

Page 1
Table of Contents
General Information
Manuals .......................................................... i
Using This Manual ................................................. i
Warranty ......................................................... iii
Product Assistance ................................................. iv
Maintenance Agreements ............................................ iv
Service Procedure .................................................. iv
Table of Contents
Safety Precautions ..................................................
ESD Precaution ........................................... ’ ......... viii
Plug-in Module Installation and Removal ............................... x
Section 1: Product Description 1-1
Block Diagram .................................................... I-4
Section 2: Installation 2-1
Attach Line Cord ................................................... 2-1
Operate in Proper Environment ........................................ 2-1
Apply Power ...................................................... 2-2
Selecting the Computer Port .......................................... 2-2
Setting the GPIB Address ............................................ 2-2
GPIB Host and Hardcopy Operation ....................................
RS-232-C Configuration ............................................. 2-7
Install the Plug-in(s) ................................................
Section 3: Operation
Overview ......................................................... 3-1
vii
2-3
2-12
3-1
7200A Mainframe Front Panel ........................................ 3-10
Acquisition Keys .................................................. 3-11
TOC-1
Page 2

Table of Contents
Waveform Display and Measurement ..................................
Panel Settings Storage ............................................... 3-51
Hardcopy ........................................................
Programming ......................................................
Using Setup Screens ................................................
Configure System ..................................................
Setting Up Traces and Processing Functions .............................
Extended Parameter Setup ............................................ 3-89
Persistence Setup Screen .............................................
Multi Zoom Setup Screen ............................................
Hardcopy Setup ....................................................
Waveform Storage Setup ............................................. 3-112
Waveform Recall Setup .............................................. 3-115
Disk Utilities ......................................................
Configure System ..................................................
Program Setup .....................................................
3-15
3-51
3-51
3-53
3-54
3-56
3-99
3-101
3-103
3-118
3-127
3-139
7242 Series Operator’s Manual
The 7242 Series ....................................................
Accessories and Options .............................................
Specifications .....................................................
Installation ........................................................
Install the Plug-in(s) ................................................ 4-3
Operation .........................................................
Probes ...........................................................
Control Layout .................................................
Display of Acquisition Settings ......................................
7242 Series Plug-in Front Panel Controls ................................ 4-8
TOC~
4-1
4-1
4-1
4-1
4-3
4-4
4-4
4-5
4-6
Page 3

Table of Contents
Index to Controls ...................................................
Vertical Controls ...................................................
Timebase Controls .................................................. 4-12
Trigger Controls ...................................................
VERTICAL Status .................................................
TIMEBASE Status ................................................. 4-20
TRIGGER Status .................................................. 4-25
Standard Trigger ................................................... 4-27
Smart Trigger ...................................................... 4-27
Single Source ......................................................
Pattern .................................................. ......... 4-34
State Qualified .................................................... 4-39
Time Qualified .....................................................
TV ..............................................................
Plug-in Status .................................................... 4-51
4-9
4-10
4-14
4-17
4-30
4-45
4-50
7234 Plug-in Operator’s Manual 4-53
Installation ........................................................ 4-55
Install the Plug-in(s) ................................................
Operation ......................................................... 4-57
Probes ........................................................... 4-57
Control Layout ....................................................
Display of Acquisition Settings ...................................... 4-59
7234 Plug-in Front Panel Controls: ..................................... 4-61
Vertical Controls ................................................... 4-63
Timebase Controls .................................................. 4-66
Trigger Controls ................................................... 4-67
VERTICAL Status ................................................. 4-71
4-55
4-58
TOC-3
Page 4

Table of Contents
TIMEBASE Status ................................................. 4-74
TRIGGER Status .................................................. 4-79
Standard Trigger ...................................................
Smart Trigger
TM
................................................... 4-81
Single Source ...................................................... 4-84
Pattern ........................................................... 4-88
State Qualified .................................................... 4-93
Time Qualified ..................................................... 4-99
Plug-in Status .................................................... 4-104
Appendix A
Summary of Waveform Processing, Display, and Storage ................... A-I
Appendix B
Raekmount Installation ............................................. B-1
Appendix C
Accessories ....................................................... C-1
Appendix D - 7291 2GS/sec Adaptor
Features .......................................................... D-1
4-81
A-I
B-I
C-I
D-1
Calibration ........................................................ D-2
Operation ......................................................... D-4
Appendix E - 7200ARCLK Installation, Test and Cal Procedure E-1
How to Use This Manual ............................................
Installation ........................................................ E-3
Calibration ........................................................
Test .............................................................
TOC4
E-1
E-5
E-6
Page 5

Table of Contents
Appendix F - 7200A-IF2 Installation & System Test Manual
How To Use This Manual ............................................
Product Description .................................................
Specifications .....................................................
PC Utilities Operation and Description .................................
PC Utility Software Installation .......................................
Utility Program Definition ...........................................
7200A-IF2 Installation Procedure ......................................
F-1
F-1
F-1
F-3
F-3
F-4
F-7
F-10
Appendiz G - 7200A Version 2.2.0, Keyboard and SCSI Support G-1
Keyboard Support ..................................................
Additional Keyboard Support ................................ . ......... G-2
New Display Options ...............................................
SCSI Sequence ....................................................
Software Installation
7200A Install / Archive Utility ........................................
With the 7200A powered off: .........................................
Gol
G-3
G-3
Install-1
1
1
7200A Installation of New Software ...................................
MS-DOS Copy ....................................................
7200A Back Up / Restore Utility ...................................... 5
7200A Back Up/Restore Utility .......................................
Setup Screen Selections ..............................................
Restrictions .......................................................
Back Up and Restore Operation .......................................
Progress Display ...................................................
2
4
6
6
7
8
9
TOC-5
Page 6

General Information
~,~. :.
Four manuals are included with the LeCroy 7200A Modular Oscilloscope System:
¯ LeCroy 7200 Series Modular Oscilloscope System Operator’s Manual explains
front-panel operation~ ~:
LeCroy 7200 Set)’ies Modular Oscilloscope System Programmer’s Manual
¯
e xp!a|ns programming protocol for controlling the 7200 Series from a host
computer, R~bte command descriptions for the 7200 Series and 7242/34 Series
plug,ins areialso included.
Getting SMrtedWith the LeCroy 7200 Modular Oscilloscope System and 7242/34
¯
Sede$ P, lug-in Modules helps a new user to quickly operate the instrument.
NEW -
LeCro.y¯7200 Series Technical Reference Manual, explaining the Pulse
P’arameters for the 7200 Series Oscilloscope.
Note
A/I Controls and Operation for the 7200 and 7200A Modular Oscilloscope
Mainframes are the same except for the following:
Time of Flight processing functions
Persistence setup Screen
1.44 MByte Floppy Format
Trace Annotation.Setup
Display Opi~0ns Setup
Display Options
Using, Manual
This operator’s manual cbntains installation and operating instructions for the 7200A
Modular Oscilloscope.,.. System:
Section 1: Product Description
Section 2: Im~latie.
... ,... ~.’ ’,.~
Overviews the 7200A’s major features. It also contains a
simple block diagram.
Describes the proper operating environment, setup pro-
cedures, and plug-in installation.
p. 3-74
p. 3-99
p. 3-122
p. 3-123
p. 3-125
p 3-128
Page 7

Using This Manual
Section 3: Operation
Section 4:7200 Series
Plug-in Operation
Introduces concepts which are fundamental to operating
the 7200A. Then, =Using Front Panel Controls" details
manual operation. The remainder of the section explains
how to use setup screens to configure controls.
Explains the Operation and Control of all 7200 Series
Plug-in modules.
ii
Page 8

Warranty
LeCroy warrants operation under normal use for a period of two years from the date of shipment. Replacement parts and repairs are warranted for 90 days. Accessory products not
manufactured by LeCroy are covered by the original equipment manufacturers’ warranties.
LeCroy provides software code error corrections at no charge.
USA
EAST
LeCmy Corporation
690 Chestnut Ridge Road
Chestnut Ridge, New York 10977-6449
TEL: (914) 578-6091
FAX: (914) 578-5999
FARWF.3T
LeCroy Corporation
5912 Stoneridge Mall Road, Suite 150
Pleasanton, California 94566
TEL: (415) 463-2600
FAX: (415) 463-9179
SOUTHWEST
LeCroy Corporation
14800 Central Avenue, S.E.
Albuquerque, New Mexico 87123
TEL: (505) 293-6100
FAX: (505) 293-9617
CANADA
LeCroy Canada Inc.
2751 Jacques Cartier est
Suite 200
Longueull, PQ, J4N IL7
TEL: 514.928.4707
FAX: 514.928.0969
EUROPE
WEST GERMANY
LeCroy GmbH
Postfach 10-37-67
Manhelmer Str. 177
D.6900 Heidelberg
West Germany
TEL: 011.49.6221.831001
FAX: 011.49.6221.834655
FRANCE
LeCroy SARL
B.P. 214
Avenue du Parana
F-91941 Les Ulis Cedex
France
TEL: 011.33.16.907.3897
FAX: 011.33.16.907.4042
SWITZERLAND
LeCroy SA
2, CheminPre-de-ia-Fontaine
P.O. Box 341
CH-1217 Meyrin 1 Geneva,
Switzerland
TEL: 011.41.22.719.21.11
LeCroy SA
Bahnhofstrasse 18
CH - 5600 Lenzburg
Switzerland
TEL: 011.41.64.519.181
FAX: 011.41.64.519.192
ENGLAND
LeCmy LTD
28 Blacklands Way
Abingdon Business Park
Abingdon, Oxon OX14 1DY
Great Britain
TEL: 011.44.23.553.31.14
FAX: 011.44.23.552.87.96
ITALY
LeCroy S.r.I.
Via Roccaporena 58
1-00191 Roma
Italy
TEL: 011.39.6.33.13.146
FAX: 011.39.6.327.92.21
LeCroy S.r.l.
Via Pinturricchio, 9
I - 20133 Milano
Italy
TEL: 011.39.220.47.082
FAX: 011.39.220.47.026
JAPAN
LeCroy OS
Esaka Sansho Bldg - 3rd Floor
16-3, 3-Chome
Tarumicho, Suite City
Osaka 564 Japan
TEL: 011.816.330.0961
FAX: 011.816.330.8096
LeCroy TK
Zaiken Bldg 6th Floor
Sasazuka, Shibuya-ku
Tokyo 151 Japan
TEL: 011.813.3376-9400
FAX: 011.813.3376.9587
BENELUX
LeCroy BV
Waalreseweg 17
NL-5554 HA Valkenswaard
The Netherlands
TEL: 011.31.4902.8.9285
FAX: 011.31.4902.42628
m
Page 9

Service Procedure
In exercising this warranty, LeCroy will repair or, at its option, replace any product returned
to the factory or an authorized service facility within the warranty period only if the warrantor’s examination discloses that the product is defective due to workmanship or materials
and the defect has not been caused by misuse, neglect, accident, or abnormal conditions or
operations.
The purchaser is responsible for transportation and insurance charges. LeCroy will retum all
in-warranty products with transportation prepaid.
This warranty is in lieu of all other warranties, express or implied, including but not limited to
any implied warranty of merchantability, fitness, or adequacy for any particular purpose or
use. LeCroy Corporation shall not be liable for any special, incidental, or consequential damages, whether in contract, or otherwise.
Product Assistance
LeCroy Corporation will gladly answer your questions. Write or call your regional field serv-
ice office (see next page) or Test & Measurement Division, 700 Chestnut Ridge Road, Chestnut Ridge, New York 10977-6499. TEL: (914) 425-2000, ext. 6011.
Maintenance Agreements
LeCroy offers a choice of customer support services to meet your individual needs. Annual
software maintenance contracts, ensures your 7200A always features the latest processing
enhancements and extensions. Extended warranty maintenance agreements let you budget
maintenance costs after the initial warranty has expired. Other services such as installation,
training, calibration, enhancements and on-site repair are available through specific Supple-
mental Support Agreements. Contact your regional field service office for details:
Service Procedure
Refer any servicing requiring removal of exterior enclosure panels to qualified LeCroy service personnel. Be prepared to describe the problem in detail.
WARNING: Do not remove chassis panels. Removing the
ax~rlor covers exposes parts which could cause electric [
Jl
ahock.
If the product is under warranty, LeCroy will, at its option, repair or replace the 7200A at no
charge. For repairs after the warranty period, the customer must provide a Purchase Order
iv
Page 10

Service Procedure
Number before the service engineer can initiate repairs. The customer will be billed for the
parts, labor, and shipping.
Shipping Guidelines
First, attach a tag to the instrument which indicates:
Purchase Order Number
Owner’s name and complete address
The service required including detailed operational problems
Person to contact for confirmation (include phone number)
Ship the unit in its original packaging. If not possible, provide a 275 lb. strength double wall
corrugated cardboard box with inside dimensions at least eight inches greater than the
instrument dimensions. The extra space will provide adequate room for cushioning.
Protect the finish by carefully wrapping the unit in polyethylene sheeting.
Place adequate dunnage or urethane foam in the container (approximately 4 inch depth) and
place the wrapped unit on it. Allow approximately four inches of space on all four sides and
the top of the unit.
Fasten the container with packaging tape and/or industrial staples. Address the container to
LeCroy’s service location and include your return address.
Page 11

Safety Precautions
This manual describes how to maintain the LeCroy 7200 Series Precision Digital Oscilloscope. For ease of reference, this equipment is referred to as the 7200 Mainframe throughout this manual.
The general Safety precautions listed below must be followed during all phases of operation and service of the LeCroy 7200 Series Precision Digital OscoUoscope. These wamings and other specific safety notices may be repeated
elsewhere in this manual. LeCroy Corporation assumes no liability for the operator who fails to comply with these
precautions.
AC POWER SOURCE
This product Is designed to operate from an AC
power soume that will supply not more than 250
volts rms, between the two supply conductors (line
and neutral), or between either supply conductor
and ground.
PROPER GROUNDING
The 7200A Is a Safety Class 1 instrument. This
means that the instrument enclosure is connected
to protective earth ground through the three-conductor power supply cord, and properly grounded AC
power outlet. This protective grounding minimizes
shock hazard and is essential for safe opera-
tion. Any interruption of the protective earth connection will cause a potential shock hazard, as all
accessible conductive parts, (even knobs and con-
trois which may appear to be non-conductive) may
render an electric shuck.
FUSES
To avoid fire hazard, use only fuses of the same
type, current rating, and voltage rating, as speclfl-
caUy called out in this manual.
DO NOT OPERATE IN AN EXPLOSIVE
ATMOSPHERE
Do not operate the 7200A In an atrnosphere of explosive gases of flammable gases.
DO NOT REMOVE COVERS OR
PANELS
To avoid personal Injury, the operator should not re.
move the protective covers, or attempt internal servicing or adjustment of any kind. Refer this servicing
to qualified LeCroy service personnel. Do not oper-
ate this instrument with any protective panels or cov-
ers removed.
DEFINITION OF TERMS
In Manuals: CAUTION statement, signifies condi-
tions or practices which may result in damage to
EQUIPMENT or PROPERTY. This differs from the
WARNING statement, which signifies a condition or
pratlce which could result in PERSONAL INJURY or
LOSS OF LIFE.
When these terms are encountered in the text, the
reader should not proceed further until the specific
notice is fully understood.
On Equipment: CAUTION statement, indicates a
personal injury hazard which is not immediately ac-
cessible to the person reading the marking, it may
also signify a hazard to the equipment or property.
DANGER statement, signifies a personal
injury hazard which is immediately acces-
sible to the person reading the marking.
SAFETY SYMBOLS
As marked on equipment:
DANGER - Hazardous voltages
Protective ground (earth) terminal
®
//~ A’I-I’ENTION - refer to the manual
vii
Page 12

Section 1: Product Description
The LeCroy 7200A Precision Digital Oscilloscope offers high accuracy waveform measurement and analysis with full IEEE-488 (GPIB) and RS-232-C support. Using different plug-ins,
you can customize waveform acquisition parameters to match a specific application. These
parameters include sample rate, resolution, bandwidth, triggering, waveform memory, and
number of channels.
Key Features of the 7200A Precision Digital Oscilloscope
Modular Digitizing Plug-in
1 or 2 plug-ins per 7200A mainframe, with independent or slaved timebase and
¯
trigger.
Display
¯ High resolution color display.
¯ Up to 8 traces, simultaneously displayed.
¯ Vertical and horizontal expand and position for all traces.
¯ Hardcopy to plotters, dot matrix printers, laser printers and floppy disk
(compatible with desktop publishing systems).
Manual, Remote, and Automatic Control
Familiar analog controls for timebase, sensitivity, offset, etc.
¯
¯ On-line HELP for all controls.
¯ Autosetup to set the trigger, gain, offset, and timebase to display a repetitive input
signal.
¯ Full remote control from IEEE-488 (conforming to IEEE-488.2) and RS-232-C.
¯ Program mode for automated measurement sequences and test applications.
Waveform Measurements
¯ 14 basic waveform parameters on any trace.
¯ Up to 20 waveform parameters (choose from more than 70) on any combination
of 8 traces.
Any parameter on any trace available from remote control or Program mode.
¯
¯ Simple vertical and horizontal measurements using cursors.
1-1
Page 13

ESD Precaution
The 7200 Mainframe contains electrostatic discharge (ESD) sensitive devices. For this reason, it is necessary to work on the 7200 Mainframe in an environment that minimizes exposure of the circuit board assemblies and components to conditions that could be
destructive. Servicing of the 7200 Mainframe and its ancillary devices requires an awareness
of the potentially destructive effects of ESD. Depending upon the relative humidity of the
maintenance shop, seemingly simple and unrealted acts such as walking across vinyl floor
or picking up an ordinary polyethylene bag from a workbench can generate thousands of
volts of electricity. If proper grounding practices are not used, accidental contact with one of
the CMOS devices on a circuit can result in its destruction.
The maintenance shop must be free of sources of static electricity. This means that neither
the 7200 mainframe nor any of its acillary devices should be disassembled on a work surface of melamine or finished wood unless a properly grounded electrostatic mat is underneath.
A work chair padded with urethane foan can generate 18 thousand volts of static electricity If
humidity is low. Chairs of finished wood, vinyl, and fiberglass should not be used and metal
work chairs may be used only if properly grounded.
Personell should not wear common clean room smocks, non-conductive shoes, or garments
made of any material other than virgin cotton.
Common plastic bags, wraps, envelopes, bubble pack, foam, trays, tote boxes, vials, and
parts bins should not be in the shop. All board assemblies should be placed in ESD-protective bags Immediatley upon removal and all new boards should not be removed from their
ESD-protective bags until immedlaltely before installation.
In addition, common spray cleaners, solder suckers, and soldering irons should not be
used. Brushes with synthetic bristles should not be used for solvent cleening, e.g., removal
of rosin residue from circuit board assemblies.
Heat guns and blowers are potential sources of static electricity and all cleaning and drying
operations are potential sources as well.
Increased ESD awareness has four major effects:
¯ All electronic components are assumed to be ESD-sensitive
¯ Sensitive components are not touched unless a properly grounded wrist strap is
worn
¯ Sensitive components are transported, stored, and handled only in ESD-frae
environments
¯ ESD-sensltive components are tested only in a static-free environment
viii
Page 14

As a general approach to servicing the 7200 Mainframe and its ancillary devices, do the following:
Disconnect power from the 7200 Mainframe except when required for voltage checks and
.
adjustments.
Be sure the multimeter is properly grounded before checking power supply output levels.
.
3.
Wear a properly grounded wrisy strap or touch the properly grounded 7200 Mainframe
before removing any board, the hard disk drive, or the floppy drive.
°
Wear a properly grounded wrist strap to remove any board from a plug-in
5.
Ground the ESD-protective package containing replacement devices before opening to
dissipate its static charge.
°
Remove ESD-sensitive devices from their packaging immediately before installation. Avoid
touching other parts, connections, and circuitry.
Use only anti-static spray for troubleshooting.
.
ix
Page 15

Plug-in Module Installation and Removal
Installation
CAUTION: Plug-in modules should not be installed with 7200 Mainframe power on.
To install a plug-in module, use the following procedure:
a.)
b.)
Align groove on bottom of plug-in module (Figure 1) with guide on bottom of plug-in
compartment of 7200 mainframe.
Slide plug-in module into compartment until latched in place.
Removal
CAUTION: Plug-in modules should not be removes with 7200 Mainframe power on.
To remove a plug-in module, use the following procedure:
a.) At bottom front of plug-in module, pull latch to release, then slide out of compartment
Figure 1
Page 16

Waveform Processing
¯ Extensive processing possible for each of 8 traces including addition, subtraction,
multiplication, division, differentiation, integration, smoothing, averaging, FFT,
square, square-root, log, histograming, trending, etc.
¯ Engineering units used for all processing.
Data Storage and Portability
¯ MS-DOSe compatible 3.5" floppy for waveform storage and portability.
¯ 8 non-volatile memories available for individual waveform storage.
¯ Store and recall front-panel setups to intemal or floppy disk.
¯ Optional external hard drive available for increased security
Software Support
¯ Updates via floppy disk.
Future plug-in drivers supplied on floppy disk without firmware Updates.
¯
The LeCroy 7200A Precision Digital Oscilloscope provides high accuracy waveform measurement, analysis, and built-in mass storage with full IEEE-488 (GPIB) and RS-232-C sup-
port. Its modular amhitecture accepts plug-ins with integral digitizers and recording
memories.
Different plug-ins allow you to customize acquisition parameters, such as sample rate, bandwidth, and number of channels, to match specific applications. Because each plug-in contains its own digitizing circuitry, you can add channels without losing performance. The
system is truly Integrated, permitting cable-free synchronization of timebases and triggers
between plug-ins.
The 7200A can perform extensive waveform processing and measurements, either manually, automatically, or under remote control. Waveform processing includes addition, subtrac-
tion, multiplication, division, differentiation, integration, smoothing, averaging, FFT, square,
square-root, log,histogram, trend, etc.
Using custom digital signal processing circuitry, the 7200A rapidly analyzes large waveforms
to produce accurate waveform parameters based on the IEEE standard for pulse characterization. A comprehensive set of automatic waveform parameters is provided. Custom pa-
ramaters can be added (contact LeCroy).
A built-in hard disk and 3.5" MS-DOSe floppy disk drive provide mass storage and data portability. Waveforms, front-panel setups, and user Programs can be stored on either disk. In
Record Traces mode, thousands of waveforms can be stored at high speed to the hard disk
for later recall, analysis, or processing. The hard disk also contains the operating system and
1-2
Page 17

the comprehensive on-line HELP manual. The MS-DOS® floppy disk provides convenient
data portability and long-term storage. Software upgrades and new plug-in drivers are han-
dled economically by using floppies rather than by changing firmware.
The 7200A _supports a wide variety of hardcopy devices, using GPIB, RS-232-C, and parallel
(Centronics
ing graphic output with a desktop publishing system.
Another powerful feature of the 7200A is its ability to execute user programs, making it ideally suited for automated test applications. Programs are closely tied to the 7200A’s remote
control syntax with simple control-flow structures. The "Learn" mode records a sequence of
front-panel keystrokes as a program, providing the basis for automating measurements. Off-
line editing on a PC can produce more powerful programs involving looping and decision
making for sophisticated automatic tests.
The 7200A’s extensive waveform processing and measurement capabilities, coupled with decision making, make it a complete stand-alone automatic test system for producing answers,
not just data.
~)
communication standards. It also supports HPGL output to floppy for integrat-
1-3
Page 18

Block Diagram
The Cenb’al Processor co-ordinates the activities of the other units. Commands are received
from the front-panel subsystem, which constantly monitors all the front-panel keys and
knobs, or from a host computer. Alternately, the CenVal Processor can execute a previously
saved sequence of commands, interpreting and directing them to the appropriate subsystem
to perform tasks. All control settings are saved in non-volatile memory. The front panel con-
trol setup can also be saved on the Internal disk or the floppy diskette.
The C, enVal Processor also oversees data acquisition. The Master Timebasa Reference syn-
chronizes data acquisition between plug-ins. When acquisition completes, the Central Processor receives the data and performs any requested waveform processing and automatic
measurements. Some processing can also be done in the plug-in itself. The results can be
sent to the display, floppy diskette, and the I/O port. If Record Traces is enabled, the data
can also be stored on the internal disk for later review.
digital bus
1-4
I
analog bus
i ::::~: MASTSR .......... iiii
TIMEBA8E : i
i REFERENCE i
L.......~.: ...........,.;. .......................; ...........
..[+++~~+®+++
~1+ "+++ +~:+
Figure 1.1: 7200A Block Diagram
~~
I IEEE-488 I Plotters,
[ RS.232-C ] Printers and
[ Centronlcs [ Remote Control
External Reference IN/OUT
Analog Inputs
External Sample Clock
Analog Inputs
Floppy Disk
Hard Disk
External Sample Clock
Trigger IN/OUT
Page 19

Section 2: Installation
The 7200A runs over the full line voltage range of 90 Volt to 250 Volt AC rms and source frequencies of 47 to 63 Hertz.
The 7200A is shipped with the fuse drawer and fuses most common to its destination already installed in the line cord connector (rear panel).
Attach Line Cord
The AC input receptacle (CEE-22 style) located in the line cord connector (rear panel)
three recessed male pins which accept the detachable line cord. To obtain an AC line cord
other than the one supplied, please contact the factory.
Operate in Proper Environment
WARNING: To avoid explosion, do not operate the 7200A in an
atmosphere of explosive gases.
To ensure proper operation and long instrument life, the 7200A should be operated within
the following environmental conditions:
Temperature
Ambient air temperatures between 0° to +40° C. Storage temperatures can range between
-40 to +75 C.
Ventilation
The Model 7200A is cooled by air drawn from the bottom front and exhausted through the
rear. Operate the instrument on a hard flat surface, or carpeting of very low pile. Allow at
least one half inch clearance under the bottom and 2" behind the rear fans and along the
side panels.
Grounding
Ensure a good ground. The Model 7200A is a Safety Class 1 instrument. Its exposed metal
chassis is directly connected to earth via the power supply cord.
2-1
Page 20
Setting the GPIB Address
WARNING: To avoid possible shock hazard, ground the 7200A
chassis by connecting the power supply cord to an earth grounded
AC power receptacle. Do not make any connections to the
instrument’s input or output terminals until the 7200A is properly
grounded.
Apply Power
CAUTION: Use correct power source. The Model 7200A is
designed to operate from a single-phase power source. The voltage
to ground (earth) from either pole of the power source must not
exceed the maximum rated operating voltage, 250 Volts AC rms.
To supply power to the 7200A, set its rear panel ON/OFF switch to the ON (I) position.
Selecting the Computer Port
CAUTION: Before connecting external equipment to the 7200A, set
its front panel power switch to the OFF (0) position.
The 7200A provides three interfaces: the General Purpose Interface Bus (GPIB), an RS-232-
C Sedal Port, and a Centronics Port. The GPIB end RS-232-C ports can be used to connect
the 7200A to a host computer or to connect to a printer or plotter for hardcopy output. The
Centronics port is used for hardcopy output only. The advantage of GPIB is high transmission rates. The advantage of RS-232-C is that it is a lower cost interface which can generally
be used over longer distances. If the 7200A will be used in conjunction with a host computer,
set the =Remote Control from" field in the Communications screen to either GPIB or RS232.
CAUTION: If the same port is selected for both Remote Control
and Hardcopy, when the hardcopy key is pressed, no plot is
produced and only the User Request (URQ) bit in the Standard
Event Status register (’ESR) is saL This is so the Remote
Controller can synchronously initiate the hardcopy remotely once all
the connected devices are properly set up. If a Remote Controller
is not used, then the "Remote Control from" field in the
Communications Setup screen must be set to a port that is different
from the Hardcopy Port in order to enable the hardcopy key.
Setting the GPIR Address
The GPIB address is set in the Communications Setup screen. From the Main Screen, press
the Configure System softkey to display the Configure System setup screen. Then press the
Communication Setup softkey to display the Communications Setup screen. Move the box
2-2
Page 21
GPIB Host and Hardcopy Operation
onto the =Remote Contol from" field and select GPIB. Then move the box onto the =GPIB Ad-
dress" field and select an address from 0 to 30. Note that these controls are preserved in battery backed up memory and are NOT reset by pressing the Default Settings softkey.
GPIB Host and Hardcopy Operation
The 7200A can communicate across GPIB as a talker or a listener with a remote host controller to receive remote commands/queries and send responses. Alternately, it can operate
over GPIB with a controller as a Talk Only device. The use of each of these modes is described below.
Remote Control Operation over GPIB
The 7200A enters Talk/Listen mode when the =Remote Control from" field in the Communications Setup screen is set to GPIB. In this mode, the 7200A can both receive commands and
setups from the remote host computer and send data and measurement results.
Plotting/Printing over GPIB with a Controller
If the HARDCOPY command is sent to the 7200A when in this mode, the 7200A will wait to
be addressed to talk before sending the hardcopy data. The host computer then has three
options in generating the hardcopy:
1) The host computer may read the data into internal memory
and then send the data to a printer/plotter. This is exactly the
same as reading a query response.
2) The host computer may send the =HARDCOPY" remote command and then address the printer/plotter to listen and the
7200A to talk and read the data from the 7200A. As the data is
read into the computer’s internal memory, it is also printed/plot-
ted to the printer/plotter which is a Listener.
3) The host computer may send the =HARDCOPY" remote command and then address the printer/plotter to listen, the 7200A to
talk, and the controller to go into stand-by mode waiting for EOI.
Altematively, the Data Processing Status Register (DPR) could
be programmed to issue an SRQ when hardcopy is complete so
that the host computer can perform other tasks while the hard-
copy is performed.
If the local HARDCOPY key is pressed when both the Remote
Control port and the Hardcopy port are set to GPIB, then a hardcopy is not generated. This is so the hardcopy data does not dis-
2-3
Page 22
GPIB Host and Hardcopy Operation
rupt controller activity on the GPIB bus. Instead, pressing the
HARDCOPY key sets the User Request (URQ) bit in the Stand-
ard Event Status register (*ESR). The Remote Controller can
monitor this bit and when it is set, it can initiate the hardcopy remotely In one of the three ways discussed previously.
Printing/Plotting over GPIB without a Controller
To output hardcopy data over GPIB, the "Hardcopy Port" field in the Hardcopy screen must
be set to GPIB and the Remote Control port must be RS-232-C. Talk Only is a special GPIB
mode where there is no controller allowed on the bus; the 7200A is the only talker and all
connected devices must be listeners (ie., printers/plotters must be in Listen Only mode).
Note: Since some printers/plotters do not properly enter Listen Only mode,
the 7200A will address the device at address 30 to listen before sending the
hardcopy data. ff your GPIB printer/p/offer does not work with the 7200A, set
Its GPIB address to 30 and the 7200A will force/t to listen.
2.4
Page 23
GPIB Interconnection
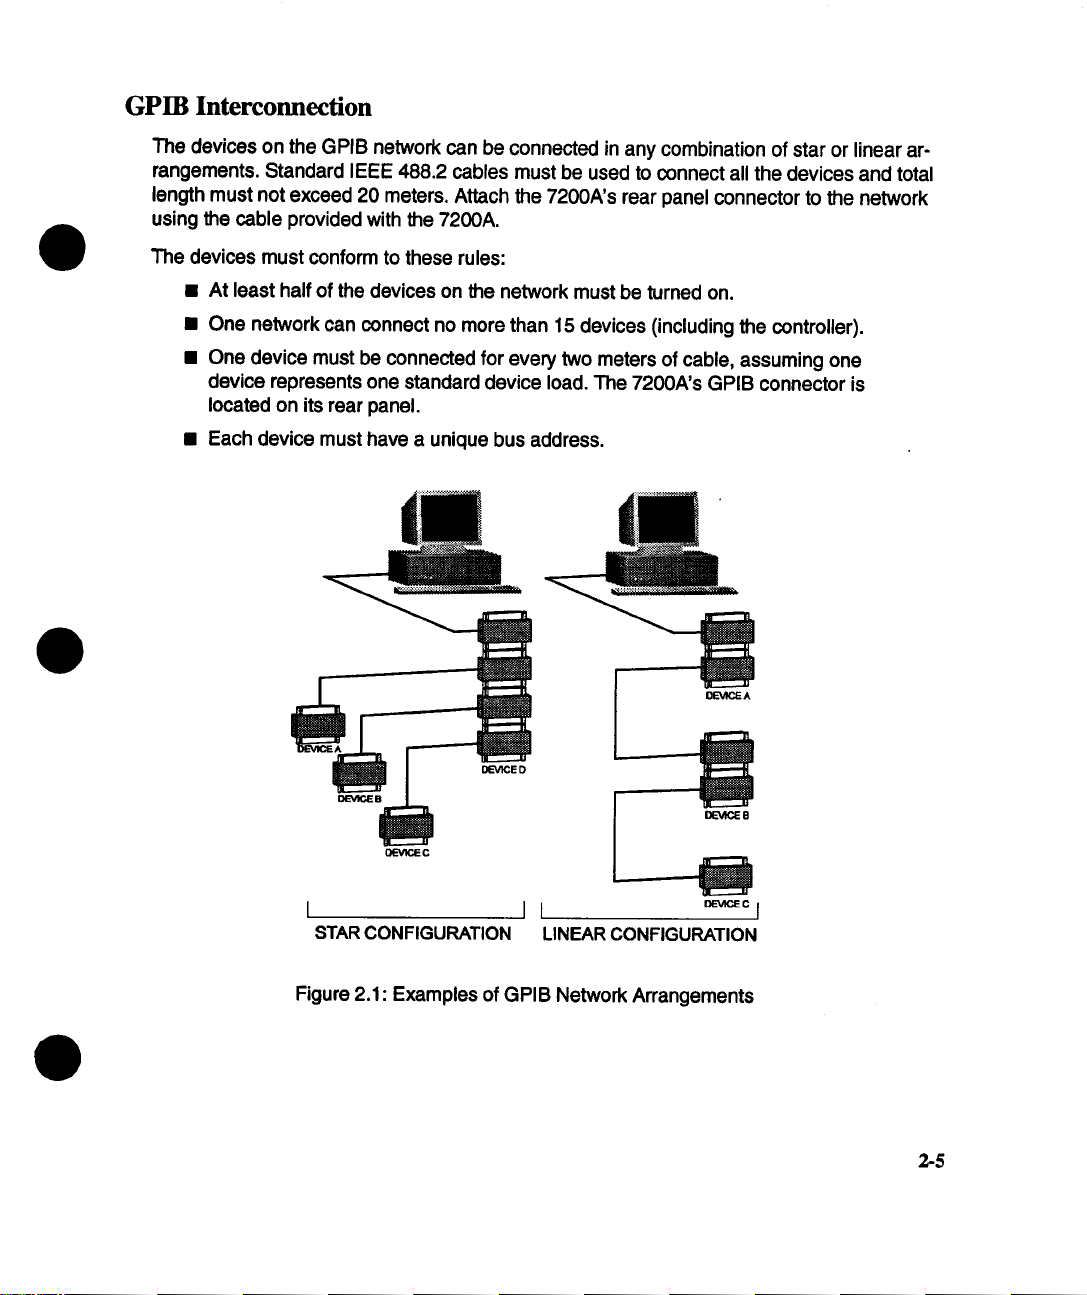
The devices on the GPIB network can be connected in any combination of star or linear arrangements. Standard IEEE 488.2 cables must be used to connect all the devices and total
length must not exceed 20 meters. Attach the 7200A’s rear panel connector to the network
using the cable provided with the 7200A.
The devices must conform to these rules:
¯ At least half of the devices on the network must be turned on.
¯ One network can connect no more than 15 devices (including the controller).
¯ One device must be connected for every two meters of cable, assuming one
device represents one standard device load. The 7200A’s GPIB connector is
located on its rear panel.
¯ Each device must have a unique bus address.
DEVlCE D
DEVICE 8
STAR CONFIGURATION
LINEAR CONFIGURATION
Figure 2.1: Examples of GPIB Network Arrangements
2-5
Page 24
GPIB Host and Hardcopy Operation
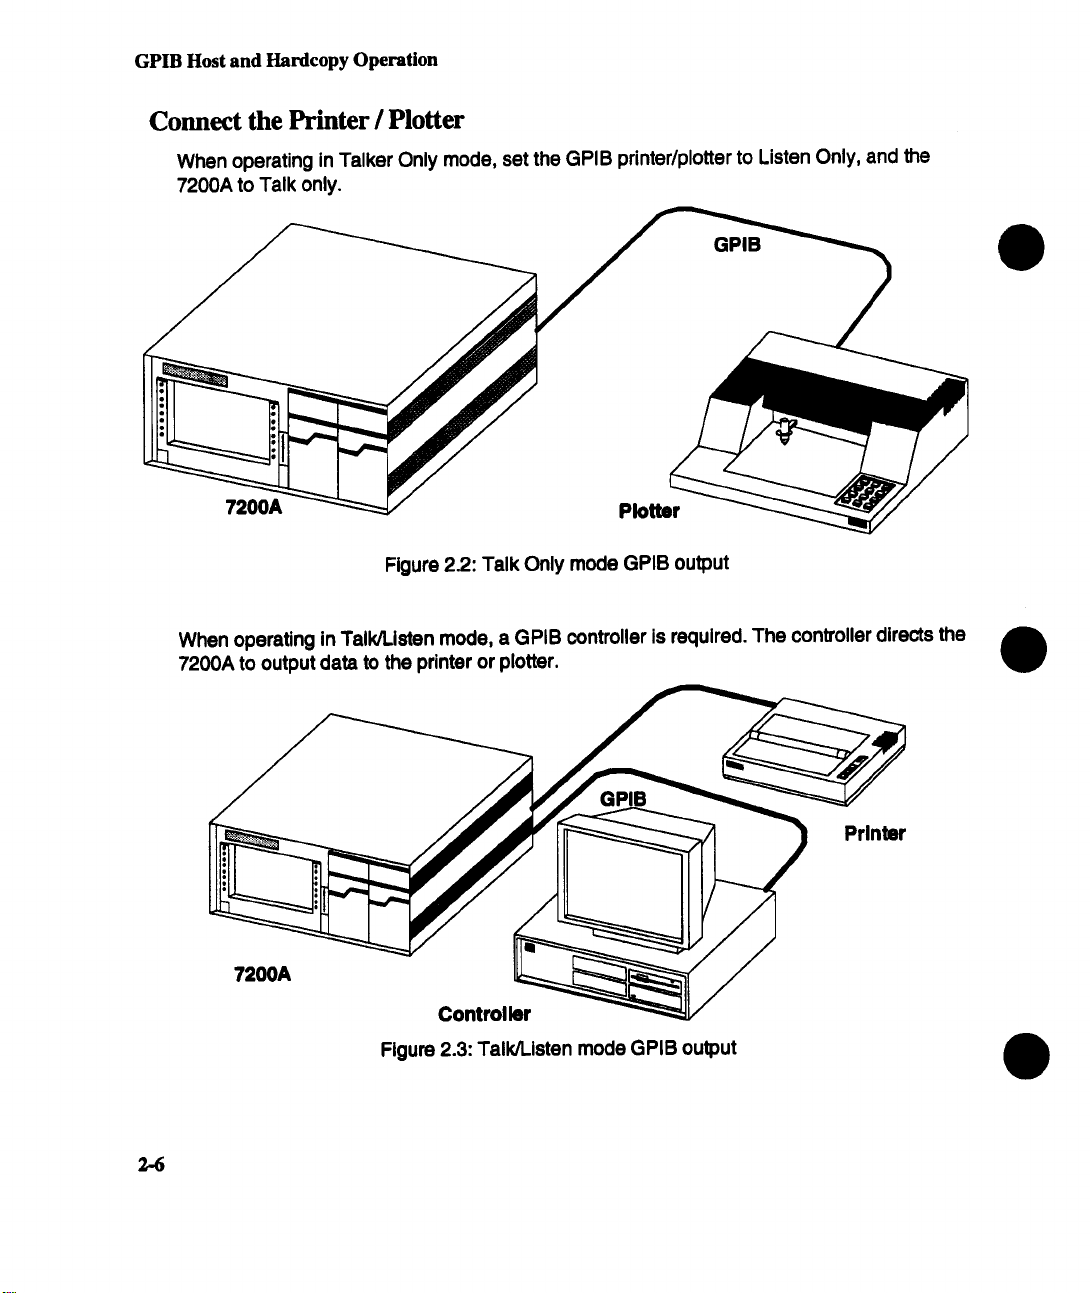
Connect the Printer / Plotter
When operating in Talker Only mode, set the GPIB printer/plotter to Listen Only, and the
7200A to Talk only.
GPIB
7200A
Figure 22.: Talk Only mode GPIB output
When operating in Talk/Listen mode, a GPIB controller is required. The conVoller directs the
7200A to output data to the printer or plotter.
Controller
Figure 2.3: Talk/Listen mode GPIB output
Plotter
2-6
Page 25
RS-232-C Configuration
Setup the Serial Port
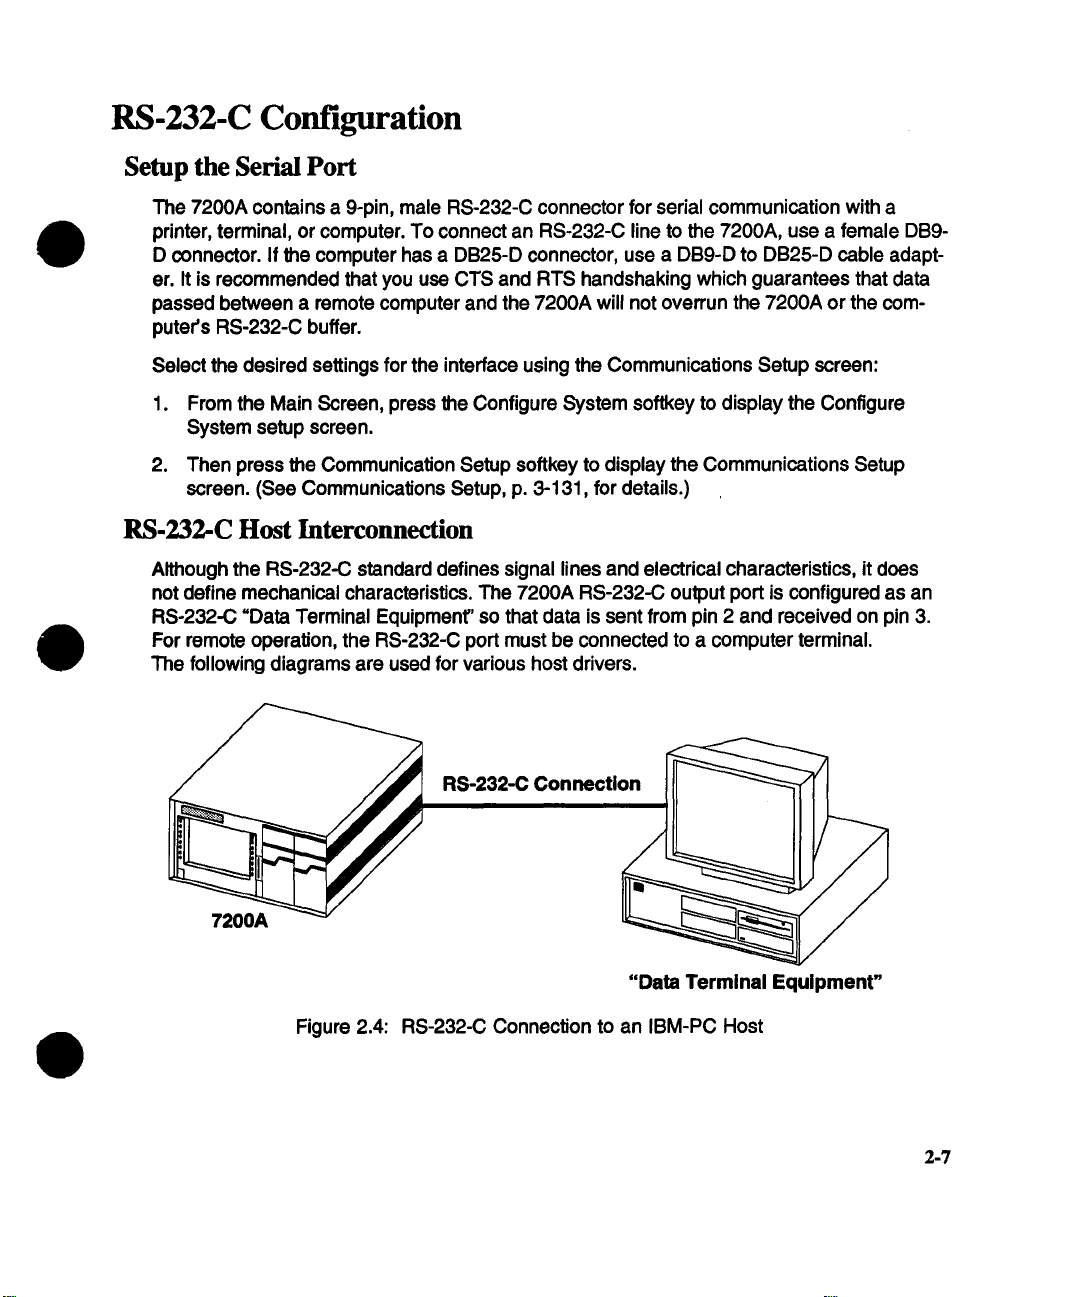
The 7200A contains a 9-pin, male RS-232-C connector for serial communication with a
printer, terminal, or computer. To connect an RS-232-C line to the 7200A, use a female DB9D connector. If the computer has a DB25-D connector, use a DB9-D to DB25-D cable adapter. It is recommended that you use CTS and RTS handshaking which guarantees that data
passed between a remote computer and the 7200A will not overrun the 7200A or the computer’s RS-232-C buffer.
Select the desired settings for the interface using the Communications Setup screen:
1. From the Main Screen, press the Configure System softkey to display the Configure
System setup screen.
2. Then press the Communication Setup softkey to display the Communications Setup
screen. (See Communications Setup, p. 3-131, for details.)
RS-232-C Host Interconnection
Although the RS-232-C standard defines signal lines and electrical characteristics, it does
not define mechanical characteristics. The 7200A RS-232-C output port is configured as an
RS-232-C =Data Terminal Equipment" so that data is sent from pin 2 and received on pin 3.
For remote operation, the RS-232-C port must be connected to a computer terminal.
The following diagrams are used for various host drivers.
"Data Terminal Equipment"
Figure 2.4: RS-232-C Connection to an IBM-PC Host
2-7
Page 26

DB9 to DB25 Wiring
This wiring configuration is used for IBM-PCs and compatibles with DB25-D connectors
configured as Data Terminal Equipment. Note that for XON-XOFF communication protocol,
only pins 2, 3, and 5 on the DB9-D connector are needed. Also, commercially available DB9-
to-DB25 adapter cables for the IBM-PC swap pins 2 and 3 and pins 7 and 8.
DB9 to DB9 Wiring
For IBM PC-AT types with DBg-D connectors configured as Data Terminal Equipment.
2-8
Page 27

DTE to DCE Wiring
For non-IBM types with DB9-D connectors configured as Data Communications Equipment.
Page 28

RS-232-C Configuration
RS-232-C Interconnections for Hardcopy
When connecting an RS-232-C serial printer/plotter to the 7200A, the printer/plotter configuration must match the 7200A RS-232-C port settings. To modify the 7200A’s settings, use
the Communications Setup screen (see page 3-131 ).
RS-232-C Connection
"Data Terminal Equipment"
"Data Terminal Equprnent"
(7200A)
DB9 to DB25 Wiring
NOTE: The 7200A RS-232-C interface is a DB9-D connector. Use
an adapter cable to connect to an RS-232-C DB25-D connector.
Figure 2.5:
RS-232-C Connection to an RS-232-C
Serial Plotter
2-10
Page 29

RS-232-C Configuration
Parallel-Centronics Wiring
The 7200A uses a standard DB25-D female connector as the Centronics parallel output port.
An adaptor cable is required to adapt the 7200A DB25-D connector to the standard 36-pin
bail lock connector used on most Centronics printers.
7200A
Figure 2.6: Output to Centronics type Printer/Plotter
Printer
2-11
Page 30

Install the Plug-in(s)
The plug-in manual contains instructions for operating the front panel controls. Plug-in functions controlled by the 7200A mainframe front panel are detailed in Section 3 of this manual.
CAUTION: Do not Install or remove a plug-In while the 7200A
mainframe is powered on.
To install, align the plug-in’s bottom grooves with the guides at the bottom of the mainframe’s plug-in compartment. Next, slide in the plug-in until it latches into place. Move the
latch on the 7200 Series plug-in until it is flush with the plug-in body. Remove the plug-in by
pulling out its latch and sliding it out.
2-12
/LATCH
Rgure 2.7: Plug-in Installation
Page 31

Section 3: Operation
Section 3 first introduces concepts which are fundamental to operating the 7200A. Next, "Using Front Panel Controls" details manual operation. The remainder of the section explains
how to use the setup screens to configure controls.
Overview
Controls
The 7200A’s controls are keys, softkeys, and knobs.
Keys have front panel labels (upper case) which identify their functions.
Softkeys have screen labels (initial capitals) which identify their functions. The softkeys are
arranged vertically to the left and right of the screen. Softkey labels change to suit specific
operations.
All knobs have front panel labels (upper case) which identify their functions except the outer
and inner knobs beneath the center of the screen. Labels on the screen indicate their current
functions. See Figure 3.1:
The label above the left arrow
indicates the outer (detented) indicates the inner (continuous)
knob’s current func, on. knob’s current function,
Figure 3.1: Outer and Inner knobs beneath center
of screen
The label above the right arrow
3-1
Page 32
Overview
Plug-ins
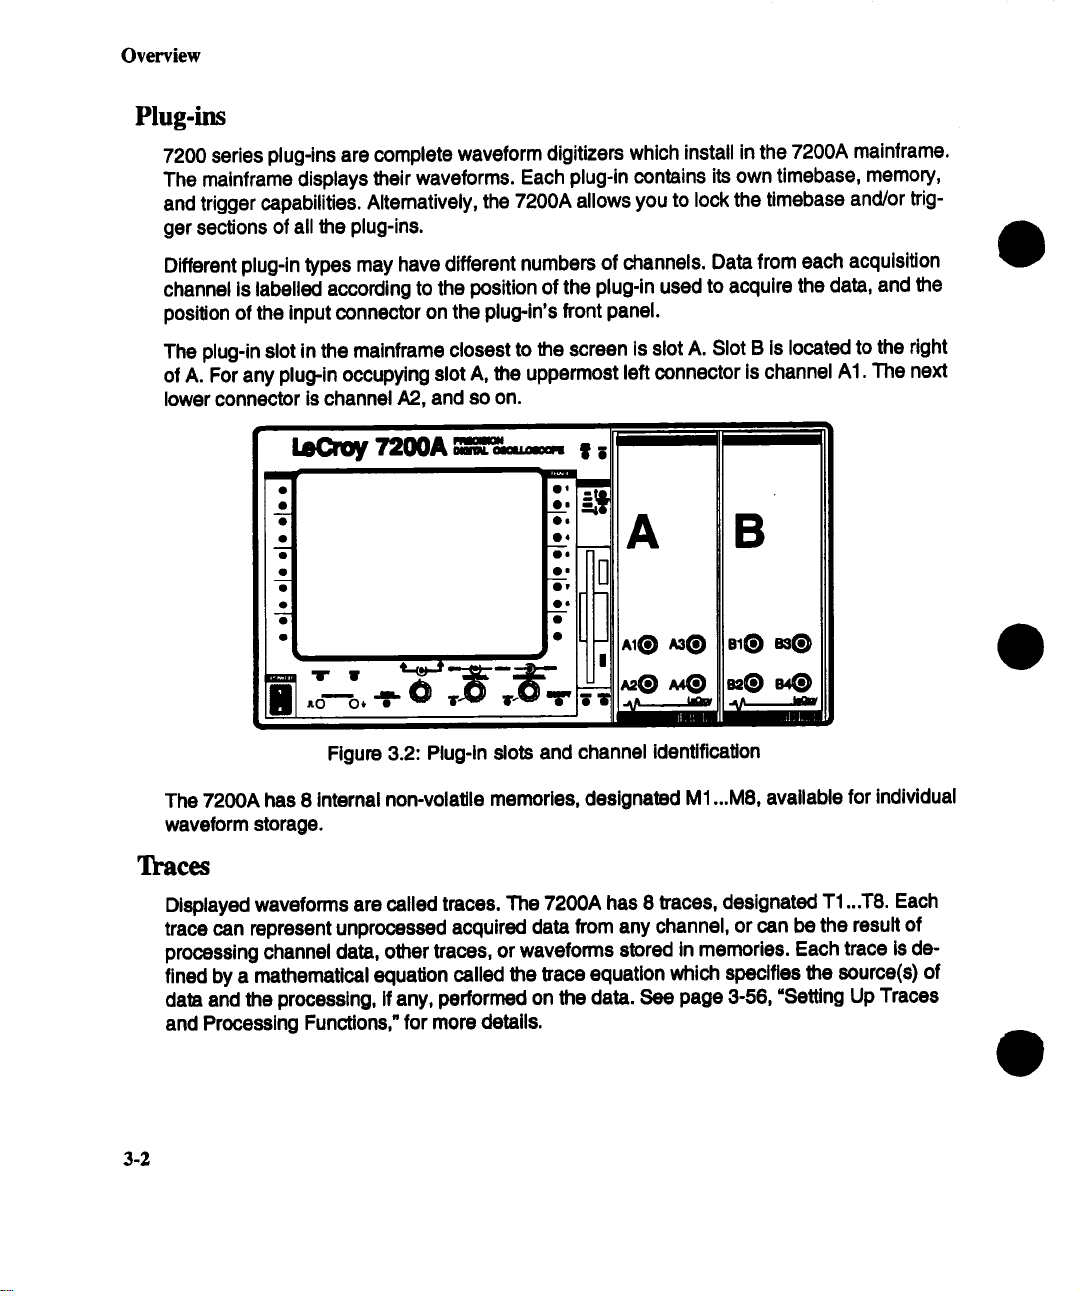
7200 series plug-ins are complete waveform digitizers which install in the 7200A mainframe.
The mainframe displays their waveforms. Each plug-in contains its own timebase, memory,
and trigger capabilities. Alternatively, the 7200A allows you to lock the timebase and/or trigger sections of all the plug-ins.
Different plug-in types may have different numbers of channels. Data from each acquisition
channel is labelled according to the position of the plug-in used to acquire the data, and the
position of the input connector on the plug-in’s front panel.
The plug-in slot in the mainframe closest to the screen is slot A. Slot B is located to the right
of A. For any plug-in occupying slot A, the uppermost left connector is channel AI. The next
lower connector is channel A2, and so on.
A B
I’"
I
Figure 3.2: Plug-in slots and channel identification
The 7200A has 8 internal non-volatile memories, designated M1 ...M8, available for individual
waveform storage.
Traces
Displayed waveforms are called traces. The 7200A has 8 traces, designated T1 ...T8. Each
trace can represent unprocessed acquired data from any channel, or can be the result of
processing channel data, other traces, or waveforms stored in memories. Each trace is defined by a mathematical equation called the trace equation which specifies the source(s)
data and the processing, if any, performed on the data. See page 3-56, =Setting Up Traces
and Processing Functions," for more details.
3.2
Page 33
Main Screen
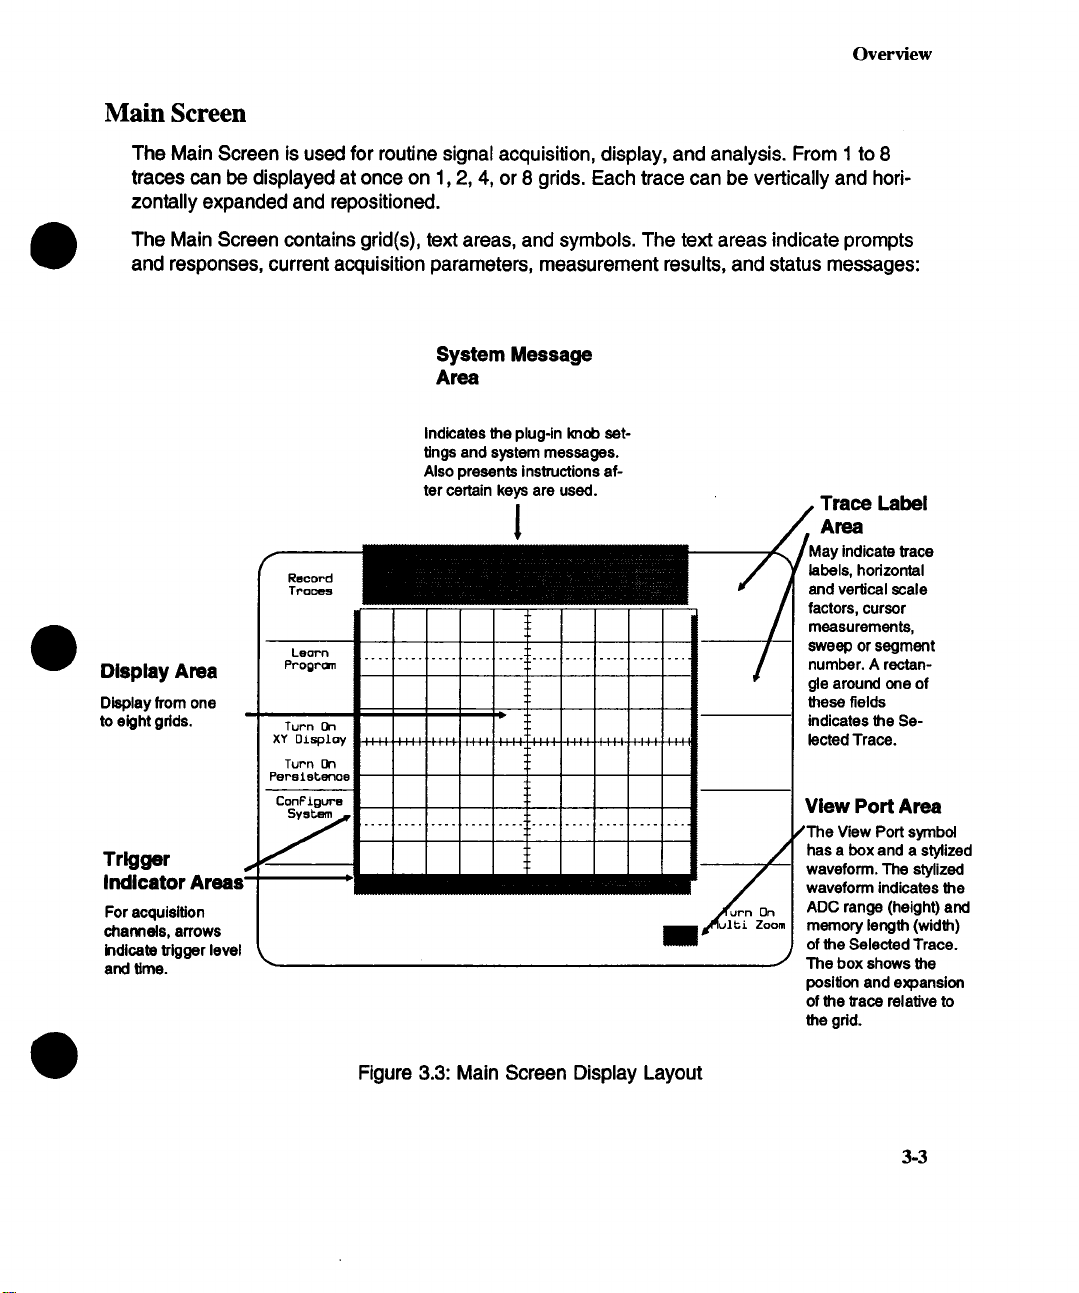
The Main Screen is used for routine signal acquisition, display, and analysis. From 1 to 8
traces can be displayed at once on 1,2, 4, or 8 grids. Each trace can be vertically and horizontally expanded and repositioned.
The Main Screen contains grid(s), text areas, and symbols. The text areas indicate prompts
and responses, current acquisition parameters, measurement results, and status messages:
System Message
Area
Indicates the plug-in knob set-
tings and system messages.
Also presents instructions af-
Display Area
Display from one
to eight gdds.
Trigger
For acquisition
charlrlels, arrows
indicate trigger level
and time.
ter certain keys are used.
Record
Troce. end vertical scale
Lech’n
Pr’ogr~n ............................. ’ " number. A rectan-
Turn On
xY o~spzoy lected Trace.
Turn On
Peps lete~’3oe
’
CooF~g~,-s
Trace Label
~lay indicate trace
185OIs, horizontal
factors, cursor
measurements,
sweep or segment
gle around one of
these fields
indicates the Se-
View Port Area
View Port symbol
has a box and a stylized
waveform. The stylized
waveform indicates the
ADC range (height) and
memory length (width)
of the Selected Trace.
The box shows the
position and expansion
of the trace relative to
the grid.
Overview
Figure 3.3: Main Screen Display Layout
3-3
Page 34
Overview
Cursors
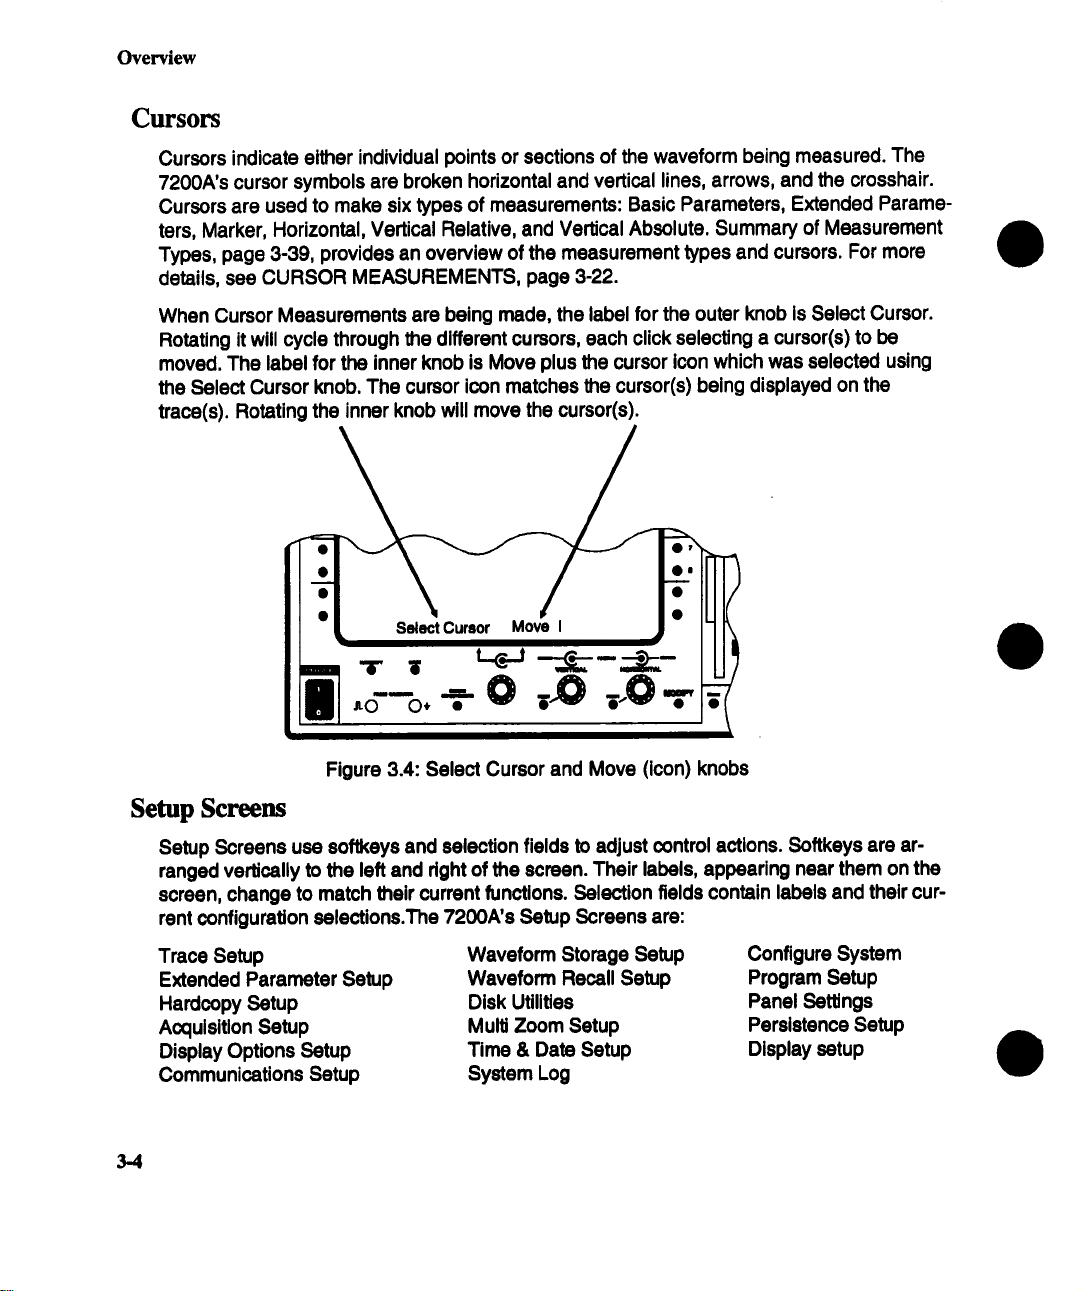
Cursors indicate either individual points or sections of the waveform being measured. The
7200A’s cursor symbols are broken horizontal and vertical lines, arrows, and the crosshair.
Cursors are used to make six types of measurements: Basic Parameters, Extended Parameters, Marker, Horizontal, Vertical Relative, and Vertical Absolute. Summary of Measurement
Types, page 3-39, provides an overview of the measurement types and cursors. For more
details, see CURSOR MEASUREMENTS, page 3-22.
When Cursor Measurements are being made, the label for the outer knob is Select Cursor.
Rotating it will cycle through the different cursors, each click selecting a cursor(s) to
moved. The label for the inner knob is Move plus the cursor icon which was selected using
the Select Cursor knob. The cursor icon matches the cursor(s) being displayed on the
trace(s). Rotating the inner knob will move the cursor(s).
Figure 3.4: Select Cursor and Move (icon) knobs
Setup Screens
Setup Screens use softkeys and selection fields to adjust control actions. Softkeys are arranged vertically to the left and dght of the screen. Their labels, appearing near them on the
screen, change to match their current functions. Selection fields contain labels and their current configuration selections.The 7200A’s Setup Screens are:
Trace Setup
Extended Parameter Setup
Hardcopy Setup
Acquisition Setup
Display Options Setup
Communications Setup
3-4
Waveform Storage Setup
Waveform Recall Setup
Disk Utilities
Multi Zoom Setup
Time & Date Setup
System Log
Configure System
Program Setup
Panel Settings
Persistence Setup
Display setup
Page 35
Overview
To display the setup screen for a control, press the MODIFY key (beneath the lower right cor-
ner of the screen) and then press or turn the control.
NOTE: Adjusting a knob or pressing a key after pressing MODIFY will
not affect its setting, ff you press a key which does not have a setup
screen, the System Message Area will display an appropriate message.
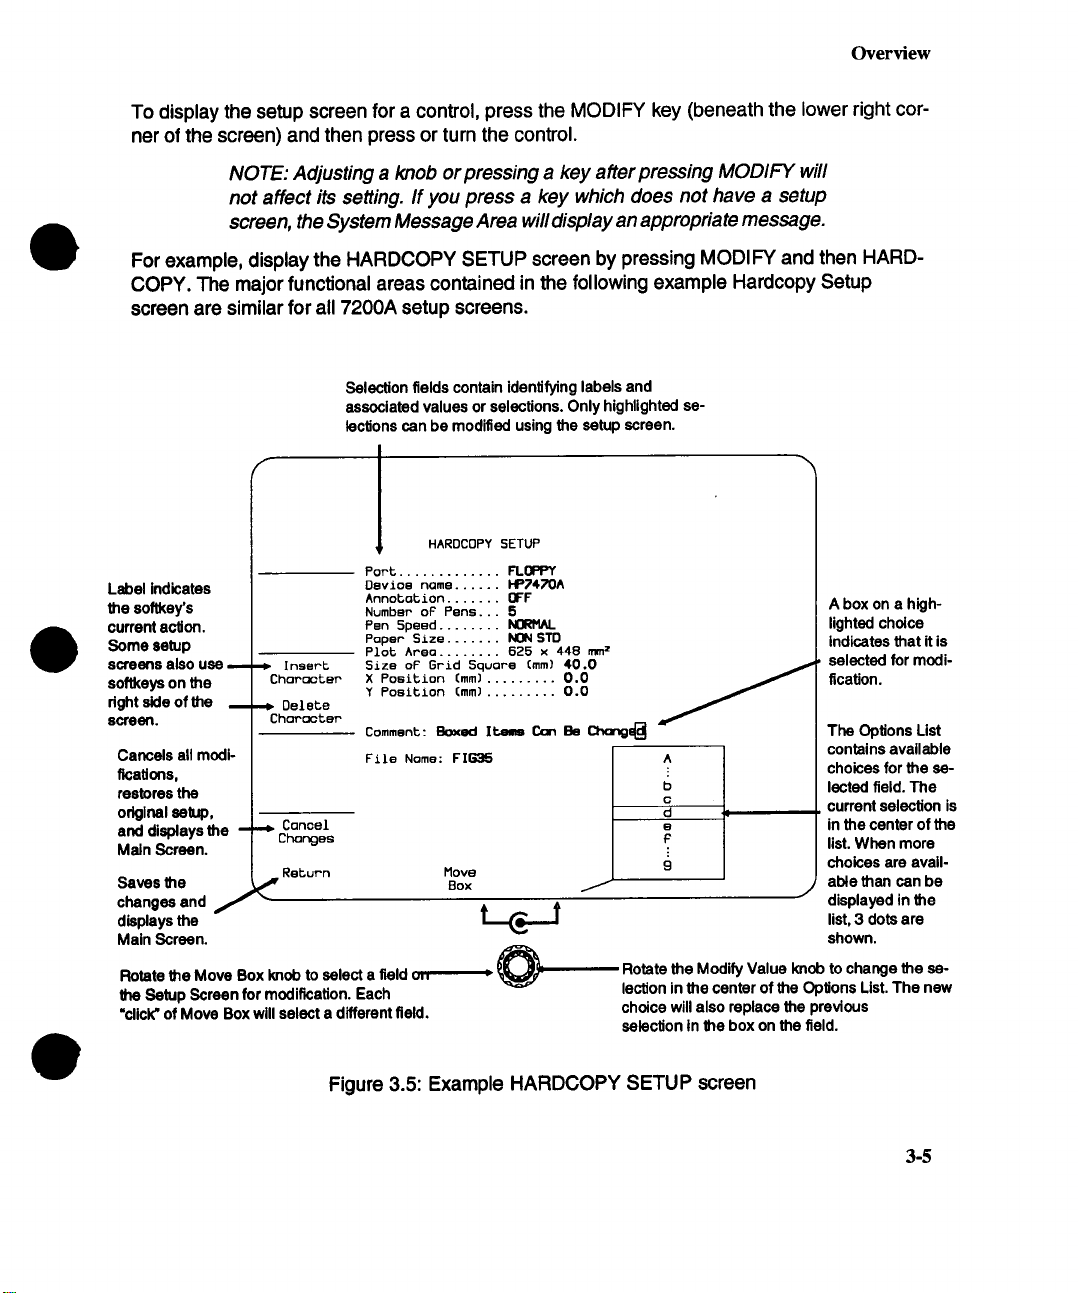
For example, display the HARDCOPY SETUP screen by pressing MODIFY and then HARDCOPY. The major funcUonal areas contained in the following example Hardcopy Setup
screen are similar for all 7200A setup screens.
Selection fields contain identifying labels and
associated values or selections. Only highlighted se-
lecfions can be modified using the setup screen.
HARDCOPY 5ETUP
Box
t_c._J
FLOPPY
NORMAL
z
A box on a highlighted choice
indicates that it is
selected for modi-
fication.
The Opfions List
contains available
b
C
-~ current selection is
9
t
Rotate the Modify Value Imob to change the selection in the center of the Options List. The new
choice will also replace the previous
selection in the box on the field.
choices for the se-
lected field. The
in the center of the
list. When more
choices are avail-
able than can be
J displayed in the
list, 3 dots are
shown.
Port .............
Label indicates
the softkey’s
current action.
Some setup
screens aiso use
soflkeys on the
right side of the
screen.
Cancels all modificafions,
restores the
original setup,
and displays the
Main Screen.
Saves the
changes and J
displays the
Main Screen.
Rotate the Move Box I~ob to select a field v,,
the Setup Screen for modification. Each
"dick" of Move Box will select a different field.
, ! I nssrt
Character
, Delete
Character
i Cancel
Changes
Re~urn
~"
Dsvioe name ..... HP7470A
Annotation ..... OFF
Number oF Pens. 5
Pen 5peed ......
Paper Size ..... NON STO
Plot Area ...... 6Z5 x 448 mm
Size of Grid Square (mm) 40.0 ~,
X Position (mm) .........0.0
Y Position (mm) .........0.0
Comment: Boxed Items Can Be Change~
File Name: FIG35 J ^
Move
Figure 3.5: Example HARDCOPY SETUP screen
3-5
Page 36
Overview
On-line HELP
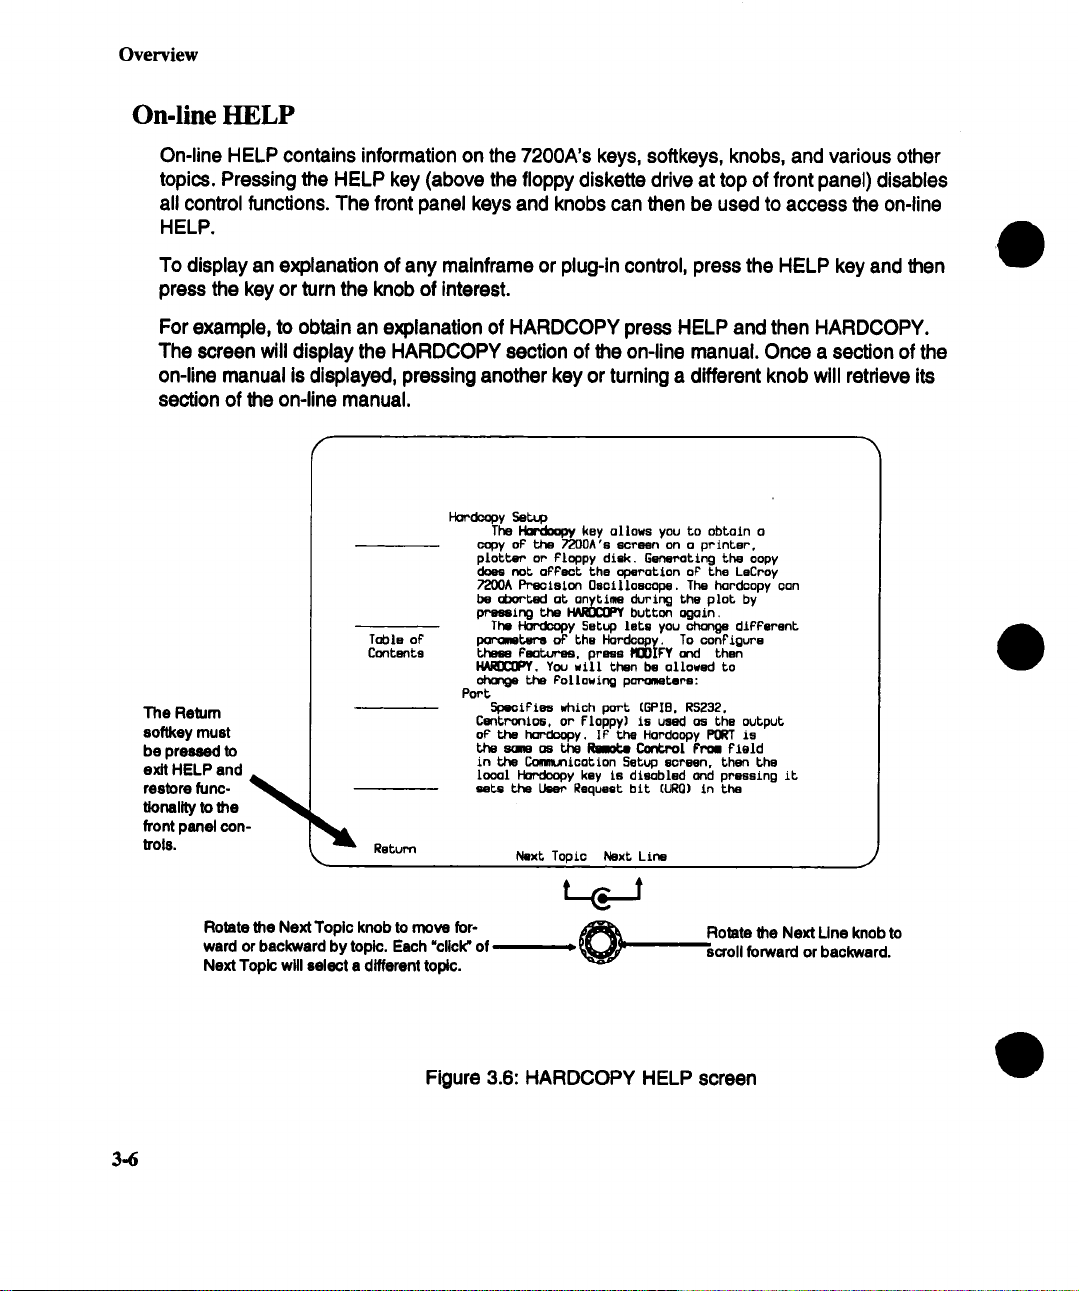
On-line HELP contains information on the 7200A’s keys, softkeys, knobs, and various other
topics. Pressing the HELP key (above the floppy diskette drive at top of front panel) disables
all control functions. The front panel keys and knobs can then be used to access the on-line
HELP.
To display an explanation of any mainframe or plug-in control, press the HELP key and then
press the key or turn the knob of Interest.
For example, to obtain an explanation of HARDCOPY press HELP and then HARDCOPY.
The screen will display the HARDCOPY section of the on-line manual. Once a section of the
on-line manual is displayed, pressing another key or turning a different knob will retrieve its
section of the on-line manual.
H=-~py Seep
The HordooW key allows you to obtain o
coW oF the 7200A’e 6croon on a printer,
piot~P or Floppy disk. Generating the oopy
does not oPPect the operation of’ the LsCroy
7200A Prectsion Oscilloscope, The hordoopy con
be aborted at, anytime during the plot by
pressing the H/~ button again.
The ~y Setup lets you change dlFPsrsnt
poromter’s oF the Hordoopy. To configure
these Features, press flOOIFY and then
~, You sill then be allowed to
ohonge tJne Pollowing pm-omtsrs:
Port,
SpeciFies which port (GPI8. R5232,
CentPonlos, or Floppy] is used as the output
oF" the hor’doopy. IP the Hordoopy PORT is
the some as the ~ CofCPol FPOll Field
in the Communication 5etup screen, then the
local Hordoopy key Is disabled and pressing it,
sets the User Request bit (URQ] in the
Next Topic Next Line
The Return
eoftkey must
be pressed to
exit HELP and
restore rune- ~
flonallty to the
front panel controis.
Table oF
Cantante
Return
3.6
Rotate the Next Topic knob to move for-
ward or backward by topic. Each "click" of
Next Topic will select a different topic.
Figure 3.6: HARDCOPY HELP screen
Rotate the Next Line knob to
scroll forward or backward.
Page 37
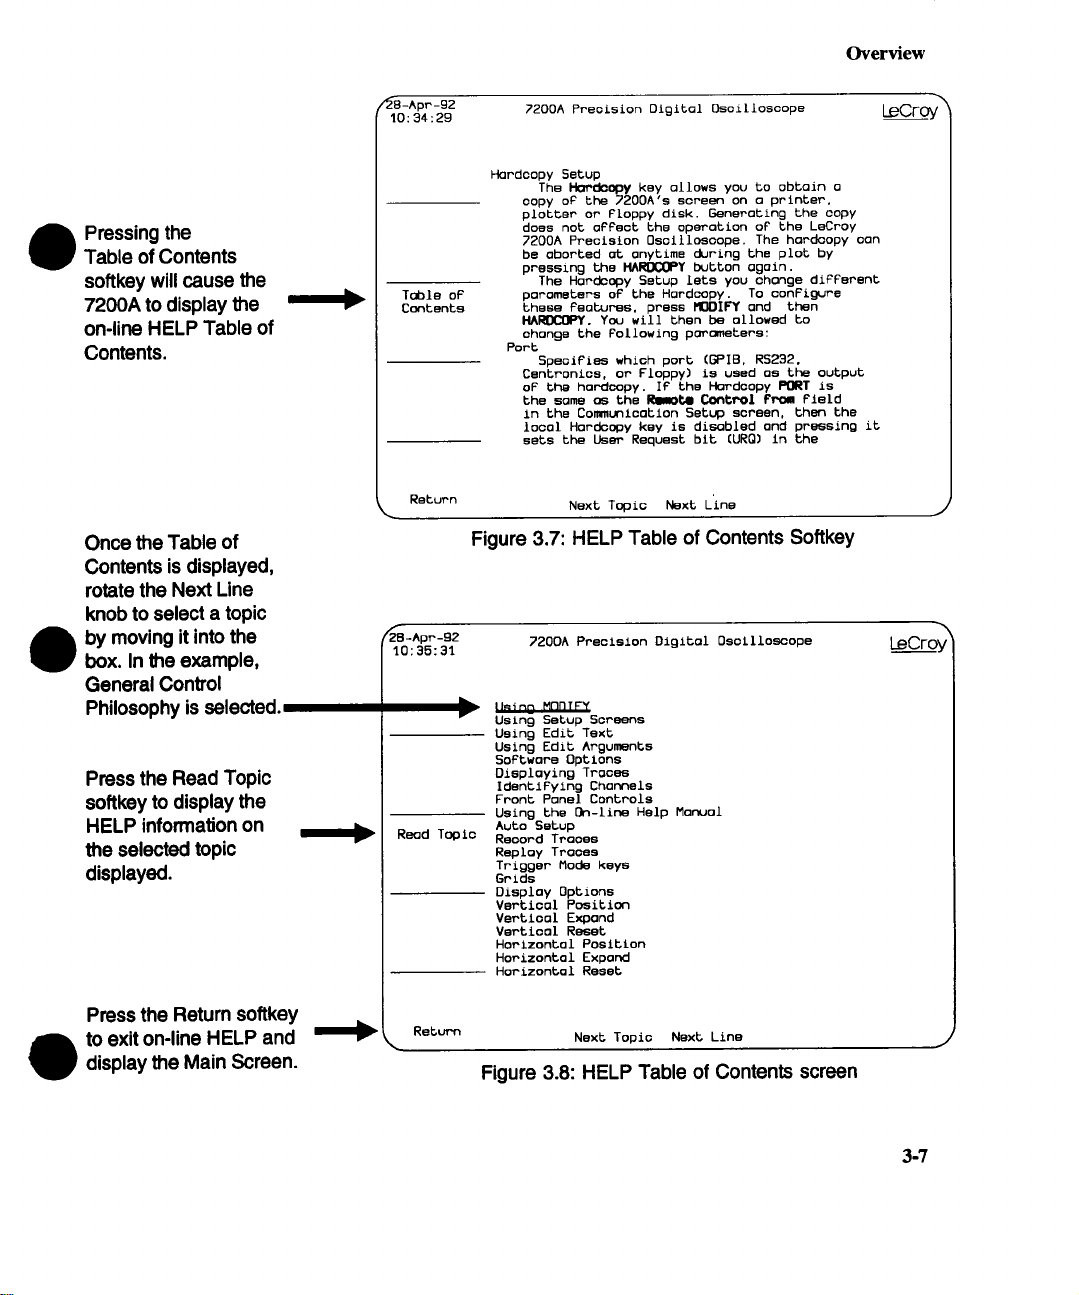
Overview
Pressing the
Table of Contents
softkey will cause the
7200A to display the
on-line HELP Table of
Contents.
Once the Table of
Contents is displayed,
rotate the Next Line
knob to select a topic
by moving it into the
box. In the example,
General Control
Philosophy is selected.
Press the Read Topic
softkey to display the
HELP information on
the selected topic
displayed.
~El-Apr-92
10:34 : 29
Toble of
Contents
~2B-Apr-g2
10:35:31
Reod Topic
7200A Preoision Olglbul Oscilloscope
Hordoopy Setup
The HoP~opy key ollows you to obtoin o
copy of the 7200A’s screen on o printer,
plotter or Floppy disk. Generoting the copy
does not offsct the operotion of the LeCroy
7200A Precision Oscilloscope. The hordoopy con
be oborted o~ onytime during the plot by
pressing the HAROCOPY button ogoin.
The Hordcopy Setup lets you chonge different
poromsters of the Hordcopy. To configure
these lectures, press MODIFY ond then
HAROCOPY. You will then be o[Iowed to
chunge the Following po~ometere:
Port
Specifies which pore (BPIB, R5232.
Csntronics, or Floppy) is used oS the output
of b~ hordcopy. If the Hordcopy PORT is
the some os the I~41 Control PPoll field
in the Communicotlon Setup screen, then the
Io0oi Hordoopy key is disobled ond pressing it
sets the User Request bib (URQ) in the
Next Topic Next L’ins
Figure 3.7: HELP Table of Contents Softkey
7200A Precision Digital Osoillomcope
===
Ilminn MnRIFY
r
Using Setup Screens
Using Edit Text
Using Edit Arguments
Softwore Options
Dieploying Trooes
Identifying Chonnels
Front Ponel Controls
Using the On-line Help Monuol
Auto Setup
Record Traces
Reploy Trooes
Trigger Mode keys
Grids
Disploy Options
Vertlcol Position
VertlooL Expond
Vsrtiool Reset
Horizontol Position
Horizontol Expond
Hor£zontol Reset
~
LeCroy
J
LeCroy
Press the Return softkey
to exit on-line HELP and
display the Main Screen.
I1~ Return
Next Topic Next Line
Figure 3.8: HELP Table of Contents screen
J
3-?
Page 38
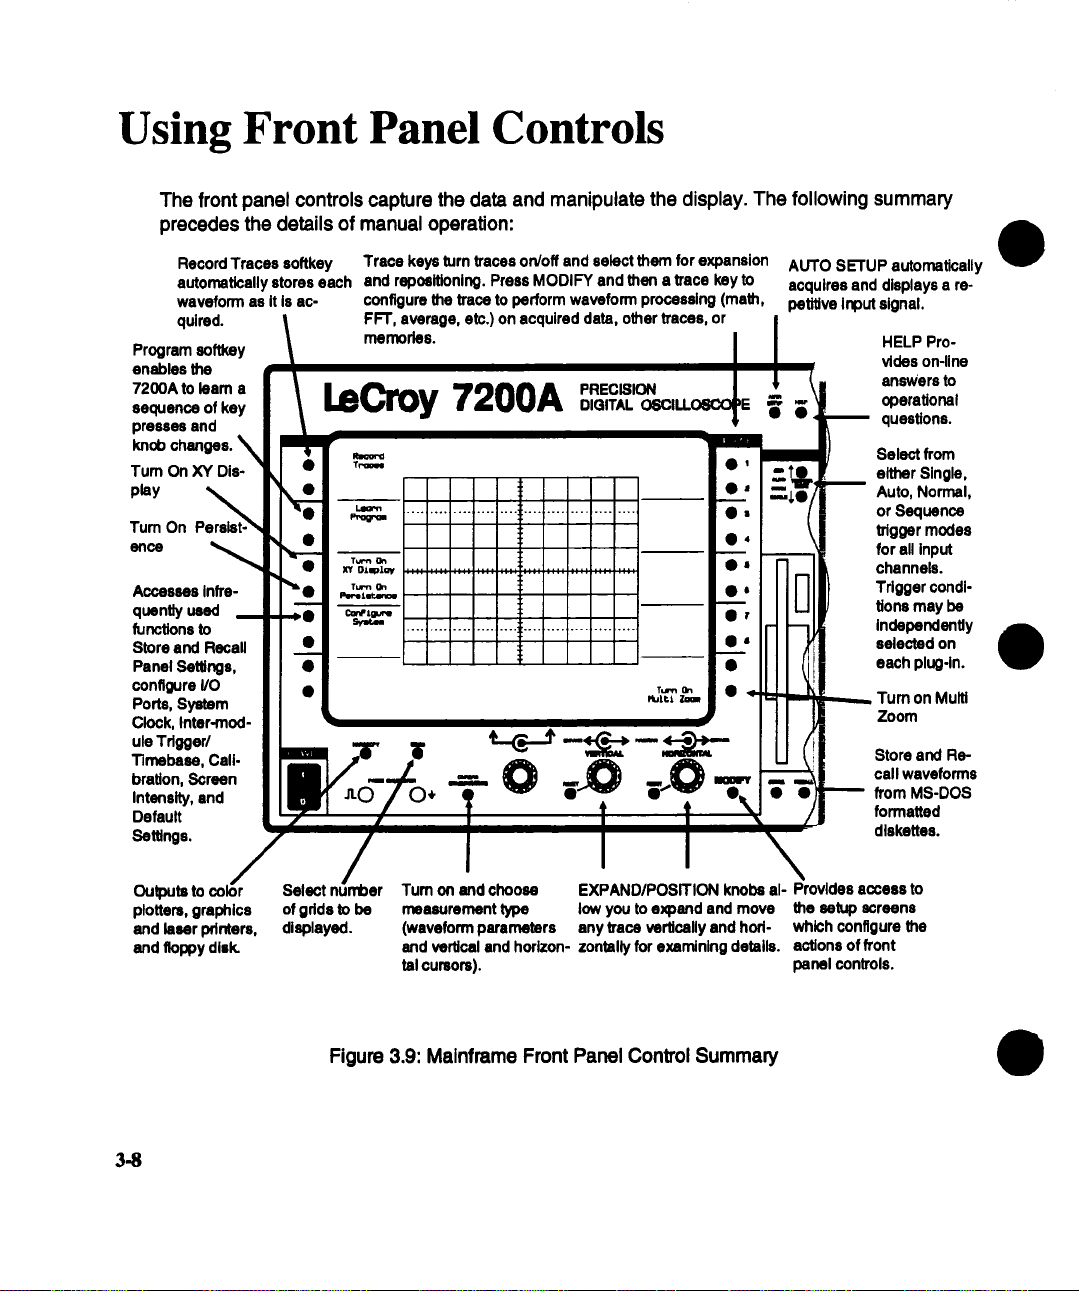
Using Front Panel Controls
The front panel controls capture the data and manipulate the display. The following summary
precedes the details of manual operation:
Record Traces acftkey Trace keys turn traces on/off and select them for expansion
automatically stores each and rspceltionlng. Press MODIFY and then a trace key to
weveforrn as it Is ac*
qulrsd.
Program softkey
enables the
7200A to learn a
sequence of key
presses and
knob
Tum On XY Display
Tum On
ence
Accesses Infrequen~ used
functions to
Store end Recall
Panel Settings,
configure I/O
Ports, System
Clock, Inter-module Tdggar/
"rimabase, Cali-
bration, Screen
Intensity, and
Default
Settings.
configure the trace to perform waveform processing (math,
FFT, average, etc.) on acquired data, other traces, or
memories.
LeCroy 7200A
! ....
-- !!
.... ; .................i l .....................
i
¯
’~ "~ "--" ~ Store and Re-
"- 0 ~0 ~-0
AUTO SETUP automatically
acquires and displays a re-
petitive Input signal.
HELP Pro-
vldes on-line
answers to
operational
questions.
Select from
either Single,
Auto, Normal,
or Sequence
trigger modes
for ell Input
channels.
Trigger conditions may be
independently
selected on
each plug-in.
Turn on Multi
Zoom
call waveforms
from MS-DOS
formatted
diskettes.
Outputs to
plotters, gmphlce
and laser printers,
and floppy disk.
3.8
Select
of gdds to be
displayed.
Figure 3.9: Mainframe Front Panel Control Summary
Tum on and choose
measurement type low you to expand and move
(waveform parameters any trace vertically and hodand vertical and horizon- zontslly for exarnlnlng details,
tel cursors),
EXPAND/POSITION knobs al- Provides access to
the setup screens
which configure the
actions of front
panel controls.
Page 39

7200A Mainframe Front Panel Illustration
Page 40
7200A Mainframe Front Panel
LeCroy 7200A
11 12 13
14 15 16
17 18 19 20 21 22 23 24
31
PRECISION
DIGITAL OSCILLOSCOPE
32
33~
34~
35m
3O
25 26
29 28
27
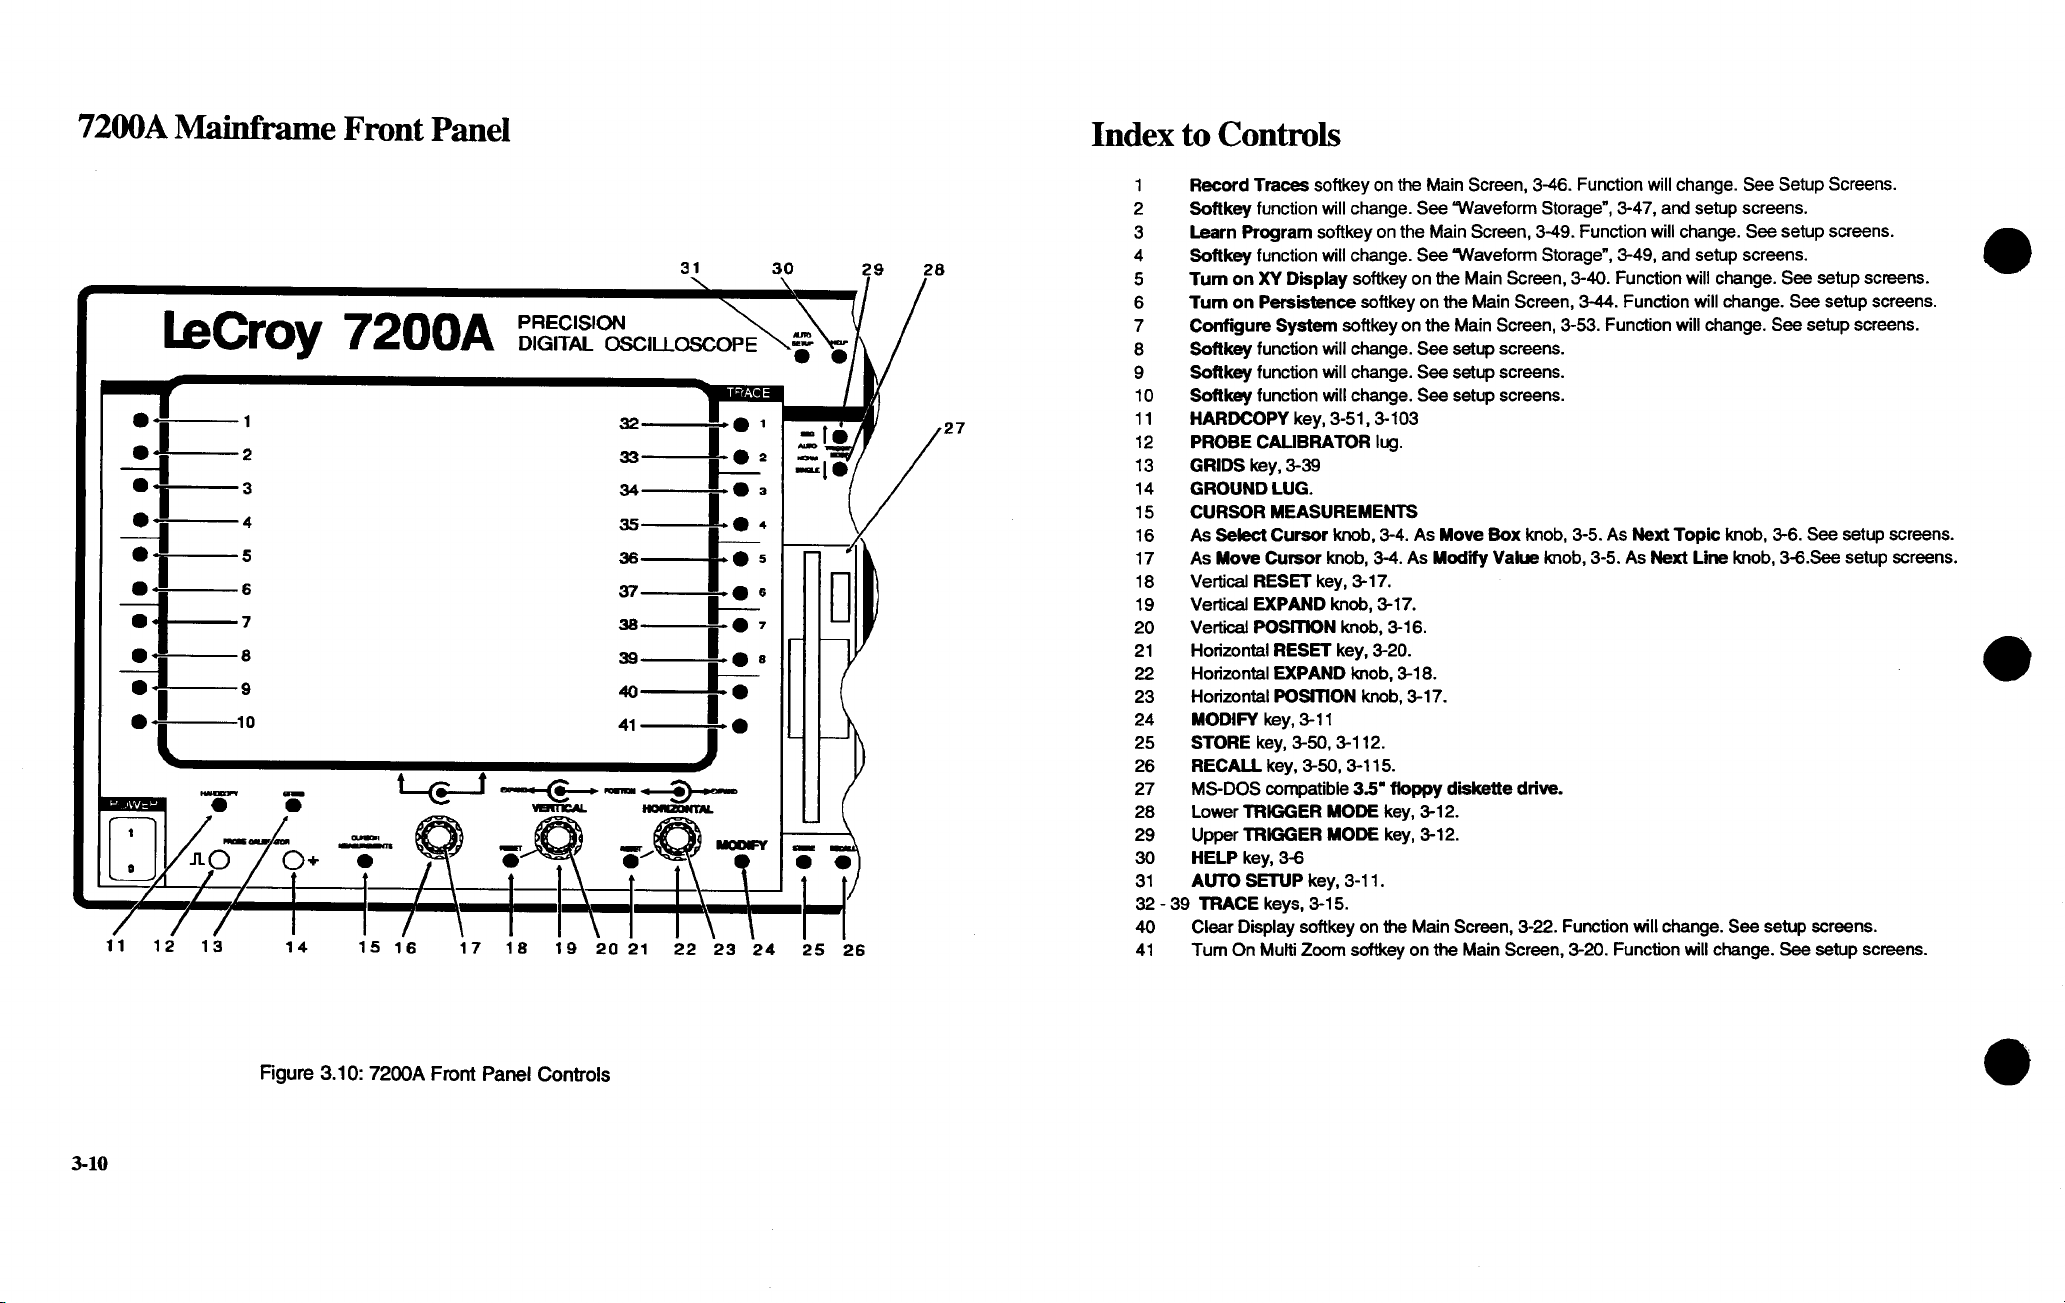
Index to Controls
1 Record Traces softkey on the Main Screen, 3-46. Function will change. See Setup Screens.
2 Softkey function will change. See =Waveform Storage", 3-47, and setup screens.
3 Learn Program softkey on the Main Screen, 3-49. Function will change. See setup screens.
4 Softkey function will change. See =Waveform Storage", 3-49, and setup screens.
5 Turn on XY Display softkey on the Main Screen, 3-40. Function will change. See setup screens.
6 "rum on Persistence softkey on the Main Screen, 3-44. Function will change. See setup screens.
7 Configure System softkey on the Main Screen, 3-53. Function will change. See setup screens.
8 Softkey function will change. See setup screens.
9 Soltkey function will change. See setup screens.
10 Soltkey function will change. See setup screens.
11 HARDCOPY key, 3-51,3-103
12 PROBE CALIBRATOR lug.
13 GRIDS key, 3-39
14 GROUND LUG.
15 CURSOR MEASUREMENTS
16 As Select Cursor knob, 3-4. As Move Box knob, 3-5. As Next Topic knob, 3-6. See setup screens.
17 As Move Cursor knob, 3-4. As Modify Value knob, 3-5. As Next Line knob, 3-6.See setup screens.
18 Vertical RESET key, 3-17.
19 Vertical EXPAND knob, 3-17.
20 Vertical POSITION knob, 3-16.
21 Horizontal RESET key, 3-20.
22 Horizontal EXPAND knob, 3-18.
23 Horizontal POSITION knob, 3-17.
24 MODIFY key, 3-11
25 STORE key, 3-50, 3-112.
26 RECALL key, 3-50, 3-115.
27 MS-DOS compatible 3.5" floppy diskette drive.
28 Lower TRIGGER MODE key, 3-12.
29 Upper TRIGGER MODE key, 3-12.
30 HELP key, 3-6
31 AUTO SETUP key, 3-11.
32 - 39 TRACE keys, 3-15.
40 Clear Display softkey on the Main Screen, 3-22. Function will change. See setup screens.
41 Tum On Multi Zoom softkey on the Main Screen, 3-20. Function will change. See setup screens.
3-10
Figure 3.10: 7200A Front Panel Controls
Page 41

Following are descriptions of the mainframe front panel controls. The number in parentheses
locates the control on the 7200A front panel drawing (Figure 3.10, page 3-10).
MODIFY (24)
The MODIFY key (beneath the lower right corner of the screen)
provides access to the 7200A’s setup screens. When MODIFY is
pressed, PRESS KEY TO MODIFY ITS SE’I-I’INGS is displayed
in the System Message Area. Pressing a key or turning a knob
will then cause the control’s setup screen to appear. Modifying
the selection fields on the setup screen will change the control’s
actions.
For example, pressing MODIFY and then HARDCOPY will
cause the 7200A to display the HARDCOPY SETUP screen.
Modifying the HARDCOPY SETUP selection fields will change
the HARDCOPY key’s actions.
NOTE: If you press MODIFY and then select a control
which does not have a setup screen, the System Mes-
sage Area will display NO SETUP SCREEN FOR and
the name of the control (e.g., NO SETUP SCREEN FOR
GRIDS). Adjusting a control after pressing MODIFY
does not change the control’s setting.
Acquisition Keys
AUTO (31)
SETUP
Press this key to have the 7200A display a repetitive input signal
by automatically adjusting the acquisition control settings of each
plug-in for the "best" display. Pressing the key while in progress
will abort AUTO SETUP. The acquisition controls may then be
further adjusted if desired.
3-11
Page 42

Input signals must have an amplitude between 2 mV and 8 V, fre-
quency above 50 Hz, and a duty cycle greater than 0.1%. AUTO
SETUP time depends on the signal frequency. It is generally
under 20 seconds.
¯ The TRIGGER MODE (as described below) is set
AUTO, and timebase and trigger settings are automatIcally adjusted as follows:
If AUTO SETUP is performed on a single channel that
has a valid signal, the timebase and trigger controls
adjust to best display the signal. If no signal or a DC
signal is found, timebase for the channel is set to
10 psec.
If more than one channel is used by a trace(s) that
turned on, the lowest numbered channel with a valid
signal is used to setup the timebase and trigger
controls for all plug-in channels. If no signal or a DC
signal is found, the timebase for all channels is set to
10 IJ~ec.
¯ AUTO SETUP does not change the input’s vertical
coupling.
¯ Vertical settings for all channels are selected Inde-
pendently.
TRIGGER MODE
((28) and (29))
3-12
Selects from either Single, Normal, Auto, or Sequence trigger
modes for all input channels. Trigger conditions can be Inde-
pendently selected on each plug-in. As these keys are pressed
to step through each trigger mode, LEDs Indicate the mode selected.
A READY LED on each plug-in indicates that the tdgger circuit
has been armed and the plug-in is currently acquiring input
signals. The plug-in’s TRIG’D LED is lit whenever a valid trigger
has been received and waveform acquisition completed. In RIS
or SEQuence mode, the TRIG’D LED is not lit until a complete
waveform has been constructed after sufficient triggers have occurred.
If an acquisition key is changed while acquiring data, the acquisi-
tion stops and acquisition restarts using the new setting. If the
Page 43

key is changed between acquisitions, it affects the next acquisi-
tion.
NOTE: When the 7200A is in SINGLE or SEQuence
mode and has finished acquiring data, changes to the
plug-in acquisition settings will not affect the currently
displayed trace, but will affect the acquisition of the next
trace (initiated by pressing the TRIGGER MODE key to
re-select the mode).
The Trigger modes operate as follows:
SINGLE
NORMAL
Arms the trigger circuit. When a valid tdgger signal is detected,
acquisition occurs and the waveform is displayed.
To arm the circuit again for another sweep, press the lower
TRIGGER MODE key again to re-select SINGLE. (The READY
LED is lit.) When a valid trigger is detected (TRIG’D LED lit),
acquisition completes and the new waveform then replaces the
one previously displayed. This mode is useful for capturing transient events.
If TRIGGER MODE is pressed a second time prior to detecting a
valid trigger, the 7200A will manually trigger all plug-ins.
When the 7200A is in the Random Interleaved Sampling (RIS)
mode (as indicated by the LED on the plug-in front panel), the
waveform is constructed and displayed after sufficient triggers
have occurred. The 7200A must then be re-armed by pressing
TRIGGER MODE again to re-select SINGLE before acquisition
of the next RIS waveform begins.
The 7200A acquires data and updates the display for each valid
trigger. The trigger circuit is automatically re-armed after each
acquisition.
Select NORMAL mode by pressing either TRIGGER MODE key
until the NORM LED is lit.
This mode is useful for capturing signals correlated in time with a
repetitive trigger signal.
3-13
Page 44

When the plug-in is in the RIS mode, as indicated by an LED on
the plug-in front panel, each waveform is displayed after sufficient triggers have occurred to construct it.
AUTO
SEQUENCE
AUTO and NORMAL Trigger Modes are identical, except that in
AUTO the 7200A automatically generates an internal trigger signal If a valid trigger Is not detected within 100 msec during single
shot mode and 200 msec in RIS mode.
This mode is useful for obtaining a trace on the screen for Initial
adjustment of acquisition settings. It is also used for capturing
signals not having a reliable, detectable, or time-correlated trigger signal. Select AUTO mode by pressing either TRIGGER
MODE key until the AUTO LED is lit.
In this trigger mode the acquisition memory is partitioned Into
segments as selected from within a Plug-in Status screen.
Select SEQuence mode by pressing the upper TRIGGER MODE
key until the SEQ LED is lit.
Each time a trigger occurs, the current segment is acquired and
the ~gger circuit is re-armed for acquisition of the next segment.
When all segments are completed, the result is displayed. Some
plug-ins will optionally average the successive segments, If desired, (see plug-in manuals for details).
There are 2 types of Sequence Triggers: Single and Normal. Sequence Trigger Types are selectable in the Acquisition Setup
screen. This may be accessed either from the Configure System
screen or by pressing the MODIFY key and then a TRIGGER
MODE key.
3-14
Single Sequence acquires the requested number of segments
and displays the sequence waveform. To arm the circuit again
for another sweep, press TRIGGER MODE again to re-select
Sequence.
If SEQuence Mode is selected again prior to acquiring all
segments, acquisition halts and those segments which have
been acquired so far are displayed. If SEQuence Mode is
selected a third time, acquisition is restarted from the beginning.
Page 45

Normal Sequence will keep acquiring and displaying
sequence waveforms until the TRIGGER MODE key
is pressed again to re-select Sequence.
In SEQuence mode the total duration of each segment is equal
to the time/div x 10. Changing the number of required segments
does not change the time per division; it only affects the number
of data points (record length) per segment, and the time/point
(sampling rate).
Waveform acquisition in this mode is particularly useful for shortlived or echoed signals, such as those in RADAR, SONAR, LI-
DAR and NMR.
Waveform Display and Measurement
TRACE
((32) through (39))
Turns the trace on, selects the trace, or turns the race off. If a
TRACE key is pressed while its corresponding trace is not dis-
played, the trace is turned on and becomes the Selected Trace.
The Selected Trace is indicated by a rectangle around its trace
label. If the trace is already on, pressing its TRACE key makes it
the Selected Trace. If the TRACE key of the Selected Trace is
pressed, the trace is turned off and the next trace becomes the
Selected Trace.
While a trace is displayed, the area on the screen next to the
TRACE key indicates the trace label and the horizontal and verti-
cal scale factors for that trace (i.e., time per division and volts
per division for unprocessed waveforms). The trace label indi-
cates either: the source(s) and any processing of the trace data,
or the user selected name for the trace. If cursor measurements
are tumed on, certain cursor values are displayed under the
trace label. If the trace contains an average, extrema, histogram
or trend function, the number of acquisition sweeps or parameter
values accumulated is indicated. If the trace consists of a se-
quence waveform, the number of segments is indicated. If one
segment of a sequence waveform is displayed, the segment
number is indicated. When "l’race Colors" is set to 8 in the Dis-
play Setup Screen (see p. 3-128), this text is displayed in the
same color that the trace is drawn for easy identification.
3-15
Page 46

Waveform Display and Measurement
The following six controls affect the display of the Selected Trace, indicated by a rectangle
around Its trace label on the right side of the screen. These controls adjust the trace’s posi-
tion and magnification. As the trace is being altered, refer to the View Port which appears as
a stylized waveform within a box below the lower right corner of the grid. The View Port
graphically shows the trace location and expansion with respect to the display grid. The
width of the stylized waveform represents the total record length of the trace; the height represents the full range of the Analog to Digital Converter (ADC). If the Selected Trace is positioned or expanded to accentuate some points and not display others, the View Port
identifies the displayed section (boxed-in area) relative to the entire trace. That is, the section of the stylized waveform within the rectangle corresponds to the displayed section of the
Selected Trace. Also, when a trace Is expanded vertically or re-positioned, a two headed vertical arrow is positioned next to its’ trace label. For horizontal expansion or position a two
headed horizontal arrow is positioned next to its’ trace label.
VERTICAL (2O)
POSITION
This knob moves the Selected Trace vertically anywhere on the
screen. This allows traces to be overlaid for comparisons or
separated for easy viewing. As the Selected Trace is positioned
a two headed vertical arrow is positioned next to the trace label.
The position knob does not affect the vertical offset of the acquisition channel(s).
The View Port shows the position of the trace relative to the grid.
See Figure 3.11.
3.16
Page 47

Waveform Display and Measurement
VERTICAL (19)
EXPAND
Record
Trocee
Leorn
Progrom
Turn On
XY Oisploy
Turn On
Persistenoe
ConFigure
5ystem
~B1
5 ns 20 mV
=
Figure 3.11: Trace Vertically reposiUoned. View Port
indicates location of trace.
This knob vertically expands the Selected Trace around the center of its home grid. As the Selected Trace is expanded, the
View Port shows only a portion of the trace inside the View Port
box to indicate that part of the data range is off the screen. The
vertical scale factor indication under the trace label is automat-
ically adjusted. The expansion knob does not affect the amplifier
settings of the acquisition channel(s).
VERTICAL (18)
RESET
HORIZONTAL (23)
POSITION
The waveform can be expanded or contracted vertically in steps
that are multiples of one, two, and five.
Toggles the vertical display of the Selecte.d Trace between the
selected expansion and position and the reset vertical state (unexpanded on the center of the home grid). When the Selected
Trace is expanded or re-positioned, a two headed vertical arrow
appears next to its’ trace label.
This knob moves the Selected Trace horizontally anywhere on
the screen. As the Selected Trace is positioned a two headed
horizontal arrow is positioned next to the trace label. The posi-
3-17
Page 48

Waveform Display and Measurement
tion knob does not affect the trigger delay of the acquisition chan-
nel.
If part of the waveform is positioned off the display grid, the View
Port and horizontal arrows can help determine the position of the
displayed section relative to the entire trace.
If displaying one segment of a trace acquired with SEQuence
Mode, rotate the knob to display other segments. When a seg-
ment boundary is reached, an extra turn of the knob is required
to display the next segment. The segment number is indicated
next to the trace label.
HORIZONTAL (22)
EXPAND
This knob horizontally expands (i.e., magnifies) the Selected
Trace around the center of the grid. As the Selected Trace is expanded, the View Port shows a shorter portion of the trace inside
the View Port box to indicate that there is data which is not currentiy on the screen. The horizontal scale factor indication under
the trace label Is automatically adjusted. The expansion knob
does not affect the timebase settings of the acquisition chan-
nel(s).
The waveform can be expanded or contracted horizontally in
steps that are multiples of one, two, and five.
When a trace is horizontally expanded so that the number of
data points is less than the number of display pixels across the
screen, linear interpolation is used to connect the data points.
The actual data points are displayed with greater intensity in order to distinguish them.
When displaying a trace acquired with SEQuence Mode, rotating
the HORIZONTAL EXPANSION knob clockwise by one position
displays a single segment of the trace. Additional rotations will
expand that segment. Rotating the HORIZONTAL POSITION
knob moves to the other segments. The displayed segment num-
ber is indicated next to the trace’s label as shown on the next
page:
3-18
Page 49
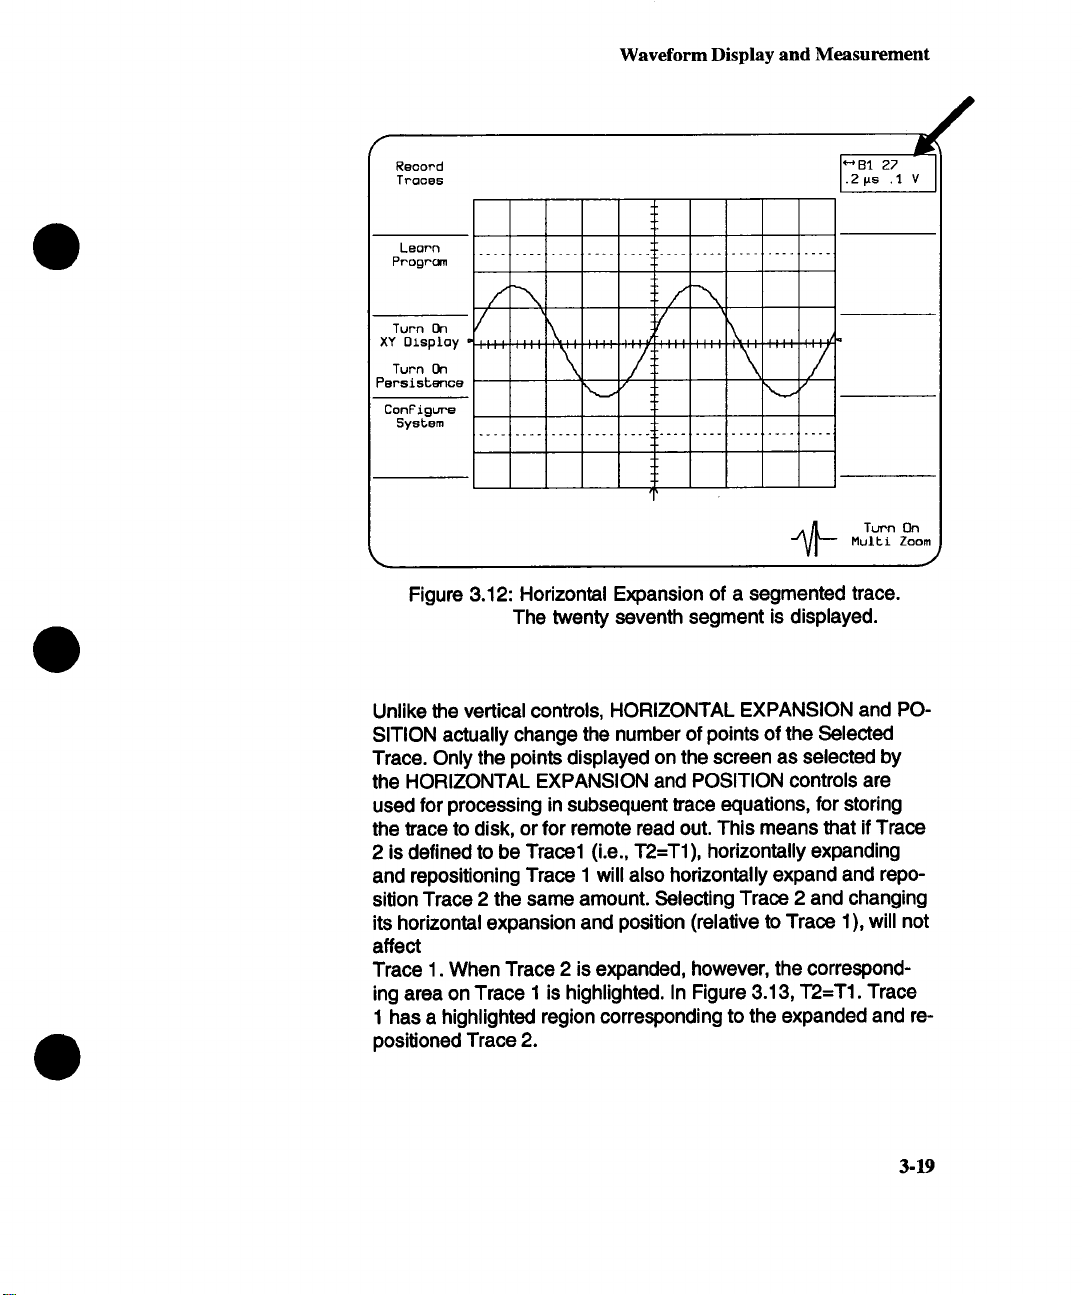
Reoord
Trooes
Waveform Display and Measurement
/
Leorn
Progrc~
Turn On
XY Oisploy -
Turn On
PersisbenGe
ConFigure
Sy6tem
=-1
/
\ ./
_/~ Turn On
Multi Zoom
J
Figure 3.12: Horizontal Expansion of a segmented trace.
The twenty seventh segment is displayed.
Unlike the vertical controls, HORIZONTAL EXPANSION and POSITION actually change the number of points of the Selected
Trace. Only the points displayed on the screen as selected by
the HORIZONTAL EXPANSION and POSITION controls are
used for processing in subsequent trace equations, for storing
the trace to disk, or for remote read out. This means that if Trace
2 is defined to be Trace1 (i.e., T2=T1), horizontally expanding
and repositioning Trace 1 will also horizontally expand and reposition Trace 2 the same amount. Selecting Trace 2 and changing
its horizontal expansion and position (relative to Trace 1), will not
affect
Trace 1. When Trace 2 is expanded, however, the corresponding area on Trace 1 is highlighted. In Figure 3.13, "1"2=T1. Trace
1 has a highlighted region corresponding to the expanded and re-
positioned Trace 2.
3-19
Page 50
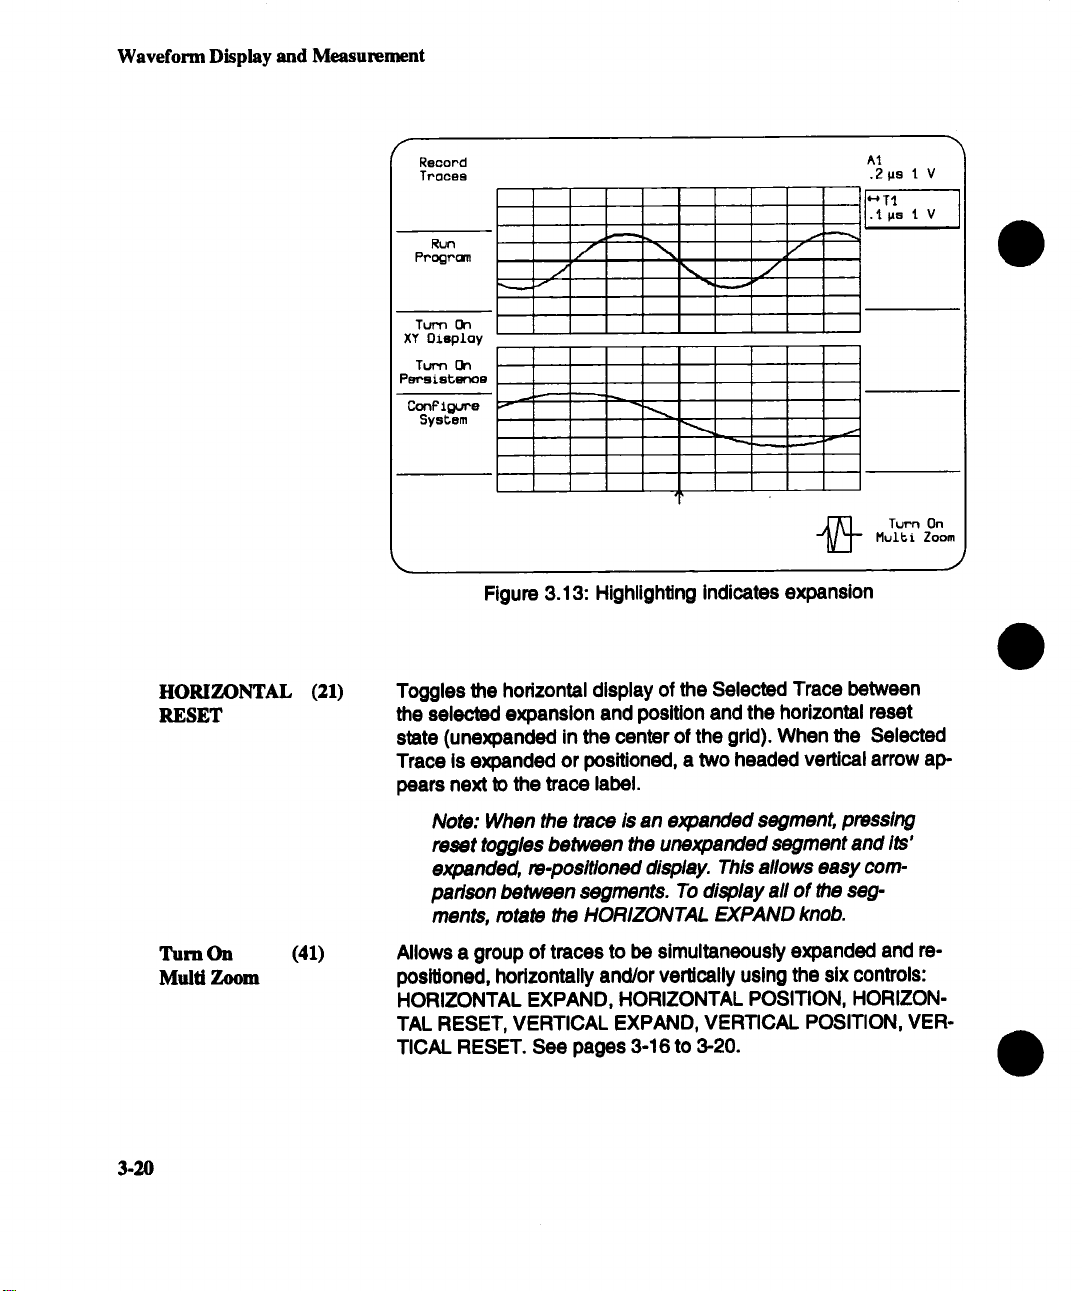
Waveform Display and Measurement
HORIZONTAL (21)
RESET
Recond
Traces
Turn On
XY Display
Turn On
Persis~gnoe
/
j
"~ ~ ~ ...._.. v
^1
.2ps I V
.1. gs 1. V
f~
MulEt Zoom
j~ Turn On
.J
Figure 3.13: Highlighting Indicates expansion
Toggles the horizontal display of the Selected Trace between
the selected expansion and position and the horizontal reset
state (unexpanded in the center of the grid). When the Selected
Trace is expanded or positioned, a two headed vertical arrow ap-
pears next to the trace label.
Turn On (41)
Multi Zoom
3.20
Note: When the trace/s an expanded segment, pressing
reset toggles between the unexpanded segment and its’
expanded, re-positioned display. This allows easy com-
parison between segments. To display all of the seg-
ments, rotate the HORIZONTAL EXPAND knob.
Allows a group of traces to be simultaneously expanded and repositioned, horizontally and/or vertically using the six controls:
HORIZONTAL EXPAND, HORIZONTAL POSITION, HORIZONTAL RESET, VERTICAL EXPAND, VERTICAL POSITION, VER-
TICAL RESET. See pages 3-16 to 3-20.
Page 51

Waveform Display and Measurement
Use the Multi Zoom Setup Screen to assign traces to a group
and to choose which axis (horizontal, vertical or both) affects the
group. To display the Multi Zoom Setup Screen, press the MODIFY key and the Turn On Multi Zoom softkey or press the MODIFY key and rotate any of the expand or position keys (see Multi
Zoom Setup, p 3-101).
When the selected trace is in the Multi Zoom group, all other
traces in the group are indicated by a dotted box around its trace
label.
Note: If a trace is added to a group and the new trace
has a different expansion, the traces assigned to the
group become unexpanded. Position is not affected.
When any of the traces in a group is the selected trace and a expansion or position control is changed, the control is applied to
all of the traces in the group. Reset toggles the display of the
group between the selected expansion and position and the reset state (unexpanded in the center of the grid). When the group
is expanded or positioned, a two headed arrow appears next to
the all trace labels.
Note: When a trace, which is not in the group of traces
for Multi Zoom, is selected, changing an expansion control only affects that trace.
3-21
Page 52
Waveform Display and Measurement
Clear Display (40) Clears the accumulation memory used for History functions (av-
eraging, extrema, histograms or trends) and the persistence dis-
play. Accumulation of data restarts with the next acquisition. The
Clear Display softkey will appear only if a History function or persistence is used. See page 3-76 for a discussion of History Func-
tions.
CURSOR
MEASUREMENTS (15)
Tums on cursor measurements. Subsequent presses step
through the measurement choices. Cursors, which are arrows,
lines, or crosshairs, indicate a location or region(s) on a trace(s)
to use for calculations. Six types of measurements are available:
Basic A basic set of automatic waveform parameter
Parameters
Extended
Parameters
Horizontal
Relative
Vertical
Relative
Marker
calculations (frequency, peak-to-peak, mean, etc.)
on the Selected Trace. The parameters are
calculated for the section of the trace between two
cursors.
A user-selected extended set of waveform
parameters calculated on any combination of
traces. The parameters are calculated for the
sections of the traces between the cursors.
The differences between the horizontal positions
and corresponding vertical values of two cursors
on a trace.
The difference between the ve~cal positions of
twOCUreO~.
The absolute horizontal position and absolute
veRtiCal value at a cursor on a trace.
3-22
VeRtical
Absolute
To perform a measurement, first press the CURSOR MEASURE-
MENTS key to activate the cursors. When cursors are activated,
a soflkey (10) appears at the lower left corner of the screen. Its
label indicates the currently selected cursor measurement. Each
time the CURSOR MEASUREMENTS key is pressed, a different
measurement is selected. Pressing the softkey in the lower left
comer turns off cursor measurements.
The absolute vertical value at the position of a
single cursor.
Page 53
Waveform Display and Measurement
There is one cursor for Marker and Vertical Absolute and two cur-
sors for Vertical, Horizontal, and Parameter measurements.
Knobs 16 and 17 under the center of the screen are used to
move the cursor(s). When there is more than one cursor, rotate
the outer knob (16) to select which cursor(s) to move. The
above the inner knob (17) will change to indicate the selected
cursor. Rotate the inner knob (17) to move the cursor whose
icon has been selected with the outer knob. Rotating the outer
knob cycles through the cursor selections: one cursor, the other
cursor, both cursors together (track mode). In track mode the inner knob moves both cursors simultaneously while maintaining
their separation constant.
NOTE: Horizontal Relative, Vertical Relative, Marker,
and Vertical Absolute measurements cannot be made
on sequence waveforms unless they are expanded to
show individual segments. Basic and Extended waveform parameters on sequence waveforms are calculated
on the first segment between the cursors.
Following are descriptions of the six measurement types.
3-23
Page 54
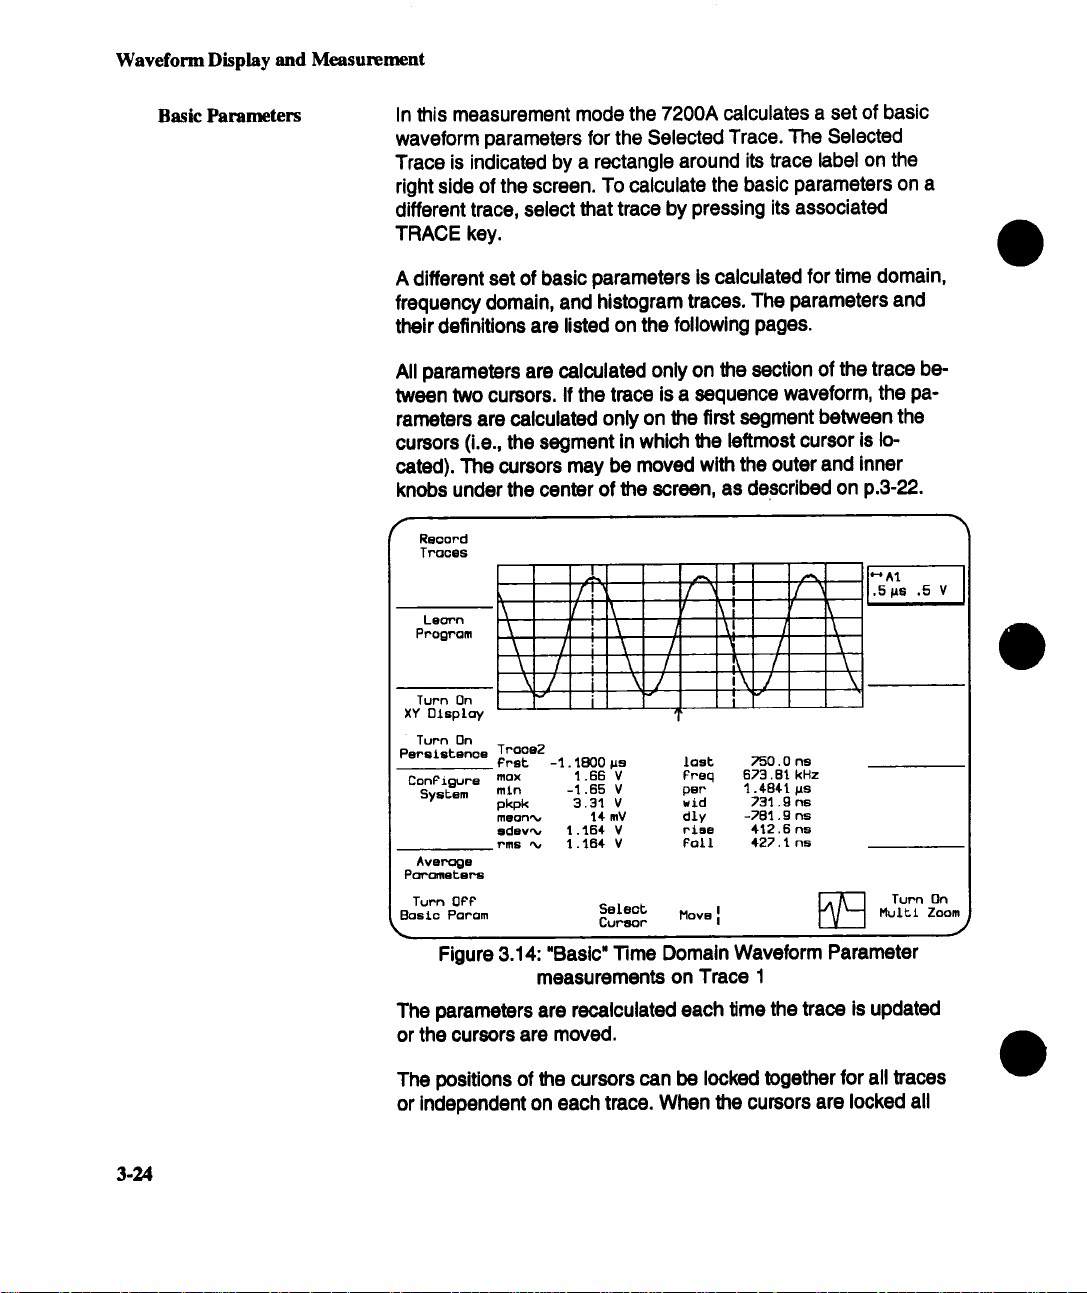
Waveform Display and Measurement
Basic Parameters In this measurement mode the 7200A calculates a set of basic
waveform parameters for the Selected Trace. The Selected
Trace is indicated by a rectangle around its trace label on the
right side of the screen. To calculate the basic parameters on a
different trace, select that trace by pressing its associated
TRACE key.
A different set of basic parameters Is calculated for time domain,
frequency domain, and histogram traces. The parameters and
their definitions are listed on the following pages.
All parameters are calculated only on the section of the trace between two cursors. If the trace is a sequence waveform, the pa-
rarneters are calculated only on the first segment between the
cursors (i.e., the segment in which the leftmost cursor is lo-
cated). The cursors may be moved with the outer and inner
knobs under the center of the screen, as described on p.3-22.
RQoor’d
Tr’ooes
Lsorn
Program
\ (I
\
\
Turn On
XY Display
Turn On
Pmrslstenoe Traoe2
ConFigure max
SysEem
Avs~:=gs
Porc~etsr-s
Turn OPP
Basic Panam Move I!
~.
Figure 3.14: "Basic" "13me Domain Waveform Parameter
The parameters are recalculated each time the trace is updated
or the cursors are moved.
\ /
Prst -1.1800 ~s
mln -1.65 V per
pl<pk 3.31V wid
meant I¢ mV
sdsv~
rms ~ 1.164 V Folt
I
/7
!
\ \I
.-. I
f
\I
/ \ /
/ i \ /
i
=r
measurements on Trace I
\j i\/ \
i
1.66 V Freq
1.46¢ V riles
Select
Cu~or
last
dly
/
I \
/ \
/ \
f
?50.0 ns
673.8l kHz
1.¢B¢l Ms
731.g ns
-?Bl.9 ns
412.6 ns
427.~ ns
~ Tunn On
IV I
.5 !us .5 V
Mult£ Zoom
.)
3-24
The positions of the cursors can be locked together for all traces
or independent on each trace. When the cursors are locked all
Page 55

Waveform Display and Measurement
traces use the same cursor positions. Locked cursors are repre-
sented by vertical lines extending the full height of the trace grid
area. Selecting a different trace causes the basic set of parameters to be computed for the new trace but the cursors do not
move.
When the cursors are unlocked each trace has its own inde-
pendent cursor positions. Unlocked cursors are represented by
short vertical marks which are displayed only on the Selected
Trace. Selecting a different trace causes the cursors for the new
trace to be displayed and the basic set of parameters to be computed for the new trace.
The cursors may be locked or unlocked by pressing the Lock/Unlock Cursors softkey in the Extended Parameter Setup screen
(accessed by pressing MODIFY and then CURSOR MEASUREMENTS). See Extended Parameter SetuP, p.3-89.
When Basic Parameters are enabled, the Average Parameters
softkey appears. The parameter averaging feature transforms
the parameter display from instantaneous values to average val-
ues.
When parameter averaging is off, the parameter values displayed are the instantaneous values for the currently displayed
waveform sweep.
When parameter averaging is on, the parameter values computed for each waveform sweep are averaged with the parameter values from the previous sweep according to the following
formula:
AVGPARAMsweep i= [19. AVGPARAMi.1 + NEWPARAMi]/20
The displayed values are thus a continuous or running average
of the values of successive acquisition sweeps.
To turn on parameter averaging, press the Average Parameters
softkey. Its label will change to Stop Average Parameters. To
tum off parameter averaging, press the Stop Average Parameters softkey.
3-25
Page 56

Waveform Display and Measurement
For time domain waveforms, the 7200A computes and displays the following 14 parameters
for the section of the Selected Trace between the cursors:
Symbol
first frst
maximum max
minimum
peak-to peak pkpk
mean m~ul
standard sdev
deviation
root mean
square
last last
frequency freq
period
rain
rlns
per
F.z sna
Time from trigger to first (leftmost) cursor.
Maximum value of the trace between the cursors.
Minimum value of the trace between the cursors.
Difference between the maximum and the minimum values.
Average or DC offset of the waveform. If the waveform Is peri-
odic, it is computed over an integral number of periods.
Square-root of sum of squares of difference from mean, divided
by number of points-l. If the waveform is periodic, it is computed
over an Integral number of periods.
Square-root of sum of squares divided by number of points. If
the waveform is periodic, it is computed over an integral number
of periods.
Time from trigger to last (rightmost) cursor.
Reciprocal of Period.
Time of a full cycle, averaged for all full cycles between the
cursors.
width wid
delay
rise time rise
fall time
3-26
dly
fall
Width of the first pulse (either positive or negative), averaged for
all similar pulses between the cursors.
Time from trigger to the midpoint of the first transition.
Duration of the pulse waveforrn’s rising transition from 10% to
90°, averaged for all rising transitions between the cursors.
Duration of the pulse waveform’s falling transition from 90% to
10%, averaged for all falling transitions between the cursors.
Page 57
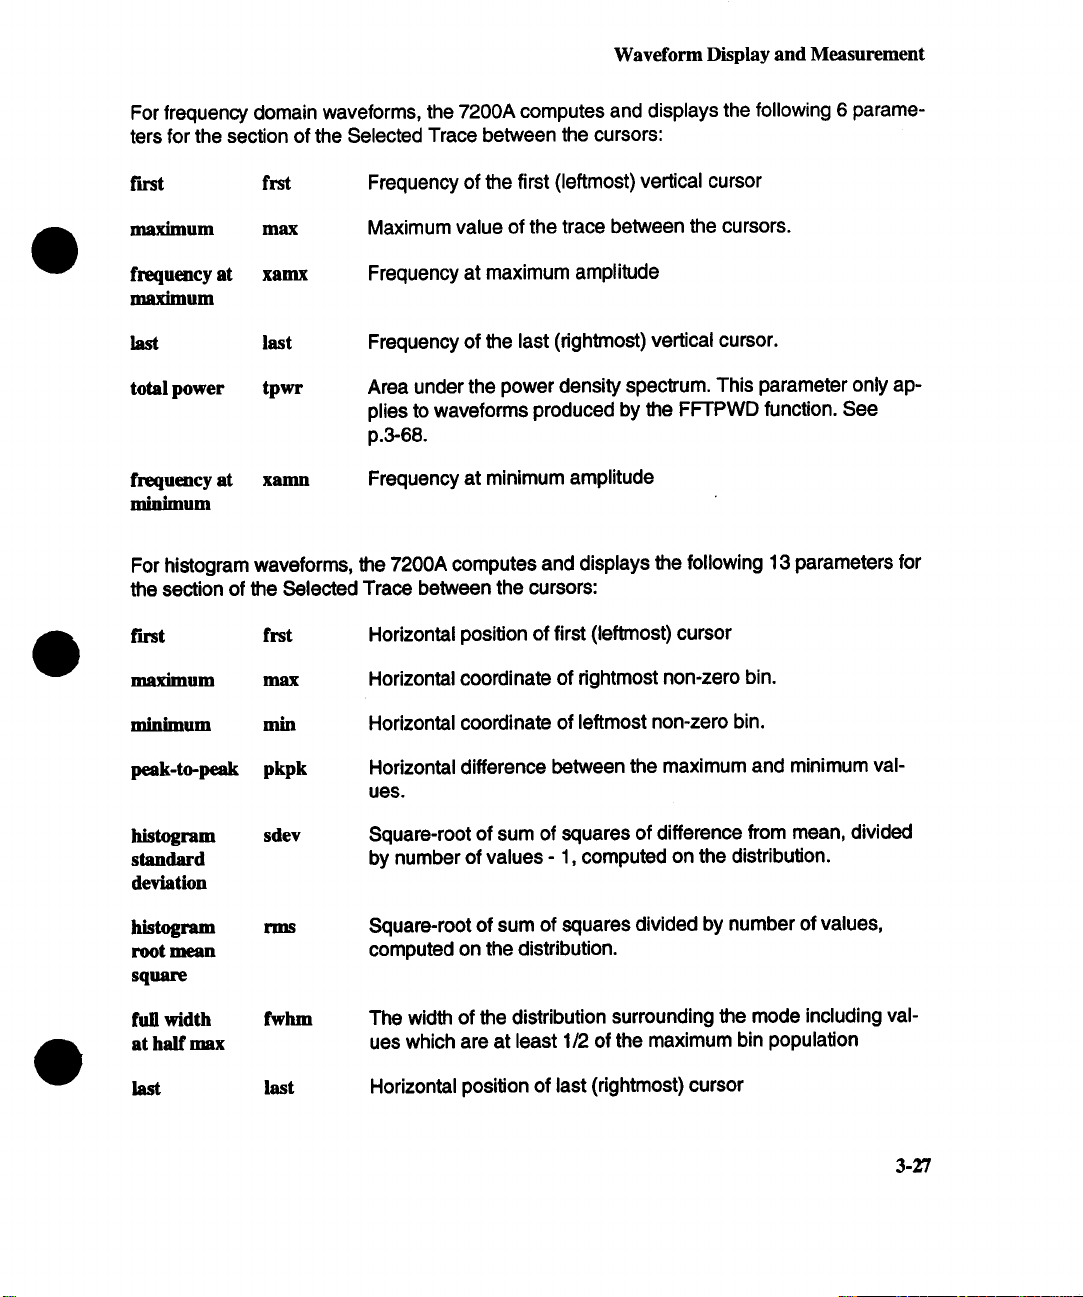
Waveform Display and Measurement
For frequency domain waveforms, the 7200A computes and displays the following 6 parameters for the section of the Selected Trace between the cursors:
first frst
maximum max
frequency at
ma~mum
last last
total power tpwr
frequency at
minimum
For histogram waveforms, the 7200A computes and displays the following 13 parameters for
the section of the Selected Trace between the cursors:
first fist
maximum max
minimum
xamx
min
Frequency of the first (leftmost) vertical cursor
Maximum value of the trace between the cursors.
Frequency at maximum amplitude
Frequency of the last (rightmost) vertical cursor.
Area under the power density spectrum. This parameter only ap-
plies to waveforms produced by the FFTPWD function. See
p.3-68.
Frequency at minimum amplitude
Horizontal position of first (leftmost) cursor
Horizontal coordinate of rightmost non-zero bin.
Horizontal coordinate of leffmost non-zero bin.
peak-to-peak
pkpk
histogram sdev
standard
deviation
histogram
root mean
square
full width
at haft max
last
fwhm
last
Horizontal difference between the maximum and minimum values.
Square-root of sum of squares of difference from mean, divided
by number of values - 1, computed on the distribution.
Square-root of sum of squares divided by number of values,
computed on the distribution.
The width of the distribution surrounding the mode including val-
ues which are at least 1/2 of the maximum bin population
Horizontal position of last (rightmost) cursor
3-27
Page 58

Waveform Display and Measurement
mean Horizontal centroid of the distribution.
median medi Horizontal median. Horizontal value of the midpoint of the
distribution.
mode mode Horizontal coordinate of the bin with maximum population.
total
population
max]hilum
population
totp Total population in the histogram.
(nmp) Maximum population in any histogram bin (i.e.vertical value at
the mode).
A graphic symbol may appear between the parameter name and
its value to Indicate additional information. The symbols and their
meanings appear on the next page:
3.28
Page 59

Waveform Display and Measurement
To obtain basic waveform parameter measurements:
INFORMATION
Parameter has been determined for several periods (up to 10000), and the aver-
age of those values is displayed.
/
V
®
m m
Parameter has been determined over an integral number of periods.
Parameter calculated on histogram
Parameter calculated on FFT waveform
Parameter does not apply to this waveform
m Insufficient data to determine a parameter.
.’?
<
>
U
Waveform contains undefined points, displayed value is suspect
Waveform cannot be classified as "pulse waveform", i.e., amplitude histogram is
fiat within statistical fluctuations. Minimum and maximum are used to assign base
and top.
Only an upper limit could be estimated (actual value of parameter may be smaller
than displayed value).
Only an lower limit could be estimated (actual value of parameter may be larger
than displayed value).
Signal is partially in overflow.
Signal is partially In underflow.
Signal is partially in overflow and partially In underflow.
WARNINGS
Figure 3.15: Waveform Parameter Interpretation
¯ Designate the trace to be measured as the Selected
Trace by pressing its TRACE key.
Turn on Cursor Measurements by pressing the CUR-
¯
SOR MEASUREMENTS key.
Select Basic Param measurements by repeatedly
¯
pressing the CURSOR MEASUREMENTS key until
Basic Param appears in the softkey label in the lower
left screen.
3.29
Page 60

Waveform Display and Measurement
¯ Use the outer and inner knobs (16 and 17) to position
the cursors around the trace’s section of interest.
Extended Parameters
In this measurement mode the 7200A calculates up to 20 userselected waveform parameters on a user-selected combination
of traces. This allows the same set of parameters to be calculated for several traces. Alternately, a different set of parameters
may be computed for each trace.
The trace used for calculation for each parameter is Indicated to
the left of the parameter name. For example, as shown in
Figure 3.16, "1"1 :rise" indicates that the rise time is computed on
Trace 1.
Use the Extended Parameter Setup Screen to select parameters
and to choose which trace(s) to measure. To display the Extended Parameter Setup screen, press the MODIFY key and
then the CURSOR MEASUREMENTS key (see Extended Paremeter Setup, p. 3-89). The Basic Parameter measurements
are a subset of those available for Extended Parameters.
All parameters are calculated only on the section of the trace be-
tween two cursors. If the trace is a sequence waveform, the parameters are calculated only on the first segment between the
cursors (i.e., the segment in which the leftmost cursor is lo-
cated). The cursors may be moved with the outer and inner
knobs under the center of the screen, as described on p.3-22.
3.30
Page 61

1 Jul-93
12:23:31
Record
Traces
Learn
Program
Waveform Display and Measurement
Turn On
XY Dtsp[oy
Turn On
Persistence
ConFzgure
System T3:meon~ -125.7 mV
Average
Paramebers T2:pkpk 536 mV T3:pkpk 536 mV
Turn OFF
Ext Pa~am
Tl:Fall< 430 ns T2:Fo£1<
T3:FoII ~ 380 ns TI:rzse < 790 ns
T2:rzse< 800 ns T3:rms ~ 299.8 mV
Tl:mean~ 160.3 mV T2:mean~ 174.8 mV
T3:Freq~ 366.964 Hz T4:Freq 361.730 Hz
Tl:Freq~24¢.1407 Hz T2:Freq~ 366,965 Hz
T3:edev~ 242.9 mV TA:sdev~ 265 mV
T2:sdev~ 243.5 mV Tl:sdev~ 475.6 mV
Select
Cursor
’ ~’ ? .... I
T4:meon~
I
Move~
800 ns
305 mV
.A Turn On
Multi Zoom
Figure 3.16: "Extended" Waveform Parameter measurements
being made on multiple traces
The parameters for each trace are recalculated each time the
trace is updated or the cursors are moved.
The positions of the cursors can be locked together for all traces
or independent on each trace. When the cursors are locked all
traces use the same cursor positions. Locked cursors are represented by vertical lines extending the full height of the trace grid
area.
When the cursors are unlocked each trace has its own inde-
pendent cursor positions. Unlocked cursors are represented by
short vertical marks which are displayed only on the Selected
Trace. Selecting a different trace causes the cursors for the new
trace to be displayed.
The cursors may be locked or unlocked by pressing the Lock/Un-
lock Cursors softkey in the Extended Parameter Setup screen
(accessed by pressing MODIFY and then CURSOR MEASURE-
MENTS). See Extended Parameter Setup, p.3-89.
3-31
Page 62

Waveform Display and Measurement
When Extended Parameters are enabled, the Average Parameters softkey appears. The parameter averaging feature trans-
forms the parameter display from instantaneous values to
average values.
When parameter averaging is off, the parameter values dis-
played are the instantaneous values for the currently displayed
waveform sweep.
When parameter averaging is on, the parameter values computed for each waveform sweep are averaged with the parameter values from the previous sweep according to the following
formula:
AVGPARAMsweep i= [19. AVGPARAMi-1 + NEWPARAMi]/20
The displayed values are thus a continuous or running average
of the values of successive acquisition sweeps.
To tum on parameter averaging, press the Average Parameters
softkey. Its label will change to Stop Average Parameters. To
turn off parameter averaging, press the Stop Average Parame-
ters softkey.
3-32
To obtain extended waveform parameter measurements:
¯Tum on Cursor Measurements by pressing the CUR-
SOR MEASUREMENTS key.
¯ Select Extended Parameter measurements by repeat-
edly pressing the CURSOR MEASUREMENTS key
until Ext Param appears in the softkey label in the
lower left screen. Use the Extended Parameter Setup
screen to select parameters and traces. See Ex-
tended Parameter Setup p. 3-89.
¯ Use the outer and inner knobs (16 and 17) to position
the cursors around the sections of Interest of the
traces being measured.
Page 63

Waveform Display and Measurement
Horizontal Relative
Measures the horizontal difference between two points on a
trace. It also gives the vertical difference between those points.
The points are indicated by the upward and downward pointing
arrows which are the Horizontal cursors. The horizontal difference is displayed under the lower left corner of the grid. For time
domain waveforms, the difference in time and its reciprocal are
displayed. For FFT, the difference is expressed as frequency.
The vertical difference is displayed under the trace label for each
trace on which the cursors are present.
NOTE: The sign of the measurements depends on
which cursor is to the left of the other. If the upward ar-
row is to the nght of the downward arrow, the resulting
time difference is indicated as a positive value.
More than one trace can be measured simultaneously if they
have the same horizontal units. The cursors are shown at the
same horizontal position relative to the trigger on each trace with
the same units. See Figure 3.17.
Reoord
Trooes
Leorn
Progrom A~
"~ I/(At
A -@. 1 1/¥
,,’~ ^,t_
A -2’90 mV
Turn On
XY Oisploy
Turn On
Persistence
ConFigure
System
Turn OFF
Horizonbol
k~
A [ A ~A A/~ A AAAA A A
II / .I.I I11 I/I rl/ti/l/
T I/~1 I /11/11, /I I//~11
v
~’v v ~
&~ -iO0.OMs
~ -lO.OOkHz .A Turn On
V VVVV V V V ~ V
Select
C~Jr@or
Move~
J~l
~--
Figure 3.17: Horizontal measurement on multiple
traces
Multi Zoom
J
3-33
Page 64

Waveform Display and Measurement
If all traces on the screen have the same horizontal units, when
the cursor(s) is moved to the edge of the screen it remains there.
Otherwise, the cursor(s) moves off the edge of one trace (or
group of traces) and onto the trace(s) with different units.
To use the Horizontal cursors:
¯Tum on Cursor Measurements by pressing the
CURSOR MEASUREMENTS key.
Select Horizontal cursors by repeatedly pressing the
¯
CURSOR MEASUREMENTS key until Horizontal
appears in the softkey label in the lower left screen.
Upward and the downward arrows appear, similar to
those shown in Figure 3.17.
Use the outer and inner knobs (16 and 17) to position
¯
the cursors on the trace(s).
Note: When a trace is expanded so that Individual data
points are highlighted and the cursor is positioned on an
acquired data point a serif will be attached to the cursor
perpendicular to the ends of the arrow shaft. If a cursor
is positioned between acquired data points, on interpolated data, there will be no serif on the end of the cur-
sors arrow shaft. See Figure 3.17.
Vertical Relative
3-34
In this mode the 7200A measures the vertical difference be-
tween two horizontal cursor lines on one grid. The vertical differ-
ence is displayed under the trace label for each trace on the
grid. See Figure 3.18.
NOTE: The sign of the measurements depends on
which cursor is above the other. If the "-- - -" cursor is
on top, the resulting difference is indicated as a positive
value.
If a measurement is not being made on a trace, its vertical and
horizontal scale factors are shown under its trace label.
Page 65
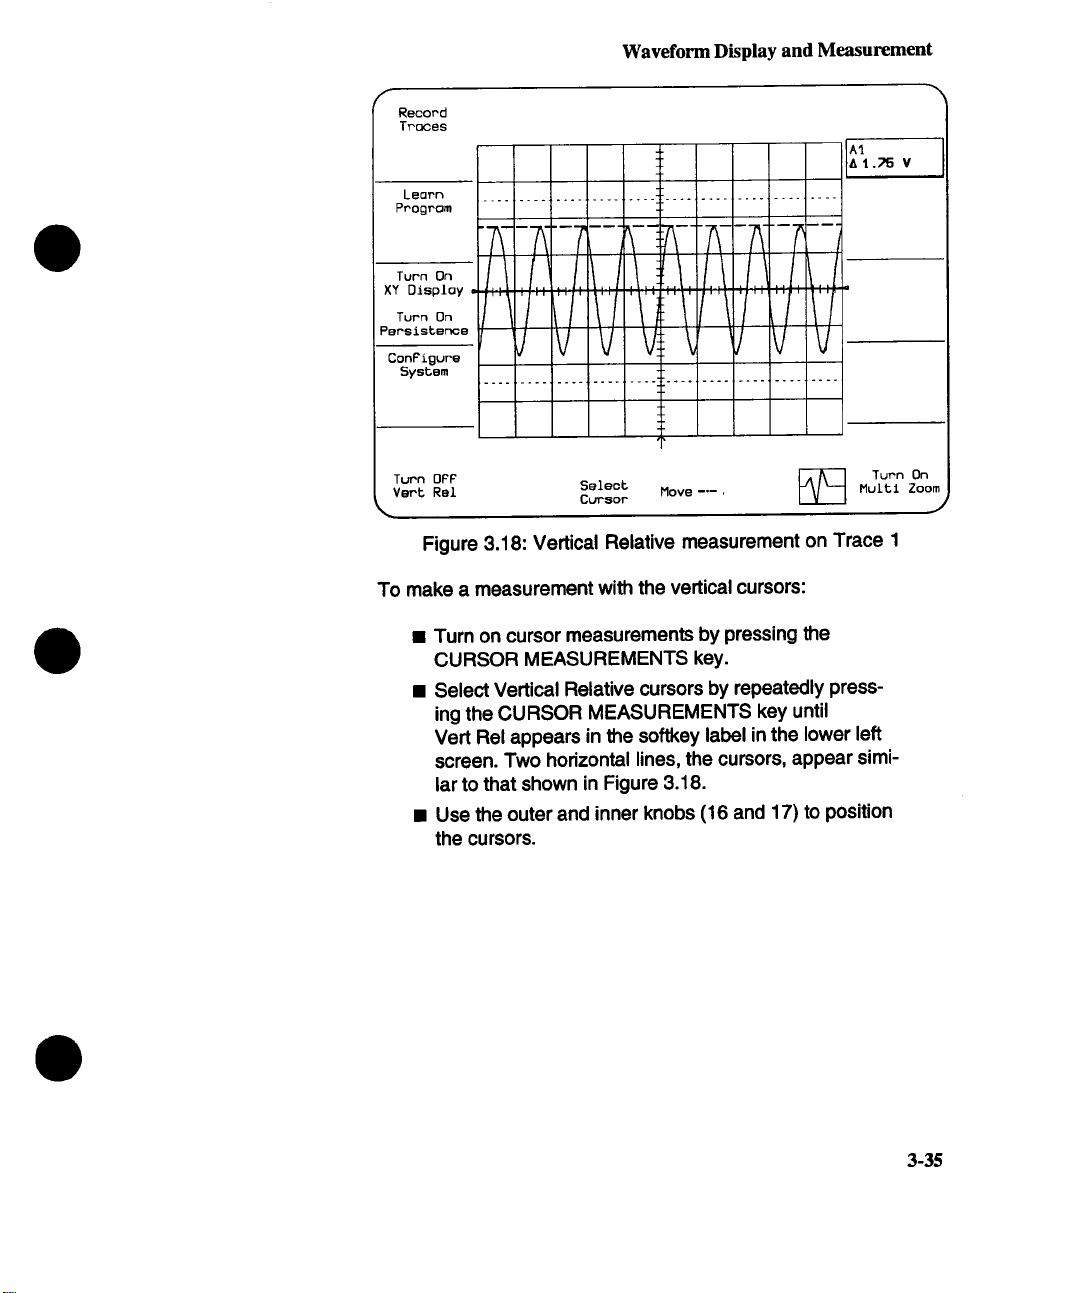
Record
Traces
Learn
Program
Turn On
XY Display
Turn On
Persistence
ConFigure
5ysbem
Waveform Display and Measurement
~--R--T--~--
L,/I.... / .... ~,/,
V
.............. 4
Turn OPP
Vent Rel
Select
Cursor
Move -’-.
Figure 3.18: Vertical Relative measurement on Trace 1
To make a measurement with the vertical cursors:
¯ Turn on cursor measurements by pressing the
CURSOR MEASUREMENTS key.
¯ Select Vertical Relative cursors by repeatedly press-
ing the CURSOR MEASUREMENTS key until
Vert Rel appears in the softkey label in the lower left
screen. Two horizontal lines, the cursors, appear similar to that shown in Figure 3.18.
¯ Use the outer and inner knobs (16 and 17) to position
the cursors.
Turn On
Multl Zoom
j
3-35
Page 66

Waveform Display and Measurement
Marker
In this mode the 7200A measures the absolute vertical value
and the horizontal position of a point on a traca(s). The vertical
measurement indicates the absolute amplitude of the trace at
the Marker (crosshair %"), and is displayed under the trace label
for each trace on which the marker is present.
The Marker’s horizontal position is expressed as the time between the trigger and the Marker. For FFT, the horizontal position is expressed as a frequency. It is shown under the lower left
comer of the grid. Both the vertical and horizontal measurements are correct regardless of trace expansion or position.
More than one trace can be measured simultaneously if they
have the same horizontal units. A Marker cursor appears at the
same horizontal position relative to the trigger on all traces. The
cursors will move simultaneously when the knob is rotated. See
Figure 3.19 on the next page.
If all traces on the screen have the same horizontal units, when
the cursor(s) is moved to the edge of the screen it remains there,
¯ To move the cursor(s) to a trace with different horizontal units,
continue to rotate the Move cursor knob until the cursor(s)
moves off the edge of one trace (or group of traces) and onto the
trace(s) with different units.
3-36
Page 67
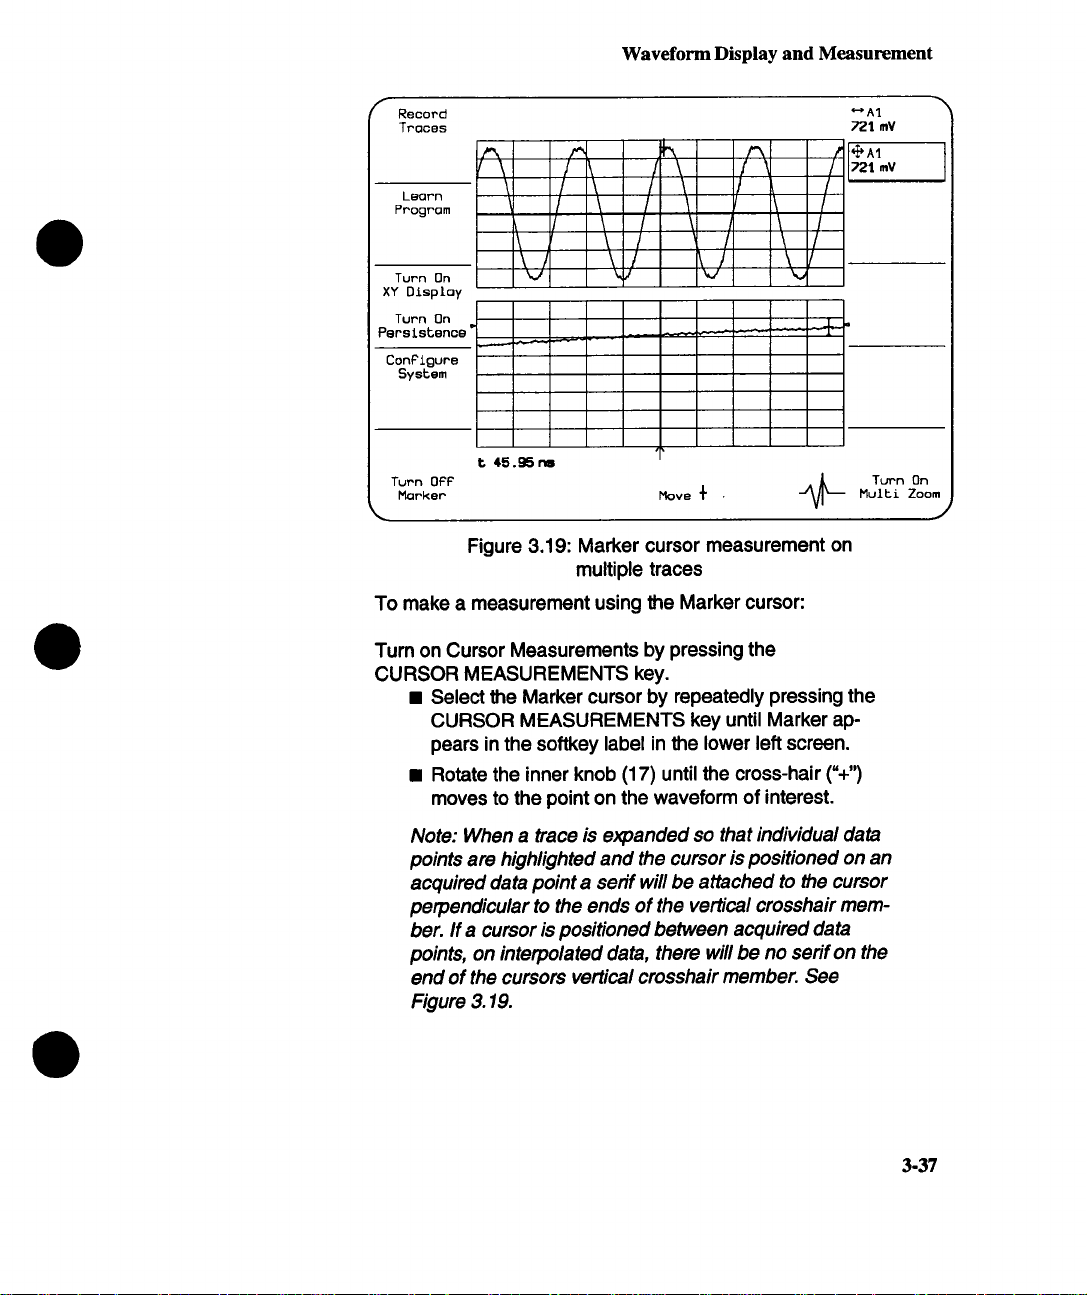
Record
Traces
Progrom
Waveform Display and Measurement
\ \
Turn On ~
XY Disploy
Turn On
PersistenQe’
ConFigure
System
Turn OFF
Morker Move +
t 45.~nI
k/ ~ ’~
Figure 3.19: Marker cursor measurement on
multiple traces
To make a measurement using the Marker cursor:
Tum on Cursor Measurements by pressing the
CURSOR MEASUREMENTS key.
¯ Select the Marker cursor by repeatedly pressing the
CURSOR MEASUREMENTS key until Marker appears in the softkey label in the lower left screen.
¯ Rotate the inner knob (17) until the cross-hair (%")
moves to the point on the waveform of interest.
I
-+-
Turn On
Multi Zoom
J
Note: When a trace is e)cpanded so that individual data
points are highlighted and the cursor is positioned on an
acquired data point a serif will be attached to the cursor
perpendicular to the ends of the ver~cal crosshair mem-
ber. If a cursor is positioned between acquired data
points, on interpolated data, there will be no senf on the
end of the cursors vertical crosshair member. See
Figure 3.19.
3-37
Page 68
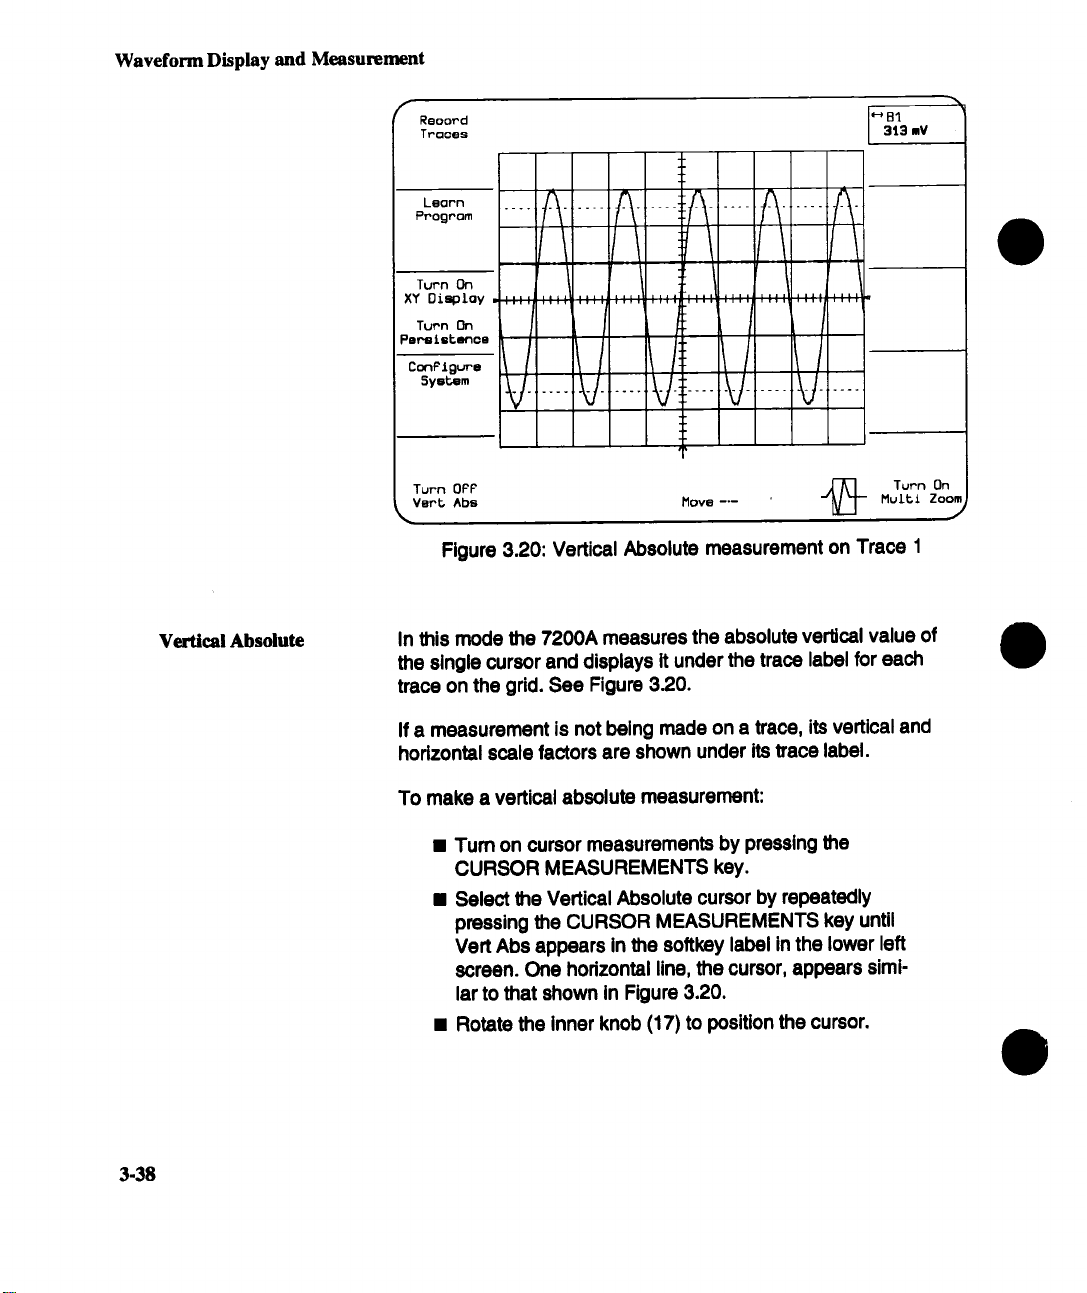
Waveform Display and Measurement
Vertical Absolute
f
Reoord
Troces
Leorn
Program
Turn On
XY Display .....
Turn On
Pe~letenoo
5yetem
Turn OPF
Vert Abe
~,
I
/
V"
Move --°-- ~_
,J ,,,,
i
I
,,,,
HB1
313 mV
Turn On
Multi Zoom
Figure 3.20: Vertical Absolute measurement on Trace 1
In this mode the 7200A measures the absolute ve~cal value of
the single cursor and displays it under the trace label for each
trace on the grid. See Figure 3.20.
J
3-38
If a measurement is not being made on a trace, its vertical and
horizontal scale factors are shown under its trace label.
To make a vertical absolute measurement:
¯ Turn on cursor measurements by pressing the
CURSOR MEASUREMENTS key.
¯ Select the Vertical Absolute cursor by repeatedly
pressing the CURSOR MEASUREMENTS key until
Vert Abs appears in the softkey label in the lower left
screen. One horizontal line, the cursor, appears simi-
lar to that shown in Figure 3.20.
¯ Rotate the inner knob (17) to position the cursor.
Page 69
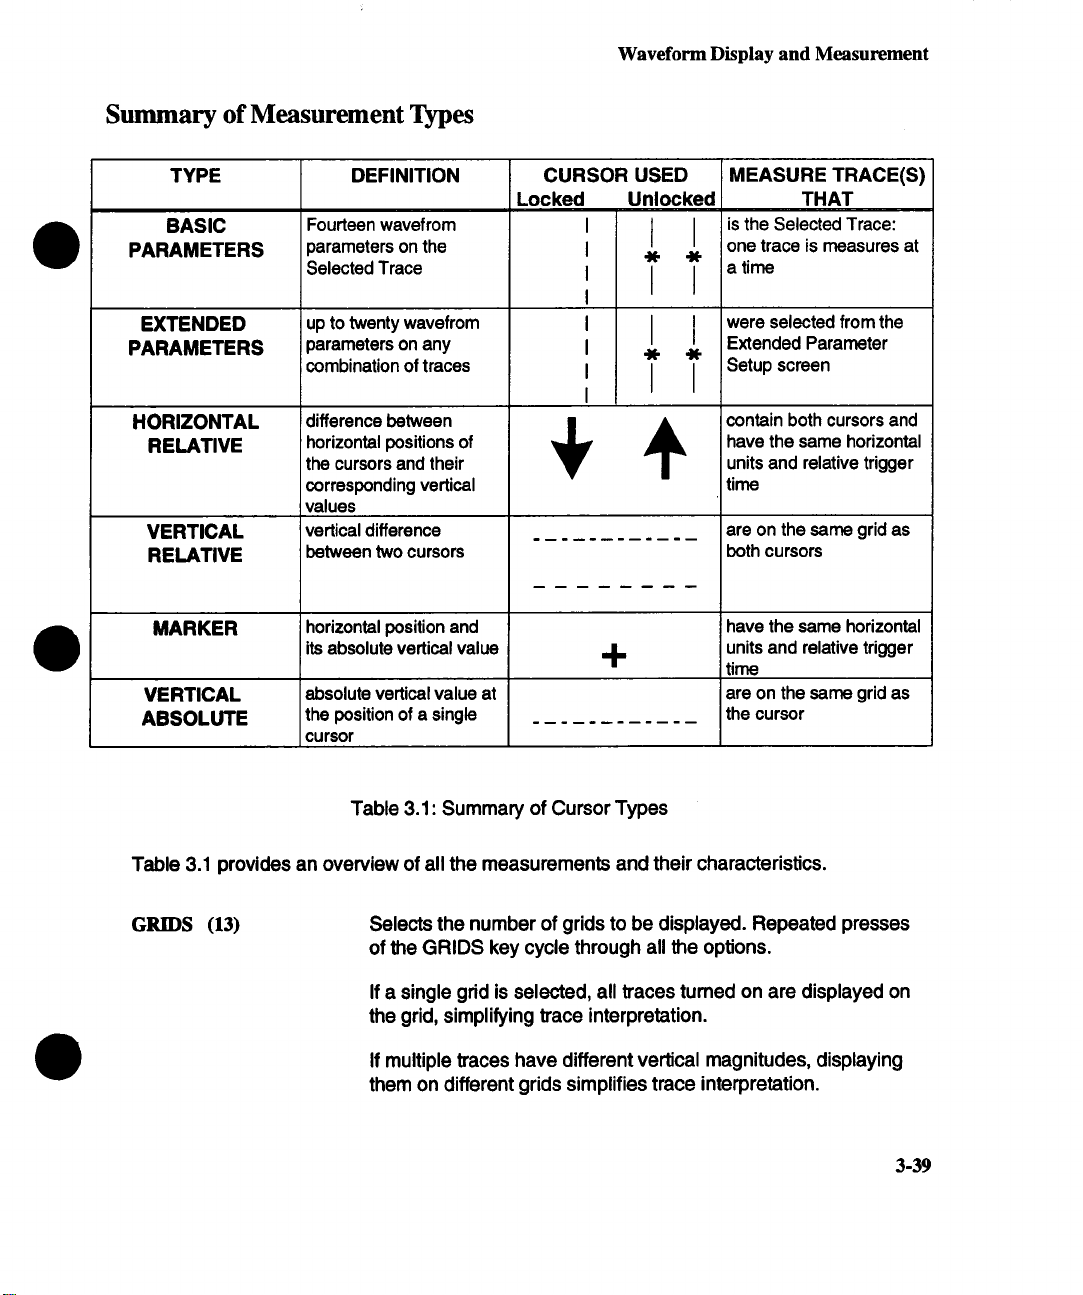
Summary of Measurement Types
TYPE DEFINITION CURSOR USED MEASURE TRACE(S)
BASIC
PARAMETERS
EXTENDED
PARAMETERS
HORIZONTAL
RELATIVE
VERTICAL
RELATIVE
Fourteen wavefrom
parameters on the
Selected Trace
up to twenty wavefrom I
parameters on any
combination of traces
difference between
horizontal positions of have the same horizontal
the cursors and their
corresponding vertical time
values
vertical difference are on the same grid as
between two cursors
Waveform Display and Measurement
Locked Unlocked THAT
I
I
I
I
I
I
I
I
4(- 4(-
I I
4(- 4(-
I
is the Selected Trace:
one trace is measures at
a time
were selected from the
I
Extended Parameter
Setup screen
contain both cursors and
units and relative trigger
both cursors
MARKER
VERTICAL
ABSOLUTE
Table 3.1 provides an overview of all the measurements and their characteristics.
GRIDS (13)
horizontal position and have the same horizontal
its absolute vertical value
absolute vertical value at
the position of a single the cursor
cursor
Table 3.1: Summary of Cursor Types
Selects the number of grids to be displayed. Repeated presses
of the GRIDS key cycle through all the options.
If a single grid is selected, all traces turned on are displayed on
the grid, simplifying trace interpretation.
If multiple traces have different vertical magnitudes, displaying
them on different grids simplifies trace interpretation.
-I-
units and relative trigger
time
are on the same grid as
3-39
Page 70

Waveform Display and Measurement
For full screen displays the choices are Single, Dual, Quad, and
Octal grids.
For half screen displays such as when a setup screen or wave-
form parameters are displayed, the choices are Single, Dual,
Quad grids.
The 7200A automatically maps the traces to the grids, placing
the lowest numbered trace which is displayed on the upper most
grid, the next trace on the next highest grid, until all selected
traces are allocated. When all grids are allocated the two traces
are mapped to each gdd starting at the upper most grid. This procedure repeats until all traces are mapped to grids.
Although traces are initially allocated to grids, they can be
moved onto other grids for comparisons using the Vertical Position continuous knob.
Turn On
XY Display (5)
Softkey(5) enables the X versus Y (XY) display mode which
lows the user to display one trace against another. The tech-
nique is normally used to compare the amplitude information of
two waveforms and can reveal phase and frequency information
through the analysis of patterns called Lissejous figures. The
softkey label will change to TURN OFF XY DISPLAY. Pressing
softkey(5) after its label has changed will cause the standard display to appear.
If Persistence is on when XY mode is enabled or If TURN ON
PERSISTENCE is pressed while the XY display is active, the X
vs Y plot is not cleared after each sweep to allow comparison of
successive acquisitions. The number of sweeps remembered
may be selected by pressing the MODIFY key followed by the
Tum On Persistence softkey to display the Persistence Setup
Screen (see p. 3-99)
With persistence enabled, the X vs Y display is only cleared
when a control, mainframe or plugin, which affects the display is
changed or when the CLEAR DISPLAY key is pressed.
The layout of the XY screen is shown in Figure 3.21. The square
grid in the top haft of the screen is used for the XY display while
the rectangular grid underneath simultaneously shows the origi-
3-40
Page 71
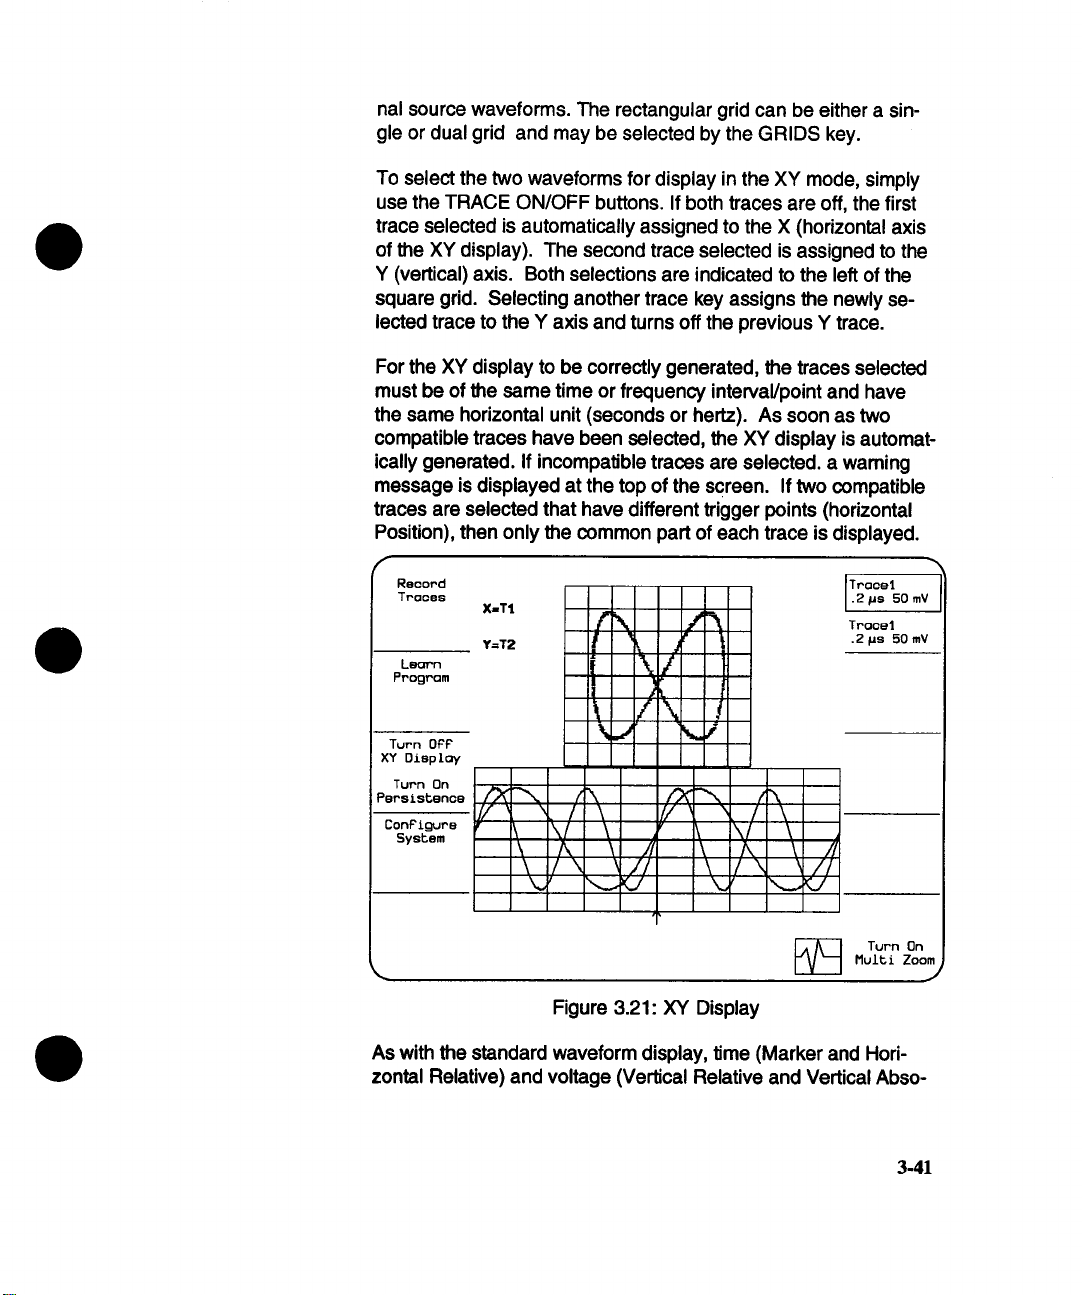
nal source waveforms. The rectangular grid can be either a single or dual grid and may be selected by the GRIDS key.
To select the two waveforms for display in the XY mode, simply
use the TRACE ON/OFF buttons. If both traces are off, the first
trace selected is automatically assigned to the X (horizontal axis
of the XY display). The second trace selected is assigned to the
Y (vertical) axis. Both selections are indicated to the left of the
square grid. Selecting another trace key assigns the newly se-
lected trace to the Y axis and turns off the previous Y trace.
For the XY display to be correctly generated, the traces selected
must be of the same time or frequency interval/point and have
the same horizontal unit (seconds or hertz). As soon as two
compatible traces have been selected, the XY display is automatically generated. If incompatible traces are selected, a waming
message is displayed at the top of the screen. If two compatible
traces are selected that have different trigger points (horizontal
Position), then only the common part of each trace is displayed.
Reoord
Truces
Program
Turn OPP
XY Oisploy
Turn On
Persistence
ConP£gure
System
X=T1
// ~ /
’
V \
\ /k \
\ /\ ~//
r\
\
\/
j
Ii
/L
V
\
\
\
/ \
\/
/k \ //
/ \ //
Truce1
.2/Js 50 mV
Truce1
.2 ~us 50 mV
L
Turn On
Multi Zoom
J
Figure 3.21: XY Display
As with the standard waveform display, time (Marker and Horizontal Relative) and voltage (Vertical Relative and Vertical Abso-
3-41
Page 72
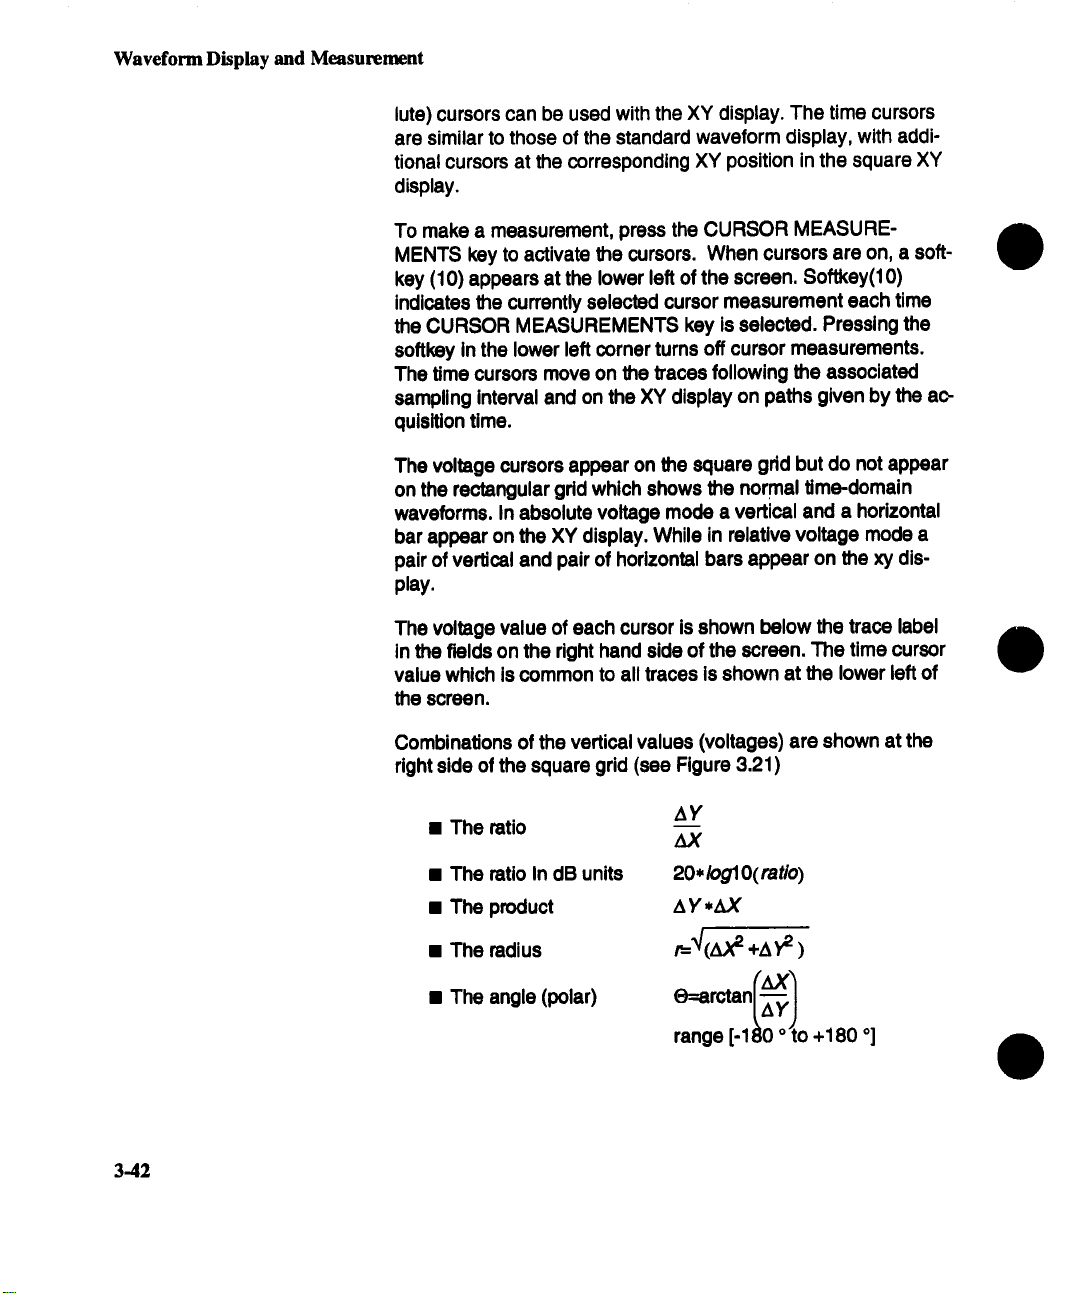
Waveform Display and Measurement
lute) cursors can be used with the XY display. The time cursors
are similar to those of the standard waveform display, with additional cursors at the corresponding XY position in the square XY
display.
To make a measurement, press the CURSOR MEASUREMENTS key to activate the cursors. When cursors are on, a softkey (10) appears at the lower left of the screen. Softkey(10)
indicates the currently selected cursor measurement each time
the CURSOR MEASUREMENTS key is selected. Pressing the
softkey in the lower left corner turns off cursor measurements.
The time cursors move on the traces following the associated
sampling Interval and on the XY display on paths given by the acquisition time.
The voltage cursors appear on the square grid but do not appear
on the rectangular grid which shows the normal time-domain
waveforms. In absolute voltage mode a vertical and a horizontal
bar appear on the XY display. While in relative voltage mode a
pair of vertical and pair of horizontal bars appear on the xy display.
The voltage value of each cursor is shown below the trace label
in the fields on the right hand side of the screen. The time cursor
value which is common to all traces is shown at the lower left of
the screen.
3-42
Combinations of the vertical values (voltages) are shown at the
right side of the square grid (see Figure 3,21)
¯ The ratio
¯ The ratio In dB units
¯ The product
¯ The radius
¯ The angle (polar)
AY
20*/og10(ratio)
AY,Z~("
+A,F )
O=arctan
range [.ll!ilo +180 o]
~
Page 73
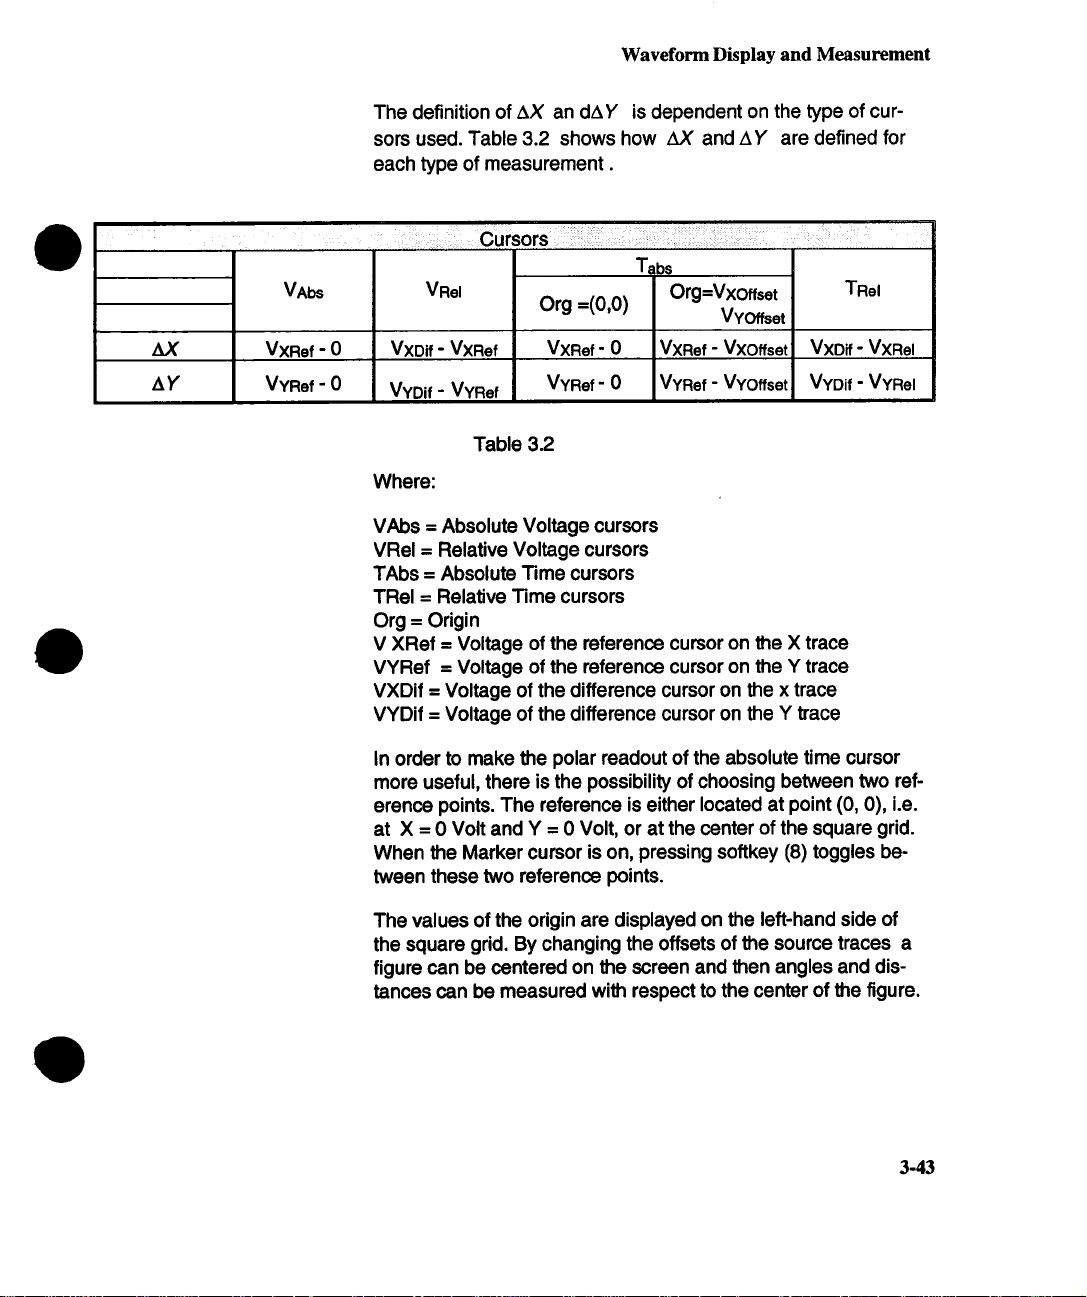
AY
The definition of AX an dAY is dependent on the type of cur-
sors used. Table 3.2 shows how zU( and AY are defined for
each type of measurement.
VAbs VRel
VXRef - 0
VYRef - 0
VXDif - VXRef
VYDif - VYRef
Where:
VAbs = Absolute Voltage cursors
VRel = Relative Voltage cursors
TAbs = Absolute Time cursors
TRel = Relative Time cursors
Org = Origin
V XRef = Voltage of the reference cursor on the X trace
VYRef = Voltage of the reference cursor on the Y trace
VXDif = Voltage of the difference cursor on the x trace
VYDif = Voltage of the difference cursor on the Y trace
Table 3.2
Waveform Display and Measurement
Tabs
Org =(o,o)
VXRef- 0 VXRef - Vxoffset VXDif - VXRel
Org=Vxoffset
VYOffset
VYRef - VYOffsetVYRef- 0 VYDif - VYRel
TRel
In order to make the polar readout of the absolute time cursor
more useful, there is the possibility of choosing between two ref-
erence points. The reference is either located at point (0, 0), i.e.
at X = 0 Volt and Y = 0 Volt, or at the center of the square grid.
When the Marker cursor is on, pressing softkey (8) toggles be-
tween these two reference points.
The values of the origin are displayed on the left-hand side of
the square grid. By changing the offsets of the source traces a
figure can be centered on the screen and then angles and dis-
tances can be measured with respect to the center of the figure.
3-43
Page 74

Waveform Display and Measurement
Persistence (6)
softkey
In this mode, the 7200A displays prior sweeps on the grid to allow comparison of successive acquisitions. To set the number of
sweeps remembered, display the Persistence Setup screen by
pressing the MODIFY key followed by the Turn On Persistence
softkey (see Persistence Setup screen p 3-99)
Reoord
Tr~ee
".#%
,% /~ D
*"* ^’t
.5~e .2 V
°
/
Learn
Program
1
/
~ /
1 ~ f
V
# oF sweeps = 1
\/
f 1, f
Clear
Dieploy
Turn On
Multl Zoom
Figure 3.22: Persistence
J
3.44
While in Persistence mode the number of sweeps currently contained in the persistence array will be displayed under the grid.
See Figure 3.22
The persistence display is cleared whenever a control, mainframe or plug-in which affects the display is changed or when
the =Clear Display" key is pressed.
As with the standard waveform display, time (Marker and Hori-
zontal Relative) and voltage (Vertical Relative and Vertical Absolute) cursors can be used with the persistence display grid.
Page 75

Waveform Display and Measurement
To make a measurement, press the CURSOR MEASURE-
MENTS key to activate the cursors. When cursors are on, a softkey (10) appears at the lower left of the screen. Softkey(10)
indicates the currently selected cursor measurement each time
the CURSOR MEASUREMENTS key is selected. Pressing the
softkey in the lower left corner turns off cursor measurements.
The voltage or time value of each cursor is shown below the
trace label in the fields on the right hand side of the screen.
3-45
Page 76

Waveform Display and Measurement
Waveform Storage
The 7200A has several options for storing trace waveforms:
¯ Trace waveforms can be stored on MS-DOS formatted 3.5" floppy diskettes.
These diskettes can be read by any MS-DOS compatible machine. Conversely,
waveform data previously stored on a diskette can be recalled, displayed, and
processed. (Floppy diskettes can be formatted on the 7200A in the Disk Utilities
screen. See page 3-118).
¯ The 7200A has 8 Internal non-volatile memories, M1 ...M8, available for Individual
waveform storage.
¯ In Record Traces mode, all displayed traces are automatically recorded in an
internal non-volatile variable size circular buffer each time they are updated with a
new acquisition. The recorded traces may subsequently be replayed, examined,
processed, or stored to floppy diskette. Note that the size of this buffer varies with
memory option but is at least 8 Mbytes (4 million data points).
¯ Any waveform display with its annotation can be preserved on hard copy with a
printer or color plotter. Alternatively, a tabular printout of the waveform data points
and acquisition Information can be produced.
¯ Trace waveforms can also be transferred remotely via GPIB or RS-232-C to an
external mass storage device. Refer to =Section 3: Waveform Transfer" in the
7200A Remote Programming Manual.
The internal memories M1 ... M8 and the Record Traces bu#er are
non-volatile, i.e., they maintain their contents when the power is off.
They may be cleared by pressing the Clear Memories softkey in the
Configure System Setup screen.
Record (1) Automatically records all displayed traces each time they are upTraces
3-46
dated with a new acquisition.The traces are saved in a circular
buffer.
To start the automatic record process, press the Record Traces
softkey In the 7200A’s Main Screen. The softkey’s label will
change to "Stop Record Traces" and the REC icon will be dis-
played at the bottom of the screen.
All traces which display or process acquisition data and which
are turned on are saved each time they are updated on the
screen. The traces are saved in groups. If the plug-in triggers
are locked together, all traces containing data from any plug-in
Page 77

Waveform Display and Measurement
are updated and recorded simultaneously for every acquisition. If
the plug-in triggers are independent, traces which contain data
from a plug-in are recorded as a group for each acquisition by
that plug-in.
Each trace group is time stamped as it is recorded. The times
are displayed when the traces are subsequently retrieved with
the Replay Traces softkey.
The trace groups are recorded in a circular buffer. The number
of trace groups which the buffer holds depends on the number of
traces per group and the number of data points per trace. After
the buffer is filled, the oldest traces are overwritten.
To stop the automatic record process, press the Stop Record
Traces softkey.
Replay (2)
Traces
Retrieves traces that Record Traces saved in the buffer. Re-
played traces can be examined, processed, or stored to floppy
diskette. The Replay Traces softkey is not present when the Re-
cord Traces buffer is empty.
To retrieve traces which have previously been recorded, press
the Replay Traces softkey in the 7200A’s Main Screen. The soft-
key’s label will change to =Stop Replay Traces" and the PLAY
icon will be displayed at the bottom of the screen.
If any history functions have been accumulating data (eg.: aver-
age, extrema [see History Functions, page 3-76]), the accumu-
lated data will be lost when Replay Traces is enabled. If a history
function has been defined and the Replay Traces softkey is
pressed, the following warning prompt will appear in the System
Message Area:
"HISTORY WILL BE LOST. CONTINUE? (PRESS YES OR NO)"
and the YES and NO softkeys will appear:
YES
NO
In Replay Traces mode, traces are retrieved in the same groups
in which they were originally recorded. When the 7200A re-
trieves a trace group, it places the trace waveforms in the corm-
Press YES to enter Replay Traces mode;
Press NO to cancel the operation.
3-47
Page 78

Waveform Display and Measurement
spending memories M1 ...M8. For example, if the 7200A retrieves a trace group containing traces 1 and 2, the trace 1 waveform is placed in memory M1 and the trace 2 waveform is placed
in memory M2, overwriting the previous contents of the memories.
In Replay Traces mode, the 7200A stops acquiring data and
switches from the acquisition set of trace equations to the replay
set of trace equations. (Each trace is defined by a mathematical
trace equation which specifies the soume(s) of data and optional
processing. See =Setting Up Traces and Processing Functions"
on page 3-56.) The default values of the replay trace equations
are TI=M1, T2=M2 .... T8=M8. Thus, by default, all replayed
trace wavefotms will be displayed in the same traces they origi-
nally came from. The replay trace equations may be modified in
the Trace Setup screens to perform processing on the replayed
waveforms in the memories. All operations which can be performed on the acquisition traces can be performed on the replay
traces, including waveform processing, vertical and horizontal expansion and reposition, cursor measurements, waveform pa-
rameters, and storage to floppy diskette.
The 7200A provides sequential access to the trace groups which
have been recorded. Softkeys are provided to step or scan backward and forward in the Record Traces buffer. On each step
backward or forward the 7200A retrieves the group of traces re-
corded earlier or later and places the waveforms in the corresponding memories M1 ...M8. It automatically tums on all traces
which display or process data from these memories and turns off
all other traces.
3.48
The time at which the trace group was originally recorded is displayed in the upper left corner of the screen along with the index
of the trace group In the Record Traces buffer. The most recently recorded group of traces has Index 0, the next older group
index -1, etc.
When Replay Traces mode is first turned on, the 7200A retrieves the most recently recorded trace group. The following
softkeys provide sequential access to the other recorded trace
groups:
Page 79

Waveform Display and Measurement
Step
Backward (3)
Step
Forward (4)
Switch To
Scan Mode (5)
Scan (3)
Backward
Scan (4)
Forward
Switch To (5)
Step Mode
Retrieves the group of traces which was recorded previous to
the current group. The Step Backward softkey is not present
when there are no older trace groups.
Retrieves the group of traces which was recorded after the current group. The Step Forward softkey is not present when there
are no newer trace groups.
Switches from Step mode to Scan mode. The softkey’s label will
change to "Switch To Step Mode" and the Step Backward and
Step Forward Softkeys will change to Scan Backward and Scan
Forward.
Starts scanning backwards in the Record Traces buffer. The
7200A will automatically retrieve, display, and process (if config-
ured in the replay trace equations) successively older trace
groups. The softkey’s label will change to "Stop Scanning".
Press it to stop scanning.
Starts scanning forward in the Record Traces buffer. The 7200A
will automatically retrieve, display, and process (if configured in
the replay trace equations) successively newer trace groups.
The softkey’s label will change to "Stop Scanning". Press it to
stop scanning.
Switches from Scan mode to Step mode. The softkey’s label will
change to "Switch To Scan Mode" and the Scan Backward and
Scan Forward softkeys will change to Step Backward and Step
Forward.
The replay trace equations may be modified to perform history
functions (eg.: average, extrema [see "History Functions" on
p.3-76) on the replayed waveforms in the memories. For example, to average together all recorded sweeps of trace 3, enable
Replay Traces and modify one of the trace equations to perform
AVGS(M3). Then step or scan to retrieve and average together
all recorded sweeps of trace 3. While stepping or scanning, if the
next trace to be retrieved was originally acquired with different
plug-in acquisition parameters (eg.: timebase, vertical gain), the
following warning prompt will appear in the System Message
Area:
3-49
Page 80
Waveform Display and Measurement
"CONTINUE AND RESET HISTORY? (PRESS YES OR NO)"
and the YES and NO softkeys will appear:
YES Press YES to continue to retrieve the next trace. The
NO Press NO to cancel the operation. If the 7200A was
To exit Replay Traces mode and resume data acquisition, press
the Stop Replay Traces softkey.
accumulated history data (eg., average so far) will
reset.
scanning, it will stop.
STORE (2.$)
RECALL (26)
Stores trace waveforms to floppy diskette or memories M1 ...M8.
The Waveform Storage Setup screen is used to configure the
specific storage operation to be performed. To display the setup
screen, press MODIFY and then STORE. See page 3-112 for a
description of the Waveform Storage Setup screen.
Recalls waveforms from floppy diskette to memodes MI...MS.
The Waveform Recall Setup screen is used to configure the specific recall operation to be performed. To display the setup
screen, press MODIFY and then RECALL. See page 3-115 for a
description of the Waveform Recall Setup screen.
3-50
Page 81
Programming
Panel Settings Storage
All front panel settings can be stored on the 7200A’s intemal disk or on MS-DOS formatted
3.5" floppy diskettes. Users can store and recall their own front panel settings in a few key
presses.
Panel settings are stored and recalled in the Panel Settings screen. To display the Panel
Settings screen, first press the Configure System softkey in the Main Screen. This displays a
screen which contains softkeys used to setup 7200A system operations. Then press the
Panel Settings softkey. See page 3-136 for a description of the Panel Settings screen.
Hardcopy
HARDCOPY (11)
Programming
Program (3)
SoRkey
Outputs a screen image, waveform listing (description of acquisition parameters and actual data points), or Program listing to se-
lected plotters and printers via the 7200A GPIB, Centronics, or
RS-232-C ports. The 7200A can also save the screen image on
floppy diskette.
Generating the copy does not affect scope operation. The
screen copy can be aborted while in progress by pressing the
HARDCOPY key again.
The Hardcopy Setup screen is used to specify the type of output,
the hardcopy device, the port to which it is connected, and user
specified annotations. To display Hardcopy Setup, press MOD-
IFY and then HARDCOPY. The Hardcopy Setup screen will display its selections. See Hardcopy Setup, page 3-103.
Enables the 7200A to leam a sequence of key presses and knob
changes. Once learned, the sequence, or program, can be executed repeatedly for automatic operation. The program can then
be stored and recalled to and from disk for later use. Alternately,
you can create programs with an editor, which can interact with
the operator or make decisions based on wavefrom parameters,
data values, control settings, etc. For more information refer to
Section 7 of the Remote Programmer’s Manual.
3-51
Page 82

Programming
The program can be examined, stored, and recalled in the
Program Setup screen, displayed by pressing MODIFY and then
the Program softkey. See page 3-139 for a description of the
Program Setup screen.
From the Main Screen, the Program learning process can be
started and stopped. Also, execution of the learned program can
be initiated and terminated.
The label appearing on the Main Screen for the Program softkey
Indicates the next possible Program action:
Initiates the leaming process. All key presses and
knob changes are remembered for later execution.
Stop Learn
Terminates the learning process.
Program
Initiates program execution. The program executes
to completion unless it is suspended, or an error
occurs.
Stop Run
Program
"ABORT PROGRAM? (PRESS YES OR NO)".
and the YES and NO softkeys will appear.
YES Pressing the YES softkey terminates the program
NO Pressing the NO softkey resurnes program execution.
Suspends execution. Pressing any other key or
adjusting any knob during execution will also
suspend the program. In either case, when the
program is suspended, a message will appear in
the upper screen:
and re-displays the Run softkey label.
3-$2
Page 83
Configure System
Using Setup Screens
Configure System
Softkey (7)
Displays a screen which contains softkeys used to setup 7200A
system operations. Use the System Configure screen to store
and recall panel settings, select trace and grid intensities, set
time and date, set the GPIB address, set RS-232-C port parameters, and select plug-in interdependencies. System Configure
also provides a default settings key, a system reset key, and a
screen which displays a log of system messages. It also presents a summary of all trace equations and of the contents of the
memories MI...M8.
Using Setup Sc cns
Setup screens use softkeys and selection fields to adjust control actions (see "Overview,"
pp. 3-1 and 3-7). The remainder of Section 3 explains how to use the 7200A’s setup
screens:
Setting up Traces and Processing Functions
Explains how to select which waveform data will be displayed in each trace and how to
perform waveform processing. See page 3-56.
Extended Parameter Setup
Explains how to select and display up to twenty different waveform parameters (selected
from over sixty) for any displayed trace(s). See page 3-89.
Persistence Setup
Explains how to set the number of sweeps remembered by the persistence display.
See page 3-99.
Multi Zoom Setup
Explains how to select the traces to be locked together and how to select whether horizontal,
vertical or both axis will be locked together. See page 3-101.
3-53
Page 84
Configure System
Hardcopy Setup
Explains how to output screen images, waveforms, and Program listings to plotters, graphics
and laser printers, and 3.5" floppy disk. See page 3-103.
Waveform Storage Setup
Explains how to store traces to memories and 3.5" floppy diskette. See page 3-112.
Display Options Setup
Explains how the operator can include additional annotation on to the traces and how they
are displayed. See page 3-125.
Waveform Recall Setup
Explains how to recall waveforms from 3.5" floppy diskette. See page 3-115.
Disk Utilities
(Accessed by pressing the Disk Utilities softkey from the Recall Setup, Store Setup, Panel
Settings, or Program Setup screens.) Explains how Disk Utilities screen softkeys and fields
are used to format floppy diskettes and to access and maintain files. See page 3-118.
Trace Annotation Setup
Explains how to annotate points of Interest on traces. See page 3-123.
Configure System
Provides access to Infrequently used screens. See page 3-127.
Panel Settings
Provides access to the Panel Settings screen which is used to store and recall panel
settings. See page 3-136.
3-$4
Page 85
Configure System
Acquisition Setup
Explains how to select various acquisition options. See page 3-133.
Display Setup
Explains how to select display intensities and colors. See page 3-128.
Program Setup
Explains how to configure the 7200A to learn a sequence of key presses and knob changes
for repeated automatic operation and how to store and recall programs. See page 3-139.
3-55
Page 86
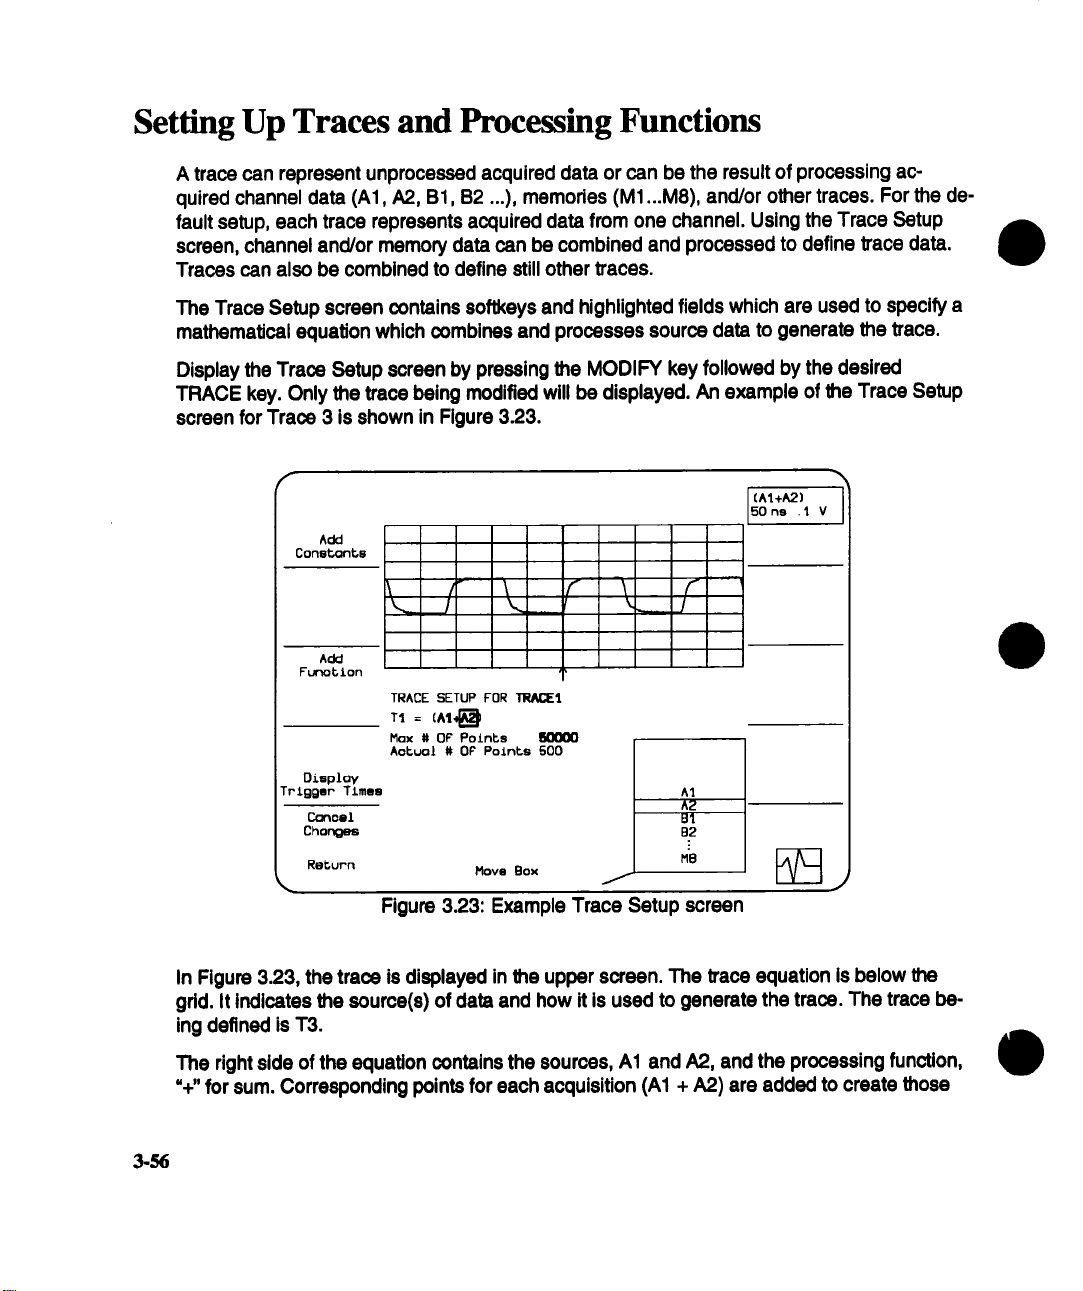
Setting Up Traces and Processing Functions
A trace can represent unprocessed acquired data or can be the result of processing acquired channel data (A1, A2, B1, B2 ...), memories (M1 ...M8), and/or other traces. For the
fault setup, each trace represents acquired data from one channel. Using the Trace Setup
screen, channel and/or memory data can be combined and processed to define trace data.
Traces can also be combined to define still other traces.
The Trace Setup screen contains softkeys and highlighted fields which are used to specify a
mathematical equation which combines and processes source data to generate the trace.
Display the Trace Setup screen by pressing the MODIFY key followed by the desired
TRACE key. Only the trace being modified will be displayed. An example of the Trace Setup
screen for Trace 3 is shown in Figure 3.23.
f
Const, ont, e
Add
(A1+A2)
50 ns .1 V
\ /- "\
/
Add
Funo~ion
TRACE SETUP FOR ]I~AOEI
TI = (AI~
Max # OF Potnts lk3000
OiBploy Aotuoi # OF Points 500
Trigger Times al
Conoel B1
Chonges
Re~urn
Move Box
/
A2
B2
M8
Figure 3.23: Example Trace Setup screen
In Figure 3.23, the trace is displayed in the upper screen. The trace equation is below the
gdd. It indicates the source(s) of data and how it is used to generate the trace. The trace be-
ing defined is T3.
The right side of the equation contains the sources, A1 and A2, and the processing function,
%" for sum. Corresponding points for each acquisition (A1 + A2) are added to create those
3-56
Page 87

Setting Up Traces and Processing Functions
in T3. The Max # Of Points field indicates an upper limit on the number of points that will be
added to generate T3. The Actual # of Points field indicates the actual number of points in
the waveform.
The softkeys to the left of the screen select processing functions, the trace label, constants,
and units.
The Move Box outer knob (17) is used to select a field for modification. The options list in the
lower fight screen indicates available choices with the current choice in the center. To
change the selection, rotate the Modify Value inner knob (16) to move the desired choice
the center of the lisL The new choice will also replace the previous selection in the box.
As you modify the trace equation, the displayed trace will be continually updated to reflect
the selected processing. Press the Return softkey to save the edited trace setup and return
to the Main Screen. The Cancel Changes softkey cancels all changes, restores the original
trace setup, and displays the Main Screen.
Changing the Trace Equation
The trace equation is a mathematical equation defining the trace. It contains sources and
functions which operate on those sources. In addition, multiplicative constants, additive con-
stants, and units may be associated with each source.
The source data for the trace comes from acquisition channels, memories, or other traces.
Any channel present in the system and any memory (M1 ...M8) can be used as a source for
any trace. To avoid circular definitions, a given trace can use only lower numbered traces as
sources. The 7200A automatically determines which channels or traces can be used as
sources and displays them in the options list for a source. In Figure 3.23, the options for
sources for Trace 3 are A1, A2, T1, T2, M1, M2, M3, M4, M5, M6, M7, M8.
To change a source, move the box onto it and rotate the Modify Value inner knob to select a
different source. The new source will appear in the trace equation and in the center of the options list.
The 7200A performs both unary waveform functions, which operate on one source, and bi-
nary functions which operate on two sources. An equation may contain up to two waveform
functions. Only one of the following functions may be used per equation: AVGC, AVGS,
EXTREMA, AVGMAG, AVGPWD, AVGPWS, FFTIM, FFTMAG, FFTPHA, FFTPWD,
FFTPWS, FFTRE, FFTRI, HIST, TREND, TOFAN, TOFPC, WINHIST
To change a function, move the box onto it. The options list will display the available func-
tions. Rotate the Modify Value knob to select the desired function. The new function will re-
place the previous one in the trace equation. See pages 367 to 3-70 for descriptions of the
available waveform functions. The Add Function softkey, described below, adds a waveform
function to the equation. The Delete Function softkey deletes the function in the box.
3-57
Page 88
Setting Up Traces and Processing Funclions
The default equation for each trace contains a single source, a channel. Further sources are
added in conjunction with binary waveform functions. When a binary function is added, the
7200A automatically adds a second source, with an initial default value. The second source
can be changed by moving the box onto it and rotating the Modify Value knob to select a different value. When a binary processing function is deleted or changed to a unary function,
the 7200A deletes its righthand source.
Note: The 7200A has two distinct sets of trace equations. When in
Replay Traces mode, the 7200A stops acquiring data and switches
from the acquisition set to the replay set of trace equations. The only
difference between the equations is that acquisition channels are not
available to be sources in replay trace equations. See "Replay Traces,"
page 3.47.
Add Function To add a mathematical operation to a trace equation, press the
Add Function softkey while the box is on the equation. A new
math symbol will appear in the equation, and the box will move
onto the symbol. Use the Modify Value knob to select the desired function.
For example, in the trace equation:
3-58
T1 =~B~
Pressing Add Function with the box on the source B2 results in:
T1 --~BS-](B2) (Equation
with the box on ABS (the symbol indicating absolute value),
which is the default chosen by the 7200A.
If you add a binary waveform function, a math symbol followed
by a second source is added to the right of the box. For exam-
ple, if you change ABS to %" by rotating the Modify Value knob,
Equation 2 becomes
T1 = (B2~A1)
and the box moves to the binary waveform operator, %". For
Equation 3, A1 is the default chosen by the 7200A for the second source.
Rotating the Move Box knob and Modify Value knobs to change
the rightmost A1 to another source, A2, results in
T1 -- (B2 +1-~---]) (Equation
(Equation 1)
(Equation 3)
Page 89

Setting Up Traces and Processing Functions
When you press the Add Function softkey, the 7200A adds a
waveform function which operates on the element of the equation which is in the box. The element may be either a source or a
previously added function. For example, in Equation 4, pressing
Add Function with the box on A2 results in
T1 = (B2 +r~S~(A2))
Changing the ABS to "--" would result in
T1 = (B2 + (A2 [~ A1))
The 7200A added the binary operator "--" and a default source
A1 to the right of A2.
Starting from Equation 4 again, moving the box onto %" and
then pressing Add Function results in
T1 =r~-k B2 + A2). (Equation
The 7200A has added a function which operates on the result of
the %". Changing ABS to =-’ would result in
T1 = ((B2 + A2) [] A1 ) (Equation
]Delete Fuaction To delete a waveform function, move the box onto the function
to be deleted and press the Delete Function softkey.
Deleting a function is the reverse of adding a function. For binary
waveform functions, the source to the right of the deleted function is also removed.
Although the deleted function (and righthand source) are re-
moved from the trace equation, they are temporarily saved while
the setup screen is displayed. The next time the Add Function
softkey is pressed, they are the default function and source
added by the 7200A.
(Equation 5)
(Equation 6)
This mechanism allows you to retrieve a function you may have
accidentally deleted, or to move an operation and source from
one part of the equation to another. For example, moving the
box in Equation 8 to the rightmost =--’ and pressing Delete Func-
tion causes "-A1" to be deleted:
T1 = (B2~]A2)
(Equation 9)
3-59
Page 90

Setting Up Traces and Processing Functions
Moving the box left onto "B2" and pressing Add Function results
In:
T1 = ((B2 [~ A1 ) + A2) (Equation
Max # Of Points
Actual # Of Points
Add Constants
Waveform processing may require appreciable execution time.
To reduce this time, reduce the number of points to process for
the trace by selecting a smaller value for this field.
NOTE: This is only an upper l/m# on the number of points
to process. The actual number of points in the trace will
be less than this value if the source(s) of the trace has
fewer points. If the source(s) has more points, the 7200A
will reduce the number of points used by decimating, or
using every nth point.
Indicates the actual number of points in the trace. This number
will vary based on panel settings such as tirnebase, horizontal
expansion, and processing function. It ranges from 20 points to
the maximum record length, but no greater than the Max # Of
Points.
Enables selection of multiplicative constants with units and addi-
tive constants. One multiplicative constant with units and one addrive constant are associated with each source. Since a trace
equation may include three sources, three pairs of constants
may be specified. Different Greek letters are assigned to each of
the six constants.
Both Multiplicative and Additive Constants are then divided into
two Independent fields. The fields, mantissa and exponent are independently set.
3-6O
To change the constants for a source, move the box onto the
source and press the Add Constants softkey. Additional fields appear as shown in Figure 3.24.
Page 91
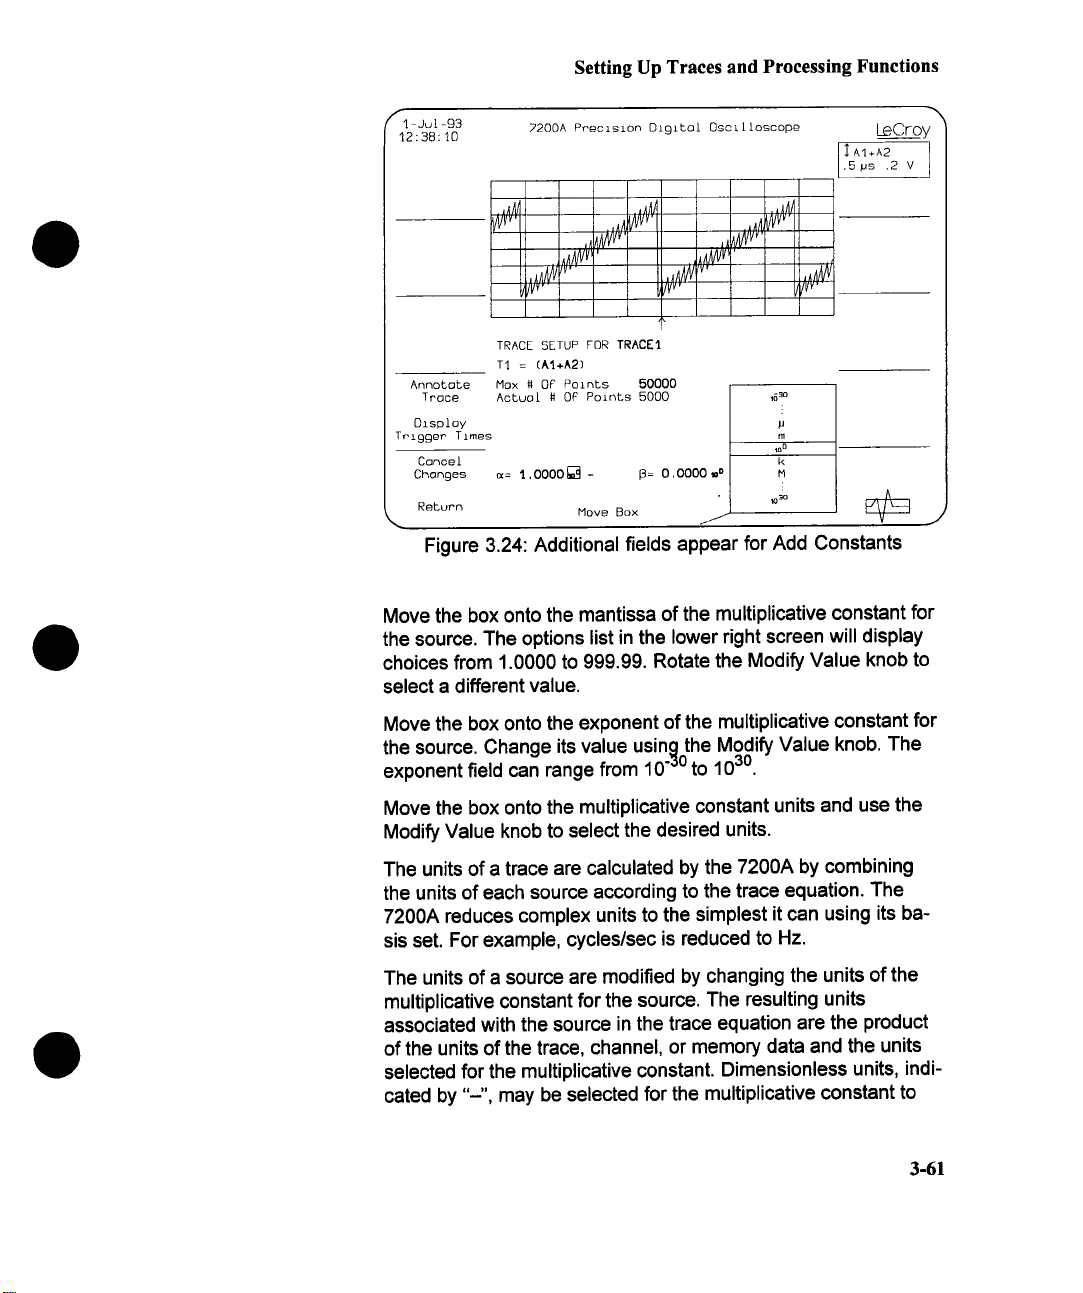
Setting Up Traces and Processing Functions
fl Ju[-93
12: 98:10
Annotate Max # 0£ Points 50000
Trace
Display p
Trigger Times
Cancel k
ChongeSReturn
7200A Precision Digital Oscilloscope
~/Vv’
TRACE SETUP FOR TRACEI
TI = (At+A2)
Actua[# O~ Points 5000
°
~= 1.0000~ -
~: O.O000__w
Move Box
LeCroy
AI+A2
.5 ps .2 V
,630
m
o
m
~3oM!
/
Figure 3.24: Additional fields appear for Add Constants
Move the box onto the mantissa of the multiplicative constant for
the source. The options list in the lower right screen will display
choices from 1.0000 to 999.99. Rotate the Modify Value knob to
select a different value.
Move the box onto the exponent of the multiplicative constant for
the source. Change its value using the Modify Value knob. The
exponent field can range from 10
"3°
to 1030.
Move the box onto the multiplicative constant units and use the
Modify Value knob to select the desired units.
The units of a trace are calculated by the 7200A by combining
the units of each source according to the trace equation. The
7200A reduces complex units to the simplest it can using its basis set. For example, cycles/sec is reduced to Hz.
The units of a source are modified by changing the units of the
multiplicative constant for the source. The resulting units
associated with the source in the trace equation are the product
of the units of the trace, channel, or memory data and the units
selected for the multiplicative constant. Dimensionless units, indicated by "-", may be selected for the multiplicative constant to
3-61
Page 92

Setting Up Traces and Processing Functions
preserve the units of the source waveform data.
The units end their definitions are:
% percentage
dB decibels
dBM
dBV
decade decade
octave octave
ppm part per million
# events
m meters
K degree Kelvin
o
A
Hz Hertz
s seconds
C Coulombs
F Farads
MHO 1/ohms
V Volts
W Watts
H Henrys
WB Webers
N Newtons
J Joules
POISE Poise
g
1Is
1/H 1/Henrys
PAL Pascal
L liter
T
DIV Division
dimensionless
decibel milliwatt
decibel Volts
degree
amps
ohm
grams
l/seconds
Tesla
3-62
More complex combinations can be entered remotely or from
ICL. For Instance, the program =UNITS", which is distributed on
the hard disk, lets the operator enter a unit sb’ing of up to 40
characters. The entered unit is automatically multiplied by the default units of Volts, thus, entering:
Page 93

Setting Up Traces and Processing Functions
Reset Value
PAIN
S3*NM2
(W/s)*V
W/sV Watt/second Volt will appear as VA/s
g*m/s2/V Grams X meters/seconds2Nolt is converted
NOTE: Channel data always has units of Volts. You can
modify the units associated with an acquisition channel in
a trace equation by selecting the appropriate multiplica-
tive constant units.
Move the box onto the additive constant field and change its
value with the Modify Value knob. The additive constant mantissa value can range from -999.99 to 999.99.
Move the box onto the additive constant exponent field. Change
its value using the Modi~ Value knob. The exponent field can
range from 10
While constants are being edited, the Reset Value softkey is dis-
played. If the box is on the multiplicative constant mantissa,
pressing Reset Value sets the value to 1. If the box is on the multiplicative constant exponent, pressing Reset Value sets the
value to 10o. When the box is on the additive constant mantissa,
pressing Reset Value sets the value to 0. If the box is on additive
°.
constant exponent, pressing Reset Value sets the value to 10
If the box is on units, pressing Reset Value sets the units to =--"
to indicate dimensionless units.
"3°
to 103°.
Converts acquired units to PALs
(pressure)
Seconds3 X Amps/meter2 will display
everything in g (grams)
Watts/seconds X Volts will display as V3 Ns
to Newtons
Delete Constants
When any of the constants have changed from their reset val-
ues, the trace equation will change to display the current equation.
ff any of the variable fields have changed, the trace equation will show the both the additive and multiplicative variables as greek letters.
If the Add Constants softkey is pushed then it is re-labeled as
Delete Constants. Pressing the Delete Constants softkey will re-
move the constants from that source and save it in memory.
3-63
Page 94

Setting Up Traces and Processing Functions
After a constant is deleteted the softkey is again labeled
Add Constants.
To transfer a constant from one source to another source, move the box over the source to
be moved and press Delete Constants. Next move the box over the source to receive the
constant. Press Add Constants. The constant is now transferred to the new source.
Insert
ChorooteP
Delete
Character
DeFault
Text
Display
Trigger Times
Canoel
Changes
Return
TRACE SETUP FOR 5ENSJ]
TI = AI
Max # OF Points 50000
Aotuol # OF Points 20000
Move
^
1
2
3
g
Figure 3.25: Edting the Trace Label
Trace Setup For
3-64
Once the desired changes are made, press the Return softkey to
save the selections and continue editing other parts of the equation. If the changes are not desired, press the Cancel Changes
softkey to restore the original selections and to continue editing
the equation. To simplify the equation, the multlplicative constant, additive constant, and units will not be displayed if the values are 1.0, 0.0, and "-’ respectively.
Associated with each trace is a label used for screen annotation
and disk storage. The default labels are 5"RACE1", "rRACE2",
etc.
To edit the trace label, move the box onto the Trace Setup For
field. The Edit Text softkey will appear in the upper left screen.
When it is pressed the Insert Character, Delete Character, and
Page 95

Setting Up Traces and Processing Functions
Default Label softkeys will appear, and the box will move on
individual characters in the trace label. See Figure 3.25.
Insert Press the Insert Character softkey once for each
Character character to be inserted. Each new character will
match the character displayed in the box and will
be displayed to the right of the box. After adding
a character(s), use the Modify Value continuous
knob to change the character as desired.
Delete Press the Delete Character softkey for each
Character character to be deleted.
Default Press the Default Text softkey to change the
Text trace label back to the default ("TRACE1 ",
’~RACE2", etc.).
Once the desired changes are made, press the Return softkey to
save the edited trace label and continue editing other parts of
the equation. If the changes are not desired, press the Cancel
Changes softkey to retain the original trace label.
NOTE: If the trace label is equal to the default
("I’RACE I ", "TRACE2", etc.), an abbreviated form of the
trace equation will be displayed next to the trace key. ff
the label has been changed so that it is not equal to the
default, the label will be displayed next to the trace key.
Annotate Trace
Display Trigger Times
This softkey displays the Trace Annotation Setup Screen which
allows the operator to annotate up to 10 different points of inter-
est on each trace. See page 3-123.
The Display Trigger Times softkey will display the time(s)
which the trigger(s) occurred or the acquisition duration.
For Sequence trigger mode, the first and last trigger times (or Duration) are displayed along with the triggers time for each seg-
ment. When there are more segment trig times than can fit on
the screen, the Next Line continuous knob will allow scrolling up
and down the list of trig times.
The Show Absolute/Relative Times softkey will switch between
the display of trig times from the time at which trigger occurred
(Absolute) and the time from first trigger (Relative). The Return
softkey when pressed will exit the trig times screen and return to
the Trace Setup screen.
3-65
Page 96
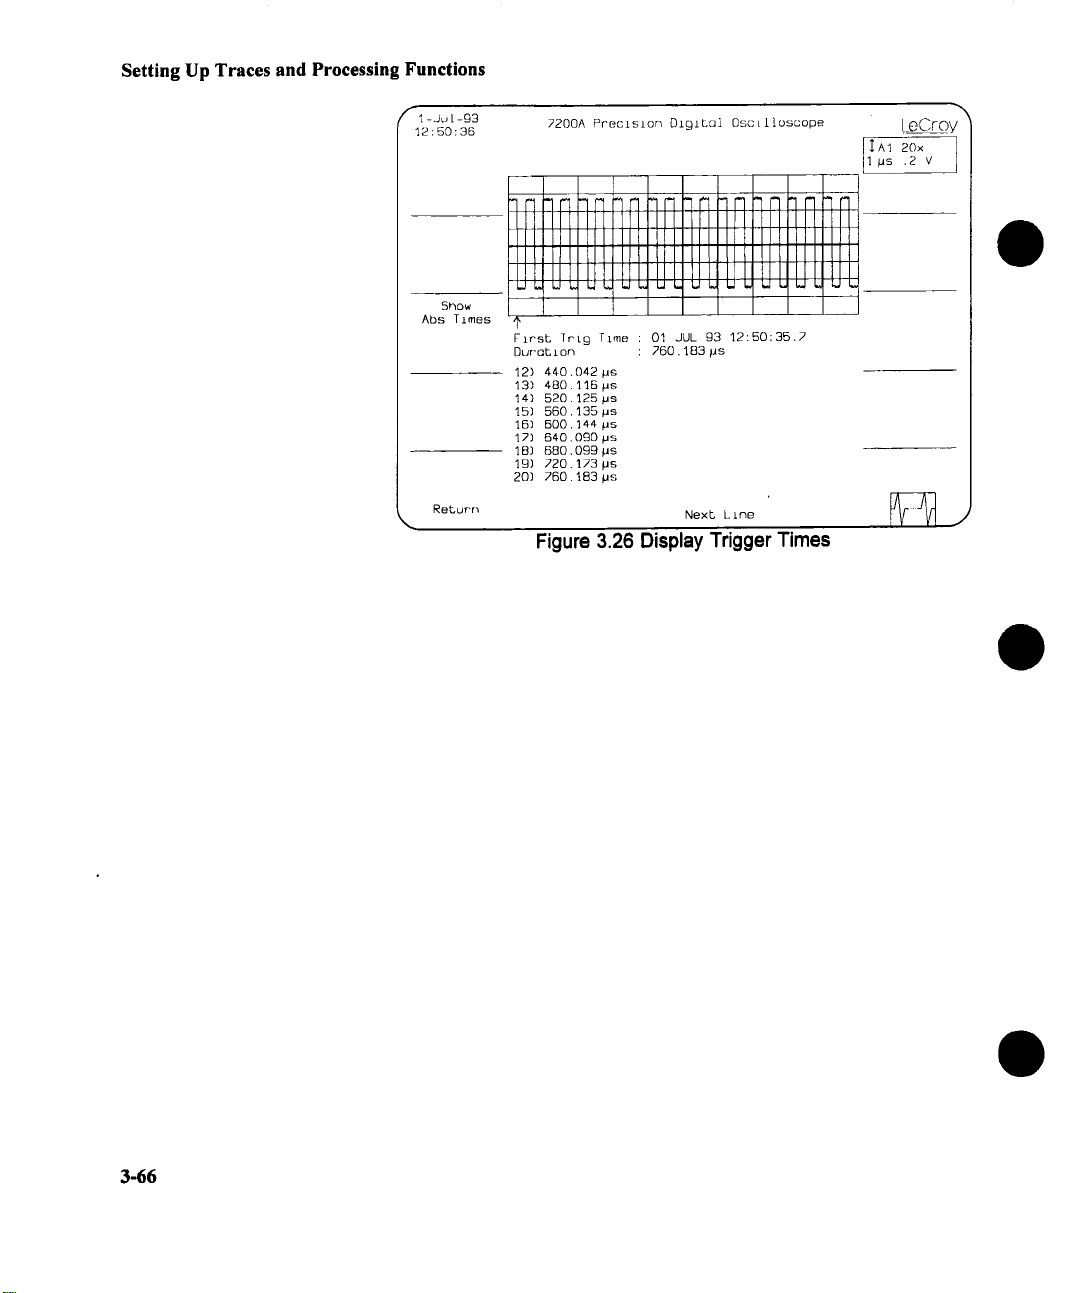
Setting Up Traces and Processing Functions
r
1 - Ju [ -g3
12:50:36
2200A Precision OigiLoi OscLt[oscope
l eCroy
~A1 20x
1 ps .2 V
x.
5how
Abs Times
Return
HHHH
HHIIIIIIIll
llll]llllllItllllllllltlllfllllllltl
ILIIIIIIIIIIIIIIIIIIILILI{IlltlIIIIIItl
FlreL ]rig Time : 01 JUL g3 12:50:35.7
Duration : 760,183#s
12) 440.042 #s
13) 480. 115 #s
14) 520. 125 ps
15) 560. 135 pe
15) 500. 144 pe
12) 640.090 ps
1B) 680,09g ps
lg) 720.173 ps
20) 260.183 ps
Next Line
Figure 3.26 Display Trigger Times
3-66
Page 97
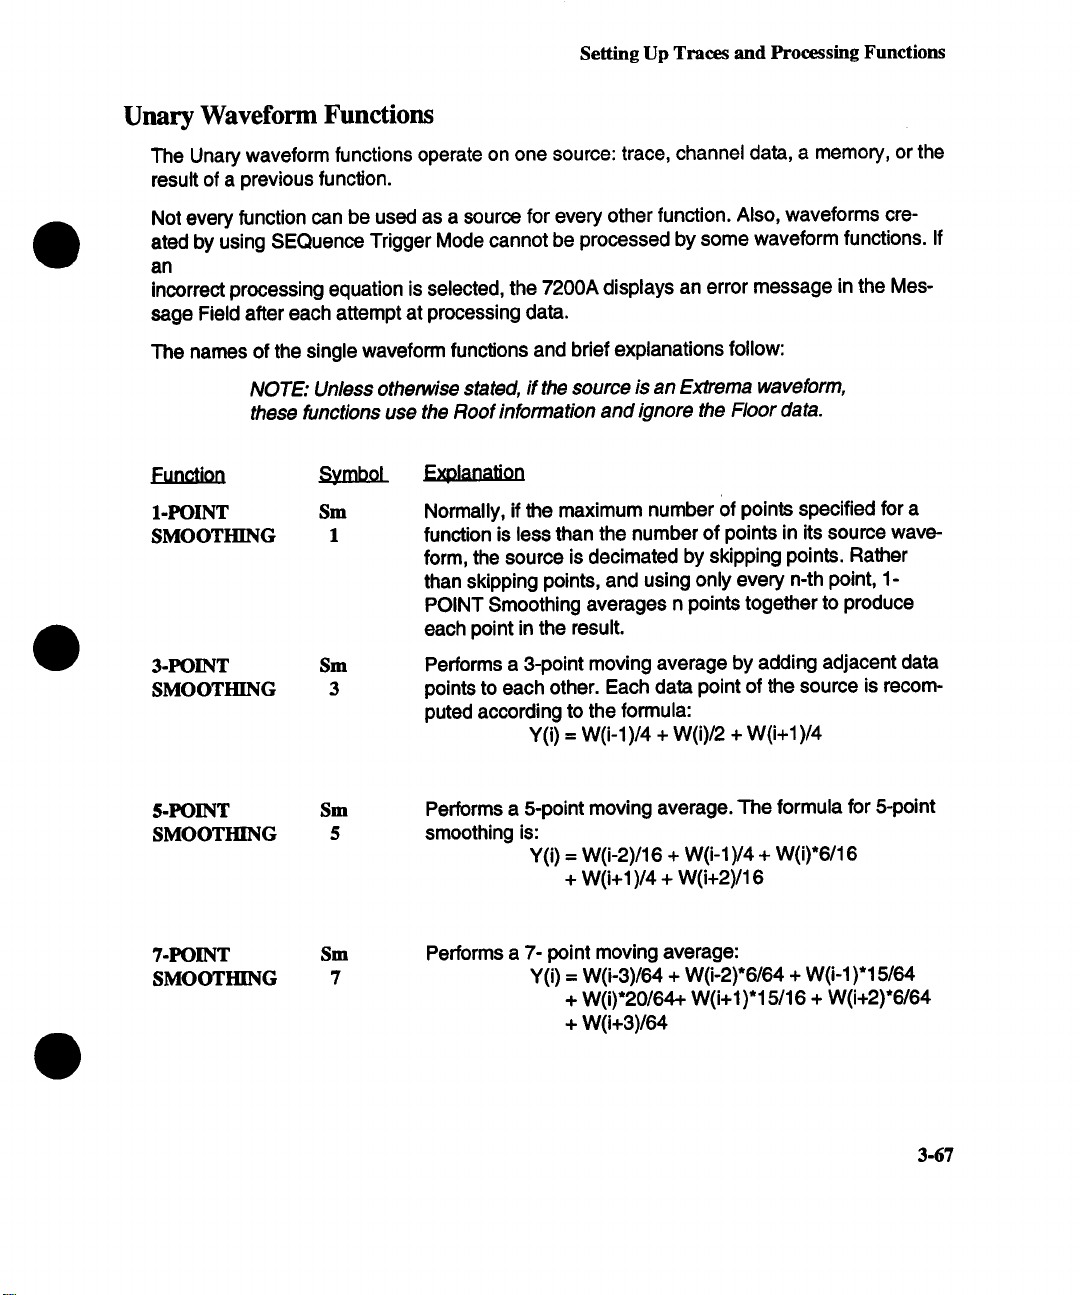
Setting Up Traces and Processing Functions
Unary Waveform Functions
The Unary waveform functions operate on one source: trace, channel data, a memory, or the
result of a previous function.
Not every function can be used as a source for every other function. Also, waveforms created by using SEQuence Trigger Mode cannot be processed by some waveform functions. If
an
incorrect processing equation is selected, the 7200A displays an error message in the Message Field after each attempt at processing data.
The names of the single waveform functions and brief explanations follow:
NOTE: Unless otherwise stated, if the source is an Extrema waveforrn,
these functions use the Roof information and ignore the Floor data.
Function
1 -POINT Sm
SMOOTHING
3-POINT Sm
SMOOTHING
S-POINT Sm
SMOOTHING
7-POINT Sm
SMOOTHING 7
1
3
5
Eamaattoa
Normally, if the maximum number Of points specified for a
function is less than the number of points in its source waveform, the source is decimated by skipping points. Rather
than skipping points, and using only every n-th point, 1POINT Smoothing averages n points together to produce
each point in the result.
Performs a 3-point moving average by adding adjacent data
points to each other. Each data point of the source is recomputed according to the formula:
Y(i) = W(i-1)/4 + W(i)/2 + W(i+1)/4
Performs a 5-point moving average. The formula for 5-point
smoothing is:
Y(i)= W(i-2)/16 + W(i-1)/4 + W(i)’6/16
+ W(i+l )/4 + W(i+2)/16
Performs a 7- point moving average:
Y(i) = W(i-3)/64 + W(i-2)’6/64 + W(i-1)’15/64
+ W(i)’20/64+ W(i+l)*l 5/16 + W(i+2)’6/64
+ W(i+3)/64
3-67
Page 98
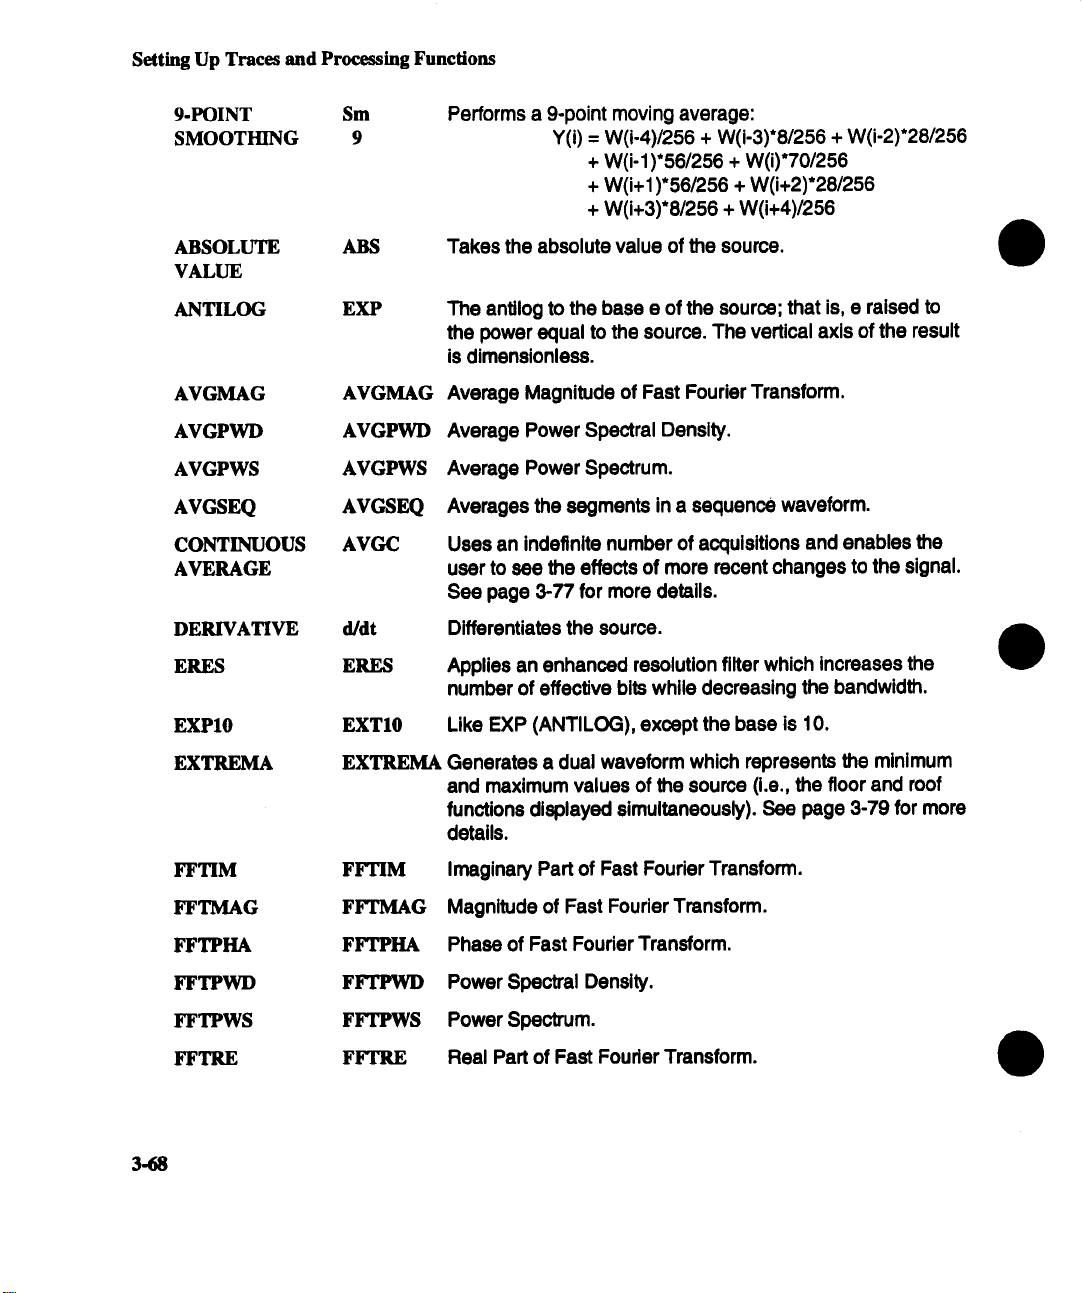
Setting Up Traces and Processing Functions
9-POINT
SMOOTHING 9
ABSOLUTE ABS
VALUE
ANTILOG EXP
AVGMAG
AVGPWD
AVGPWS
AVGSEQ
CONTINUOUS
AVERAGE
DERIVATIVE
ERES
Sm
AVGMAG
AVGPWD
AVGPWS
AVGSEQ
AVGC
d/dt
ERES
Performs a 9-point moving average:
Y(i) = W(i-4)/256 + W(i-3)’8/256 + W(i-2)’28/256
+ W(i-1 )*56/256 + W(i)’70/256
+ W(i+l )’56/256 + W(i+2)’28/256
+ W(i+3)’8/256 + W(i+4)/256
Takes the absolute value of the source.
The antilog to the base e of the source; that is, e raised to
the power equal to the source. The vertical axis of the result
is dimensionless.
Average Magnitude of Fast Fourier Transform.
Average Power Spectral Density.
Average Power Spectrum.
Averages the segments in a sequence waveform.
Uses an indefinite number of acquisitions and enables the
user to see the effects of more recent changes to the signal.
See page 3-77 for more details.
Differentiates the source.
Applies an enhanced resolution filter which increases the
number of effective bits while decreasing the bandwidth.
EXP10
EXTREMA
FFTIM
FFTMAG
FFTPHA
FFTPWD
FFTPWS
FFTRE
3.68
EXT10
EXTREMA
FFTIM
FFTMAG
FFTPHA
FFTPWD
FFTPWS
FFTRE
Like EXP (ANTILOG), except the base is 10.
Generates a dual waveform which represents the minimum
and maximum values of the source (i.e., the floor and roof
functions displayed simultaneously). See page 3-79 for more
details.
Imaginary Part of Fast Fourier Transform.
Magnitude of Fast Fourier Transform.
Phase of Fast Fouder Transform.
Power Spectral Density.
Power Spectrum.
Real Part of Fast Fourier Transform.
Page 99
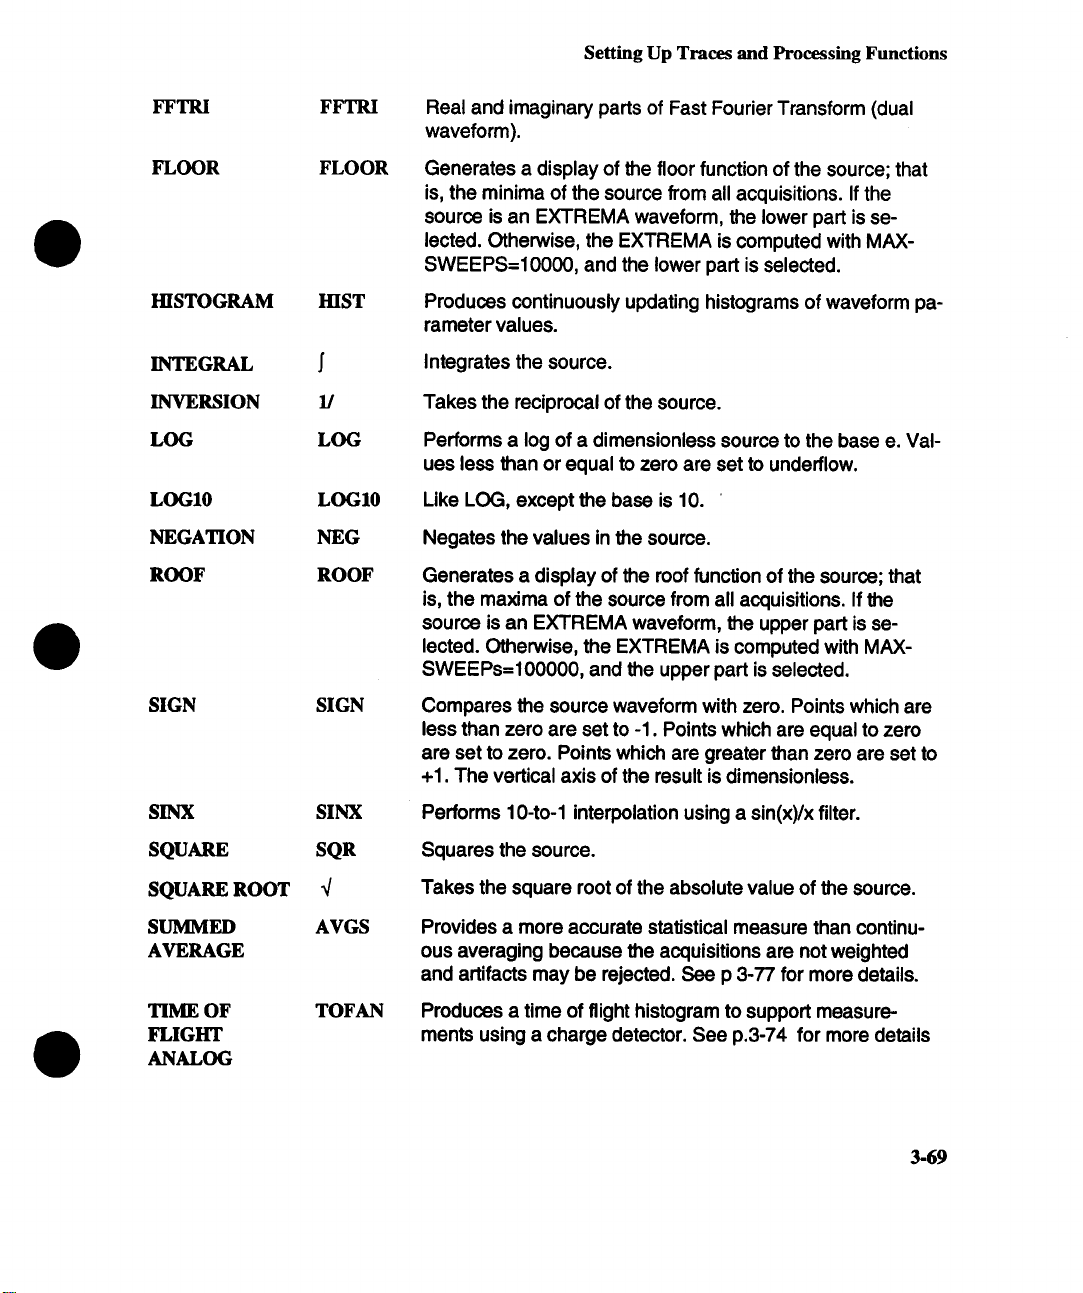
Setting Up Traces and Processing Functions
Real and imaginary parts of Fast Fourier Transform (dual
waveform).
FLOOR FLOOR
HISTOGRAM HIST
INTEGRAL
INVERSION 1/
LOG LOG
LOG10 LOG10
NEGATION NEG
ROOF ROOF
SIGN SIGN
Generates a display of the floor function of the source; that
is, the minima of the source from all acquisitions. If the
source is an EXTREMA waveform, the lower part is selected. Otherwise, the EXTREMA is computed with MAXSWEEPS=10000, and the lower part is selected.
Produces continuously updating histograms of waveform parameter values.
Integrates the source.
Takes the reciprocal of the source.
Performs a log of a dimensionless source to the base e. Val-
ues less than or equal to zero are set to underflow.
Like LOG, except the base is 10.
Negates the values in the source.
Generates a display of the roof function of the source; that
is, the maxima of the source from all acquisitions. If the
source is an EXTREMA waveform, the upper part is selected. Otherwise, the EXTREMA is computed with MAXSWEEPs=100000, and the upper part is selected.
Compares the source waveform with zero. Points which are
less than zero are set to -1. Points which are equal to zero
are set to zero. Points which are greater than zero are set to
+1. The vertical axis of the result is dimensionless.
SINX SINX
SQUARE SQR
SQUARE ROOT
SUMMED
AVERAGE
TIME OF
FLIGHT
ANALOG
AVGS
TOFAN
Performs 10-to-1 interpolation using a sin(x)/x filter.
Squares the source.
Takes the square root of the absolute value of the source.
Provides a more accurate statistical measure than continuous averaging because the acquisitions are not weighted
and artifacts may be rejected. See p 3-77 for more details.
Produces a time of flight histogram to support measure-
ments using a charge detector. See p.3-74 for more details
3-69
Page 100

Setting Up Traces and Processing Functions
TIME OF
FLIGHT
PULSE COUNT
TREND
WINDOW WINHIST
HISTOGRAM
TOFPC
TREND
Produces a Time of Flight histogram to support measurements using a pulse detector. See p.3-74 for more details
The 7200A can produce rolling trends of the most recent
waveform parameter values.
Takes a Time of Flight histogram as inputs and produces a
new histogram using user defined windows, see p.3-75 for
details.
Fast Fourier Transform Functions
The FFT functions compute spectra of single time-domain waveforms. Spectra are dis-
played with a linear frequency axis running from zero to the Nyquist frequency. The fre-
quency scale factors (Hz/div) are in a 1,2, 5 sequence.
FFT Functions
Function .~
Power Spectrum
FFTPWS
The Power Spectrum is the signal power (or magnitude) represented on a logarithmic vertical scale. For 50 Q input cou-
pling, 0 dBm corresponds to the voltage (0.315 V peak)
which is equivalent to 1 mW into 50 Q. For 1 MQ input cou-
pling, 0 dBV corresponds to 1 V peak. The power spectrum
is suitable for characterizing spectra which contain Isolated
peaks.
PowerDensiW FFTPWD
Ma ude
Phase (degrees)
Real
3.70
FFTRE
tYrMAG
FFTPHA
The Power Density is the signal power normalized to the
bandwidth of the equivalent filter associated with the FFT calculation. The units are dBm for 50 t3 input coupling, and dBV
for 1 MF4 input coupling. The power density is suitable for
characterizing broad-band noise
The Magnitude has the same units as the input signal. It is
the peak signal amplitude represented on a linear scale.
The Phase is measured with respect to a cosine whose
maximum occurs at the left-hand edge of the screen, at
which point it has 0% Similarly, a positive-going sine starting
at the left-hand edge of the screen has -90° phase.
The Real part has the same units as the Input, and repre-
sents the real part of the complex result of the FFT computation.
 Loading...