

Page 1

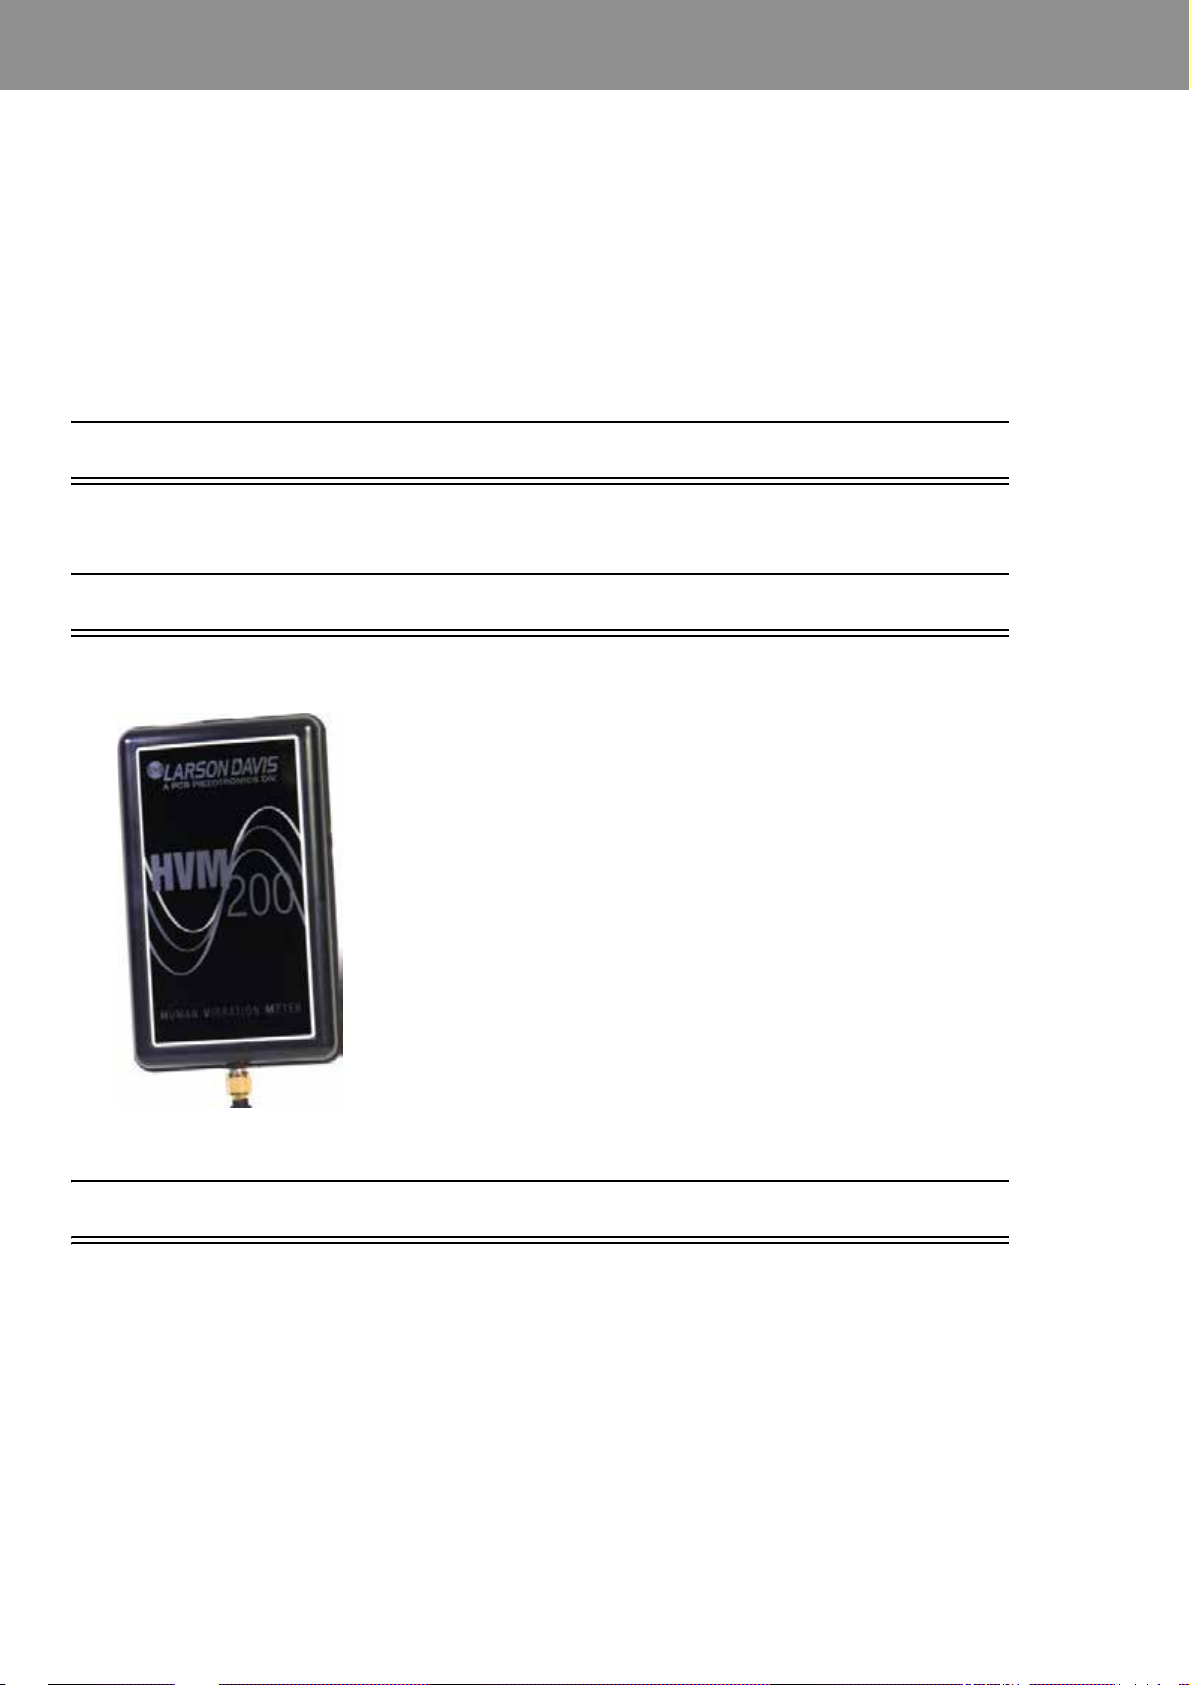
Model HVM200
Human Vibration Meter
Manual
Vertrieb für Österreich :
www.nbn.at
nbn Elektronik Handelsgesellschaft m. b. H.
Riesstraße 146, 8010 Graz | Tel. +43 316 40 28 05 | Fax +43 316 40 25 06
Page 2

Larson Davis
HVM200
Reference Manual
IHVM200.01 Rev C
Page 3

Copyright
Copyright 2016 PCB Piezotronics, Inc. This manual is copyrighted, with all rights reserved. The manual may
not be copied in whole or in part for any use without prior written consent of PCB Piezotronics, Inc.
Trademarks
PCB® is a registered trademark of PCB Group, Inc. Microsoft®, Windows®, and Excel® are either registered
trademarks or trademarks of Microsoft Corporation in the United States and/or other countries.
Disclaimer
The following paragraph does not apply in any state or country where such statements are not agreeable with
local law: Even though PCB Piezotronics, Inc. has reviewed its documentation, PCB Piezotronics, Inc.
makes no warranty or representation, either expressed or implied, with respect to this instrument and documentation, its quality, performance, merchantability, or fitness for a particular purpose. This documentation
is subject to change without notice, and should not be construed as a commitment or representation by PCB
Piezotronics, Inc. This publication may contain inaccuracies or typographical errors. PCB Piezotronics, Inc.
will periodically update the material for inclusion in new editions. Changes and improvements to the information described in this manual may be made at any time.
Warranty
For warranty information, refer to our Terms and Conditions of Sale on our website at www.larsondavis.com/
TermsConditions.aspx.
HVM200 Purchase Information
Record the serial number and date of purchase below.
Serial Number:_______________________ Date of Purchase:____________________
Recycling
PCB Piezotronics, Inc. is an environmentally friendly organization and encourages our customers to be environmentally conscious. When this product reaches its end of life, please recycle the product through a local
recycling center or return the product to:
PCB Piezotronics, Inc.
Attn: Recycling Coordinator
1681 West 820 North
Provo, Utah, USA 84601-1341
where it will be accepted for disposal.
Contact Larson Davis
Website: www.larsondavis.com
Worldwide Corporate Headquarters
Larson Davis - a PCB Piezotronics division
Toll-free (in the US):888-258-3222
Phone:716-926-8243
USA fax:716-926-8215
E-mail: sales@larsondavis.com
HVM200 Reference Manual i-2
Page 4

Table of Contents
Module 1 Introduction 1-1
1.1 Overview ..........................................................................................................................1-1
1.2 Features ...........................................................................................................................1-1
1.3 Standard Contents ...........................................................................................................1-1
Module 2 Getting Started 2-1
2.1 Overview ..........................................................................................................................2-1
2.2 Powering the HVM200 .....................................................................................................2-1
2.3 Power Button Operation ...................................................................................................2-3
2.4 Downloading the HVM200 Control App ...........................................................................2-3
2.5 Connecting the HVM200 to a Mobile Device ....... ... .... ... ... ... ... .... ... ... ... ....... ... ... ... .... ... ... ..2-4
2.6 Connecting HVM200 to G4 LD Utility ...............................................................................2-7
2.7 Connecting the Accelerometer .........................................................................................2-9
Module 3 Making Measurements 3-1
3.1 Overview ..........................................................................................................................3-1
3.2 Setting Up the Measurement ...........................................................................................3-1
3.3 Making the Measurement .............. .... ............................................................. ... ... .... ... ... ..3-7
3.4 Downloading Data .......................................... ... ... ... .......................................................3-12
Module 4 Changing Features 4-1
4.1 Overview ..........................................................................................................................4-1
4.2 Setting/Syncing Meter Time and Date .............................................................................4-1
4.3 Turning Off/On WiFi Signal ..................................... .... .....................................................4-3
4.4 Upgrade Firmware and Options .......................................................................................4-5
Appendix A Specifications A-1
A.1 General Characteristics ................................................................................................... A-1
A.2 Physical Characteristics .................................................................................................. A-3
A.3 Operational Characteristics ............................................................................................. A-4
A.4 Electrical Characteristics ................................................................................................. A-5
A.5 Reference Values ............................................................................................................A-7
A.6 Measurement Ranges ..................................................................................................... A-8
A.7 Frequency Weighting Curves ............................................ ... ... .... ...... ... .... ... ... ... ... .... ... ... . A-8
A.8 Frequency Weighting Tables .. ... ... .... ... ...... .... ... ... ... .... ... ... ... ... .... ... ... ... .... ... ... ...... .... ... .. A-13
A.9 Integration Weighting Limits .......................................................................................... A-23
A.101/1 & 1/3 Octave Band Filters ...................................................................................... A-29
A.11Standards Met .................................. ............................................................. ... ... .... ... ..A-38
Appendix B Adaptor Resonance & Frequency Response B-1
B.1 Mechanical ...................................................................................................................... B-1
Appendix C Glossary of Terms C-1
Appendix D Regulatory Compliance Statement D-1
HVM200 Reference Manual ii-1
Page 5
Module1 Introduction
1.1 Overview ...............................................................................................................1-1
1.2 Features ................................................................................................. ...............1-1
1.3 Standard Contents ................................................................................................1-1
1.3.1 Optional Kits .............................................................................................1-2
1.3.2 Optional Accessories ...............................................................................1-2
1.1 Overview
This module describes the features and options available on the HVM200.
1.2 Features
The Larson Davis HVM200 Human Vibration Meter is designed for use
in assessing vibration as perceived by human beings.
The HVM200 provides the following features for vibration measurement:
1.3 Standard Contents
The HVM200 package includes the following contents:
TRY THIS Record the meter serial
number and date of purchase in a safe
place where it can be retrieved, in
case you require customer support.
• Whole body, hand-arm, and general vibration applications
• Wireless mobile interface
• Compact design for easy wear and convenient placement
• Mobile application for configuring, measuring, and viewing vibration data on multiple meters
• Connection and control of multiple meters through WiFi access
• Support for optional 1/1 and 1/3 Octave Band Analysis
• Data analysis and visualization using optional G4 LD Utility software
• HVM200 Human Vibration Meter and certificate
• BAT018 Rechargeable Lithium Battery
• PSA035 Power Supply and Adapters
• CBL218 USB Type A to micro-B USB Cable
• CBL217-01 Accelerometer Cable (1/4-28 4-pin connection)
• G4 LD Utility Software CD
HVM200 Reference Manual Overview 1-1
Page 6

1.3.1 Optional Kits
Optional CCS047
Hard Shell Case
• Removable 8 GB SD Memory (in meter)
• Optional license document for HVM support in G4 LD Utility if
purchased
The following HVM200 models provide kits with the following contents:
• HVM200-HA-41F: Standard contents with CCS047 Hard Shell
Case, CCS048-L Hand/Arm Vibration Arm Band, SEN041F
accelerometer, ADP081A Hand Adapter, and SWW-G4-HVM
software license
• HVM200-WB: Standard contents with CCS047 Hard Shell Case,
SEN027 Whole Body Vibration Seat Adapter, and SWW-G4HVM software license
• HVM200-ALL-41F: Standard Contents with CCS047 Hard Shell
Case, CCS048-L Hand/Arm Vibration Arm Band, SEN041F
accelerometer, ADP081A Hand Adapter, and SWW-G4-HVM
software license
1.3.2 Optional Accessories
SWW-G4-HVM
License to enable HVM100 and HVM200 support in G4 LD Utility
HVM200-OB3
1/1 and 1/3 Octave Band Analysis firmware
HVM200-RAW
Record sampled raw data files
SWW-G4-SDK
G4 software development kit
CCS047
Hard Shell Case for transport and protection of HVM200 and accessories
CCS048-L (large) and CCS048-S (small)
Arm Band for wearing the HVM200
SEN026
Accelerometer for ADP063 palm adapter.
SEN040F & SEN041F
Accelerometers for Hand-Arm vibration measurement
SEN020
Accelerometer for Hand-Arm and general vibration measurements
HVM200 Reference Manual Standard Contents 1-2
Page 7

SEN027
Seat Adapter, accelerometer, and adapter for whole-body vibration measurements
LEARN MORE For more informa-
tion on HVM200 accessories, including sensors, see “Adaptor Resonance
& Frequency Response” on page B-1
ADP063, ADP080A, ADP081A, and ADP082A
Adapters for accelerometer placement
CBL217-05, CBL216, and CBL217-01
Cables for connection between accelerometers and HVM200 meter
394C06
Hand-held Shaker for vibrational measurement verification
HVM200 Reference Manual Standard Contents 1-3
Page 8

Module2 Getting Started
2.1 Overview ...............................................................................................................2-1
2.2 Powering the HVM200 ................................................. .... ... ... ... .... ... ..................... 2-1
2.3 Power Button Operation ........................................................................................2-3
2.4 Downloading the HVM200 Control App ................................................................2-3
2.5 Connecting the HVM200 to a Mobile Device ........................................................2-4
2.5.1 Mobile Device Connection Options ..........................................................2-4
2.5.2 Connecting to a Mobile Device via Access Point .....................................2-4
2.5.3 Connecting HVM200 to WiFi Network ......................................................2-5
2.6 Connecting HVM200 to G4 LD Utility ....................................................................2-7
2.6.1 G4 LD Utility Connection Options ............................................................2-7
2.6.2 Connecting the HVM200 meter to G4 LD Utility via USB .........................2-8
2.6.3 Connecting the HVM200 meter to G4 LD Utility via IP Address ..............2-8
2.7 Connecting the Accelerometer ..............................................................................2-9
2.1 Overview
This module provides instructions for setting up and configuring
HVM200 meters for use with the HVM200 Control app and G4 LD Utility.
2.2 Powering the HVM200
Before using your HVM200, charge the battery completely by following
these steps:
Step 1 Slide and remove the back battery cover from the HVM200
meter.
FIGURE 2-1 Remove Battery Cover
HVM200 Reference Manual Overview 2-1
Page 9
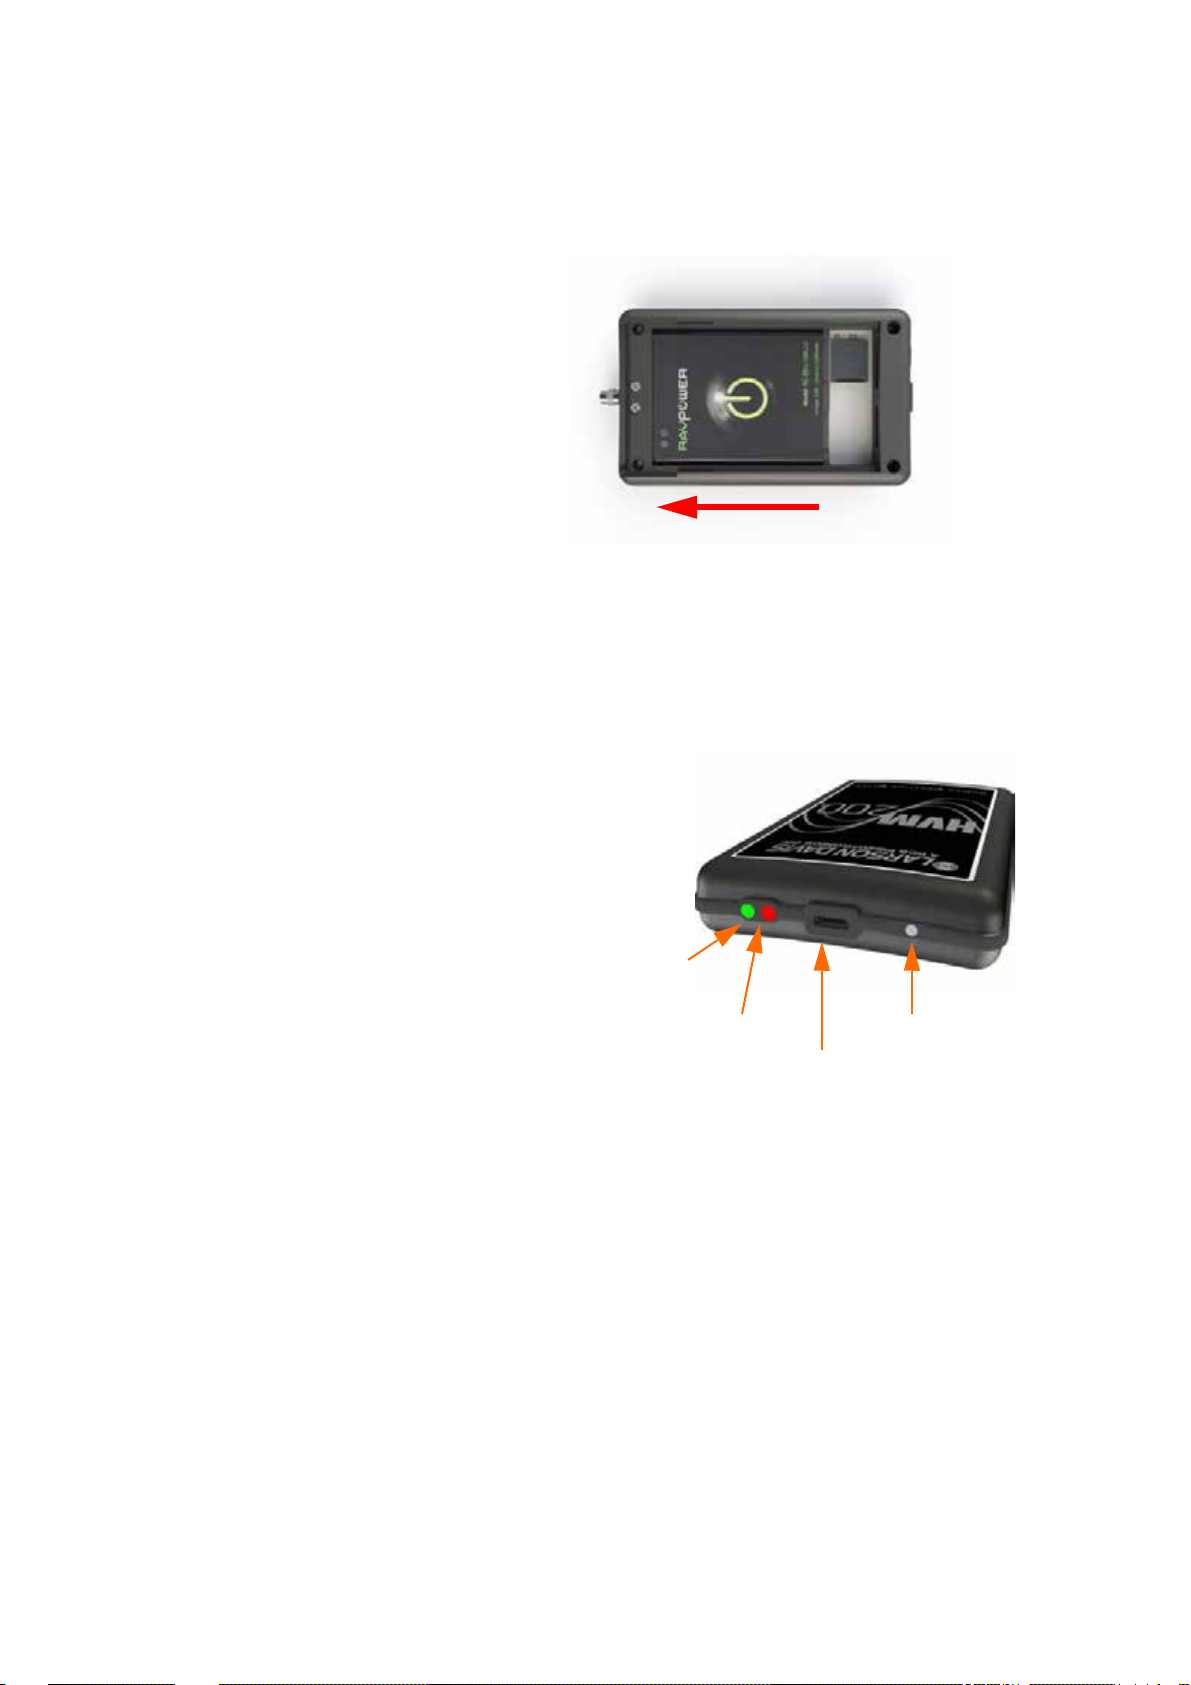
Step 2 Insert the supplied battery into the HVM200 by sliding the
Power LED
Status LED
Power Button
Micro-B USB port
battery contacts against the meter power contacts first and
then lowering the other end of the battery into the tray.
TAKE NOTE Make sure the battery
contacts are fully seated against the
power contacts in the meter and that
the battery lies flat in the tray.
TAKE NOTE The Power LED dis-
plays a yellow color while charging.
TAKE NOTE Avoid leaving the bat-
tery drained for extended periods of
time in order to maximize overall
battery life.
FIGURE 2-2 Insert Battery
Step 3 Slide the back battery cover onto the HVM200.
Step 4 Connect one end of the supplied USB cable to the HVM200
Micro-B USB port and the other end to the PSA035 charger.
FIGURE 2-3 HVM200 Communication
LEARN MORE Refer to the back
label of your HVM200 for a description of each LED indication, or see
see “LED Indications” on page A-4.
Step 5 In order to get an accurate battery reading, the HVM200
must be fully charged prior to use. When fully charged, the
Power LED displays a solid green color. Charging time may
take from 3 to 6 hours.
HVM200 Reference Manual Powering the HVM200 2-2
Page 10

2.3 Power Button Operation
Power Button
Status LED
Power LED
The HVM200 has one button. This power button operates all functions
needed for full operation.
FIGURE 2-4 HVM200 Power Button
Turn Meter On
Press power button until the Power LED shows blue.
Start Measurement
Press power button once and the Status LED will show green. It may flash
to indicate run pending. When the green light stops flashing and periodically winks, this means the meter is working and collecting data.
LEARN MORE For further help with
the LED indicators, refer to the label
on the back of the meter, or see “LED
Indications” on page A-4.
Stop Measurement
Press power button once and the Status LED will show red to indicate that
the measurement has stopped.
Turn Meter Off
Press and hold power button just until the Power LED shows blue, then let
go. Wait until both LEDs go dark, this indicates that the meter is now off.
2.4 Downloading the HVM200 Control App
Use your mobile device to find and download the HVM200 Control app
from Google Play or the Apple App Store
“HVM200”.
Table 2.1 Mobile Requirements
Apple Android
Space 2.5MB 2.8M
®
. To find the app, search for
OS Version 7.0 or later 4.0 and up
HVM200 Reference Manual Power Button Operation 2-3
Page 11
2.5 Connecting the HVM200 to a Mobile Device
With the HVM200 Control app, you can make a direct WiFi connection to the HVM200
from your mobile device.
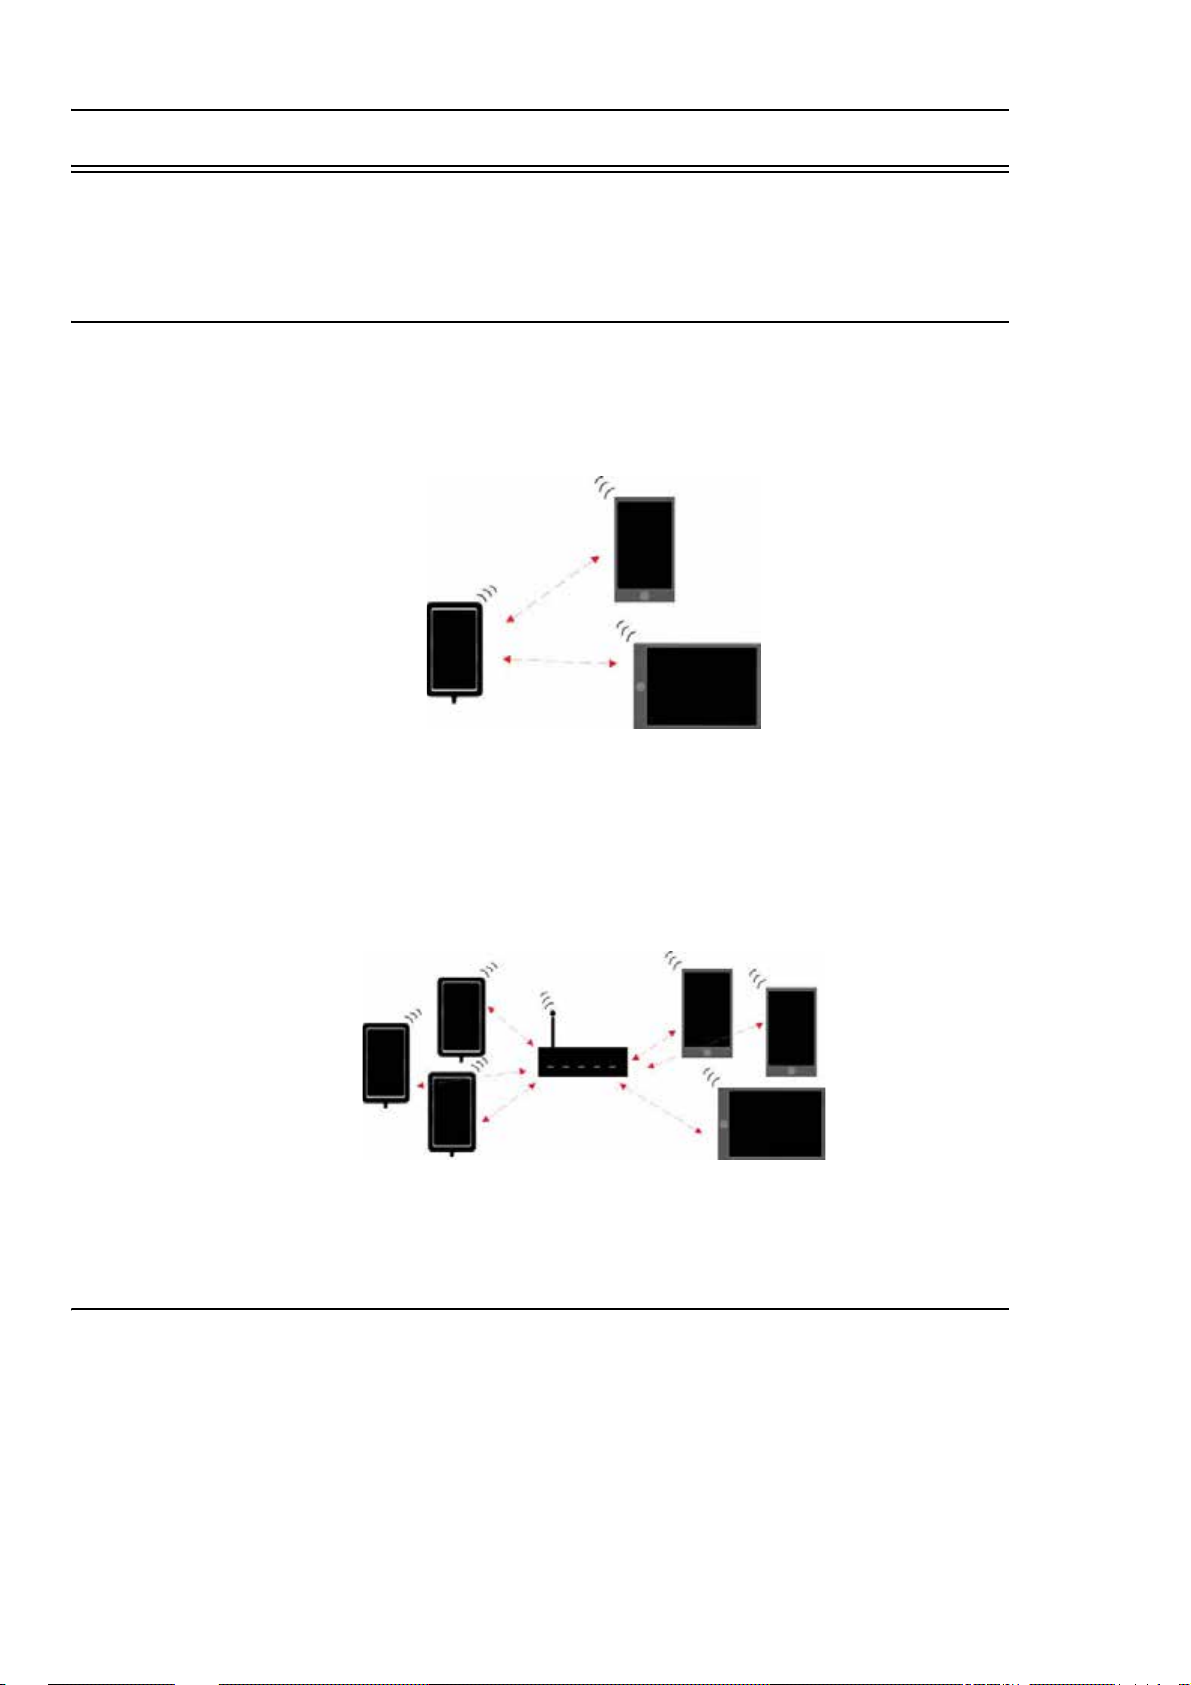
2.5.1 Mobile Device Connection Options
One HVM200 to multiple mobile devices.
FIGURE 2-5 Mobile Connection
Use HVM200 Access Point to connect meter to one or more mobile
devices.
Multiple HVM200 to multiple mobile devices
FIGURE 2-6 Mobile Connections
If a router is within range, connect the HVM200 to the same WiFi network as mobile device(s).
2.5.2 Connecting to a Mobile Device via Access Point
With the HVM200 Control app, you can make a direct WiFi connection to
the HVM200 from your mobile device:
TRY THIS If there is no network
showing, make sure the HVM200 is
turned on.
HVM200 Reference Manual Connecting the HVM200 to a Mobile Device 2-4
Step 1 Open the WiFi settings on your mobile device.
Page 12
TAKE NOTE Depending on your
Tap here
Menu Icon
mobile device, you may need to perform this step each time you want to
connect to the HVM200.
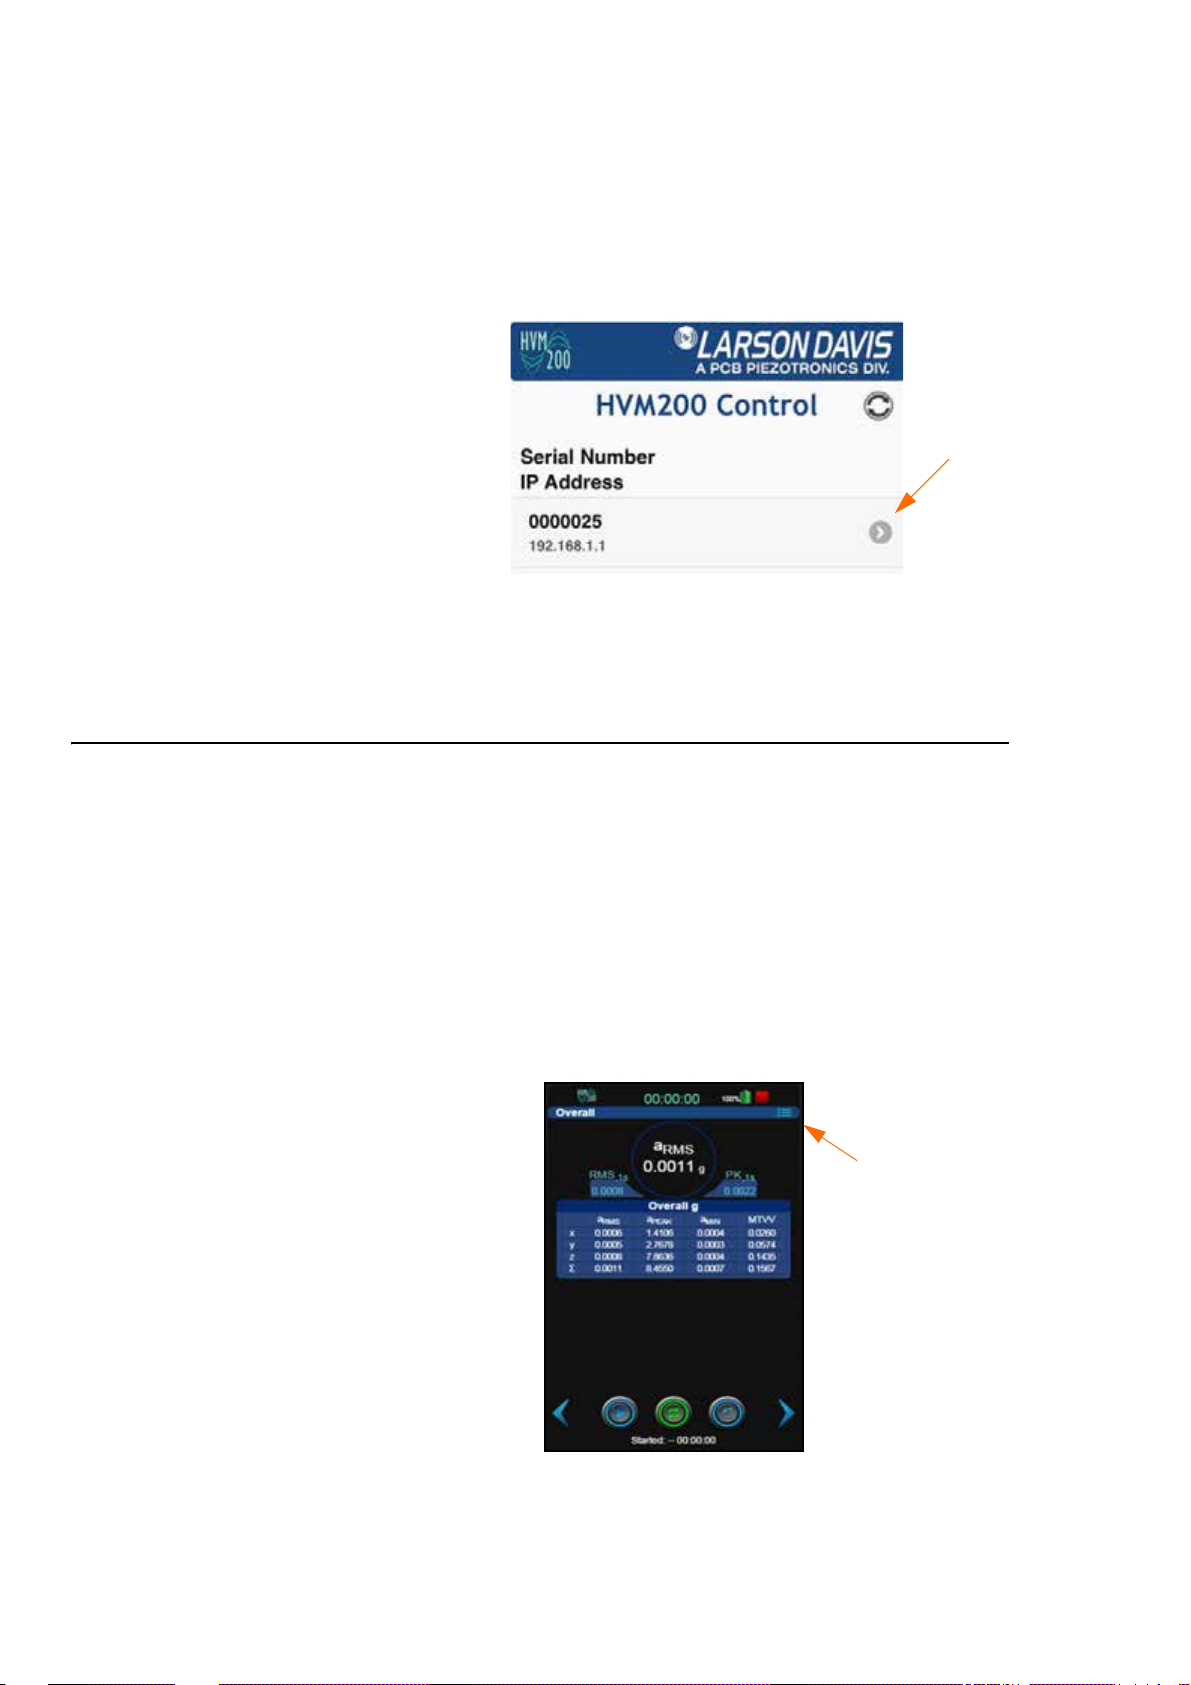
Step 2 Connect to the HVM200 WiFi network displaying the serial
number of your meter.
Step 3 Launch the HVM200 Control app to begin controlling the
meter on your mobile device.
FIGURE 2-7 HVM200 Access Point
Step 4 Connect the HVM200 by selecting the meter with the serial
number displayed for your meter.
2.5.3 Connecting HVM200 to WiFi Network
The HVM Control App will be able to connect to the HVM200 as long as
the mobile device is connected to the same wireless local network as the
HVM200.
To establish a WiFi connection over a network with the HVM200 meter,
follow these steps:
Step 1 Launch the HVM200 Control app or the G4 Live Stream
view. Select your meter. Click the menu icon.
TAKE NOTE It is best to make the
initial connection to a WiFi network
while also connected to a PC via
USB, if possible.
FIGURE 2-8 HVM200 App
Step 2 On the HVM200 Menu, select Setup WiFi.
HVM200 Reference Manual Connecting the HVM200 to a Mobile Device 2-5
Page 13
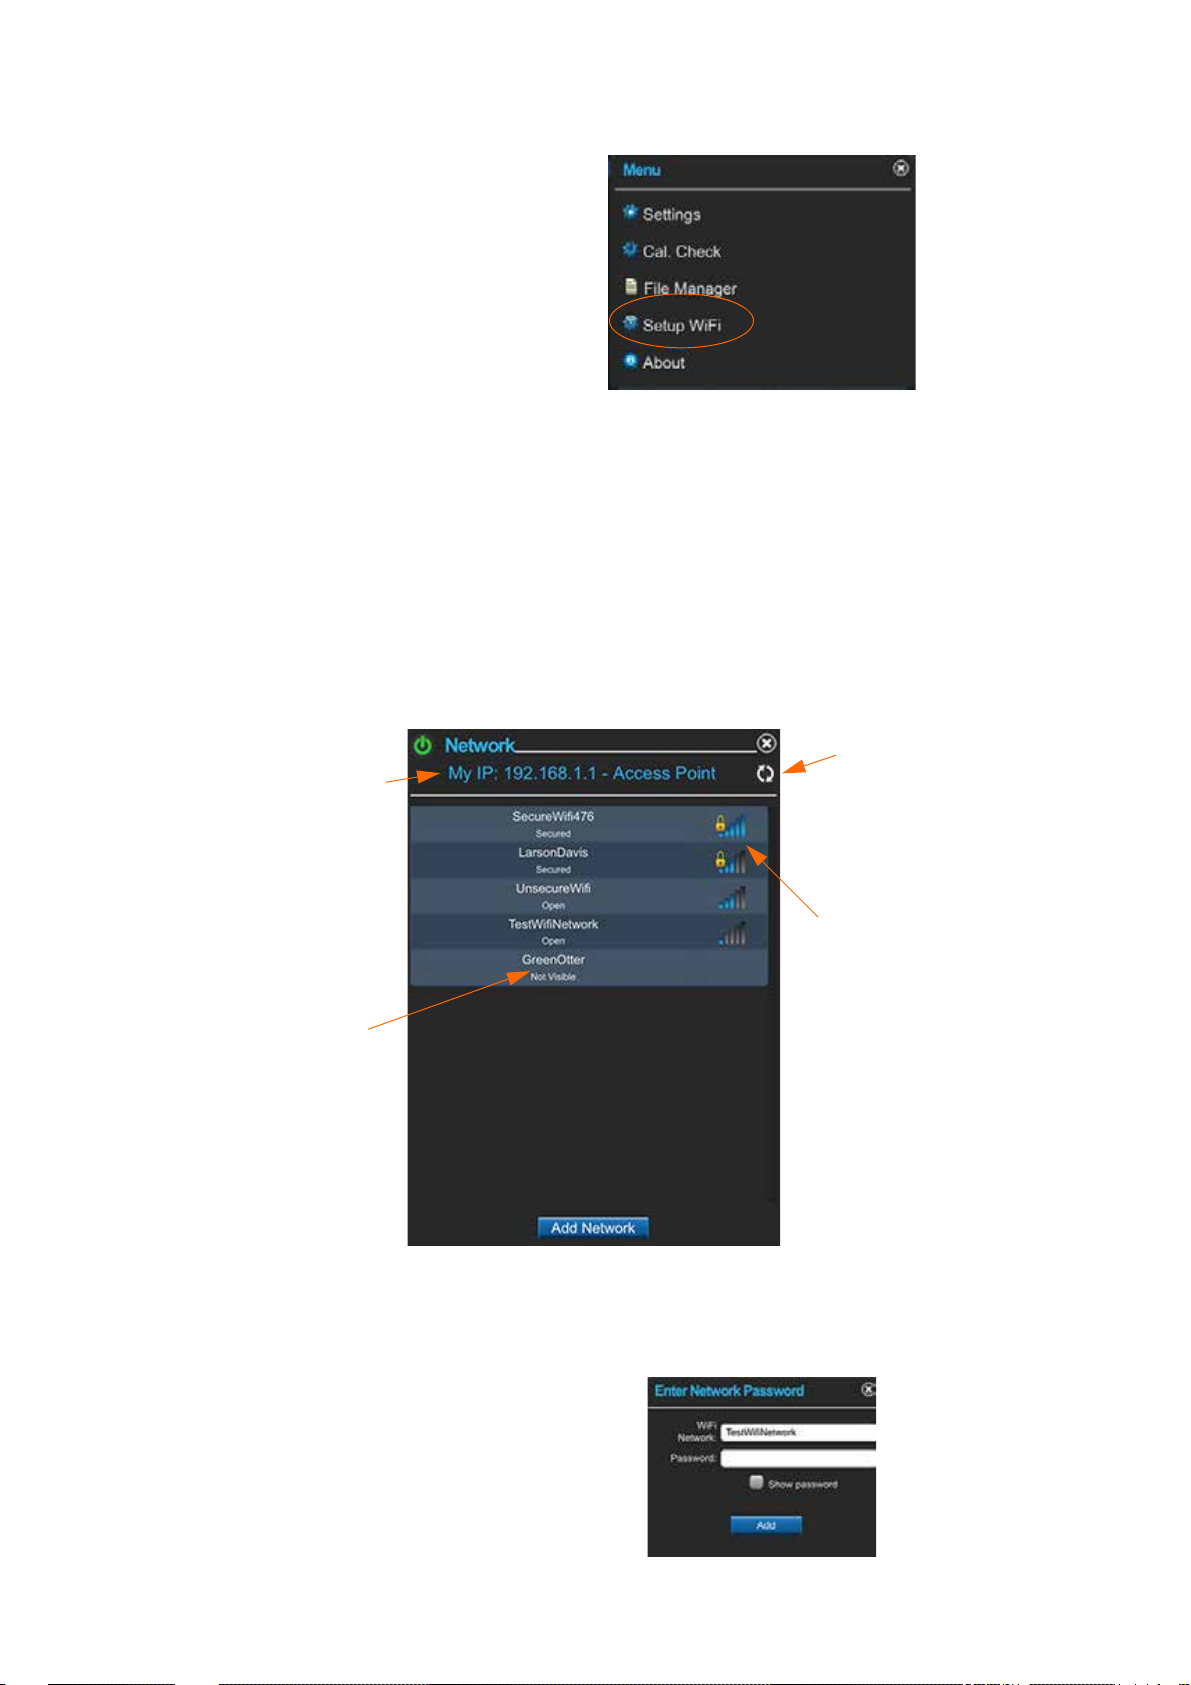
FIGURE 2-9 WiFi Setup
Signal strength indicator and Secured
network icon
(requires password)
Not visible net-
works are previously used but not
currently detected.
Refresh
This meter is set as
an Access Point
LEARN MORE Networks are listed
in the order of greatest signal
strength.
TAKE NOTE If you have already
entered a password and saved a network, the HVM200 automatically
connects to the network with the
greatest signal strength.
FIGURE 2-10 Network Settings.
Step 3 Select an available network. If no network appears on the
list, click the refresh button. To connect to a hidden network,
click Add Network and provide network name.
TAKE NOTE The HVM200 supports
WPA and WPA2 WiFi security. Larson Davis recommends using secure
WiFi networks.
Step 4 Enter the network password, if required, and click Add
FIGURE 2-11 Enter Network Password
HVM200 Reference Manual Connecting the HVM200 to a Mobile Device 2-6
Page 14
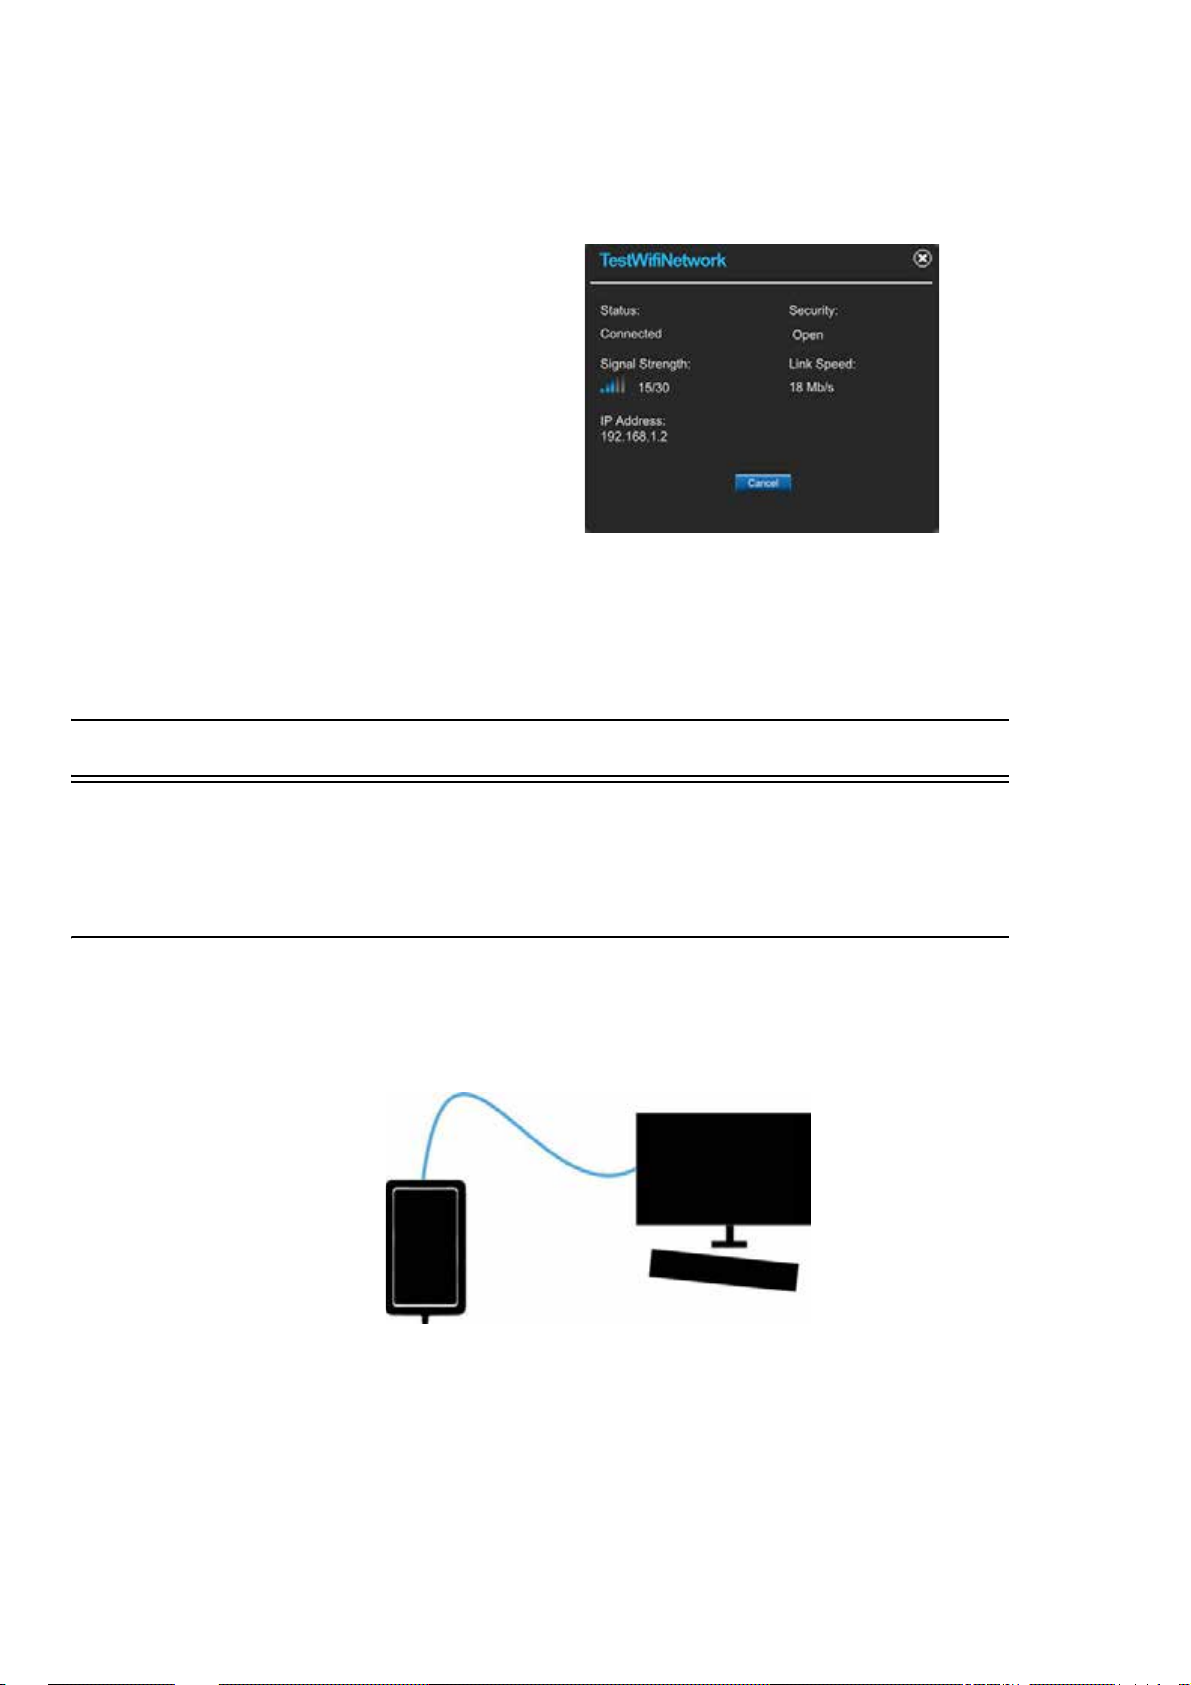
Step 5 Verify your network connection details by clicking the
newly added network from the list.
FIGURE 2-12 Network Connection Details
Step 6 In the connect screen of the HVM Control App, if the
HVM200 and your mobile device are both on the same local
network, you will see it in the list. Select it to connect.
2.6 Connecting HVM200 to G4 LD Utility
TAKE NOTE G4 LD Utility for
HVM software requires a license.
2.6.1 G4 LD Utility Connection Options
HVM200 to PC via USB Cable
FIGURE 2-13 USB Cable Connection
G4 LD Utility for HVM software provides features for setup, measurement, data download, and data viewing.
Using a Micro B USB cable, you can directly connect your PC to meter
and operate it using G4 LD Utility.
HVM200 Reference Manual Connecting HVM200 to G4 LD Utility 2-7
Page 15
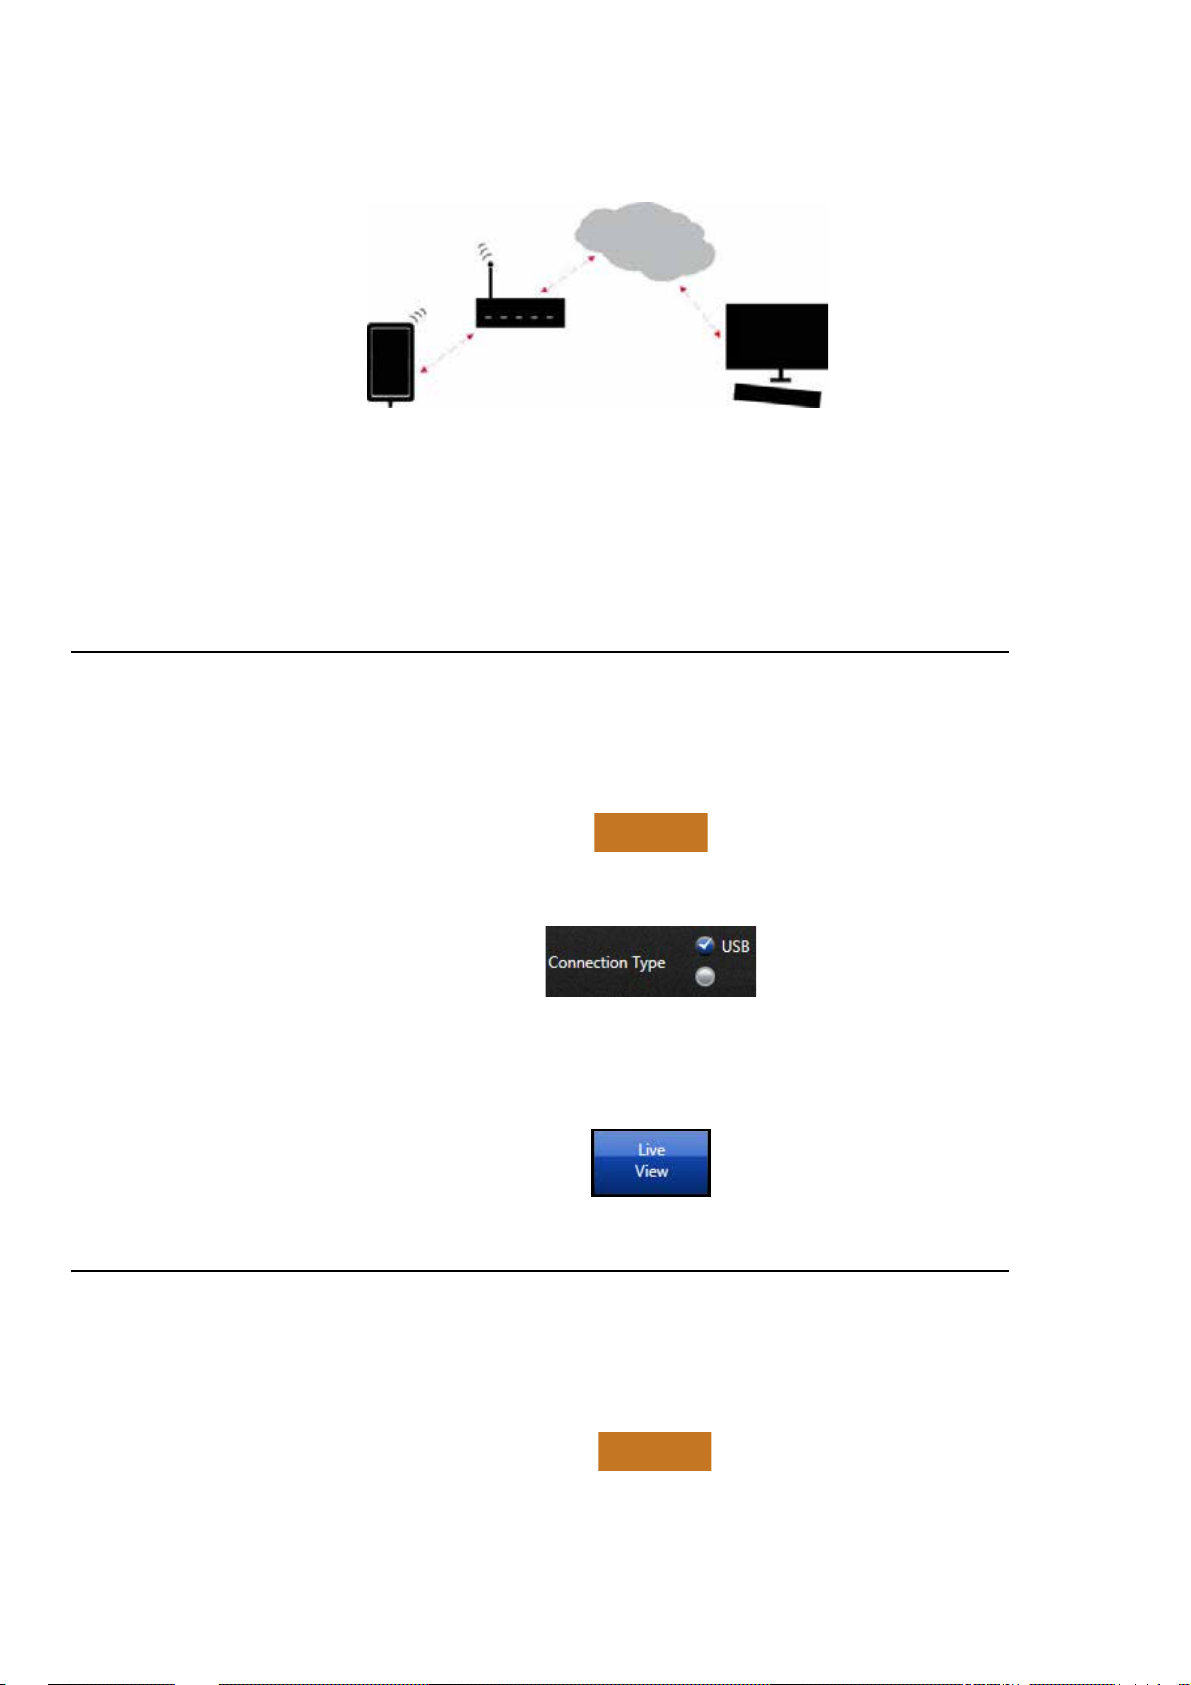
HVM200 to PC via TCP/IP
FIGURE 2-14 TCP/IP Connection
With the meter connected to a WiFi network that has Internet access, a PC
can access the meter as long as it is currently connected to the Internet and
you have the IP address to enter into G4 LD Utility, in addition port forwarding will need to be set up on the gateway or router.
2.6.2 Connecting the HVM200 meter to G4 LD Utility via USB
LEARN MORE For more informa-
tion on working with G4 LD Utility,
refer to the G4 LD Utility Software
Manual.
Step 1 Connect the HVM200 to a PC with the provided USB to
micro-B USB cable. (CBL218).
Step 2 Launch G4 and click Connect.
Step 3 Connect via USB.
Step 4 Click the Live View button. The Live View presents the
same interface as the HVM200 App for working with measurements.
2.6.3 Connecting the HVM200 meter to G4 LD Utility via IP Address
LEARN MORE For more informa-
tion on working with G4, refer to the
G4 LD Utility Software Manual.
Step 1 Using previous instructions, connect meter to a WiFi net-
work with Internet access.
Step 2 Launch G4 and click Connect.
HVM200 Reference Manual Connecting HVM200 to G4 LD Utility 2-8
Page 16
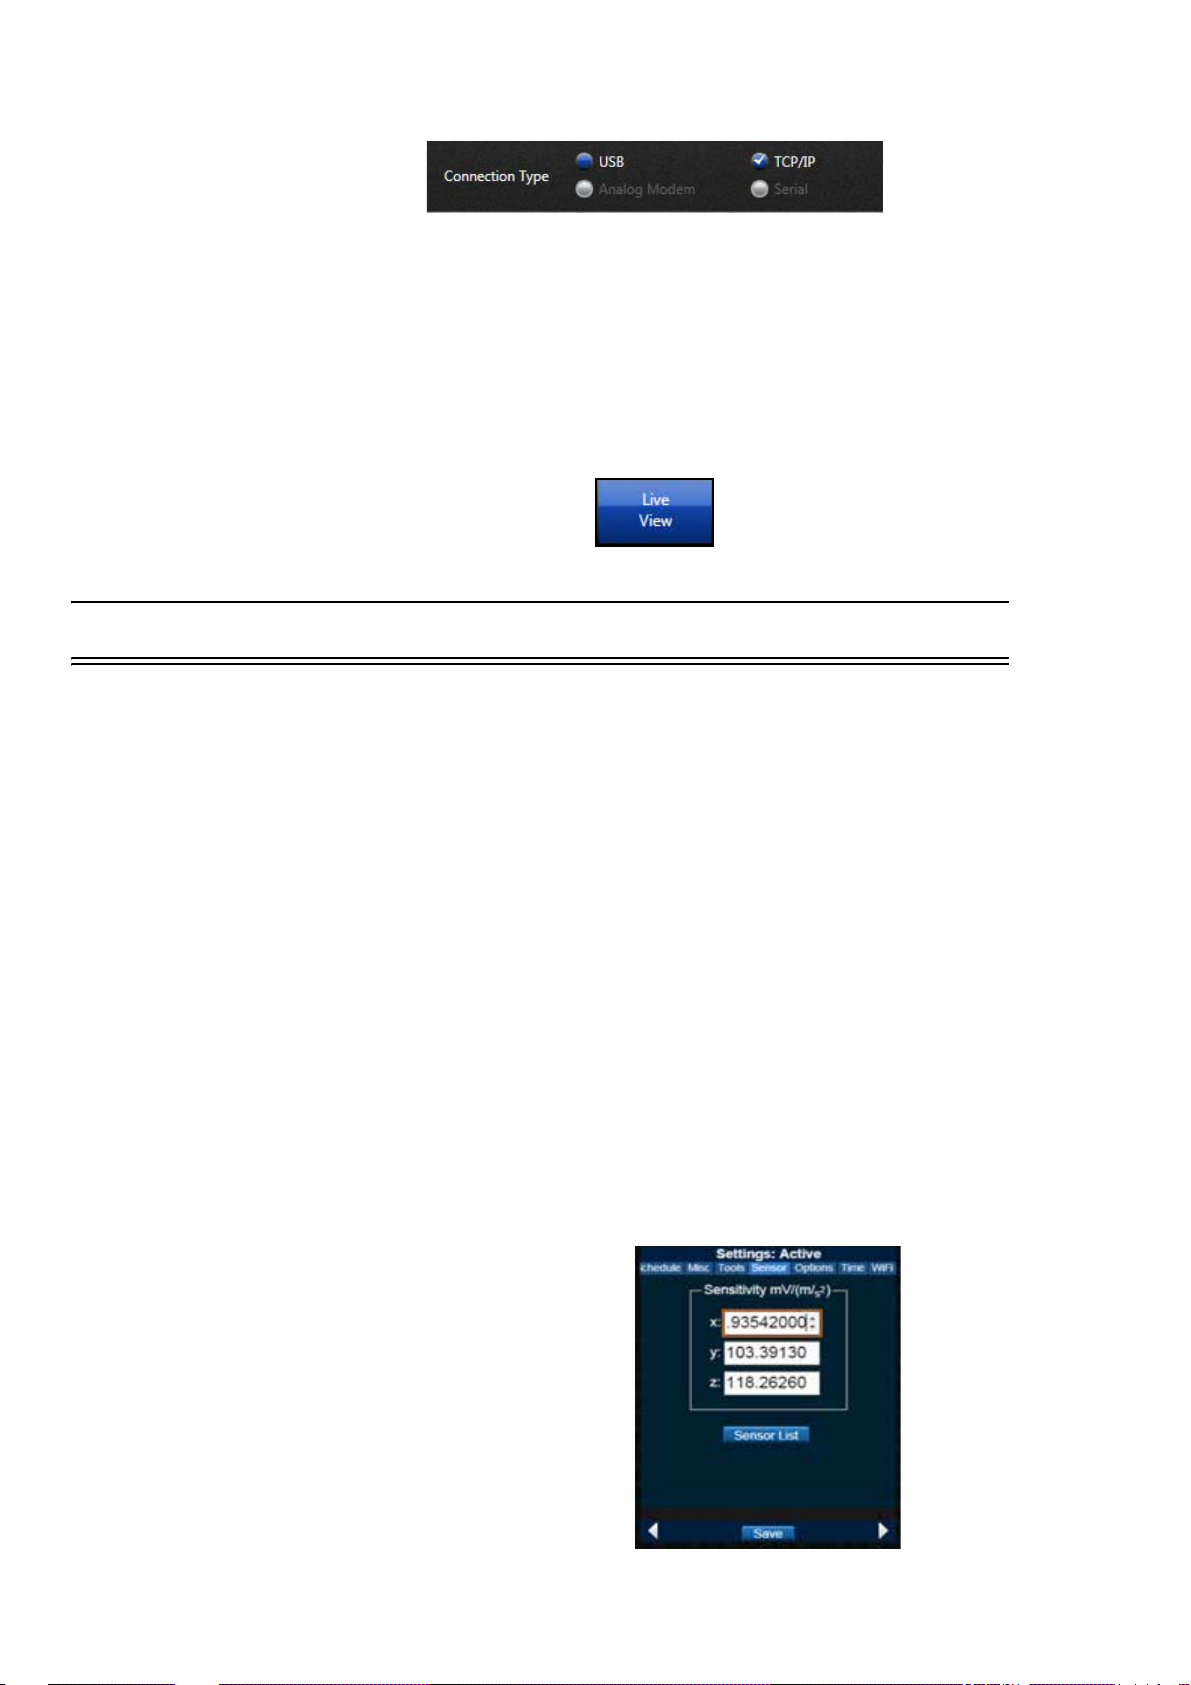
Step 3 Connect via TCP/IP. Click the Add Meter button.
Step 4 Place your cursor in fields and enter the IP address.
Step 5 Once IP address is entered, the Connect button will turn
blue, select it.
TAKE NOTE IP address is the only
required field to add a meter, unless a
password has been created.
Step 6 Click the Live View button. The Live View presents the
same interface as the HVM200 App for working with measurements.
2.7 Connecting the Accelerometer
LEARN MORE Refer to the "Hand-
held Shaker for vibrational measurement verification" in this manual for
information on selecting the proper
accelerometer for the HVM200
meter.
To connect the accelerometer to your HVM200 meter, follow these steps:
Step 1 Insert the accelerometer cable into the 4-pin connector on
the HVM200 and then rotate the nut on the cable until the
connection is tight.
Step 2 Insert the other end of the accelerometer cable into the 4-pin
connector on the accelerometer and tighten the cable nut.
Step 3 If the HVM200 is not already turned on, press the power
button once, the Power LED will turn blue.
Step 4 Connect the HVM200 to G4 via USB.
LEARN MORE For more informa-
tion on working with G4 tabs and settings, refer to the G4 LD Utility
Software Manual.
TAKE NOTE If you are using an
accelerometer with Transducer Electronic Data Sheet (TEDS) capabilities, the sensitivity values will
already be displayed for the x, y, and
z axes of the sensor.
HVM200 Reference Manual Connecting the Accelerometer 2-9
Step 5 Click the Setup Manager tab in G4. Under the meter set-
tings (displaying the meter serial number) click the Sensor
tab.
FIGURE 2-15 Sensor Settings
Page 17

FIGURE 2-16 Sensor Tab
Step 6 Click Sensor List.
TAKE NOTE Sensor information,
including model, serial number, and
sensitivity specifications are usually
listed on the calibration certificate
that comes with an accelerometer.
FIGURE 2-17 Sensor List Identification and Sensitivity
Step 7 In the Sensor List, type the model, serial number of your
accelerometer, and the sensitivity for the x, y, and z axes and
then click Add.
Step 8 Select the accelerometer when it appears in the list and click
Select. The sensitivity values will automatically appear on
the Sensor tab. Click Save. Use the Sensor List to quickly
access and select stored sensors for future measurements.
HVM200 Reference Manual Connecting the Accelerometer 2-10
Page 18

Module
3.1 Overview ...............................................................................................................3-1
3.2 Setting Up the Measurement ................................................................................3-1
3.2.1 Perform a Calibration Check ....................................................................3-1
3.2.2 Selecting a Setup File Using Your Mobile Device ....................................3-3
3.3 Making the Measurement ......................................................................................3-7
3.3.1 Position for Hand/Arm Vibration ............................................................. ..3-7
3.3.2 Position for Whole Body Vibration with Seat Adapter ..............................3-7
3.3.3 Start/Stop the Measurement ....................................................................3-8
3.4 Downloading Data ...............................................................................................3-12
3.4.1 Working with RAW Data Files ................................................................3-12
3 Making Measurements
3.1 Overview
This module provides an example procedure for performing a vibration
measurement with the HVM200 Control app and G4 LD Utility.
The following example demonstrates procedures for measuring vibration,
including:
• Setting Up the Measurement
• Making the Measurement
• Downloading the Measurement Data
3.2 Setting Up the Measurement
To set up the measurement:
1. Perform a calibration check.
2. Specify a setup file on your mobile device.
The following sections describe these steps in more detail.
3.2.1 Perform a Calibration Check
TAKE NOTE A calibration check on
an HVM200 requires a hand held
shaker like the PCB Model 394C06.
HVM200 Reference Manual Overview 3-1
To perform a calibration check, follow these steps:
Step 1 If you have not indicated sensitivity values for the x, y, and z
axes on the Sensor tab, refer to “Connecting the Accelerom-
eter” to specify these settings.
Step 2 Launch G4 or HVM Control app on mobile device, connect
to HVM200, and click Live View.
Page 19
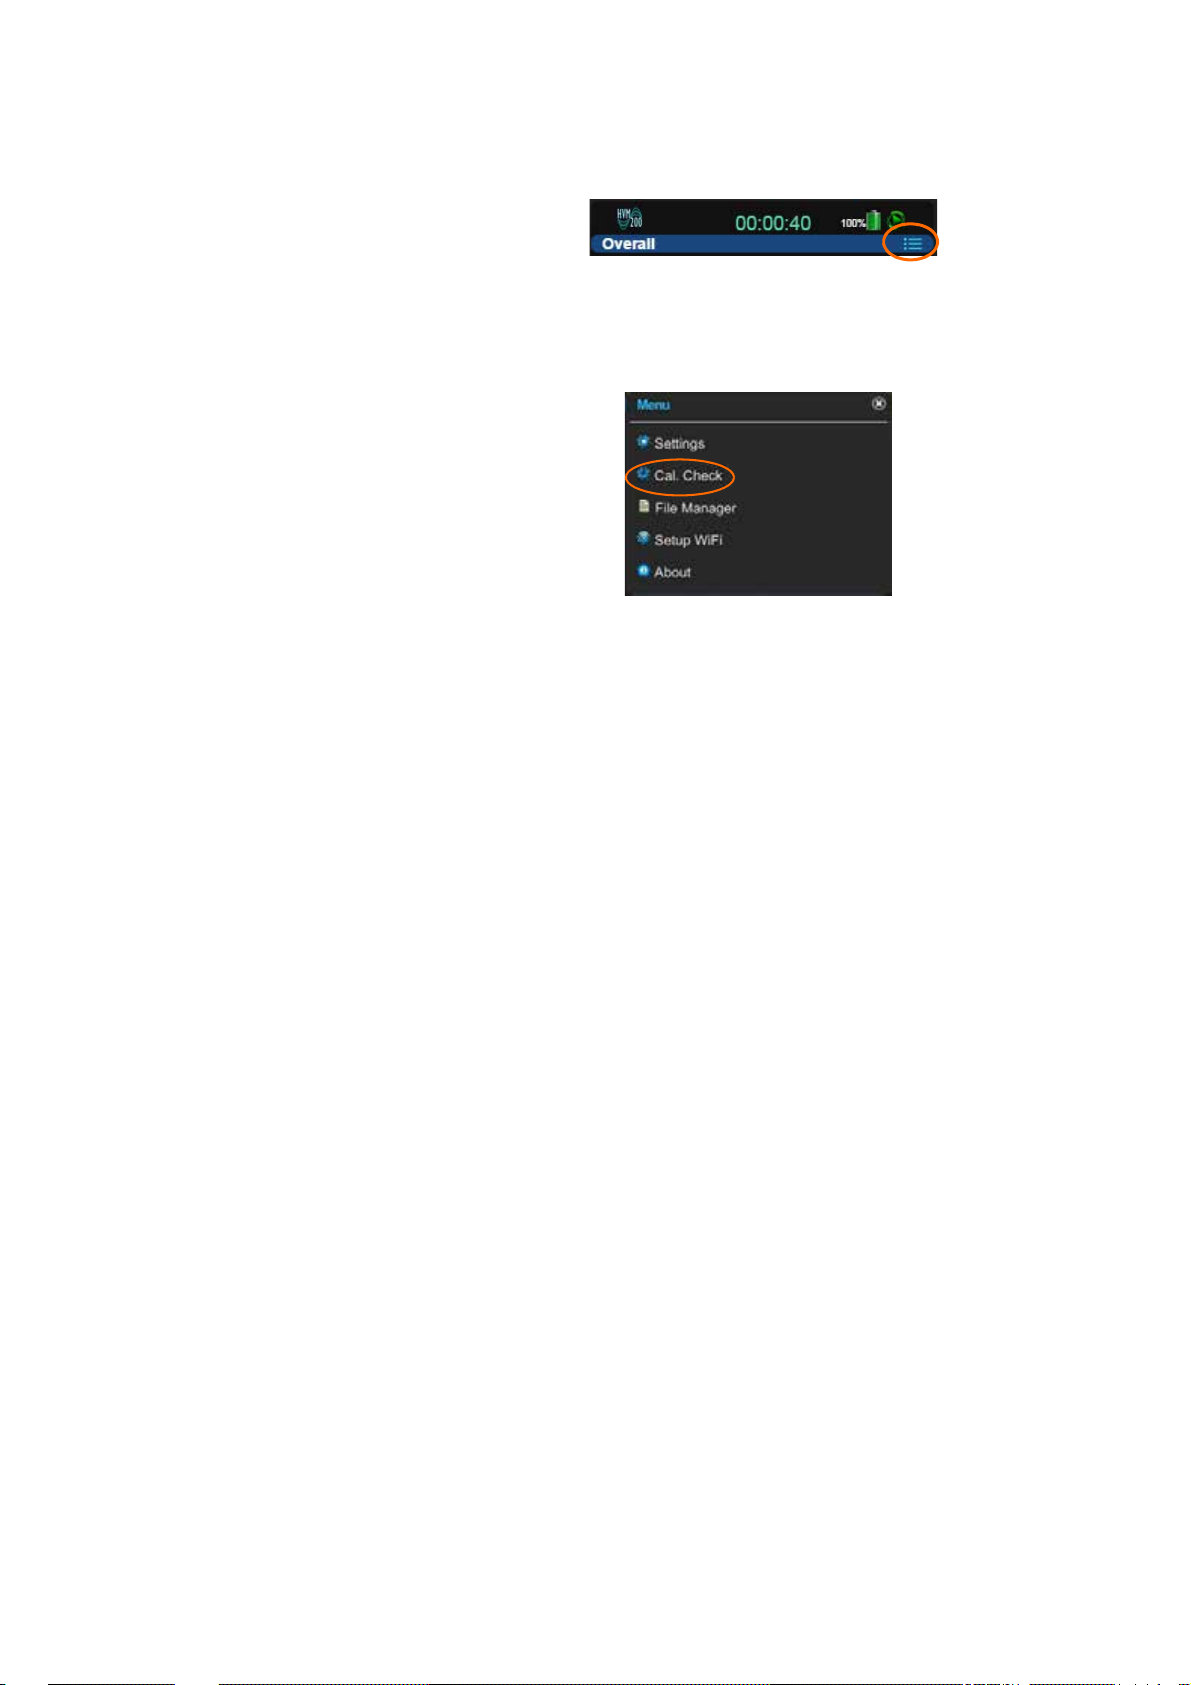
Step 3 Click the Menu icon.
FIGURE 3-1 Menu Icon
TAKE NOTE A calibration can only
be made if the meter is stopped and
currently on Live. Performing a cali-
bration will automatically put the
meter in this state.
Step 4 Click Cal. Check on Menu.
FIGURE 3-2 Cal. Check Option
Step 5 Enter the Reference value for the shaker you will use to per-
form the calibration check and click Set. This value is usu-
ally provided in the shaker reference documentation.
Step 6 Attach the transducer on your shaker so that the axis you
wish to check is oriented properly.
Step 7 Start the shaker and note the a
values for each axis, as
rms
follows:
TAKE NOTE The filter is automati-
cally set to the Fb weighting during
calibration check measurements and
restored when finished.
• Values are gray when level has not been checked.
• Values are white when level is being checked.
• Values are red if the axis measurement is complete and the
level varies from the reference value by more than ± 5%.
• Values are green if the axis measurement is complete and
the level is within ± 5% of the reference value.
Step 8 Repeat the process for each axis on the accelerometer.
HVM200 Reference Manual Setting Up the Measurement 3-2
Page 20
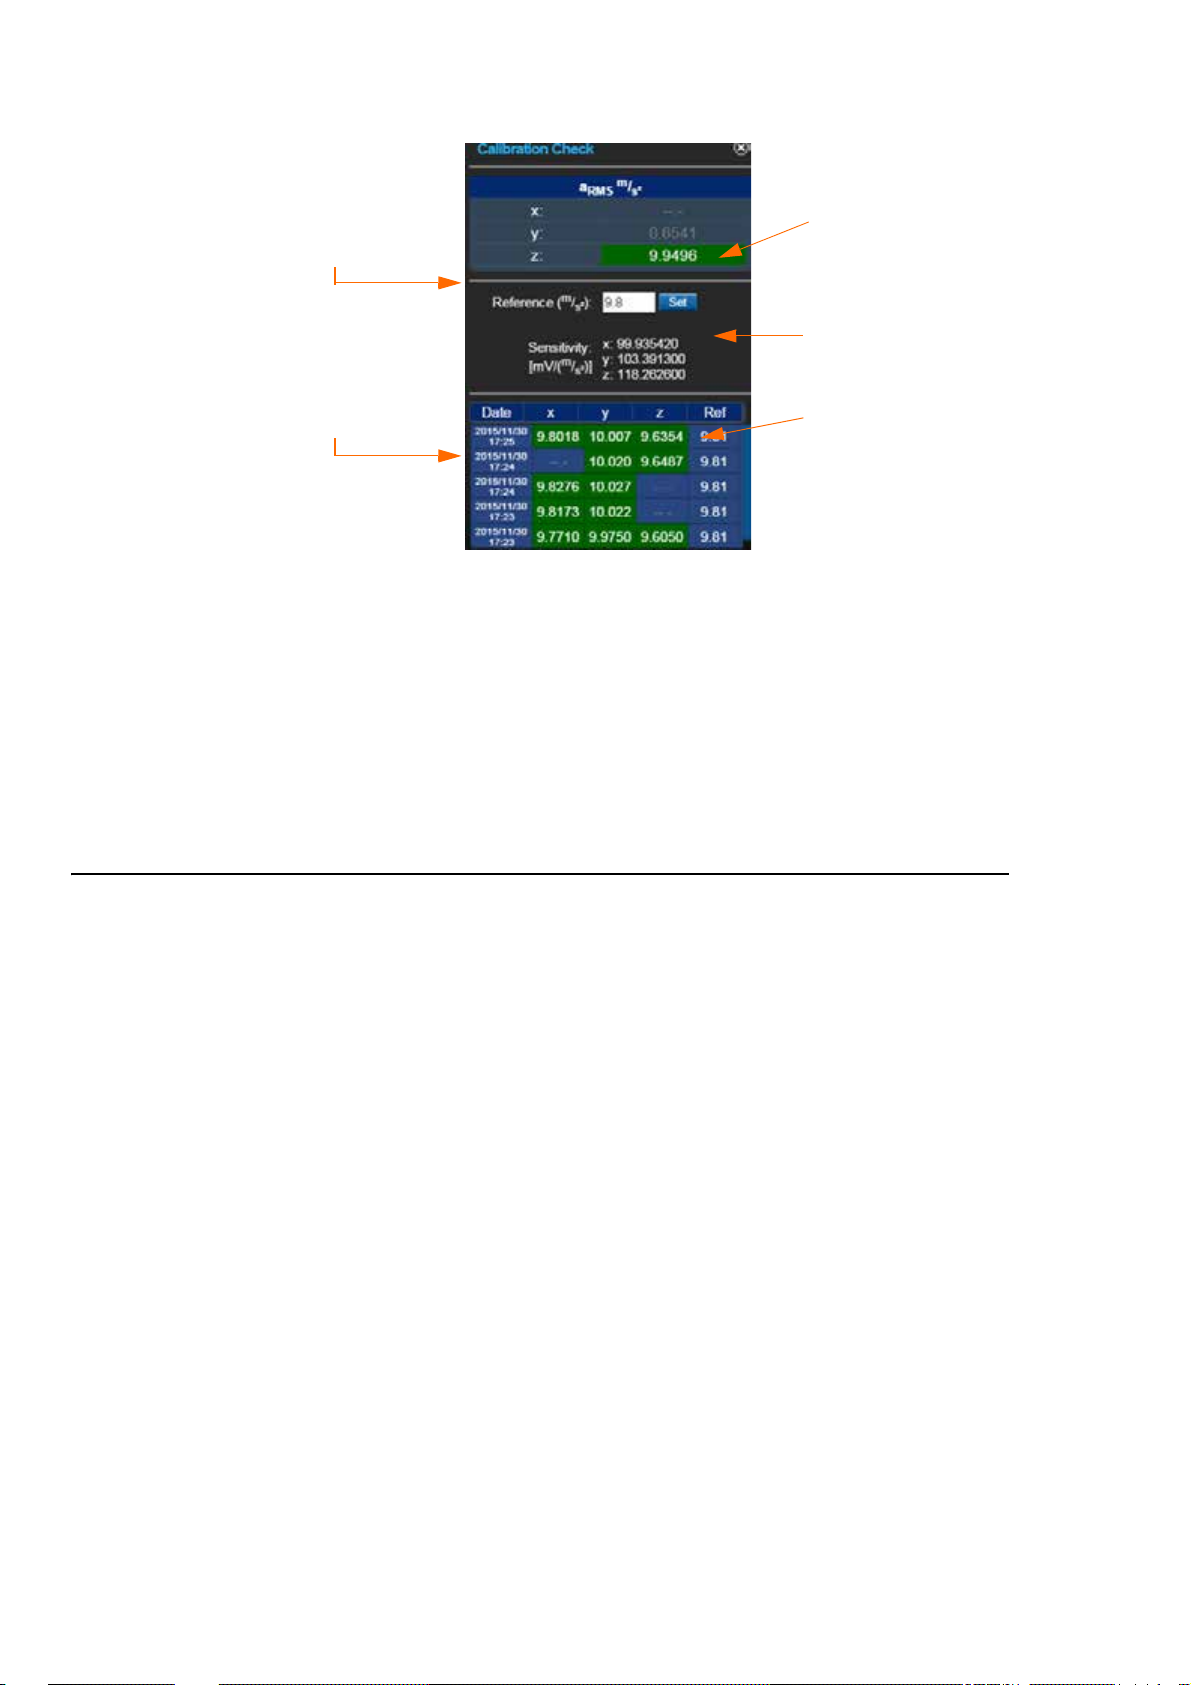
FIGURE 3-3 Calibration Check
Z axis has been
checked and is
within range.
Reference value
from shaker
Shows saved calibration checks
Sensitivity settings
specified in setup
Green indicates values are within range.
LEARN MORE If you are using G4
LD Utility software (optional license
required), the last two saved calibration checks are displayed in measurement spreadsheets. See the G4 LD
Utility Software Manual for more
information.
Step 9 To save the calibration check, close the Calibration Check
dialog box. Saved calibration check information is displayed
at the bottom of the dialog box when it is re-opened.
3.2.2 Selecting a Setup File Using Your Mobile Device
The HVM200 includes nine default setups in its Settings list. These
default setups correspond to settings typically used for different methods
of measurement.
You can also create new setup files on the Settings list. To create a new
setup file, follow these steps:
Name the Setup File
TRY THIS The easiest way to create
a new setup file is to modify an existing default setup and save it with a
different name.
Step 1 Tap the menu icon on the HVM200 app and then tap Set-
tings.
Step 2 Press and hold your finger on a default Setup File in the Set-
tings list. Select Save As and specify the setup name.
HVM200 Reference Manual Setting Up the Measurement 3-3
Page 21

FIGURE 3-4 Name the Setup File
TAKE NOTE If you return to the
Setup Manager tab from a settings
tab, you are prompted to save set-
tings. Click Yes to apply the changes
to the setup.
Step 3 Find and click the setup file you just created by scrolling
down the list. The list now displays a report icon next to
your new setup file.
FIGURE 3-5 Select New Setup File
Set Operating Mode, Interval Time, and Weighting
TAKE NOTE The interval time val-
ues represent the span that data is
collected, averaged, and stored
before starting a new sample.
Step 4 Use the bottom right arrow to move to the Setup tab, specify
any changes to your settings and select the Store Raw Data
option if you have it installed and need it for your post-mea-
surement analysis. The Store Raw Data option will greatly
increase the amount of memory required to store the mea-
surement. Click Save.
The supplied HVM200 memory card can store individual file sizes up to 2
GB and more than 6 hours of measurements with the Store Raw Data
option enabled. When not enabled, the card can store approximately 8000
hours of measurements.
HVM200 Reference Manual Setting Up the Measurement 3-4
Page 22
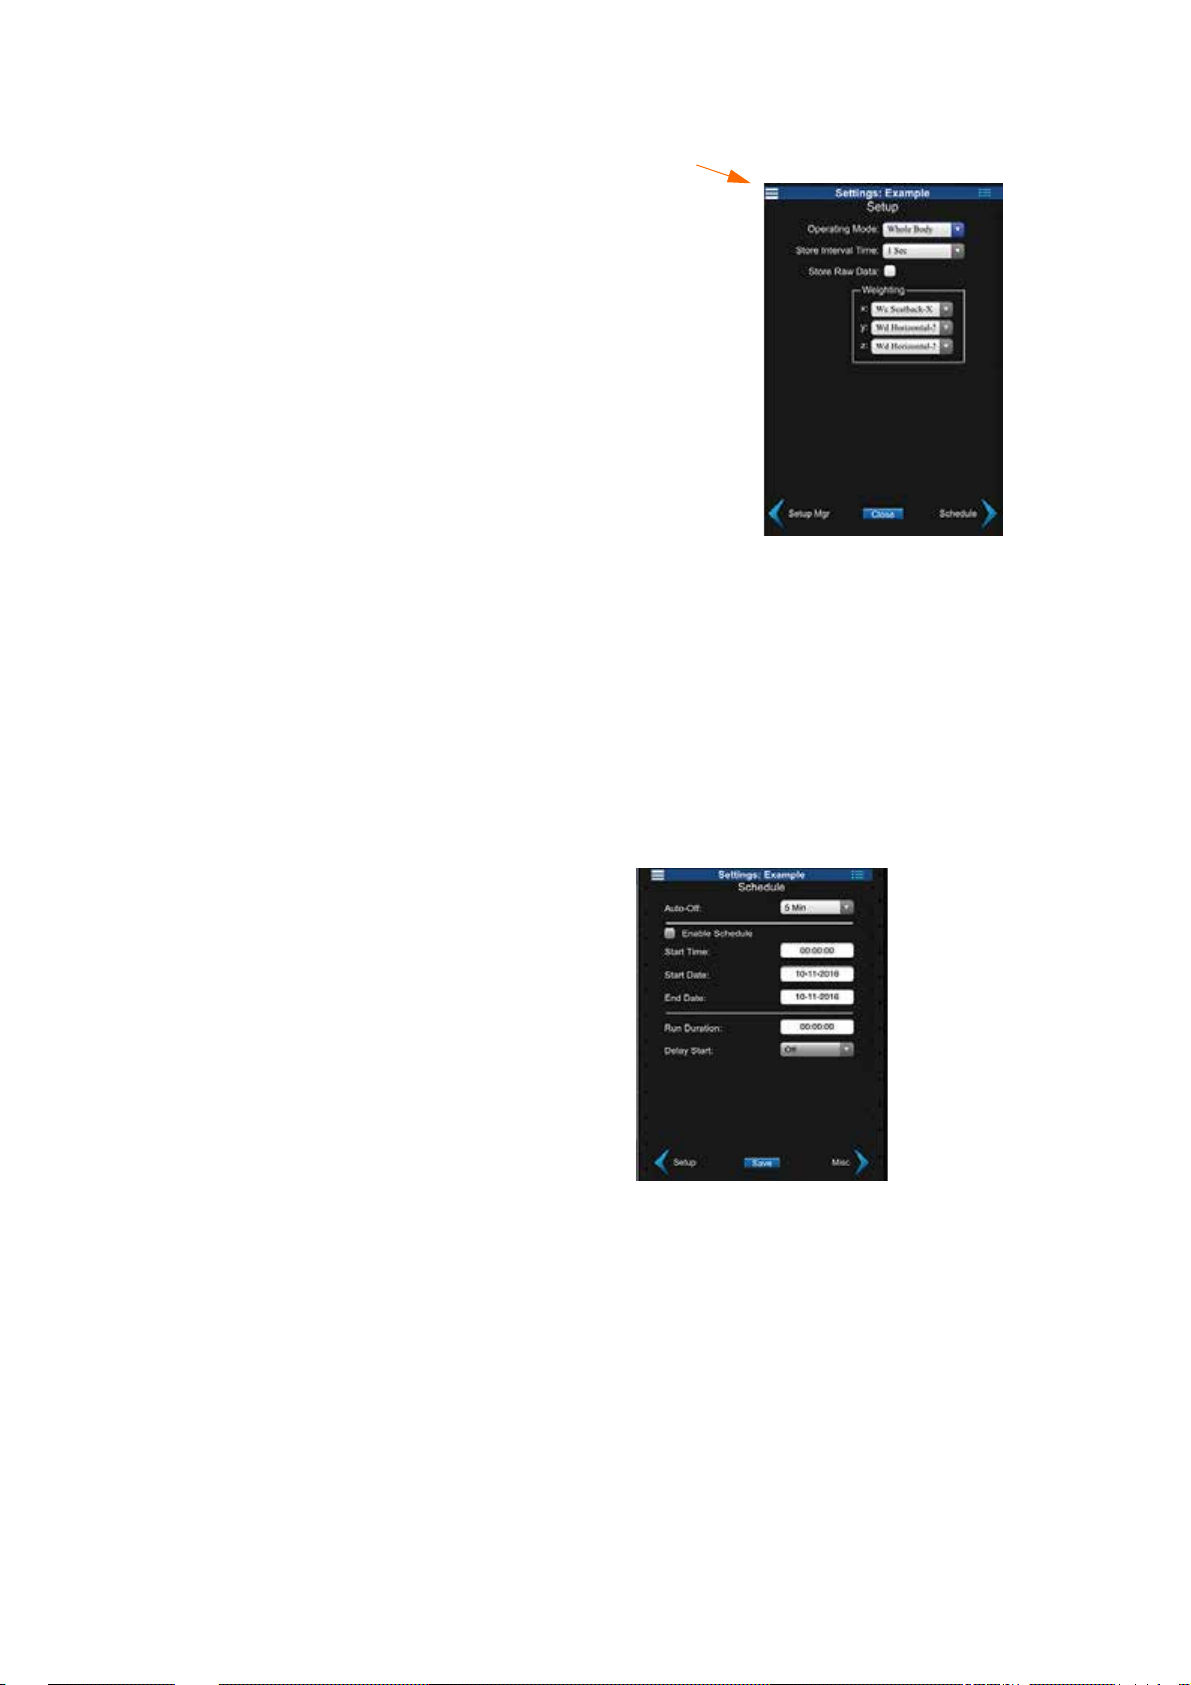
TAKE NOTE The Wh weighting is
This is the Setting
Menu which will
allow you to jump
to any of the settings options at
anytime.
automatically specified for all axes
with the Hand/Arm mode. For more
information on operating mode
options and weighting curves,
“Specifications” on page A-1.
Set Measurement Schedule
FIGURE 3-6 Operation Settings
TAKE NOTE When run duration is
set to 00:00:00 the HVM200 will run
until manually stopped. If the run
duration is set to any other time, the
HVM200 will automatically stop
after acquiring data for the selected
amount of time.
TAKE NOTE If a manual measure-
ment overlaps with the Start Time of
a scheduled measurement, the scheduled measurement will not start until
the manual measurement has stopped
and any specified delay has passed.
Step 5 If needed, schedule the HVM200 to take a measurement
automatically by selecting the Enable Schedule option on
the Schedule tab. Specify the Start Time, Start Date, End
Date, and Duration. Specify a Delay Start, if needed.
FIGURE 3-7 Schedule Settings
TAKE NOTE Auto-Off is the
amount of time the HVM200 will
remain fully powered if it is not taking a measurement. If a measurement
occurs, this time will reset.
Set OBA Time History, Decibel Reference, and Exposure Settings
Step 6 On the Misc tab, select 1/1 Octave or 1/3 Octave to include
octave band analysis in your measurement data, if you have
the options installed.
HVM200 Reference Manual Setting Up the Measurement 3-5
Page 23
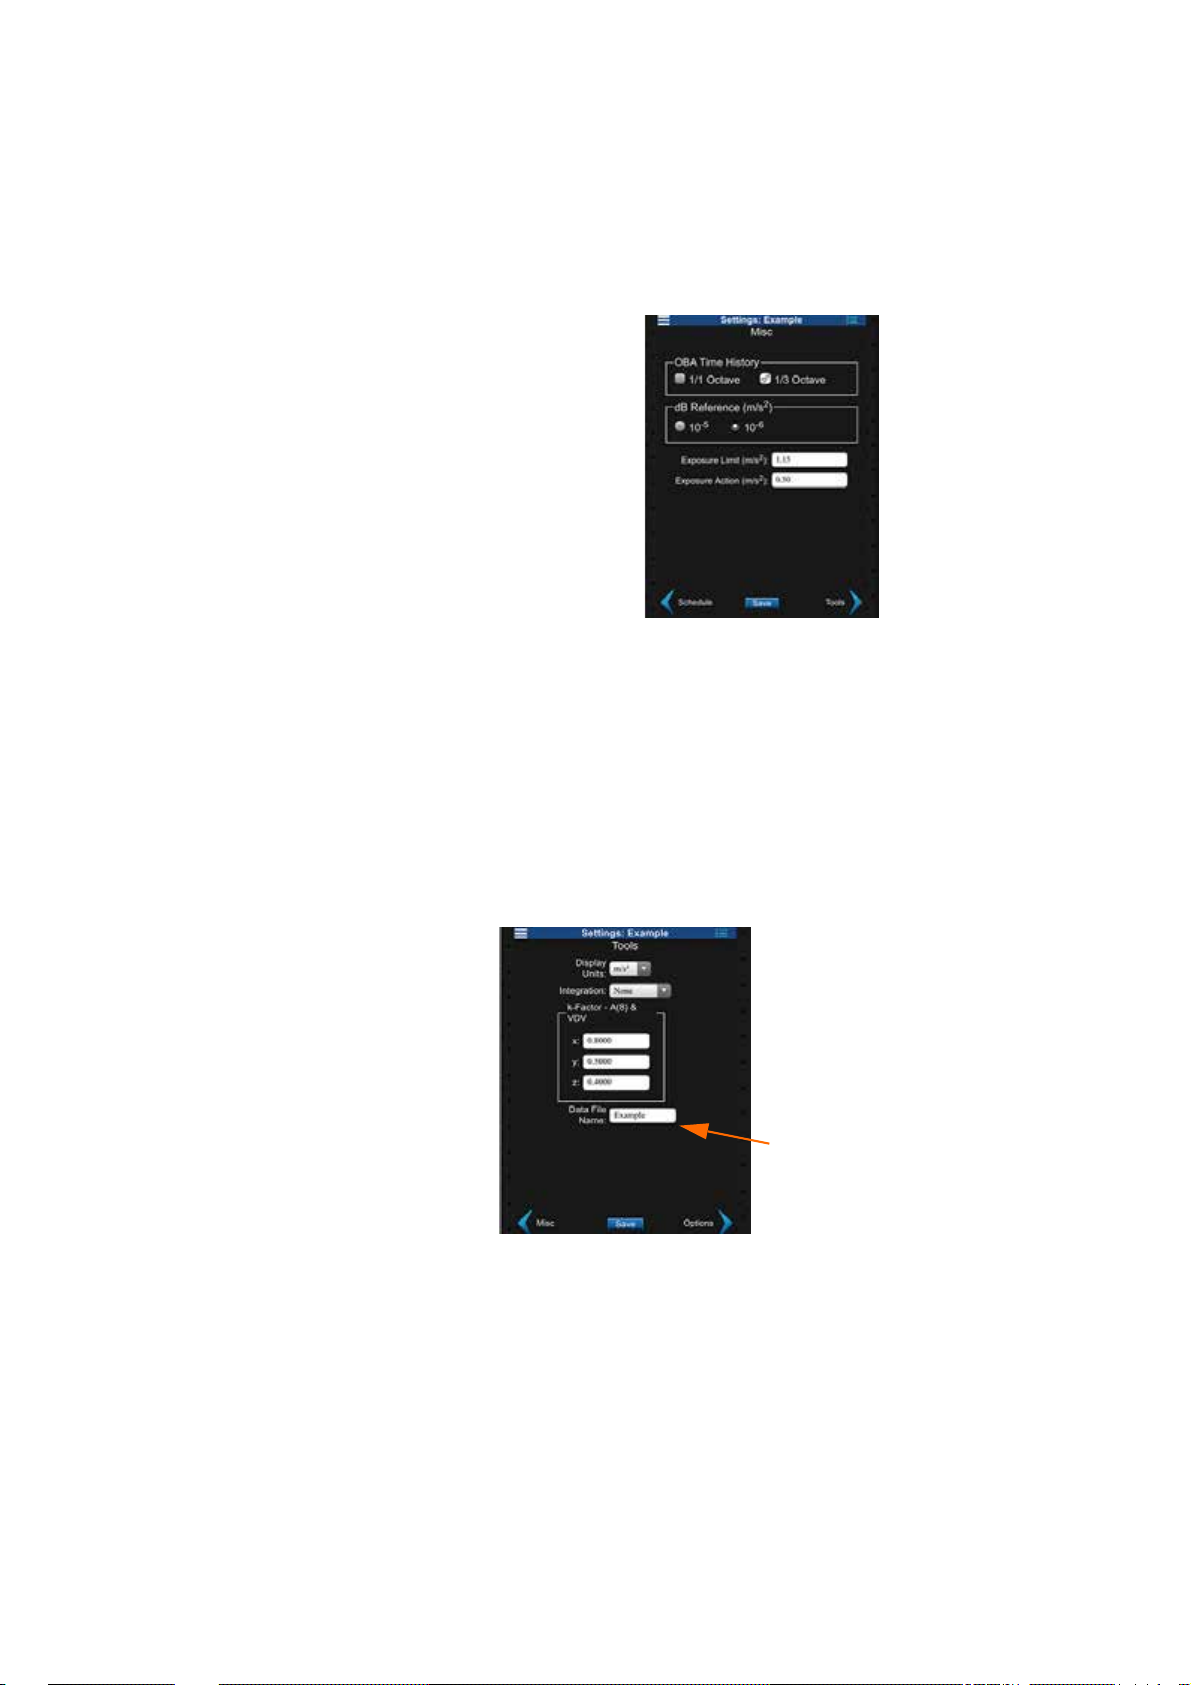
TAKE NOTE Single and double inte-
The data files for this
Setup will be saved with
this name as a pretext
gration are not allowed when display
units are set to dB.
Step 7 If you plan to choose dB reference units as the Display
Units (Tools tab), select 10-5 or 10-6 as the dB Reference on
this tab; otherwise this selection is ignored.
Step 8 Specify the Exposure Limit and Exposu re Action.
TAKE NOTE The exposure settings
show default values according to the
EU Physical Agents Directive (2002/
44/EC) but can be modified according to differing standards or needs.
Choose Tools Settings
TAKE NOTE Single integration cal-
culations convert acceleration values
into velocity values; double integration converts acceleration values into
displacement values.
FIGURE 3-8 Misc. Settings
Step 9 On the Tools tab, choose the Display Units and Integration
method. Specify the k-Factor for each axis and type a Data
File Name. Click Save.
TAKE NOTE For whole body mea-
surements, the HVM200 multiplies
the specified k-Factor by the instan-
taneous acceleration for each axis to
produce the summation (value in
the Overall view of the app. K-factors are ignored for general vibration
and hand/arm measurements. See
“Glossary of Terms” on page C-1.
Verify Sensor Settings
FIGURE 3-9 Tools Settings
If you are using an accelerometer with TEDS capability, the Sensor tab
on the HVM200 settings (displaying serial number) are automatically
specified. If your accelerometer does not have TEDS capability and you
have not already specified the settings, refer to the section “Connecting
the Accelerometer” on page 2-9.
HVM200 Reference Manual Setting Up the Measurement 3-6
Page 24

Verify Installed Options
If you have purchased Octave Band Analysis or Raw Data options, click
the Options tab and verify that they are displayed and selected in the list.
You can deselect this feature temporarily if given measurement does not
require the data.
3.3 Making the Measurement
To make the vibration measurement:
1. Position the HVM200 meter and accelerometer.
2. Start the measurement.
3. Observe data.
4. Stop and annotate the measurement.
The following sections describe these steps in more detail.
3.3.1 Position for Hand/Arm Vibration
For Hand/Arm vibration measurement, follow these steps:
Step 1 Attach the Larson Davis CCS048 Arm Band on the person
being monitored. The end with the transparent cover should
be the farthest from the hand.
Step 2 Insert the HVM200 into the arm band so that the accelerom-
eter connector is nearest the hand.
Step 3 Connect the accelerometer to the HVM200.
TAKE NOTE Refer to see “Mechani-
cal” on page B-1.
Step 4 Attach the accelerometer to an appropriate adapter and place
it so that the vibration that is coupled to the hand can best be
measured.
3.3.2 Position for Whole Body Vibration with Seat Adapter
For whole body vibration measurements using the Larson Davis SEN027
Seat Adapter, follow these steps:
TAKE NOTE The Seat Adapter is
sold with the SEN027 accelerometer
already housed within the adapter
and with the cable already connected
to the accelerometer.
Step 1 Place the seat adapter in the location where the person being
monitored will sit.
Step 2 Connect CBL217-01 to the HVM200 on one end and the
seat adapter cable on the other end.
Step 3 Set the HVM200 meter in a secure location, where it will not
fall from its position.
HVM200 Reference Manual Making the Measurement 3-7
Page 25
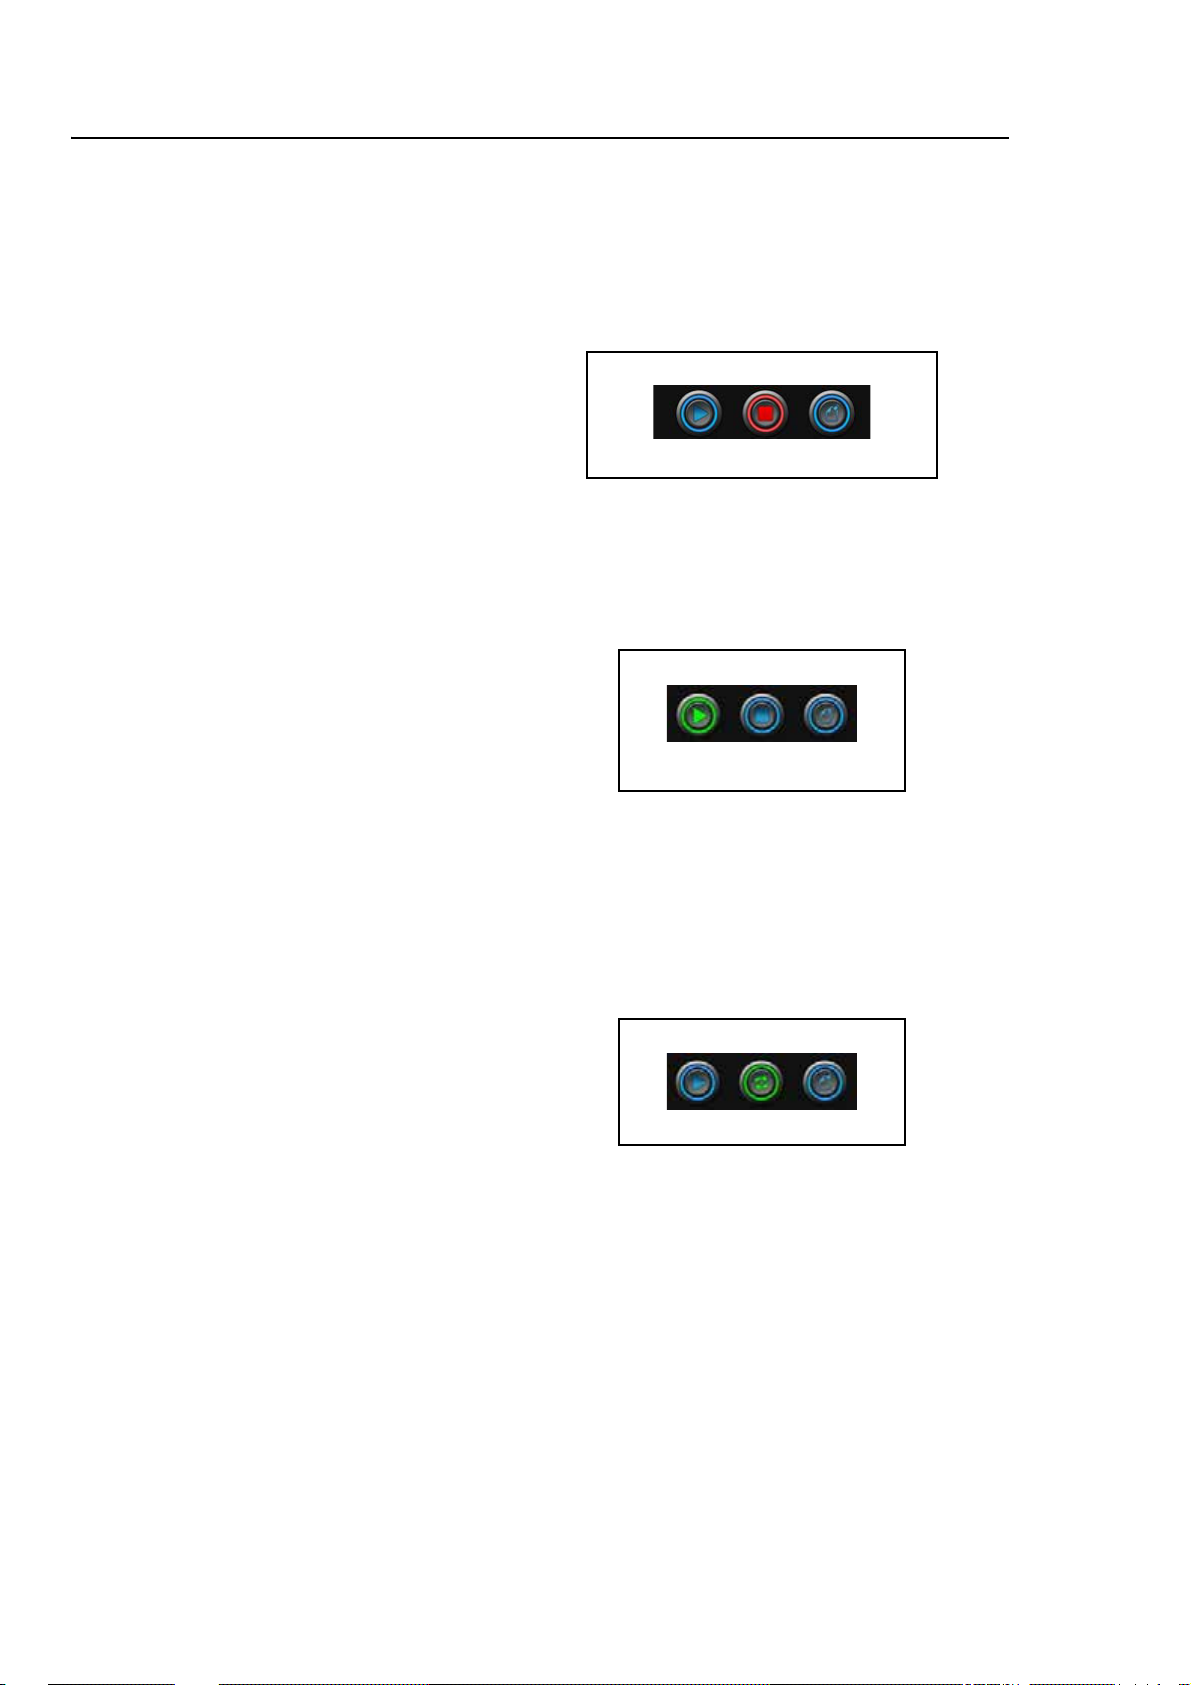
3.3.3 Start/Stop the Measurement
Run Stop
Annotate
Running
Stop
Run Live
Start Measurement
TRY THIS You can also start the
measurement manually by pushing
the power button on the HVM200 for
at least one second after it is stable
(or after the Status LED is red), see
“Power Button Operation” on
page 2-3.
Stop Measurement
Click the Run button that appears on the HVM200 Control app or G4 LD
Utility.
FIGURE 3-10 Meter is stopped
Click the Stop button.
FIGURE 3-11 Meter is running measurement
View Live Data
Observe Data
TRY THIS Alternatively, you can
also schedule measurements auto-
matically on the Schedule tab if you
do not need to observe them.
While meter is stopped and not taking a measurement, click the red Stop
button. A green Live button will appear. To return to stop, press Live
again.
FIGURE 3-12 Viewing Live Data & Meter is stopped
The HVM200 Control app provides the following data displays:
•Overall
• Summation
• X-axis
• Y-axis
• Z-axis
To advance from one data display to the next, click the Next Arrow. To
enlarge a data display, click the Zoom button.
HVM200 Reference Manual Making the Measurement 3-8
Page 26
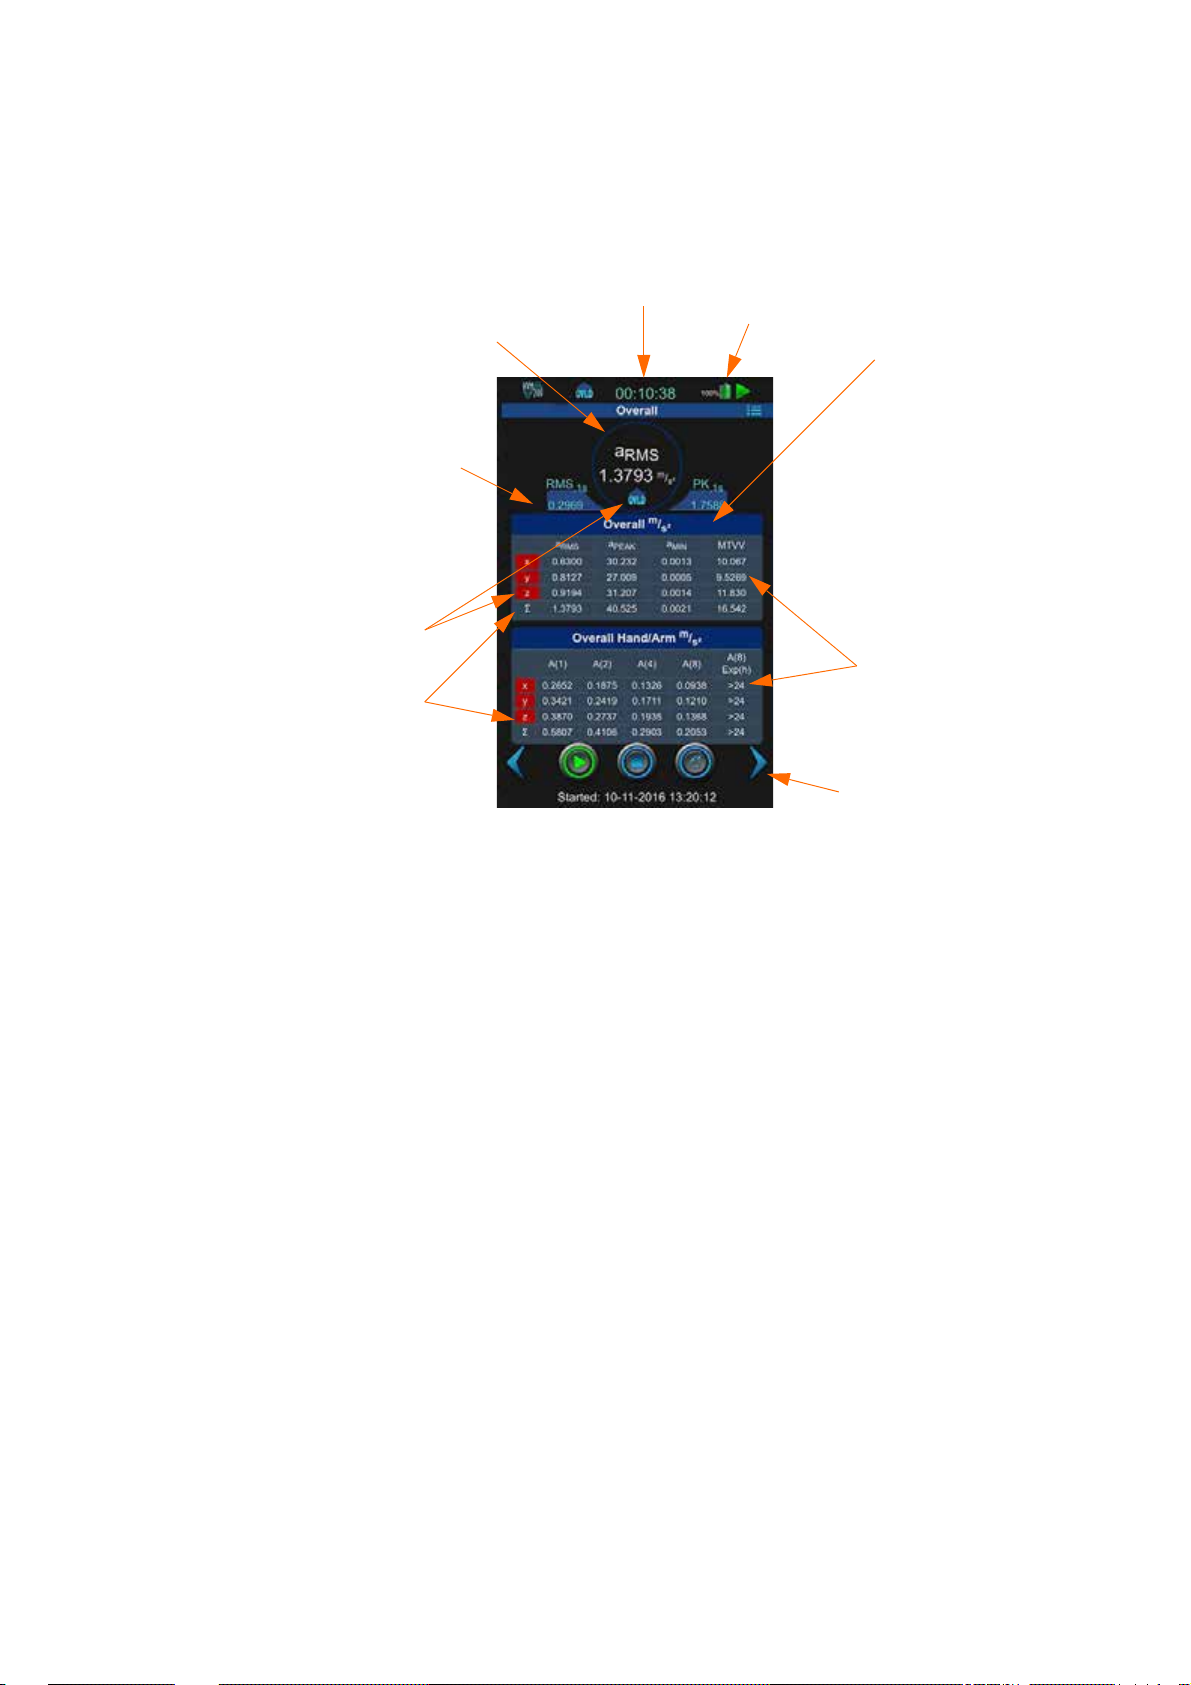
The Overall display shows cumulative data for all three axes and their
Current overall root mean
square (RMS) vibration value
according to specified units.
Measurement
Duration Clock
RMS value from the previous second
Overloaded Indicators
Values for each axis
Summation values
Next data display arrow
Battery
Status
RMS: Root mean
square value
PEAK (PK):
Highest instantaneous value
MIN: Lowest
value
MTVV: Maxi-
mum Transient
Vibration Value
summation for the measurement.
FIGURE 3-13 Overall Data Display
MIN and MTVV are the minimum and maximum whole body and hand/
arm values of the vibration signal with a one second exponential time
weighting. MIN and MAX are the minimum and maximum general
vibration values.
represents the summation of vibration values taken from the X, Y, and Z
axes.
The Summation display provides a real-time graphical representation of
the current summed values from all three axes.
HVM200 Reference Manual Making the Measurement 3-9
Page 27
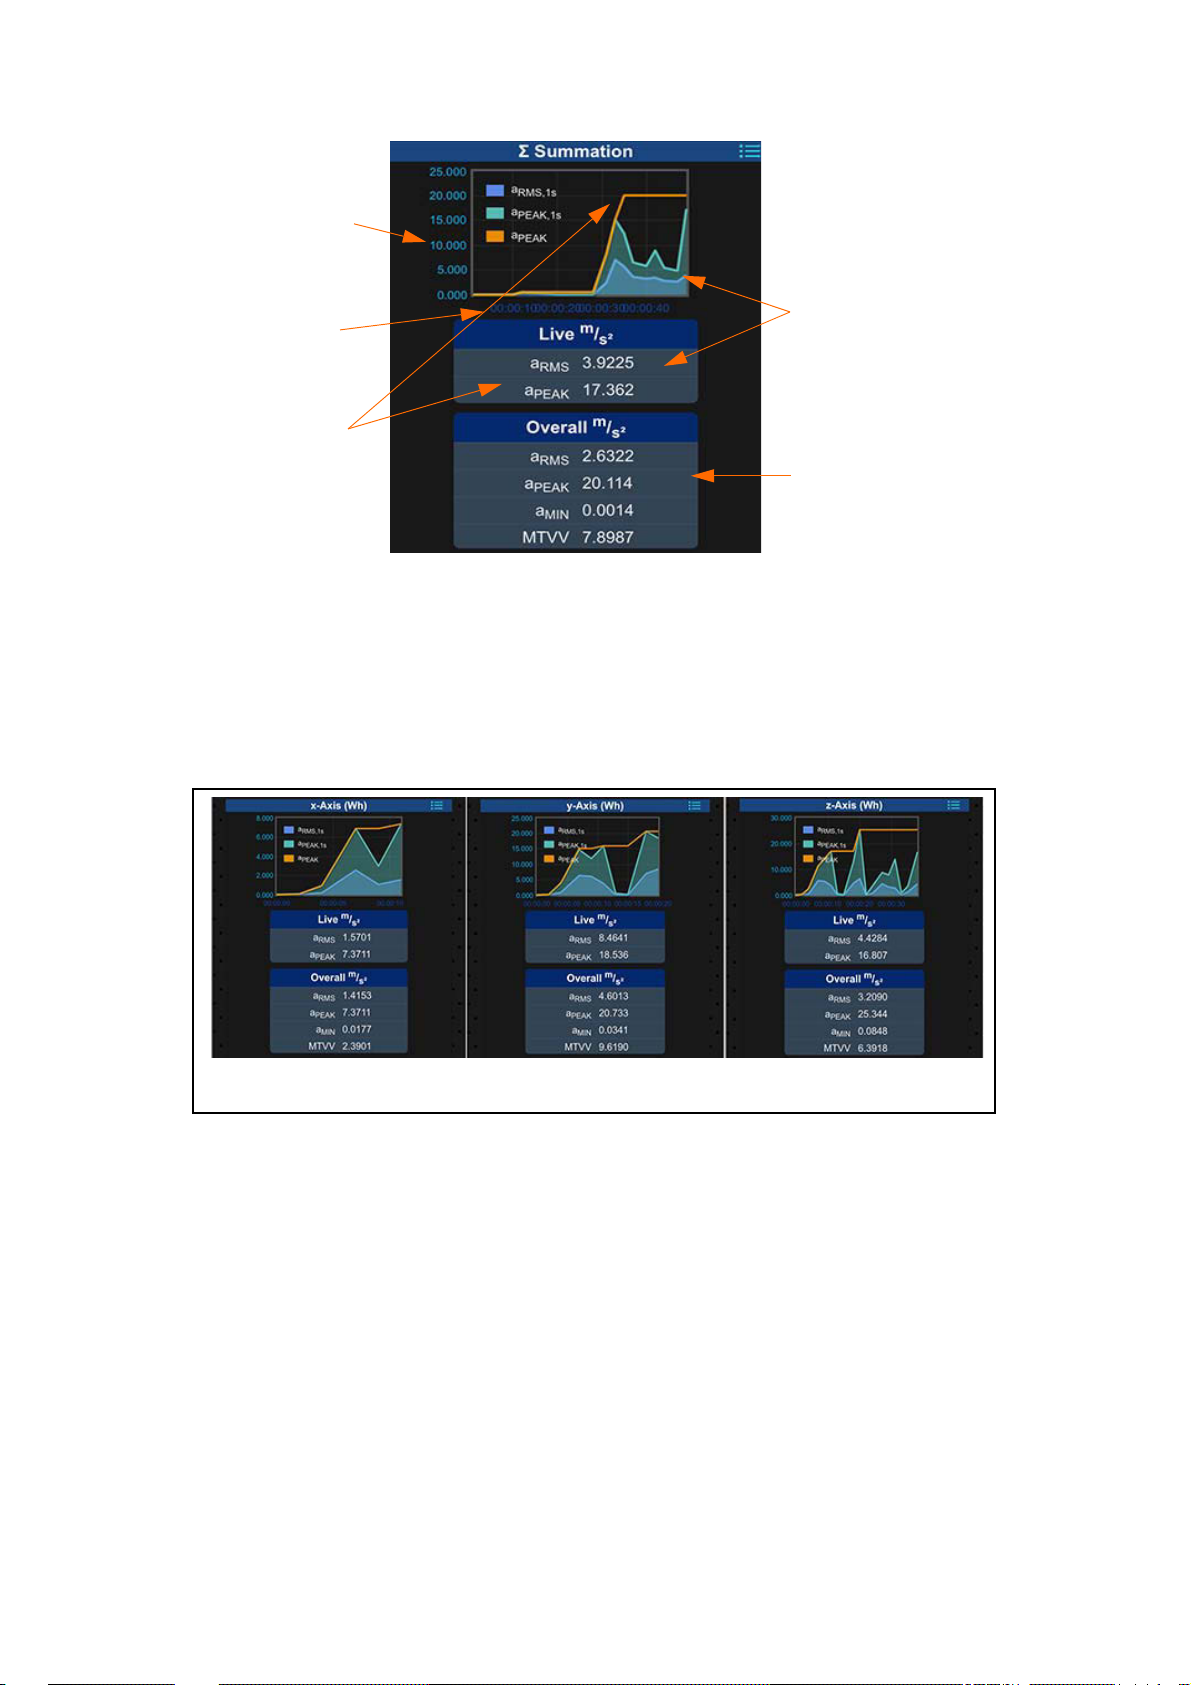
FIGURE 3-14 Summation Data Display
Vibration values according to specified units
Measurement Time
Current a
RMS
value
Current a
PEAK
value
Overall measurement data
X
Y
Z
For more information on summation values, including Vibration Dose
Value (VDV) and the daily vibration exposure value over eight hours
A(8), see the "Glossary" on page C-1.
The Axes displays provide real-time graphical and tabular representations
of current and overall values for each axis, similar to Figure 3-14.
FIGURE 3-15 X, Y, and Z Axes Data Displays
Overload and Under-range Indicators
Overload
LEARN MORE For information on
overload indications on the Status
LED, see “Operational Characteristics” on page A-4.
An overload occurs when the signal from the accelerometer exceeds the
input range of the meter.
HVM200 Reference Manual Making the Measurement 3-10
Page 28

FIGURE 3-16 Overload Indicators
Indicates an overload has occurred on one or
more axes in current measurement
Red background
shows overload for
each axis.
Gray background
shows under-range
condition for the Y
and Z axes.
Under-range
An under-range occurs when the signal from the accelerometer is below
the input range to the point it cannot be measured accurately.
Annotate the Measurement
FIGURE 3-17 Under-range Indicators
Click the Annotate button and type a note to include with the measurement (you do not need to stop the measurement to annotate).
FIGURE 3-18 Annotate Button
HVM200 Reference Manual Making the Measurement 3-11
Page 29

TAKE NOTE An annotation note
may be made before the measurement is started and will be added as
an overall measurement note; only
one such note may be applied to the
measurement, but it can be overwritten if needed.
FIGURE 3-19 Annotate Measurement
3.4 Downloading Data
Once you have clicked the Stop button and the measurement is com-
pleted, you can download and work with data by using any of the following methods:
TAKE NOTE Refer to the G4 LD
Utility Manual for information on
downloading and viewing data with
G4.
LEARN MORE For tips on working
with raw data, see see “Working with
RAW Data Files” on page 3-12
• Download and view .hvm2 files in G4. The HVM functionality in
G4 requires a license.
• Download raw data files. You also need to specify storing data
with this option on the Setup tab during measurement setup. See
"Selecting a Setup File Using Your Mobile Device" for more
information.
• Use a third-party tool. Because .hvm2 files are stored in JavaS-
cript Object Notation (JSON) format, you can copy the data file
from the removable SD memory card and work with it in any tool
compatible with the format.
3.4.1 Working with RAW Data Files
RAW data files can be created with each measurement, if the Setup File
has checked “Store Raw Data” on the Setup Tab, see “Figure 3-6 Operation Settings” on page 3-5.
While HVM200 is connected to G4, a RAW file can be downloaded from
the Data Manager tab. The file will always be larger than an HVM file.
FIGURE 3-20 Raw Data File
HVM200 Reference Manual Downloading Data 3-12
Page 30

The raw data file is a binary file that contains raw data samples in a float
format for the x, y, and z axes after sensitivity has been applied. Each
sample contains 12 bytes in the following format:
Byte 01234567891011
Definition X Axis Sample Y Axis Sample Z Axis Sample
The byte order within each float is little endian.
TAKE NOTE The resulting data will
be in acceleration, which is the standard method of displaying the data,
and will need to be integrated into
velocity or displacement if needed.
In order to work with a RAW file, you will need MATLAB, GNU Octave,
or similar program. The following script can be used to parse the data.
The file name will need to be adjusted to match the file name of your
RAW file. After parsed, "Weighting Filters for Raw Data" to adjust
weighting filters for hand arm or whole body vibration purposes.
%% Example Matlab / GNU Octave code for parsing HVM200 raw data format
close all; clear all; clc;
%% Number of Samples to read
Sample_Rate = 7161.45833;% Hz (Hard wired sample rate)
Sample_Time = 10; %second
num_samples_to_read = Sample_Rate*Sample_Time;
%% Open file, Read, Close
%% filename = 'HVM_SERIAL_NUMBER_BASENAME_DATESTAMP.00.raw';
filename = 'HVM_0000056_HVMD_151216_180801.00.raw';
rawsavename = 'HVM_0000056';
filteredsavename = 'HVMFilt_0000056';
FID = fopen(filename,'r');
A = fread(FID,[num_samples_to_read*3],'float');
fclose(FID);
%% Build Axis data
axis_counter = 1;
x_axis = zeros(1,floor(num_samples_to_read));
y_axis = zeros(1,floor(num_samples_to_read));
z_axis = zeros(1,floor(num_samples_to_read));
x_axis = A(1:3:end);
y_axis = A(2:3:end);
z_axis = A(3:3:end);
%% Remove DC bias from data (optional)
x_axis = x_axis - mean(x_axis);
y_axis = y_axis - mean(y_axis);
z_axis = z_axis - mean(z_axis);
HVM200 Reference Manual Downloading Data 3-13
Page 31

%% Plot
figure(1);
plot(x_axis,'-b');
hold on;
plot(y_axis, '-r');
plot(z_axis, '-k');
hold off;
legend('x','y','z');
title('HVM200 Data');
save(rawsavename,'x_axis','y_axis','z_axis','Sample_Rate','Sample_Time')
;
%% Further processing through ISO 8041 Wk filter
x_axis_filt = isofilwk(x_axis, Sample_Rate);
y_axis_filt = isofilwk(y_axis, Sample_Rate);
z_axis_filt = isofilwk(z_axis, Sample_Rate);
figure(2);
plot(x_axis_filt,'-b');
hold on;
plot(y_axis_filt, '-r');
plot(z_axis_filt, '-k');
hold off;
title('HVM200 Data with Wk filter');
legend('x','y','z');
save(filteredsavename,'x_axis_filt','y_axis_filt','z_axis_filt','Sample_
Rate','Sample_Time');
Weighting Filters for Raw Data
The "isofilwk()" function comes from sample code taken from the ISO
8041 standard, and can be modified for other weighting filters using the
desired parameters from Table 3-1 'Parameters and transfer functions of
the frequency weightings (source: ISO 8041)'.
Use the following script and table to adjust RAW data file for hand arm or
whole body vibrations.
isofilwk() Sample Code (ISO 8041 standard)
function y = isofilwk(x, fs)
% ISOFILWK
% Filter ISO 8041 Wk
% y = isofilwk(x,fs)
HVM200 Reference Manual Downloading Data 3-14
Page 32

% y output signal, acceleration
% x input signal, acceleration
% fs sampling frequency Hz
% bilinear transformation algorithm is used
f1 = 0.4;
f2 = 100;
f3 = 12.5;
f4 = 12.5;
Q4 = 0.63;
f5 = 2.37;
Q5 = 0.91;
f6 = 3.35;
Q6 = 0.91;
% Note that in the function “butter” the variables Ql and Q2 are
% effectively set to equal to l/sqrt(2), therefore they don't need
% to be explicitly set here.
w3 = 2*pi*f3;
w4 = 2*pi*f4;
w5 = 2*pi*f5;
w6 = 2*pi*f6;
nyq = fs/2; % Nyquist frequency
% determine parameters for band limiting high pass and low pass
[b1,a1] = butter (2,f1/nyq, 'high' ); % High pass
[b2,a2] = butter (2,f2/nyq); % Low pass
% determine parameters for a-v transition
B3 = [1/w3 1];
A3 = [1/w4/w4 1/Q4/w4 1];
[b3,a3] = bilinear (B3, A3, fs);
% determine parameters for upward step
B4 = [1/w5/w5 1/Q5/w5 1]*w5*w5/w6/w6;
A4 = [1/w6/w6 1/Q6/w6 1];
[b4,a4] = bilinear (B4, A4, fs);
% Apply filter to input signal vector x (output to signal vector y)
y = filter (b2, a2, x); % Apply low-pass band limiting
y = filter (b1, a1, y); % Apply high-pass band limiting
y = filter (b3, a3, y); % Apply a-v transition
HVM200 Reference Manual Downloading Data 3-15
Page 33

y = filter (b4, a4, y); % Apply upward step
2
2
2
2
2
2
2
2
2
2
2
2
2
2
2
2
2
2
end
Band-limiting a-v-transition Upward step Gain
Weighting
W
b
W
c
W
d
W
e
W
f
W
h
W
j
W
k
W
m
f
Q1
1
f
Q
2
2
f
3
f
4
Q
4
f
5
Q
5
Hz Hz Hz Hz Hz Hz
0,4
0,4
0,4
0,4
0,08
8/
10
10
0,4
0,4
10
0,1
1/
1/
1/
1/
1/
1/
1/
1/
-
1/
100
100
100
100
0,63
31/
10
10
100
100
100
1/
1/
1/
1/
1/
1/
1/
1/
1/
16 16 0,55 2,5 0,9 4 0,95 1,024
8 8 0,63 ∞ 1 ∞ 11
2 2 0,63 ∞ 1 ∞ 11
1 1 0,63 ∞ 1 ∞ 11
∞ 0,25 0,86 0,0625 0,80 0,10 0,80 1
100/(2π) 100/(2π) 0,64 ∞ 1 ∞ 11
∞∞1 3,75 0,91 5,32 0,91 1
12,5 12,5 0,63 2,37 0,91 3,35 0,91 1
1/(0,028 ×
2π)
1/(0,028 ×
2π)
0,5 ∞ 1 ∞ 11
f
Q
6
6
K
NOTE 1 For weighting Wb, Table A.1 of ISO 2631-4:2001 rounds the value of parameter Q
to 2 decimal
1
places. The parameter specified here is the exact value.
NOTE 2 For weighting Wh, Table A.1 of ISO 5349-1:2001 rounds the values of parameters f1, f2, f3 and f
to 5 significant figures and parameter Q
to 2 decimal places. The parameters specified here are the exact
1
values.
Table 3.1 Parameters and transfer functions of the frequency
weightings (source: ISO 8041)
4
HVM200 Reference Manual Downloading Data 3-16
Page 34

Module4 Changing Features
Select Sync PC
and Meter Clocks
4.1 Overview ...............................................................................................................4-1
4.2 Setting/Syncing Meter Time and Date ..................................................................4-1
4.2.1 Setting/Syncing Time via G4 LD Utility ....................................................4-1
4.2.2 Setting/Syncing Time via HVM200 Control app .......................................4-2
4.3 Turning Off/On WiFi Signal ...................................................................................4-3
4.3.1 Turn Off WiFi Signal .................................................................................4-3
4.3.2 Turn Back On WiFi Signal ........................................................................4-4
4.4 Upgrade Firmware and Options ............................. ... ... .... ... ... ....... ... ... ... .... ... ... ... ..4-5
4.1 Overview
This module provides instructions for setting and disabling features, and
upgrading the HVM200.
4.2 Setting/Syncing Meter Time and Date
The HVM200 has a time feature that allows the meter’s internal clock to
be either manually set or synced with your PC or mobile device.
4.2.1 Setting/Syncing Time via G4 LD Utility
Step 1 Ensure the meter is powered on.
Step 2 Launch G4 LD Utility and connect meter either through
USB cable or IP address.
TAKE NOTE If you don’t see the
Time tab, you may be in a different
setting than Active. Only in the
Active setting can you set or sync the
time.
FIGURE 4-1 Maintenance Tab
Step 3 Navigate Meter ManagerMaintenance.
HVM200 Reference Manual Overview 4-1
Page 35

Step 4 Select Set to use the PC clock as the new time for the meter.
If you uncheck this option, you can set the date and time
manually.
FIGURE 4-2 Date and Time
4.2.2 Setting/Syncing Time via HVM200 Control app
Step 1 Make sure the meter is powered on.
LEARN MORE For more informa-
tion on connecting the HVM200 to
mobile app, see “Connecting the
HVM200 to a Mobile Device” on
page 2-4
FIGURE 4-3 HVM200 Menu
TAKE NOTE If you don’t see the
Time tab, you may be in a different
setting than Active. Only in the
Active setting can you set or sync the
time.
Step 2 Launch app and connect the HVM200 meter to your device
using an Access Point or WiFi network.
Step 3 Navigate MenuSettings.
Step 4 In the new HVM screen, select the upper left Menu icon,
then choose Time.
HVM200 Reference Manual Setting/Syncing Meter Time and Date 4-2
Page 36

FIGURE 4-4 HVM200 Time Tab
Menu Icon
Step 5 There are two options:
• Set Time: Tap the inside of the time and data fields, edit by
hand what time you want the meter to be, then select Set
Time.
• Sync Time: Select this button to sync the time on your
meter with the time on your mobile device.
4.3 Turning Off/On WiFi Signal
4.3.1 Turn Off WiFi Signal
To disable WiFi signal completely from the HVM200 meter, follow these
steps:
CAUTION You will only be able to
turn the WiFi signal back on from G4
LD Utility with meter connected via
USB.
Step 1 Launch the HVM200 Control app or the G4 LD Utility Live
Stream view.
Step 2 Click the menu icon.
FIGURE 4-5 HVM200 App
Step 3 On the HVM200 Menu, select Setup WiFi.
HVM200 Reference Manual Turning Off/On WiFi Signal 4-3
Page 37

FIGURE 4-6 WiFi Setup
Power button
Power button
Step 4 Click on the power button.
FIGURE 4-7 Network Settings
Step 5 An Alert will appear. Select Confirm. WiFi is now disabled.
4.3.2 Turn Back On WiFi Signal
To turn the WiFi signal back on from the HVM200 meter, follow these
steps:
Step 1 Connect HVM200 via USB cable to PC, launch G4 LD Util-
Step 2 From the Setup WiFi screen, click the red power symbol in
FIGURE 4-8 Network Settings
ity and connect meter, see “Connecting HVM200 to G4 LD
Utility” on page 2-8.
the upper left side
Step 3 An Alert will appear, click Confirm.
Step 4 A reboot is required to turn the WiFi back on, so you can
select the Reboot button or manually turn off the meter
HVM200 Reference Manual Turning Off/On WiFi Signal 4-4
Page 38

FIGURE 4-9 Reboot Button
Reboot
Button
To disconnect meter, click this ×
Step 5 A dialogue box will appear. Select Confirm.
Step 6 A second alert will appear. Wait 30 seconds.
Step 7 The meter will lose connection to G4 LD Utility.
Step 8 Reestablish connection.
4.4 Upgrade Firmware and Options
To upgrade firmware and install optional firmware, follow these steps:
Step 1 Make sure the meter is powered on.
Step 2 Launch G4 LD Utility and connect the HVM200 meter to
your PC. see “Connecting HVM200 to G4 LD Utility” on
page 2-7
Step 3 If you meter is connected to G4 LD Utility, disconnect by
clicking on the × on the tab of your meter.
FIGURE 4-10 Disconnect Meter
Step 4 From G4, navigate FileUpgrade Firmware or
Options.
Step 5 Choose meter, then select Connect.
Step 6 In this dialogue box you can check Firmware or Options,
then press button for Choose Firmware File (or Choose
Options File if you checked “Options”.
HVM200 Reference Manual Upgrade Firmware and Options 4-5
Page 39

FIGURE 4-11 Upgrade Firmware
Step 7 Open selected file.
Step 8 Press button for Upload Firmware (or Upload Options). A
success message will appear, close out window.
HVM200 Reference Manual Upgrade Firmware and Options 4-6
Page 40

Appendix A Specifications
A.1 General Characteristics ........................................................................................ A-1
A.1.1 Time History (Logging) ........................ ... ... ...... .... ... ... ... .... ... ... ... .... ... ... ... . A-2
A.1.2 Run Modes .............................................................................................. A-2
A.1.3 Clock/Calendar ...... .................... ................ ................... .................... ....... A-2
A.1.4 Effects of Magnetic Fields ....................................................................... A-2
A.1.5 Effec ts of Mechanic al Vibrat ions ......................................... ... ... .............. A-2
A.1.6 Stabilization Time ................... ... ... ... .... ... ... ... ........................................... A-3
A.1.7 Data Storage ........................................................................................... A-3
A.1.8 Transducer Electronic Data Sheets (TEDS) Support .............................. A-3
A.2 Physical Characteristics ......................................................................... .... ... ... ... . A-3
A.2.1 Dimensions/Weight ................................................................................. A-3
A.2.2 Communication Interface .................... ... ... ... ... .... ... ...... .... ... ... ... .... ... ... ... . A-3
A.2.3 Connections ............................................................................................ A-3
A.3 Operational Characteristics .................................................................................. A-4
A.3.1 LED Indications ....................................................................................... A-4
A.4 Electrical Characteristics ...................................................................................... A-5
A.4.1 Power Consumption ............... ... ... ... .... .................................................... A-5
A.4.2 Power Supply ............................................... ... .... ... ................................. A-5
A.4.3 Electrical Testing ..................................................................................... A-6
A.4.4 Input ........................................................................................................ A-6
A.5 Reference Values ................................................................................................. A-7
A.6 Measurement Ranges ...................................................... ... ................................. A-8
A.7 Frequency Weighting Curves ............................................................................... A-8
A.8 Frequency Weighting Tables .............................................................................A-13
A.9 Integration Weighting Limits ................................................................... .... ... ... .. A-23
A.10 1/1 & 1/3 Octave Band Filters ............................................................................ A-29
A.10.1 OBA Compliance ................................................................................... A-29
A.10.2 OBA General Specifications .................................................................. A-30
A.10.3 1/1 OBA Filter Responses ..................................................................... A-30
A.11 Standards Met .................................................................................................... A-38
Specifications are subject to change without notice.
A.1 General Characteristics
• Measurement modes: Hand-arm, Whole-body, Vibration
• Metrics by mode:
HVM200 Reference Manual General Characteristics A-1
Page 41

Vibration
Hand-arm
Whole-body
• Measurement units: m/s2, cm/s2, ft/s2, in/s2, g, dB
RMS, Peak, Min, MTVV, A(8) Act, A(8) Exp, EP VDV (x, y, z & )
RMS, Peak, Min, Max (x, y, z & )
RMS, Peak, Min, MTVV, A(8) (x, y, z & )
A.1.1 Time History (Logging)
• Store interval (user-selected): 1, 2, 5, 10, 20, 30 s; 1, 2, 5, 20, 30 min; 1 hr
• Stored values: RMS and Peak for x, y, and z axes and for .
A.1.2 Run Modes
• Manual: Run/stop with app or meter button
• Timed: Start at time specified in setup
• Delayed: Start after delay specified in setup of 5, 10, 20, 30, or 60 seconds
A.1.3 Clock/Calendar
• 24 hour clock format: hh:mm:ss
• Run-time resolution: 1 second
• 5 minute (typical) clock retention during battery change
Time of Day Drift
Worst case: 6.91 seconds per day (-10 C to + 50 C).
Effects of Temperature and Humidity
• Operating temperature: 14°F to 122°F (-10 °C to 50 °C)
• The RMS level of the HVM200 varies up to 1% when exposed to temperatures of - 10 °C to 50 °C
and relative humidity (RH) 20 to 90% (non-condensing).
• Tested at 159.4 Hz and 9.81 m/s2.
A.1.4 Effects of Magnetic Fields
Complete instrument RMS level varies up to 1.4% when exposed to an 80 A/m, 60 Hz magnetic field
(worst case orientation).The complete instrument is defined as the HVM200 meter, CBL217-01, and
SEN041F.
A.1.5 Effects of Mechanical Vibrations
Complete instrument RMS level varies up to 0.4% when exposed to mechanical vibrations of 30 m/s2 at
79.58 Hz (worst-case orientation).
HVM200 Reference Manual General Characteristics A-2
Page 42

A.1.6 Stabilization Time
• 60 seconds
• Measurements with integration settings require up to one minute additional stabilization time before
initiating (the Power LED may display a solid green color during this additional stabilization time).
A.1.7 Data Storage
• Removable micro SD memory card up to 32 GB.
• 2 GB file size limit. Files are truncated at 2 GB. No limit to number of files or setups.
• Data and settings are stored in non-volatile memory
• Swapping limitation: Device must be off while replacing Micro SD card or battery.
A.1.8 Transducer Electronic Data Sheets (TEDS) Support
• Chips supported by HVM200: DS2430 and DS2431
• Versions supported: 0.9 (only DS2430 chip) and 1.0
• Templates supported: 0 (version 0.9), 25 (version 1.0)
A.2 Physical Characteristics
A.2.1 Dimensions/Weight
• Length: 4.6 inches (11.8 cm)
• Width: 2.6 inches (6.7 cm)
• Depth: 0.7 inches (1.8 cm)
• Weight: 4.6 ounces (130 grams) - including battery
• Ingress Protection Rating: IP42
A.2.2 Communication Interface
• USB 2.0 Hi-Speed
• WiFi 802.11 b/g/n with WPA and WPA2 security
A.2.3 Connections
• Micro-B USB cable (Communication and power)
• 1/4-28 4-pin 3-channel sensor connector
HVM200 Reference Manual Physical Characteristics A-3
Page 43

A.3 Operational Characteristics
Power LED
Status LED
Power Button
G4 Live View
Warning Icon
A.3.1 LED Indications
The following tables shows HVM200 LED indications, states, and additional information.
Power LED
Indication State Additional Information
Click the Warning Icon on the G4 LD Utility Live View. The “About
This Meter” information shows if there is a sensor/cable connection
System
Warning
Battery Low
(Blinking)
Battery
Charging
Battery
Charged
error, battery connection error, or SD memory card error. To avoid
system errors, do not hot swap SD memory cards.
Charge the HVM200 via USB from your computer or from the
PSA035 power supply. If not charged, the HVM200 will shut down
when the remaining battery life approaches the threshold for safe shut
down. If the HVM200 shuts down mid-measurement, the file is trun-
cated and G4 LD Utility may not be able to display summary informa-
tion for the file.
Allow the battery to charge fully to maximize overall battery life.
N/A
Power On is displayed both on start up and shut down. When turning
on the HVM200, press the power button for about one second until
Power On
HVM200 Reference Manual Operational Characteristics A-4
the blue LED is displayed. When shutting down, press the power but-
ton until the blue LED is displayed and the Status LED is dark.
Power On is also displayed when the HVM200 is running on battery
power (not simultaneously charging through USB connection).
Page 44

Status LED
Indication State
Measurement
Stopped
Measurement
Running
Measurement
Run Pending
(Blinking)
Overload
Overloaded
(Blinking)
Power Button Functions
Additional Information
The HVM200 is not running a measurement.
The HVM200 is in the process of taking a measurement.
The HVM200 is stabilizing for an impending measurement, which
may last up to 60 seconds, or is awaiting a delayed start set from the
scheduling tab.
A signal from the accelerometer is currently exceeding the calibrated
input range of the HVM200.
An overload has occurred in this measurement.
Power Button Functions
Action Press Power Button
Turn on power At least one second until Power LED is blue
Turn off power Until Power LED is blue and Status LED is dark
Start or stop toggle for manual measurement After turning on meter, less than three seconds
Shut down (if unresponsive) At least 16 seconds
A.4 Electrical Characteristics
A.4.1 Power Consumption
• USB Power: 130 mA in station mode; 180 mA in access point mode
• Battery run time: 12 hours in station mode; 9 hours in access point mode
A.4.2 Power Supply
• User replaceable rechargeable lithium-ion battery
• Charge time: 3.5 hours with Larson Davis PSA035 power supply
HVM200 Reference Manual Electrical Characteristics A-5
Page 45

• External Power:
Represents one
input for each axis
(x,y, z).
Refer to the “Pinout” diagram
below for more
information on the
1/4-28 input connection.
USB Type A to Micro-B USB cable, 3 ft (1 m)
Larson Davis Power Supply PSA035 (universal 100-240 VAC to 5 V USB power adapter)
A.4.3 Electrical Testing
During electrical testing, the following circuit was used:
Circuit to Inject Electrical Signal into HVM200 ICP® Inputs
A.4.4 Input
• Input type: ICP, IEPE, or CCP
• Excitation current: 2 mA
• Input connector: 1/4-28 4-pin male (the input connection is also the transducer connection)
• Measurement input voltage range: 1.8 to 16 Vdc
• Measurement AC reference bias voltage: 9 Vdc
• Absolute voltage range (min to max): 0 to 28 V
• Bandwidth: 0.4 Hz to 3000 Hz
• Range: Single range
• Sample rate: 7161.45833 Hz
HVM200 Reference Manual Electrical Characteristics A-6
Page 46

Pinout
A1
A2
B2 B1
Pin Signal
A1 GND
A2 X Axis
B1 Y Axis
B2 Z Axis
A.5 Reference Values
The following values represent the primary frequencies and amplitudes at which weighting filters are specified and tested.
Operating
Mode
Vibration Fa (0.4 Hz to 100 Hz)
Frequency W e ighting Reference Frequency
50 rad/s (7.958 Hz)
Fb (0.4 Hz to 1250 Hz)
Fc (6.3 Hz to 1250 Hz)
500 rad/s (79.58 Hz)
500 rad/s (79.58 Hz)
Hand Arm Wh 500 rad/s (79.58 Hz)
Whole Body Wm
100 rad/s (15.915 Hz)
Wb
Wc
Wd
We
Wj
Wk
Reference
Amplitude
10 m/s
10 m/s
10 m/s
10 m/s
1.0 m/s
1.0 m/s
1.0 m/s
1.0 m/s
1.0 m/s
1.0 m/s
1.0 m/s
2
2
2
2
2
2
2
2
2
2
2
Wf (Severity)
2.5 rad/s (0.3979 Hz)
0.1m/s
2
HVM200 Reference Manual Reference Values A-7
Page 47

A.6 Measurement Ranges
The following table shows the HVM200 dynamic and linearity ranges in root-mean square values. (Peak values are 1.414 times higher.)
Frequency
Weighting
Noise Floor
(typical mV)
Lower Limit
(Under-range
mV)
Lower Limit Lin-
earity Range
(typical mV)
Lower Limit
Linearity Range
(maximum mV)
Upper Limit
(Overload V)
Fa 0.028 0.204 0.092 0.178 5.01
Fb 0.046 0.232 0.133 0.176 5.01
Fc 0.041 0.205 0.116 0.152 5.01
Wb 0.016 0.167 0.073 0.137 5.01
Wc 0.021 0.184 0.089 0.150 5.01
Wd 0.014 0.181 0.072 0.175 5.01
We 0.012 0.193 0.073 0.161 5.01
Wf 0.009 0.185 0.100 0.147 5.01
Wh 0.014 0.087 0.042 0.090 5.01
Wj 0.023 0.167 0.077 0.151 5.01
Wk 0.018 0.144 0.073 0.121 5.01
Wm 0.017 0.103 0.060 0.077 5.01
A.7 Frequency Weighting Curves
The following graphs show frequency weighting curves for the HVM200.
HVM200 Reference Manual Measurement Ranges A-8
Page 48

HVM200 Reference Manual Frequency Weighting Curves A-9
Page 49

HVM200 Reference Manual Frequency Weighting Curves A-10
Page 50

HVM200 Reference Manual Frequency Weighting Curves A-11
Page 51

HVM200 Reference Manual Frequency Weighting Curves A-12
Page 52

A.8 Frequency Weighting Tables
The following tables show frequency weighting values for the HVM200.
HVM200 Reference Manual Frequency Weighting Tables A-13
Page 53

Fa (Flat 0.4 Hz to 100 Hz)
Freq ( Hz) Fa Ideal (dB) Fa Typical (dB) Tolerance (dB)
0.1000
0.1259
0.1585
0.1995
0.2512
0.3162
0.3981
0.5012
0.6310
0.7943
1.000
1.259
1.585
1.995
2.512
-24.10
-20.12
-16.19
-12.34
-8.71
-5.51
-3.05
-1.48
-0.65
-0.27
-0.11
-0.04
-0.02
-0.01
0.00
-25.19 +2/-
-21.21 +2/ -
-16.92 +2/ -
-12.95 +2/-
-9.26 +2/-2
-5.84 +2/-2
-3.15 +1/-1
-1.46 +1/-1
-0.57 +1/-1
-0.17 +1/-1
0.06 +1/-1
0.00 +1/-1
-0.02 +1/-1
-0.03 +1/-1
-0.03 +1/-1
3.162
3.981
5.012
6.310
7.943
10.00
12.59
15.85
19.95
25.12
31.62
39.81
50.12
63.10
79.43
0.00
0.00
0.00
0.00
0.00
0.00
0.00
0.00
-0.01
-0.02
-0.04
-0.11
-0.27
-0.64
-1.46
-0.03 +1/-1
-0.02 +1/-1
-0.03 +1/-1
-0.04 +1/-1
0.00 0
-0.01 +1/-1
0.00 +1/-1
0.02 +1/-1
-0.02 +1/-1
-0.05 +1/-1
-0.03 +1/-1
-0.12 +1/-1
-0.27 +1/-1
-0.65 +1/-1
-1.44 +1/-1
100.0
125.9
158.5
199.5
-3.01
-5.46
-8.64
-12.27
-2.99 +1/-1
-5.47 +2/-2
-8.65 +2/-2
-12.32 +2/ -
HVM200 Reference Manual Frequency Weighting Tables A-14
Page 54

Freq ( Hz) Fa Ideal (dB) Fa Typical (dB) Tolerance (dB)
251.2
316.2
398.1
-16.11
-20.04
-24.02
-16.20 +2/ -
-20.16 +2/ -
-24.22 +2/ -
HVM200 Reference Manual Frequency Weighting Tables A-15
Page 55

Fb (Flat 0.4 Hz to 1260 Hz) Frequency Weighting
Freq ( Hz) Fb Ideal (dB) Fb Typical (dB) Tolerance (dB)
0.1000 -24.10 -25.24 +2 / -
0.1259 -20.12 -21.23 +2 / -
0.1585 -16.19 -16.94 +2 / -
0.1995 -12.34 -12.99 +2 / -
0.2512 -8.71 -9.29 +2 / -2
0.3162 -5.51 -5.84 +1 / -1
0.3981 -3.05 -3.18 +1 / -1
0.5012 -1.48 -1.49 +1 / -1
0.6310 -0.65 -0.59 +1 / -1
0.7943 -0.27 -0.21 +1 / -1
1.000 -0.11 -0.08 +1 / -1
1.259 -0.04 -0.05 +1 / -1
1.585 -0.02 -0.04 +1 / -1
1.995 -0.01 -0.04 +1 / -1
2.512 0.00 -0.04 +1 / -1
3.162 0.00 -0.07 +1 / -1
3.981 0.00 -0.05 +1 / -1
5.012 0.00 -0.05 +1 / -1
6.310 0.00 -0.07 +1 / -1
7.943 0.00 -0.06 +1 / -1
10.00 0.00 -0.03 +1 / -1
12.59 0.00 -0.03 +1 / -1
15.85 0.00 -0.01 +1 / -1
19.95 0.00 -0.03 +1 / -1
25.12 0.00 -0.05 +1 / -1
31.62 0.00 -0.02 +1 / -1
39.81 0.00 -0.02 +1 / -1
50.12 0.00 -0.03 +1 / -1
63.10 0.00 -0.03 +1 / -1
79.43 0.00 0.00 0
100.0 0.00 -0.01 +1 / -1
HVM200 Reference Manual Frequency Weighting Tables A-16
Page 56

Freq ( Hz) Fb Ideal (dB) Fb Typical (dB) Tolerance (dB)
125.9 0.00 -0.04 +1 / -1
158.5 0.00 -0.02 +1 / -1
199.5 0.00 -0.05 +1 / -1
251.2 -0.01 -0.06 +1 / -1
316.2 -0.02 -0.05 +1 / -1
398.1 -0.04 -0.10 +1 / -1
501.2 -0.11 -0.15 +1 / -1
631.0 -0.27 -0.31 +1 / -1
794.3 -0.64 -0.63 +1 / -1
1000 -1.46 -1.47 +2 / -2
1259 -3.01 -3.35 +2 / -2
1585 -5.46 -6.86 +2 / -2
1995 -8.64 -12.55 +2 / -2
2512 -12.27 -21.30 +2 / -
3162 -16.11 -39.09 +2 / -
3981 -20.04 -85.43 +2 / -
HVM200 Reference Manual Frequency Weighting Tables A-17
Page 57

Fc (Flat 6.3 Hz to 1260 Hz), Wh, and Wf Frequency Weighting.
Freq
( Hz)
Fc Ideal
(dB)
Fc T yp
(dB)
Wh Ideal
(dB)
Wh T yp
(dB)
Tolerance
(dB)
Wf Ideal
(dB)
Wf T yp
(dB)
Tolerance
(dB)
0.7943 0.7943 -36.06 -36.00 -36.10 +2 / - -32.37 -32.08 +2 / -
1.000 1.000 -32.08 -31.99 -32.08 +2 / - -28.40 -30.95 +2 / -
1.259 1.259 -28.08 -27.99 -28.09 +2 / - -24.41 -26.39 +2 / -
1.585 1.585 -24.08 -23.99 -24.07 +2 / - -20.34 -21.30 +2 / -
1.995 1.995 -20.09 -20.01 -20.08 +2 / - -16.06 -17.28 +2 / -
2.512 2.512 -16.16 -16.05 -16.12 +2 / - -11.45 -12.58 +2 / -2
3.162 3.162 -12.31 -12.18 -12.26 +2 / - -6.86 -7.07 +2 / -2
3.981 3.981 -8.70 -8.51 -8.56 +2 / -2 -3.16 -3.56 +2 / -2
5.012 5.012 -5.50 -5.27 -5.32 +2 / -2 -0.92 -1.13 +4 / -1
6.310 6.310 -3.02 -2.77 -2.83 +2 / -2 0.04 -0.02 +1 / -1
7.943 7.943 -1.52 -1.18 -1.25 +2 / -2 -0.06 -0.12 +1 / -1
10.00 10.00 -0.67 -0.43 -0.46 +1 / -1 -1.41 -1.39 +1 / -1
12.59 12.59 -0.31 -0.38 -0.39 +1 / -1 -4.22 -4.21 +1 / -1
15.85 15.85 -0.12 -0.96 -0.99 +1 / -1 -8.22 -8.22 +1 / -1
19.95 19.95 -0.08 -2.14 -2.17 +1 / -1 -13.05 -12.96 +2 / -2
25.12 25.12 -0.06 -3.78 -3.83 +1 / -1 -18.73 -18.63 +2 / -2
31.62 31.62 -0.02 -5.69 -5.71 +1 / -1 -25.30 -25.22 +2 / -2
39.81 39.81 -0.03 -7.72 -7.75 +1 / -1 -32.57 -32.49 +2 / -
50.12 50.12 -0.03 -9.78 -9.80 +1 / -1 -40.26 -40.20 +2 / -
63.10 63.10 -0.03 -11.83 -11.86 +1 / -1 -48.14 -48.11 +2 / -
79.43 79.43 0.00 -13.88 -13.88 0 -56.11 -55.96 +2 /-
100.0 100.0 -0.01 -15.91 -15.92 +1 / -1
125.9 125.9 -0.04 -17.93 -17.97 +1 / -1
158.5 -0.02 -19.97 +1 / -1
199.5 0.00 -0.05 -19.94 -22.01 +1 / -1
251.2 0.00 -0.06 -21.95 -24.04 +1 / -1
316.2 -0.01 -0.05 -23.96 -26.06 +1 / -1
398.1 -0.02 -0.10 -25.98 -28.13 +1 / -1
501.2 -0.04 -0.15 -28.00 -30.21 +1 / -1
631.0 -0.11 -0.31 -30.07 -32.40 +1 / -1
HVM200 Reference Manual Frequency Weighting Tables A-18
Page 58

Freq
( Hz)
Fc Ideal
(dB)
Fc T yp
(dB)
Wh Ideal
(dB)
Wh T yp
(dB)
Tolerance
(dB)
794.3 -0.27 -0.63 -32.23 -34.70 +1 / -1
1000 -0.64 -1.47 -34.60 -37.41 +2 / -2
1259 -1.46 -3.35 -37.42 -40.97 +2 / -2
1585 -3.01 -6.86 -40.97 -46.21 +2 / -2
1995 -5.46 -12.55 -45.42 -54.40 +2 / -2
2512 -8.64 -21.30 -50.60 -67.23 +2 / -
3162 -12.27 -39.09 -56.23 -92.87 +2 / -
3981 -16.11 -86.14 -62.07 -101.37 +2 / -
Wf Ideal
(dB)
Wf T yp
(dB)
Tolerance
(dB)
HVM200 Reference Manual Frequency Weighting Tables A-19
Page 59

Wm, Wc, and Wd Frequency Weightings
Freq
( Hz)
Wm Ideal
(dB)
WmTyp
(dB)
Wc Ideal
(dB)
Wc Typ
(dB)
Wd Ideal
(dB)
Wd T yp
(dB)
Tolerance
(dB)
0.100 -32.04 -36.81 -24.10 -25.20 -24.09 -25.23 +2 / -
0.1259 -28.20 -32.86 -20.12 -21.23 -20.12 -21.21 +2 / -
0.1585 -23.98 -28.53 -16.19 -16.93 -16.18 -16.96 +2 / -
0.1995 -20.23 -24.53 -12.34 -13.00 -12.32 -13.00 +2 / -
0.2512 -16.71 -20.60 -8.71 -9.30 -8.68 -9.28 +2 / -2
0.3162 -13.51 -16.58 -5.51 -5.88 -5.47 -5.78 +2 / -2
0.3981 -10.98 -12.67 -3.05 -3.17 -2.98 -3.10 +1 / -1
0.5012 -9.53 -9.04 -1.47 -1.50 -1.37 -1.40 +1 / -1
0.6310 -8.71 -5.76 -0.64 -0.60 -0.50 -0.45 +1 / -1
0.7943 -8.38 -3.18 -0.25 -0.23 -0.08 -0.06 +1 / -1
1.00 -8.29 -1.59 -0.08 -0.06 +0.10 0.12 +1 / -1
1.259 -8.27 -0.85 +0.00 -0.01 +0.06 0.06 +1 / -1
1.585 -8.07 -0.61 +0.06 0.02 -0.26 -0.28 +1 / -1
1.995 -7.60 -0.64 +0.10 0.05 -1.00 -1.06 +1 / -1
2.512 -6.13 -0.86 +0.15 0.09 -2.23 -2.30 +1 / -1
3.162 -3.58 -1.24 +0.19 0.12 -3.88 -3.93 +1 / -1
3.981 -1.02 -1.78 +0.21 0.14 -5.78 -5.84 +1 / -1
5.012 0.21 -2.55 +0.11 0.04 -7.78 -7.85 +1 / -1
6.310 0.46 -3.52 -0.23 -0.31 -9.83 -9.92 +1 / -1
7.943 0.21 -4.76 -0.97 -1.06 -11.87 -11.91 0
10.0 -0.23 -6.16 -2.20 -2.25 -13.91 -13.95 +1 / -1
12.59 -0.85 -7.75 -3.84 -3.88 -15.98 +1 / -1
15.85 -1.83 -9.44 -5.74 -5.74 -17.95 +1 / -1
19.95 -3.00 -11.30 -7.75 -7.81 -20.02 +1 / -1
25.12 -4.44 -13.19 -9.80 -9.85 -15.93 -22.04 +1 / -1
31.62 -6.16 -15.12 -11.87 -11.91 -17.95 -24.05 +1 / -1
39.81 -8.11 -17.14 -13.97 -14.00 -19.97 -26.12 +1 / -1
50.12 -10.09 -19.26 -16.15 -16.20 -21.98 -28.28 +1 / -1
63.10 -12.43 -21.62 -18.55 -18.59 -24.01 -30.67 +1 / -1
79.43 -15.34 -24.40 -21.37 -21.39 -26.08 -33.45 +1 / -1
HVM200 Reference Manual Frequency Weighting Tables A-20
Page 60

Freq
( Hz)
Wm Ideal
(dB)
WmTyp
(dB)
Wc Ideal
(dB)
Wc Typ
(dB)
Wd Ideal
(dB)
Wd T yp
(dB)
Tolerance
(dB)
100.0 -18.72 -27.95 -24.94 -24.96 -28.24 -37.02 +1 / -1
125.9 -23.00 -32.43 -29.39 -29.45 -30.62 -41.50 +2 / -2
158.5 -28.56 -37.60 -34.57 -34.63 -33.43 -46.68 +2 / -2
199.5 -34.03 -43.28 -40.20 -40.32 -36.99 -52.36 +2 / -
251.2 -39.69 -49.17 -46.04 -46.21 -41.43 -58.25 +2 / -
316.2 -45.65 -55.16 -51.98 -52.19 -46.62 -64.23 +2 / -
398.1 -51.84 -61.23 -57.95 -58.29 -52.24 -70.30 +2 / -
HVM200 Reference Manual Frequency Weighting Tables A-21
Page 61

We, Wj, and Wk Frequency Weighting
Freq
( Hz)
We Ideal
(dB)
We Typ
(dB)
Wj Ideal
(dB)
Wj Typ
(dB)
Wk Ideal
(dB)
Wk T yp
(dB)
Tolerance dB
0.100 -24.08 -25.22 -30.18 -31.27 -30.11 -31.20 +2 / -
0.1259 -20.09 -21.22 -26.20 -27.28 -26.14 -27.24 +2 / -
0.1585 -16.14 -16.91 -22.27 -22.99 -22.21 -22.98 +2 / -
0.1995 -12.27 -12.92 -18.42 -19.08 -18.37 -19.00 +2 / -
0.2512 -8.60 -9.20 -14.79 -15.37 -14.74 -15.32 +2 / -2
0.3162 -5.36 -5.66 -11.60 -11.89 -11.55 -11.88 +2 / -2
0.3981 -2.86 -2.99 -9.15 -9.25 -9.11 -9.24 +1 / -1
0.5012 -1.27 -1.28 -7.58 -7.59 -7.56 -7.57 +1 / -1
0.6310 -0.55 -0.48 -6.77 -6.72 -6.77 -6.71 +1 / -1
0.7943 -0.52 -0.47 -6.42 -6.38 -6.44 -6.37 +1 / -1
1.00 -1.11 -1.08 -6.30 -6.26 -6.33 -6.30 +1 / -1
1.259 -2.29 -2.29 -6.28 -6.28 -6.29 -6.28 +1 / -1
1.585 -3.91 -3.92 -6.32 -6.33 -6.13 -6.16 +1 / -1
1.995 -5.80 -5.82 -6.34 -6.37 -5.50 -5.54 +1 / -1
2.512 -7.81 -7.85 -6.22 -6.26 -3.97 -4.01 +1 / -1
3.162 -9.85 -9.87 -5.60 -5.66 -1.86 -1.93 +1 / -1
3.981 -11.89 -11.95 -4.08 -4.11 -0.31 -0.38 +1 / -1
5.012 -13.93 -13.98 -1.99 -2.04 +0.33 0.28 +1 / -1
6.310 -15.95 -16.00 -0.47 -0.51 +0.46 0.42 +1 / -1
7.943 -17.97 -18.04 +0.14 0.08 +0.32 0.28 0
10.0 -19.98 -20.02 +0.26 0.23 -0.10 -0.14 +1 / -1
12.59 -19.98 -22.01 +0.26 0.21 -0.10 -0.95 +1 / -1
15.85 -21.99 -23.99 +0.22 0.16 -0.93 -2.22 +1 / -1
19.95 -23.99 -26.05 +0.16 0.07 -2.22 -3.95 +1 / -1
25.12 -26.00 -28.06 +0.10 0.01 -3.91 -5.88 +1 / -1
31.62 -28.01 -30.06 +0.06 -0.01 -5.84 -7.90 +1 / -1
39.81 -30.04 -32.14 +0.00 -0.10 -7.89 -10.04 +1 / -1
50.12 -32.11 -34.30 -0.08 -0.27 -10.01 -12.24 +1 / -1
63.10 -34.26 -36.68 -0.25 -0.65 -12.21 -14.66 +1 / -1
79.43 -36.64 -39.47 -0.63 -1.44 -14.62 -17.48 +1 / -1
HVM200 Reference Manual Frequency Weighting Tables A-22
Page 62

Freq
( Hz)
100.0 -39.46 -43.03 -1.45 -3.01 -17.47 -21.05 +1 / -1
125.9 -43.01 -47.51 -3.01 -5.49 -21.04 -25.55 +2 / -2
158.5 -47.46 -52.69 -5.45 -8.66 -25.50 -30.73 +2 / -2
199.5 -52.64 -58.37 -8.64 -12.34 -30.69 -36.42 +2 / -
251.2 -58.27 -64.21 -12.26 -16.22 -36.32 -42.32 +2 / -
316.2 -64.11 -70.24 -16.11 -20.18 -42.16 -48.30 +2 / -
398.1 -70.04 -76.29 -20.04 -24.25 -48.10 -54.40 +2 / -
We Ideal
(dB)
We Typ
(dB)
Wj Ideal
(dB)
Wj Typ
(dB)
Wk Ideal
(dB)
Wk T yp
(dB)
Tolerance dB
A.9 Integration Weighting Limits
All data presented is with a reference sensitivity of 1 mV/m/s2. The amplitude values on the tables and figures scale according to the ratio of selected sensor sensitivity values to 1 mV/m/s2.
Single Integration Double Integration
Weighting Noise Floor (m/s) Max (m/s) Noise Floor (m) Max (m)
Fa
Fb
Fc
Wb
Wc
Wd
We
Wf
Wh
Wj
Wk
Wm
For the following charts, the valid measurement range for each weighting is shown between the noise floor
and the maximum.
0.0121 1403.690 0.0150 801.367
0.0220 1403.690 0.0173 801.367
0.0003 84.283 0.0003 3.235
0.0068 563.341 0.0060 317.432
0.0163 1403.690 0.0143 801.367
0.0155 1415.048 0.0111 801.367
0.0108 1434.733 0.0102 804.139
0.0802 5740.123 0.1707 8823.712
0.0003 87.044 0.0002 3.235
0.0080 695.458 0.0077 397.953
0.0083 698.669 0.0067 400.711
0.0049 698.620 0.0034 204.094
HVM200 Reference Manual Integration Weighting Limits A-23
Page 63

HVM200 Reference Manual Integration Weighting Limits A-24
Page 64

HVM200 Reference Manual Integration Weighting Limits A-25
Page 65

HVM200 Reference Manual Integration Weighting Limits A-26
Page 66

HVM200 Reference Manual Integration Weighting Limits A-27
Page 67

HVM200 Reference Manual Integration Weighting Limits A-28
Page 68

A.10 1/1 & 1/3 Octave Band Filters
Octave Band Analysis (OBA) is an optional feature for the HVM200.
A.10.1 OBA Compliance
• IEC 61260-1:2014 Class 1
• ANSI S1.11-2014 Part 1, Class 1
HVM200 Reference Manual 1/1 & 1/3 Octave Band Filters A-29
Page 69

A.10.2 OBA General Specifications
• 1/1 Octave Filters: 0.5 Hz to 2000 Hz
• 1/3 Octave Filters: 0.4 Hz to 2500 Hz
• Weighting: Unweighted
• Measured Values: RMS and Peak OBA Filter Responses
A.10.3 1/1 OBA Filter Responses
1/1 Octave Measurement Range
Frequency (Hz) Noise Floor (mV) Lower Limit Linearity (mV) Overload (V)
0.5
1
2
4
8
16
31.5
63
125
250
500
1000
2000
0.0076 0.079 5.01
0.0101 0.126 5.01
0.0088 0.089 5.01
0.0095 0.112 5.01
0.0100 0.089 5.01
0.0097 0.112 5.01
0.0103 0.071 5.01
0.0114 0.100 5.01
0.0140 0.071 5.01
0.0157 0.056 5.01
0.0190 0.056 5.01
0.0245 0.079 5.01
0.0343 0.100 5.01
HVM200 Reference Manual 1/1 & 1/3 Octave Band Filters A-30
Page 70

1/1 Octave Filter Response Summary Graph
1/1 OBA 8.0 Hz Filter Response
HVM200 Reference Manual 1/1 & 1/3 Octave Band Filters A-31
Page 71

1/1 OBA 8.0 Hz Filter Response: Pass-band
1/1 OBA 16.0 Hz Filter Response
HVM200 Reference Manual 1/1 & 1/3 Octave Band Filters A-32
Page 72

1/1 OBA 16.0 Hz Filter Response: Pass-band
1/3 OBA Filter Responses
1/3 Octave Filter Measurement Range
Frequency (Hz) Noise Floor (mV) Lower Limit Linearity (mV) Overload (V)
0.4 0.0064 0.071 5.01
0.5 0.0055 0.063 5.01
0.63 0.0057 0.112 5.01
0.8 0.0053 0.089 5.01
1 0.0052 0.126 5.01
1.25 0.0054 0.178 5.01
1.6 0.0050 0.079 5.01
2 0.0055 0.158 5.01
2.5 0.0055 0.178 5.01
3.15 0.0053 0.282 5.01
4 0.0050 0.141 5.01
5 0.0053 0.112 5.01
6.3 0.0054 0.200 5.01
8 0.0053 0.089 5.01
10 0.0053 0.089 5.01
12.5 0.0054 0.056 5.01
16 0.0053 0.056 5.01
20 0.0054 0.089 5.01
25 0.0055 0.071 5.01
31.5 0.0056 0.063 5.01
40 0.0057 0.089 5.01
50 0.0059 0.056 5.01
63 0.0062 0.056 5.01
HVM200 Reference Manual 1/1 & 1/3 Octave Band Filters A-33
Page 73

1/3 Octave Filter Measurement Range
80 0.0064 0.056 5.01
100 0.0069 0.056 5.01
125 0.0075 0.056 5.01
160 0.0074 0.063 5.01
200 0.0079 0.056 5.01
250 0.0084 0.056 5.01
315 0.0091 0.056 5.01
400 0.0098 0.079 5.01
500 0.0105 0.056 5.01
630 0.0115 0.079 5.01
800 0.0126 0.056 5.01
1000 0.0139 0.056 5.01
1250 0.0153 0.063 5.01
1600 0.0171 0.056 5.01
2000 0.0191 0.056 5.01
2500 0.0219 0.063 5.01
1/3 Octave Filter Summary Graph
HVM200 Reference Manual 1/1 & 1/3 Octave Band Filters A-34
Page 74

1/3 OBA 0.4 Hz Filter Response
1/3 OBA 0.4 Hz Filter Response: Pass-band
HVM200 Reference Manual 1/1 & 1/3 Octave Band Filters A-35
Page 75

1/3 OBA 8.0 Hz Filter Response
1/3 OBA 8.0 Hz Filter Response: Pass-band
HVM200 Reference Manual 1/1 & 1/3 Octave Band Filters A-36
Page 76

1/3 OBA 16.0 Hz Center Band Filter Response
1/3 OBA 16.0 Hz Filter Response: Pass-band
HVM200 Reference Manual 1/1 & 1/3 Octave Band Filters A-37
Page 77

1/3 OBA 80.0 Hz Filter Response
1/3 OBA 80.0 Hz Passband Filter Response
A.11 Standards Met
Type Precision
The Larson Davis HVM200 Human Vibration Meter is a Type 1 instrument designed for use in assessing
vibration as perceived by human beings. The instrument meets the requirements of ISO 8041:2005(E).
Additionally, because the HVM200 meets the current ISO 8041:2005 standard, it is also compatible with the
standards listed below. These standards define methods for the measurement of whole-body and hand-arm
vibration.
HVM200 Reference Manual Standards Met A-38
Page 78

• ISO 2631-1:1997 Mechanical vibration and shock -- Evaluation of human exposure to whole-body
vibration -- Part 1: General requirements
• ISO 2631-5:2004 Evaluation of human exposure to whole-body vibration -- Part 5: Method for evaluation of vibration containing multiple shocks
• ISO 2631-2:2003 Evaluation of human exposure to whole-body vibration -- Part 2: Continuous and
shock-induced vibrations in buildings (1 to 80 Hz)
• ISO 2631-4:2001 Mechanical vibration and shock -- Evaluation of human exposure to whole-body
vibration -- Part 4: Guidelines for the evaluation of the effects of vibration and rotational motion on
passenger and crew comfort in fixed-guide-way transport systems
• ISO 5349-1:2001 Mechanical vibration -- Measurement and evaluation of human exposure to handtransmitted vibration -- Part 1: General requirements
• ISO 5349-2:2001 Mechanical vibration -- Measurement and evaluation of human exposure to handtransmitted vibration -- Part 2: Practical guidance for measurement at the workplace
• EN 1032:2003 Mechanical vibration -- Testing of mobile machinery in order to determine the vibration emission value
• ANSI S2.70 Guide for the Measurement and Evaluation of Human Exposure to Vibration Transmitted
to the Hand
HVM200 Reference Manual Standards Met A-39
Page 79

AppendixBAdaptor Resonance
& Frequency Response
B.1 Mechanical ................................ ....................................................................... .... B-1
B.1.1 ADP080A ................................................................................................ B-1
B.1.2 ADP081A ................................................................................................ B-2
B.1.3 ADP082A ................................................................................................ B-2
B.1.4 Measurements ........................................................................................ B-2
B.1.5 ADP080A + SEN041 ............................................................................... B-3
B.1.6 ADP081A + SEN041 ............................................................................... B-4
B.1.7 ADP082A + SEN041 ............................................................................... B-4
Experimental measurements indicate no resonances within the Wh frequency range for the adaptors
ADP080A, ADP081A and ADP082A.
B.1 Mechanical
Specification Unit
Total Mass of Vibration Sensor &
Mounting System (including sensor,
adapter, & mounting screw)
Mounting Height of Vibration Sensor
(distance between sensor and mounting
surface)
Adapter dimensions inches
ounces
(grams)
inches
(mm)
(mm)
B.1.1 ADP080A
FIGURE B-1 (Hand Adapter with SEN04XF Accelerometer)
ADP080AADP081AADP082
A
0.67 (19) 0.74 (21) 0.35 (10)
0.32 (8.0) 0.18 (4.6) 0.32 (8.1)
Shown
Below
Shown
Below
Shown
Below
HVM200 Reference Manual Mechanical B-1
Page 80

B.1.2 ADP081A
FIGURE B-2 (Handle Adapter with SEN04XF Accelerometer)
B.1.3 ADP082A
FIGURE B-3 (Clamp Adapter with SEN04XF Accelerometer)
B.1.4 Measurements
Frequency Response
The frequency response measurements were performed by suspending the test object and exciting it with a
modal hammer. The responses were measured in x, y and z directions using a triaxial accelerometer connected to the test object using the specified adapter. A graphic is included to illustrate the test configuration.
T riaxial Accelerometer
The triaxial accelerometer used for these tests was a Larson Davis Model SEN041F having a sensitivity of 10
mV/g.
HVM200 Reference Manual Mechanical B-2
Page 81

B.1.5 ADP080A + SEN041
FIGURE B-4 ADP080A + SEN041
Frequency Response Function X, Y and Z
HVM200 Reference Manual Mechanical B-3
Page 82

B.1.6 ADP081A + SEN041
Frequency Response Function X, Y and Z
B.1.7 ADP082A + SEN041
Frequency Response Function X, Y and Z
HVM200 Reference Manual Mechanical B-4
Page 83

Appendix C Glossary of Terms
Aeq
1
T
---
a
w
2
ttd
0
T
=
1
T
---
a
w
2
t
a
o
2
--------------
td Bd
0
T
=
aLms2
Aeq
2
8hours
The following table contains definitions and calculations for terminology used in the HVM200 manual.
Term Equation Description
RMS
Acceleration
T= Integration time in seconds.
(t) = instantaneous acceleration.
a
w
t = Time, in seconds.
The Aeq integration time is from Run to Reset; the display is
updated once per second.
RMS
Acceleration in
Decibels
Allowed
Exposure Time
a
= reference acceleration, 10-6 m/s2 or 10-5 m/s2 (user select-
o
able)
a
is user selectable.
L
A8Exp: a
A8Act: a
typically = 5
L
typically = 2.5
L
HVM200 Reference Manual C-1
Page 84

Term Equation Description
A 8
1
8Hours
-------------------
a
w
2
ttd
0
T
=
A 4
1
4Hours
-------------------
a
w
2
ttd
0
T
=
A 2
1
2Hours
-------------------
a
w
2
ttd
0
T
=
A 1
1
1Hours
-------------------
a
w
2
ttd
0
T
=
P 100
E
ka
a
T
hours
2
8
w
exp
Arms
1
---
a
w
2
ttd
t0
t
0
=
-
The HVM200 measures the following quantities:
Energy
Equivalent
RMS
Acceleration
Exposure
Points (PE)
Running RMS
Acceleration
LINEAR
a
= the vibration magnitude in m/s2.
w
T= the exposure time in hours.
k = the multiplying sum factor for the individual axis.
a
= the exposure action value.
exp
The summation measurement exposure points will be the maximum of the three axes exposure points.
Integration time, in seconds.
t
= Observation time
o
The linear Arms integration time is controlled by the Averaging
time setting; a new linear Arms value is calculated and displayed at the end of each integration period.
HVM200 Reference Manual C-2
Page 85

Term Equation Description
Arms
1
---
a
w
2
t
tt
0
------
exp td
t
0
=
-
-
VDV a
w
4
ttd
0
T
1
4
---
=
Running RMS
Acceleration
EXPONENTI
AL
Time constant of the measurement.
An averaging time of SLOW is equivalent to a time constant of
1 second.
Vibration Dose
Value
Maximum
Transient
Vibration
Value
Minimum
Transient
Vibration
Value
Long Term
Maximum
Peak
The VDV integration time is from Run to Reset; the display is
updated once per second. The VDV is not calculated for units of
dB org.
For whole body vibration mode:
VDV
= max(VDVx + VDVy + VDVz)
sum
Amax = maximum reading of all Arms readings from Run to
Reset.
The display is updated at the end of each Averaging time
period.
Amin = minimum reading of all Arms readings from Run to
Reset.
The display is updated at the end of each Averaging time
period.
Amp = peak level of the instantaneous weighted acceleration,
aw(t); measured over the entire measurement period, from Run
to Reset.
The displayed Amp value is updated once per second.
Peak = peak level of the instantaneous weighted acceleration,
Short Term
aw(t); measured during one Averaging time period.
Maximum
Peak
The peak measurement period is controlled by the Averaging
time setting; a new Peak value is calculated and displayed at the
end of each Averaging time period.
HVM200 Reference Manual C-3
Page 86

Term Equation Description
aw(t) = instantaneous, summed acceleration
awx(t), awy(t), awz(t) = X, Y, and Z axis instantaneous accelera-
Summed
Instantaneous
Kx,Ky,K
= X, Y, and Z axis Sum Factors
z
tion
Acceleration
The HVM200 uses the formula above to calculate the instanta-
neous, summed acceleration, aw(t). This value is then used to
calculate a sum quantity for the A
Peak, VDV, and PE. K factors affect only sum value and not
individual axis data.
rms,Amin
, A
, Amp, Aeq,
max
HVM200 Reference Manual C-4
Page 87

Appendix D Regulatory
Compliance Statement
FCC
This device complies with part 15 of the FCC rules. Operation is subject to the following two conditions: (1)
This device may not cause harmful interference, and (2) this device must accept any interference received,
including interference that may cause undesired operation. Any changes or modifications not expressly
approved by manufacturer could void the user’s authority to operate the equipment.
IMPORTANT! Any changes or modifications not expressly approved by the party responsible for compliance could void the user’s authority to operate this equipment.
Industry Canada
This device complies with Industry Canada licence-exempt RSS standard(s). Operation is subject to the following two conditions: (1) this device may not cause interference, and (2) this device must accept any interference, including interference that may cause undesired operation of the device.
This Class B digital apparatus complies with Canadian ICES-003.
Cet appareil numérique de la classe B est conforme à la norme NMB-003 du Canada
Le présent appareil est conforme aux CNR d’Industrie Canada applicables aux appareils radio exempts de
licence. L’exploitation est autorisée aux deux conditions suivantes: (1) l’appareil ne doit pas produire de
brouillage, et (2) l’utilisateur de l’appareil doit accepter tout brouillage radioélectrique subi, meme si le
brouillage est susceptible d’en compromettre le fonctionnement.
IMPORTANT! Tous les changements ou modifications pas expressément approuvés par la partie responsable
de la conformité ont pu vider l’autorité de l’utilisateur pour actioner cet équipment.
47 CFR 15.505- FCC
Class B
NOTE: This equipment has been tested and found to comply with the limits for a Class B digital device, pursuant to part 15 of the FCC Rules. These limits are designed to provide reasonable protection against harmful
interference in a residential installation. This equipment generates, uses and can radiate radio frequency
energy and, if not installed and used in accordance with the instructions, may cause harmful interference to
radio communications. However, there is no guarantee that interference will not occur in a particular installation. If this equipment does cause harmful interference to radio or television reception, which can be determined by turning the equipment off and on, the user is encouraged to try to correct the interference by one or
more of the following measures:
• Reorient or relocate the receiving antenna.
• Increase the separation between the equipment and receiver.
• Connect the equipment into an outlet on a circuit different from that to which the receiver is connected.
HVM200 Reference Manual D-1
Page 88

• Consult the dealer or an experienced radio/ TV technician for help.
Class A- FCC
NOTE: This equipment has been tested and found to comply with the limits for a Class A digital device, pursuant to part 15 of the FCC Rules. These limits are designed to provide reasonable protection against harmful
interference when the equipment is operated in a commercial environment. This equipment generates, uses,
and can radiate radio frequency energy and, if not installed and used in accordance with the instruction manual, may cause harmful interference to radio communications. Operation of this equipment in a residential
area is likely to cause harmful interference in which case the user will be required to correct the interference
at his own expense.
Vertrieb für Österreich :
HVM200 Reference Manual D-2
www.nbn.at
nbn Elektronik Handelsgesellschaft m. b. H.
Riesstraße 146, 8010 Graz | Tel. +43 316 40 28 05 | Fax +43 316 40 25 06
 Loading...