

Page 1
INSTRUCTION MANUAL
FOR DCL-12, 13, 14, 15, 20
Helping People Solve Analytical Challenges
PO Box 329 • Chestertown • Maryland • 21620 • USA
800-344-3100 • 410-778-3100 (Outside U.S.A.)
Visit us on the web at www.lamotte.com
®
1985-01 • 10/01
Page 2

TABLE OF CONTENTS
Page
Introduction to Colorimetric Analysis 3
Sample Dilution Techniques 4
General Information 5
Specifications 6
General Operating Procedure 7
pH-Lime Requirement 8
Soluble Salts 9
Soil Colorimeter Tests 10
Ammonia Nitrogen 11
Calcium & Magnesium 12 - 13
Chloride 14
Copper 15
Iron 16
Manganese 17 - 18
Nitrate Nitrogen 19 - 20
Nitrite Nitrogen 21 - 22
Phosphorus 23 - 24
Potassium 25 - 26
Sulfur 27 - 28
Zinc 29 - 30
1985-01 • 10/01
Page 3

AN INTRODUCTION TO COLORIMETRIC ANALYSIS
Most test substances in water are colorless and undetectable to the human eye. In order to test for their presence we must
find a way to “see” them. The LaMotte colorimeter can be used to measure any test substance that is itself colored or can be
reacted to produce a color. In fact a simple definition of colorimetry is “the measurement of color” and a colorimetric
method is “any technique used to evaluate an unknown color in reference to known colors”. In a colorimetric chemical test
the intensity of the color from the reaction must be proportional to the concentration of the substance being tested. Some
reactions have limitations or variances inherent to them that may give misleading results. Many such interferences are
discussed with each particular test instruction. In the most basic colorimetric method the reacted test sample is visually
compared to a known color standards. However, accurate and reproducible results are limited by the eyesight of the analyst,
inconsistencies in the light sources, and the fading of color standards.
To avoid these sources of error, a colorimeter can be used to photoelectrically measure the amount of colored light
absorbed by a colored sample in reference to a colorless sample (blank).
Why measure colored light? White light is made up of many different colors or wavelengths of light. A colored sample
typical absorbs only one color or one band of wavelengths from the white light. Not much difference could be measured
between white light before it passes through a colored sample versus after it passes through. The reason for this is that the
one color absorbed by the sample is only a small portion of the total amount of light passing through the sample. However,
if we could select only that one color or band of wavelengths of light which the test sample is most sensitive to, we would
see a large difference between the light before it passes through the sample and after it passes through.
A colorimeter passes a white light beam through an optical filter which transmits only one particular color or band of
wavelengths of light to the photodetector where it is measured. The difference in the amount of colored light transmitted
by a colorless sample (blank) and the amount of colored light transmitted by a colored sample is a measurement of the
amount of colored light absorbed by the sample. In most colorimetric tests the amount of colored light absorbed is directly
proportional to the concentration of the test factor producing the color and the path length through the sample. However,
for some tests the amount of colored light absorbed is inversely proportional to the concentration.
The choice of the correct optical filter and therefore the correct color or wavelength of light is important. It is interesting
to note that the filter that gives the most sensitive calibration for your test factor is the complimentary color of the test
sample. For example, the Nitrate-Nitrogen test produces a pink color proportional to the nitrate concentration in the
sample (the greater the nitrate concentration, the darker the pink color). A green filter is used since a pinkish-red solution
absorbs mostly green light.
REAGENT BLANK
Some tests will provide greater accuracy if a reagent blank is determined, to compensate for any color or turbidity resulting
from the reagents themselves. A reagent blank is performed by running the test procedure on 10 mL of demineralized water.
With the reagent blank in the colorimeter chamber, scan the blank then perform the unknown tests as described.
COLORIMETER TUBES
Colorimeter tubes which have been scratched through excess use should be discarded and replaced with new ones. Dirty
tubes should be cleaned on both the inside and outside. Fingerprints on the exterior of the tubes can cause excessive light
scattering and result in errors. Handle the tubes carefully, making sure the bottom half of the tube is not handled.
LaMotte makes every effort to provide high quality colorimeter tubes. However, wall thicknesses and diameter of tubes may
still vary slightly. This may lead to slight variations in results (e.g. if a tube is turned while in the sample chamber, the
reading will likely change slightly). To eliminate this error put the tubes into the colorimeter chamber with the same
orientation every time.
The tubes that are included with the colorimeter have an index mark to facilitate this.
1985-01 •10/01
3
Page 4

SAMPLE DILUTION TECHNIQUES
If a test result exceeds the lower end of the calibration chart for a specific test, you must dilute your sample. Repeat the test
to obtain a reading which is in the concentration range for the test. The reading is multiplied by the appropriate dilution
factor. If the reading exceeds the high end of the calibration chart, a reagent blank should be run for best results. (Note:
These comments are not true for colorimetric determination of pH.)
EX AM PLE: Mea sure 5 mL of the wa ter sam ple into a grad u ated cyl in der. Add de min er al ized wa ter un til the cyl in -
der is filled to the 10 mL line. The sam ple has been di luted by one-half, and the di lu tion fac tor is
there fore 2. Per form the test pro ce dure, then mul ti ply the re sult ing con cen tra tion by 2 to ob tain the
test re sult.
The following table gives quick reference guidelines on dilutions of various proportions. All dilutions are based on a 10 mL
volume, so several dilutions will require small volumes of the water sample. Graduated pipets should be used for all
dilutions.
SIZE OF SAMPLE
DEIONIZED WATER TO
BRING VOLUME TO 10 ML MULTIPLICATION FACTOR
10 mL 0 mL 1
5 mL 5 mL 2
2.5 mL 7.5 mL 4
1 mL 9 mL 10
0.5 mL 9.5 mL 20
If the above glassware is not available, dilutions can be made with the colorimeter tube. Fill the colorimeter tube to the 10
mL line with the sample then transfer it to another container. Add 10 mL volumes of demineralized water to the container
and mix. Transfer back 10 mL of the diluted sample to the colorimeter tube and test it. Continue diluting and testing until
a reading, which is in the concentration range for the test, is obtained. Be sure to multiply the concentration found by the
dilution factor (the number of total 10 mL volumes used).
EX AM PLE: 10 mL of sam ple is di luted with three 10 mL vol umes of de min er al ized wa ter; the di lu tion fac tor is four.
INTERFERENCES
LaMotte reagents systems are designed to minimize most common interferences. Each individual test discusses interferences
unique to that test. You should be aware of possible interferences in the water being tested.
The reagent systems also contain buffers to adjust the water sample to the ideal pH for the reaction. It is possible that the
buffer capacity of the water sample may exceed the buffer capacity of the reagent system and the ideal pH will not be
obtained. If this is suspected, measure the pH of a reacted distilled water reagent blank using a pH meter. This is the ideal
pH for the test. Measure the pH of a reacted water sample using the pH meter. If the pH is significantly different from the
ideal value, the pH of the sample should be adjusted before testing.
Interferences due to high concentration of the substance being tested for, can be over come by sample dilution.
STRAY LIGHT INTERFERENCE
Normal indoor lighting causes no interference with the DC1600 Colorimeter. Testing in bright sunlight may result in
interferences due to stray light. This interference can be eliminated by covering the colorimeter chamber with the black
cap when zeroing the meter and reading samples. Turbidimetric determinations (i.e. sulfate, potassium, cyanuric acid and
turbidity) are most likely to exhibit a stray light interference. Always check for stray light interferences when you do
turbidimetric determinations. Colorimetric test are less likely to have this problem.
To determine if stray light is causing an interference place a reacted sample in the colorimeter chamber. Press the “30
Second Read” button. As soon as the reading stabilizes (usually 5–7 seconds), record the reading. Cover the colorimeter
chamber with something (i.e. a hand or any opaque object), if the reading changes then there is an interference. If the
reading changes only 1 - 2 % T then the interference is negligible except for the most critical tests. If sample turbidity is
causing a stray light interference a filtration may be needed.
1985-01 • 10/01
4
Page 5

GENERAL INFORMATION
LIMITS OF LIABILITY
Under no circumstances shall LaMotte Company be liable for loss of life, property, profits, or other damages incurred
through the use or misuse of their products.
PACKAGING AND DELIVERY
Experienced packaging personnel at LaMotte Company assure the adequate protection against normal hazards encountered
in transportation of shipments. After the product leaves the manufacturer, all responsibility for its safe delivery is assured by
the transportation company. Damage claims must be filed immediately with the transportation company to receive
compensation for damaged goods.
Should it be necessary to return the instrument for repair or servicing, pack instrument carefully in suitable container with
adequate packing material. Attach a letter to the shipping carton describing the kind of trouble experienced. This valuable
information will enable the service department to make the required repairs more efficiently.
EPA COMPLIANCE
The DC1600 Colorimeter is an EPA-Accepted instrument. EPA-Accepted means that the instrument meets the
requirements for colorimeters as found in test procedures that are approved for the National Primary Drinking Water
Regulations (NPDWR) or National Pollutant Discharge Elimination System (NPDES) compliance monitoring programs.
EPA-Accepted instruments may be used with approved test procedures without additional approval.
REPLACING LIGHT BULB
Turn the meter over, making sure the battery compartment is in the upper left corner (This is important). Remove the four
screws from the bottom of the colorimeter and remove the base. The burned out light bulb is attached to the small
rectangular circuit located just to the right (your right) of the light chamber. Remove the two screws that connect the
circuit and SAVE THE BURNED OUT LIGHT BULB. The light bulb must be returned to LaMotte Company for
replacement. Make sure the two washers are still in place. Remove the screw in the upper left corner of the colorimeter and
detach the replacement circuit. Replace that screw. When fastening the fresh bulb in place, be sure both washers are
aligned. Align the base to the meter and replace the four original screws.
NOTE: If the re place ment bulb is sig nif i cantly dif fer ent from the orig i nal bulb, the “Set Blank” con trol may not have
enough range; if so, please call our tech ni cal sup port peo ple for as sis tance.
REPLACING THE BATTERY
The colorimeter is equipped with a battery check indication, the symbols BAT and ~ on the left hand side of the display,
that will be displayed when the battery needs to be replaced. The meter will still provide valid readings, but the readings
may drift. Eventually the meter will not have enough power to turn on. To replace the battery, remove the panel on the
back of the meter and detach the battery. Replace with a fresh alkaline 1604A type (9V) battery.
Battery polarity (+ & –) must never be reversed, even momentarily. If it is, the instrument will be rendered
INOPERABLE, and must be returned to LaMotte Company for repair. This will be considered a non-warranty repair.
Use appropriate caution when replacing the battery.
1985-01 • 10/01
5
Page 6

SPECIFICATIONS
IN STRU MENT TYPE
Multi-wavelength filter colorimeter _ internal, non-removable filters
READ OUT
1
3
inch digit LCD; displays 0–100%T
2
READ ABLE RES O LU TION
± 1%T
READING STA BIL ITY
± 0.2%T within 5 seconds of turn-on to automatic turn-off
READING IN TER VAL
Approximately 30 seconds with automatic turn-off, resettable
MEA SURE MENT WAVE LENGTHS
1 (420nm), 2 (460nm), 3 (510nm), 4 (530nm), 5 (570nm), 6 (605nm); switch selectable
WAVE LENGTH AC CU RACY
± 1 nanometers
PHO TO MET RIC AC CU RACY
± 0.5%T
SAM PLE CHAM BER
Indexed; accepts 21 mm diameter flat-bottomed test tubes (capped)
SOURCE LAMP
Tungsten filament bulb, 10,000 hour life (est.), spare included, field replaceable
POWER RE QUIRE MENTS
Battery Operation: Field replaceable 1604 type (9V)
Line Operation: 120/220V, 50/60 Hz, 2VA, with optionally-available adapter
DI MEN SIONS
(W x D x H) 190 x 140 90 mm
1
1
7
x 5
2
x 3
2
1
inches
2
WEIGHT
2 lbs.
1985-01 • 10/01
6
Page 7
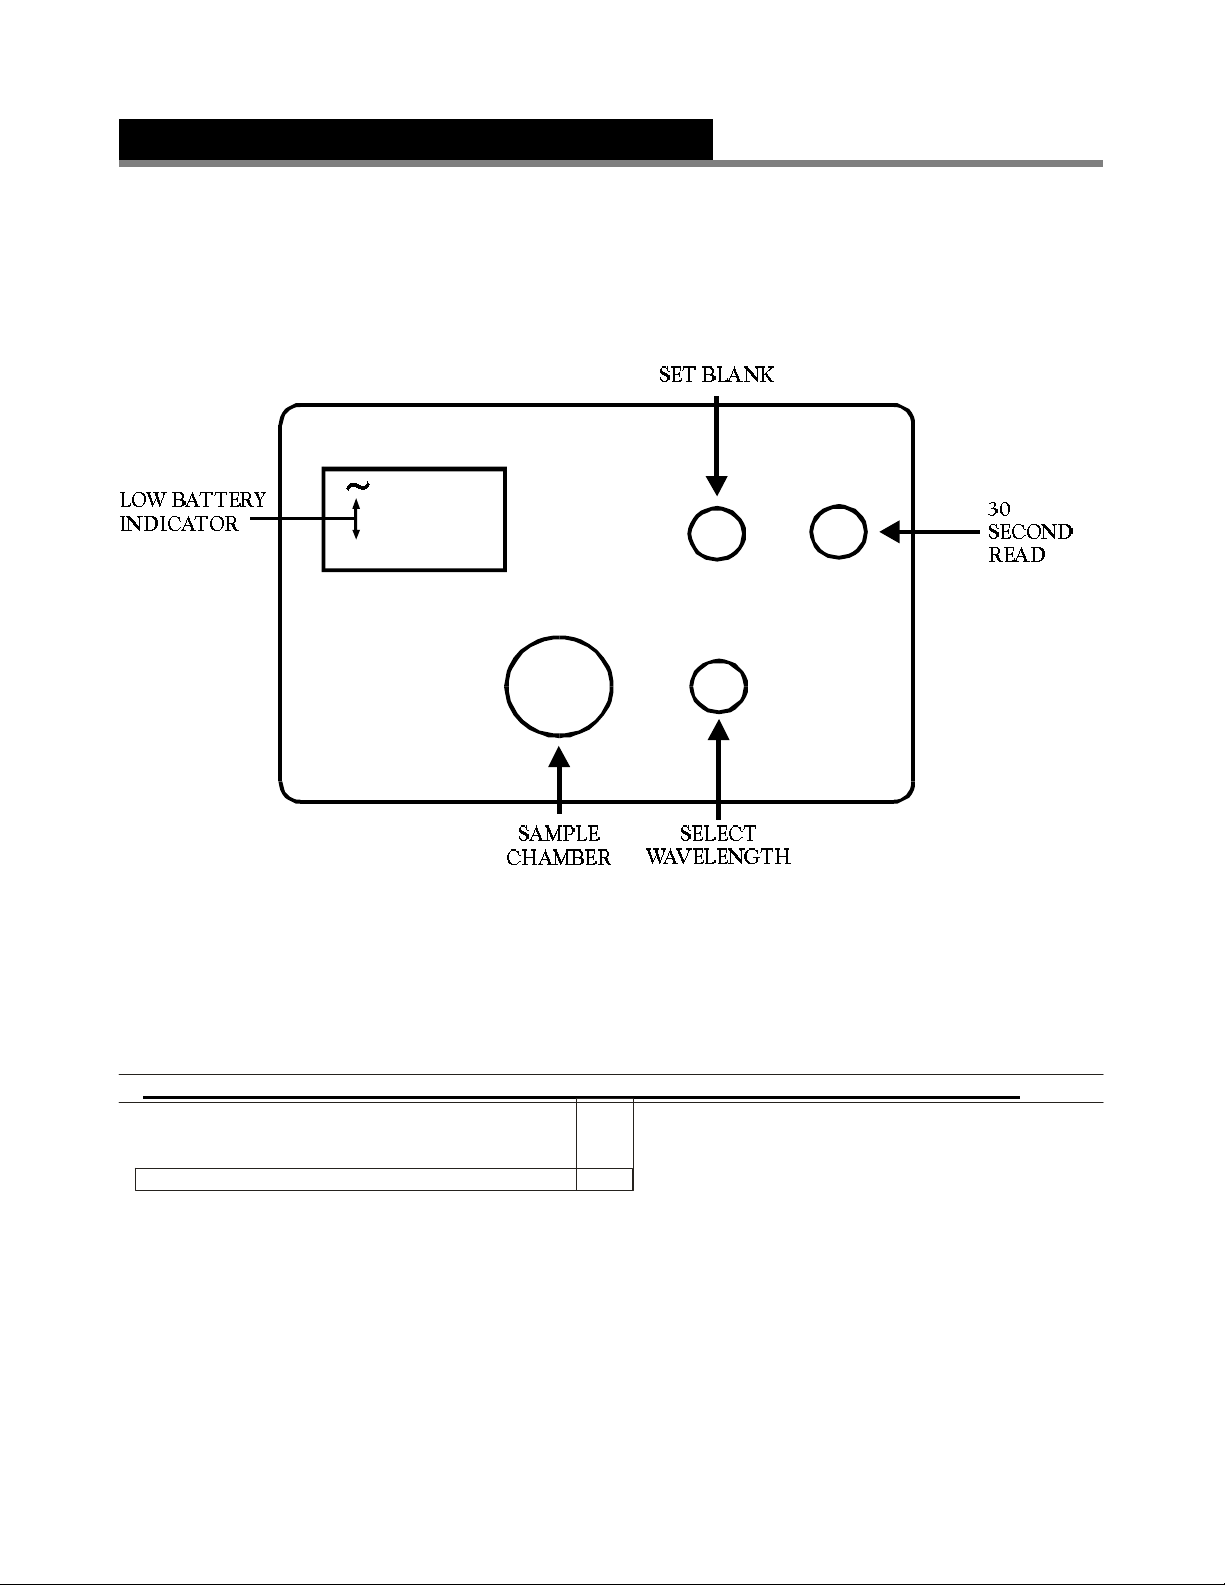
GENERAL OPERATING PROCEDURE
BAT
1. Rinse a clean colorimeter tube (0967) with sample water. Fill to the 10 mL line with sample.
2. Select the appropriate wavelength (1 to 7) from the “Select Wavelength” knob. Insert tube into the colorimeter
chamber. (Press firmly on the tube, overcoming the slight resistance, to make sure the tube rests on the bottom of the
chamber.)
3. Press the “30 Second Read” button (the BAT and ~ symbols will flash on briefly). Adjust instrument with “Set Blank”
control until meter reads exactly 100%T. The instrument is now ready to read an unknown sample.
NOTE: See Battery Replacement section for more information.
4. Perform test outlined in the recommended procedures.
5. Insert sample into the colorimeter and press the “30 Second Read” button. As soon as the reading stabilizes
(usually 5–7 seconds), record the reading.
6. Consult the calibration chart for the corresponding concentration. For example, a reading of 75%T would be found by
reading 70%T on the left column of the chart and 5 across the top of the chart. Read down the column until the
columns intersect. The value at the intersection represents concentration in parts per million (ppm) or milligrams per
liter (mg/L).
TYPICAL CALIBRATION CHART
%T 9 8 7 6 5 4 3 2 1 0
90
80
70 0.00 0.01 0.01 0.02 0.02 0.02 0.03 0.03
60 0.04 0.04 0.04 0.05 0.05 0.06 0.06 0.06 0.07 0.07
50 0.08 0.08 0.08 0.09 0.09 0.10 0.10 0.10 0.11 0.11
40 0.11 0.12 0.12 0.13 0.13 0.13 0.14 0.14 0.14 0.15
30 0.15 0.16 0.16 0.16 0.17 0.17 0.18 0.18 0.19 0.19
20 0.20 0.20 0.21 0.22 0.22 0.23 0.24 0.25 0.26 0.27
10 0.28 0.30
NOTE: The num ber of dec i mal places in each num ber in the cal i bra tion chart is pro vided for in ter po la tion pur poses
NOTE: %T read ings above the high est %T value on the chart should be in ter preted as 0 ppm. For ex am ple, on the
only and does not nec es sar ily re flect the sen si tiv ity of each test.
above chart, read ings above 77%T would cor re spond to 0 ppm. Some tests may have re sults above 100%T.
1985-01 • 10/01
7
Page 8

pH
PROCEDURE
1. Use the 10 g Soil Measure (1164) to add one level measure of the soil sample to a 50 mL beaker (0944). Use the
graduated cylinder (0416) to add 10 mL of deionized water. Stir thoroughly.
2. Let stand for at least 30 minutes, stirring two or three times.
3. Read pH on pH meter. Stir mixture just prior to making the pH reading.
LIME RE QUIRE MENT - WOOD RUFF METHOD
PROCEDURE
1. Use the 10 g Soil Measure (1164) to add one level measure of the soil sample to a 50 mL beaker (0944). Use the
graduated cylinder (0416) to add 10 mL of deionized water. Stir thoroughly.
2. Let stand for at least 15 minutes.
3. Add 20 mL of Woodruff Buffer Solution (5272). Mix well, and let stand for at least 20 minutes, stirring two or three
times.
4. Read on pH meter. Stir mixture just prior to making reading.
5. Each 0.1 pH unit drop from pH 7.0 indicates a lime requirement equivalent to 1000 lbs calcium carbonate (CaCO3).
1985-01 • 10/01
8
Page 9

SOLUBLE SALTS (TOTAL DISSOLVED SALTS)
PROCEDURE
1. Fill a 50 mL beaker (0944) with the soil to be tested, tapping it lightly to eliminate any trapped air and then strike off
the surface.
2. Empty the contents of the beaker into the 300 mL bottle (0991) and add 100 mL of deionized water.
3. Cap the bottle and shake vigorously. Allow to stand for thirty minutes. During the thirty minute waiting period the
bottle should be shaken vigorously three or four times.
4. Filter the contents of the bottle using funnel (0459) and filter paper (0463) and collect the filtrate in a 100 mL bottle
(0990) which is then used as a conductivity chamber.
5. Take conductivity reading according to method given for General Operating Procedure.
6. To convert conductivity to Soluble Salts (Total Dissolved Salts), use the following formula.
Micromhos/cm @ 25°C x 0.7 = ppm of sol u ble salts (to tal dis solved salts)
SOLUBLE SALTS
Below 1000 parts per million most plants will get along well. However, green-house and many sensitive garden plants may
be damaged if the soluble salts are over 500 parts per million of chlorides, particularly some of the most sensitive legumes. If
the soluble salts are greater that 1000 parts per million, the chlorides and sulfates should be determined to learn whether
the soluble salts are chlorides or sulfates. In calcareous soils, the sulfates represent gypsum and have little effect on the
production of plants.
1985-01 • 10/01
9
Page 10

SOIL COLORIMETER TESTS
INSTRUCTIONS
pH and Lime Requirement are determined by means of the pH meter. The conductivity meter is used for determining
soluble salts. Calcium, Magnesium and Chlorides are determined by titration. All of the other readings are made on the
colorimeter.
EXTRACTION
The following method of extraction is employed for obtaining the soil filtrate for the tests for Nitrate Nitrogen,
Phosphorous, Potassium, Calcium, Magnesium, Ammonia Nitrogen, Nitrite Nitrogen, Manganese, Copper, Zinc, and Iron.
Separate extractions are required for the Chloride and Sulfate tests. Consult the LaMotte Soil Handbook for information
on sampling and preparation of sample for testing.
PROCEDURE
1. Use the 1 mL pipet (0354) to add 5 mL of the *Acid Extracting Solution (6361) to the 100 mL graduated cylinder
(0419). Add deionized water to 75 mL graduation.
2. Pour this solution into the 100 mL bottle (0990).
3. Use the Soil Measure (1165) to add 15 g (one level measure) of the soil sample to the bottle.
4. Cap the bottle and shake for a period of 5 minutes.
5. Use the funnel (0459) and filter paper (0463) to filter and collect all of the soil filtrate in a 100 mL bottle (0990).
6. The soil filtrate is used for all of the tests listed above, except Chloride and Sulfate.
SINGLE TEST PROCEDURE
1. Use the 1 mL pipet (0354) to add 1 mL of the *Acid Extracting Solution (6361) to the graduated vial (0989), then
add deionized water to the graduation.
2. Use the 1.0 g spoon (0697) to add 3 grams of soil to the extracting solution in the vial.
3. Cap the vial and shake for a period of 5 minutes.
4. Filter, using the funnel (0459) and filter paper (0463) and collect all of the soil filtrate.
5. The soil filtrate is used for all of the tests except Chlorides and Sulfates.
NEUTRALIZATION OF SOIL FILTRATE
In the tests for Calcium, Magnesium, Ammonia Nitrogen, Manganese, Copper, Zinc, and Iron the acidity of the soil filtrate
must be neutralized before proceeding with the test. This is done by treating the measured soil filtrate with *Sodium
Hydroxide, 15% (7886) until the solution shows a green or blue color when spotted on a strip of Bromthymol Blue Test
Paper (2931). This is done by adding the *Sodium Hydroxide, 15% (7886) solution to the soil filtrate, one drop at a time
while stirring with the plastic rod (0824). The stirring rod is touched to the Bromthymol Blue test paper after the addition
of each drop of *Sodium Hydroxide, 15% (7886), until the color changes from yellow to green or blue.
1985-01 • 10/01
10
Page 11

AMMONIA NITROGEN TEST
NESSLERIZATION METHOD
QUANTITY CONTENTS CODE
30 mL Ammonia Nitrogen Reagent #1 V-4797-G
2 x 30 mL *Ammonia Nitrogen Reagent #2 *V-4798-G
1 Pipet , 1 mL , plastic 0354
*WARNING: Reagents marked with a * are considered hazardous substances. Material Safety Data Sheets (MSDS) are
supplied for these reagents. For your safety read label and MSDS before using.
A fertile soil may be expected to give a low ammonia nitrogen test reading, unless there has been a recent application of
nitrogenous fertilizer in forms other than the nitrate. The rapid disappearance of ammonia after fertilizer application
indicates the desired transformation of the ammonia to the more available nitrate compounds. In forest soils, ammonia is
the most abundant available form of nitrogen. If there is a satisfactory rate of nitrogen transformation, the humus layers of a
forest soil will produce very high concentrations of ammonia nitrogen.
RANGE: 0-150 lbs/A
METHOD: Am mo nia forms a col ored com plex with Nessler’s Re agent in pro por tion to the amount of am mo -
nia pres ent in the sam ple. Ro chelle salt is added to pre vent pre cip i ta tion of cal cium or m ag ne sium
in undistilled sam ples.
IN TER FER ENCES: Sam ple tur bid ity and color may in ter fere. Tur bid ity may be re moved by fil tra tion pro ce d ure. Color
in ter fer ences may be elim i nated by ad just ing the in stru ment to 100%T with a sam ple blank.
PROCEDURE
1. Use the 1 mL pipet (0354) to transfer 2 mL of soil filtrate into a clean colorimeter tube (0967) and dilute to the 10 mL
mark with deionized water. Mix and neutralize according to the procedure on page 10.
2. Select setting 1 on the “Select Wavelength” knob.
3. Insert sample into chamber and press the “30 Second Read” button. Adjust “100"%T with the ”Set Blank" knob.
4. Remove sample tube and add 12 drops of Ammonia Nitrogen Reagent #1 (4797), cap and mix.
5. With the 1.0 mL pipet (0354), add one measure of *Ammonia Nitrogen Reagent #2 (4798) to the tube, cap and mix.
Allow five minutes for maximum color development.
6. At the end of a 5 minute waiting period, insert sample into colorimeter, press “30 Second Read” button and measure
%T as soon as reading stabilizes.
7. Consult chart to find the concentration of Ammonia Nitrogen in pounds per acre.
AMMONIA NITROGEN CALIBRATION CHART (LBS/ACRE)
%T 9 8 7 6 5 4 3 2 1 0
80 0.0 0.5 1.5 2.0 3.0 3.5
70 4.5 5.5 6.0 7.0 8.0 8.5 9.5 10.5 11.5 12.0
60 13.0 14.0 15.0 16.0 17.0 18.0 19.0 20.0 21.0 22.0
50 23.0 24.0 25.5 26.5 27.5 28.5 30.0 31.0 32.5 33.5
40 35.0 36.0 37.5 39.0 40.5 42.0 43.0 44.5 46.5 48.0
30 49.5 51.0 53.0 54.5 56.5 58.0 60.0 62.0 64.0 66.0
20 68.5 70.5 73.0 75.5 78.0 80.5 83.5 86.0 89.0 92.0
10 95.5 99.0 102.5 106.5 110.5 115.0 120.0 125.0 130.5 137.0
0 143.5 151.0
AMMONIA NITROGEN CONCENTRATION CHART
%T RANGE POUNDS PER ACRE
58-100% Low 0-24 lbs/acre
29-57% Medium 25-68 lbs/acre
0-28% High Over 71 lbs/acre
1985-01 • 10/01
11
Page 12

CALCIUM & MAGNESIUM TEST
SCHWARZENBACH EDTA METHOD
QUANTITY CONTENTS CODE
30 mL *Calcium & Magnesium Buffer *5126-G
60 mL Standard EDTA Reagent 5254-H
100 Calcium Hardness Indicator Tablets T-5250-J
30 mL Calcium Magnesium Inhibitor Reagent 3922-G
30 mL *CM Indicator Reagent *6522WT-G
30 mL *Sodium Hydroxide w/Metal Inhibitors *4259-G
15 mL *Inhibitor Solution *9258-E
15 mL *TEA Reagent *3921-E
2 Direct Reading Titrators , 0-1000 Range 0384
1 Pipet , transfer, plastic 0364
1 Test tube, 5-10-15 mL , glass, w/cap 0778
*WARNING: Reagents marked with a * are considered hazardous substances. Material Safety Data Sheets (MSDS) are
supplied for these reagents. For your safety read label and MSDS before using.
The amount of total calcium in soils may range from as little as 0.1% to as much 25%. A calcium deficiency is rarely a
problem due to widely accepted practice of applying lime to soil to raise the pH to the proper range for optimum plant
growth. As an important mineral nutrient, calcium is a component of cell walls in plants and is known to stimulate root
and leaf development as well as activate several enzyme reactions involved in plant metabolism. Indirectly, calcium
influences crop yields by reducing soils acidity and by reducing the toxicity of several other soil minerals such as manganese,
zinc, and aluminum.
The Schwarzenbach EDTA titration method, used to determine calcium and magnesium, involves two titrations. The first
titration gives the calcium and magnesium content, the second only calcium. Magnesium is calculated from the difference
between the titration values.
Carefully read the LaMotte Direct Reading Titrator Manual before performing the titrations described below.
RANGE: Cal cium 0-400 lbs/A
Mag ne sium 0-240 lbs/A
METHOD: Ti tra tion with Schwarzenbach EDTA
IN TER FER ENCE: Sam ple color and tur bid ity may in ter fere with end point.
DILUTION OF SOIL EXTRACT
Use the 30 mL graduated cylinder (0418) to measure 10 mL of the soil extract and transfer it to a 50 mL beaker (0944).
Add 10 mL of deionized water, mix and neutralize according to the procedure on page 10.
TITRATION A, CALCIUM & MAGNESIUM
1. Fill the test tube (0778) to the 5 mL line with the soil extract from above. Dilute to the 10 mL line with deionized
water.
2. Add 5 drops of Calcium Magnesium Inhibitor Reagent (3922).
3. Wait 5 minutes.
4. Use a transfer pipet (0364) to add 5 drops of *Calcium & Magnesium Buffer (5126).
5. Add 10 drops of *CM Indicator (6522WT).
6. Fill the Direct Reading Titrator (0384) with the Standard EDTA Reagent (5254). Insert the tip of the Titrator into the
center hole of the test tube cap.
7. While gently swirling the tube, slowly press the plunger to titrate until the color changes from red to blue.
8. Read the Titrator scale at the tip of the plunger and multiply by 5.16. This is Titration Value A.
1985-01 • 10/01
12
Page 13

TITRATION B, CALCIUM
1. Fill the test tube (0778) to the 5 mL line with the diluted soil extract. Dilute to 10 mL with deionized water.
2. Add 2 drops of *Inhibitor Solution (9258).
3. Add 2 drops of *TEA Reagent (3921).
4. Add 8 drops of *Sodium Hydroxide w/Metal Inhibitors (4259).
5. Add one Calcium-Hardness Indicator Tablet (T-5250) to the test sample. Cap and shake to dissolve the tablet. A red
color will develop.
6. Immediately titrate the sample. Fill the Direct Reading Titrator with Standard EDTA Reagent (5254). Insert the tip of
the Titrator into the hole in the cap of the test tube.
7. While gently shaking the tube, slowly press the plunger to titrate until the red color changes to a clear blue and does
not revert to red upon standing 1 - 2 minutes.
8. Read the Titrator scale at the tip of the plunger and multiply by 5.16. This is Titration Value B.
FINAL RESULTS
Calcium Content = 0.4 x Titration Value B = ppm Ca
Magnesium Content = 0.24 (Value A - Value B) = ppm Mg
Multiply the results by 2 to obtain the content in pounds per acre.
EX AM PLE:
Titration Value A is 640 ppm CaCO
Titration Value B is 520 ppm CaCO
3
3
Calcium = 0.4 x 520 = 208 ppm Ca
= 208 x 2 = 416 lb/acre Ca
Magnesium =0.24 (640-520)
= 0.24 x 120 = 29 ppm Mg
= 29 x 2 = 58 lb/acre Mg
1985-01 • 10/01
13
Page 14

CHLORIDE TEST
DIRECT READING TITRATOR METHOD
QUANTITY CONTENTS CODE
15 mL *Chloride Reagent #1 *4504-E
60 mL *Silver Nitrate, 0.141N *3062DR-H
1 Extracting Tube, plastic, w/cap 0989
1 Spoon, 1g 0697
1 Test Tube, 5-10-15 mL , glass, w/cap 0778
1 Direct Reading Titrator , 0-1000 Range 0384
*WARNING: Reagents marked with a * are considered hazardous substances. Material Safety Data Sheets (MSDS) are
supplied for these reagents. For your safety, read label and accompanying MSDS before using.
Chlorides are present in practically all soils. Application of fertilizer may increase chloride levels. Chlorides are removed
from soil by leaching. Excessive concentrations are toxic to plants. A high test reading, particularly where stunted growth
has been observed, may indicate poisoning due to high chloride levels in the soil.
RANGE: 0-1000 lbs/A
METHOD: In a neu tral or slightly al ka line so lu tion, po tas sium dichromate in di cates the end point o f the sil ver
IN TER FER ENCES: Bro mine, Io dide, and Cy a nide reg is ter as equiv a lent chlo ride con cen tra tions.
Carefully read the LaMotte Direct Reading Titrator Manual before performing the titration procedure described below. The Titrator is
calibrated in terms of parts per million chloride and each minor division on the Titrator scale equals 20 ppm.
ni trate ti tra tion.
PROCEDURE
1. Fill a clean extracting tube (0989) to the mark with deionized water.
2. Add 3 one gram measures of soil using the 1 g spoon (0697). Cap tube and shake for five minutes.
3. Filter and collect all of the soil filtrate using the funnel (0459) and filter paper (0463). The filtrate does not have to be
clear since a slight turbidity does not interfere in the test.
4. Fill the test tube (0778) to the 10 mL line with the filtrate.
5. Add three drops of *Chloride Reagent #1 (4504) to the sample. Cap and shake to mix. A yellow color will result.
6. Fill the Direct Reading Titrator (0384) with *Silver Nitrate, 0.141 (3062DR) in the manner described in the
instruction manual.
7. Titrate the test sample with *Silver Nitrate, 0.141 (3062DR) until the yellow color changes permanently to
pink. Record the Titrator reading. If the plunger reaches the bottom mark (1000 ppm) on the Titrator scale before the
endpoint color change occurs, refill the Titrator and continue the titration procedure. Be sure to include the value of
the original amount added (1000 ppm) when recording the final result.
This test is valuable on saline soils or when contamination from sea water or sea spray is suspected. Normal soils of humid
regions rarely give readable tests, except when recently receiving liberal amounts of fertilizers containing chlorides.
1985-01 • 10/01
14
Page 15

COPPER TEST
DIETHYZDITHIOCARBAMATE METHOD
QUANTITY CONTENTS CODE
15 mL *Copper Reagent *6446-E
*WARNING: Reagents marked with a * are considered hazardous substances. Material Safety Data Sheets (MSDS) are
supplied for these reagents. For your safety, read label and accompanying MSDS before using.
Like many other micronutrients, the amount of available copper varies considerably with the type of soil. Well drained
sandy soils are usually low in copper while heavily clay-type soils contain an abundant supply of copper. Like manganese,
copper may be unavailable in soils that have a high organic make-up because it readily forms insoluble complexes with
organic compounds.
Generally from 0.2-25 lbs/A of copper is added to the soil to correct a deficient level. Copper is another metal that is
necessary in the formation of the chlorophyll molecule and like other metals, e.g. iron, manganese and zinc acts as a
catalyst.
RANGE: 0-25 ppm
METHOD: Cu pric ions form a yel low col ored che late with Diethyldithiocarbamate around pH 9-10, in pro por -
tion to the con cen tra tion of cop per in the sam ple.
IN TER FER ENCES: Bis muth, co balt, mer cury, nickel and sil ver ions and chlo rine (6 ppm or greater) in ter fere se ri ously
and must be ab sent.
PROCEDURE
1. Fill a clean colorimeter tube (0967) to the 10 mL line with the soil filtrate then neutralize according to the procedure
on page 10.
2. Select setting 2 on the “Select Wavelength” knob.
3. Insert tube containing sample into chamber and press the “30 Second Read” button. Adjust “100"%T with the ”Set
Blank" knob.
4. Remove the tube and add 5 drops of *Copper Reagent (6446). Cap and mix contents. A yellow color indicates the
presence of copper.
5. Insert sample into colorimeter chamber, press the “30 Second Read” button and measure %T as soon as reading
stabilizes.
6. Consult chart to find the concentration of Copper in parts per million.
NOTE: There is a ten dency for the me ter to drift with the use of the blue fil ter (415nm) as a re sult of the photocell’s
re sponse to blue light. For best re sults, af ter sam ple has been in serted into cham ber and cov ered, al low ap prox i mately 10 sec onds be fore tak ing the read ing.
COPPER CALIBRATION CHART (PPM)
%T 9 8 7 6 5 4 3 2 1 0
90 0.0 0.1 0.2 0.3 0.4 0.5 0.6 0.7 0.8 0.9
80 1.0 1.1 1.2 1.3 1.4 1.5 1.6 1.7 1.8 1.9
70 2.0 2.2 2.3 2.4 2.5 2.6 2.8 2.9 3.0 3.1
60 3.3 3.4 3.5 3.7 3.8 3.9 4.1 4.2 4.4 4.5
50 4.7 4.8 5.0 5.2 5.3 5.5 5.6 5.8 6.0 6.2
40 6.4 6.5 6.7 6.9 7.1 7.3 7.5 7.7 8.0 8.2
30 8.4 8.6 8.9 9.1 9.4 9.6 9.9 10.2 10.5 10.8
20 11.1 11.4 11.7 12.1 12.4 12.8 13.2 13.6 14.0 14.4
10 14.9 15.4 15.9 16.4 17.0 17.6 18.3 19.0 19.8 20.7
0 21.6 22.7 23.9 25.3
COPPER CONCENTRATION CHART
%T RANGE PARTS PER MILLION
89-100% Low 0-1 ppm
71-88% Marginal 1-3 ppm
63-70% Adequate 3-4 ppm
1985-01 • 10/01
15
Page 16

IRON TEST - BIPYRIDYL METHOD
QUANTITY CONTENTS CODE
30 mL *Iron Reagent #1 *V-4450-G
5 g *Iron Reagent #2 Powder *V-4451-C
1 Pipet , 0.5 mL 0353
1 Spoon, 0.1 g 0699
*WARNING: Reagents marked with a * are considered hazardous substances. Material Safety Data Sheets (MSDS) are
supplied for these reagents. For your safety, read label and accompanying MSDS before using.
Iron is essential to the formation of chlorophyll, and iron deficiency causes chlorosis. While most soils contain abundant
iron, only a fraction is soluble and readily available to the growing plant. This is particularly true in neutral or alkaline soils.
Acid soils contain higher levels of available iron.
RANGE: 0-25 ppm
METHOD: Fer ric iron is re duced to fer rous iron and sub se quently forms a col ored com plex with bipyridyl for
a quan ti ta tive mea sure of to tal iron.
IN TER FER ENCES: Strong ox i diz ing agents in ter fere, as well as cop per and co balt in ex cess of 5.0 mg/L
PROCEDURE
1. Fill a clean colorimeter tube (0967) to the 10 mL line with the soil filtrate then neutralize according to the procedure
on page 10.
2. Select setting 3 on the “Select Wavelength” knob. Press the “30 Second Read” button.
3. Insert tube containing sample into chamber and adjust to “100"%T with the ”Set Blank" knob. This is the 100%T
blank.
4. Remove the tube from the chamber. With 0.5 mL pipet (0353) add one measure of *Iron Reagent #1 (4450) to sample.
Cap and mix.
5. With the 0.1 g spoon (0699) add one level measure of *Iron Reagent #2 Powder (4451) to sample. Cap and shake
vigorously for 30 seconds.
6. Allow three minutes for maximum color development.
7. After three minutes, insert sample into colorimeter chamber, press the “30 Second Read” button and measure %T as
soon as reading stabilizes.
8. Consult the calibration chart to find the concentration of Iron in parts per million (ppm).
IRON CALIBRATION CHART (PPM)
%T 9 8 7 6 5 4 3 2 1 0
90 0.1 0.2 0.3 0.4 0.4 0.5 0.6 0.7 0.8 0.9
80 1.0 1.1 1.2 1.3 1.4 1.5 1.6 1.7 1.8 2.0
70 2.1 2.2 2.3 2.4 2.5 2.6 2.8 2.9 3.0 3.1
60 3.3 3.4 3.5 3.7 3.8 3.9 4.1 4.2 4.4 4.5
50 4.6 4.8 5.0 5.1 5.3 5.4 5.6 5.8 6.0 6.1
40 6.3 6.5 6.7 6.9 7.1 7.3 7.5 7.7 7.9 8.1
30 8.4 8.6 8.9 9.1 9.4 9.6 9.9 10.2 10.5 10.8
20 11.1 11.4 11.8 12.1 12.5 12.9 13.3 13.7 14.1 14.6
10 15.0 15.6 16.1 16.7 17.3 17.9 18.7 19.4 20.3 21.2
0 22.2 23.4 24.7 26.2 28.0 30.3 33.2 37.4 44.7
IRON CONCENTRATION CHART
%T RANGE PARTS PER MILLION
86-100% Very Low 0-1.3 ppm
70-85% Low 1.4-3 ppm
57-69% Medium 3-5 ppm
32-56% Medium High 5-10 ppm
0-31% High Above 10-25 ppm
1985-01 • 10/01
16
Page 17

MANGANESE TEST - PERIODATE METHOD
QUANTITY CONTENTS CODE
10 g Manganese Buffer Reagent 6310-D
15 g *Manganese Periodate Reagent *6311-E
2 Spoon, 0.1 g 0699
The amount of manganese available to the plant is dependant upon the soil pH, the quantity of organic matter present, and
the degree of aeration. Manganese deficiency is most likely to occur in neutral or alkaline soils because it is less soluble at
elevated pH levels. In extremely acid soils, where manganese is more soluble, toxic levels may exist which may reduce crop
yields. In slightly acid sandy soils, manganese may leach past the root zone and not be able for utilization by the plant. Also,
it is believed that manganese may form insoluble organic complexes in some soils that have high humus content. All of the
factors contribute to the availability of this essential element. Only soil or tissue tests can determine whether deficient or
toxic levels of manganese exist.
Although manganese is known to play an important role in many of the metabolic processes in the plant, little is known
about its function other than it is required in some enzyme reactions and is required for the formation of chlorophyll in the
plant.
RANGE: 0-100 ppm
METHOD: Periodate method.
IN TER FER ENCES: Re ducing sub stances ca pa ble of re act ing with periodate or per manga nate must be elim i nated. Chlo -
rine in small amounts can be ox i dized by periodate .
PROCEDURE
1. Fill a clean colorimeter tube (0967) to the 10 mL line with the soil filtrate then neutralize according to the procedure
on page 10.
2. Select setting 4 on the “Select Wavelength” knob.
3. Insert tube containing sample into chamber and press the “30 Second Read” button. Adjust to “100"%T with the ”Set
Blank" knob.
4. Remove the tube and add two level measures of Manganese Buffer Reagent (6310) with the 0.1 g spoon (0699). Cap
and mix to dissolve the powder.
5. With the other 0.1 g spoon (0699), add one heaping measure of *Manganese Periodate Reagent (6311) to the contents
of the tube, cap and mix. An undissolved portion of the reagents may remain in the bottom of the tube without
adversely affecting the results.
6. Allow approximately two minutes for the pink color to develop if manganese is present.
7. Insert test sample into colorimeter chamber, press the “30 Second Read” button, and measure %T as soon as reading
stabilizes.
8. Consult chart to find the concentration of Manganese in parts per million (ppm).
MANGANESE CALIBRATION CHART (PPM)
%T 9 8 7 6 5 4 3 2 1 0
90 0.0 0.4 0.8 1.2 1.6 2.0 2.4 2.8 3.2
80 3.6 4.0 4.5 4.9 5.3 5.8 6.2 6.7 7.1 7.6
70 8.0 8.5 9.0 9.5 9.9 10.4 10.9 11.4 12.0 12.5
60 13.0 13.5 14.1 14.6 15.2 15.7 16.3 16.9 17.5 18.1
50 18.7 19.3 19.9 20.6 21.2 21.9 22.6 23.2 23.9 24.6
40 25.4 26.1 26.8 27.6 28.4 29.2 30.0 30.8 31.7 32.5
30 33.4 34.3 35.3 36.2 37.2 38.2 39.2 40.3 41.4 42.5
20 43.7 44.9 46.1 47.4 48.7 50.1 51.5 53.0 54.6 56.2
10 57.9 59.7 61.6 63.6 65.7 67.9 70.3 72.8 75.6 78.6
0 81.9 85.5 89.6 94.3 99.7
1985-01 • 10/01
17
Page 18

MANGANESE CONCENTRATION CHART
%T RANGE PARTS PER MILLION
86-100% Low 0-5 ppm
71-85% Medium 5-12 ppm
51-70% Medium High 13-24 ppm
32-50% High 25-40 ppm
0-31% Very High Over 40 ppm
1985-01 • 10/01
18
Page 19

NITRATE NITROGEN TEST
CADMIUM REDUCTION METHOD
QUANTITY CONTENTS CODE
2 x 60 mL *Mixed Acid Reagent *V-6278-H
5 g *Nitrate Reducing Reagent *V-6279-C
1 Spoon, 0.1g 0699
*WARNING: Reagents marked with a * are considered hazardous substances. Material Safety Data Sheets (MSDS) are
supplied for these reagents. For your safety, read label and accompanying MSDS before using.
Nitrogen is a component of the chlorophyll (green color) in plants, thus giving plants the rich green color characteristic of
a healthy plant. Nitrogen promotes succulence in forage crops and leafy vegetables. When used at the recommended rates,
nitrogen improves the quality of leaf crops. It also simulates the utilization of phosphorus, potassium and other essential
nutrient elements. The above-ground growth of plants is enhanced with nitrogen. Nitrogen hastens crop maturity
(assuming all other nutrients are adequately supplied and excessive nitrogen rates are not applied). Nitrogen is very
influential in fruit sizing.
RANGE: 0-150 lbs/A
METHOD: Pow dered cad mium is used to re duce ni trate to ni trite. The ni trite that is orig i nally pres ent plus re -
duced ni trate is de ter mined by diazotizing sul fa nil amide and cou pling with
N- (1 naphthyl )-ethylenediamine dihydrochloride to form a highly col ored azo dye which is
mea sured colorimetrically.
IN TER FER ENCES: Strong oxiding and re duc ing sub stances in ter fere. Low re sults might be ob tained for sam ples that
con tain high con cen tra tions of iron and cop per.
PROCEDURE
1. Select setting 4 on the “Select Wavelength” knob.
2. Use the 1 mL pipet (0354) to add 1 mL of soil filtrate to a clean colorimeter tube (0967) and dilute to the line with
deionized water. Cap tube and mix.
3. Measure 5 mL of the diluted soil filtrate to another colorimeter tube (0967), then add 5 mL of *Mixed Acid Reagent
(6278). Use the 10 mL graduated cylinder (0416) for these measurements. Cap the tube and mix, then insert tube into
colorimeter chamber and press the “30 Second Read” button. Adjust “100"%T with the ”Set Blank" knob.
4. Remove the tube from the chamber. Use the 0.1 g spoon (0699) to add two level measures of *Nitrate Reducing
Reagent (6279) to the contents of tube and cap.
5. Hold tube by index finger and thumb and mix by inverting approximately 50-60 times in a minute, then let stand 10
minutes for maximum color development. (NOTE: At the end of the waiting period an undissolved portion of the
*Nitrate Reducing Reagent may remain in the bottom of the tube without affecting the results.)
6. At the end of the 10 minute waiting period, insert tube into chamber of colorimeter, press the “30 Second Read”
button and measure %T as soon as reading stabilizes.
7. Consult chart to find the concentration of Nitrate Nitrogen, in the soil, in pounds per acre.
NITRATE NITROGEN CALIBRATION CHART (lbs/acre)
%T 9 8 7 6 5 4 3 2 1 0
90 2 3 5 6 7 8 10 11 12 14
80 15 16 18 19 20 22 23 25 26 27
70 29 30 32 34 35 37 38 40 42 43
60 45 47 48 50 52 54 56 58 60 62
50 64 66 68 70 72 74 76 78 81 83
40 86 88 90 93 96 98 101 104 107 110
30 113 116 119 122 125 129 132 136 140 144
20 148 152
1985-01 • 10/01
19
Page 20

NITRATE NITROGEN CONCENTRATION CHART
%T RANGE POUNDS PER ACRE
93-100% Low 0-9.0 lbs/acre
79-92% Medium 11-29 lbs/acre
65-78% Medium High 33-51 lbs/acre
43-64% High 53-100 lbs/acre
0-42% Very High Over 100 lbs/acre
1985-01 • 10/01
20
Page 21

NITRITE NITROGEN TEST
DIAZOTIZATION METHOD
QUANTITY CONTENTS CODE
2 x 60 mL *Mixed Acid Reagent *V-6278-H
5 g *Color Developing Reagent *V-6281-C
1 Spoon, 0.1g 0699
*WARNING: Reagents marked with a * are considered hazardous substances. Material Safety Data Sheets (MSDS) are
supplied for these reagents. For your safety, read label and accompanying MSDS before using.
Nitrites are formed as an intermediate step in the production of nitrate. Soils that are well drained and aerated contain only
small amounts of nitrite nitrogen. Excessive nitrites, which are toxic to plants, may result from soil conditions unfavorable
to the formation of nitrate, such as inadequate aeration. High nitrite readings may also be encountered in soils with large
amounts of nitrates, where a portion of the nitrate nitrogen decomposes to form nitrites.
RANGE: 0-53 lbs/A
METHOD: The diazonium com pound formed by diazotization of sul fa nil amide by ni trite in wa ter un der acid
con di tions is cou pled with N- (1-naphthyl )-ethylenediamine to pro duce a red dish-pur ple color
which is read colorimetrically.
IN TER FER ENCES: There are few known in ter fer ences of sub stances at con cen tra tions less than 1000 times that of ni -
trite; how ever, the pres ence of strong ox i dants or reductants may readily af fect the ni trite
con cen tra tions. High al ka lin ity (above 600 mg/L) will give low re sults due to a shift in pH.
PROCEDURE
1. Use the 1 mL pipet (0354) to add 2 mL of soil filtrate to a clean colorimeter tube (0967) and dilute to the line with
deionized water. Cap tube and mix.
2. Select setting 4 on the “Select Wavelength” knob.
3. Measure 5 mL of diluted soil filtrate into another colorimeter tube, then add 5 mL of *Mixed Acid Reagent (6278).
Use the small graduated cylinder (0416) for these measurements. Cap the tube and mix, then insert the tube into
colorimeter chamber and press the “30 Second Read” button. Adjust “100"%T with the ”Set Blank" knob.
4. Remove the tube from the chamber. Using the 0.1 g spoon (0699), add two level measures of *Color Developing
Reagent (6281) to the contents of tube and cap.
5. Shake tube for approximately one minute to dissolve the powder, then let stand for 5 minutes for maximum color
development.
6. At the end of the 5 minute waiting period, insert tube into chamber, press the “30 Second Read” button and measure
%T as soon as reading stabilizes.
7. Consult chart to find the nitrite nitrogen concentration in pounds per acre.
NITRITE NITROGEN CALIBRATION CHART (LBS/A)
%T 9 8 7 6 5 4 3 2 1 0
100 0.0 0.1 0.2
90 0.3 0.5 0.6 0.7 0.8 1.0 1.1 1.2 1.3 1.5
80 1.6 1.7 1.9 2.0 2.1 2.3 2.4 2.6 2.7 2.8
70 3.0 3.1 3.3 3.4 3.6 3.7 3.9 4.1 4.2 4.4
60 4.5 4.7 4.9 5.0 5.2 5.4 5.6 5.8 5.9 6.1
50 6.3 6.5 6.7 6.9 7.1 7.3 7.5 7.7 7.9 8.2
40 8.4 8.6 8.8 9.1 9.3 9.6 9.8 10.1 10.3 10.6
30 10.9 11.2 11.4 11.7 12.0 12.4 12.7 13.0 13.4 13.7
20 14.1 14.4 14.8 15.2 15.6 16.1 16.5 17.0 17.5 18.0
10 18.5 19.1 19.7 20.4 21.0 21.8 22.6 23.4 24.3 25.3
0 26.5 27.7 29.2 30.9 32.9 35.5 38.8 43.8 53.0
1985-01 • 10/01
21
Page 22

NITRITE NITROGEN CONCENTRATION CHART
%T RANGE POUNDS PER ACRE
86-100% Low 0-2 lbs/acre
73-85% Medium 2.5-4 lbs/acre
42-72% High 4.5-10 lbs/acre
0-41% Very High Over 10 lbs/acre
1985-01 • 10/01
22
Page 23

PHOSPHORUS TEST
ASCORBIC ACID REDUCTION METHOD
QUANTITY CONTENTS CODE
60 mL *Phosphate Acid Reagent *V-6282-H
5 g *Phosphate Reducing Reagent *V-6283-C
1 Pipet , 1 mL , plastic 0354
1 Spoon, 0.1 g 0699
*WARNING: Reagents marked with a * are considered hazardous substances. Material Safety Data Sheets (MSDS) are
supplied for these reagents. For your safety read label and accompanying MSDS before using.
Phosphorus is necessary for the hardy growth of the plant and activity of the cells. It encourages root development, and by
hastening the maturity of the plant, it increases the ratio of grain to straw, as well as the total yield. It plays an important
part in increasing the palatability of plants and simulates the formation of fats, convertible starches and healthy seed. By
stimulating rapid cell development in the plant, phosphorus naturally increases the resistance to disease. An excess of
phosphorus does not cause the harmful effect of excessive nitrogen and has an important balancing effect upon the plant.
RANGE: 0-99 lbs/A
METHOD: Am mo nium molybdate and an ti mony po tas sium tartrate re act in a fil tered acid me dium with di lute
so lu tion of PO4-2 to form an an ti mony-phosphomolybdate com plex. This com plex is re duced to an
in tense blue col ored com plex by ascor bic acid. The color is pro por tion ate to the amount of p hos phate pres ent. (Only orthophosphate forms a blue color in this test.) Polyphosphates (and some
or ganic phos pho rus com pounds) may be con verted to the orthophosphate form by sul fu ric acid d i ges tion. Or ganic phos pho rus com pounds may be con verted to the orthophosphate form by
per sul fate di ges tion.
IN TER FER ENCES: High iron con cen tra tions can cause pre cip i ta tion of and sub se quent loss of phos pho rus.
PROCEDURE
1. Use the 1 mL pipet (0354) to add 1 mL of the soil filtrate to a clean colorimeter tube (0967) and dilute to the 10 mL
line with deionized water.
2. Select setting 4 on the “Select Wavelength” knob.
3. Insert the tube containing the diluted soil filtrate into chamber and press the “30 Second Read” button. Adjust
“100"%T with the ”Set Blank" knob.
4. Remove the tube containing the diluted soil filtrate and add one measure of *Phosphate Acid Reagent (6282) with the
1 mL pipet (0354), cap tube and mix.
5. With the 0.1 g spoon (0699), add one level measure of *Phosphate Reducing Reagent (6283) and shake until
dissolved. Allow five minutes for full color development. Phosphates exhibit a clear blue color.
6. At the end of the waiting period, insert test sample into colorimeter chamber, press the “30 Second Read” button and
measure %T as soon as reading stabilizes.
7. Consult the chart to find the concentration of Phosphorus (P), in the soil, in pounds per acre.
PHOSPHORUS CALIBRATION CHART (LBS/A)
%T 9 8 7 6 5 4 3 2 1 0
90 0.2 1.0 1.7 2.4 3.1 3.9 4.6 5.4 6.2 6.9
80 7.7 8.5 9.3 10.1 10.9 11.8 12.6 13.5 14.3 15.2
70 16.1 17.0 17.9 18.8 19.7 20.7 21.6 22.6 23.6 24.6
60 25.6 26.7 27.7 28.8 29.9 31.0 32.1 33.2 34.4 35.6
50 36.8 38.0 39.3 40.5 41.8 43.2 44.5 45.9 47.3 48.8
40 50.2 51.8 53.3 54.9 56.5 58.2 59.9 61.7 63.5 65.4
30 67.3 69.3 71.3 73.4 75.6 77.9 80.2 82.6 85.1 87.8
20 90.5 93.3 96.3 99.4
1985-01 • 10/01
23
Page 24

PHOSPHORUS CONCENTRATION CHART
%T RANGE POUNDS PER ACRE
81-100% Very Low 0-14 lbs/acre
61-80% Low 16-34 lbs/acre
39-60% Medium 35-67 lbs/acre
0-38% High Over 70 lbs/acre
PHOS PHO RUS IN AL KALINE SOILS
A special extraction procedure is used for determining the available phosphorus content of Western U.S. alkaline soils
where the pH value is above 7.0.
EXTRACTION PROCEDURE
1. Use the 1 mL pipet (0354) to add 1 mL of the *Special NF Extracting Solution (6362) to the graduated vial (0989)
then add deionized water to the graduation.
2. Add 3 one gram measures of soil using the 1 g spoon (0697) to the extracting solution in the vial.
3. Cap the vial and shake for a period of 5 minutes.
4. Filter using the funnel (0459) and filter paper (0463). Collect all of the filtrate.
5. Perform the Phosphorus test according to the Phosphorus procedure given above.
1985-01 • 10/01
24
Page 25

POTASSIUM TEST
TETRAPHENYLBORON METHOD
QUANTITY CONTENTS CODE
30 mL *Sodium Hydroxide, 0.1N *4004WT-G
5g *Tetraphenylboron Powder *6364-C
1 Pipet , 1 mL 0354
1 Spoon, 0.05g 0696
*WARNING: Reagents marked with a * are considered hazardous substances. Material Safety Data Sheets (MSDS) are
supplied for these reagents. For your safety, read label and accompanying MSDS before using.
Potassium is not a component of the structural makeup of plants, yet it plays a vital role in the physiological and
biochemical functions of plants. The exact function of potassium in plants is not clearly understood, but many beneficial
factors, implicating the involvement and necessity of potassium in plant nutrition have been demonstrated. Some of these
factors are: it enhances disease resistance by strengthening stalks and stems; activates various enzyme systems within plants;
contributes to a thicker cuticle (waxy layer) which guards against disease and water loss; controls the turgor pressure within
plants to prevent wilting; enhances fruit size, flavor, texture and development and is involved in the production of amino
acids (the building blocks for protein), chlorophyll formation ( green-color), starch formation and sugar transport from
leaves to roots.
When present in large amounts, ammonia salts will produce a precipitate similar to that produced by potassium. If fertilizer
containing ammonia salts has recently been applied, or if the soil pH is below pH 5.0, perform the ammonia test before
performing the potassium test. A high ammonia nitrogen test result will alert the operator to a probable false high reading
in the potassium test; actual potassium tests will be somewhat lower.
RANGE: 0-500 lbs/A
METHOD: Po tas sium re acts with so dium tetraphenylboron to form a col loi dal white pre cip i tate in quan ti ties
pro por tional to the po tas sium con cen tra tion mea sured as tur bid ity.
IN TER FER ENCES: Cal cium and Mag ne sium at very high con cen tra tions.
PROCEDURE
1. Use the 1 mL pipet (0354) to add 2 ml of the soil filtrate to a clean colorimeter tube (0967) and dilute to the 10 mL
line with deionized water.
2. Select setting 1 on the “Select Wavelength” knob.
3. Insert the tube containing the diluted soil filtrate into chamber and press the “30 Second Read” button. Adjust
“100"%T with the ”Set Blank" knob.
4. Remove the tube containing the diluted soil filtrate and add 4 drops of *Sodium Hydroxide, 1.0 N (4004) and mix.
5. With the 0.05 g spoon (0696), add 1 level measure of *Tetraphenylboron Powder (6364). Cap the tube and shake
vigorously until all of the powder has dissolved.
6. After standing 5 minutes, shake the tube to suspend any settled precipitate and immediately place it in the colorimeter
chamber, press the “30 Second Read” button and measure the %T as soon as the reading stabilizes.
7. Consult the chart to find the concentration in pounds per acre of Potassium in the soil.
POTASSIUM CALIBRATION CHART (LBS/A)
%T 9 8 7 6 5 4 3 2 1 0
90 22.9 26.5 30.1 33.6 37.1 40.5 43.9 47.3 50.5 53.8
80 57.0 60.1 63.2 66.2 69.2 72.1 75.0 77.8 80.6 83.3
70 86.0 88.6 91.2 93.7 96.2 98.6 100.9 103.2 105.5 107.7
60 109.8 111.9 114.0 116.0 118.0 119.9 121.7 123.6 125.4 127.1
50 128.8 130.5 132.1 133.7 135.3 136.8 138.4 139.9 141.4 142.9
40 144.3 145.8 147.3 148.9 150.4 152.0 153.7 155.3 157.1 159.0
30 160.9 163.0 165.2 167.5 170.1 172.8 175.8 179.1 182.7 186.6
20 191.0 195.8 201.1 207.0 213.5 220.9 229.1 238.2 248.6 260.2
10 273.2 288.0 304.7 323.7 345.4 370.1 398.3 430.8 468.3 511.6
1985-01 • 10/01
25
Page 26

POTASSIUM CONCENTRATION CHART
%T RANGE POUNDS PER ACRE
93-100% Very Low 0-44 lbs/acre
82-91% Low 50-76 lbs/acre
50-81% Medium 82-143 lbs/acre
18-80% High 144-281 lbs/acre
0-17% Very High Over 294 lbs/acre
1985-01 • 10/01
26
Page 27

SULFUR TEST
BARIUM CHLORIDE METHOD
QUANTITY CONTENTS CODE
60 mL *Sulfate Extracting Solution *6363-H
10 g *Sulfate Reagent *V-6277-D
1 Pipet , 1 mL , plastic 0354
1 Spoon, 1.0g 0697
1 Spoon, 0.1 g 0699
*WARNING: Reagents marked with a * are considered hazardous substances. Material Safety Data Sheets (MSDS) are
supplied for these reagents. For your safety, read label and accompanying MSDS before using.
Sulfur is essential to the formation of protein and affects various aspects of plant metabolism. Sulfur-deficient plants are
pale green in color with thin, reedy stems. Negatively charged sulfate ions are easily leached. The major sources of soil
sulfate are fertilizer containing sulfate compounds and atmospheric sulfur dioxide carried into the soil by precipitation.
RANGE: 0-172 ppm
METHOD: Sul fate ion is pre cip i tated in an acid me dium with bar ium chlo ride to form bar ium sul fate crys tals
IN TER FER ENCE: Sus pended mat ter and color in ter fer ence may be re moved by a fil tra tion step. Sil ica in ex cess of
PROCEDURE
1. Use the 1 mL pipet (0354) to add 1 mL of *Sulfate Extracting Solution (6363) to the graduated vial (0989) then add
deionized water to the graduation.
2. Add 3 one gram measures of soil using the 1 g spoon (0697). Cap vial and shake for five minutes.
3. Filter and collect all of the soil filtrate using the funnel (0459) and filter paper (0463). If the filtrate is not clear, filter a
second time.
4. Fill a clean colorimeter tube (0967) to the 10 mL line with the soil filtrate.
5. Select setting 1 on the “Select Wavelength” knob.
6. Insert tube containing sample into chamber and press the “30 Second Read” button. Adjust “100"%T with the ”Set
Blank" knob.
7. Remove the tube from the chamber. Use the 0.1 g spoon (0699) to add one level measure of *Sulfate Reagent (6277)
to the sample tube. Cap the tube and shake until powder has dissolved. A white precipitate will develop if sulfates are
present.
8. Allow the reaction to proceed for 5 minutes, then mix again before inserting tube into chamber of colorimeter. Cover
and measure %T as soon as reading stabilizes.
9. Consult chart to find the concentration in parts per million (ppm) of sulfur.
in pro por tion to the amount of sul fate pres ent.
500 mg/L will in ter fere.
NOTE: A white film is de pos ited on the in side of test tubes as a re sult of the sul fate test. Thor oughly clean and rinse
test tubes af ter each test.
SULFUR CALIBRATION CHART (ppm)
%T 9 8 7 6 5 4 3 2 1 0
90 6.7 7.2 7.6 8.1 8.5 9.0 9.4 9.9 10.3 10.8
80 11.2 11.7 12.2 12.6 13.1 13.6 14.0 14.5 15.0 15.5
70 16.0 16.5 17.0 17.5 18.0 18.5 19.1 19.6 20.1 20.7
60 21.2 21.8 22.3 22.9 23.5 24.1 24.6 25.3 25.9 26.5
50 27.1 27.8 28.5 29.1 29.8 30.5 31.3 32.0 32.8 33.5
40 34.4 35.2 36.0 36.9 37.8 38.8 39.7 40.7 41.8 42.9
30 44.0 45.2 46.4 47.7 49.1 50.5 52.0 53.6 55.2 57.0
20 58.9 60.9 63.0 65.3 67.8 70.4 73.3 76.4 79.8 83.5
10 87.6 92.0 97.0 102.6 108.8 115.9 124.0 133.3 144.1 156.9
0 172.1
1985-01 • 10/01
27
Page 28

SULFUR CONCENTRATION CHART
%T RANGE PARTS PER MILLION
79-100% Low 0-16 ppm
55-78% Medium Low 17-30 ppm
34-54% Medium 31-50 ppm
0-33% High 52-75 ppm
1985-01 • 10/01
28
Page 29

ZINC TEST
ZINCON METHOD
QUANTITY CONTENTS CODE
30 mL *Zinc Indicator Solution *6314-G
120 mL *Methyl Alcohol *6319-J
10 g Sodium Ascorbate 6316-D
25 g *Zinc Buffer Powder *6315-G
15 mL *Sodium Cyanide, 10% *6565-E
30 mL *Formaldehyde Solution, 37% *5128-G
1 “Diluted Zinc Indicator Solution”, Bottle,
w/1 mL pipet assembly 0128-MT
1 Graduate Cylinder, 10 mL , glass 0416
1 Spoon, 0.5 g 0698
2 Pipets , dropping, plastic 0352
1 Spoon, 0.1 g 0699
*WARNING: Reagents marked with a * are considered hazardous substances. Material Safety Data Sheets (MSDS) are
supplied for these reagents. For your safety read label and accompanying MSDS before using.
The availability of zinc in soils decreases with an increase in soil ph. Some soils that are limited above pH 6.0 may show a
zinc deficiency especially in well drained sandy soils. A nutrient interaction exists between soils that have a high
phosphorous level and show a zinc deficiency even though zinc levels were sufficient. This interaction is due to the
preferential uptake of phosphorus instead of zinc and the possible formation of insoluble zinc phosphates. Once zinc is
applied to the soil, it is relatively immobile because it is readily absorbed by organic matter in the soil.
Zinc is essential in promoting certain enzyme reactions in the soil and is required for the production of chlorophyll and the
formation of carbohydrates in plants.
AP PLI CA TION: Drinking and sur face wa ters, do mes tic and in dus trial waste wa ter.
RANGE: 0.01 - 3.0 ppm
METHOD: Zinc forms a blue col ored com plex with Zincon in a so lu tion buf fered at pH 9.0. Other heavy met -
als are complexed by cy a nide and the zinc cy a nide com plex is re leased by the ad di tion of
form al de hyde be fore the other metal cy a nide com plexes are de stroyed. So dium ascorbate is added
to re duce the in ter fer ence of man ga nese.
SAM PLE
HAN DLING &
PRES ER VA TION:
IN TER FER ENCES: The fol low ing ions in ter fere in con cen tra tions greater than those listed.
Sam ple should be an a lyzed within 6 hours af ter col lec tion. The ad di tion of HCl will help pre serve
the metal ion con tent, how ever the acid should be neu tral ized be fore anal y sis.
ION MG/L ION MG/L
Cd(II) 1 Cr(III) 10
Al (III) 5 Ni(II) 20
Mn (II) 5 Cn (II) 30
Fe (III) 7 Co (II) 30
Fe (II) 9 CrO4(II) 50
1985-01 • 10/01
29
Page 30

PROCEDURE
A. PREPARATION OF DILUTED ZINC INDICATOR SOLUTION
1. Use one pipet (0352) to measure exactly 5.0 mL of Zinc Indicator Solution into the 10 mL graduate cylinder. The
bottom of the curved surface (the meniscus) of the liquid should be at the 5.0 mL mark. Pour this into the bottle
labeled “Diluted Zinc Indicator Solution”.
2. Use the unrinsed graduated cylinder first to add 10.0 mL and then 7.8 mL (total of 17.8 mL) of methyl alcohol, 6319,
to the bottle labeled “Diluted Zinc Indicator Solution”. Cap and mix the ingredients in this bottle. Do not leave this
bottle uncapped.
B. DETERMINATION OF ZINC
1. Fill a clean colorimeter tube (0967) to the 10 mL line with the soil filtrate then neutralize according to the procedure
on page 10.
2. Select setting 6 on the “Select Wavelength” knob and press the “30 Second Read” button.
3. Insert the tube into the colorimeter chamber and adjust to “100”%T with the “Set Blank” knob. This is the 100%T
blank.
4. Remove the tube, add 0.1 g of Sodium Ascorbate (6316) with the 0.1 g spoon (0699) and 0.5 g of *Zinc Buffer
Reagent (6315) with 0.5 g spoon (0698), cap and shake vigorously for 1 minute.
5. Add 3 drops of *Sodium Cyanide Solution (6565), cap and mix contents of tube.
6. Use the 1 mL pipet assembly to add 1 mL of *“Diluted Zinc Indicator Solution”. Cap and mix contents.
7. Use a second plain pipet (0352) to add 4 drops of *Formaldehyde Solution, 37% (5128). Cap and mix by inverting 15
times.
8. Press the “30 Second Read” button and insert the tube into colorimeter chamber. Measure the test result as soon as the
reading stabilizes.
9. Consult the calibration chart to find the concentration of zinc in parts per million (ppm).
ZINC CALIBRATION CHART
%T 9 8 7 6 5 4 3 2 1 0
90
80 0.0 0.1 0.1 0.2 0.2 0.3 0.3
70 0.4 0.4 0.5 0.5 0.6 0.6 0.7 0.7 0.8 0.9
60 0.9 1.0 1.0 1.1 1.2 1.2 1.3 1.4 1.4 1.5
50 1.6 1.7 1.7 1.8 1.9 2.0 2.0 2.1 2.2 2.3
40 2.4 2.5 2.6 2.7 2.8 2.9 3.0 3.1 3.2 3.3
30 3.4 3.5 3.6 3.8 3.9 4.0 4.2 4.3 4.4 4.6
20 4.8 4.9 5.1 5.3 5.5 5.6 5.9 6.1 6.3 6.5
10 6.8 7.0 7.3 7.6 8.0 8.3 8.7 9.1 9.5 10.0
0 10.6 11.2 11.9 12.8 13.8 15.1 16.8 19.2 23.6
ZINC CONCENTRATION CHART
%T RANGE PARTS PER MILLION
82-100% Low 0-0.5 ppm
77-81% Marginal 0.6-1.0 ppm
69-76% Adequate 1.1-2 ppm
1985-01 • 10/01
30
 Loading...