

Page 1

LaMotte DC1600 Outfit • Code 1785
TABLE OF CONTENTS
Page
Specifications ............................................................................................................................................. 3
General Information................................................................................................................................... 4
General Operating Procedure...................................................................................................................... 5
Chemical Testing........................................................................................................................................ 6
Water Sampling for Chemical Analysis....................................................................................................... 6
Filtration....................................................................................................................................................... 7
An Introduction to Colorimetric Analysis................................................................................................... 7
Reagent Blank.............................................................................................................................................. 7
Colorimeter Tubes........................................................................................................................................ 7
Calibration Curves....................................................................................................................................... 8
Preparing Dilute Standard Solutions............................................................................................................ 9
Standard Additions...................................................................................................................................... 9
Sample Dilution Techniques and Volumetric Measurements..................................................................... 10
Interferences............................................................................................................................................... 10
Stray Light Interferences............................................................................................................................ 10
Testing Procedures
Aluminum.................................................................................................................................................. 11
Ammonia Nitrogen-Low Range................................................................................................................. 13
Ammonia Nitrogen-High Range................................................................................................................ 15
Chlorine-Bromine-Iodine........................................................................................................................... 17
Chlorine Dioxide........................................................................................................................................ 23
Chromium-Hexavalent .............................................................................................................................. 25
Chromium-Total......................................................................................................................................... 27
Copper-Low Range .................................................................................................................................... 31
Copper-High Range.................................................................................................................................... 33
Cyanide ...................................................................................................................................................... 35
Cyanuric Acid ............................................................................................................................................ 37
Fluoride....................................................................................................................................................... 39
Hydrazine.................................................................................................................................................... 41
Hydrogen Peroxide..................................................................................................................................... 43
Iron Bipyridyl.............................................................................................................................................. 45
Iron Phenanthroline................................................................................................................................... 47
Manganese-High Range ............................................................................................................................. 49
Manganese-Low Range............................................................................................................................... 51
Molybdenum-Tiron .................................................................................................................................... 53
Molybdenum-Thioglycolate ....................................................................................................................... 55
Nickel......................................................................................................................................................... 57
Nitrate Nitrogen......................................................................................................................................... 59
Nitrite Nitrogen ......................................................................................................................................... 61
Oxygen, Dissolved...................................................................................................................................... 63
Ozone......................................................................................................................................................... 65
pH............................................................................................................................................................... 67
Phenols....................................................................................................................................................... 69
Phosphate-High Range............................................................................................................................... 71
Phosphate-Low Range................................................................................................................................ 73
Potassium.................................................................................................................................................... 75
Silica-Low Range........................................................................................................................................ 77
Silica-High Range ...................................................................................................................................... 79
Sulfate......................................................................................................................................................... 81
Sulfide......................................................................................................................................................... 83
Tannin........................................................................................................................................................ 85
Turbidity..................................................................................................................................................... 87
Zinc............................................................................................................................................................. 89
61785 • 7/01
Page 2

LaMOTTE COMPANY
Helping People Solve Analytical Challenges
PO Box 329 • Chestertown • Maryland • 21620 • USA
800-344-3100 • 410-778-3100 (Outside USA) • Fax 410-778-6394
Visit us on the web at www.lamotte.com
2
®
Page 3

SPECIFICATIONS
INSTRUMENT TYPE
Multi-wavelength filter colorimeter _ internal, non-removable filters
READOUT
1
3
inch digit LCD; displays 0–100%T
2
READABLE RESOLUTION
± 1%T
READING STABILITY
± 0.2%T within 5 seconds of turn-on to automatic turn-off
READING INTERVAL
Approximately 30 seconds with automatic turn-off, resettable
MEASUREMENT WAVELENGTHS
1 (420nm), 2 (460nm), 3 (510nm), 4 (530nm), 5 (570nm), 6 (605nm); switch selectable
WAVELENGTH ACCURACY
± 1 nanometers
PHOTOMETRIC ACCURACY
± 0.5%T
SAMPLE CHAMBER
Indexed; accepts 21 mm diameter flat-bottomed test tubes (capped)
SOURCE LAMP
Tungsten filament bulb, 10,000 hour life (est.), spare included, field replaceable
POWER REQUIREMENTS
Battery Operation: Field replaceable 1604 type (9V)
Line Operation: 120/220V, 50/60 Hz, 2VA, with optionally-available adapter
DIMENSIONS
(W x D x H) 190 x 140 90 mm
1
1
7
x 5
2
WEIGHT
x 3
2
1
inches
2
2 lbs.
3
Page 4
GENERAL INFORMATION
BAT
LIMITS OF LIABILITY
Under no circumstances shall LaMotte Company be liable for loss of life, property, profits, or other damages incurred
through the use or misuse of their products.
PACKAGING AND DELIVERY
Experienced packaging personnel at LaMotte Company assure the adequate protection against normal hazards encountered
in transportation of shipments. After the product leaves the manufacturer, all responsibility for its safe delivery is assured by
the transportation company. Damage claims must be filed immediately with the transportation company to receive
compensation for damaged goods.
Should it be necessary to return the instrument for repair or servicing, pack instrument carefully in suitable container with
adequate packing material. Attach a letter to the shipping carton describing the kind of trouble experienced. This valuable
information will enable the service department to make the required repairs more efficiently.
EPA COMPLIANCE
The DC1600 Colorimeter is an EPA-Accepted instrument. EPA-Accepted means that the instrument meets the
requirements for colorimeters as found in test procedures that are approved for the National Primary Drinking Water
Regulations (NPDWR) or National Pollutant Discharge Elimination System (NPDES) compliance monitoring programs.
EPA-Accepted instruments may be used with approved test procedures without additional approval.
REPLACING LIGHT BULB
Turn the meter over, making sure the battery compartment is in the upper left corner (This is important). Remove the four
screws from the bottom of the colorimeter and remove the base. The burned out light bulb is attached to the small
rectangular circuit located just to the right (your right) of the light chamber. Remove the two screws that connect the
circuit and SAVE THE BURNED OUT LIGHT BULB. The light bulb must be returned to LaMotte Company for
replacement. Make sure the two washers are still in place. Remove the screw in the upper left corner of the colorimeter and
detach the replacement circuit. Replace that screw. When fastening the fresh bulb in place, be sure both washers are
aligned. Align the base to the meter and replace the four original screws.
NOTE: If the replacement bulb is significantly different from the original bulb, the “Set Blank” control may not have
enough range; if so, please call our technical support people for assistance.
4
Page 5

REPLACING THE BATTERY
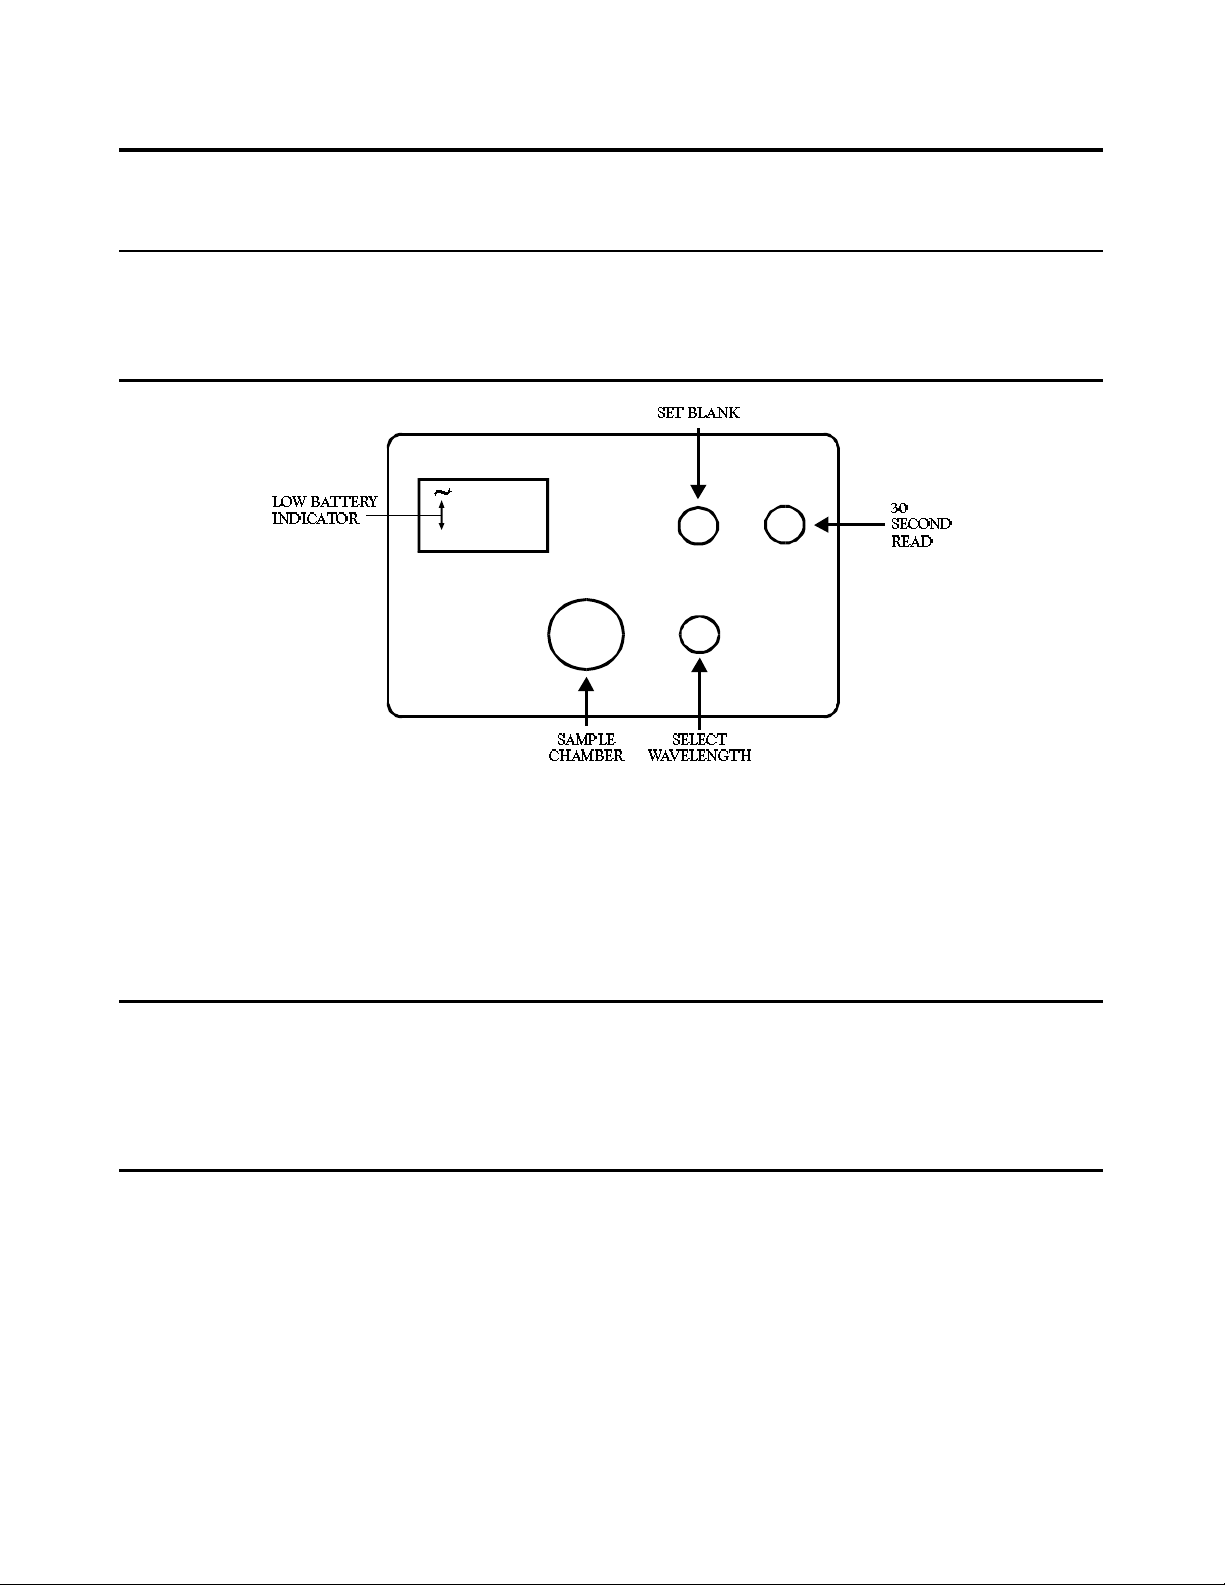
The colorimeter is equipped with a battery check indication, the symbols BAT and ~ on the left hand side of the display,
that will be displayed when the battery needs to be replaced. The meter will still provide valid readings, but the readings
may drift. Eventually the meter will not have enough power to turn on. To replace the battery, remove the panel on the
back of the meter and detach the battery. Replace with a fresh alkaline 1604A type (9V) battery.
Battery polarity (+ & –) must never be reversed, even momentarily. If it is, the instrument will be rendered
INOPERABLE, and must be returned to LaMotte Company for repair. This will be considered a non-warranty repair.
Use appropriate caution when replacing the battery.
GENERAL OPERATING PROCEDURE
1. Rinse a clean colorimeter tube (0967) with sample water. Fill to the 10 mL line with sample.
2. Select the appropriate wavelength (1 to 7) from the “Select Wavelength” knob. Insert tube into the colorimeter
chamber. (Press firmly on the tube, overcoming the slight resistance, to make sure the tube rests on the bottom
of the chamber.)
3. Press the “30 Second Read” button (the BAT and ~ symbols will flash on briefly). Adjust instrument with “Set Blank”
control until meter reads exactly 100%T. The instrument is now ready to read an unknown sample.
NOTE: See Battery Replacement section for more information.
4. Perform test outlined in the recommended procedures.
5. Insert sample into the colorimeter and press the “30 Second Read” button. As soon as the reading stabilizes
(usually 5–7 seconds), record the reading.
6. Consult the calibration chart for the corresponding concentration. For example, a reading of 75%T would be found by
reading 70%T on the left column of the chart and 5 across the top of the chart. Read down the column until the
columns intersect. The value at the intersection represents concentration in parts per million (ppm) or milligrams per
liter (mg/L).
TYPICAL CALIBRATION CHART
% T 9 8 7 6 5 4 3 2 1 0
90
80
70
60
50
40
30
20
10
0.04 0.04 0.04 0.05 0.05 0.06 0.06 0.06 0.07 0.07
0.08 0.08 0.08 0.09 0.09 0.10 0.10 0.10 0.11 0.11
0.11 0.12 0.12 0.13 0.13 0.13 0.14 0.14 0.14 0.15
0.15 0.16 0.16 0.16 0.17 0.17 0.18 0.18 0.19 0.19
0.20 0.20 0.21 0.22 0.22 0.23 0.24 0.25 0.26 0.27
0.28 0.30
0.00 0.01 0.01 0.02 0.02 0.02 0.03 0.03
NOTE: The number of decimal places in each number in the calibration chart is provided for interpolation purposes
only and does not necessarily reflect the sensitivity of each test.
NOTE: %T readings above the highest %T value on the chart should be interpreted as 0 ppm. For example, on the
above chart, readings above 77%T would correspond to 0 ppm. Some tests may have results above 100%T.
5
Page 6

CHEMICAL TESTING
WATER SAMPLING FOR CHEMICAL ANALYSIS
TAKING REPRESENTATIVE SAMPLES
The underlying factor to be considered for any type of water sampling is whether or not the sample is truly representative of
the source. Some of the ways to properly collect a representative sample are as follows:
Sample as frequently as possible.
Collect a large sample or at least enough to conduct whatever tests are necessary.
Make a composite sample for the same sampling area.
Handle the sample in such a way as to prevent deterioration or contamination before the analysis is performed.
Perform analysis for dissolved gases such as dissolved oxygen, carbon dioxide, and hydrogen sulfide immediately at the site
of sampling. These factors, as well as samples for pH, cannot be stored for later examination.
Make a list of conditions or observations which may affect the sample. Other considerations for taking representative
samples are dependent upon the source of the sample. Taking samples from surface waters involves different considerations
than taking samples from impounded and sub-surface waters.
SAMPLING OF OPEN WATER SYSTEMS
Surface waters, such as those found in streams and rivers, are usually well mixed. The sample should be taken downstream
from any tributary, industrial or sewage pollution source. For comparison purposes samples may be taken upstream and at
the source of the pollution before mixing.
In ponds, lakes, and reservoirs with restricted flow, it is necessary to collect a number of samples in a cross section of the
body of water, and where possible composite samples should be made to ensure representative samples.
To collect samples from surface waters, select a suitable plastic container with a tight fitting screw cap. Rinse the container
several times with the sample to be tested, then immerse the container below the surface until it is filled to overflowing and
replace the cap. If the sample is not to be tested immediately, pour a small part of the sample out and reseal. This will allow
for any expansion. Any condition which might affect the sample should be listed.
Sub-surface sampling is required to obtain a vertical profile of streams, lakes, ponds, and reservoirs at specific depths. This
type of sampling requires more sophisticated sampling equipment.
For dissolved oxygen studies, or for tests requiring small sample sizes, a Water Sample Bottle (LaMotte code 1060) will serve
as a subsurface or in-depth sampler. This weighted device is lowered to the sampling depth and allowed to rest at this depth
for a few minutes. The water percolates into the sample chamber displacing the air which bubbles to the surface. When the
bubbles cease to rise, the device has flushed itself approximately five times and it may be raised to the surface for
examination. The inner chamber of the sampling device is lifted out and portions of the water sample are carefully
dispensed for subsequent chemical analysis.
A Snap-Plunger Water Sampler (LaMotte code 1077) is another “in-depth” sampling device which is designed to collect
large samples which can be used for a multitude of tests. Basically, this collection apparatus is a hollow cylinder with a
spring loaded plunger attached to each end. The device is cocked above the surface of the water and lowered to the desired
depth. A weighted messenger is send down the calibrated line to trip the closing mechanism and the plungers seal the
sample from mixing with intermediate layers as it is brought to the surface. A special drain outlet is provided to draw off
samples for chemical analysis.
SAMPLING OF CLOSED SYSTEM
To obtain representative samples from confined water systems, such as pipe lines, tanks, vats, filters, water softeners,
evaporators and condensers, even different considerations are required because of chemical changes which occur between
the inlet and outlet water. One must have a basic understanding of the type of chemical changes which occur for the type
of equipment used. Also, consideration should be given to the rate of passage and retaining time for the process water.
Temperature changes play an important part in deciding exactly what test should be performed. Process water should be
allowed to come to room temperature, 20–25°C, before conducting any tests.
For drawing off samples from an outlet pipe such as a tap, allow sample to run for several minutes, rinsing the container
several times before taking the final sample. Avoid splashing and introduction of any contaminating material.
6
Page 7

FILTRATION
When testing natural waters that contain significant turbidity due to suspended solids and algae, filtration is an option.
Reagent systems, whether EPA, Standard Methods, LaMotte or any others, will generally only determine dissolved
constituents. Both EPA and Standard Methods suggest filtration through a 0.45 micron filter membrane, to remove
turbidity, for the determination of dissolved constituents.** To test for total constituents, organically bound and suspended
or colloidal materials, a rigorous high temperature acid digestion is necessary.
AN INTRODUCTION TO COLORIMETRIC ANALYSIS
Most test substances in water are colorless and undetectable to the human eye. In order to test for their presence we must
find a way to “see” them. The LaMotte colorimeter can be used to measure any test substance that is itself colored or can be
reacted to produce a color. In fact a simple definition of colorimetry is “the measurement of color” and a colorimetric
method is “any technique used to evaluate an unknown color in reference to known colors”. In a colorimetric chemical test
the intensity of the color from the reaction must be proportional to the concentration of the substance being tested. Some
reactions have limitations or variances inherent to them that may give misleading results. Many such interferences are
discussed with each particular test instruction. In the most basic colorimetric method the reacted test sample is visually
compared to a known color standards. However, accurate and reproducible results are limited by the eyesight of the analyst,
inconsistencies in the light sources, and the fading of color standards.
To avoid these sources of error, a colorimeter can be used to photoelectrically measure the amount of colored light
absorbed by a colored sample in reference to a colorless sample (blank).
Why measure colored light? White light is made up of many different colors or wavelengths of light. A colored sample
typical absorbs only one color or one band of wavelengths from the white light. Not much difference could be measured
between white light before it passes through a colored sample versus after it passes through. The reason for this is that the
one color absorbed by the sample is only a small portion of the total amount of light passing through the sample. However,
if we could select only that one color or band of wavelengths of light which the test sample is most sensitive to, we would
see a large difference between the light before it passes through the sample and after it passes through.
A colorimeter passes a white light beam through an optical filter which transmits only one particular color or band of
wavelengths of light to the photodetector where it is measured. The difference in the amount of colored light transmitted
by a colorless sample (blank) and the amount of colored light transmitted by a colored sample is a measurement of the
amount of colored light absorbed by the sample. In most colorimetric tests the amount of colored light absorbed is directly
proportional to the concentration of the test factor producing the color and the path length through the sample. However,
for some tests the amount of colored light absorbed is inversely proportional to the concentration.
The choice of the correct optical filter and therefore the correct color or wavelength of light is important. It is interesting
to note that the filter that gives the most sensitive calibration for your test factor is the complimentary color of the test
sample. For example, the Nitrate-Nitrogen test produces a pink color proportional to the nitrate concentration in the
sample (the greater the nitrate concentration, the darker the pink color). A green filter is used since a pinkish-red solution
absorbs mostly green light.
REAGENT BLANK
Some tests will provide greater accuracy if a reagent blank is determined, to compensate for any color or turbidity resulting
from the reagents themselves. A reagent blank is performed by running the test procedure on 10 mL of demineralized water.
With the reagent blank in the colorimeter chamber, scan the blank then perform the unknown tests as described.
COLORIMETER TUBES
Colorimeter tubes which have been scratched through excess use should be discarded and replaced with new ones. Dirty
tubes should be cleaned on both the inside and outside. Fingerprints on the exterior of the tubes can cause excessive light
scattering and result in errors. Handle the tubes carefully, making sure the bottom half of the tube is not handled.
LaMotte makes every effort to provide high quality colorimeter tubes. However, wall thicknesses and diameter of tubes may
still vary slightly. This may lead to slight variations in results (e.g. if a tube is turned while in the sample chamber, the
reading will likely change slightly). To eliminate this error put the tubes into the colorimeter chamber with the same
orientation every time.
The tubes that are included with the colorimeter have an index mark to facilitate this.
**LaMotte offers a filtering apparatus: syringe assembly (code 1050) and membrane filters, 0.45 micron, (code 1103).
7
Page 8
CALIBRATIONS CURVES
The first step in using a non-LaMotte reagent system with your DC1600 Colorimeter is to create a calibration curve for the
reagent system. To create a calibration curve, prepare standard solutions of the test factor and use the reagent system to test
the standard solutions with the DC1600 Colorimeter.
Plot the results (in Absorbance or % Transmittance) versus concentration to create a calibration curve. The calibration
curve may then be used to identify the concentration of an unknown sample by testing the unknown, reading %T (and
calculating absorbance if needed), and finding the corresponding concentration from the curve. You can also determine the
linear range of the reagent system. The range of the test is dependent on several factors, including pathlength.
PROCEDURE
1. Prepare 5 or 6 standard solutions of the factor being tested. The concentrations of these standards should be evenly
distributed throughout the range of the reagent system, and should include a 0 ppm standard (distilled water). For
instance, the solutions could measure 0, 10%, 30%, 50%, 70%, and 90% of the system’s maximum range.
2. Determine the appropriate wavelength for the color produced by the reagent system. The settings for the “Select
Wavelength” knob and the corresponding wavelengths are: 1 (420 nm), 2 (460 nm), 3 (510 nm), 4 (530 nm),
5 (570 nm), 6 (605 nm). Set the “Select Wavelength” knob to the setting corresponding to the appropriate
wavelength.
3. Rinse a clean colorimeter tube (0967) with unreacted 0 ppm standard. Fill to the 10 mL line with 0 ppm sample.
Insert tube into the colorimeter chamber.
4. Press the “30 Second Read” button. Adjust instrument with “Set Blank” control until meter reads exactly 100%T. The
instrument is now ready to read an unknown sample.
5. Perform test according to the recommended procedures on each standard solution. Fill a clean colorimeter tube
(0967) to the 10 mL line with a reacted sample.
6. Insert reacted sample into the colorimeter chamber and press the “30 Second Read” button. As soon as the reading
stabilizes (usually 5–7 seconds), record the reading. Read all other reacted samples and record the results.
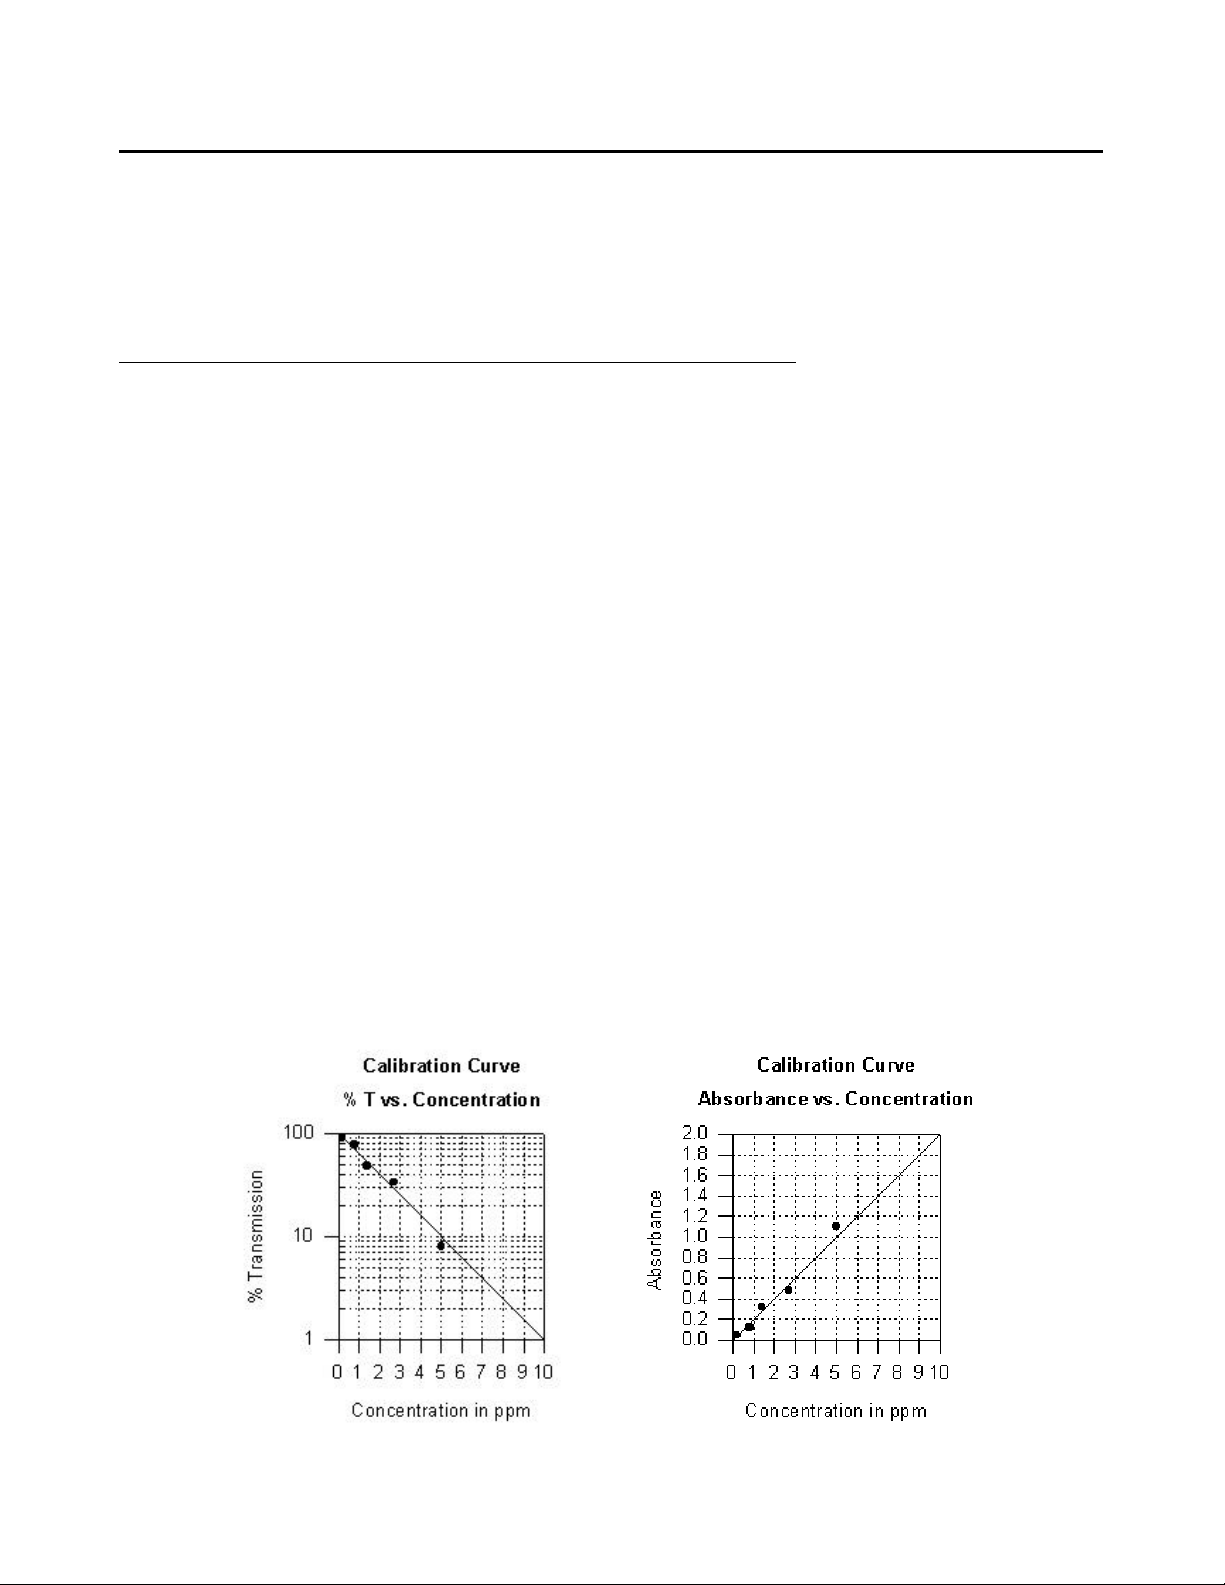
7. Plot results on graph paper or computer using any available plotting program. If results are as %T versus
concentration, semilog graph paper must be used. Plot the standard solution concentrations on the horizontal, linear
axis, and the %T on the vertical, logarithmic axis. If absorbance versus standard solution concentration is to be
plotted a simple linear graph paper can be used. Calculate absorbance (A) from %T for each reading [A =
-log(%T/100)]. Plot the standard solution concentration on the horizontal axis, and the absorbance on the vertical
axis.
8. After plotting the results, draw a line, or curve, of best fit through the plotted points. The best fit may not connect the
points. There should be approximately an equal number of points above the curve as below the curve. Some reagent
systems will produce a straight line, while others produce a curve. Many computer spreadsheet programs can produce
the curve of best fit by regression analysis of the standard solution data.
A sample of each type of graph appears below:
8
Page 9
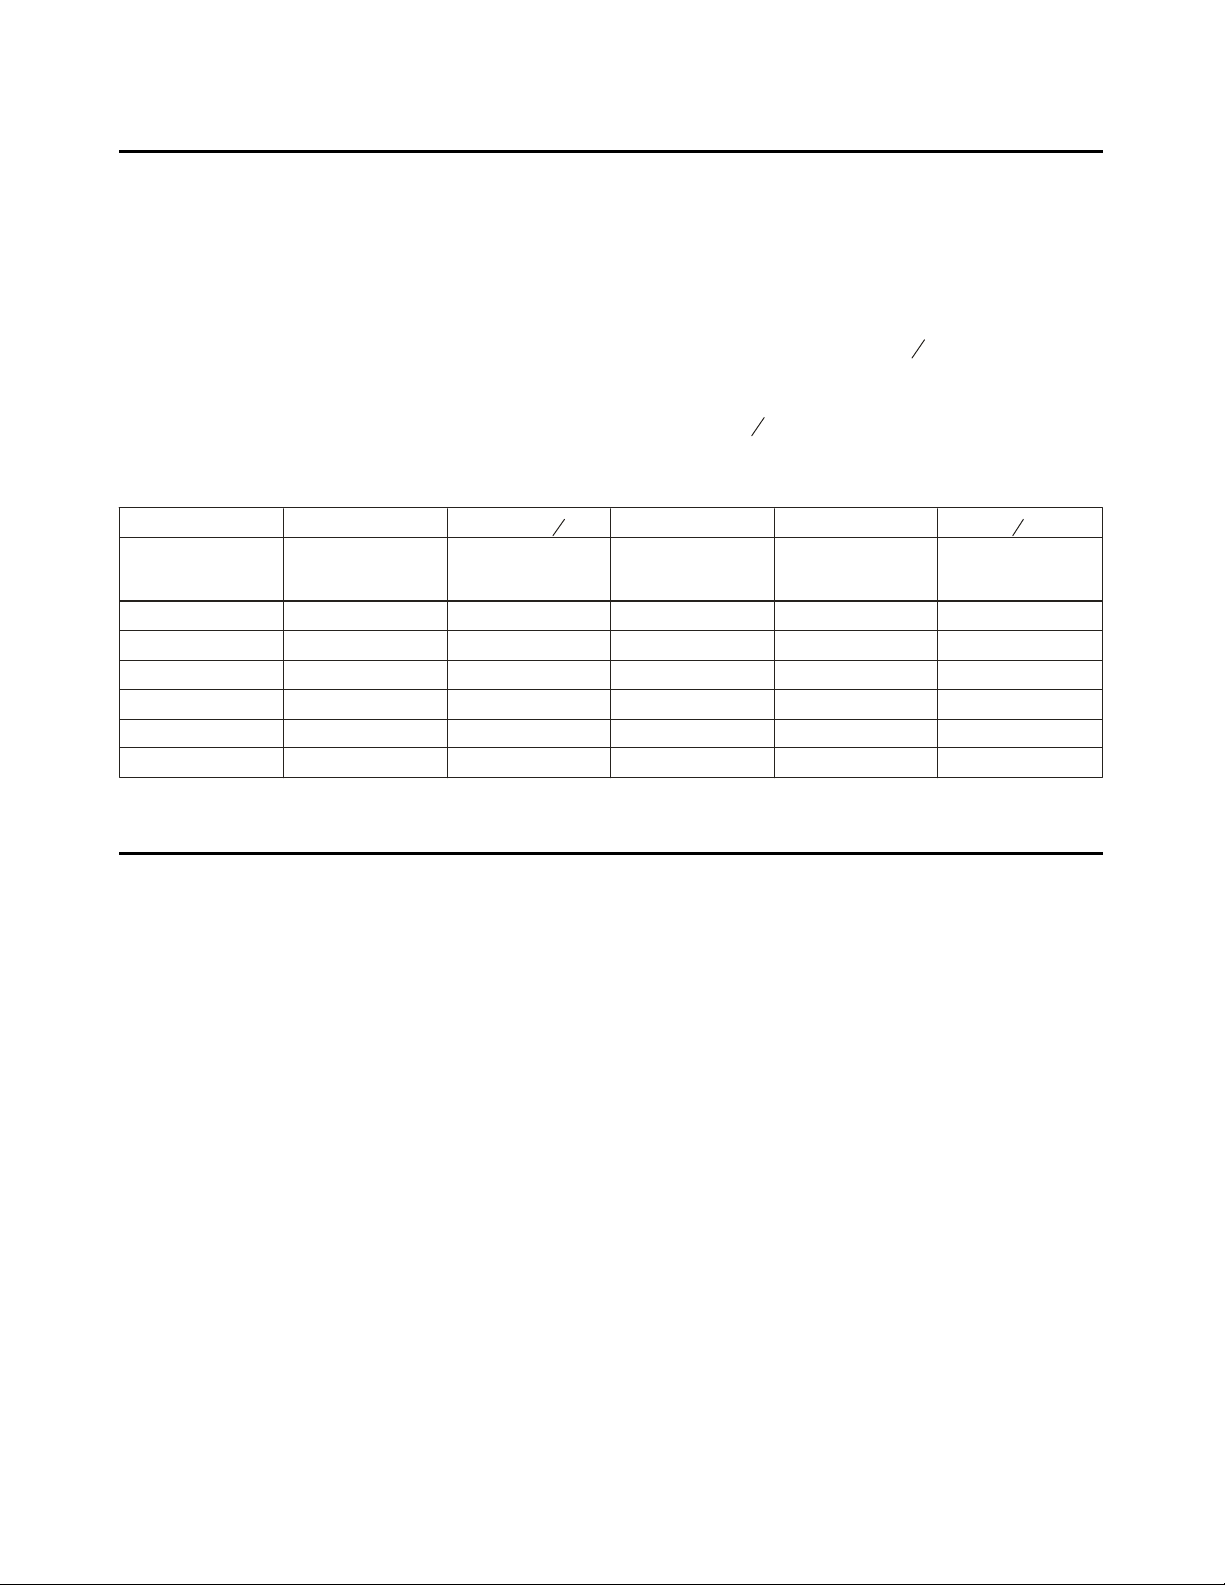
PREPARING DILUTE STANDARD SOLUTIONS
Standard solutions should be prepared to create a calibration curve. Standard solutions can be prepared by diluting a known
concentrated standard by specified amounts. A chart or computer spreadsheet can be created to determine the proper
dilutions. Use volumetric flasks and pipets for all dilutions.
1. In Column A – Record the maximum concentration of test as determined by the range and path length.
2. In Column B – Record the percent of the maximum concentration the standard solution will be.
3. In Column C – Calculate the final concentration of the diluted standard solutions by multiplying the maximum
concentration (In Column A) by the % of maximum concentration divided by 100. (C = A x
4. In Column D – Record the final volume of the diluted sample (i.e. volume of volumetric flask).
5. In Column E – Record the concentration of the original standard.
6. In Column F – Calculate the milliliters of original standard required (C x
D
= F).
E
A sample chart appears below:
Final
B
I00
D E C x
Volume
of Standard
Concentration of
Original Standard
A B C = A x
Maximum
concentration
of test
% of Maximum
Concentration
Concentration of
Diluted Standard
10.0 ppm 90 9.0 ppm 100 mL 1000 ppm 0.90 mL
10.0 ppm 70 7.0 ppm 100 mL 1000 ppm 0.70 mL
10.0 ppm 50 5.0 ppm 100 mL 1000 ppm 0.50 mL
10.0 ppm 30 3.0 ppm 100 mL 1000 ppm 0.30 mL
10.0 ppm 10 1.0 ppm 100 mL 1000 ppm 0.10 mL
10.0 ppm 0 0 ppm 100 mL 1000 ppm 0 mL
B
).
100
mL of Original
Standard Required
D
= F
E
STANDARD ADDITIONS
A common method to check the accuracy and precision of a test is by standards additions. In this method a sample is tested
to determine the concentration of the test substance. A second sample is then “spiked” by the addition of a known quantity
of the test substance. The second sample is then tested. The determined concentration of the spiked sample should equal
the concentration of the first plus the amount added with the spike. The procedure can be repeated with larger and larger
“spikes.” If the determined concentrations do not equal the concentration of the sample plus that added with the “spike”
than a interference may exist.
For example, a 10.0 mL water sample was determined to contain 0.3 ppm iron. To a second 10.0 mL sample add 0.1 mL of
50 ppm iron standard. The concentration of iron due to the “spike” is (0.10 mL * 50 ppm)/10.0 mL = 0.50 ppm. The
concentration of iron determined in the spiked sample should be 0.3 + 0.5 = 0.8 ppm iron. (Note: any error due to the
increased volume from the “spike” is negligible).
LaMotte offers a line of calibration standards which can be used to generate calibration curves and perform standard
additions.
9
Page 10

SAMPLE DILUTION TECHNIQUES AND VOLUMETRIC MEASUREMENTS
If a test result exceeds the lower end of the calibration chart for a specific test, you must dilute your sample. Repeat the test
to obtain a reading which is in the concentration range for the test. The reading is multiplied by the appropriate dilution
factor. If the reading exceeds the high end of the calibration chart, a reagent blank should be run for best results.
(NOTE: These comments are not true for colorimetric determination of pH.)
EXAMPLE: Measure 5 mL of the water sample into a graduated cylinder. Add demineralized water until the
cylinder is filled to the 10 mL line. The sample has been diluted by one-half, and the dilution factor is
therefore 2. Perform the test procedure, then multiply the resulting concentration by 2 to obtain the
test result.
The following table gives quick reference guidelines on dilutions of various proportions. All dilutions are based on a 10 mL
volume, so several dilutions will require small volumes of the water sample. Graduated pipets should be used for all
dilutions.
SIZE OF
SAMPLE
10 mL 0 mL 1
5 mL 5 mL 2
2.5 mL 7.5 mL 4
1 mL 9 mL 10
0.5 mL 9.5 mL 20
If the above glassware is not available, dilutions can be made with the colorimeter tube. Fill the colorimeter tube to the 10
mL line with the sample then transfer it to another container. Add 10 mL volumes of demineralized water to the container
and mix. Transfer back 10 mL of the diluted sample to the colorimeter tube and test it. Continue diluting and testing until
a reading, which is in the concentration range for the test, is obtained. Be sure to multiply the concentration found by the
dilution factor (the number of total 10 mL volumes used).
DEIONIZED WATER TO BRING VOLUME
TO 10 ML
MULTIPLICATION
FACTOR
EXAMPLE: 10 mL of sample is diluted with three 10 mL volumes of demineralized water; the dilution factor is four.
INTERFERENCES
LaMotte reagents systems are designed to minimize most common interferences. Each individual test discusses interferences
unique to that test. You should be aware of possible interferences in the water being tested.
The reagent systems also contain buffers to adjust the water sample to the ideal pH for the reaction. It is possible that the
buffer capacity of the water sample may exceed the buffer capacity of the reagent system and the ideal pH will not be
obtained. If this is suspected, measure the pH of a reacted distilled water reagent blank using a pH meter. This is the ideal
pH for the test. Measure the pH of a reacted water sample using the pH meter. If the pH is significantly different from the
ideal value, the pH of the sample should be adjusted before testing.
Interferences due to high concentration of the substance being tested for, can be over come by sample dilution.
STRAY LIGHT INTERFERENCE
Normal indoor lighting causes no interference with the DC1600 Colorimeter. Testing in bright sunlight may result in
interferences due to stray light. This interference can be eliminated by covering the colorimeter chamber with the black
cap when zeroing the meter and reading samples. Turbidimetric determinations (1.e. sulfate, potassium, cyanuric acid and
turbidity) are most likely to exhibit a stray light interference. Always check for stray light interferences when you do
turbidimetric determinations. Colorimetric test are less likely to have this problem.
To determine if stray light is causing an interference place a reacted sample in the colorimeter chamber. Press the “30
Second Read” button. As soon as the reading stabilizes (usually 5–7 seconds), record the reading. Cover the colorimeter
chamber with something (1.e. a hand or any opaque object), if the reading changes then there is an interference. If the
reading changes only 1 - 2 % T then the interference is negligible except for the most critical tests. If sample turbidity is
causing a stray light interference a filtration may be needed.
10
Page 11

ALUMINUM
ERIOCHROME CYANINE R METHOD CODE 3641
QUANTITY CONTENTS CODE
5 g *Aluminum Inhibitor Reagent *7865-C
2 x 120 mL *Aluminum Buffer Reagent *7866-J
120 mL Aluminum Indicator Reagent 7867-J
15 mL Aluminum Complexing Reagent 7868-E
1 Spoon, 0.1 g, plastic 0699
2 Pipets, 1.0 mL, plastic 0354
*WARNING: Reagents marked with a * are considered hazardous substances. Material Safety Data Sheets (MSDS) are supplied for
these reagents. For your safety, read label and accompanying MSDS before using.
Aluminum is the third most common element in the earth’s crust, which accounts for its wide appearance in many water
supplies. Aluminum exists in water as soluble salts, colloidal compounds, and insoluble compounds. In wastewater that has
been treated by alum coagulation it will appear in one or more of the above forms. Properly treated drinking water should
have an aluminum concentration below 0.05 mg/L.
APPLICATION: Drinking, surface, and saline water; domestic and industrial wastewater.
RANGE: 0 – 0.30 ppm Aluminum
METHOD: Aluminum ions buffered to a pH of 6.0 react with Eriochrome Cyanine R dye to produce a
SAMPLE HANDLING
& PRESERVATION: Collect sample in acid washed glass or plastic bottle. Analyze as soon as possible.
INTERFERENCES: Fluoride and polyphosphate will interfere. Interference from iron and manganese is eliminated
pink to red complex in proportion to the concentration.
by the addition of an inhibitor.
11
Page 12

PROCEDURE
NOTE: For the best possible results, carry a reagent blank through the procedure to compensate for any color which may
develop within the reagents. The reagent blank should be treated with 10 drops of Aluminum Complexing Reagent (7868)
and the test procedure completed as given in Steps 4-8. Set the Reagent Blank reading to 77%T, which corresponds to 0
ppm aluminum, then continue with unknown sample tests.
1. Rinse a clean colorimeter tube (0967) with sample water. Fill to the 10 mL line with sample.
2. Select setting 4 on “Select Wavelength” knob and press “30 Second Read” button.
3. Insert tube into colorimeter chamber and adjust to 100%T with “Set Blank” knob. This is the 100%T blank.
(See Note.)
4. Remove tube from colorimeter. Use the 0.1 g spoon (0699) to add one measure of *Aluminum Inhibitor Reagent
(7865). Cap and mix.
5. Use a 1.0 mL pipet (0354) to add 4 mL of *Aluminum Buffer Reagent (7866). Cap and mix.
6. Use a second 1.0 mL pipet (0354) to add 2 mL of Aluminum Indicator Reagent (7867). Cap and mix contents. Wait
5 minutes for maximum color development.
7. At end of 5 minute waiting period, press “30 Second Read” button and insert tube into colorimeter chamber. Record
%T as soon as reading stabilizes.
8. Consult calibration chart to determine aluminum concentration in parts per million (ppm).
DC1600 ALUMINUM CALIBRATION CHART
%T 9 8 7 6 5 4 3 2 1 0
90
80
70
60
50
40
30
20
10
0
0.04 0.04 0.04 0.05 0.05 0.06 0.06 0.06 0.07 0.07
0.08 0.08 0.08 0.09 0.09 0.10 0.10 0.10 0.11 0.11
0.11 0.12 0.12 0.13 0.13 0.13 0.14 0.14 0.14 0.15
0.15 0.16 0.16 0.16 0.17 0.17 0.18 0.18 0.19 0.19
0.20 0.20 0.21 0.22 0.22 0.23 0.24 0.25 0.26 0.27
0.28 0.30
0.00 0.01 0.01 0.02 0.02 0.02 0.03 0.03
12
Page 13

AMMONIA NITROGEN ~ LOW RANGE
SALICYLATE METHOD CODE 3659-01
QUANTITY CONTENTS CODE
60 mL *Ammonia #1 *3978-H
10 g *Salicylate #2 *7457-D
5 g *Salicylate #3 *7458-C
1 Spoon, 0.1 g, plastic 0699
1 Spoon, 0.15 g, plastic 0727
1 Pipet, 1.0 mL, plastic 0354
*WARNING: Reagents marked with * are considered hazardous substances. Material Data Safety Sheets (MSDS) are supplied for these
reagents. For your safety, read label and accompanying MSDS before using.
APPLICATION: Low concentrations of ammonia in fresh, brackish and salt water. Fresh and salt water
aquariums.
RANGE: 0 – 1.0 ppm Ammonia-Nitrogen
METHOD: Salicylate and ammonia react at high pH in the presence of a chlorine donor and an iron
catalyst to form a blue indophenol dye, the concentration of which is proportional to the
ammonia concentration in the sample.
SAMPLE HANDLE
& PRESERVATION: Ammonia solutions tend to be unstable and should be analyzed as soon as possible. Samples
can be stabilized by adjusting the pH to less than pH 2 with HCl. The solution should then be
neutralized with NaOH before performing the test.
INTERFERENCES: There are few interferences in most natural waters. High concentrations of reducing reagents,
such as hydrazine, react with the chlorine donor and can result in negative interferences. Color
and turbidity can also interfere.
13
Page 14

PROCEDURE
1. Rinse a clean colorimeter tube (0967) with sample water. Fill to the 10 mL line with sample.
2. Select setting 6 on “Select Wavelength” knob and press “30 Second Read” button.
3. Insert tube into colorimeter chamber and adjust to 100% T with “Set Blank” knob. This is the 100% T blank.
4. Remove tube from colorimeter. Use the 1.0 mL plastic pipet (0354) to add 2.0 mL of *Ammonia #1 (3978). Cap and
mix.
5. Use the 0.15 g spoon (0727) to add two measures of *Salicylate #2 (7457). Cap and mix until dissolved. Wait 1
minute.
6. At end of 1 minute waiting period use 0.1 g spoon (0699) to add two measures of *Salicylate #3 (7458). Cap and
shake vigorously for 30 seconds. Wait 12 minutes for maximum color development.
7. At the end of 12 minute waiting period, press “30 Second Read” button and insert tube into colorimeter chamber.
Record % T as soon as reading stabilizes.
8. Consult calibration chart to determine ammonia -nitrogen concentration in parts per million (ppm).
DC1600 AMMONIA NITROGEN ~ LOW RANGE CALIBRATION CHART
%T 9 8 7 6 5 4 3 2 1 0
90
80
70
60
50
40
30
20
10
0
0.06 0.07 0.08 0.09 0.10 0.11 0.12 0.13 0.14 0.15
0.17 0.18 0.19 0.20 0.21 0.23 0.24 0.25 0.27 0.28
0.30 0.31 0.33 0.34 0.36 0.38 0.40 0.41 0.43 0.45
0.47 0.50 0.52 0.54 0.57 0.59 0.62 0.65 0.68 0.71
0.75 0.79 0.82 0.87 0.91 0.96 1.02
0.00 0.01 0.02 0.03 0.04 0.04 0.05
14
Page 15

AMMONIA NITROGEN ~ HIGH RANGE
NESSLERIZATION METHOD CODE 3642
QUANTITY CONTENTS CODE
30 mL Ammonia Nitrogen Reagent #1 V-4797-G
2 x 30 mL *Ammonia Nitrogen Reagent #2 *V-4798-G
1 Pipet, 1 mL, plastic 0354
*WARNING: Reagents marked with a * are considered hazardous substances. Material Safety Data Sheets (MSDS) are supplied for
these reagents. For your safety, read label and accompanying MSDS before using.
Ammonia nitrogen is present in various concentrations in many surface and ground water supplies. Any sudden change in
the concentration of ammonia nitrogen in a water supply is cause for suspicion. A product of microbiological activity,
ammonia nitrogen is sometimes accepted as chemical evidence of pollution when encountered in natural waters.
Ammonia is rapidly oxidized in natural water systems by special bacterial groups that produce nitrite and nitrate. This
oxidation requires that dissolved oxygen be available in the water. Ammonia is an additional source of nitrogen as a
nutrient which may contribute to the expanded growth of undesirable algae and other forms of plant growth that overload
the natural system and cause pollution.
APPLICATION: Drinking, surface, and saline waters; domestic and industrial wastes.
RANGE: 0 – 3.0 ppm Ammonia Nitrogen
METHOD: Ammonia forms a colored complex with Nessler’s Reagent in proportion to the amount of
ammonia present in the sample. Rochelle salt is added to prevent precipitation of calcium or
magnesium in undistilled samples.
SAMPLE HANDLING
& PRESERVATION: Preservation is accomplished by the addition of 2 mL of concentrated H2SO4 at 4°C.
INTERFERENCES: Sample turbidity and color may interfere. Turbidity may be removed by a filtration procedure.
Color interference may be eliminated by adjusting the instrument to 100%T with a sample
blank.
15
Page 16

PROCEDURE
NOTE: For best results carry a reagent blank through the procedure for greater accuracy. Set the Reagent blank reading to
85%T, which corresponds to 0 ppm ammonia nitrogen, then continue with unknown sample tests.
1. Rinse a clean colorimeter tube (0967) with sample water. Fill to the 10 mL line with sample.
2. Select setting 1 on “Select Wavelength” knob and press “30 Second Read” button.
3. Insert tube into colorimeter chamber and adjust to 100%T with “Set Blank” knob. This is the 100%T blank (See
Note).
4. Remove tube from colorimeter. Add 8 drops of Ammonia Nitrogen Reagent #1 (V-4797). Cap and mix.
5. Use the 1.0 mL pipet (0354) to add 1.0 mL of *Ammonia Nitrogen Reagent #2 (V-4798). Cap and mix. Allow
5 minutes for maximum color development.
6. At end of 5 minute waiting period, press “30 Second Read” button and insert tube into colorimeter chamber. Record
%T as soon as reading stabilizes.
7. Consult calibration chart to determine ammonia-nitrogen concentration in parts per million (ppm).
DC1600 AMMONIA NITROGEN ~ HIGH RANGE CALIBRATION CHART
%T 9 8 7 6 5 4 3 2 1 0
90
80
70
60
50
40
30
20
10
0
0.09 0.11 0.12 0.14 0.16 0.17 0.19 0.21 0.23 0.24
0.26 0.28 0.30 0.32 0.34 0.36 0.38 0.40 0.42 0.44
0.46 0.48 0.51 0.53 0.55 0.57 0.60 0.62 0.65 0.67
0.70 0.72 0.75 0.78 0.81 0.84 0.86 0.89 0.93 0.96
0.99 1.02 1.06 1.09 1.13 1.16 1.20 1.24 1.28 1.32
1.37 1.41 1.46 1.51 1.56 1.61 1.67 1.72 1.78 1.84
1.91 1.98 2.05 2.13 2.21 2.30 2.40 2.50 2.61 2.74
2.87 3.02
0.00 0.01 0.03 0.04 0.06 0.07
16
Page 17

CHLORINE - BROMINE - IODINE
DPD METHOD CODE 3643
QUANTITY CONTENTS CODE
2 x 100 *DPD #1 Instrument Grade Tablets *6903-J
100 DPD #3 Instrument Grade Tablets 6197-J
15 mL Glycine Solution 6811-E
1 Tablet Crusher 0175
*WARNING: Reagents marked with a * are considered hazardous substances. Material Safety Data Sheets (MSDS) are supplied for
these reagents. For your safety, read label and accompanying MSDS before using.
NOTE: To distinguish bromine, free chlorine, total chlorine and combined chlorine, order Glycine Solution (Code
6811-E).
CHLORINE
All water for cities and communities must be disinfected; even waters that come from clean sources, protected watersheds,
reservoirs, and deep wells, are commonly disinfected to assure safety. Chlorine is the most commonly used disinfectant for
several reasons: it is effective against a wide range of microorganisms, its cost is low, and the methods of applying it have
been well developed. If chlorine is present in the water for a few minutes, disease producing bacteria will be destroyed. A
number of conditions affect the disinfecting action of chlorine. In municipal systems these can be controlled so that if
chlorine is detectable, it can be assumed that bacteria have been killed. The factors that influence the rate of disinfection
are temperature, pH, presence of other materials that react with chlorine, time, and the concentrations of the various
chlorine combinations that are formed in the water with ammonia and other substances that react with chlorine.
The fact that chlorine can be easily detected and measured makes chlorine a favorite water disinfectant of those concerned
with the public safety of water supplies. Chlorine concentrations in the range of 0.1 to 0.4 milligrams per liter are usually
maintained in municipal supplies.
Chlorine can be added in the form of chlorine gas, liquid sodium hypochlorite (bleach), granular calcium hypochlorite or
as organic chlorine compounds. Chlorine is not present in natural water supplies; if it is present it is the result of
chlorination of a water supply or of chlorinated compounds being discharged as waste from industrial operations. The
presence of chlorine in concentrations above 0.5 parts per million should be considered evidence of pollution from chlorine
treated effluents or from a process in which high concentrations of chlorine are used.
APPLICATION: Drinking, surface, saline waters; swimming pool water; domestic and industrial wastes.
RANGE: 0.00 – 4.0 ppm Chlorine
METHOD: In the absence of iodide, free available chlorine reacts instantly with DPD to produce a red
color. Subsequent addition of potassium iodide evokes a rapid color response from the
combined forms of chlorine (chloramines).
SAMPLE HANDLING
& PRESERVATION: Chlorine in aqueous solutions is not stable, and the chlorine content of samples or solutions,
particularly weak solutions, will rapidly decrease. Exposure to sunlight or agitation will
accelerate the reduction of chlorine present in such solutions. For best results, start analysis
immediately after sampling. Samples to be analyzed for chlorine cannot be preserved or stored.
INTERFERENCE: The only interfering substance likely to be encountered in water is oxidized manganese. The
extent of this interference can be determined by treating a sample with sodium arsenite to
destroy the chlorine present so that the degree of interference can be measured.
Iodine and bromine can give a positive interference, but these are not normally present unless
they have been added as disinfectants.
17
Page 18

FREE CHLORINE
1. Rinse a clean colorimeter tube (0967) with sample water. Fill to the 10 mL line with sample.
2. Select setting 4 on “Select Wavelength” knob and press “30 Second Read” button.
3. Insert tube into colorimeter chamber and adjust to 100%T with “Set Blank” knob. This is the 100%T blank.
4. Remove tube from colorimeter and pour off all but a sufficient amount of sample water to cover a tablet. Add one
*DPD #1 Instrument Grade Tablet (6903). Crush tablet with a tablet crusher (0175), then add water sample until
tube is filled to 10 mL line. Cap tube and shake until tablet has dissolved. Solution will turn pink if free chlorine is
present.
5. Press “30 Second Read” button and insert tube into colorimeter chamber. Record %T as soon as reading stabilizes.
Reading for free chlorine should be made within 30 seconds.
6. Consult calibration chart to determine free chlorine concentration in parts per million (ppm). Do not discard sample
if test for total residual chlorine is to be made. If reading is greater than 4.0 ppm, it is recommended that a dilution be
made of the sample and the result multiplied by the dilution factor.
COMBINED CHLORINE
1. Add one DPD #3 Instrument Grade Tablet (6197) to sample from Step 5 above. Crush tablet with tablet crusher
(0175). Cap tube and shake until tablet dissolves. An increase in color over Step 5 represents combined chlorine.
2. Press “30 Second Read” button and insert sample into colorimeter chamber. Record %T as soon as reading stabilizes.
3. Consult calibration chart to determine total chlorine concentration in parts per million (ppm). Subtract free chlorine
reading from total chlorine reading to obtain concentration of combined chlorine. If reading is greater than 4.0 ppm,
it is recommended that a dilution be made of the sample and the result multiplied by the dilution factor.
DC1600 FREE AND TOTAL CHLORINE CALIBRATION CHART
%T 9 8 7 6 5 4 3 2 1 0
90
80
70
60
50
40
30
20
10
0
0.00 0.01 0.02 0.03 0.04 0.05 0.06 0.07 0.08 0.09
0.10 0.11 0.12 0.13 0.14 0.15 0.16 0.18 0.19 0.20
0.21 0.22 0.24 0.25 0.26 0.28 0.29 0.30 0.32 0.33
0.34 0.36 0.37 0.39 0.41 0.42 0.44 0.45 0.47 0.49
0.51 0.52 0.54 0.56 0.58 0.60 0.62 0.64 0.66 0.68
0.71 0.73 0.75 0.78 0.80 0.83 0.85 0.88 0.91 0.94
0.96 1.00 1.03 1.06 1.09 1.13 1.16 1.20 1.24 1.28
1.32 1.37 1.41 1.46 1.51 1.57 1.62 1.68 1.74 1.81
1.88 1.95 2.03 2.12 2.21 2.31 2.42 2.54 2.67 2.82
2.98 3.17 3.39 3.65 3.96
18
Page 19

BROMINE
APPLICATION: Drinking, surface, saline waters; swimming pool water; domestic and industrial waters and
wastes.
RANGE: 0 – 10 ppm Bromine
METHOD: In buffered sample bromine reacts with diethyl-p-phenylene diamine (DPD) to produce a
SAMPLE HANDLING
& PRESERVATION: Bromine in aqueous solutions is not stable, and the bromine content of samples or solutions,
INTERFERENCE: The only interfering substance likely to be encountered in water is oxidized manganese. The
pink-red color in proportion to the concentration of bromine present.
particularly weak solutions, will rapidly decrease. Exposure to sunlight or agitation will
accelerate the reduction of bromine present in such solutions. For best results start analysis
immediately after sampling. Samples to be analyzed for bromine cannot be preserved or stored.
extent of this interference can be determined by treating a sample with sodium arsenite to
destroy the bromine present so that the degree of interference can be estimated.
Iodine and chlorine can also interfere, but these are not normally present unless they have
been added as disinfectants.
19
Page 20

PROCEDURE
A. BROMINE (NO CHLORINE)
1. Rinse a clean colorimeter tube (0967) with sample water. Fill to the 10 mL line with sample.
2. Select setting 4 on “Select Wavelength” knob and press the “30 Second Read” button.
3. Insert tube into colorimeter chamber and adjust to 100%T with the “Set Blank” knob. This is the 100%T blank.
4. Remove tube from the colorimeter. Pour out all but a sufficient amount of sample water to cover a tablet. Add one
*DPD #1 Instrument Grade Tablet (6903). Crush tablet with tablet crusher (0175), then add sample water until tube
is filled to 10 mL line. Cap tube and shake until tablet is dissolved. Solution will turn pink if bromine is present.
5. Press “30 Second Read” button and insert tube into colorimeter chamber. Record %T as soon as reading stabilizes.
6. Consult calibration chart to determine bromine concentration in parts per million (ppm).
B. BROMINE IN THE PRESENCE OF CHLORINE
1. Rinse a clean colorimeter tube (0967) with sample water. Fill to the 10 mL line with sample.
2. Select setting 4 on “Select Wavelength” knob and press “30 Second Read” button.
3. Insert tube into colorimeter chamber and adjust to “100”%T with the “Set Blank” knob. This is the 100%T blank.
4. Rinse a second clean colorimeter tube (0967) with sample water. Fill to the 10 mL line with sample. Add 5 drops of
Glycine Solution (6811). Cap and mix.
5. Remove 100%T blank from colorimeter. Pour out all of the sample water. To this tube add just enough of Glycine
treated sample (Step 4) to cover a tablet. Add one *DPD#1 Instrument Grade Tablet (6903). Crush tablet with a
tablet crusher (0175). Add all remaining Glycine-treated sample. Cap tube and shake until tablet dissolves. Solution
will turn pink if bromine is present.
6. Press “30 Second Read” button, and insert sample into colorimeter chamber. Record %T as soon as reading stabilizes.
7. Consult calibration chart to determine bromine concentration in parts per million (ppm). Record as Reading BR.
C. FREE AVAILABLE, TOTAL AVAILABLE AND
COMBINED CHLORINE IN THE PRESENCE OF BROMINE
NOTE: Combined chlorine is not affected by the presence of bromine, so the calculation is the same as when
only chlorine is present.
1. Perform the test for free and combined chlorine as previously described.
2. Perform the test for bromine in the presence of chlorine.
3. Calculations:
Residual Bromine (ppm) = Reading BR
Free Chlorine in the Presence of Bromine =
Total Chlorine in the Presence of Bromine =
Combined Chlorine in the Presence of Bromine =
DC1600 BROMINE CALIBRATION CHART
%T 9 8 7 6 5 4 3 2 1 0
90
80
70
60
50
40
30
20
10
0
0.10 0.12 0.13 0.15 0.17 0.19 0.21 0.23 0.25 0.27
0.29 0.31 0.33 0.35 0.37 0.40 0.42 0.44 0.47 0.49
0.51 0.54 0.56 0.59 0.61 0.64 0.67 0.69 0.72 0.75
0.78 0.81 0.84 0.87 0.90 0.93 0.96 1.00 1.03 1.06
1.10 1.14 1.17 1.21 1.25 1.29 1.33 1.37 1.42 1.46
1.50 1.55 1.60 1.65 1.70 1.75 1.80 1.86 1.91 1.97
2.03 2.09 2.16 2.23 2.30 2.37 2.44 2.52 2.60 2.68
2.77 2.86 2.96 3.06 3.16 3.27 3.39 3.51 3.64 3.78
3.93 4.08 4.25 4.43 4.63 4.84 5.07 5.32 5.60 5.92
6.27 6.67 7.14 7.70 8.38 9.24 10.40
Free Chlorine − 0.45 (Reading BR)
Total Chlorine − 0.45 (Reading BR)
Total Chlorine − Free Chlorine
20
Page 21

IODINE
APPLICATION: Drinking, surface, saline waters; swimming pool water; domestic and industrial wastes.
RANGE: 0 - 15.0 ppm Iodine
METHOD: In a buffered sample iodine reacts with diethyl-p-phenylene-diamine (DPD) to produce a
pink-red color in proportion to the concentration of iodine present.
SAMPLE HANDLING
& PRESERVATION: Iodine in aqueous solutions is not stable, and the iodine content of samples or solutions,
particularly weak solutions, will rapidly decrease. Exposure to sunlight or agitation will
accelerate the reduction of iodine present in such solutions. For best results start analysis
immediately after sampling. Samples to be analyzed for iodine cannot be preserved or stored.
INTERFERENCE: The only interfering substance likely to be encountered in water is oxidized manganese. The
extent of this interference can be determined by treating a sample with sodium arsenite to
destroy the chlorine present so that the degree of interference can be measured.
Chlorine and bromine can give a positive interference, but these are not normally present
unless they have been added as disinfectants.
PROCEDURE
1. Rinse a clean colorimeter tube (0967) with sample water. Fill tube to the 10 mL line with sample.
2. Select setting 4 on “Select Wavelength” knob and press “30 Second Read” button.
3. Insert tube into colorimeter chamber and adjust to 100%T with “Set Blank” knob. This is the 100%T blank.
4. Remove tube from colorimeter. Pour off all but a sufficient amount of sample water to cover a tablet. Add one *DPD
#1 Instrument Grade Tablet (6903). Crush tablet with tablet crusher (0175). Add sample water until tube is filled to
10 mL line. Cap and shake until tablet dissolves. Solution will turn pink if iodine is present.
5. Press “30 Second Read” button and insert tube into colorimeter chamber. Record %T as soon as reading stabilizes.
6. Consult calibration chart to determine iodine concentration in parts per million (ppm).
DC1600 IODINE CALIBRATION CHART
%T 9 8 7 6 5 4 3 2 1 0
90
80
70
60
50
40
30
20
10
0
0.13 0.17 0.21 0.25 0.29 0.32 0.36 0.40 0.44 0.49
0.53 0.57 0.61 0.66 0.70 0.75 0.79 0.84 0.88 0.93
0.98 1.03 1.08 1.13 1.18 1.23 1.29 1.34 1.39 1.45
1.51 1.56 1.62 1.68 1.74 1.81 1.87 1.93 2.00 2.07
2.13 2.20 2.28 2.35 2.42 2.50 2.58 2.66 2.74 2.82
2.91 2.99 3.08 3.17 3.27 3.36 3.46 3.57 3.67 3.78
3.89 4.01 4.12 4.25 4.37 4.50 4.64 4.78 4.92 5.08
5.23 5.40 5.57 5.74 5.93 6.13 6.33 6.55 6.78 7.02
7.27 7.54 7.83 8.14 8.47 8.83 9.22 9.65 10.12 10.64
11.23 11.89 12.66 13.56 14.65
21
Page 22

This page is purposely left blank...
22
Page 23

CHLORINE DIOXIDE
DPD METHOD CODE 3644
QUANTITY CONTENTS CODE
100 *DPD #1 Instrument GradeTablets *6903-J
15 mL Glycine Solution 6811-E
1 Tablet Crusher 0175
*WARNING: Reagents marked with a * are considered hazardous substances. Material Safety Data Sheets (MSDS) are supplied for
these reagents. For your safety, read label and accompanying MSDS before using.
Chlorine dioxide is used as a substitute for and an adjunct to chlorine in water treatment. It is better than chlorine in
eliminating taste and odor in certain cases. Chlorine dioxide, unlike chlorine, does not produce carcinogenic chlorinated
organic compounds when reacted with organic materials. A disadvantage is the higher cost of producing chlorine dioxide
compared to chlorine.
APPLICATION: Drinking and pool waters; domestic and industrial wastewater.
RANGE: 0 – 7.0 ppm Chlorine Dioxide
METHOD: Chlorine dioxide reacts with DPD to form a red color in proportion to the concentration.
SAMPLE HANDLING
& PRESERVATION: Test as soon as possible to avoid loss of chlorine dioxide.
INTERFERENCE: Chlorine interference is eliminated by the addition of glycine to the sample before the
indicator.
PROCEDURE
1. Rinse a clean colorimeter tube (0967) with sample water. Fill to 10 mL line with sample.
2. Select setting 4 on “Select Wavelength” knob and press “30 Second Read” button.
3. Insert tube into colorimeter chamber and adjust to 100%T with “Set Blank” knob. This tube is the 100%T blank.
4. Remove tube from colorimeter. Pour out all but a sufficient amount of sample water to cover tablet. Add 5 drops of
Glycine Solution (6811).
5. Add one *DPD #1 Instrument Grade Tablet (6903). Crush tablet with tablet crusher. Cap and shake until tablet
dissolves. Fill to 10 mL line with sample water. Solution will turn pink if chlorine dioxide is present.
6. Press “30 Second Read” button and insert tube into colorimeter chamber. Record %T as soon as reading stabilizes.
The reading should be made within 30 seconds.
7. Consult calibration chart to determine chlorine dioxide concentration in parts per million (ppm).
DC1600 CHLORINE DIOXIDE CALIBRATION CHART
%T 9 8 7 6 5 4 3 2 1 0
90
80
70
60
50
40
30
20
10
0
0.16 0.18 0.20 0.22 0.24 0.26 0.28 0.30 0.32 0.35
0.37 0.39 0.41 0.44 0.46 0.48 0.51 0.53 0.56 0.59
0.61 0.64 0.67 0.70 0.72 0.75 0.78 0.81 0.85 0.88
0.91 0.94 0.98 1.01 1.05 1.08 1.12 1.16 1.20 1.24
1.28 1.32 1.37 1.41 1.46 1.51 1.55 1.61 1.66 1.71
1.77 1.82 1.88 1.94 2.01 2.07 2.14 2.21 2.29 2.36
2.44 2.53 2.61 2.70 2.80 2.90 3.01 3.12 3.24 3.37
3.50 3.64 3.79 3.96 4.14 4.33 4.54 4.77 5.02 5.31
5.63 6.00 6.42 6.93
0.00 0.02 0.03 0.05 0.07 0.09 0.11 0.12 0.14
23
Page 24

This page is purposely left blank...
24
Page 25

CHROMIUM (HEXAVALENT)
DIPHENYLCARBOHYDRAZIDE METHOD CODE 3645
QUANTITY CONTENTS CODE
10 g *Chromium Reagent Powder *V-6276-D
1 Spoon, 0.1 g, plastic 0699
1 Filter Paper 0465-H
1 Funnel, 20 mL 2-2135
*WARNING: Reagents marked with a * are considered hazardous substances. Material Safety Data Sheets (MSDS) are supplied for
these reagents. For your safety, read label and accompanying MSDS before using.
Chromium may be present in water containing waste from industries such as metal plating, or in overflow water from large
air conditioning units where chromate compounds are frequently added to cooling water to control corrosion. It is
considered to be a toxic chemical and, if present in an amount of over 0.5 ppm, is evidence of contamination from
untreated or incompletely treated industrial waste.
Chromium is one of a class of heavy metals found in the bottom muds of polluted bodies of waters. Certain shellfish are
capable of concentrating this element, endangering the health of its ultimate consumer, human or animal.
APPLICATION: Drinking, surface, & saline waters; domestic and industrial wastewaters.
RANGE: 0 – 1.0 ppm Chromium
METHOD: Hexavalent chromium reacts with 1,5 diphenylcarbohydrazide under acidic conditions to form
a red-purple color in proportion to the amount of chromium present.
SAMPLE HANDLING
& PRESERVATION: Analysis for chromium should be made as quickly as possible after sample collection since
storage in glass or plastic containers may result in low chromate values.
INTERFERENCES: High concentrations of mercurous and mercuric ions may impart a blue color to the chromium
determination. Iron and vanadium in concentrations above 1 mg/L may result in a yellow
color. However, the vanadium color becomes negligible 10 minutes after the addition of
diphenylcarbohydrazide.
25
Page 26

PROCEDURE
1. Rinse a clean colorimeter tube (0967) with sample water. Fill to the 10 mL line with sample.
2. Select setting 4 on “Select Wavelength” knob and press “30 Second Read” button.
3. Insert tube into colorimeter chamber and adjust to 100%T with “Set Blank” knob. This is the 100%T blank.
4. Remove tube from colorimeter chamber. Use the 0.1g spoon (0699) to add one measure of *Chromium Reagent
Powder (V-6276). Cap and shake until powder dissolves. Wait 2 or 3 minutes for full color development.
NOTE: Highly buffered waters may give poor results and require a more careful pH adjustment. Order the Chromium
pH Adjustment Package, Code 2087.
NOTE: During waiting period, fold a piece of filter paper (0465) in half then half again to form a cone, and fit into
the funnel (2-2135).
5. At the end of 2-3 minute waiting period, filter sample into a clean colorimeter tube. Insert this tube into colorimeter
chamber and press “30 Second Read” button. Record %T as soon as reading stabilizes.
6. Consult calibration chart to determine hexavalent chromium concentration in parts per million (ppm).
NOTE: To convert result to ppm chromate (CrO4
(Na2CrO4), multiply by 3.12.
DC1600 CHROMIUM (HEXAVALENT) CALIBRATION CHART
%T 9 8 7 6 5 4 3 2 1 0
100
90
80
70
60
50
40
30
20
10
0
0.016 0.019 0.022 0.026 0.029 0.032 0.036 0.040 0.043 0.047
0.050 0.054 0.058 0.062 0.065 0.069 0.073 0.077 0.081 0.085
0.089 0.094 0.098 0.102 0.106 0.111 0.115 0.120 0.124 0.129
0.134 0.139 0.143 0.148 0.153 0.158 0.164 0.169 0.174 0.180
0.185 0.191 0.197 0.202 0.208 0.214 0.221 0.227 0.233 0.240
0.247 0.253 0.260 0.267 0.275 0.282 0.290 0.298 0.306 0.314
0.322 0.331 0.340 0.349 0.358 0.368 0.378 0.388 0.399 0.410
0.421 0.433 0.445 0.458 0.471 0.484 0.499 0.514 0.529 0.546
0.563 0.581 0.600 0.621 0.643 0.666 0.691 0.719 0.748 0.781
0.817 0.857 0.903 0.956 1.019
-2
), multiply by 2.23. To convert result to ppm sodium chromate
0.000 0.003 0.006 0.009 0.012
26
Page 27

CHROMIUM
HEXAVALENT, TRIVALENT & TOTAL
DIPHENYLCARBOHYDRAZIDE METHOD CODE 3698
QUANTITY CONTENTS CODE
60 mL *Sulfuric Acid, 5N *7681-H
10 g *Chromium Reagent Powder *V-6276-D
15 mL *Sodium Azide, 5% *7683-E
30 mL Potassium Permanganate, 0.5% 7682-G
60 mL Deionized Water 5115PT-H
1 Pipet, plain, glass, w/cap 0341
1 Pipet, 1.0mL, plastic 0354
1 Pipet, plain, plastic 0352
1 Spoon, 0.1 g, plastic 0699
1 Graduated Cylinder, 50 mL, glass 0418
1 Flask, Erlenmeyer, 125 mL, glass 0431
1 Test tube holder 1113
1 Filter Paper 0465
1 Funnel, plastic 0459
*WARNING: Reagents marked with a * are considered hazardous substances. Material Safety Data Sheets (MSDS) are supplied for
these reagents. For your safety, read label and accompanying MSDS before using.
A toxic chemical, chromium is found in two forms in the water; trivalent chromium (Cr+3) and hexavalent chromium
(Cr+6). Chromium enters the water from industrial waste, including large air conditioning units where it may be used to
control corrosion, or metal finishing plants. Trivalent chromium is more toxic than hexavalent chromium. Levels greater
than 0.5 ppm indicate improperly treated industrial waste. It is important to maintain chromium levels at or below 0.5 ppm,
because clams and other shellfish will store chromium in their systems, accumulating levels which may be dangerous to the
consumer, whether human or animal.
APPLICATION: Drinking, surface, & saline water; domestic and industrial waste
RANGE: 0 – 1.0 ppm
METHOD: The trivalent chromium is converted to hexavalent chromium by permanganate under acidic
SAMPLE HANDLING
& PRESERVATION: Analysis for chromium should be made as quickly as possible after sample collection since
INTERFERENCES: High concentrations of mercurous and mercuric ions may interfere.
conditions. Hexavalent chromium reacts with 1,5 diphenylcarbohydrazide under acidic
conditions to form a red-purple color in proportion to the amount of chromium present.
storage in glass or plastic containers may result in low chromate values.
27
Page 28

PROCEDURE
HEXAVALENT CHROMIUM
1. Rinse a clean colorimeter tube (0967) with sample water. Fill to 10 mL line with sample water.
2. Select setting 4 on “Select Wavelength” knob and press “30 Second Read” button.
3. Insert colorimeter tube into colorimeter chamber and adjust to 100% T with “Set Blank” knob. This is the 100% T
blank.
4. Remove tube from colorimeter. Use 0.1 g spoon (0699) to add one level measure of *Chromium Reagent Powder
(V-6276). Cap and shake for one minute. Wait 2 to 3 minutes.
5. During the waiting period, fold a piece of filter paper in half, then in half again to form a cone. Push corners together
to open end, and insert into funnel (0459).
6. Filter sample into a clean colorimeter tube (0967). Insert tube into colorimeter chamber and press “30 Second Read”
button. Record %T as soon as reading stabilizes.
7. Consult calibration chart (page 26) to determine hexavalent chromium concentration in parts per million (ppm).
TOTAL CHROMIUM WITH ACID DIGESTION
1. Fill graduated cylinder (0418) to 50 mL line with sample water. Transfer to Erlenmeyer flask (0431).
2. Use the 1 mL pipet (0354) to add 5 mL (five measures) of *Sulfuric Acid, 5N (7681). Swirl to mix.
NOTE: Highly buffered waters may require pH adjustment. Order the Chromium pH Adjustment
Package, Code 2087.
3. Place flask on burner or hot plate. Bring solution to a gentle boil.
4. Fill pipet (0341) with Potassium Permanganate, 0.5% (7682). While gently swirling flask, add Potassium
Permanganate, 0.5% (7682), 2 drops at a time to boiling solution, until solution turns a dark pink color which persists
for 10 minutes. Continue boiling.
5. Add one drop of *Sodium Azide, 5% (7683) to boiling solution. Boil for approximately 30 seconds. If pink color does
not fade, add another drop of *Sodium Azide, 5%. Continue adding *Sodium Azide, 5% one drop at a time until pink
color disappears.
6. Remove flask from heat. Cool sample under running water. This is the digested sample.
7. Pour digested sample into clean graduated cylinder (0418). Dilute to the 50 mL line with Deionized Water (5115).
8. Rinse a clean colorimeter tube (0967) with sample water. Fill to 10 mL line with sample water.
9. Select setting 4 on “Select Wavelength” knob and press “30 Second Read” button.
10. Insert colorimeter tube into colorimeter chamber and adjust to 100% T with “Set Blank” knob. This is the 100% T
blank.
11. Remove tube from colorimeter. Use 0.1 g spoon (0699) to add one level measure of *Chromium Reagent Powder
(V-6276). Cap and shake for one minute. Wait 2 to 3 minutes.
12. During the waiting period, fold a piece of filter paper in half, then in half again to form a cone. Push corners together
to open end, and insert into funnel (0459).
13. Filter sample into a clean colorimeter tube (0967). Insert tube of filtered sample into colorimeter chamber and press
“30 Second Read” button. Record %T as soon as reading stabilizes.
14. Consult calibration chart (page 26) to determine total chromium concentration in parts per million (ppm).
TRIVALENT CHROMIUM
Subtract hexavalent chromium from total chromium. Record as ppm trivalent chromium.
Trivalent Chromium = Total Chromium − Hexavalent Chromium
28
Page 29

DC1600 CHROMIUM (HEXAVALENT) CALIBRATION CHART
%T 9 8 7 6 5 4 3 2 1 0
100
90
80
70
60
50
40
30
20
10
0
0.016 0.019 0.022 0.026 0.029 0.032 0.036 0.040 0.043 0.047
0.050 0.054 0.058 0.062 0.065 0.069 0.073 0.077 0.081 0.085
0.089 0.094 0.098 0.102 0.106 0.111 0.115 0.120 0.124 0.129
0.134 0.139 0.143 0.148 0.153 0.158 0.164 0.169 0.174 0.180
0.185 0.191 0.197 0.202 0.208 0.214 0.221 0.227 0.233 0.240
0.247 0.253 0.260 0.267 0.275 0.282 0.290 0.298 0.306 0.314
0.322 0.331 0.340 0.349 0.358 0.368 0.378 0.388 0.399 0.410
0.421 0.433 0.445 0.458 0.471 0.484 0.499 0.514 0.529 0.546
0.563 0.581 0.600 0.621 0.643 0.666 0.691 0.719 0.748 0.781
0.817 0.857 0.903 0.956 1.019
0.000 0.003 0.006 0.009 0.012
29
Page 30

This page is purposely left blank...
30
Page 31

COPPER ~ LOW RANGE
BICINCHONINIC ACID METHOD CODE 3640
QUANTITY CONTENTS CODE
50 *Copper Tablets *T-3808-H
*WARNING: Reagents marked with a * are considered hazardous substances. Material Safety Data Sheets (MSDS) are supplied for
these reagents. For your safety, read label and accompanying MSDS before using.
The copper content of drinking water generally falls below 0.03 parts per million, but copper levels as high as 1.0 parts per
million will give water a bitter taste. Waters testing as high as 1.0 part per million copper have probably been treated with a
copper compound, like those used in the control of algae, or have become contaminated from untreated industrial wastes.
The addition of copper sulfate to lakes causes an increase in the copper content of the sediments. Acid waters and those
high in free carbon dioxide may cause the corrosion or “eating away” of copper, brass and bronze pipes and fittings. This
corrosion results in the addition of copper into the water supply.
APPLICATION: Drinking, surface, and saline waters; domestic and industrial wastes.
RANGE: 0 – 3.0 ppm Copper
METHOD: Cupric ions form a purple complex with bicinchoninic acid around pH 6-7, in proportion to
the concentration of copper in the sample.
SAMPLE HANDLING
& PRESERVATION: Copper has a tendency to be adsorbed to the surface of the sample container. Samples should
be analyzed as soon as possible after collection. If storage is necessary, 0.5 mL of 20% HCl per
100 mL of sample will prevent “plating out.” However, a correction must be made to bring the
reaction into optimum pH range.
INTERFERENCES: High concentrations of oxidizing agents, calcium, and magnesium interfere. Silver can also
interfere.
PROCEDURE
1. Rinse a clean colorimeter tube (0967) with sample water. Fill to the 10 mL line with sample.
2. Select setting 5 on “Select Wavelength” knob and press “30 Second Read” button.
3. Insert tube into colorimeter chamber and adjust to 100%T with “Set Blank” knob. This is the 100%T blank.
4. Remove tube from colorimeter and add one *Copper Tablet (T-3808). Cap and shake vigorously until tablet dissolves.
Solution will turn purple if copper is present. Wait 2 minutes.
5. At end of 2 minute waiting period, press “30 Second Read” button and insert tube into colorimeter chamber. Record
%T as soon as reading stabilizes.
6. Consult calibration chart to determine copper concentration in parts per million (ppm).
DC1600 COPPER ~ LOW RANGE CALIBRATION CHART
%T 9 8 7 6 5 4 3 2 1 0
90
80
70
60
50
40
30
20
10
0
0.02 0.04 0.06 0.08 0.10 0.12 0.14 0.17 0.19 0.21
0.23 0.25 0.28 0.30 0.32 0.35 0.37 0.40 0.42 0.45
0.47 0.50 0.52 0.55 0.58 0.61 0.63 0.66 0.69 0.72
0.75 0.78 0.81 0.84 0.88 0.91 0.94 0.98 1.01 1.05
1.08 1.12 1.16 1.19 1.23 1.27 1.31 1.36 1.40 1.44
1.49 1.53 1.58 1.63 1.68 1.73 1.78 1.83 1.89 1.94
2.00 2.06 2.12 2.18 2.25 2.32 2.39 2.46 2.53 2.61
2.69 2.78 2.86 2.96 3.05
31
Page 32

This page is purposely left blank...
32
Page 33

COPPER ~ HIGH RANGE
DIETHYLDITHIOCARBAMATE METHOD CODE 3646
QUANTITY CONTENTS CODE
15 mL *Copper Reagent *6446-E
*WARNING: Reagents marked with a * are considered hazardous substances. Material Safety Data Sheets (MSDS) are supplied for
these reagents. For your safety, read label and accompanying MSDS before using.
The copper content of drinking water generally falls below 0.03 parts per million, but copper levels as high as 1.0 parts per
million will give water a bitter taste. Waters testing as high as 1.0 part per million copper have probably been treated with a
copper compound, like those used in the control of algae, or have become contaminated from untreated industrial wastes.
The addition of copper sulfate to lakes causes an increase in the copper content of the sediments. Acid waters and those
high in free carbon dioxide may cause the corrosion or “eating away” of copper, brass and bronze pipes and fittings. This
corrosion results in the addition of copper into the water supply.
APPLICATION: Drinking, surface, and saline waters; domestic and industrial wastes.
RANGE: 0 – 5.0 ppm Copper
METHOD: Cupric ions form a yellow colored chelate with diethyldithiocarbamate around pH 9-10 in
proportion to the concentration of copper in the sample.
SAMPLE HANDLING
& PRESERVATION: Copper has a tendency to be absorbed to the surface of the sample container. Samples should
be analyzed as soon as possible after collection. If storage is necessary, 0.5 mL of 20%
hydrochloric acid per 100 mL of sample will prevent “plating out.” However, a correction must
be made to bring the reaction in the optimum pH range.
INTERFERENCES: Bismuth, cobalt, mercurous, nickel and silver ions and chlorine (6 ppm or greater) interfere
and must be absent.
PROCEDURE
1. Rinse a clean colorimeter tube (0967) with sample water. Fill to the 10 mL line with sample.
2. Select setting 2 on “Select Wavelength” knob and press “30 Second Read” button.
3. Insert tube into colorimeter chamber and adjust to 100%T with “Set Blank” knob. This is the 100%T blank.
4. Remove tube from colorimeter and add 5 drops of *Copper Reagent (6446). Cap and mix. Solution will turn yellow
if copper is present.
5. Press “30 Second Read” button and insert tube into colorimeter chamber. Record %T as soon as reading stabilizes.
6. Consult calibration chart to determine copper concentration in parts per million (ppm).
DC1600 COPPER ~ HIGH RANGE CALIBRATION CHART
%T 9 8 7 6 5 4 3 2 1 0
90
80
70
60
50
40
30
20
10
0
0.003 0.021 0.040 0.059 0.077 0.097 0.116 0.135 0.155 0.175
0.195 0.215 0.236 0.257 0.278 0.299 0.321 0.343 0.365 0.387
0.410 0.433 0.456 0.480 0.503 0.528 0.552 0.577 0.602 0.628
0.654 0.680 0.707 0.734 0.761 0.789 0.818 0.847 0.876 0.906
0.936 0.967 0.998 1.030 1.062 1.096 1.129 1.164 1.199 1.234
1.271 1.308 1.346 1.385 1.424 1.465 1.506 1.549 1.592 1.636
1.682 1.729 1.777 1.826 1.877 1.929 1.983 2.039 2.096 2.155
2.216 2.279 2.345 2.413 2.484 2.557 2.634 2.714 2.798 2.886
2.978 3.076 3.179 3.288 3.404 3.529 3.662 3.806 3.963 4.135
4.325 4.537 4.778 5.056
33
Page 34

This page is purposely left blank...
34
Page 35

CYANIDE
PYRIDINE-BARBITURIC ACID METHOD CODE 3660
QUANTITY CONTENTS CODE
60 mL Cyanide Buffer 2850PS-H
5 g *Cyanide Cl Reagent *2794DS-C
5 g *Cyanide Indicator Reagent *2793DS-C
15 mL *Hydrochloric Acid, 1N *6130-E
15 mL *Sodium Hydroxide, 1N *4004-E
2 Spoons, 0.1 g, plastic 0699
1 Pipet, plastic, 1.0 mL 0354
1 pH Short Range Test Papers, pH 9 - 14 2955
1 Rod, plastic, stirring 0519
*WARNING: Reagents marked with * are considered hazardous substances. Material Data Safety Sheets (MSDS) are supplied for these
reagents. For your safety, read label and accompanying MSDS before using.
APPLICATION: Low level concentrations in drinking and surface waters; domestic and industrial waters. This
method determines only those cyanides amenable to chlorination.
RANGE: 0 – 0.5 ppm Cyanide
METHOD: Cyanides react with a chlorine donor to form cyanogen chloride, which subsequently reacts
with Pyridine and Barbituric Acid to form a red-blue compound in proportion to the amount
of cyanide originally present. The concentration of the red-blue compound is determined
spectrophotometrically.
SAMPLE HANDLE
& PRESERVATION: Cyanide solutions tend to be unstable and should be analyzed as soon as possible. Samples can
be stabilized by adjusting the pH to greater than12 with NaOH. However, the pH will have to
be readjusted to pH 10.5 before performing the test.
INTERFERENCES: Oxidizing agents and aldehydes can react with cyanide, while reducing agents, such as sulfite,
react with the chlorine donor; both can cause negative interferences. Thiocyanate and
cyanogen chloride both react as cyanide in this test and will give a positive interference. Color
and turbidity can also interfere.
35
Page 36

PROCEDURE
1. Rinse a clean colorimeter tube (0967) with sample water. Fill to the 10 mL line with sample.
2. Dip the end of plastic rod (0519) into water sample and touch it to a small piece (1/4 inch) of pH Short Range Test
Paper (2955) to wet paper. Read pH immediately from color chart.
a) If pH is below 10, raise the pH by adding *Sodium Hydroxide, 1N (4004) one drop at a time with stirring.
Check pH after each drop with a new piece of pHydrion paper. Continue adjustment until pH is between 10.5
and 11.0.
b) If pH is above 11.5, lower pH by adding *Hydrochloric Acid (6130) one drop at a time with stirring. Check pH
after each drop with a new piece of pHydrion paper. Continue adjustment until pH is between 10.5 and 11.0.
3. Select setting 5 on “Select Wavelength” knob and press “30 Second Read” button.
4. Insert the tube into colorimeter chamber and adjust to 100% T with “Set Blank” knob. This is the 100% T blank.
5. Remove tube from colorimeter. Use the 1.0 mL pipet (0354) to add 1.0 mL of Cyanide Buffer (2850PS) to tube. Cap
and mix.
6. Use one 0.1 g spoon (0699) to add one measure of *Cyanide Cl Reagent (2794DS). Cap and invert 10 times to mix.
Wait 30 seconds.
7. At the end of the 30 second waiting period, use a second 0.1 g spoon (0699) to add one measure of *Cyanide
Indicator Reagent (2793DS). Cap and shake vigorously for 15 - 20 seconds. Wait twenty minutes for maximum color
development.
8. At the end of the twenty minute waiting period, press “30 Second Read” button and insert tube into colorimeter
chamber. Record % T as soon as reading stabilizes.
9. Consult calibration chart to determine cyanide concentration in parts per million (ppm).
DC1600 CYANIDE CALIBRATION CHART
%T 9 8 7 6 5 4 3 2 1 0
90
80
70
60
50
40
30
20
10
0
0.01 0.01 0.01 0.01 0.01 0.02 0.02 0.02 0.02 0.02
0.03 0.03 0.03 0.03 0.03 0.03 0.04 0.04 0.04 0.04
0.05 0.05 0.05 0.05 0.05 0.06 0.06 0.06 0.06 0.06
0.07 0.07 0.07 0.07 0.08 0.08 0.08 0.08 0.09 0.09
0.09 0.10 0.10 0.10 0.10 0.11 0.11 0.11 0.12 0.12
0.12 0.13 0.13 0.13 0.14 0.14 0.14 0.15 0.15 0.15
0.16 0.16 0.17 0.17 0.18 0.18 0.18 0.19 0.19 0.20
0.20 0.21 0.21 0.22 0.23 0.23 0.24 0.25 0.25 0.26
0.27 0.27 0.28 0.29 0.30 0.31 0.32 0.33 0.34 0.36
0.37 0.39 0.41 0.43 0.45 0.48 0.51
36
Page 37

CYANURIC ACID
MELAMINE - TURBIDITY CODE 3661
QUANTITY CONTENTS CODE
2 x 250 mL *Cyanuric Acid Test Solution *4856-K
1 Syringe, 5 mL 0807
*WARNING: Reagents marked with a * are considered hazardous substances. Material Safety Data Sheets (MSDS) are supplied for
these reagents. For your safety, read label and accompanying MSDS before using.
Cyanuric acid is added to swimming pool water as a stabilizing agent for free chlorine residuals. It minimizes the loss of
chlorine from the action of ultraviolet rays in sunlight. Cyanuric acid levels in pools should be maintained between 25 and
50 ppm and should never exceed the 100-150 ppm limit as proposed by the various public health associations.
APPLICATION: Swimming pool waters.
RANGE: 5 – 200 ppm Cyanuric Acid
METHOD: A buffered solution of melamine forms a precipitate with cyanuric acid in proportion to the
amount of cyanuric acid present. The amount of particles in suspension is measured
turbidimetrically.
SAMPLE HANDLING
& PRESERVATION: Cyanuric acid samples should be analyzed as soon as possible after collection. Deterioration of
the sample can be minimized by keeping samples in the dark or refrigerated until analysis can
be performed.
INTERFERENCES: No known interference from compounds normally found in pool water. Temperature of the
sample should be maintained between 70°F and 80°F for best results.
37
Page 38

PROCEDURE
1. Rinse a clean colorimeter tube (0967) with sample water. Fill to the 10 mL line with sample.
2. Select setting 4 on “Select Wavelength” knob and press “30 Second Read” button.
3. Insert tube into colorimeter chamber and adjust to 100%T with “Set Blank” knob. This is the 100%T blank.
4. Remove tube from colorimeter and pour out water. Use the 10 mL graduated cylinder (0416) to measure 5 mL
of sample water and pour into colorimeter tube.
5. Use the 5 mL syringe (0807) to add 5 mL of *Cyanuric Acid Test Solution (4856). Cap and mix thoroughly. A
precipitate will form if cyanuric acid is present. Wait 1 minute.
NOTE: This reagent bottle has a special fitting which enables the syringe to be inserted into the top of the bottle.
With syringe in place, invert bottle and withdraw syringe plunger until 5 mL of reagent is contained in the syringe
barrel. Remove syringe from reagent bottle and depress plunger to dispense into the tube.
6. At end of 1 minute waiting period, mix thoroughly, press “30 Second Read” button and insert sample into colorimeter
chamber. Record %T as soon as reading stabilizes.
7. Consult calibration chart to determine cynauric acid concentration in parts per million (ppm).
DC1600 CYANURIC ACID CALIBRATION CHART
%T 9 8 7 6 5 4 3 2 1 0
90
80
70
60
50
40
30
20
10
0
5.8 6.5 7.2 7.9 8.5 9.2 9.9 10.7 11.4 12.1
12.9 13.6 14.4 15.1 15.9 16.7 17.5 18.3 19.2 20.0
20.9 21.7 22.6 23.5 24.4 25.3 26.2 27.2 28.2 29.1
30.1 31.1 32.1 33.1 34.2 35.3 36.4 37.5 38.6 39.8
40.9 42.1 43.4 44.6 45.9 47.2 48.5 49.9 51.3 52.7
54.1 55.6 57.1 58.7 60.3 61.9 63.6 65.3 67.1 68.9
70.7 72.7 74.6 76.7 78.8 80.9 83.2 85.5 87.9 90.4
93.0 95.7 98.5 101.4 104.4 107.6 110.9 114.4 118.2 122.0
126.1 130.4 135.0 140.0 145.3 151.0 157.1 163.8 171.6 179.3
188.4 198.7 210.5
38
Page 39

FLUORIDE
SPADNS CODE 3647
QUANTITY CONTENTS CODE
2 x 60 mL *Acid-Zirconyl-SPADNS Reagent *3875-H
60 mL *Sodium Arsenite Solution *4128-H
1 Pipet, 0.5 mL, plastic 0353
1 Pipet, 1.0 mL, plastic 0354
*WARNING: Reagents marked with a * are considered hazardous substances. Material Safety Data Sheets (MSDS) are supplied for
these reagents. For your safety, read label and accompanying MSDS before using.
Fluoride may occur naturally in some ground waters or it may be added to public drinking water supplies to maintain a 1.0
mg/L concentration to prevent dental cavities. At higher concentrations, fluoride may produce an objectionable
discoloration of tooth enamel called fluorosis, though levels up to 8 mg/L have not been found to be physiologically
harmful.
APPLICATION Drinking and surface waters; domestic and industrial waters.
RANGE: 0.0 – 2.0 ppm Fluoride
METHOD: Colorimetric test based upon the reaction between fluoride and zirconium dye lake. The
fluoride reacts with the dye lake, dissociating a portion of it into a colorless complex ion and
dye. As the fluoride concentration increases, the color produced becomes progressively lighter.
SAMPLE HANDLING
& PRESERVATION: Samples may be stored and refrigerated in plastic containers.
INTERFERENCES: The following substances produce a positive interference at the concentration given:
Chloride (Cl–) 7000 mg/L
Phosphate (PO4–3) 16 mg/L
Sulfate (SO4–2) 200 mg/L
The following substances produce a negative interference at the concentration given:
Alkalinity (CaCO3) 5000 mg/L
Aluminum (Al3+) 0.1 mg/L
Iron (Fe3+) 10 mg/L
Color and turbidity must be removed or compensated for in the procedure. Temperature should be maintained within 5°C
of room temperature.
NOTE: This procedure uses the EPA approved SPADNS Reagent System for fluoride found in method 4500-F-D, 17th
Edition of Standard Methods, page 4-89.
39
Page 40

PROCEDURE
1. Rinse a clean colorimeter tube (0967) with sample water. Fill to the 10 mL line with sample.
2. Select setting 6 on “Select Wavelength” knob and press “30 Second Read” button.
3. Insert tube into colorimeter chamber and adjust to 100%T with “Set Blank” knob. This is the 100%T blank. (See
Note 2.)
4. Remove tube from colorimeter. Use the 0.5 mL pipet (0353) to add 0.5 mL of *Sodium Arsenite Solution (4128).
Cap and mix.
5. Use the 1.0 mL pipet (0354) to add 2 measures of *Acid-Zirconyl SPADNS Reagent (3875). Cap and mix thoroughly.
6. Insert tube into colorimeter and press “30 Second Read” button. Record %T as soon as the reading stabilizes.
7. Consult calibration chart to determine fluoride concentration in parts per million (ppm).
NOTE: For best results perform the test procedure on clear, colorless, fluoride free water. This reagent blank should
read 26%T. If the reagent blank reading is less than 26%T, add the difference to all subsequent unknown sample
readings. If the result is greater than 26%T subtract the difference from all subsequent unknown sample readings.
EXAMPLES: Reagent Blank = 24%, 26 - 24 = 2. Add 2 to unknown sample result. 56 + 2 = 58%T
Reagent Blank = 29%, 29 - 26 = 3. Subtract 3 from unknown sample result. 56 - 3 = 53%T.
DC1600 FLUORIDE CALIBRATION CHART
%T 9 8 7 6 5 4 3 2 1 0
90
80
70
60
50
40
30
20
10
0
2.00 1.95 1.90 1.85 1.80 1.75 1.71 1.66 1.61 1.57
1.52 1.48 1.43 1.39 1.34 1.30 1.26 1.22 1.18 1.13
1.09 1.05 1.01 0.97 0.93 0.90 0.86 0.82 0.78 0.74
0.70 0.66 0.61 0.57 0.53 0.48 0.43 0.38 0.33 0.27
0.21 0.15 0.08 0.00
40
Page 41

HYDRAZINE
p-DIMETHYLAMINOBENZALDEHYDE METHOD CODE 3656
QUANTITY CONTENTS CODE
2 x 60 mL *Hydrazine Reagent A *4841-H
10 g *Hydrazine Reagent B Powder *4842-D
1 Pipet, 1.0 mL, plastic 0354
1 Spoon, 0.1 g, plastic 0699
*WARNING: Reagents marked with a * are considered hazardous substances. Material Safety Data Sheets (MSDS) are supplied for
these reagents. For your safety, read label and accompanying MSDS before using.
Hydrazine, N2H4, is added to the water in high pressure boilers to reduce corrosion of pipes and fittings by acting as an
oxygen scavenger.
APPLICATION: Water and boiler water, industrial wastewater.
RANGE: 0 – 1.0 ppm Hydrazine
METHOD: p-Dimethylaminobenzaldehyde reacts with hydrazine under acidic conditions to form a yellow
color in proportion to the amount of hydrazine present.
SAMPLE HANDLING
& PRESERVATION: Samples should be analyzed as soon as possible after collection due to the ease with which
hydrazine becomes oxidized. Acidification of the sample may increase the time between
collection and analysis.
INTERFERENCES: The substances normally present in water do not interfere with the test, with the exception of
strong oxidizing agents.
PROCEDURE
1. Rinse a clean colorimeter tube (0967) with sample water. Fill to the 10 mL line with sample.
2. Select setting 2 on “Select Wavelength” knob and press “30 Second Read” button.
3. Insert tube into colorimeter chamber and adjust to 100%T with “Set Blank” knob. This tube is the 100%T blank.
4. Remove tube from colorimeter. Use the 1 mL pipet (0354) to transfer 4 mL of *Hydrazine Reagent A (4841). Cap and
mix.
5. Use the 0.1 g spoon (0699) to add one measure of *Hydrazine Reagent B Powder (4842). Cap and mix. Wait 10
minutes for maximum color development. An undissolved portion of Hydrazine Reagent B may remain in bottom of
tube without adversely affecting results.
6. At end of 10 minute waiting period, press “30 Second Read” button and insert tube into colorimeter chamber. Record
%T as soon as reading stabilizes.
7. Consult calibration chart to determine hydrazine concentration in parts per million (ppm).
DC1600 HYDRAZINE CALIBRATION CHART
%T 9 8 7 6 5 4 3 2 1 0
90
80
70
60
50
40
30
20
10
0
0.01 0.01 0.02 0.02 0.02 0.03 0.03 0.03 0.04 0.04
0.04 0.04 0.05 0.05 0.05 0.06 0.06 0.06 0.07 0.07
0.07 0.08 0.08 0.09 0.09 0.09 0.10 0.10 0.10 0.11
0.11 0.12 0.12 0.12 0.13 0.13 0.14 0.14 0.15 0.15
0.16 0.16 0.17 0.17 0.18 0.18 0.19 0.19 0.20 0.20
0.21 0.21 0.22 0.23 0.23 0.24 0.24 0.25 0.26 0.26
0.27 0.28 0.29 0.29 0.30 0.31 0.32 0.33 0.34 0.35
0.36 0.37 0.38 0.39 0.40 0.41 0.42 0.43 0.45 0.46
0.48 0.49 0.51 0.52 0.54 0.56 0.58 0.61 0.63 0.66
0.69 0.72 0.76 0.81 0.86 0.92 1.01
41
Page 42

This page is purposely left blank...
42
Page 43

HYDROGEN PEROXIDE
DPD METHOD CODE 3662
QUANTITY CONTENTS CODE
30 mL *Hydrogen Peroxide Reagent #1 *6452-G
100 Hydrogen Peroxide LR Tablets 6454-J
1 Tablet Crusher 0175
*WARNING: Reagents marked with a * are considered hazardous substances. Material Safety Data Sheets (MSDS) are supplied for
these reagents. For your safety, read label and accompanying MSDS before using.
Hydrogen peroxide, H2O2, is a colorless compound that is widely used as a bleaching or decolorizing agent in the
manufacture of many commercial products. As an oxidizing compound it is also used in the treatment of sewage to reduce
odors and corrosion due to hydrogen sulfide. It may also be used as a sanitizing agent for water treatment. Hydrogen
peroxide is relatively unstable, and for this reason it dissipates quickly and leaves no residuals.
APPLICATION: Drinking and surface waters; domestic and industrial wastes.
RANGE: 0 – 1.5 ppm Hydrogen Peroxide
METHOD: Hydrogen peroxide reacts with an excess of potassium iodide through the action of a catalyst
and buffer to release an equivalent amount of iodine. The iodine in turn reacts with
diethyl-p-phenylenediamine (DPD) to produce a pink-red color in proportion to the iodine
released.
SAMPLE HANDLING
& PRESERVATION:
Hydrogen peroxide is not stable in aqueous solutions. Exposure to sunlight and agitation will
accelerate the reduction of hydrogen peroxide in dilute solutions. For best results start analysis
immediately after sampling.
INTERFERENCE: The likelihood of other oxidizing compounds interfering with this method is eliminated by the
presence of hydrogen peroxide. Manganese may interfere and should be removed before
analysis.
PROCEDURE
1. Rinse a clean colorimeter tube (0967) with sample water. Fill to the 10 mL line with sample.
2. Select setting 4 on “Select Wavelength” knob and press “30 Second Read” button.
3. Insert tube into colorimeter chamber and adjust to 100%T with “Set Blank” knob. This is the 100%T blank.
4. Remove tube from colorimeter and add 4 drops of *Hydrogen Peroxide Reagent #1 (6452). Cap and mix.
5. Add one Hydrogen Peroxide LR Tablet (6454). Crush tablet with tablet crusher (0175). Cap and mix until tablet
dissolves. Solution will turn pink if hydrogen peroxide is present. Wait 2 minutes for full color development.
6. At end of 2 minute waiting period, press “30 Second Read” button and insert tube into colorimeter chamber. Record
%T as soon as reading stabilizes.
7. Consult calibration chart to determine hydrogen peroxide concentration in parts per million (ppm).
NOTE: It is suggested for the best possible results to carry a reagent blank through the procedure with deionized or
demineralized water. Set the reagent blank to 101%T hydrogen peroxide, then continue with unknown sample tests.
DC1600 HYDROGEN PEROXIDE CALIBRATION CHART
%T 9 8 7 6 5 4 3 2 1 0
90
80
70
60
50
40
30
20
10
0.02 0.03 0.03 0.04 0.05 0.05 0.06 0.06 0.07 0.08
0.08 0.09 0.10 0.10 0.11 0.12 0.13 0.13 0.14 0.15
0.16 0.16 0.17 0.18 0.19 0.19 0.20 0.21 0.22 0.23
0.24 0.25 0.26 0.27 0.28 0.28 0.29 0.30 0.31 0.33
0.34 0.35 0.36 0.37 0.38 0.39 0.40 0.42 0.43 0.44
0.46 0.47 0.48 0.50 0.51 0.53 0.54 0.56 0.57 0.59
0.61 0.63 0.64 0.66 0.68 0.70 0.72 0.74 0.77 0.79
0.81 0.84 0.86 0.89 0.92 0.95 0.98 1.01 1.05 1.09
1.12 1.16 1.21 1.26 1.31 1.36 1.42 1.48 1.55 0
43
Page 44

This page is purposely left blank...
44
Page 45

IRON
BIPYRIDYL METHOD CODE 3648
QUANTITY CONTENTS CODE
30 mL *Iron Reagent #1 *V-4450-G
5 g *Iron Reagent #2 *V-4451-C
1 Pipet, 0.5 mL, plastic 0353
1 Spoon, 0.1 g, plastic 0699
*WARNING: Reagents marked with a * are considered hazardous substances. Material Safety Data Sheets (MSDS) are supplied for
these reagents. For your safety, read label and accompanying MSDS before using.
Most natural waters contain some iron. Its presence may vary from small traces to very large amounts in water which is
contaminated by acid mine wastes. For domestic use, the concentration should not exceed 0.2 ppm and for some industrial
applications not even a trace of iron can be tolerated. There are many means available for removing or reducing the iron
content. Water softening resins are effective for removing small amounts of iron and special ion exchange materials are
selective for iron removal. High concentrations of iron can be removed by such chemical processes as oxidation and lime or
lime-soda softening. Because of the many means of removing or reducing the amount of iron in water, the particular
method employed will depend largely on the form of iron which is present and the end use of the treated water.
APPLICATION: Drinking, surface and saline waters; domestic and industrial wastes.
RANGE: 0 – 5.0 ppm Iron
METHOD: Ferric iron is reduced to ferrous iron and subsequently forms a colored complex with bipyridyl
for a quantitative measure of total iron.
SAMPLE HANDLING
& PRESERVATION: The sample container should be cleaned with acid and rinsed with deionized water. Addition
of acid to adjust the sample to pH 2 - 3 will prevent deposition of iron on the container walls.
Samples should be analyzed as soon as possible.
INTERFERENCES: Strong oxidizing agents interfere, as well as copper and cobalt in excess of 5.0 mg/L.
45
Page 46

PROCEDURE
1. Rinse a clean colorimeter tube (0967) with sample water. Fill to the 10 mL line with sample.
2. Select setting 3 on “Select Wavelength” knob and press “30 Second Read” button.
3. Insert tube into colorimeter chamber and adjust to 100%T with “Set Blank” knob. This is 100%T blank.
4. Remove tube from colorimeter. Use the 0.5 mL pipet (0353) to add one measure of *Iron Reagent #1 (V-4450). Cap
and mix.
5. Use the 0.1 g spoon (0699) to add 0.1 g of *Iron Reagent #2 (V-4451). Cap and shake vigorously for 30 seconds. Wait
three minutes for maximum color development.
6. At the end of 3 minute waiting period, press “30 Second Read” button and insert tube into colorimeter chamber.
Record %T as soon as reading stabilizes.
7. Consult calibration chart to determine iron concentration in parts per million (ppm).
DC1600 IRON ~ BIPYRIDYL CALIBRATION CHART
%T 9 8 7 6 5 4 3 2 1 0
90
80
70
60
50
40
30
20
10
0
0.02 0.04 0.05 0.07 0.09 0.11 0.13 0.15 0.16 0.18
0.20 0.22 0.24 0.26 0.28 0.30 0.33 0.35 0.37 0.39
0.41 0.44 0.46 0.48 0.50 0.53 0.55 0.58 0.60 0.63
0.65 0.68 0.70 0.73 0.76 0.78 0.81 0.84 0.87 0.90
0.93 0.96 0.99 1.02 1.06 1.09 1.12 1.16 1.19 1.23
1.26 1.30 1.34 1.38 1.42 1.46 1.50 1.54 1.58 1.63
1.68 1.72 1.77 1.82 1.87 1.93 1.98 2.04 2.10 2.16
2.22 2.28 2.35 2.42 2.49 2.57 2.65 2.73 2.82 2.91
3.01 3.11 3.22 3.33 3.46 3.59 3.73 3.88 4.05 4.24
4.44 4.67 4.90
46
Page 47

IRON
1,10-PHENANTHROLINE METHOD CODE 3668
QUANTITY CONTENTS CODE
15 mL *Acid Phenanthroline Indicator *2776-E
5 g *Iron Reducing Reagent *2777-C
1 Spoon, 0.1 g, plastic 0699
*WARNING: Reagents marked with a * are considered hazardous substances. Material Safety Data Sheets (MSDS) are supplied for
these reagents. For your safety, read label and accompanying MSDS before using.
APPLICATION: Drinking, surface and saline waters; domestic and industrial wastes.
RANGE: 0 – 6.0 ppm Iron
METHOD: Ferric iron is reduced to ferrous iron and subsequently forms a colored complex with bipyridyl
for a quantitative measure of total iron.
SAMPLE HANDLE
& PRESERVATION: The sample container should be cleaned with acid and rinsed with deionized water. Addition
of acid to adjust the sample to pH 2 - 3 will prevent deposition of iron on the container walls.
Samples should be analyzed as soon as possible.
INTERFERENCES: Strong oxidizing agents, cyanide, nitrite, and phosphates; chromium, zinc in concentrations
exceeding 10 times that of iron; cobalt and copper in excess of 5 mg/L, and nickel in excess of
2 mg/L. Bismuth, cadmium, mercury, molybdate, and silver precipitate phenanthroline.
PROCEDURE
1. Rinse a clean colorimeter tube (0967)with sample water. Fill to the 10 mL mark with sample.
2. Select setting 2 on the “Select Wavelength” knob and press the “30 Second Read” button.
3. Insert the tube into the colorimeter chamber and adjust to 100% T with the “Set Blank” knob. This is the 100% T
blank.
4. Remove the tube from colorimeter. Use the 0.1 g spoon (0699) to add one measure of *Iron Reducing Reagent
(2777). Cap and invert the tube 15 – 20 times to mix.
5. Remove the cap and add 6 drops of *Acid Phenanthroline Indicator (2776). Cap and invert the tube 3 – 4 times to
mix reagents. Wait five minutes for maximum color development.
6. After five minutes, press the “30 Second Read” button and insert the tube into colorimeter chamber. Record %T as
soon as the reading stabilizes.
7. Consult the calibration chart to determine iron concentration in parts per million (ppm).
DC1600 IRON ~ 1,10-PHENANTHROLINE CALIBRATION CHART
%T 9 8 7 6 5 4 3 2 1 0
90
80
70
60
50
40
30
20
10
0
0.02 0.03 0.05 0.07 0.08 0.10 0.11 0.13 0.15 0.17
0.18 0.20 0.22 0.24 0.26 0.28 0.29 0.31 0.33 0.35
0.37 0.39 0.41 0.43 0.46 0.48 0.50 0.52 0.54 0.57
0.59 0.61 0.64 0.66 0.69 0.71 0.74 0.76 0.79 0.81
0.84 0.87 0.90 0.93 0.96 0.99 1.02 1.05 1.08 1.11
1.15 1.18 1.21 1.25 1.29 1.32 1.36 1.40 1.44 1.48
1.52 1.57 1.61 1.66 1.70 1.75 1.80 1.85 1.91 1.96
2.02 2.08 2.14 2.21 2.27 2.34 2.42 2.49 2.57 2.66
2.75 2.84 2.94 3.05 3.16 3.28 3.41 3.56 3.71 3.88
4.07 4.29 4.53 4.82 5.16 5.58 6.13
47
Page 48

This page is purposely left blank...
48
Page 49

MANGANESE ~ HIGH RANGE
PERIODATE METHOD CODE 3669
QUANTITY CONTENTS CODE
10 g Manganese Buffer Reagent 6310-D
15 g *Manganese Periodate Reagent *6311-E
1 Spoon, 0.1 g, plastic 0699
1 Spoon, 0.15 g, plastic 0727
*WARNING: Reagents marked with a * are considered hazardous substances. Material Safety Data Sheets (MSDS) are supplied for
these reagents. For your safety, read label and accompanying MSDS before using.
Manganese is present in ground water in the divalent state due to the lack of oxygen. In surface waters, manganese may be
in various oxidation states as soluble complexes or as suspended compounds. Manganese is rarely present in excess of 1
mg/L. It may impart an objectionable taste or cause staining problems in laundry, but manganese levels normally
encountered in water seldom produce any health hazards. Manganese is removed from water by various means, including
chemical precipitation, pH adjustment, aeration, superchlorination and the use of ion exchange resins.
APPLICATION: Drinking and surface waters, domestic and industrial wastewaters.
RANGE: 0 – 10.0 ppm Manganese
METHOD: Periodate oxidates soluble manganous compounds to form permanganate.
SAMPLE HANDLING
& PRESERVATION: Manganese may oxidize readily in a neutral water and precipitate from solution. It may adhere
to or be absorbed by container walls, especially glass. Acidified samples can be stored in plastic.
INTERFERENCES: Reducing substances capable of reacting with periodate or permanganate must be removed or
destroyed before the periodate oxidation is attempted.
49
Page 50

PROCEDURE
1. Rinse a colorimeter tube (0967) with sample water. Fill to the 10 mL line with sample.
2. Select setting 4 on the “Select Wavelength” knob and press the “30 Second Read” button.
3. Insert the tube into the colorimeter chamber and adjust to 100%T with the “Set Blank” knob. This is the 100%T
blank.
4. Remove tube from colorimeter. Use the 0.1 g spoon (0699) to add two measures of Manganese Buffer Reagent (6310).
Cap and mix until powder dissolves.
5. Use the 0.15 g spoon (0727) to add one measure of *Manganese Periodate Reagent (6311). Cap and shake for one
minute. An undissolved portion of the reagent may remain in the bottom of the tube without adversely affecting the
test results. Wait two minutes for maximum color development. Solution will turn pink if manganese is present.
6. At the end of the two minute waiting period, press the “30 Second Read” button and insert tube into the colorimeter
chamber. Record %T as soon as the reading stabilizes.
7. Consult the calibration chart to determine manganese concentration in parts per million (ppm).
DC 1600 MANGANESE ~ HIGH RANGE CALIBRATION CHART
%T 9 8 7 6 5 4 3 2 1 0
90
80
70
60
50
40
30
20
10
0
0.72 0.81 0.89 0.98 1.06 1.15 1.24 1.33 1.42 1.51
1.61 1.70 1.80 1.89 1.99 2.09 2.19 2.29 2.39 2.50
2.60 2.71 2.82 2.93 3.04 3.15 3.26 3.38 3.50 3.62
3.74 3.86 3.99 4.12 4.25 4.38 4.51 4.65 4.79 4.93
5.07 5.22 5.37 5.52 5.68 5.84 6.00 6.17 6.33 6.51
6.69 6.87 7.05 7.24 7.44 7.64 7.85 8.06 8.28 8.50
8.74 8.98 9.23 9.48 9.75 10.02
0.00 0.08 0.16 0.24 0.31 0.39 0.47 0.56 0.64
50
Page 51

MANGANESE ~ LOW RANGE
PAN METHOD CODE 3658
QUANTITY CONTENTS CODE
2 x 60 mL *Hardness Buffer Reagent *4255-H
30 mL *Manganese Indicator Reagent *3956-G
15 mL *Sodium Cyanide, 10% *6565-E
1 Pipet, 0.5 mL, plastic 0369
1 Pipet, 1.0 mL, plastic 0354
*WARNING: Reagents marked with a * are considered hazardous substances. Material Safety Data Sheets (MSDS) are supplied for
these reagents. For your safety read label and accompanying MSDS before using.
Manganese is present in ground water in the divalent state due to the lack of oxygen. In surface waters manganese may be
in various oxidation states as soluble complexes or as suspended compounds. Manganese is rarely present in excess of 1
mg/L. It may cause an objectionable taste or cause staining problems in laundry, but manganese levels normally
encountered in water seldom produce any health hazard.
Manganese is removed from water by various means including chemical precipitation, pH adjustment, aeration,
superchlorination and the use of ion exchange resins.
APPLICATION: Drinking and surface waters; domestic and industrial wastewaters.
RANGE: 0.0 – 0.9 mg/L Manganese
METHOD: PAN (1–(2–Pyridylazo)–2–Naphthol) forms a red complex with Manganese (Mn2+ ) at a pH
of 8 to 10.
SAMPLE HANDLING
& PRESERVATION: Manganese may oxidize readily in neutral water and precipitate from solution. It may adhere or
be absorbed by container walls, especially glass. Acidified sample can be stored in plastic.
INTERFERENCES: None. Test is quite specific.
51
Page 52

PROCEDURE
1. Rinse a colorimeter tube (0967) with sample water. Fill to the 10 mL line with sample.
2. Select setting 5 on the “Select Wavelength” knob and press the “30 Second Read” button.
3. Insert tube into the colorimeter chamber and adjust to 100%T with the “Set Blank” knob. This is the 100%T blank.
4. Remove tube from colorimeter. Use the 1.0 mL pipet (0354) to add 2.0 mL (two measures) of *Hardness Buffer
Reagent (4255). Swirl to mix.
5. Add 2 drops of *Sodium Cyanide, 10% (6565). Cap and mix.
6. Use the 0.5 mL pipet (0369) to add 0.5 mL of *Manganese Indicator Reagent (3956). Cap and mix.
7. Press the “30 Second Read” button and insert tube into the colorimeter chamber. Record %T as soon as the reading
stabilizes.
8. Consult the calibration chart to determine the manganese concentration in parts per million (ppm).
NOTE: For best results, carry a reagent blank through the procedure. Treat 10 mL of demineralized water with the
test procedure. This is the Reagent Blank. Set the reading to 86.8%T, which corresponds to 0 ppm, then continue
with the unknown sample tests.
DC 1600 MANGANESE ~ LOW RANGE CALIBRATION CHART
%T 9 8 7 6 5 4 3 2 1 0
90
80
70
60
50
40
30
20
10
0
0.01 0.01 0.02 0.02 0.03 0.03 0.04
0.05 0.05 0.06 0.07 0.07 0.08 0.09 0.09 0.10 0.11
0.12 0.12 0.13 0.14 0.15 0.16 0.16 0.17 0.18 0.19
0.20 0.21 0.22 0.23 0.24 0.25 0.26 0.27 0.28 0.29
0.30 0.32 0.33 0.34 0.35 0.37 0.38 0.39 0.41 0.42
0.44 0.46 0.47 0.49 0.51 0.53 0.54 0.56 0.59 0.61
0.63 0.65 0.68 0.70 0.73 0.76 0.79 0.82 0.85 0.89
52
Page 53

MOLYBDENUM
TIRON METHOD CODE 3657
QUANTITY CONTENTS CODE
60 mL pH 7.0 Buffer 2881-H
5 g *Tiron Powder *6045-C
30 mL *Sodium Hydroxide, 0.2N *5168-G
1 pHydrion Test Papers 2953
2 Resin Columns 1079
2 Pipets, 1.0 mL, plastic 0354
1 Spoon, 0.1 g, plastic 0699
1 Test Tube, 5, 10, 12.9, 20 & 25 mL, glass, w/cap 0608
1 Demineralizer Bottle 1151
1 Rod, plastic, stirring 0519
*WARNING: Reagents marked with a * are considered hazardous substances. Material Safety Data Sheets (MSDS) are supplied for
these reagents. For your safety read label and accompanying MSDS before using.
Molybdenum occurs naturally in the earth’s crust as molybdenite and wolfenite, and is an important element in many
biochemical reactions, including nitrogen fixation. In industrial processes, such as the operation of boilers and cooling
towers, molybdenum, in the form of sodium molybdate, is used as an environmentally safe corrosion inhibitor. Sodium
molybdate is used for the manufacture of inorganic and organic pigments and as a bath additive for metal finishing. High
concentrations of molybdenum in surface waters are generally produced by industrial manufacturing processes and not due
to natural causes.
APPLICATION: Drinking and surface waters, domestic and industrial wastewater, boiler and cooling water.
RANGE: 0 – 10 ppm Molybdenum
METHOD: Molybdenum or its salts form a colored complex with Tiron at a neutral pH, the color of which
increases proportionately with the concentration of molybdenum. Sodium molybdate is
determined by multiplying the molybdenum concentration by 2.5.
SAMPLE HANDLING
& PRESERVATION: Molybdenum samples may be stored in either plastic or glass containers.
INTERFERENCES: Iron and some other cations may cause some interference with this method. To eliminate this
interference the sample must be passed through a resin column and then subjected to the
molybdenum test procedure below.
Two ready-to-use resin columns (1079) are furnished with the test kit.
CARE OF
THE RESIN
COLUMN:
Each resin column can be used for twenty water samples, after which it should be discarded. At the
conclusion of any test, the resin column should be treated with 3-4 mL of deionized water, stoppered
and capped until used again.
53
Page 54

PROCEDURE
1. Suspend the resin column (1079) in the test tube (0608).
2. Use Demineralizer Bottle (1151) to add 3-4 mL of deionized water to resin column.
3. Add 5 mL of sample water to resin column with the 1.0 mL pipet (0354). Discard all of the solution that has passed
through resin column.
4. Continue adding sample water to resin column and collect 10 mL of filtrate in a clean colorimeter tube (0967).
5. Dip end of plastic rod (0519) in sample water recovered from resin column. Touch it to a small piece (1/4 inch) of
pHydrion paper (2953). Read pH immediately from color chart. Add *Sodium Hydroxide 0.2N (5168) to sample one
drop at a time with stirring. Check pH with a new piece of pHydrion paper after each drop. Continue adjustment until
pH is between 5.5 and 6.5 (preferably 5.5).
NOTE: If pH changes to greater than 7.5 after addition of first drop of *Sodium Hydroxide 0.2N, discard sample and
begin again with Step 1. Step 5, pH adjustment, will not be necessary.
6. Select setting 1 on “Select Wavelength” knob and press “30 Second Read” button.
7. Insert tube into colorimeter chamber and adjust to 100%T with “Set Blank” knob. This is the 100%T blank.
8. Remove tube from colorimeter. Use the 1.0 mL pipet (0354) to add 1.0 mL of pH 7.0 Buffer (2881). Cap and mix.
9. Use the 0.1 g spoon (0699) to add one measure of *Tiron Powder (6045). Cap and mix until powder dissolves.
Solution will immediately turn yellow if molybdenum is present.
10. Insert tube into colorimeter chamber and press “30 Second Read” button. Record %T as soon as reading stabilizes.
11. Consult calibration chart to determine molybdenum concentration in parts per million (ppm).
DC1600 MOLYBDENUM CALIBRATION CHART
%T 9 8 7 6 5 4 3 2 1 0
90
80
70
60
50
40
30
20
10
0
0.46 0.51 0.56 0.61 0.66 0.72 0.77 0.83 0.88 0.94
0.99 1.05 1.11 1.17 1.23 1.29 1.35 1.41 1.47 1.53
1.60 1.66 1.73 1.80 1.86 1.93 2.00 2.07 2.14 2.22
2.29 2.36 2.44 2.52 2.60 2.68 2.76 2.84 2.93 3.01
3.10 3.19 3.28 3.37 3.47 3.56 3.66 3.76 3.87 3.97
4.08 4.19 4.30 4.42 4.54 4.66 4.78 4.91 5.05 5.18
5.32 5.47 5.62 5.77 5.94 6.10 6.28 6.46 6.65 6.84
7.05 7.26 7.49 7.73 7.99 8.26 8.55 8.86 9.19 9.55
9.95
0.02 0.07 0.11 0.16 0.21 0.26 0.31 0.36 0.41
54
Page 55

MOLYBDENUM
THIOGLYCOLATE METHOD CODE 3699-01
QUANTITY CONTENTS CODE
60 mL *Mo Buffer *3997-H
60 mL *Molybdenum Oxidizing Reagent *6485-H
2.5g *Molybdenum Indicator Powder 6486-S
1 Spoon, 0.05g, plastic 0696
2 Pipets, 1.0 mL, plastic, w/caps 0372
*WARNING: Reagents marked with a * are considered hazardous substances. Material Safety Data Sheets (MSDS) are supplied for
these reagents. For your safety read label and accompanying MSDS before using.
Molybdenum occurs naturally in the earth’s crust as molybdenite and wolfenite, and is an important element in many
biochemical reactions, including nitrogen fixation. In industrial processes, such as the operation of boilers and cooling
towers, molybdenum, in the form of sodium molybdate, is used as an environmentally safe corrosion inhibitor.
APPLICATIONS: Boiler and cooling water
RANGE: 0 – 50 ppm Molybdenum
METHOD: Calcium thioglycolate reacts with molybdenum to give a yellow color with an intensity
proportional to the amount of molybdenum present.
SAMPLE HANDLING
& PRESERVATION: Molybdenum samples may be stored in either plastic or glass containers.
INTERFERENCES: Nickel levels less than 50 ppm do not interfere; aluminum levels less than 10 ppm do not
interfere; chromate at higher concentrations interferes due to the intense yellow color. Ferrous
iron levels below 50 ppm do not interfere, but low levels of ferric iron will cause a large blank.
Highly buffered samples may exceed the capacity of the system possibly producing inaccurate
results.
55
Page 56

PROCEDURE
1. Rinse then fill clean colorimeter tube (0967) to 10 mL line with sample water.
2. Select setting 4 on the “select wavelength” knob and press the “30 Second Read” button.
3. Insert tube into colorimeter chamber and press “ON/OFF” button.
4. Adjust to 0 ppm with the “Set Blank” knob. This is the sample blank.
5. Remove tube from colorimeter chamber. Use a 1.0 mL pipet (0372) to add 1.0 mL of *Mo Buffer (3997). Cap and
mix.
6. Use a second 1.0 mL pipet (0372) to add 1.0 mL of *Molybdenum Oxidizing Regent (6485). Cap and mix.
7. Use 0.05 g spoon (0696) to add one measure of Molybdenum Indicator Powder (6486). Cap and mix until powder
dissolves. Solution will turn yellow if molybdenum is present.
8. Insert tube into colorimeter chamber and press “30 Second Read” button. Record %T as soon as reading stabilizes.
9. Consult calibration chart to determine molybdenum concentration in parts per million (ppm).
DC 1600 MOLYBDENUM THIOGLYCOLATE CALIBRATION CHART
%T 9 8 7 6 5 4 3 2 1 0
90
80
70
60
50
40
30
20
10
0
0.14 0.30 0.46 0.63 0.79 0.96 1.13 1.30 1.47 1.65
1.83 2.01 2.19 2.37 2.56 2.75 2.94 3.13 3.32 3.52
3.72 3.92 4.13 4.34 4.55 4.76 4.98 5.20 5.42 5.65
5.88 6.11 6.34 6.58 6.83 7.08 7.33 7.58 7.84 8.11
8.38 8.65 8.93 9.21 9.50 9.79 10.09 10.40 10.71 11.03
11.35 11.68 12.02 12.36 12.72 13.08 13.45 13.83 14.21 14.61
15.02 15.44 15.87 16.31 16.76 17.23 17.71 18.21 18.72 19.25
19.80 20.37 20.96 21.57 22.21 22.87 23.56 24.29 25.04 25.84
26.67 27.56 28.49 29.48 30.54
56
Page 57

NICKEL
DIMETHYLGLYOXIME METHOD CODE 3663
QUANTITY CONTENTS CODE
60 mL *Hydrochloric Acid, 2.5N *6251PS-H
30 g *Ammonium Persulfate Reagent *6566-G
30 mL *Silver Nitrate Solution, 0.0141N *6346WT-G
250 mL Sodium Citrate, 10% 6253-K
60 mL *Dimethylglyoxime, 1% *6254-H
60 mL *Ammonium Hydroxide, Conc. *6537-H
3 Pipets, 1.0 mL, plastic 0354
1 Spoon, 0.1 g, plastic 0699
1 Test tube, measuring, glass, w/cap 0786
1 Graduated Cylinder, 10 mL, glass 0416
*WARNING: Reagents marked with a * are considered hazardous substances. Material Safety Data Sheets (MSDS) are supplied for
these reagents. For your safety read label and accompanying MSDS before using.
Nickel is not usually found in natural waters except as a result of contamination from industrial wastewaters as a corrosion
product of stainless steel and nickel alloys. Nickel may also enter surface waters from plating bath process water.
APPLICATION: Drinking and surface waters; domestic and industrial wastewater.
RANGE: 0 – 10.0 ppm Nickel
METHOD: Nickel under acidic conditions forms a colored complex with dimethylglyoxime in proportion
to the concentration of nickel.
SAMPLE HANDLING
& PRESERVATION: Samples may be collected in either plastic or glass containers and preserved by adding 5 mL of
concentrated nitric acid per liter.
INTERFERENCES: Organic matter interferes. Cobalt, iron, copper, manganese and chromium do not interfere if
each of the concentrations is below 15 ppm.
This test procedure is designed for determining nickel in effluents where organic matter is absent and the interfering ions of
cobalt, iron, copper, manganese and chromium are below 15 ppm.
57
Page 58

PROCEDURE
1. Use the 10 mL graduated cylinder (0416) to measure 10 mL of sample water. Pour into glass test tube (0786).
2. Use the 1 mL pipet (0354) to add 1 mL of *Hydrochloric Acid, 2.5N (6251).
3. Use the 0.1 g spoon (0699) to add 2 measures of *Ammonium Persulfate Reagent (6566). Add two drops of *Silver
Nitrate, 0.0141N (6346). Mix until the powder has dissolved. The solution will be slightly cloudy at this point.
4. Use 10 mL graduated cylinder (0416) to add 5 mL of Sodium Citrate, 10% (6253).
5. Use a second 1 mL pipet (0354) to add 1 mL of *Ammonium Hydroxide, Conc. (6537). Mix, then dilute to 25 mL
with deionized water.
6. Use a third 1 mL pipet (0354) to add 1 mL of *Dimethylglyoxime, 1% (6254). Wait 20 minutes for color
development.
7. At end of 20 minute waiting period fill a clean colorimeter tube (0967) to the 10 mL line with the developed test
sample.
8. Fill a second clean colorimeter tube (0967) to 10 mL line with deionized water or untreated sample water.
9. Select setting 2 on “Select Wavelength” knob and press the “30 Second Read” button.
10. Insert tube containing the untreated sample into colorimeter chamber and adjust to 100%T with “Set Blank” knob.
This is the 100%T blank.
11. Insert test sample (Step 7) into colorimeter chamber and press “30 Second Read” button. Record %T as soon as
reading stabilizes.
12. Consult calibration chart to determine nickel concentration in parts per million (ppm).
DC1600 NICKEL CALIBRATION CHART
%T 9 8 7 6 5 4 3 2 1 0
90
80
70
60
50
40
30
20
10
0
0.14 0.17 0.20 0.23 0.27 0.30 0.33 0.37 0.40 0.44
0.47 0.51 0.54 0.58 0.62 0.66 0.69 0.73 0.77 0.81
0.85 0.89 0.93 0.97 1.01 1.06 1.10 1.14 1.19 1.23
1.28 1.32 1.37 1.42 1.46 1.51 1.56 1.61 1.67 1.72
1.77 1.83 1.88 1.94 1.99 2.05 2.11 2.17 2.23 2.30
2.36 2.43 2.49 2.56 2.63 2.70 2.78 2.85 2.93 3.01
3.09 3.17 3.25 3.34 3.43 3.52 3.62 3.72 3.82 3.92
4.03 4.15 4.26 4.38 4.51 4.64 4.78 4.92 5.07 5.22
5.39 5.56 5.75 5.94 6.15 6.37 6.61 6.87 7.16 7.46
7.81 8.19 8.63 9.13 9.73 10.46
58
Page 59

NITRATE-NITROGEN
CADMIUM REDUCTION METHOD CODE 3649
QUANTITY CONTENTS CODE
2 x 60 mL *Mixed Acid Reagent *V-6278-H
5 g *Nitrate Reducing Reagent *V-6279-C
1 Spoon, 0.1 g, plastic 0699
1 Dispenser Cap 0692
*WARNING: Reagents marked with a * are considered hazardous substances. Material Safety Data Sheets (MSDS) are supplied for
these reagents. For your safety, read label and accompanying MSDS before using.
Nitrogen is essential for plant growth, but the presence of excessive amounts in water supplies presents a major pollution
problem. Nitrogen compounds may enter water as nitrates or be converted to nitrates from agricultural fertilizers, sewage,
industrial and packing house wastes, drainage from livestock feeding areas, farm manures and legumes. Nitrates in large
amounts can cause “blue babies” (methemoglobinemia) in infants less than six months of age. Nitrate concentration is an
important factor to be considered in livestock products, where, in addition to causing methemoglobinemia, it is responsible
for many other problems. Nitrates in conjunction with phosphate stimulate the growth of algae with all of the related
difficulties associated with excessive algae growth.
U.S. Public Health Service Drinking Water Standards state that 10 ppm nitrate nitrogen should not be exceeded. To the
sanitary and industrial engineer, concentrations of less than 1 ppm are acceptable.
APPLICATION: This method determines nitrate levels in drinking, surface, saline waters, domestic and
industrial waters.
RANGE: 0 – 3.0 ppm Nitrate Nitrogen (Range can be extended by dilution).
METHOD: Powdered cadmium is used to reduce nitrate to nitrite. The nitrite that is originally present
plus reduced nitrate is determined by diazotization of sulfanilamide and nitrite followed by
coupling with N-(1 naphthyl)-ethylenediamine dihydrochloride to form a highly colored azo
dye which is measured colorimetrically.
SAMPLE HANDLING
& PRESERVATION:
INTERFERENCES: Nitrite interferes at all levels. Use the following equation to compensate for nitrite
Analysis should be made as soon as possible. If analysis cannot be made within 24 hours, the
sample should be preserved by refrigeration at 4°C. When samples must be stored for more
than 24 hours, they can be preserved by adding 2 mL of concentrated sulfuric acid per liter of
sample. For best results, the analysis for nitrate should be determined at temperatures between
20°C and 25°C.
interferences: Test result (ppm) - (Nitrite-N(ppm) x 5.5) = true Nitrate-N reading.
Strong oxidizing and reducing substances interfere. Low results might be obtained for samples
that contain high concentrations of iron and copper.
59
Page 60

PROCEDURE
1. Rinse a clean colorimeter tube (0967) with sample water. Fill to 10 mL line with sample.
2. Select setting 4 on “Select Wavelength” knob and press the “30 Second Read” button.
3. Insert tube into colorimeter chamber and adjust to 100%T with “Set Blank” knob. This is the 100%T blank.
4. Remove tube from colorimeter and pour off 5 mL into graduated cylinder (0416). Discard the remaining sample.
5. Return the 5 mL sample to colorimeter tube. Use the graduated cylinder to measure 5 mL of *Mixed Acid Reagent
(V-6278) and add to tube. Cap and mix. Wait approximately 2 minutes before proceeding to Step 6.
6. Use the 0.1 g spoon (0699) to add two measures of *Nitrate Reducing Reagent (V-6279). Cap.
7. Hold tube by index finger and thumb and mix by inverting approximately 50-60 times a minute for four minutes. Wait
10 minutes for maximum color development.
NOTE: At end of waiting period an undissolved portion of Nitrate Reducing Reagent may remain in bottom of the
tube without affecting results.
8. At end of 10 minute waiting period, press “30 Second Read” button and insert tube into colorimeter chamber. Record
%T as soon as reading stabilizes.
9. Consult calibration chart to determine nitrate nitrogen concentration in parts per million (ppm).
NOTE: To convert Nitrate Nitrogen (NO3–N) results to ppm Nitrate (NO3), multiply by 4.4.
DC1600 NITRATE-NITROGEN CALIBRATION CHART
%T 9 8 7 6 5 4 3 2 1 0
90
80
70
60
50
40
30
20
10
0
0.02 0.03 0.05 0.06 0.07 0.08 0.10 0.11 0.12 0.14
0.15 0.16 0.18 0.19 0.20 0.22 0.23 0.25 0.26 0.27
0.29 0.30 0.32 0.34 0.35 0.37 0.38 0.40 0.42 0.43
0.45 0.47 0.48 0.50 0.52 0.54 0.56 0.58 0.60 0.62
0.64 0.66 0.68 0.70 0.72 0.74 0.76 0.78 0.81 0.83
0.86 0.88 0.90 0.93 0.96 0.98 1.01 1.04 1.07 1.10
1.13 1.16 1.19 1.22 1.25 1.29 1.32 1.36 1.40 1.44
1.48 1.52 1.56 1.61 1.65 1.70 1.75 1.80 1.86 1.92
1.98 2.04 2.11 2.18 2.26 2.34 2.43 2.52 2.63 2.74
2.87 3.01
60
Page 61

NITRITE-NITROGEN
DIAZOTIZATION METHOD CODE 3650
QUANTITY CONTENTS CODE
2 x 60 mL *Mixed Acid Reagent *V-6278-H
5 g *Color Developing Reagent *V-6281-C
1 Spoon, 0.1 g, plastic 0699
1 Dispenser Cap 0692
*WARNING: Reagents marked with a * are considered hazardous substances. Material Safety Data Sheets (MSDS) are supplied for
these reagents. For your safety, read label and accompanying MSDS before using.
Nitrite represents an intermediate state in the nitrogen cycle, usually resulting from the bacterial decomposition of
compounds containing organic nitrogen. Under aerobic conditions bacteria oxidize ammonia to nitrites; and under
anaerobic conditions, bacteria reduce nitrates to nitrites. Nitrites are often used as preservatives when added to certain
foods.
The nitrite concentration of drinking water rarely exceeds 0.1 ppm (mg/L).
APPLICATION: This method is applicable for the determination of nitrite in drinking, surface and saline
waters; domestic and industrial wastes.
RANGE: 0 – 0.7 ppm Nitrite-Nitrogen
METHOD: Nitrite is determined by diazotization of sulfanilamide and nitrite followed by coupling with
N-(1 naphthyl)-ethylenediamine dihydrochloride to form a highly colored azo dye which is
measured colorimetrically.
SAMPLE HANDLING
& PRESERVATION: Samples should be analyzed as soon as possible. They may be stored for 24 to 48 hours at 4°C.
INTERFERENCES: Ion concentrations present at less than 1000 times the nitrite concentration do not interfere;
however, the presence of strong oxidants or reductants may readily affect nitrite
concentrations. High alkalinity (above 600 mg/L) will give low results due to a shift in pH.
61
Page 62

PROCEDURE
NOTE: Place Dispenser Cap (0692) on *Mixed Acid Reagent (V-6278). Save this cap for refill reagents.
1. Rinse a clean colorimeter tube (0967) with sample water. Fill to the 10 mL line with sample.
2. Select setting 4 on “Select Wavelength” knob and press “30 Second Read” button.
3. Insert tube into colorimeter chamber and adjust to 100%T with “Set Blank” knob. This is the 100%T blank.
4. Remove tube from colorimeter and pour off 5 mL into the graduated cylinder (0416). Discard the remaining sample.
5. Return the 5 mL sample to colorimeter tube. Use graduated cylinder to measure 5 mL of *Mixed Acid Reagent
(V-6278) and add to tube. Cap and mix.
6. Use the 0.1 g spoon (0699) to add two measures of *Color Developing Reagent (V-6281). Cap and shake tube for
approximately one minute to dissolve the powder. Wait 5 minutes for maximum color development.
7. At end of 5 minute waiting period, press “30 Second Read” button and insert tube into colorimeter chamber. Record
%T as soon as reading stabilizes.
8. Consult calibration chart to determine nitrite-nitrogen concentration in parts per million (ppm).
NOTE: To convert nitrite-nitrogen (N) results to ppm nitrite (NO2), multiply results by 3.3.
DC1600 NITRITE-NITROGEN CALIBRATION CHART
%T 9 8 7 6 5 4 3 2 1 0
100
90
80
70
60
50
40
30
20
10
0
0.004 0.006 0.008 0.010 0.012 0.015 0.017 0.019 0.021 0.024
0.026 0.029 0.031 0.033 0.036 0.039 0.041 0.044 0.046 0.049
0.052 0.054 0.057 0.060 0.063 0.066 0.068 0.071 0.074 0.077
0.081 0.084 0.087 0.090 0.093 0.097 0.100 0.103 0.107 0.110
0.114 0.118 0.121 0.125 0.129 0.133 0.137 0.141 0.145 0.150
0.154 0.158 0.163 0.168 0.172 0.177 0.182 0.187 0.192 0.198
0.203 0.209 0.214 0.220 0.226 0.233 0.239 0.246 0.253 0.260
0.267 0.275 0.283 0.291 0.299 0.308 0.317 0.327 0.337 0.348
0.359 0.371 0.383 0.397 0.411 0.426 0.442 0.460 0.479 0.500
0.523 0.549 0.578 0.612 0.653 0.702
0.001
62
Page 63

OXYGEN, DISSOLVED
WINKLER COLORIMETRIC METHOD CODE 3688
QUANTITY CONTENTS CODE
30 mL *Manganese Sulfate Solution *4167WT-G
30 mL *Alkaline Potassium Iodide Azide *7166WT-G
30 mL *Sulfuric Acid 1:1 *6141WT-G
1 Sample Tube, screw cap 29180
1 Cap 28570
*WARNING: Reagents marked with a * are considered hazardous substances. Material Safety Data Sheets (MSDS) are supplied for
these reagents. For your safety, read label and accompanying MSDS before using.
Dissolved oxygen is vital to the survival of aquatic organisms. Naturally present, dissolved oxygen enters the water when
plant photosynthesize. Wind and wave action also cause oxygen from the air to dissolve into water. Dissolved oxygen is
consumed by aquatic animals and by the oxidation, or chemical breakdown, of dead and decaying plants and animals. The
concentration of dissolved oxygen in natural waters can range from 0 to 14 ppm and is effected by temperature and salinity.
APPLICATION: This method is applicable for the determination of dissolve oxygen in drinking water, all
surface waters and wastewater.
RANGE: 0 – 12.5 ppm
METHOD: This method use the azide modification of the Winkler Method with a colorimetric
INTERFERENCES: The presence of other oxidizing agents may cause positive interferences. Reducing may cause
determination of the yellow iodine produced from the reaction of the reagents with the
dissolved oxygen.
negative interferences. Nitrite interferences are eliminated with the azide modification.
COLLECTION & TREATMENT OF THE WATER SAMPLE
Steps 1 through 4 below describe proper sampling technique in shallow water. For sample collection at depths beyond arm’s
reach, special water sampling apparatus is required (e.g. the LaMotte Water Sampling Chamber, Code 1060; Model JT-1
Water Samplers, Code 1077; Water Sampling Outfit, Code 3103; or Water Sampling Bottle, Code 3-0026).
1. To avoid contamination, thoroughly rinse the screw cap Sample Tube with sample water.
2. Tightly cap Sample Tube and submerge to the desired depth. Remove cap and allow the Sample Tube to fill.
3. Tap the sides of the submerged bottle to dislodge any air bubbles clinging to the inside. Replace the cap while the
Sample Tube is still submerged.
4. Retrieve Sample Tube and examine it carefully to make sure that no air bubbles are trapped inside. Once a satisfactory
sample has been collected, proceed immediately with Steps 5 and 6 to “fix” the sample.
NOTE: Be careful not to introduce air into the sample while adding the reagents in steps 5 and 6. Simply drop the
reagents into the sample. Cap carefully, and mix gently.
5. Add 2 drops of *Manganese Sulfate Solution (4167WT) and 2 drops of *Alkaline Potassium Iodide Azide (7166WT).
Cap and mix by inverting several times. A precipitate will form. Allow the precipitate to settle below the shoulder of
the bottle before proceeding.
6. Add 2 drops of *Sulfuric Acid, 1:1 (6141WT). Cap and gently shake until the reagent and the precipitate have
dissolved. A clear-yellow to brown-orange color will develop, depending on the oxygen content of the sample.
NOTE: It is very important that all “brown flakes” are dissolved completely. If the water has a high DO level this
could take several minutes.
NOTE: Following the completion of step 6, contact between the water sample and the atmosphere will not affect the
test result. Once the sample has been “fixed” in this manner, it is not necessary to perform the actual test procedure
immediately. Thus, several samples can be collected and “fixed” in the field, and then carried back to a testing station
or laboratory where the test procedure is to be performed.
63
Page 64

PROCEDURE
1. Rinse a clean colorimeter tube (0967) with sample water. Fill to the 10 mL line with sample. This tube is the BLANK.
2. Select setting 2 on “Select Wavelength” knob and press “30 Second Read” button.
3. Insert tube into colorimeter chamber and adjust to 100%T with “Set Blank” knob. This is the 100%T blank.
4. Remove BLANK from colorimeter and insert SAMPLE tube into colorimeter chamber. Record %T as soon as reading
stabilizes.
5. Consult calibration chart to determine dissolved oxygen concentration in parts per million (ppm).
DC1600 DISSOLVED OXYGEN CALIBRATION CHART
%T 9 8 7 6 5 4 3 2 1 0
90
80
70
60
50
40
30
20
10
0
0.0 0.1 0.1 0.2 0.2 0.3 0.3 0.3 0.4 0.4
0.5 0.5 0.6 0.6 0.7 0.7 0.8 0.8 0.9 0.9
1.0 1.0 1.1 1.1 1.2 1.2 1.3 1.3 1.4 1.4
1.5 1.6 1.6 1.7 1.7 1.8 1.9 1.9 2.0 2.1
2.1 2.2 2.3 2.4 2.4 2.5 2.6 2.7 2.7 2.8
2.9 3.0 3.1 3.1 3.2 3.3 3.4 3.5 3.6 3.7
3.8 3.9 4.0 4.1 4.3 4.4 4.5 4.6 4.7 4.9
5.0 5.2 5.3 5.5 5.6 5.8 6.0 6.1 6.3 6.5
6.7 7.0 7.2 7.4 7.7 8.0 8.3 8.6 8.9 9.3
9.8 10.2 10.8 11.4 12.1 13.0
64
Page 65

OZONE
INDIGO METHOD CODE 3651
QUANTITY CONTENTS CODE
15 mL Chlorine Inhibitor 3990-E
250 mL *Ozone Buffer *3991-K
30 mL Indigo Blue Stock Solution 3989-G
1 Sampling Apparatus 0681
1 Pipet, transfer, 1.0 mL 2-2170
1 Pipet, 5 mL, glass, volumetric 0329
1 Pump, 10 mL 2-2216
1 Bottle, HR Reagent, amber glass 0680-J
1 Graduated Cylinder, 50 mL, glass 0418
1 Bulb 30121
*WARNING: Reagents marked with a * are considered hazardous substances. Material Safety Data Sheets (MSDS) are supplied for
these reagents. For your safety, read label and accompanying MSDS before using.
Ozone is sometimes used in place of, or in conjunction with, chlorine or other halogens for disinfection of pool, spa, or
drinking waters. Recently, large aquatic facilities have begun using ozone as a disinfectant in many artificial habitats.
APPLICATION: Drinking, pool and aquatic waters.
RANGE: 0.0 – 0.4 ppm Ozone
METHOD: Ozone rapidly and stoichiometrically decolorizes Indigo Trisulfonate under acidic conditions.
SAMPLE HANDLING
& PRESERVATION: Ozone is extremely unstable in aqueous solutions. Test must be performed immediately and the
sample must not be agitated.
INTERFERENCES: Manganese at any level interferes.
65
Page 66

PROCEDURE
A. PREPARATION OF HR REAGENT
1. Use the 50 mL graduated cylinder to carefully add 45 mL of *Ozone Buffer (3991) to amber glass bottle marked HR
Reagent (0680).
2. Use the 5 mL transfer pipet (0329) and pump (2-2216) to add 5 mL of Indigo Blue Stock Solution (3989) to the
amber glass bottle. Cap and mix.
NOTE: HR Reagent must be made fresh each week. If reagents are refrigerated, they may be kept up to 3 weeks.
B. DETERMINATION OF OZONE
3. Use the 1.0 mL transfer pipet (2-2170) and pump (2-2216) to add 1.0 mL of HR Reagent to each of 2 clean
colorimeter tubes (0967).
4. If chlorine is present add 3 drops Chlorine Inhibitor (3990) to each tube. Cap tubes.
5. Take one of the prepared colorimeter tubes and sampling apparatus (0681) to sampling site.
6. Lower end of tubing of sampling apparatus to desired depth. Slowly withdraw and depress plunger several times to
purge syringe and tubing. Slowly withdraw plunger to fill purged syringe.
7. Remove plastic tubing from syringe. Remove cap from the prepared tube. Place tip of syringe against inside of the
prepared tube. Slowly depress plunger and fill to the 10 mL line and cap. This is the Sample Tube.
NOTE: DO NOT SHAKE OR INVERT THE SAMPLE.
8. Fill the second prepared tube (0967) to the 10 mL line with ozone free water. This is the Reagent Blank.
9. Select setting 6 on “Select Wavelength” knob and press “30 Second Read” button.
10. Insert the Reagent Blank into colorimeter chamber and adjust “Set Blank” knob so meter reads 43%T (0.00 ppm).
Remove tube from colorimeter.
11. Press “30 Second Read” button and insert reacted Sample Tube into colorimeter chamber. Record%T as soon as the
reading stabilizes.
12. Consult calibration chart to determine ozone concentration in parts per million (ppm).
DC1600 OZONE CALIBRATION CHART
%T 9 8 7 6 5 4 3 2 1 0
90
80
70
60
50
40
0.35 0.35 0.34 0.33 0.32 0.32 0.31 0.30 0.29 0.28
0.27 0.27 0.26 0.25 0.24 0.23 0.22 0.21 0.20 0.19
0.18 0.17 0.16 0.15 0.14 0.13 0.12 0.11 0.10 0.08
0.07 0.06 0.05 0.04 0.02 0.01 0.00
0.40 0.39 0.38 0.38 0.37 0.36
66
Page 67

pH
COLORIMETRIC METHOD CODE 3700
QUANTITY CONTENTS CODE
60 mL Chlorphenol Red Indicator V-2209-H
60 mL Phenol Red Indicator V-2304-H
60 mL Thymol Blue Indicator V-2213-H
3 Pipets, 0.5 mL, plastic w/caps 0369
The term pH (always written with a lower case p and an upper case H) is correctly defined as the negative logarithm of the
hydrogen ion concentration. More simply, the term pH can be considered to be an “index” of the amount of hydrogen ion
present in a substance, or is a measure of the acidity of the substance. This “index” is important as it can be used to quickly
identify the acid, neutral or alkaline (basic) nature of materials. Acidic substances have a pH less than 7.0, neutral
substances have a pH equal to 7.0 and alkaline substances have a pH greater than 7.0.
Most natural waters have pH values from pH 5.0 to pH 8.5. Acidic, freshly fallen rain water may have a pH value of pH 5.5
to pH 6.0. When it reacts with soils and minerals containing weakly alkaline materials, the hydroxyl ion concentration will
increase and the hydrogen ion concentration will decrease. Then the water may become slightly alkaline with a pH of 8.0
to 8.5. Natural sea water has a pH value of 8.1, and changes from this value indicate that water from an inland source is
entering the body of sea water.
Waters more acidic than pH 5.0 and more alkaline than pH 8.5 to 9.0 should be viewed with suspicion. Mine drainage and
acidic industrial wastes are the principal factors in increasing the acidity of water, and alkaline industrial wastes are the
cause of high pH values.
Because pH measurements can be made so simply, and because they can tell so much about the past and future reactions of
water, they are routinely made in water quality studies. Sudden changes in pH values serve as warning signals that water
quality may be adversely affected through the introduction of contaminants.
APPLICATION: Drinking, surface, and saline waters, swimming pool water; domestic and industrial wastes.
METHOD: The various pH indicators exhibit a specific color change over a narrow pH range. The color
changes are measured colorimetrically.
SAMPLE HANDLING
& PRESERVATION: Sample should be analyzed immediately after collection.
INTERFERENCES: Sample color and turbidity interfere with the colorimetric pH measurement. Color
RANGE & SETTING: pH Indicator pH Range Wavelength Setting
interfernece may be eliminated by adjusting the instrument to 100%T with a sample blank.
Two drops of 0.1N sodium thiosulfate per 100 mL of sample will eliminate the chlorine
interference.
Chlorphenol Red 5.0 – 7.0 4
Phenol Red 6.5 – 8.3 4
Thymol Blue 8.0 – 9.5 5
PROCEDURE
1. Rinse a clean colorimeter tube (0967) with sample water. Fill to 10 mL line with sample.
2. Use “Range & Setting” chart (above) to select wavelength setting on the “Select Wavelength” knob, corresponding
to anticipated pH range.
3. Press “30 Second Read” button and insert tube into colorimeter chamber. Adjust to 100%T with with “Set Blank”
knob. This is 100%T blank.
4. Remove tube from colorimeter. Use the 0.5 mL pipet (0369) to add exactly 0.5 mL of the pH indicator for the chosen
range. Cap and mix.
5. Press “30 Second Read” button and insert tube into colorimeter chamber. Record %T as soon as reading stabilizes.
6. Consult the calibration chart to find the pH value for the indicator selected.
67
Page 68

DC1600 CHLORPHENOL RED CALIBRATION CHART
%T 9 8 7 6 5 4 3 2 1 0
90
80
70
60
50
40
30
20
10
0
5.0 5.0 5.0 5.1 5.1 5.1 5.1 5.2 5.2 5.2
5.2 5.3 5.3 5.3 5.3 5.4 5.4 5.4 5.4 5.5
5.5 5.5 5.5 5.5 5.6 5.6 5.6 5.6 5.7 5.7
5.7 5.7 5.7 5.8 5.8 5.8 5.8 5.8 5.8 5.9
5.9 5.9 5.9 5.9 6.0 6.0 6.0 6.0 6.0 6.1
6.1 6.1 6.1 6.2 6.2 6.2 6.3 6.3 6.4 6.4
6.5 6.5 6.6 6.7 6.8 6.9 7.0
pH 5.0 - 7.0
DC1600 PHENOL RED CALIBRATION CHART
%T 9 8 7 6 5 4 3 2 1 0
90
80
70
60
50
40
30
20
10
0
%T 9 8 7 6 5 4 3 2 1 0
90
80
70
60
50
40
30
20
10
0
6.5 6.5 6.5 6.6 6.6 6.6 6.6 6.7 6.7 6.7
6.7 6.8 6.8 6.8 6.8 6.9 6.9 6.9 6.9 7.0
7.0 7.0 7.0 7.1 7.1 7.1 7.1 7.1 7.2 7.2
7.2 7.2 7.2 7.3 7.3 7.3 7.3 7.4 7.4 7.4
7.4 7.4 7.4 7.5 7.5 7.5 7.5 7.5 7.6 7.6
7.6 7.6 7.6 7.7 7.7 7.7 7.7 7.7 7.7 7.8
7.8 7.8 7.8 7.9 7.9 7.9 8.0 8.0 8.0 8.1
8.2 8.3
DC1600 THYMOL BLUE CLAIBRATION CHART
8.1 8.1 8.1 8.1 8.1 8.1 8.2 8.2 8.2 8.2
8.2 8.2 8.3 8.3 8.3 8.3 8.3 8.4 8.4 8.4
8.4 8.4 8.4 8.5 8.5 8.5 8.5 8.5 8.6 8.6
8.6 8.6 8.6 8.7 8.7 8.7 8.7 8.7 8.8 8.8
8.8 8.8 8.9 8.9 8.9 8.9 9.0 9.0 9.0 9.0
9.1 9.1 9.1 9.2 9.2 9.2 9.3 9.3 9.4 9.4
9.5
pH 6.5 - 8.3
6.5
pH 8.0 - 10.00
8.0 8.0 8.0 8.0 8.0 8.0
68
Page 69

PHENOLS
AMINOANTIPYRINE METHOD CODE 3652
QUANTITY CONTENTS CODE
5 g Aminoantipyrine Reagent 7825-C
30 mL *Ammonium Hydroxide Solution *7826-G
2 x 60 mL *Potassium Ferricyanide Solution *7827-H
1 Spoon, 0.1 g, plastic 0699
1 Pipet, plain, plastic 0352
1 Pipet, 1.0 mL, plastic 0354
*WARNING: Reagents marked with a * are considered hazardous substances. Material Safety Data Sheets (MSDS) are supplied for
these reagents. For your safety, read label and accompanying MSDS before using.
Phenols may occur in domestic and industrial waste waters and in drinking water supplies. Chlorination of waters
containing phenols may produce odiferous and objectionable tasting chlorophenols. Natural waters seldom contain more
than 1 mg/L phenol.
Phenols may be removed from water by various treatment processes including chlorination and activated carbon
absorption.
APPLICATION: Drinking and surface waters; domestic and industrial waste water.
RANGE: 0 – 6.0 ppm Phenol
METHOD: 4-Aminoantipyrine is oxidized in the presence of all ortho- and meta- substituted phenols to
form a colored complex in proportion to the amount of phenol present.
SAMPLE HANDLING
& PRESERVATION: Phenols are subject to biological and chemical oxidation. Samples should be analyzed within
4 hours after collection. If sample cannot be analyzed within 4 hours it can be preserved by
acidification with phosphoric acid to pH 4.0.
INTERFERENCES: Oxidizing and reducing chemicals, alkaline pH values, and phenol decomposing bacteria may
interfere with the test.
69
Page 70

PROCEDURE
1. Rinse a clean colorimeter tube (0967) with sample water. Fill to the 10 mL line with sample .
2. Select setting 3 on “Select Wavelength” knob and press “30 Second Read” button.
3. Insert tube into colorimeter chamber and adjust to 100%T with “Set Blank” knob. This is the 100%T blank.
4. Remove tube from colorimeter. Use the 0.1 g spoon (0699) to add one measure of Aminoantipyrine Reagent
(7825-C). Cap and mix until powder dissolves.
5. Use the plain pipet (0352) to add 4 drops of *Ammonium Hydroxide Solution (7826). Cap and mix.
6. Use the 1 mL pipet (0354) to add 2 mL of *Potassium Ferricyanide Solution (7827). Cap and mix. Solution will
almost immediately develop a reddish hue if phenols are present.
7. Press “30 Second Read” button and insert tube into colorimeter chamber. Record %T as soon as reading stabilizes.
8. Consult calibration chart to determine phenol concentration in parts per million (ppm).
DC1600 PHENOL CALIBRATION CHART
%T 9 8 7 6 5 4 3 2 1 0
90
80
70
60
50
40
30
20
10
0
0.16 0.19 0.21 0.24 0.26 0.29 0.31 0.34 0.37 0.39
0.42 0.45 0.48 0.51 0.54 0.56 0.59 0.62 0.65 0.69
0.72 0.75 0.78 0.81 0.85 0.88 0.91 0.95 0.98 1.02
1.06 1.09 1.13 1.17 1.21 1.25 1.29 1.33 1.37 1.42
1.46 1.51 1.55 1.60 1.65 1.70 1.75 1.80 1.85 1.90
1.96 2.01 2.07 2.13 2.19 2.26 2.32 2.39 2.46 2.53
2.60 2.68 2.76 2.84 2.92 3.01 3.10 3.20 3.30 3.41
3.52 3.64 3.76 3.89 4.03 4.18 4.34 4.52 4.70 4.9
5.14 5.39 5.68 6.02
0.00 0.02 0.04 0.07 0.09 0.11 0.14
70
Page 71

PHOSPHATE ~ HIGH RANGE
VANADOMOLYBDOPHOSPHORIC ACID METHOD CODE 3655
QUANTITY CONTENTS CODE
60 mL *VM Phosphate Reagent *4410-H
1 Pipet, 1.0 mL, plastic 0354
*WARNING: Reagents marked with a * are considered hazardous substances. Material Safety Data Sheets (MSDS) are supplied for
these reagents. For your safety, read label and accompanying MSDS before using.
Phosphate treatment in boiler and cooling water and other industrial water systems are run at levels up to 100 ppm
orthophosphate. These high levels permit the use of a simpler, high range test.
APPLICATION: Boiler, cooling, and industrial water.
RANGE: 0 – 80.0 ppm Orthophosphate
METHOD: Orthophosphate reacts in acid conditions with ammonium vanadomolybdate to form
vanadomolybdophosphoric acid. This yellow color is proportional to the concentration of
orthophosphate and is read colorimetrically.
SAMPLE HANDLING
& PRESERVATION: If the analysis cannot be performed the same day of collection, the sample should be preserved
INTERFERENCES: Silica interferes only if the sample is heated. Arsenate, fluoride, thorium, bismuth, sulfide,
by the addition of 2 mL of concentrated sulfuric acid or 40 mg mercuric chloride per liter and
refrigerated at 4°C.
thiosulfate, and thiocyanate cause negative interference.
PROCEDURE
1. Rinse a clean colorimeter tube (0967) with sample water. Fill to the 10 mL line with sample.
2. Select setting 2 on “Select Wavelength” knob and press the “30 Second Read” button.
3. Insert tube into colorimeter chamber and adjust to 100%T with “Set Blank” knob. This is the 100%T blank.
4. Remove tube from colorimeter. Use the 1.0 mL pipet (0354) to add 2.0 mL of *VM Phosphate Reagent (4410). Cap
and mix. Wait 5 minutes for full color development.
5. At end of 5 minute waiting period, press the “30 Second Read” button and insert tube into colorimeter chamber.
Record %T as soon as reading stabilizes.
6. Consult calibration chart to determine phosphate concentration in parts per million (ppm).
DC1600 PHOSPHATE ~ HIGH RANGE CALIBRATION CHART
%T 9 8 7 6 5 4 3 2 1 0
90
80
70
60
50
40
30
20
10
0
0.40 0.77 1.15 1.52 1.91 2.29 2.69 3.08 3.49 3.90
4.31 4.73 5.15 5.59 6.02 6.47 6.92 7.37 7.84 8.31
8.78 9.27 9.76 10.26 10.77 11.28 11.81 12.34 12.88 13.43
13.99 14.56 15.14 15.73 16.34 16.95 17.57 18.21 18.86 19.52
20.19 20.88 21.58 22.30 23.03 23.78 24.55 25.33 26.13 26.95
27.79 28.65 29.53 30.43 31.36 32.31 33.29 34.29 35.33 36.39
37.48 38.61 39.78 40.98 42.22 43.50 44.83 46.21 47.63 49.12
50.66 52.26 53.93 55.68 57.51 59.42 61.43 63.54 65.77 68.12
70.61 73.26 76.08 79.11 82.36
71
Page 72

This page is purposely left blank...
72
Page 73

PHOSPHATES ~ LOW-RANGE
ASCORBIC ACID REDUCTION METHOD CODE 3653
QUANTITY CONTENTS CODE
60 mL *Phosphate Acid Reagent *V-6282-H
5 g *Phosphate Reducing Reagent *V-6283-C
1 Pipet, 1 mL, plastic 0354
1 Spoon, 0.1 g, plastic 0699
*WARNING: Reagents marked with a * are considered hazardous substances. Material Safety Data Sheets (MSDS) are supplied for
these reagents. For your safety, read label and accompanying MSDS before using.
Phosphorus is an important nutrient for aquatic plants. The amount found in water is generally not more than 0.1 ppm
unless the water has become polluted from waste water sources or excessive drainage from agricultural areas. When
phosphorus is present in excess of the concentrations required for normal aquatic plant growth, a process called
eutrophication takes place. This creates a favorable environment for the increase in algae and weed nuisances. When algae
cells die, oxygen is used in the decomposition and fish kills often result. Rapid decomposition of dense algae scums with
associated organisms give rise to foul odors and hydrogen sulfide gas.
APPLICATION: Drinking, surface and saline waters; domestic and industrial wastes (Method based on reactions
that are specific for orthophosphate).
RANGE: 0 – 3.0 ppm Orthophosphate (Range can be extended by dilution.)
METHOD: Ammonium molybdate and antimony potassium tartrate react in a filtered acid medium with
dilute solution of PO4
reduced to an intense blue colored complex by ascorbic acid. The color is proportional to the
amount of phosphate present. (Only orthophosphate forms a blue color in this test.)
Polyphosphates (and some organic phosphorus compounds) may be converted to the
orthophosphate form by sulfuric acid digestion. Organic phosphorus compounds may be
converted to the orthophosphate form by persulfate digestion.
SAMPLE HANDLING
& PRESERVATION: If benthic deposits are present in the area being sampled, great care should be taken not to
include these deposits. If the analysis cannot be performed the same day of collection, the
sample should be preserved by the addition of 2 mL of concentrated sulfuric acid or 40 mg
mercuric chloride per liter and refrigerated at 4°C.
INTERFERENCES: a. No interference from copper, iron, or silicate at concentrations many times the
concentration of sea water. However, high iron concentrations can cause precipitation, and
subsequent loss of phosphorus.
b. Salt error for samples ranging from 5% to 20% salt content was found to be less than 1%.
c. Mercuric chloride, HgCl2, when used as the preservative, interferes when the chloride
levels are low (less than 50 mg/L). This interference is overcome by spiking samples with a
minimum of 50 mg/L of sodium chloride.
3–
to form an antimony-phosphomolybdate complex. This complex is
73
Page 74

PROCEDURE
1. Rinse a clean colorimeter tube (0967) with sample water. Fill to the 10 mL line with sample.
2. Select setting 6 on “Select Wavelength” knob and press “30 Second Read” button.
3. Insert tube into colorimeter chamber and adjust to 100%T with “Set Blank” knob. This is the 100%T blank.
4. Remove tube from colorimeter. Use 1.0 mL pipet (0354) to add 1.0 mL of *Phosphate Acid Reagent (V-6282).
Cap and mix.
5. Use the 0.1 g spoon (0699) to add one measure of *Phosphate Reducing Reagent (V-6283). Cap and shake until
powder dissolves. Wait 5 minutes for full color development. Solution will turn blue if phosphates are present.
6. At end of 5 minute waiting period, press the “30 Second Read” button and insert tube into colorimeter chamber.
Record %T as soon as reading stabilizes.
7. Consult calibration chart to determine the phosphate concentration in parts per million (ppm).
DC1600 PHOSPHATE ~ LOW RANGE CALIBRATION CHART
%T 9 8 7 6 5 4 3 2 1 0
90
80
70
60
50
40
30
20
10
0
0.01 0.03 0.05 0.07 0.10 0.12 0.14 0.17 0.19 0.21
0.24 0.26 0.29 0.31 0.34 0.36 0.39 0.41 0.44 0.47
0.49 0.52 0.55 0.58 0.61 0.63 0.66 0.69 0.72 0.75
0.79 0.82 0.85 0.88 0.92 0.95 0.98 1.02 1.06 1.09
1.13 1.17 1.20 1.24 1.28 1.32 1.37 1.41 1.45 1.50
1.54 1.59 1.64 1.68 1.73 1.79 1.84 1.89 1.95 2.00
2.06 2.12 2.19 2.25 2.32 2.39 2.46 2.53 2.61 2.69
2.78 2.86 2.95 3.05
74
Page 75

POTASSIUM
TETRAPHENYLBORON METHOD CODE 3639
QUANTITY CONTENTS CODE
30 mL *Sodium Hydroxide, 1.0N *4004WT-G
5 g *Tetraphenylboron Powder *6364-C
1 Spoon, 0.05 g, plastic 0696
*WARNING: Reagents marked with a * are considered hazardous substances. Material Safety Data Sheets (MSDS) are supplied for
these reagents. For your safety, read label and accompanying MSDS before using.
Potassium, as the seventh most common element on the Earth’s surface and in the oceans, may be found in minor quantity
in most water supplies. It seldom exceeds 10 ppm in drinking water and usually is less than 2 ppm. In some brine or runoff
in agricultural areas the potassium concentration may reach 100 ppm.
APPLICATION: Drinking, surface, and saline water.
RANGE: 1.0 – 10.0 ppm Potassium
METHOD: Potassium reacts with sodium tetraphenylborate to form a colloidal white precipitate in
quantities proportional to the potassium concentration.
SAMPLE HANDLING
& PRESERVATION: Store samples in polyethylene bottles, not in soft glass where leaching of potassium from the
glass may occur. Samples may be acidified to pH 2 with nitric acid, but should be neutralized
before analyzing.
INTERFERENCE: Calcium and magnesium interfere at very high concentrations.
PROCEDURE
1. Rinse a clean colorimeter tube (0967) with sample water. Fill to the 10 mL line with sample.
2. Select setting 1 on “Select Wavelength” knob and press “30 Second Read” button.
3. Insert tube into colorimeter chamber and adjust to 100%T with “Set Blank” knob. This is the 100%T blank.
4. Remove tube from colorimeter chamber. Add 4 drops of *Sodium Hydroxide, 1.0N (4004WT). Cap and mix.
5. Use the 0.05 g spoon (0696) to add one measure of *Tetraphenylboron Powder (6364). Cap and shake vigorously
until all of the powder has dissolved. Wait 5 minutes.
6. At end of 5 minute waiting period, press “30 Second Read” button. Mix tube again to suspend any settled precipitate
and immediately insert into colorimeter chamber. Record %T as soon as reading stabilizes.
7. Consult calibration chart to determine potassium concentration in parts per million (ppm).
DC1600 POTASSIUM CALIBRATION CHART
%T 9 8 7 6 5 4 3 2 1 0
90
80
70
60
50
40
30
20
10
0
1.14 1.20 1.26 1.32 1.38 1.44 1.50 1.56 1.61 1.67
1.72 1.77 1.82 1.87 1.92 1.97 2.02 2.06 2.11 2.15
2.20 2.24 2.28 2.32 2.36 2.40 2.43 2.47 2.51 2.54
2.58 2.61 2.64 2.67 2.71 2.74 2.77 2.80 2.83 2.86
2.89 2.92 2.95 2.98 3.01 3.04 3.07 3.11 3.14 3.18
3.22 3.26 3.30 3.35 3.40 3.46 3.52 3.58 3.65 3.73
3.82 3.92 4.02 4.14 4.27 4.42 4.58 4.76 4.97 5.20
5.46 5.76 6.09 6.47 6.91 7.40 7.97 8.62 9.37 10.23
1.01 1.08
75
Page 76

This page is purposely left blank...
76
Page 77

SILICA ~ LOW RANGE
HETEROPOLY BLUE METHOD CODE 3664
QUANTITY CONTENTS CODE
30 mL *Silica Reagent #1 *V-4466-G
30 mL *Silica Reagent #2 *V-4467-G
30 mL *Silica Reagent #3 *V-4468-G
10 g *Silica Reagent #4 *V-6284-D
1 Spoon, 0.1 g, plstaic 0699
*WARNING: Reagents marked with a * are considered hazardous substances. Material Safety Data Sheets (MSDS) are supplied for
these reagents. For your safety, read label and accompanying MSDS before using.
Silicon dioxide, SiO2, commonly known as silica, occurs in all natural water. Silica may be present as suspended insoluble
particles, in a colloidal or polymeric state. It may also be present in a reactive form as silicic acid or silicate ions. Silica is a
major nutrient for diatoms. A silica cycle occurs in many bodies of water containing organisms, such as diatoms, that use
silica in their skeletal structure. The silica removed from the water may be slowly returned to solution by the decomposition
of the dead organisms. The major source of silica in natural water is from the decomposition of silicate minerals in the
drainage basin from which the waters flow. Values may range from 0-75 parts per million (or mg/liter).
The presence of silica is particularly objectionable in water used for boiler feed water purposes, as it may cause the
formation of a hard, dense scale which has unusually high resistance to heat transfer. Serious loss of turbine efficiency
results from insoluble silica turbine blade deposits caused by vaporization of silica from boiler water.
APPLICATION: Drinking, surface and saline waters; domestic and industrial wastes.
RANGE: 0.0 – 4.0 ppm Silica
METHOD: Reactive silica forms a complex with ammonium molybdate in an acidic solution to produce a
yellow-green color in proportion to the amount of silica present. Phosphate also reacts with
molybdate but the addition of oxalic acid eliminates the molybdophosphoric acid complex.
This silica molybdate complex is then reduced by ascorbic acid to produce an intense blue
color.
SAMPLE HANDLING
& PRESERVATION: Silica samples may be preserved by refrigeration at 4°C in a plastic container up to one week
without any change in silica concentration.
INTERFERENCES: Sulfides and large amounts of iron interfere. Color and turbidity may be removed by
standardizing the instrument with the original water sample. Since silica is a component of
glass waste and a common contaminant, it is suggested to run a reagent blank using silica-free
water. The blank value is subtracted from the sample concentrations.
77
Page 78

PROCEDURE
1. Rinse a clean colorimeter tube (0967) with sample water. Fill to the 10 mL line with sample.
2. Select setting 6 on “Select Wavelength” knob and press “30 Second Read” button.
3. Insert tube into colorimeter chamber and adjust to 100%T with “Set Blank” knob. This is the “100”%T blank.
4. Remove tube from colorimeter. Add 6 drops *Silica Reagent #1 (V-4466). Cap and invert to mix.
5. Add 12 drops of *Silica Reagent #2 (V-4467). Cap and mix. Wait 5 minutes.
6. At end of 5 minute waiting period, add 8 drops of *Silica Reagent #3 (V-4468). Cap and mix. Wait 2 minutes.
7. At end of 2 minute waiting period, use the 0.1 g spoon (0699) to add one measure of *Silica Reagent #4 (V-6284).
Cap and mix. Wait approximately 5 minutes for full color development.
8. At end of 5 minute waiting period, press the “30 Second Read” button and insert tube into colorimeter chamber.
Record %T as soon as reading stabilizes.
9. Consult calibration chart to determine silica concentration in parts per million (ppm).
NOTE: For the best possible results carry a reagent blank through the procedure to compensate for any silica which
may be present in the reagents or glassware. The test procedure is run on 10 mL of silica-free water and this tube is
used to set the meter at 93.5% T, (which corresponds to 0 ppm), then continue with the unknown sample tests.
DC1600 SILICA ~ LOW RANGE CALIBRATION CHART
%T 9 8 7 6 5 4 3 2 1 0
90
80
70
60
50
40
30
20
10
0
0.11 0.13 0.16 0.19 0.21 0.24 0.27 0.29 0.32 0.35
0.38 0.41 0.44 0.47 0.50 0.53 0.56 0.59 0.62 0.65
0.68 0.72 0.75 0.78 0.82 0.85 0.89 0.92 0.96 1.00
1.04 1.07 1.11 1.15 1.19 1.23 1.27 1.32 1.36 1.40
1.45 1.50 1.54 1.59 1.64 1.69 1.74 1.79 1.84 1.90
1.95 2.01 2.07 2.13 2.19 2.26 2.32 2.39 2.46 2.53
2.60 2.68 2.76 2.84 2.92 3.01 3.10 3.20 3.30 3.41
3.51 3.63 3.75 3.88 4.02 4.16 4.32 4.49 4.67 4.87
5.09 5.33 5.61 5.93 6.30 6.75 7.32 8.12 9.45
0.01 0.03 0.06 0.08
78
Page 79

SILICA ~ HIGH RANGE
HETEROPOLY BLUE METHOD CODE 3687
QUANTITY CONTENTS CODE
30 mL *Silica Reagent #1 *V-4466-G
30 mL *Silica Reagent #2 *V-4467-G
15 mL *Silica Reagent #3 *4468-E
1 Spoon, 0.1 g, plastic 0699
*WARNING: Reagents marked with a * are considered hazardous substances. Material Safety Data Sheets (MSDS) are supplied for
these reagents. For your safety, read label and accompanying MSDS before using.
Silicon dioxide, SiO2, commonly known as silica, occurs in all natural water. Silica may be present as suspended insoluble
particles, in a colloidal or polymeric state. It may also be present in a reactive form as silicic acid or silicate ions. Silica is a
major nutrient for diatoms. A silica cycle occurs in many bodies of water containing organisms, such as diatoms, that use
silica in their skeletal structure. The silica removed from the water may be slowly returned to solution by the decomposition
of the dead organisms. The major source of silica in natural water is from the decomposition of silicate minerals in the
drainage basin from which the waters flow. Values may range from 0-75 parts per million (or mg/liter).
The presence of silica is particularly objectionable in water used for boiler feed water purposes, as it may cause the
formation of a hard, dense scale which has unusually high resistance to heat transfer. Serious loss of turbine efficiency
results from insoluble silica turbine blade deposits caused by vaporization of silica from boiler water.
APPLICATION: Boilers and cooling towers; domestic and industrial wastes.
RANGE: 0.0 – 75 ppm Silica
METHOD: Reactive silica forms a complex with ammonium molybdate in an acidic solution to produce a
yellow color in proportion to the amount of silica present. Phosphate also reacts with
molybdate but the addition of oxalic acid eliminates the molybdophosphoric acid complex.
SAMPLE HANDLING
& PRESERVATION: Silica samples may be preserved by refrigeration at 4°C in a plastic containers up to one week
without any change in silica concentration.
INTERFERENCES: Sulfides and large amounts of iron interfere. Color and turbidity may be removed by
standardizing the instrument with the original water sample.
79
Page 80

PROCEDURE
1. Rinse a clean colorimeter tube (0967) with sample water. Fill to the 10 mL line with sample.
2. Select setting 2 on “Select Wavelength” knob and press “30 Second Read” button.
3. Insert tube into colorimeter chamber and adjust to 100%T with “Set Blank” knob. This is the %100T blank.
4. Remove tube from colorimeter. Add 6 drops *Silica Reagent #1 (V-4466). Cap and invert to mix.
5. Add 12 drops of *Silica Reagent #2 (V-4467). Cap and mix. Wait 5 minutes.
6. At end of 5 minute waiting period, add 2 drops of *Silica Reagent #3 (V-4468). Cap and mix.
7. Press “30 Second Read” button and insert tube into colorimeter chamber. Record %T as soon as reading stablilizes.
8. Consult calibration chart to determine silica concentration in parts per million (ppm).
DC1600 SILICA ~ HIGH RANGE CALIBRATION CHART
%T 9 8 7 6 5 4 3 2 1 0
90
80
70
60
50
40
30
20
10
0
1 2 3 4 5 7 8 9 10 11
13 14 15 17 18 19 20 22 23 25
26 27 29 30 32 33 35 36 38 40
41 43 44 46 48 50 51 53 55 57
59 61 63 65 67 69 71 73 75
NOTE: To extend range to 150 ppm, perform a 2:1 dilution of water sample with silica free water. Perform test and
multiply result by 2.
80
Page 81

SULFATE
BARIUM CHLORIDE METHOD CODE 3665
QUANTITY CONTENTS CODE
10 g *Sulfate Reagent *V-6277-D
1 Spoon, 0.1 g, plastic 0699
*WARNING: Reagents marked with a * are considered hazardous substances. Material Safety Data Sheets (MSDS) are supplied for
these reagents. For your safety, read label and accompanying MSDS before using.
The most common mineral forms of sulfur are iron sulfide, lead sulfide, zinc sulfide and as calcium sulfate and magnesium
sulfate. In most fresh waters the sulfate ion is the second or third most abundant anion, being exceeded only by bicarbonate
and, in some cases, silicate. Sulfur, in the form of sulfate, is considered an important nutrient element. Mineral springs are
rich in sulfate and feed appreciable quantities of this compound to the watershed. Acid mine water drainage is a form of
pollution which may contribute extremely large amounts of sulfate content to natural waters. Other sources of sulfate
include waste material from pulp mills, steel mills, food processing operations and municipal wastes. Many bacteria obtain
sulfur from sulfate for the synthesis of amino acids. In lakes and streams low in oxygen, this process of sulfate reduction
causes the production of hydrogen sulfide, with its characteristic offensive odor. Calcium sulfate and magnesium sulfate
contribute significantly to the hardness of water. Under natural conditions, the quantities ordinarily to be expected in lakes
are between 3 and 30 parts per million.
APPLICATION: Drinking and surface waters, domestic and industrial wastes.
RANGE: 0 – 100 ppm Sulfate
METHOD: Sulfate ion is precipitated in an acid medium with barium chloride to form a barium sulfate
suspension in proportion to the amount of sulfate present.
SAMPLE HANDLING
& PRESERVATION: Sulfate samples may be preserved by refrigeration at 4°C up to 7 days in glass or plastic
containers without any change in concentration.
INTERFERENCE: Suspended matter and color interference may be removed by a filtration step. Silica in excess
of 500 mg/L will interfere.
81
Page 82

PROCEDURE
1. Rinse a clean colorimeter tube (0967) with sample water. Fill to the 10 mL line with sample.
2. Select setting 1 on “Select Wavelength” knob and press “30 Second Read” button.
3. Insert tube into colorimeter chamber and adjust to 100%T with “Set Blank” knob. This is the 100%T blank.
4. Remove tube from colorimeter. Use the 0.1 g spoon (0699) to add one measure of *Sulfate Reagent (V-6277). Cap
and shake until powder dissolves. A white precipitate will develop if sulfates are present. Wait 5 minutes.
5. Mix tube again. Press the “30 Second Read” button and insert tube into colorimeter chamber. Record %T as soon as
reading stabilizes.
6. Consult calibration chart to determine sulfate concentration in parts per million (ppm).
NOTE: If the sulfate concentration of the test sample is greater than 100 ppm, it is recommended that a dilution be
made with deionized water and the results multiplied by the dilution factor.
NOTE: A white film is deposited on the inside of test tubes as a result of the sulfate test. Thoroughly clean and rinse
test tubes after each test.
DC1600 SULFATE CALIBRATION CHART
%T 9 8 7 6 5 4 3 2 1 0
90
80
70
60
50
40
30
20
10
0
4.04 4.30 4.56 4.83 5.09 5.36 5.63 5.90 6.17 6.45
6.72 7.00 7.28 7.56 7.84 8.12 8.41 8.70 8.99 9.28
9.58 9.88 10.18 10.48 10.79 11.10 11.41 11.72 12.04 12.37
12.70 13.03 13.36 13.71 14.05 14.40 14.76 15.12 15.49 15.87
16.25 16.64 17.04 17.44 17.86 18.28 18.72 19.16 19.62 20.09
20.57 21.06 21.57 22.10 22.64 23.21 23.79 24.39 25.02 25.67
26.35 27.05 27.79 28.56 29.38 30.23 31.12 32.07 33.07 34.13
35.26 36.46 37.74 39.11 40.58 42.17 43.88 45.75 47.77 49.99
52.43 55.12 58.10 61.43 65.18 69.41 74.25 79.81 86.29 93.92
103.05
82
Page 83

SULFIDE
METHYLENE BLUE METHOD CODE 3654
QUANTITY CONTENTS CODE
60 mL *Sulfide Reagent A *V-4458-H
15 mL *Sulfide Reagent B *V-4459-E
2 x 60 mL Sulfide Reagent C 4460-H
2 Pipets, 1.0 mL, plastic 0354
*WARNING: Reagents marked with a * are considered hazardous substances. Material Safety Data Sheets (MSDS) are supplied for
these reagents. For your safety, read label and accompanying MSDS before using.
Sulfide occurs in many well water supplies and sometimes is formed in lakes or surface waters. In distribution systems, it may
be formed as a result of bacterial action on organic matter under anaerobic conditions. It may also be found in waters
receiving sewage or industrial wastes. For example, solutions used in the treatment of wood pulp in paper manufacturing
may contain large amounts of sulfite, which is reduced to sulfide. Lake muds rich in sulfates produce hydrogen sulfide during
periods of very low oxygen levels that result from summer stagnation. Concentrations of a few hundredths of a part per
million (or milligram per liter) cause a noticeable odor. At low concentrations, this odor is described as “musty”; at high
concentration it is described as “rotten eggs.” Removal of sulfide odor is accomplished by aeration or chlorination.
Hydrogen sulfide is a toxic substance that acts as a respiratory depressant in both humans and fish.
APPLICATION: Drinking, surface and saline waters; domestic and industrial wastes.
RANGE: 0.0 – 3.0 ppm Sulfide
METHOD: Under suitable conditions the sulfide ion reacts with p-aminodimethylaniline and ferric
chloride to produce methylene blue in proportion to the sulfide concentration. Ammonium
phosphate is added to remove the color due to the ferric iron.
SAMPLE HANDLING
& PRESERVATION: Samples must be taken with a minimum of aeration since sulfide is volatilized by aeration and
any oxygen which is taken up will destroy sulfides by chemical action. Samples that are used
for total sulfide concentrations may be preserved by adding 2M zinc acetate solution at a
dosage of 2 mL per liter of sample. This precipitates sulfide as inert zinc sulfide. Determination
of dissolved sulfides and sample not preserved with zinc acetate must be started within 3
minutes of sampling.
INTERFERENCES: Strong reducing agents such as sulfite, thiosulfate, and hydrosulfite prevent the formation of
the color or diminish its intensity. High concentrations of sulfide will inhibit the reaction, but
dilution of the sample prior to analysis eliminates this problem.
83
Page 84

PROCEDURE
1. Rinse a clean colorimeter tube (0967) with sample water. Fill to the 10 mL line with sample.
2. Select setting 5 on “Select Wavelength” knob and press “30 Second Read” button.
3. Insert tube into colorimeter chamber and adjust to 100%T with “Set Blank” knob. This is the 100%T blank.
4. Remove tube from colorimeter. Use the 1.0 mL pipet (0354) to add 1.0 mL of *Sulfide Reagent A (V-4458). Cap and
mix.
5. Add 6 drops of *Sulfide Reagent B (V-4459). Cap and mix. Wait 1 minute. Solution will turn blue if sulfides are
present.
6. Use the 1.0 mL pipet (0354) to add 2.0 mL of Sulfide Reagent C (4460). Cap and mix. Color development is
immediate and stable.
7. Press “30 Second Read” button and insert tube into colorimeter chamber. Record %T as soon as reading stabilizes.
8. Consult calibration chart to determine sulfide concentration in parts per million (ppm) .
DC1600 SULFIDE CALIBRATION CHART
%T 9 8 7 6 5 4 3 2 1 0
90
80
70
60
50
40
30
20
10
0
0.11 0.12 0.14 0.15 0.17 0.19 0.20 0.22 0.23 0.25
0.27 0.29 0.30 0.32 0.34 0.36 0.37 0.39 0.41 0.43
0.45 0.47 0.49 0.51 0.53 0.55 0.57 0.59 0.61 0.63
0.65 0.67 0.70 0.72 0.74 0.76 0.79 0.81 0.84 0.86
0.89 0.91 0.94 0.96 0.99 1.02 1.04 1.07 1.10 1.13
1.16 1.19 1.22 1.25 1.29 1.32 1.35 1.39 1.43 1.46
1.50 1.54 1.58 1.62 1.66 1.70 1.75 1.80 1.84 1.89
1.95 2.00 2.06 2.12 2.18 2.24 2.31 2.38 2.46 2.54
2.63 2.73 2.83 2.95
0.00 0.02 0.03 0.05 0.06 0.08 0.09
84
Page 85

TANNIN
TUNGSTO-MOLYBDOPHOSPHORIC ACID METHOD CODE 3666
QUANTITY CONTENTS CODE
30 mL *Tannin Reagent #1 *7833-G
2 x 60 mL *Tannin Reagent #2 *7834-H
1 Pipet, plain, plastic 0352
1 Pipet, 1.0 mL, plastic 0354
*WARNING: Reagents marked with a * are considered hazardous substances. Material Safety Data Sheets (MSDS) are supplied for
these reagents. For your safety, read label and accompanying MSDS before using.
Tannin and lignin are examples of hydroxylated aromatic compounds found in discharge wastewater from paper mills, in
some boiler water treatment, in natural brackish water, and in wastewater from leather tanning plants. The taste and odor
of these compounds is generally offensive so that their control is important in many areas.
APPLICATION: Industrial wastewater, boiler water, and natural water.
RANGE: 0 – 10 ppm Tannic Acid
METHOD: The hydroxylated aromatic compounds will reduce a mixture of tungstophosphoric and
molybdophosphoric acids to form a blue color in proportion to the concentration of aromatic
hydroxyl groups.
SAMPLE HANDLING
& PRESERVATION: Sample should be analyzed as soon as possible after collection.
INTERFERENCES: Other reducing compounds such as ferrous iron and sulfites. Results may be expressed as tannin
like compounds, or aromatic hydroxy compounds.
PROCEDURE
1. Rinse a clean colorimeter tube (0967) with sample water. Fill to the 10 mL line with sample.
2. Select setting 6 on “Select Wavelength” knob and press “30 Second Read” button.
3. Insert tube into colorimeter chamber and adjust to 100%T with “Set Blank” knob. This is the 100%T blank.
4. Remove tube from colorimeter. Use the plain pipet (0352) to add 4 drops of *Tannin Reagent #1 (7833). Cap and
mix.
5. Use the 1.0 mL pipet (0354) to add 2.0 mL of *Tannin Reagent #2 (7834). Cap and mix. Wait 30 minutes for full
color development.
6. At end of 30 minute waiting period press “30 Second Read” button and insert tube into colorimeter chamber. Record
%T as soon as reading stabilizes.
7. Consult calibration chart to determine tannic acid or “hydroxylated aromatic compounds” concentration in parts per
million (ppm).
NOTE: It is suggested for best possible results to carry a blank through the procedure to compensate for any color
which may be present in the reagents. Set the reagent blank to 100%T, then continue with unknown sample tests.
DC1600 TANNIN (TANNIC ACID) CALIBRATION CHART
%T 9 8 7 6 5 4 3 2 1 0
90
80
70
60
50
40
30
20
10
0.22 0.27 0.32 0.36 0.41 0.46 0.51 0.56 0.61 0.66
0.71 0.76 0.81 0.86 0.92 0.97 1.02 1.08 1.13 1.19
1.25 1.30 1.36 1.42 1.48 1.54 1.60 1.66 1.73 1.79
1.85 1.92 1.99 2.05 2.12 2.19 2.26 2.33 2.40 2.48
2.55 2.63 2.71 2.78 2.86 2.95 3.03 3.11 3.20 3.29
3.37 3.46 3.56 3.65 3.75 3.85 3.95 4.05 4.16 4.26
4.37 4.49 4.60 4.72 4.84 4.97 5.10 5.23 5.37 5.51
5.65 5.80 5.96 6.12 6.29 6.46 6.64 6.83 7.03 7.23
7.45 7.68 7.92 8.17 8.44 8.72 9.03 9.36 9.71 10.10
85
Page 86

This page is purposely left blank...
86
Page 87

TURBIDITY
ABSORPTION METHOD
NO REAGENTS REQUIRED
PROCEDURE
1. Rinse a clean colorimeter tube (0967) with deionized water (turbidity free). Fill to the 10 mL line with deionized
water.
2. Select setting 1 on “Select Wavelength” knob and press “30 Second Read” button.
3. Insert tube into colorimeter chamber and adjust to 100%T with “Set blank” knob. This is the 100%T blank.
4. Rinse a second clean colorimeter tube (0967) with sample water. Fill to the 10 mL line with sample. Cap tube. Wipe
off excess water and fingerprints. Shake to resuspend particulate matter. Remove all bubbles before measurement.
5. Press “30 Second Read” button and insert tube into colorimeter chamber. Record %T as soon as reading stabilizes.
Turbidity measurements should be taken as soon as possible after sample has been collected.
6. Consult calibration chart to determine turbidity expressed in Formazin Turbidity Units (FTU).
DC1600 TURBIDITY CALIBRATION CHART (F.T.U.)
%T 9 8 7 6 5 4 3 2 1 0
90
80
70
60
50
40
30
20
10
0
The turbidity calibration chart was prepared by using standard formazin solutions as a reference. These solutions
NOTE:
can be prepared by carefully following the procedure below.†
A. Dissolve 1.000 g of Hydrazine Sulfate in deionized water and dilute to mark in 100 mL volumetric flask.
B. Dissolve 10.00 g of Hexamethylenetetramine in deionized water and dilute to mark in 100 mL volumetric flask.
C. Mix 5 mL of each solution in a 100 mL volumetric flask and allow to set undisturbed for 24 hours.
D. At the end of the waiting period, dilute to mark with deionized water and mix.
E. The turbidity of the stock solution is 400 FTU. The stock solution is stable for one month. Dilutions from the
7.0 7.8 8.6 9.4 10.2 11.1 12.0 12.9 13.8 14.7
15.7 16.7 17.7 18.7 19.8 20.8 21.9 23.1 24.2 25.4
26.6 27.8 29.1 30.4 31.7 33.1 34.5 35.9 37.4 38.9
40.4 42.0 43.6 45.3 47.0 48.7 50.5 52.4 54.3 56.2
58.3 60.3 62.5 64.7 66.9 69.3 71.7 74.1 76.7 79.3
82.1 84.9 87.8 90.8 94.0 97.2 100.5 104.0 107.6 111.4
115.3 119.3 123.5 127.9 132.5 137.3 142.3 147.5 153.0 158.7
164.8 171.1 177.8 184.8 192.3 200.2 208.6 217.5 227.0 237.1
248.0 259.7 272.3 286.0 301.0 317.3 335.3 355.2 377.5 402.6
stock should be prepared fresh daily.
†Alternatively, a prepared concentrated formazin standard of 4000 NTU may be ordered in a 60 mL size by Code 6195-H.
87
Page 88

This page is purposely left blank...
88
Page 89

ZINC
ZINCON METHOD CODE 3667
QUANTITY CONTENTS CODE
30 mL *Zinc Indicator Solution *6314-G
100 mL *Methyl Alcohol *6319-J
10 g Sodium Ascorbate Powder 6316-D
25 g *Zinc Buffer Powder *6315-G
15 mL *Sodium Cyanide, 10% *6565-E
30 mL *Formaldehyde Solution, 37% *5128-G
1 “Dilute Zinc Indicator Solution” 0128-MT
Bottle, with 1 mL pipet assembly
1 Graduated Cylinder, 10 mL, glass 0416
1 Spoon, 0.5 g, plastic 0698
2 Pipets, plain, plastic 0352
1 Spoon, 0.1 g, plastic 0699
*WARNING: Reagents marked with a * are considered hazardous substances. Material Safety Data Sheets (MSDS) are supplied for
these reagents. For your safety, read label and accompanying MSDS before using.
Zinc enters the domestic water supply from the deterioration of galvanized iron and brass pipes, and from industrial wastes.
Zinc is an essential element for body growth and development and is an important plant nutrient. Concentrations of zinc
above 5.0 mg/L in drinking water can cause a bitter astringent taste. In the U.S., zinc concentrations may vary between
0.06 to 7.0 mg/L, with an average value of 1.33 mg/L.
APPLICATION: Drinking and surface waters, domestic and industrial waste water.
RANGE: 0.0 – 3.0 ppm Zinc
METHOD: Zinc forms a blue colored complex with Zincon in a solution buffered at pH 9.0. Other heavy
SAMPLE HANDLING
& PRESERVATION: Sample should be analyzed within 6 hours after collection. The addition of hydrochloric acid
INTERFERENCES: The following ions interfere in concentrations greater than those listed.
metals are complexed by cyanide and the zinc cyanide complex is released by the addition of
formaldehyde before the other metal cyanide complexes are destroyed. Sodium ascorbate is
added to reduce the interference of manganese.
will help preserve the metal ion content, however the acid should be neutralized before
analysis.
ION mg/L
Cd(II) 1
Al(III) 5
Mn(II) 5
Fe(III) 7
Fe(II) 9
Cr(III) 10
Ni(II) 20
Cn(II) 30
CrO4(II) 50
89
Page 90

PROCEDURE
A. PREPARATION OF DILUTE ZINC INDICATOR SOLUTION
1. Use a pipet (0352) to measure exactly 5.0 mL of *Zinc Indicator Solution into 10 mL graduated cylinder. The bottom
of the curved surface (the meniscus) of liquid should be at 5.0 mL mark. Pour this into the bottle labeled “Dilute Zinc
Indicator Solution”.
2. Use unrinsed graduated cylinder to add 10.0 mL and then 7.8 mL (total of 17.8 mL) of *Methyl Alcohol (6319) to
bottle labeled “Dilute Zinc Indicator Solution”. Cap and mix ingredients in this bottle. Do not leave this bottle
uncapped.
B. DETERMINATION OF ZINC
1. Rinse a clean colorimeter tube (0967) with sample water. Fill to the 10 mL line with sample.
2. Select setting 6 on “Select Wavelength” knob and press “30 Second Read” button.
3. Insert tube into colorimeter chamber and adjust to 100%T with “Set Blank” knob. This is the 100%T blank.
4. Remove tube from colorimeter. Use 0.1 g spoon (0699) to add one measure of Sodium Ascorbate Powder (6316). Use
0.5 g spoon (0698) to add one measure of *Zinc Buffer Reagent (6315). Cap and shake vigorously for 1 minute.
5. Add 3 drops of *Sodium Cyanide, 10% (6565). Cap and mix.
6. Use the 1 mL pipet assembly to add 1 mL of “Dilute Zinc Indicator Solution”. Cap and mix.
7. Use a second plain pipet (0352) to add 4 drops of *Formaldehyde Solution, 37% (5128). Cap and mix by inverting
15 times.
8. Press the “30 Second Read” button and insert tube into colorimeter chamber. Record %T as soon as the reading
stabilizes.
9. Consult calibration chart to determine zinc concentration in parts per million (ppm).
NOTE: It is suggested for best possible results to carry a reagent blank through the procedure to compensate for any
color which may develop within the reagents. Set the reagent blank to 86%T, then continue with unknown sample
tests.
DC1600 ZINC CALIBRATION CHART
%T 9 8 7 6 5 4 3 2 1 0
90
80
70
60
50
40
30
20
10
0
0.07 0.08 0.09 0.10 0.11 0.13 0.14 0.15 0.16 0.17
0.18 0.20 0.21 0.22 0.23 0.25 0.26 0.27 0.29 0.30
0.32 0.33 0.35 0.36 0.38 0.39 0.41 0.43 0.44 0.46
0.48 0.50 0.51 0.53 0.55 0.57 0.59 0.61 0.63 0.66
0.68 0.70 0.73 0.75 0.78 0.80 0.83 0.86 0.89 0.92
0.95 0.98 1.02 1.05 1.09 1.13 1.17 1.21 1.26 1.31
1.36 1.41 1.47 1.53 1.59 1.66 1.74 1.82 1.91 2.01
2.12 2.25 2.39 2.56 2.76 3.02
0.00 0.01 0.02 0.03 0.04 0.05 0.06
90
 Loading...