

Page 1

STORMWATCH
DRAIN MONITORING KIT
Code 7446-01
Find Quality Products Online at: sales@GlobalTestSupply.com
www.GlobalTestSupply.com
Page 2

OVERVIEW
According the U.S. Census Bureau, the world’s population went from 2.5 billion in
1950 to 6 billion in 2000 and is on pace to exceed 9 billion by 2050. We will soon
have 3 times the global population we had only in 1950, and with this growth
comes enormous impacts on the surface of our globe. As buildings and pavement
expand so do our obligations to control stormwater euents. Urban development
creates new pollution, which can either be washed or directly dumped into storm
sewer systems, and ultimately into our waterways and coastal areas. Storm runo
leaving developed urban areas is signicantly greater in inorganic content than
runo from the same area prior to development.
Stormwater is typically dened as water that is created as a result of a
precipitation event. This water may ow through any path (gully, stream,
conduit, channel, etc.) or adjacent area that is subject to overow or ood water
generated from that event. This water passes through a wide variety of natural
or articial environments, often sweeping organic and inorganic constituents
into the watercourse through
municipal storm drain systems.
These environments can include
pipeline projects, construction
sites, landscaped areas,
agricultural runo, irrigation
ditches, industrial sites, and a
variety of other sources. In most
cases this material is eventually
fed into a stream, river, or other
waterway, contributing to the
overall pollutant load in that body
of water.
While onsite sampling and osite
testing can be completed over the
course of a number of days, the source of this outfall continues to contaminate
the watercourse with both inorganic and organic constituents during subsequent
precipitation events. A means is required by which to screen the outfall to
potentially determine its source, the contribution it is making to the pollutant load,
and the proper course of action to take.
Instrumentation and reagent systems are currently available to make
measurements necessary to provide a preliminary screening of the outow, and
determine whether it is contributing to the overall pollutant load as it relates to
inorganic constituents. In many cases these measurements can be made near the
source, using handheld instrumentation and test kits, which may provide some
indication as to the source and content of the outow, or provide some indication
of what additional testing is required.
2
Find Quality Products Online at: sales@GlobalTestSupply.com
www.GlobalTestSupply.com
Page 3

EXAMPLES OF OUTFLOWS
Outows attributable to a rainwater event can occur across a number of dierent
environments.
These include:
• Agricultural runoff
• Industrial sites
• Construction sites
• Irrigation runoff
• Parking lots and pavement
• Other
While illicit discharges of various chemical constituents into stormwater drains
represent a portion of the overall problem, these are not normally dened as
stormwater events. These outows can contain a wide variety of both inorganic
and organic contaminants, and must be considered when characterizing the
source of outow. Inorganic constituents can often provide an indicator of such
outows when used in a manner that takes all indicators into account.
Where there are questions and concerns, either generated through the use
of inorganic indicators, or when there are suspicions regarding organic
contaminants, samples should be sent for further analysis.
While individual test measurements can be eectively used for screening outows,
long term trends are important after establishing baseline values for inorganic
indicators (and organic indicators as needed).
MAKING MEASUREMENTS
Colorimetric
Colorimetric methods are based on the intensity of color produced by a chemical
reaction. The color of the reaction is matched to a precision matched color bar
using an Octa-Slide 2 Comparator.
Turbidimetric
The turbidity concentration is determined by the degree to which black lines on
the tube are obscured when compared to calibrated targets.
Detergent
Anionic surfactants are extracted with toluene and break up an ion pair, releasing
bromphenol blue into a water layer.
Electrometric pH
When the TRACER is immersed in the sample, the meter measures the dierence
in electrical potential between the electrode and the reference electrode. The
electronic measurement is converted from millivolts to pH units, and the result
appears on the display.
3
Find Quality Products Online at: sales@GlobalTestSupply.com
www.GlobalTestSupply.com
Page 4

INDICATORS
Chlorine
Chlorine is used throughout the country to disinfect tap water, except where
private wells provide the water supply. Unfortunately, chlorine is extremely volatile,
and even moderate levels of organic materials can cause chlorine levels to drop
below detection levels. Because chlorine is unstable, it is not a reliable indicator,
although if very high chlorine levels are measured, it is a strong indication of a
water line break, swimming pool discharge, or industrial discharge from a chlorine
bleaching process.
Copper
Copper can arise from the corrosive actions of water leaching copper from copper
pipes in building condensate systems and heat exchangers. High concentrations
of copper can come from a variety of other sources including vehicle brake pads,
pesticides and soil erosion, plating operations, vehicle uid leaks and dumping.
Phenols
Phenols are used in heavy or industrial cleaning solutions, plating operations, coal
coking and renery operations. They are also a product of plating operations and
are used as an anticaking ingredient in road salts.
Turbidity
Turbidity in water is caused by suspended particles or colloidal matter that
obstructs light transmission through the water. It may be caused by inorganic or
organic matter or a combination of the two. Microorganisms (bacteria, viruses and
protozoa) are typically attached to particulates. Turbidity in some groundwater
sources is a consequence of inert clay or chalk particles or the precipitation of
nonsoluble reduced iron and other oxides . Turbidity in surface waters may be the
result of particulate matter of many types and is more likely to include attached
microorganisms that are a threat to health.
Detergents
In many countries, persistent types of anionic detergent have been replaced by
others that are more easily biodegraded, and hence the levels found in water
sources have decreased substantially. The concentration of detergents should
not be allowed to reach levels giving rise to either foaming or taste problems.
The presence of any detergent may indicate contamination of source water with
sewage or ingress of detergent solution into the distribution system, as a result of
back-ow, for example.
pH
Most discharge ow types are neutral, having a pH value around 7, although
groundwater concentrations can be somewhat variable. pH is a reasonably good
indicator for liquid wastes from industries, which can have very high or low pH
(ranging from 3 to 12). The pH of residential wash water tends to be rather basic
(pH of 8 or 9). Although pH data is often not conclusive by itself, it can identify
problem outfalls that merit follow-up investigations. Normal rainwater has a pH of
approximately 5.6
4
Find Quality Products Online at: sales@GlobalTestSupply.com
www.GlobalTestSupply.com
Page 5

Test Factor Methodology Action Level
Total Residual
Chlorine
Total Copper Copper ions form a yellow colored chelate with
Total Phenol 4-Aminoantipyrine is oxidized in the presence of
Turbidity The turbidity is determined by comparing the degree
Detergents
(Surfactants)
pH An ion specic electrode is used to measure
Combined forms of chlorine react with DPD in the
presence of potassium iodide to produce a red color.
Color is compared to a known standard using a
comparator.
diethyldithiocarbamate around pH 9-10 in
proportion to the concentration of copper in the
sample. Color is compared to a known standard
using a comparator.
all ortho- and meta-substituted phenols to form
a colored complex in proportion to the amount
of phenol present. Color is compared to a known
standard using a comparator.
to which black lines on a tube are obscured by the
sample when compared to targets ina comparator.
The presence of LAS (Linear Alkylbenzene Sulfonate)
in the water sample causes the transfer of
bromphenol blue dye from the organic reagent layer
to the aqueous layer. The amount of color in the
aqueous layer is proportional to the concentration
of the LAS in the sample.
potential across the salt bridge created by an
electronic meter with a probe.
≥0.30 ppm
≥0.50 ppm
≥1.00 ppm
Non specied
≥0.40 ppm
<6 or >9
5
Find Quality Products Online at: sales@GlobalTestSupply.com
www.GlobalTestSupply.com
Page 6

USE OF THE OCTA-SLIDE 2 VIEWER
The Octa-Slide 2 Viewer should be held so nondirect light enters through the back of the Viewer.
Insert the reacted sample into the top of the
Viewer. Slide the Octa-Slide 2 Bar into the Viewer
and match the color of the reaction to the color
standards.
GLASSWARE CLEANING PROCEDURE
It is important to rinse test tubes with Deionized Water, three times in succession,
after each test procedure is completed. At the end of each day, all sampling
and test glassware should be brushed with a test tube brush (0514) and dilute
dishwashing detergent and rinsed three times with Deionized Water.
To avoid possible detergent test interference, do not use detergent to clean
Detergent Bottle (0800), rinse three times with Deionized Water only.
6
Find Quality Products Online at: sales@GlobalTestSupply.com
www.GlobalTestSupply.com
Page 7

FIELD TEST PROCEDURES
1
2
3
4
5
6
TOTAL RESIDUAL CHLORINE
QUANTITY CONTENTS CODE
50 Chlorine DPD #4R Tablets 6899A-J
2 Test Tube, 2.5-5-10 mL, plastic, w/caps 0106
1 Chlorine Octa-Slide 2 Bar, 0.2-3.0 ppm 3401-01
*WARNING: Reagents marked with an * are considered to be potential health hazards. To view or
PROCEDURE
Insert Chlorine
Octa-Slide 2
Bar (3401-01)
into the
Octa-Slide 2
Viewer (1101).
Cap and mix
until tablet
disintegrates.
Fill a test tube
(0106) to the 5
mL line with the
water sample.
Insert test
tube into
OctaSlide 2
Viewer.
Add one
Chlorine DPD
#4R Tablet
(6899A).
Match
sample color
to a color
standard.
Record as
ppm Total
Residual
Chlorine.
7
Find Quality Products Online at: sales@GlobalTestSupply.com
www.GlobalTestSupply.com
Page 8

COPPER
QUANTITY CONTENTS CODE
30 mL *Copper 1 *6446-G
2 Test Tube, 2.5-5-10 mL, plastic, w/caps 0106
1 Copper Octa-Slide 2 bar, 0-4.0 ppm 3435-01
*WARNING: Reagents marked with an * are considered to be potential health hazards. To view or
PROCEDURE
1
Insert the
Copper OctaSlide 2 bar
(3435-01) into
the OctaSlide 2 Viewer
(1101).
4
Cap and mix.
2
5
Fill a test tube
(0106) to the
10 mL line with
sample water.
Insert test
tube into
OctaSlide 2
Viewer.
3
6
Add 5 drops
of *Copper 1
(6446).
Match
sample color
to a color
standard.
Record as
ppm Copper.
8
Find Quality Products Online at: sales@GlobalTestSupply.com
www.GlobalTestSupply.com
Page 9

PHENOLS
QUANTITY CONTENTS CODE
10 g Aminoantipyrine Reagent 7825-D
60 mL *Ammonia Hydroxide Solution *7826-H
2 x 100 mL Potassium Ferricyanide Solution 7827-J
1 Spoon, 0.1 g 0699
1 Pipet, plain, glass, w/cap 0344
1 Pipet Assembly, 1.0 mL, plastic, w/cap 0330
2 Test Tube, plastic, w/caps 0106
1 Phenols Octa-Slide 2 bar, 0-5 ppm 3434-01
1 Sample Reaction Tube 0837
*WARNING: Reagents marked with an * are considered to be potential health hazards. To view or
PROCEDURE
1
Insert the
Phenols
Octa-Slide 2
bar (3434-01)
into the OctaSlide 2 Viewer
(1101).
4
Use the
unmarked
pipet (0344) to
add 4 drops of
*Ammonium
Hydroxide
Solution (7826).
Cap and mix.
2
Fill Sample
Reaction Tube
(0837) to
the line with
sample water.
5
Use the 1.0 mL
pipet (0330) to add
2 mL (2 measures)
of Potassium
Ferricyanide
Solution (7827).
Cap and mix.
Solution will turn
orange/pink
if phenols are
present.
9
3
Use 0.1 g spoon
(0699) to add
1 measure of
Aminoantipyrine
Reagent (7825).
Cap and mix.
6
Fill test tube
(0106) to 10
mlL line with
solution. Cap.
Insert tube
into OctaSlide Viewer
(1101). Match
sample color
to a color
standard.
Record as
ppm Phenols.
Find Quality Products Online at: sales@GlobalTestSupply.com
www.GlobalTestSupply.com
Page 10

TURBIDITY
1
2
3
4
5
QUANTITY CONTENTS CODE
2 Test Tube, 2.5-5-10 mL, plastic, w/caps, with line 0106-WL
1 Turbidity Octa-Slide 2 bar, Low-Med-High 3436-01
PROCEDURE
Insert Turbidity
Octa-Slide 2
Bar (3436-01)
into the OctaSlide 2 Viewer
(1101).
Match sample
with the
standards by
comparing
the degree
to which the
black lines are
obscured by
the turbidity
(cloudiness)
of the sample.
Low 0-50 FTUs
Medium 75-150 FTUs
High 200-500 FTUs
Fill a test tube
(0106-WL) to
the 10 mL line
with sample
water.
Disregard any
differences in
color between
the sample
and the
standards.
The test is
based on the
degree of
turnidity, not
color. Record
as Low,
Medium or
High.
Insert test
tube into the
Octa-Slide 2
Viewer with
the printing
on the tube
facing away
from the
operator.
NOTE:
Throughly
clean tubes
after each use.
Find Quality Products Online at: sales@GlobalTestSupply.com
www.GlobalTestSupply.com
10
Page 11

DETERGENT
QUANTITY CONTENTS CODE
60 g Detergent Reagent #1 7444-H
3 x 100 mL *Detergent Reagent #2 *6037-J
100 mL *Detergent Reagent #3 *7445-J
1 Pipet, 0.5 mL, glass, w/cap 0335
1 Spoon, 1.0 g 0697
1 French Bottle, Calibrated to 65 & 75 mL 0800
*WARNING: Reagents marked with an * are considered to be potential health hazards. To view or
PROCEDURE
1
4
Fill bottle
(0800) to 65
mL line with
sample water.
Fill to 75
mL line with
Detergent
Reagent #2.
2
5
Use the 1.0 g
spoon (0697)
to add 2
measures
of Detergent
Reagent #1
(7444).
Use pipet (0335) to add 0.5 mL *Detergent
#3 (7445). Shake vigorously for 15 seconds.
Wait until layers separate (20-30 seconds).
If the top layer is light blue, less that 0.1 mL
detergent is present and no further testing is
necessary. If top layer is colorless, continue
adding *Detergent Reagent #3 , 0.5 mL at a
time, shaking vigorously for 15 seconds after
each addition, allowing the layers to separate
until the top layer is light blue. Count the
number of additions of 0.5 mL of *Detergent
Reagent #3 required to change the top layer
from colorless to light blue.
3
Shake until
dissolved.
6
Detergent concentrations in ppm = (Number of pipets Detergent # 3 -1) x 0.1
Example: It takes 9 pipets to turn the top layer blue. (9-1) x 0.1 = 0.8. The amount
of detergent is greater than 0.7 ppm but less than 0.9 ppm detergent.
11
Find Quality Products Online at: sales@GlobalTestSupply.com
www.GlobalTestSupply.com
Page 12
pH • TRACER
1
2
3
For complete instructions, see the TRACER manual.
Before rst use, hold the meter by the top battery compartment and swiftly tap
the back of the meter downward into your palm (not a hard surface). This assures
that the internal electrolyte moves to the very tip of the electrode. The electrolyte
should ll the circular junction window at the tip of the electrode.
Before rst use or after storage, soak the electrode in tap water or pH buer
solution for about 10 minutes.
For the most accurate results, allow sucient time for the temperature of the
probe to reach the temperature of the sample before calibrating. This will be
indicated by a stable temperature reading on the display.
CALIBRATION
The TRACER can be calibrated at 1, 2 or 3 points. For the most accurate results
with a two point calibration, calibrate the TRACER with a pH 7 buer rst, then
calibrate with either a pH 4 or pH 10 buer whichever is closest to the pH value of
the sample to be tested. When performing a three point calibration, calibrate with
the pH 7 buer rst, followed with the pH 4 buer and then the pH 10 buer.
Preparation of Buers
Fill a sample
cup with 20
mL of distilled
or deionized
water.
Add one buffer
tablet:
pH 4.0
Code 3983A
OR
pH 7.0
Code 3984A
OR
pH 10.0
Code 3985A.
Use the tablet
crusher (0175)
to crush the
tablet. Stir until
the tablet has
disintegrated.
NOTE: Buers should be prepared fresh daily.
12
Find Quality Products Online at: sales@GlobalTestSupply.com
www.GlobalTestSupply.com
Page 13

Calibration
1
Fill a
sample
cup to
the 20 mL
line with
a buffer
2
Press the
ON/OFF
button to
turn the
MODE
CAL
TRACER
ON
OFF
ON.
solution.
3
Place the electrode in the
buffer solution. Press and
hold the CAL/RECALL button
CAL
until “CAL” appears in the
MODE
CAL
lower display. The meter will
ON
OFF
automatically recognize the
buffer and calibrate itself
to that value. The circled
number on the display will
match the value of the buffer.
During the
4
calibration the pH
value on the display
will ash. When
the calibration
is complete, the
TRACER will display
“SA” and “End” and
return to normal
operation.
The appropriately
5
circled indicator (L, M
or H) will appear on
the display when a
calibration has been
completed within one
power on cycle.
For a two or three
6
point calibration,
repeat steps 1-5 with
the remaining buffers.
When the TRACER
is turned off, the
circled indicator
conguration and the
calibration data will be
memorized.
NOTE: If the buffer solution is more than 1 pH unit off from 4, 7, or 10, or the electrode
slope is low, the meter will assume that there is an error and the calibration will be
terminated. END will be displayed.
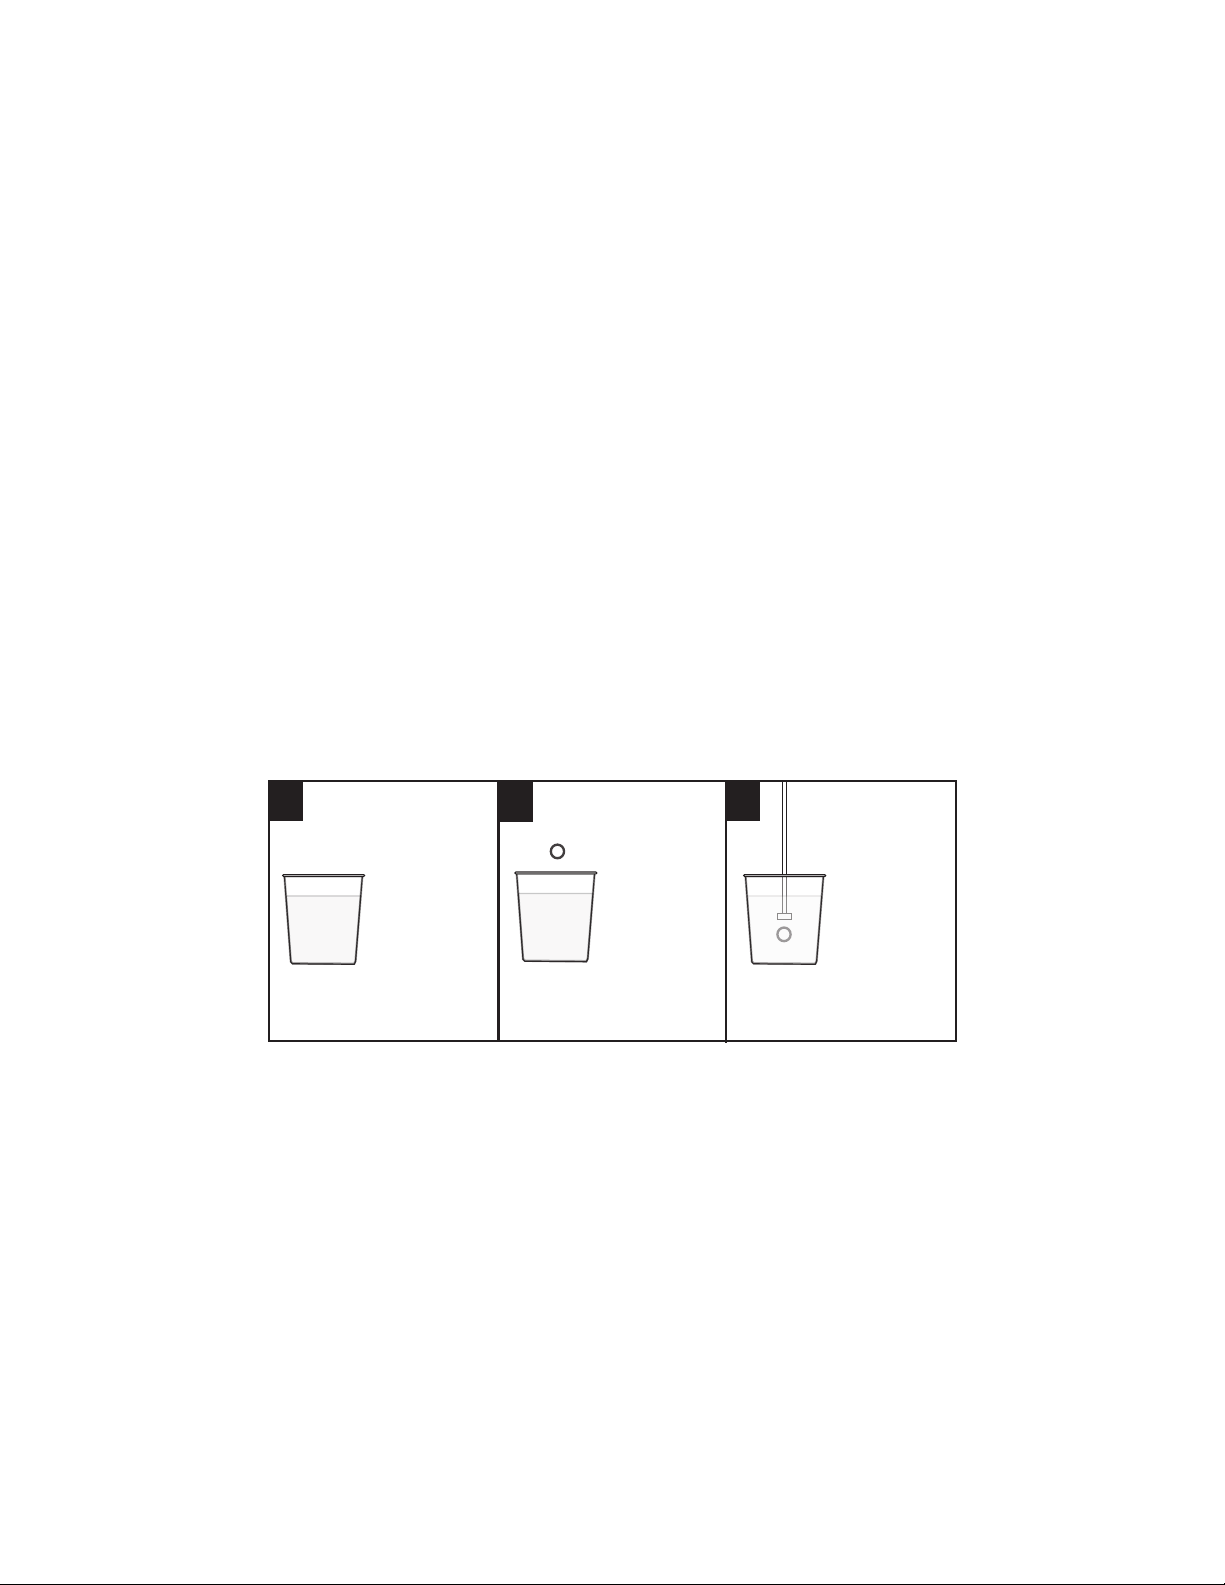
MEASUREMENT
For small samples ll
1
a sample cup to the
20 mL line with the
test sample.
Sample depth
must be
greater than
or equal to 1.5
inches.
4
Slowly stir the
sample with
the TRACER
MODE
CAL
to remove air
ON
OFF
bubbles.
2
MODE
CAL
ON
OFF
5
The reading will
ash until it has
stabilized. This may
take
several seconds
depending on the
buffer capacity
sample.
13
Press the
ON/OFF
button.
of the
3
CAL
MODE
CAL
ON
OFF
6
Rinse the electrode
in distilled water.
Replace the cap.
Immerse the
TRACER in
the sample.
Make sure
the electrode
is completely
submersed.
Find Quality Products Online at: sales@GlobalTestSupply.com
www.GlobalTestSupply.com
Page 14

KIT CONTENTS
Quantity Contents Code
50
30 mL
10 g
60 mL
2 x 100 mL
60 g
3 x 100 mL
100 mL
20
20
20
1
1
1
1
1
2
6
1
1
1
1
1
1
1
1
1
1
1
*WARNING: Reagents marked with an * are considered to be potential health hazards. To view or
Chlorine DPD #4R Tablets 6899A-H
*Copper 1 *6446-G
Aminoantipyrine Reagent 7825-D
*Ammonium Hydroxide Solution *7826-H
Potassium Ferricyanide Solution 7827-J
*Detergent Reagent #1 *7444-H
*Detergent Reagent #2 *6037-J
*Detergent Reagent #3 *7445-J
pH 4.0 MiniBuer Tablets
pH 7.0 MiniBuer Tablets
pH 10.0 MiniBuer Tablets
----
----
----
Spoon, 0.1 g 0699
Spoon, 1.0 g 0697
Pipet, plain, glass, w/cap 0344
Pipet Assembly, 1.0 mL, plastic, w/cap 0330
Pipet Assembly, 0.5 mL, glass, w/cap 0335
Test Tubes, 2.5–10 mL, plastic, w/caps, with line 0106-WL
Test Tubes, 2.5–5–10 mL, plastic, w/caps 0106
Sample Reaction Tube, glass 0837
Bottle, French, calibrated to 65 & 75 mL 0800
Sample Cup, 20 mL, plastic
----
Tablet Crusher 0175
Test Tube Brush 0514
Chlorine Octa-Slide 2 Bar, 0.2–3.0 ppm 3401-01
Copper Octa-Slide 2 Bar, 0–4.0 ppm 3435-01
Phenols Octa-Slide 2 Bar, 0–5 ppm 3434-01
Turbidity Octa-Slide 2 Bar, Low-Med-High 3436-01
Octa-Slide Viewer 1101
TRACER, pH ----
14
Find Quality Products Online at: sales@GlobalTestSupply.com
www.GlobalTestSupply.com
 Loading...