

Page 1

Quick Manual
DIGITAL POWER METER
KEW 6305
www.GlobalTestSupply.com
Page 2

− 1 −
KEW6305
KEW6305
Preface
● Preface
This Quick manual is a simplified version of the full instruction manual which can be found in the supplied
CD-ROM. This manual is intended only as a handy reference guide and should only be used
after having read the full instruction manual which contains full details on each function of this
instrument and the items contained in the package.
● Precautions
The instruction manual (full manual) contains warnings and safety procedures which have to be
observed to ensure safe operation of the instrument and maintain it in a safe condition. Thus,
these operating instructions have to be read prior to using the instrument.
Contents
1. Instrument Overview ······························································································································2
2. Instrument Layout ··································································································································4
3. Preparations ··········································································································································· 7
4. Set-up:
5. Measurement Ranges ·························································································································13
6. Instantaneous value Measurement:
7. Integration value Measurement:
8. Demand Measurement:
9. SD card/ Saved data ··························································································································24
10. Wiring check:
11. Data check:
Range ······················································································································ 9
SET UP
Range···············································································14
W
Wh
Range ···················································································18
DEMAND
WIRING CHECK
DATA CHECK
Range ·······················································································21
Range··························································································27
Range ···································································································29
The latest software can be downloaded from our web site.
http://www.kew-ltd.co.jp
www.GlobalTestSupply.com
Page 3

− 2 −
KEW6305
KEW6305
Instrument Overview
1. Instrument Overview
Features
This is a digital Power meter that can be used for various wiring systems and can measure up to 3
systems on single-phase 2-wire circuit. That is, this instrument does the jobs of three just by one. It can be
used for measurements of instantaneous, integration and also demand values.
Measured data can be saved in SD card or the internal memory, and the data can be t
USB. Measured data can be checked on android devices in real-time by using Bluetooth function.
Safety construction
Designed to meet the international safety standard IEC 61010-1 CAT.III 600V
Wiring configration
KEW6305 supports: Single-phase 2-wire, Single-phase 3-wire, Three-phase 3-wire and Three-phase
4-wire
Measurement and calculation
KEW6305 measures voltage (RMS), current (RMS), active power, frequency and calculates reactive/
apparent power, power factor, neutral current (Three-phase 4-wire only) and active/ reactive/
apparent energy.
Demand measurement
Electricity consumption can be easily monitored so as not to exceed the target maximum demand
values.
Saving data
Instantaneous values can be saved every time pressing the
values can be saved for various periods from 1 second up to 1 hour. The maximum, minimum and
average values of instantaneous values during each cycle can also be saved.
Dual power supply system
KEW6305 operates either with an AC power supply or with batteries. In the event of interruption,
while operating with an AC power supply, power to the instrument is automatically restored by the
batteries in the instrument.
Large display
Up to 3 measured items can be displayed on the large screen simultaneously.
(e.g. voltage, current and active power)
Backlight
Backlight to facilitate working in dimly illuminated areas
Light & compact design
Clamp sensor type, compact and light weight design
W
Key. Integration and demand
SAVE
ransmitted to PC via
Application
Data in the internal memory and in SD card can be transferred to PC using USB connection or SD
slot. The supplied PC software application enables easy settings of the instrument and analysis
of the saved data from PC, moreover, can synchronize recording intervals and internal clocks of
two KEW6305 to perform synchronous measurement. Measured data can be checked on android
devices in r
eal-time via Bluetooth communication.
www.GlobalTestSupply.com
Page 4

− 3 −
KEW6305
KEW6305
Functional Overview
Functional Overview
SET UP
Configures KEW6305 and makes settings for
measurements.
WIRING CHECK
Performs a check for proper connection.
(Section 10) “Wiring check”
See
for further details.
[W] Instantaneous value measurement
Measures average, max, min values of instantaneous
values of current, voltage and electric power.
(Section 6) “Instantaneous value measurement”
See
for further details.
[Wh] Integration value measurement
Measures active/apparent/reactive powers on
each CH.
(Section 7) “Integration value measurement”
See
for further details.
DATA CHECK
Displays the saved data on the LCD.
(Section 11) “Data Check”
See
details.
fo r further
[DEMAND] Demand value measurement
Measures demand values based on the preset
target values.
(Section 8) “Demand measurement”
See
further details.
for
www.GlobalTestSupply.com
Page 5

− 4 −
KEW6305
KEW6305
2. Instrument Layout
Front view
Instrument Layout
Status indicator LED
Light up: Recording&
Measuring
Green
Blink: Stand-by
Red Light up: Recording error
Display
(LCD)
Keys
START/ STOP
Start/stop integration &
START
/STOP
demand measurements
Backlight
Turn on/off the LCD
backlight
Cursor
Select settings,
switch screens
ENTER
Confirm entries
ENTER
Key
Key
Key
Key
Function Switch
Power on/ off, select
Measurement range.
DATA
HOLD
W SAVE
Save measured
W
SAVE
instantaneous values
Freeze the readings on the LCD.
* Measurement is being performed while the readings are
being fixed.
A long press (2 sec or longer) disables all Keys (except for
Backlight Key) to prevent operational errors in recording.
Another long press (2 sec or longer) can restore the disabled
Keys.
Key
DATA HOLD
/
ESC
KEY LOCK
ESC
RESET
/
Cancel setting change
or cle ar i nt egratio n/
demand data selected
Cursor
with
Key
Key
Key
www.GlobalTestSupply.com
Page 6

− 5 −
KEW6305
KEW6305
Connector
SD Card Cover
USB Port Cover
SD Card Slot
USB Port
SD Memory Card
Voltage Input Terminal
(VN, V1, V2, V3)
Power Connector
Current Input Terminal
(A1, A2, A3)
Terminal Cover
< When the Connector Cover is opened >
< When the Connector Cover is closed >
Units
Phase No.
Wiring system
Voltage range
Current range
Connector
Side face
Symbols displayed on the LCD
< All symbols >
www.GlobalTestSupply.com
Page 7

− 6 −
KEW6305
KEW6305
< Symbols appear to show the state of the instrument or measurement >
Symbol Description
Keys are being locked.
Preset voltage value is exceeded.
Preset current value is exceeded.
Operating with AC power supply.
Operating with batteries.
Data hold function is active.
SET UP Range is selected.
WIRING CHECK Range is selected.
Blinks while instantaneous value is being displayed on the LCD.
Blinks while integration value is being displayed on the LCD.
Blinks while demand value is being displayed on the LCD.
Capacity of SD card or internal memory is full.
DATA CHECK Range is selected.
Data can be saved in the SD card.
* Blinks while saving data.
USB cord is connected to the terminal.
* Blinks during data communication.
Using Bluetooth communication.
Data can be saved in the internal memory.
* Blinks while accessing to the memory.
VT ratio is set to other than 1.
Symbols displayed on the LCD
CT ratio is set to other than 1.
www.GlobalTestSupply.com
Page 8

− 7 −
KEW6305
KEW6305
Preparations
3. Preparations
Battery
KEW6305 operates either an AC power supply or batteries. Capable of performing measurements in an
event of AC power interruption, power to the instrument is automatically restored by the batteries installed
in the instrument. Size AA alkaline dry-cell batteries (LR6) can be used.
If an AC power supply is interrupted and batteries have not been installed, the instr
off and the measuring data may be lost.
Indication on screen
Symbol of power supply displayed on each measurement screen changes as follows.
< During AC power supply operation > < During battery operation >
AC power supply symbol ( ) appears. Battery symbol ( ) appears.
● Battery condition
Battery symbol changes as follows depending on battery condition.
Battery operating time
For approx. 15 hours, with new alkaline batteries.
* It is reference time and will be shortened if using the backlight or
Bluetooth function.
ument will be powered
Batteries are exhausted.
(Accuracy of readings cannot be guaranteed.)
Depending on the states of measurement, instrument operates as
follows automatically.
* while saving instantaneous value data (Files are opened.)
-> Close the open files. (Data will be saved.)
* while measuring integration/ demand values
-> Force-quit measurements. (Data will be saved.)
How to install batteries
Install batteries in correct polarity as marked inside.
Remove all the batteries if the instrument is to be stored and will not be in use for a long period.
www.GlobalTestSupply.com
Page 9

− 8 −
KEW6305
KEW6305
Match the
arrow marks.
Rated supply voltage : 100 - 240VAC(±10%)
Rated supply frequency : 45 - 65Hz
Max power consumption : 10VAmax
Voltage test lead
Power cord
Clamp sensor
Error No. (001 – 063)
Cord connection
Cord connection
Start-up screen
KEW6305 will be powered on when setting the Function switch to any position other than OFF.
All of the LCD segments will be displayed first, and then model name with version information.
After that, stand-by screen for the selected range will be displayed.
Upon powering on the instrument, self-check routine initiates automatically. Stop using the instrument if
error message appear on the LCD after self-check and refer to
instruction manual.
www.GlobalTestSupply.com
(Section 15) Troubleshooting
in the full
Page 10

− 9 −
KEW6305
KEW6305
Set-up:
SET UP
Range
4. Set-up:
Set the Function switch to
Settings listed below can be changed. (27 items in total)
List of setting items
Setting Setting no./ item Symbol Details
Basic
setting
Time&
Buzzer
Measure-
ment
SET UP Range
SET UP
Range for making various settings.
01 Wiring system
02 Voltage range
03 Clamp sensor
04 Current range -
05 VT ratio
06 CT ratio
07 Date and time
08 Buzzer
09 Recording interval
10 Specific time period
rec. or endless rec.
*1
Time period setting
11
Time setting
*1
12
Time period setting
Date setting
*2
Start of continuous
13
measurement
*2
End of continuous
14
measurement
15 Target demand
16 Demand measure ment cycle
17 Demand warning
cycle
*1 : Setting 11& 12 can be changed only when Setting 10 has been set to ON.
*2 : Setting 13& 14 can be changed only when Setting 10 has been set to OFF.
1P 2W (1ch) / 1P2 W(2ch )/ 1 P2 W(3ch )/
1P3W/ 3P3W/ 3P3W3A/ 3P4W
150/ 300/ 600V
50/ 100/ 200/ 500/ 1000/ 3000A type
03
Sensor
50A 1/5/10/25/50A/AUTO
100A 2/10/20/50/100A/AUTO
200A 4/20/40/100/200A/AUTO
500A 10/50/100/250/500A/AUTO
1000A 20/100/200/500/1000A/AUTO
3000A 300/1000/3000A
0.01 - 9999.99 (can be set by 0.01)
0.01 - 9999.99 (can be set by 0.01)
Year:Month:Day:Hour:Minute:Second
ON / OFF
1/ 2/ 5/ 10/ 15/ 20/ 30 sec./
1/ 2/ 5/ 10/ 15/ 20/ 30 min./ 1 hour
ON: Specifying start/ stop time
(repeatedly recorded)
OFF : Record the data continuously
Start and stop time
(Year:Month:Day:Hour:Minute:Second)
Year:Month:Day:Hour:Minute:Second
Year:Month:Day:Hour:Minute:Second
Year:Month:Day:Hour:Minute:Second
Value : 0.1 - 999.9
Unit: W/kW/MW/GW/VA/kVA/MVA/GVA
NO/ 10/ 15/ 30 min
* Demand measurement will not be
performed when NO has been
selected.
1/2/5 min. when measurement cycle is
10or15 min., 1/2/5/10/15 min. when
measurement cycle is 30 min.
Range
www.GlobalTestSupply.com
Page 11

− 10 −
KEW6305
KEW6305
Setting Setting no./ item Symbol Details
SD card/
Internal
memory
Others
18 Av ailab le s pace in
SD card
19 SD card Format
20 Av ailab le s pace in
Internal memory
21 I n t e r n a l m e m or y
Format
22 System reset
23 ID number - Designate ID no. (00-001 - 99-999)
24 Setting read
25 Setting save
26 Bluetooth
27 V / A Rang e Auto -
switching
Show the available space in the installed
SD card in percentage.
ON(Format)/ OFF(Not format)
Show the available space in the internal
memory in percentage.
ON(Format)/ OFF(Not format)
ON(Reset)/ OFF(Not reset)
Save no.: 01 - 20
Save no.: 01 - 20
ON/ OFF
ON/ OFF
Set-up:
SET UP
Range
www.GlobalTestSupply.com
Page 12
− 11 −
KEW6305
KEW6305
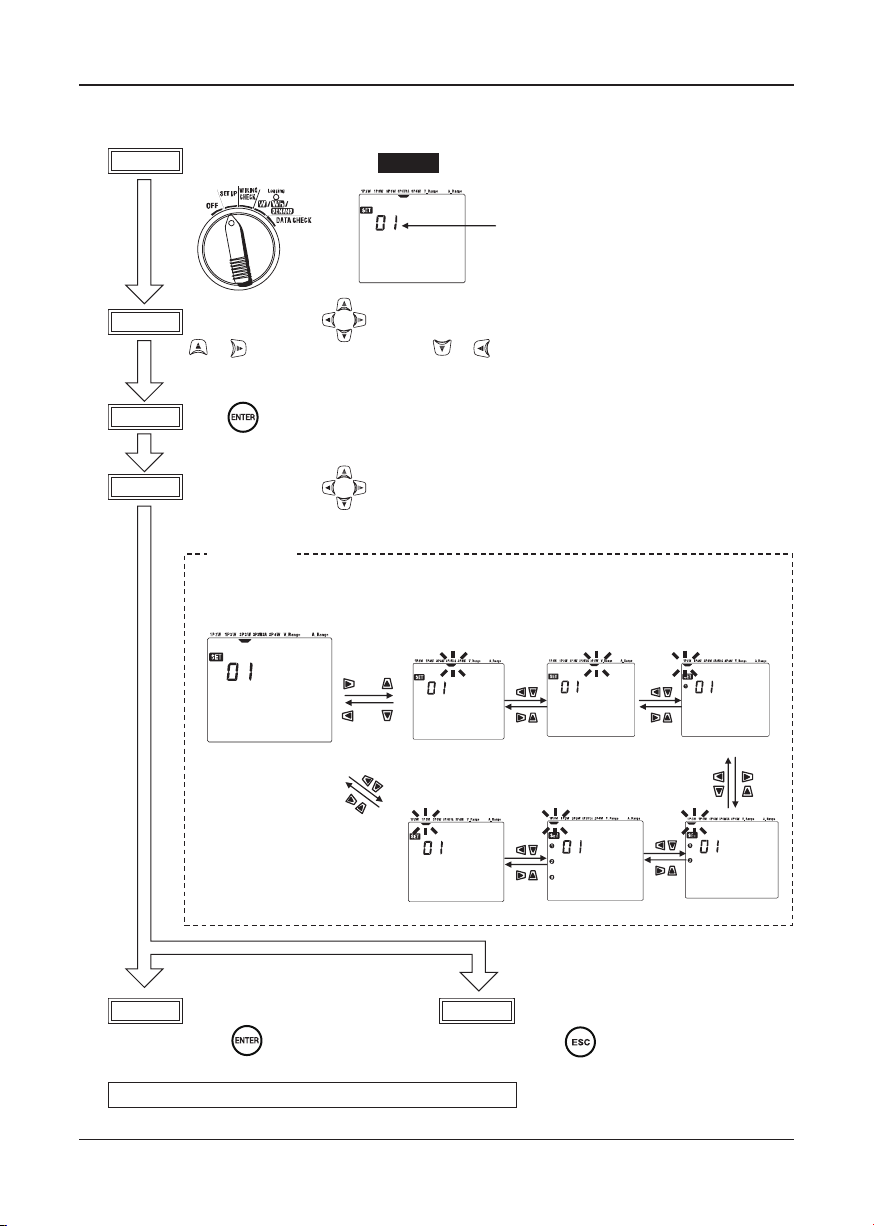
Setting procedure
Item no.
Set-up screen
3P3W (default setting)
3P4W 1P2W(1ch)
1P3W 1P2W(3ch)
1P2W(2ch)
< Example >
3P3W3A
or
or
Setting no. “01”, Setting Item “Wiring system”:
Setting: Select any one of 1P2W(1ch)/1P2W(2ch)/1P2W(3ch)/1P3W/3P3W/3P3W3A/3P4W.
4-1. Setting procedure
STEP1
Set the Function Switch to
STEP2
Use the Cursor keys and switch the Setting items with Setting no. 01 to 27.
(Up) (Right)
STEP3
Press on the desired Setting no..
for increasing numbers,
(corresponding setting item starts blinking and enters into the setting change mode.)
STEP4
Use the Cursor keys and change settings.
Range. (to show the Set-up screen)
SET UP
for decreasing numbers.
(Left) (Down)
STEP5
(Press .) (Press .)
Confirm the changed setting.
STEP5
Cancel the change.
Setting completes. Go to STEP 2 for the other settings.
www.GlobalTestSupply.com
Page 13

− 12 −
KEW6305
KEW6305
Orientation of Clamp sensor
Power
supply
Arrow mark:
Point towards
load side
Load
Reverse clamping switches the symbols (+/-)
for active power (P).
1P3W
A1
V1
VN
V2
L1
N
L2
L1
L1
N
L2
Load
1
1P3W
A2
A2
L
N
L
N
L
N
L
N
A1
V1
VN
A3
Load
1
Load
2
Load
3
1P2W(2ch)
1P2W(3ch)
1P2W(1ch)
Power
supply
Power
supply
V2
A3
V1
V3
A1
A2
L1(R)
L1(R)
L2(S)
L3(T)
Load
3P3W
3P3W3A
VN
V2
V1
A1
A2
L1(R)
L2(S)
L3(T)
L1(R)
L2(S)
L3(T)
Load
1
3P3W
3P3W
Power
supply
Power
supply
V3
3P4W
VN
V2
A3
V1
A1
A2
L1(R)
L2(S)
N
L1(R)
L2(S)
L3(T)
N
Load
3P4W
Power
supply
L3(T)
L3(T)
L2(S)
4-2. Wiring system
Wiring system
www.GlobalTestSupply.com
Page 14

− 13 −
KEW6305
KEW6305
Measurement Ranges
5. Measurement Ranges
KEW6305 can perform the following three different measurements.
(a) Instantaneous value measurement (W Range)
(b) Integration value measurement (Wh Range)
(c) Demand measurement (DEMAND Range)
Select a desirable Range according to the steps below.
1. Set the Function Switch to
Set the switch to W/ Wh/ DEMAND position.
2. Select a Range
Any one of following symbols blinks on the LCD to show which Range has been selected.
e.g.: When Wh Range is selected, symbol blinks.
(a) Selecting W Range
(1) Use the Keys and select the W symbol on the LCD.
(2) Then use the Keys to switch screens (1- 3) to be displayed.
Screen 1 - symbol blinks on the top
Screen 2
Screen 3
(b) Selecting
(1) Use the Keys and select the symbol while the Function switch is at the W
(2) Press the Keys and select the Wh or DEMAND Range.
(Selecting either Wh or DEMAND Range is impossible unless symbol is not selected.)
(3) Use the Keys and switch the displayed contents.
Wh or DEMAND Range
Range position.
W/ Wh/ DEMAND Range.
- symbol blinks on the middle
- symbol blinks on the bottom
www.GlobalTestSupply.com
Page 15

− 14 −
KEW6305
KEW6305
Instantaneous value Measurement:
W
Range
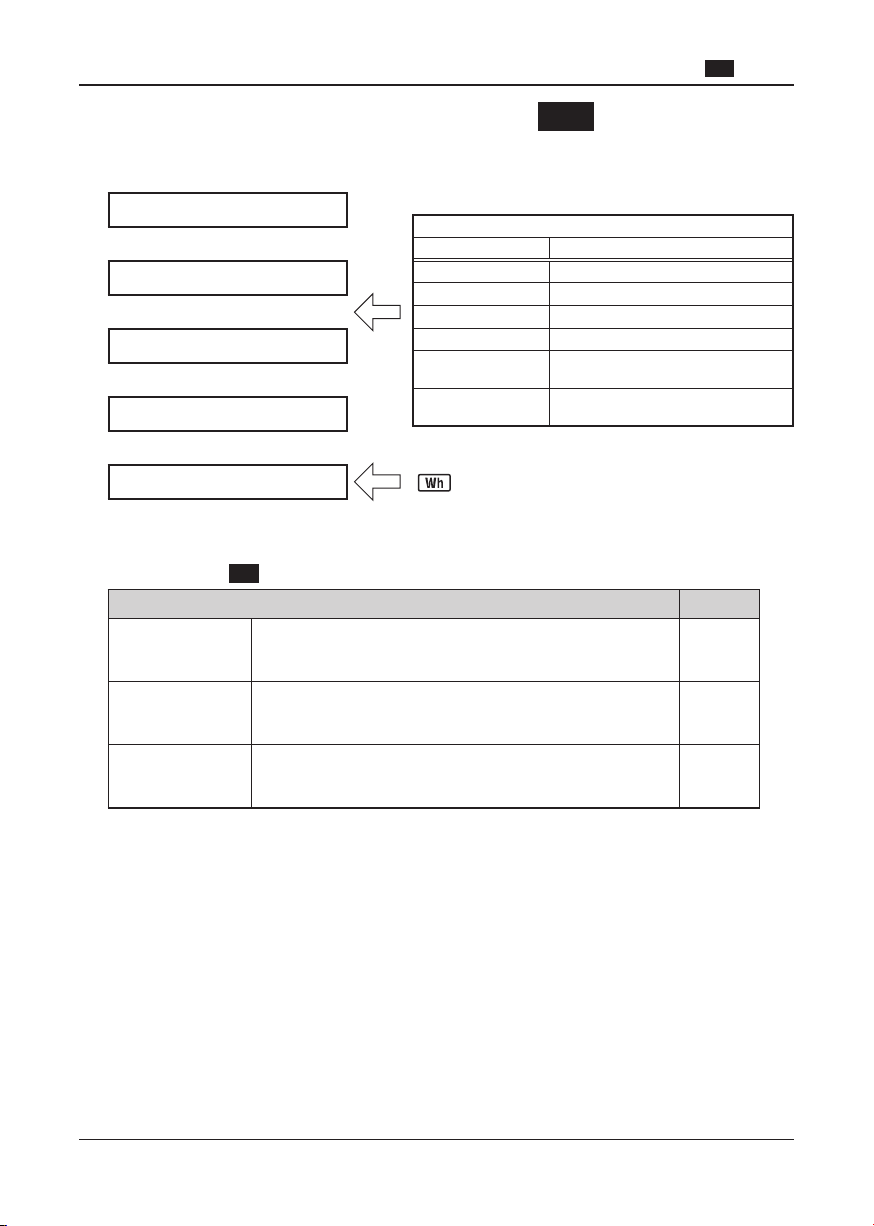
6. Instantaneous value Measurement:
W Range
6-1. Steps for measurement
Ensuring your safety
↓
Preparation for measurement
↓
Setting
↓
Wiring
↓
Instantaneous value measurement
● Parameters for
Voltage
(RMS)
Current
(RMS)
Active
power
Reactive
power
Apparent
power
Power
factor
Frequency f : frequency of V1 Hz
Neutral
current
W Range
Parameters to be displayed on the LCD Unit
V : average voltage of each phase
Vi : voltage of each phase
A : average current of each phase
Ai : current of each phase
P : total active power Pi : active power of each phase
Polarity :+ (no sign) consumption
- (minus) regenerating
Q : total reactive power Qi : reactive power of each phase
Polarity :+ (no
- (minus) leading phase
S : total apparent power Si: apparent power of each phase VA
PF : power factor of whole system PFi : power factor of each phase
Polarity :+ (no sign) lagging phase
- (minus) leading phase
In : current on neutral line (3P4W only) An
sign) lagging phase
Basic setting Measurement setting
Setting 01 Wiring system
Setting 02 Voltage range
Setting 03 Clamp sensor
Setting 04 Current range
Setting 05 VT ratio (if necessary)
Setting 06 CT ratio (if necessary)
Range
SET UP Range
* i = 1, 2, 3
V
A
W
Var
PF
www.GlobalTestSupply.com
Page 16

− 15 −
KEW6305
KEW6305
Selecting/switching display contents
Top : V
Middle : A
Bottom : P
6-2. Selecting/switching display contents
Three parameters (max) can be displayed in one screen. (In the example 1-A below, V, A and P are
displayed.) Display screen will be different depending on wiring systems.
● e.g. For Three-phase 4-wire 3P4W (16 screens):
Screen 1-A
A B C D E F G H
1
(Screen) (1-A) (1-B) (1-C) (1-D)
Top
Middle
Blink
Bottom
2
(Screen) (2-A) (2-B) (2-C) (2-D)
Top
Middle
Blink
Bottom
3
(Screen) (3-A) (3-B) (3-C) (3-D) (3-E) (3-F) (3-G) (3-H)
Top
Middle
Blink
Bottom
PF
V1
V2
V3
V1
V
A1
A
P1
P
P1
P
S1
S
PF2
PF1
A1
A2
A3
V2
A2
P2
P2
S2
P1
P2
P3
V3
A3
P3
P3
S3
PF3
PF1
PF2
PF3
− − −
− − −
Q1
S1
Q2
S2
Q3
S3
f
In
−
VL12
VL23
VL31
* Screen 1-A is displayed after powering on the instrument.
* Use
or Key to switch screens listed above in a horizontal direction.
(from 1-A to 1-D, 2-A to 2-D and 3-A to 3-G)
* Use
or Key to switch screens listed above in a vertical direction. (from 1-A to 3-A only)
On any of screens 1-B to 1-D, press
On any of screens 2-B to 2-D, press
On any of screens 3-B to 3-G, press
* Phase no.❶,❷,❸ will be displayed on the LCD.
(e.g.: On screen 1-B, only one Phase no. symbol ❶ is displayed and on screen 3-A all Phase no.
symbols ❶,❷,❸ are displayed. However, none of them is displayed on screen 1-A, 2-A and 3-G.)
* Screen 3-A shows Phase voltage and Screen 3-H Line voltage.
to switch screen to 3-A or to switch screen to 2-A.
to switch screen to 1-A or to switch screen to 3-A.
to switch screen to 2-A or to switch screen to 1-A.
www.GlobalTestSupply.com
Page 17

− 16 −
KEW6305
KEW6305
Selecting/ switching display contents
● For the other wiring systems:
Screens can be switched in the same way as described in the previous page.
WIRING Screen A B C D E F G
3P3W3A
3P3W
1P3W
1P2W (3ch)
1P2W (2ch)
1P2W (1ch)
Top V(avg) V1 V2 V3
1
Bottom P P1 P2 P3
Top P P1 P2 P3
2
Bottom PF PF1 PF2 PF3
Top V1 A1 P1 PF1 S1 Q1 f
3
Middle V2 A2 P2 PF2 S2 Q2 −
Bottom V3 A3 P3 PF3 S3 Q3 −
Top V(avg) V1 V2
1
Bottom P P1 P2
Top P P1 P2
2
Bottom PF PF1 PF2
Top V1 A1 P1 PF1 S1 Q1 f
3
Middle V2 A2 P2 PF2 S2 Q2 −
Bottom − − − − − − −
Top V(avg) V1 V2
1
Bottom P P1 P2
Top P P1 P2
2
Bottom PF PF1 P
Top V1 A1 P1 PF1 S1 Q1 f
3
Middle V2 A2 P2 PF2 S2 Q2 −
Bottom − − − − − − −
Top V V V V
1
Bottom P P1 P2 P3
Top P P1 P2 P3
2
Bottom PF PF1 PF2 PF3
Top V1 A1 P1 PF1 S1 Q1 f
3
Middle − A2 P2 PF2 S2 Q2 −
Bottom − A3 P3 PF3 S3 Q3 −
Top V V V
1
Bottom P P1 P2
Top P P1 P2
2
Bottom PF PF1 PF2
Top V1 A1 P1 PF1 S1 Q1 f
3
Middle − A2 P2 PF2 S2 Q2 −
Bottom − − − − − − −
Top V
1
Bottom P
Top P
2
Bottom
Top V A P PF S Q f
3
Middle − − − − − − −
Bottom − − − − − − −
PF
− − − − − −Middle A
− − − − − −Middle S
F2
− − −Middle A(avg) A1 A2 A3
− − −Middle S S1 S2 S3
− − − −Middle A(avg) A1 A2
− − − −Middle S S1 S2
− − − −Middle A(avg) A1 A2
− − − −Middle S S1 S2
− − −Middle A(avg) A1 A2 A3
− − −Middle S S1 S2 S3
− − − −Middle A(avg) A1 A2
− − − −Middle S S1 S2
www.GlobalTestSupply.com
Page 18
− 17 −
KEW6305
KEW6305
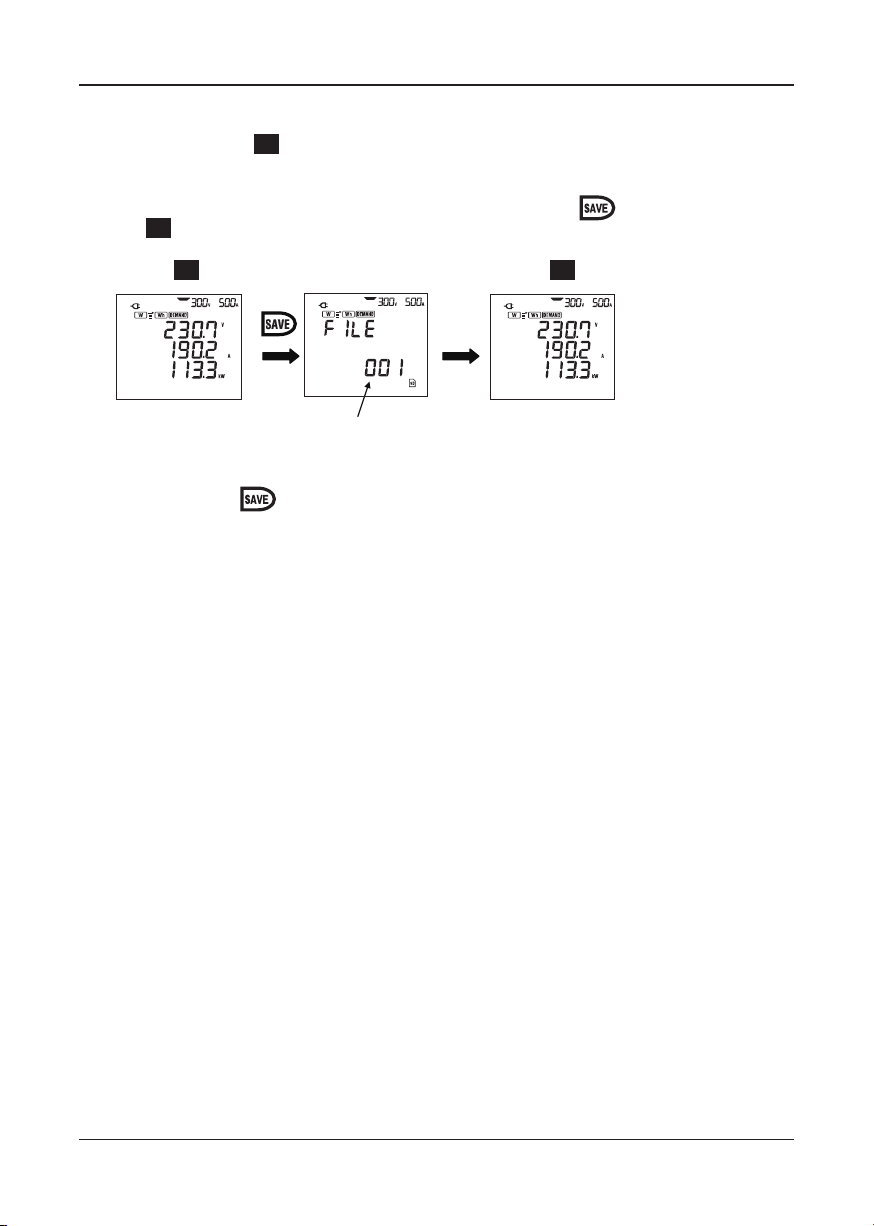
Data saving
File no.
6-3. Data saving
Instantaneous values ( W Range) can be saved by manual operation only.
[Saving procedure]
(1) File no. screen is displayed and data will be saved when pressing the
at
W Range.
Screen at W Range File no. screen Screen at W Range
Key during a measurement
(2) Another press of
(In this case, File no. is not displayed but the buzzer sounds like pi.)
Key saves another data in the preceding file.
www.GlobalTestSupply.com
Page 19
− 18 −
KEW6305
KEW6305
Integration value measurement:
Wh
Range
7. Integration value Measurement:
7-1. Steps for measurement
Ensuring your safety
↓
Preparation for measurement
↓
Setting
↓
Wiring
↓
Integration value measurement
● Parameters for
Active
energy
(consumption)
Apparent
energy
(consumption)
Integration
elapsed time
Wh Range
Parameters to be displayed on the LCD Unit
WP : Total active energy
WP1/WP2/WP3 : Active energy of each phase
WS : Total apparent energy
WS1/WS2/WS3 : Apparent energy of each phase
TIME : Hour; Min.; Sec.
Hour; Min.
Hour
Basic Setting Measurement setting
Setting 01 Wiring systemSetting 09 Recording interval
Setting 02 Voltage range
Setting 03 Clamp sensor Setting 11 Time period setting Time setting
Setting 04 Current range Setting 12 Time period setting Date setting
Setting 05 VT ratio
Setting 06 CT ratio
(if necessary)
(if necessary)
Range
Wh Range
SET UP Range
Setting 10 Specifying rec. period or endless rec.
Setting 13 Start of continuous measurement
Setting 14 End of continuous measurement
Wh
VAh
---
www.GlobalTestSupply.com
Page 20

− 19 −
KEW6305
KEW6305
How to start/ stop measurement
Start measurement
LED
LED blinks
Stand-by
mode
LED lights up
7-2. How to start/ stop measurement
● To start/ stop measurement manually ● To start/ stop measurement at the preset date&time
Ho ld down the
over 2 sec.
START
Key for
/STOP
Wh Range
File no. screen is displayed for about 2 sec.
- Manual operation : Pressing the
- Automatic operation : KEW6305 enters into stand-by mode and wait until the
The Status indicator LED blinks when the instrument is in stand-by mode and it
stays on when measurement starts.
Configure the settings for Setting 10/
START
11/12, and then press the
START
Key starts measurement anytime.
/STOP
/STOP
Key.
preset start time comes.
Measuring
* Display is updated every 1 sec.
* Data will be saved at the interval selected at Setting 09.
* While performing measurement, select the
instantaneous values and the
SET UP Range to check the
details of settings.
Stop measurement
Manual operation
Hold down the
START
/STOP
2 sec.
Key for over
Automatic operation
Measurement stops automatically
when the preset date& time comes.
The status indicator LED goes off when measurement stops (or file is closed).
* When the destination to save data has been set to the internal memory,
on the screen instead of
Integration values remain displayed on the LCD when measurement ends.
Press the
be used in further measurements.
ESC
Key at least 2 sec to select dEL and clear the display if the displayed values will not
symbol.
www.GlobalTestSupply.com
W Range to view
symbol is displayed
Page 21

− 20 −
KEW6305
KEW6305
Screen1 Screen2
Screen3 Screen4
Integration interval
Energy
Elapsed time
Data saving
Start of integration
(Manual/ automatic operation)
Energy to be saved.
0
End of integration
(Manual/ automatic operation)
7-3. How to switch screens/ save data
● Screens and switching method
< e.g. Three-phase 4-wire 3P4W >
<For the other wiring systems>
Wiring system (Setting 01) Displayed at
Top
* Single-phase 2-wire (1ch) 1P2W(1ch)
* Single-phase 2-wire (2ch)
* Single-phase 3-wire
* Three-phase 3-wire
* Three -phase 3-wire 3A
* Single-phase 2-wire (3ch)
* Three -phase 4-wire
1P2W(2ch)
1P3W
3P3W
3P3W3A
1P2W(3ch)
3P4W
Middle
Bottom
Top
Middle
Bottom
Top
Middle
Bottom
How to switch screens/ save data
Parameters to be displayed
Screen 1 Screen 2 Screen 3 Screen 4
TIME
WP
− − −
WS
TIME
WP
WS
TIME
W
WS
TIME
WP1
WS1
TIME
P
WP1
WS1
TIME
WP2
WS2
TIME
WP2
WS2
−
TIME
WP3
WS3
● Saving data (Data will be saved automatically.)
www.GlobalTestSupply.com
Page 22

− 21 −
KEW6305
KEW6305
Demand Measurement :
DEMAND
Range
8. Demand Measurement :
DEMAND Range
8-1. Steps for measurement
Ensuring your safety
↓
Preparation for measurement
↓
Setting
↓
Wiring
↓
Demand measurement
* Measured demand values will be displayed on the LCD at the start of measurement.
● Parameters for
Parameters to be displayed on the LCD Unit
Target value W
Predicted value W
Present value W
Load factor %
Demand time −
Max. demand value W
When max. demand value measured −
DEMAND
Range
Basic Setting Measurement setting
Setting 01 Wiring systemSetting 09 Recording interval
Setting 02 Voltage range
Setting 03 Clamp sensor Setting 11 Time period setting Time setting
Setting 04 Current range Setting 12 Time period setting Date setting
Setting 05 VT ratio
Setting 06 CT ratio
(if necessary)
(if necessary)
Range
SET UP Range
Setting 10 Specifying rec. period or endless rec.
Setting 13 Start of continuous measurement
Setting 14 End of continuous measurement
Setting 15 Target demand
Setting 16 Demand measurement cycle
Setting 17 Demand warning cycle
www.GlobalTestSupply.com
Page 23

− 22 −
KEW6305
KEW6305
Start measurement
LED
LED blinks
Stand-by
mode
LED lights up
How to start/ stop measurement
8-2. How to start/ stop measurement
● To start/ stop measurement manually ● To start/ stop measurement at the preset date&time
Ho ld down the
over 2 sec.
START
/STOP
Key for
DEMAND
Range
File no. screen is displayed for about 2 sec.
- Manual operation : Pressing the
- Automatic operation : KEW6305 enters into stand-by mode and wait until the
preset start time comes.
The Status indicator LED blinks when the instrument is in stand-by mode and it
stays on when measurement starts.
Co nf ig ure the s et ti ngs fo r S etting
14/15, and then press the
START
Key starts measurement anytime.
/STOP
START
/STOP
Key.
Measuring
* Display is updated every 1 sec.
* Data will be saved at the interval selected at Setting 13.
* Buzzer sounds when a predicted value exceeds a target value set
at Setting 15 in the pre-set period set at Setting 17.
* While performing measurement, select the W Range to view
instantaneous values, Wh Range to view integration values and
SET UP Range to check the details of settings.
Stop measurement
Manual operation
Hold down the
START
/STOP
2 sec.
Key for over
Automatic operation
Measurement stops automatically
when the preset date& time comes.
The status indicator LED goes off when measurement stops (or file is closed).
* When the destination to save data has been set to the internal memory,
on the screen instead of symbol.
Integration values remain displayed on the LCD when measurement ends.
Press the
be used in further measurements.
ESC
Key at least 2 sec to select dEL and clear the display if the displayed values will not
www.GlobalTestSupply.com
symbol is displayed
Page 24

− 23 −
KEW6305
KEW6305
Screens/ saving data
(W)
* Load factor (%) = Present value/ Target value*100
Demand interval
Inspection
cycle
Inspection
cycle
: Target value
: Predicted value
: Present value
: Buzzer sounds and
Backlight lights up
: Demand value (Present value)
: Demand value (Present value)
: Max demand value
(displayed on the LCD)
● : Data saving
○ : Demand value to be saved
Elapsed time
0
Demand value (W) Demand interval
8-3. Screens/ saving data
● Parameters displayed on screens and switching method
Screen 1 Screen 2 Screen 3
Top : Target value Top : Demand time Top : Date when max. demand value measured
Middle : Predicted value Middle : Load factor Middle : Time when max. demand value measured
Bottom : Present value Bottom : Present value Bottom : Max. demand value
● Saving data (Data will be saved automatically.)
<
Demand measurement with this instrument >
< Max demand value and data saving point >
www.GlobalTestSupply.com
Page 25

− 24 −
KEW6305
KEW6305
File name :
5 O – 0 0 1 . KEW
1: Manual saving
2: Auto-saving (using Timer function)
Fixed no.
SD: SD card
ME: Internal memory
File no. (001 – 999)
SD card/ Saved data
9. SD card/ Saved data
9-1. SD card compatibility
This instrument supports 1/ 2Gbyte SD cards.
● Max number of saved data
Destination to save data SD card Internal memory
Capacity 1GB 2GB 3MB
approx. 3.3 million results approx. 6.7 million results approx. 10,000 results
Manual saving (
Auto-saving
at preset interval
Max number of file 511 4
* In case that no file has been contained in SD card.
● File name
File name is assigned automatically.
W )
1 sec approx. 8 days approx. 17 days approx. 33 min.
1 min approx. 16 months approx. 33 months approx. 33 hours
30 min 3 years or more approx. 42 days
www.GlobalTestSupply.com
Page 26

− 25 −
KEW6305
KEW6305
Parameters to be saved
● Parameters to be saved
The table below shows the parameters to be saved corresponding to each measurement range.
(Parameters to be saved are different depending on wiring systems.)
Manual saving : parameters in column 1 only
(except for max/ min/ avg of each parameter)
Auto-saving : all parameters in column 1 & 2
Parameters to be saved
Voltage
(RMS)
Current
(RMS)
Active power
Reactive power
1
Apparent power
Power factor
Frequency
Active energy
(consumption)
(regenerating)
(overall)
Apparent
energy
2
(consum
(regenerating)
(overall)
Reactive energy
(consumption)
Demand value
* i = 1, 2, 3
where, max. and avg. mean maximum and average values during an interval.
Vi : voltage of each phase
Vi max : max. Vi values
Vi min : min. Vi values
Vi avg : avg. Vi values
Ai : current of each phase
Ai max : max. Ai values
Ai min : min. Ai values
Ai avg : avg. Ai values
P : total active power Pi : active power of each phase
P max : max. P value Pi max : max. Pi values
P min : min. P value Pi min : min. Pi values
P av
g : avg. P value Pi avg : avg. Pi values
Q : total reactive power Qi : reactive power of each phase
Q max : max. Q value Qi max : max. Qi values
Q min : min. Q value Qi min : min. Qi values
Q avg : avg. Q value Qi avg : avg. Qi values
S : total apparent power Si : apparent power of each phase
S max : max. S value Si max : max. Si values
S min : min. S value Si min : min. Si v
S avg : avg. S value Si avg : avg. Si values
PF : power factor of whole system PFi : power factor of each phase
PF max : max. PF value PFi max : max. PFi values
PF min : min. PF value PFi min : min. PFi values
PF avg : avg. PF value PFi avg : avg. PFi values
f : frequency of V1
f max : max. f value
f min : min. f value
f avg : avg. f value
+WP : total active energy (consumption)
+WPi : active energy (consumption) of each phase
-WP : total active energy (regenerating)
-WPi : active energy (regenerating) of each phase
#WP : total active energy (overall)
#WPi : active energy (overall) of each phase
+WS : total apparent energy (consumption)
+WSi : apparent energy (consumption) of each phase
-WS : total apparent energy (regenerating)
ption)
-WSi : apparent energy (regenerating) of each phase
#WS : total apparent energy (overall)
#WSi : apparent energy (overall) of each phase
+WQ : total reactive energy (consumption)
#DEM : total demand va
TARGET : target demand value
lue #DEMi : demand value of each phase
Neutral
current
In : current on neutral
In max : max. In value
In min : min. In value
In avg : avg. In value
alues
line
www.GlobalTestSupply.com
Page 27

− 26 −
KEW6305
KEW6305
Internal memory/
SD card data
USB connection
SD card
SD card slot or
card reader
Bluetooth
Android device
Data transfer
9-2. Data transfer
1. SD card and USB
Data in SD card or internal memory can be transferred to PC using USB connection or SD card slot/
reader.
Method of transfer
USB Card reader
SD card data (file) △
*1
Internal memory data (file) O --------
*1 : It is reccomended to transfer the data with big size by use of SD card since trasfer of such
data via USB takes time. (transfer time : approx 320MB/ hour)
* As to the manipulation of SD cards, please refer to the instruction manual attached to the card.
* In order to save data without any problem, make su
re to delete the files other than the data measured
with this instrument from the SD card.
O
2. Bluetooth
Measuring data can be checked on android devices in real-time via Bluetooth communication.
It is neccesary to enable Bluetooth function prior to using Bluetooth communication. (Setting No. 26:
Bluetooth)
* Before starting to use this function, download the special application KEW Smart f
rom the Internet
site.
The application KEW Smart is available on download site for free. (An Internet access is required.)
www.GlobalTestSupply.com
Page 28

− 27 −
KEW6305
KEW6305
Wiring check:
WIRING CHECK
Range
10. Wiring check:
WIRING CHECK Range
10-1.Checking procedure
Select the WIRING CHECK Range for checking proper connection.
STEP1
Then present voltage, current, power factor and electric power (instantaneous value) are
STEP2
blinking for about 5 sec.
STEP3
displayed as follows.
After connections are complete, set the Function switch to the
displayed on the LCD as shown in the table below.
Press the Key.
symbol keeps
Check result will be
Wiring system
(Setting no. 01)
3P4W
3P3W3A
3P3W
1P3W
1P2W (3ch)
1P2W (2ch)
1P2W (1ch)
Display
Screen 1Screen 2Screen 3Screen 4Screen 5Screen
position
Top
Middle
Bottom
Top
Middle
Bottom
Top
Middle
Bottom
Top
Middle
Bottom
Top
Mid
Bottom
dle
f
V(avg)
A(avg)
f
V(avg)
A(avg)
f
V
A(avg)
f
V
A(avg)
f
V
A1
WIRING CHECK
Items to be displayed
V1
A1
V2
V3
V1
V2
−
V
−
−
V
−
−
V
−
−
P1
A2
P2
A3
P3
A1
P1
A2
P2
−
−
A1
P1
A2
P2
A3
P3
A1
P1
A2
P2
−
−
A1
P1
−
−
−
−
Range.
PF1
PF2
PF3
PF1
PF2
−
PF1
PF2
PF3
PF1
PF2−−
PF1
−−−
6
DEG(V1)
DEG(V2)
DEG(V3)
DEG(V1)
DEG(V2)
−
−
Everything is OK. Error is found.
* Check results may be affected if great power factors (0.5 or less) exist at the measurement sites.
www.GlobalTestSupply.com
Page 29

− 28 −
KEW6305
KEW6305
Criteria of judgment and cause
10-2. Criteria of judgment and cause
Check Criteria of Judgment Cause
Frequency Frequency of V1 is within 45 - 65Hz. - Voltage clip is firmly connected to the
DUT?
- M e as u ri n g to o h ig h h ar m on i c
components?
Voltage input Voltage input is 10% or more of
(Voltage Range x VT).
Voltage balance Voltage input is w
voltage (V1)
* (not checked in single-phase wiring)
Voltage phase Phase of voltage input is within ±10º of
reference value (proper vector).
Current input Current input is 10% or more and 110%
or less of (Current Range x CT).
Current phase - PFi (absolute value) is 0.5 or more.
(3P3W3A : 0≦PFi)
- Pi is positive value.
ithin ±20% of reference
- Voltage clip is firmly connected to the
DUT?
- Voltage test leads are firmly connected
to the Voltage inp ut terminal on the
instrument?
- Settings are matched with the wiring
system under test?
- Voltage clip is firmly connected to the
DUT?
- Voltage test leads are firmly connected
to the Voltage input terminals on the
instrument?
- Voltage t e s t le a d s are p r o p e r l y
connect
ed?
(Connected to proper channels?)
- Clamp sensors are firmly connected
to the Power input t ermin als on the
instrument?
- Setting for Current Range is appropriate
for input levels?
- Arrow ma rk on the Clam p s e nso r
and the
orientation of flowing current
coincide with each other?
(Power supply to Load)
- Clamp sensors are connected properly?
www.GlobalTestSupply.com
Page 30

− 29 −
KEW6305
KEW6305
Data check:
Select the
DATA CHECK
Range.
LCD shows the saved data.
RECALL symbol
appears.
Data no. is
displayed.
DATA CHECK
Range
11. Data check:
Past 10 data (including the latest one) can be recalled and checked on the LCD.
Select the
Saved data Latest data
STEP1
Then RECALL symbol appears and the latest data (No. 01) is displayed on the LCD.
STEP2
STEP3
Screens can be switched at
Use the
DATA CHECK Range for checking the data.
Data No. 01 02
After connections are complete, set the Function switch to the
Use the Keys and select any Data no..
Use the Keys and switch screens.
DATA CHECK Range
Two before the
latest
Keys and select any Data no..
・・・
DATA CHECK Range are as follows.
09 10
Nine before
the latest
Ten before the
latest
DATA CHECK
Range.
Wiring system
(Setting no. 01)
3P3W3A
1P2W (3ch)
1P2W (2ch)
1P2W (1ch)
3P4W
3P3W
1P3W
Display
position
Top
Middle
Bottom
Top
Middle
Bottom
Top
Middle
Bottom
Top
Middle
Bottom
Top
Middle
Bottom
Screen 1
(Date& time)
YY.MM.DD
hh:mm:ss
----
YY.MM.DD
hh:mm:ss
----
YY.MM.DD
hh:mm:ss
----
YY.MM.DD
hh:mm:ss
----
YY.MM.DD
hh:mm:ss
----
Screen 1
(Voltage)
Items to be displayed
Screen 1
(Current)
V1
V2
V3
V1
V2
----
V1
----
----
V1
----
---V
----
----
A1
A2
A3
A1
A2
----
A1
A2
A3
A1
A2
---A
----
----
www.GlobalTestSupply.com
Screen 4
(Power)
P1
P2
P3
P1
P2
----
P1
P2
P3
P1
P2
---P
----
----
Screen 5
(Power)
TIME
+WP
+WS
TIME
+WP
+WS
TIME
+WP
+WS
TIME
+WP
+WS
TIME
+WP
+WS
Screen 5
(DEMAND)
Target value
----
Present value
Target value
----
Present value
Target value
----
Present value
Target value
----
Present value
Target value
----
Present value
Page 31

− 30 −
KEW6305
KEW6305
MEMO
www.GlobalTestSupply.com
Page 32

DISTRIBUTOR
Kyoritsu reserves the rights to change specifications or designs described in this
manual without notice and without obligations.
4-12 92-2101
www.GlobalTestSupply.com
 Loading...