

Page 1
Quick Manual
KYORITSU ELECTRICAL
INSTRUMENTS WORKS, LTD.
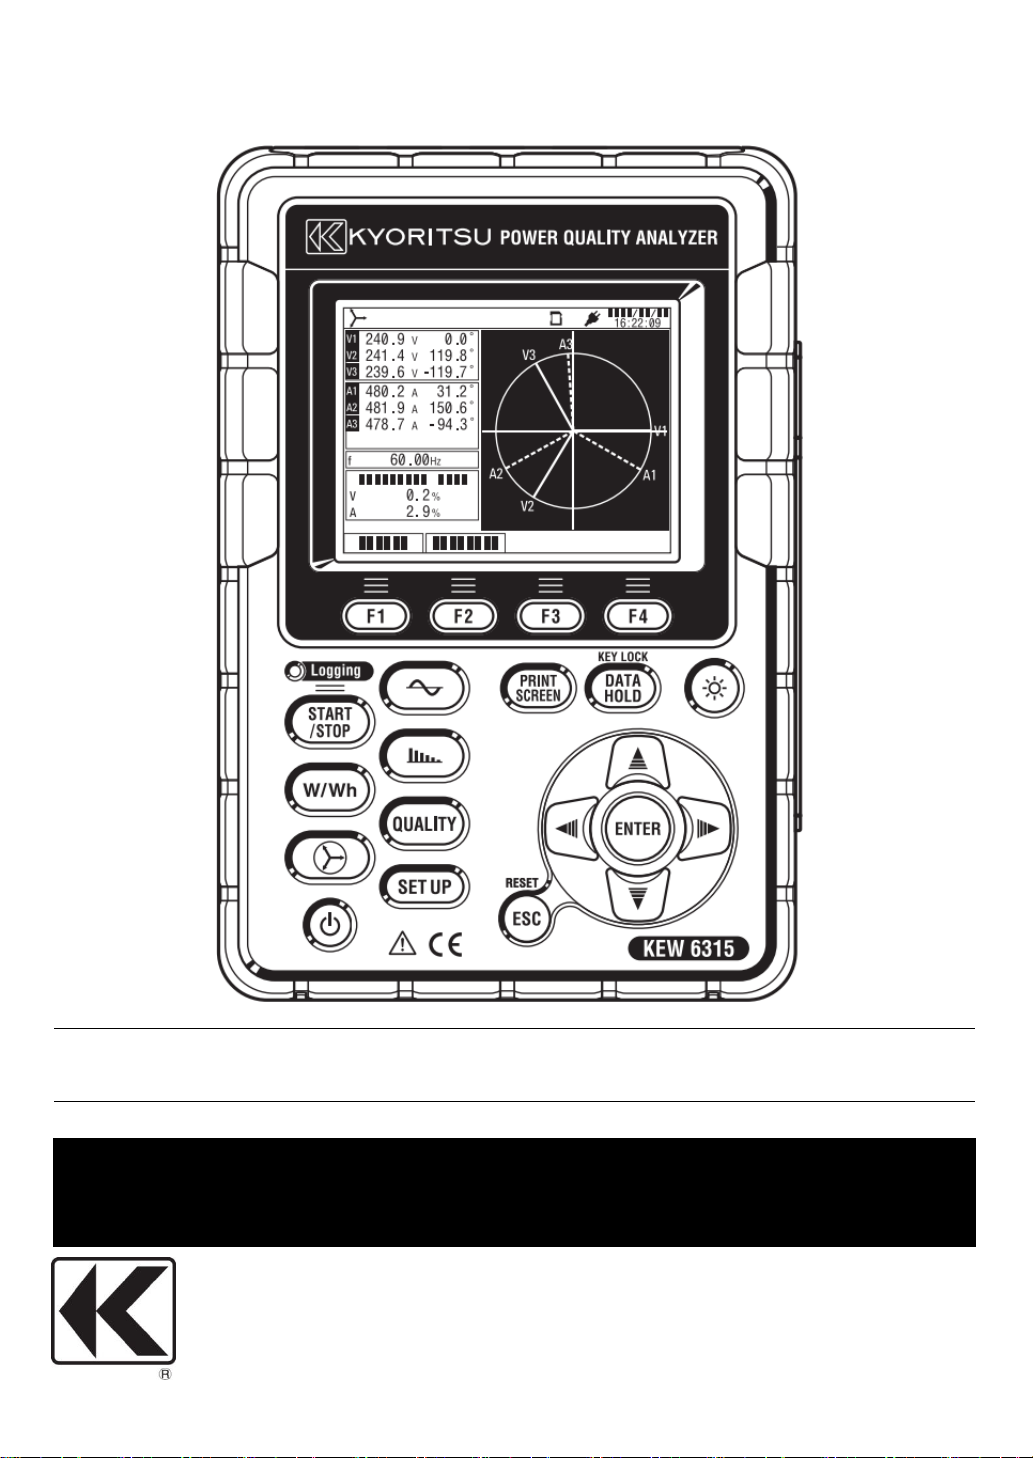
POWER QUALITY ANALYZER
KEW631
KEW6315
KEW631KEW631
5
55
Page 2

Page 3
Preface
● Preface
This Quick manual is a simplified version of the full instruction manual which can be found in
the supplied CD-ROM. This manual is intended only as a handy reference guide and should
only be used after having read the full instruction manual which contains full details on each
function of this instrument and the items contained in the package.
● Safety Warning!
The instruction manual contains warnings and safety procedures which have to be observed
to ensure safe operation of the instrument and maintain it in a safe condition. Thus, these
operating instructions have to be read prior to using the instrument.
Content
1. Instrument Overview ·············································································· 2
2. Start/ Stop Recording ··································································· 5
3. Instrument Layout ················································································ 13
4. Getting Started ··················································································· 17
5. Inst/ Integration/ Demand
Inst value : W ···················································································· 19
Integration value: Wh/ Demand ····························································· 21
KEW6315
6. Vector ···················································································· 25
7. Waveform ··············································································· 26
8. Harmonics Analysis ··································································· 27
9. Power Quality
Event(Swell/ Dip/ Int/ Inrush current/ Transient) ········································· 30
Flicker ······························································································ 33
10. Setting ················································································ 35
11. SD Card/ Saved Data ········································································· 38
The latest software can be downloaded from our homepage: http://www.kew-ltd.co.jp.
- 1 - KEW6315
Page 4

KEW6315
1
1
.
.
I
I
n
n
s
s
t
t
r
r
u
u
m
m
e
e
n
n
t
t
O
O
v
v
e
e
r
r
v
v
i
i
e
e
w
w
1
.
I
n
s
t
r
u
m
e
n
t
O
v
e
r
v
i
e
w
Feature
This is a Clamp-type Power Quality Analyzer that can be used for various wiring systems.
It can be used for simple measurements of instantaneous/ integration/ demand values, and also for
analysis of harmonics and events related to power quality and for the simulation of power factor
correction with capacitor banks. Moreover, it can display waveforms and vectors of voltage and current.
Data can be saved either in the SD card or the internal memory, and can be transferred to PC via USB,
or in real time via Bluetooth communication.
Safety construction
Designed to meet the international safety standard IEC 61010-1 CAT.IV 300V/ CAT.III 600V/ CAT.II 1000V.
Power quality analysis
KEW6315 is designed to meet the international standard IEC61000-4-30 Class S and can measure
frequency and r.m.s. voltage with high accuracy, and also can analyze harmonics. Moreover, it can
measure swell, dip, interruption, transient, inrush current and flicker all at once without a gap.
Power measurement
KEW6315 measures active/reactive/apparent power, electrical energy, power factor, r.m.s. current, phase
angle and neutral current simultaneously.
Wiring configuration
KEW6315 supports: Single-phase 2-wire (4ch), Single-phase 3-wire (2ch), Three-phase 3-wire (2ch) and
Three-phase 4-wire.
Demand measurement
Electricity consumption can be easily monitored so as not to exceed the target maximum demand values.
Waveform/ vector display
Voltage and current can be displayed by waveform or vector.
Saving data
KEW6315 is endowed with a logging function with the preset recording interval. Data can be saved by manual
operation or by specifying date & time. Screen data can be saved by using the Print Screen function.
Dual power supply system
KEW6315 operates either with AC power supply or with batteries. Both dry-cell batteries (alkaline) and
rechargeable batteries (Ni-MH) can be used. To charge the rechargeable battery, use the charger which is
manufactured by the same company as the batteries. In the event of power interruption, while operating with
AC power supply, power to the instrument is automatically restored by the batteries in the instrument.
Large display
TFT color display with large screen.
Light & compact design
Clamp sensor type, compact and light weight design.
Application
Data in the SD card or the internal memory can be saved in PC via USB. Analysis of the downloaded
data and instrument settings are possible by using the special software “KEW Windows for KEW6315”.
Real-time communication is available via Bluetooth.
Input/ Output function
Analog signals from thermometers or light sensors can be measured simultaneously with electrical power
data via 2 analog inputs (DC voltage); when any events related to power quality occur, signals can be
transmitted to alarm devices via one digital output.
Feature
KEW6315 - 2 -
Page 5
Functional overview
3
Display the avg/ max/ min instantaneous values of
current/ voltage/ active power/ apparent power/
reactive power. Integration values also can be viewed
by switching screens. Moreover, demand values with
” for further details.
” to start
up setting by
” for further details.
Functional overview
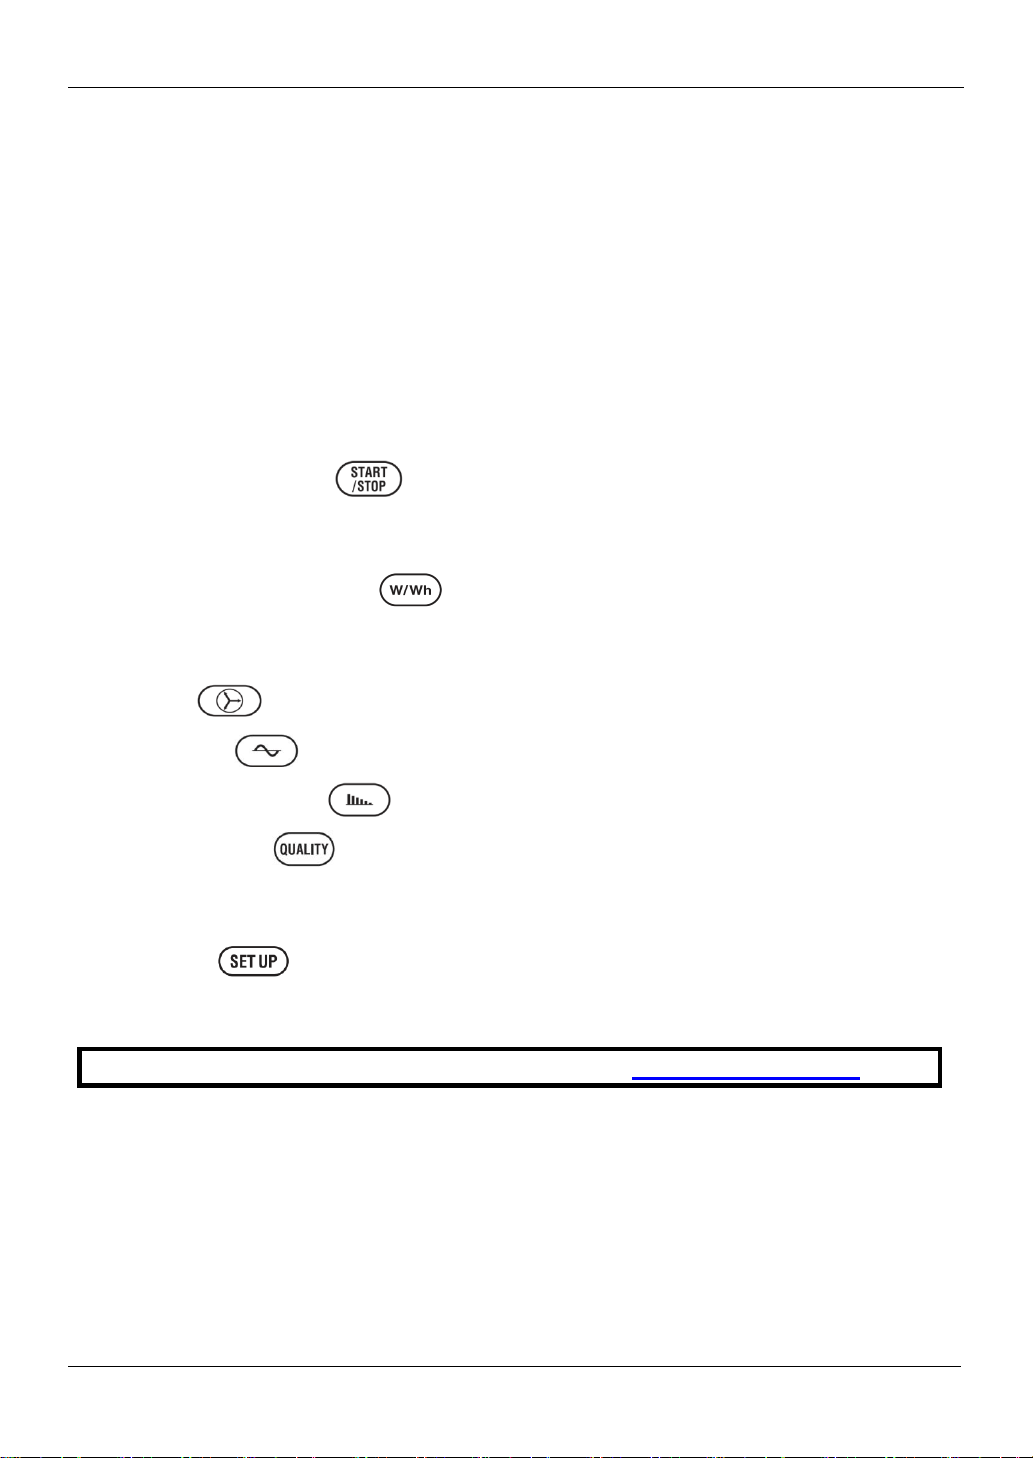
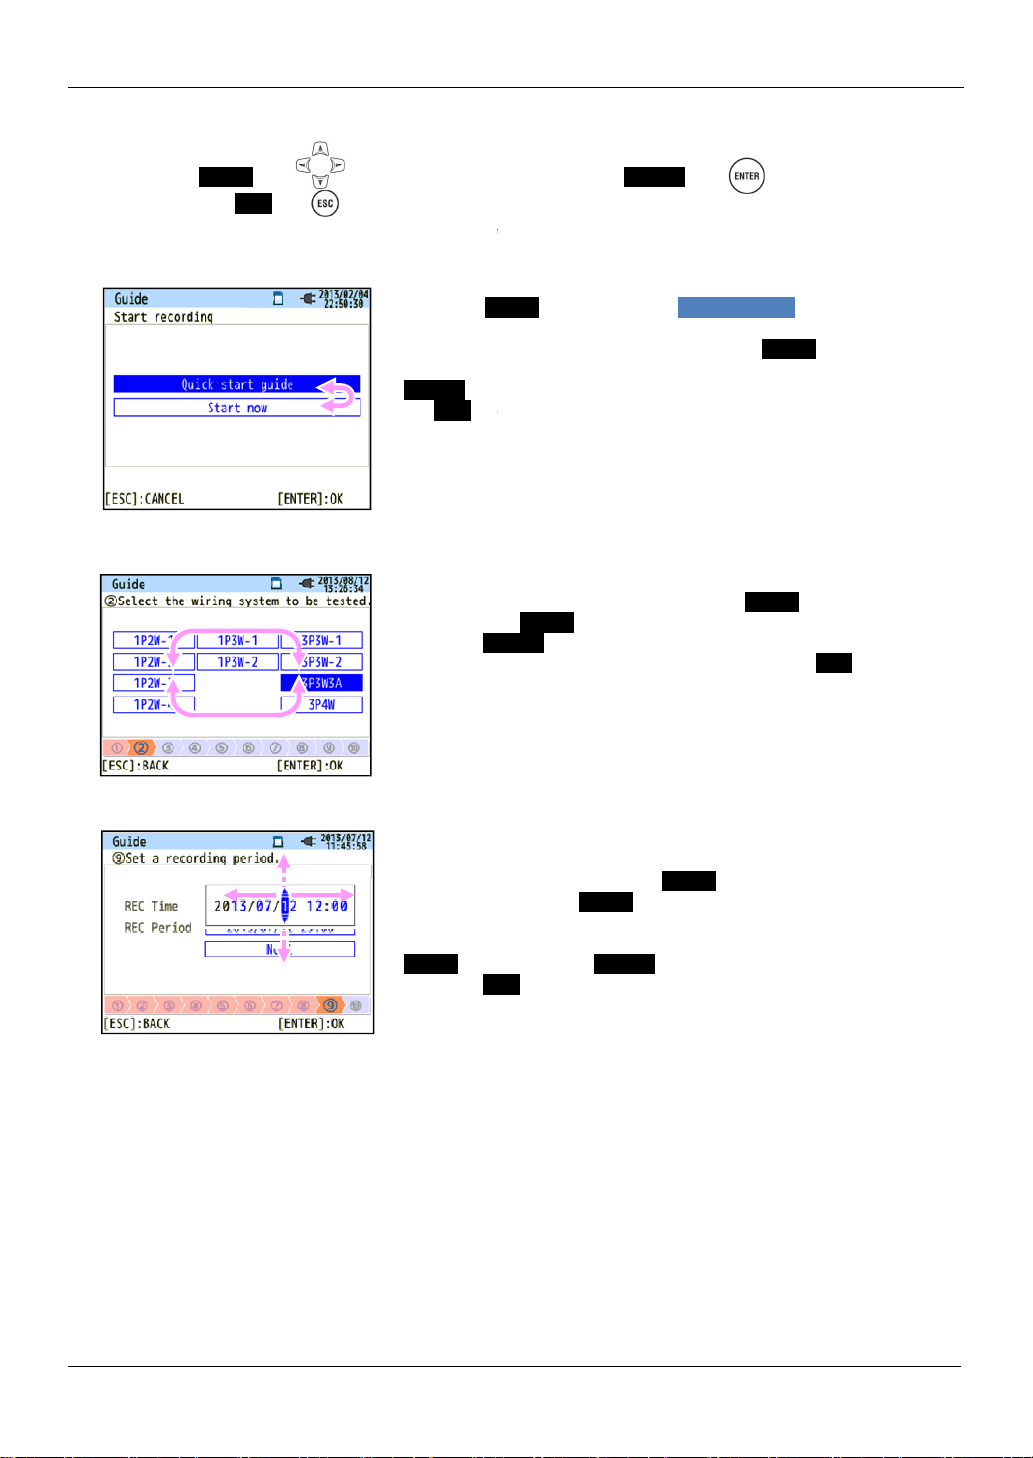
Start/ Stop
Choose either “Quick start guide” or “Start now
recording. Can do simple and fast startselecting “Quick start guide”.
See “2. Start/Stop Recording
Inst/ Integration/ Demand
the preset target value can also be checked.
See “5. Inst/ Integration/ Demand
KEW6315
-
Vector and Wiring check
Vectors of voltage and current per CH are
displayed on a graph. KEW6315 will perform
wiring check.
See “6. Vector” for further details.
- KEW6315
Page 6
KEW6315
4
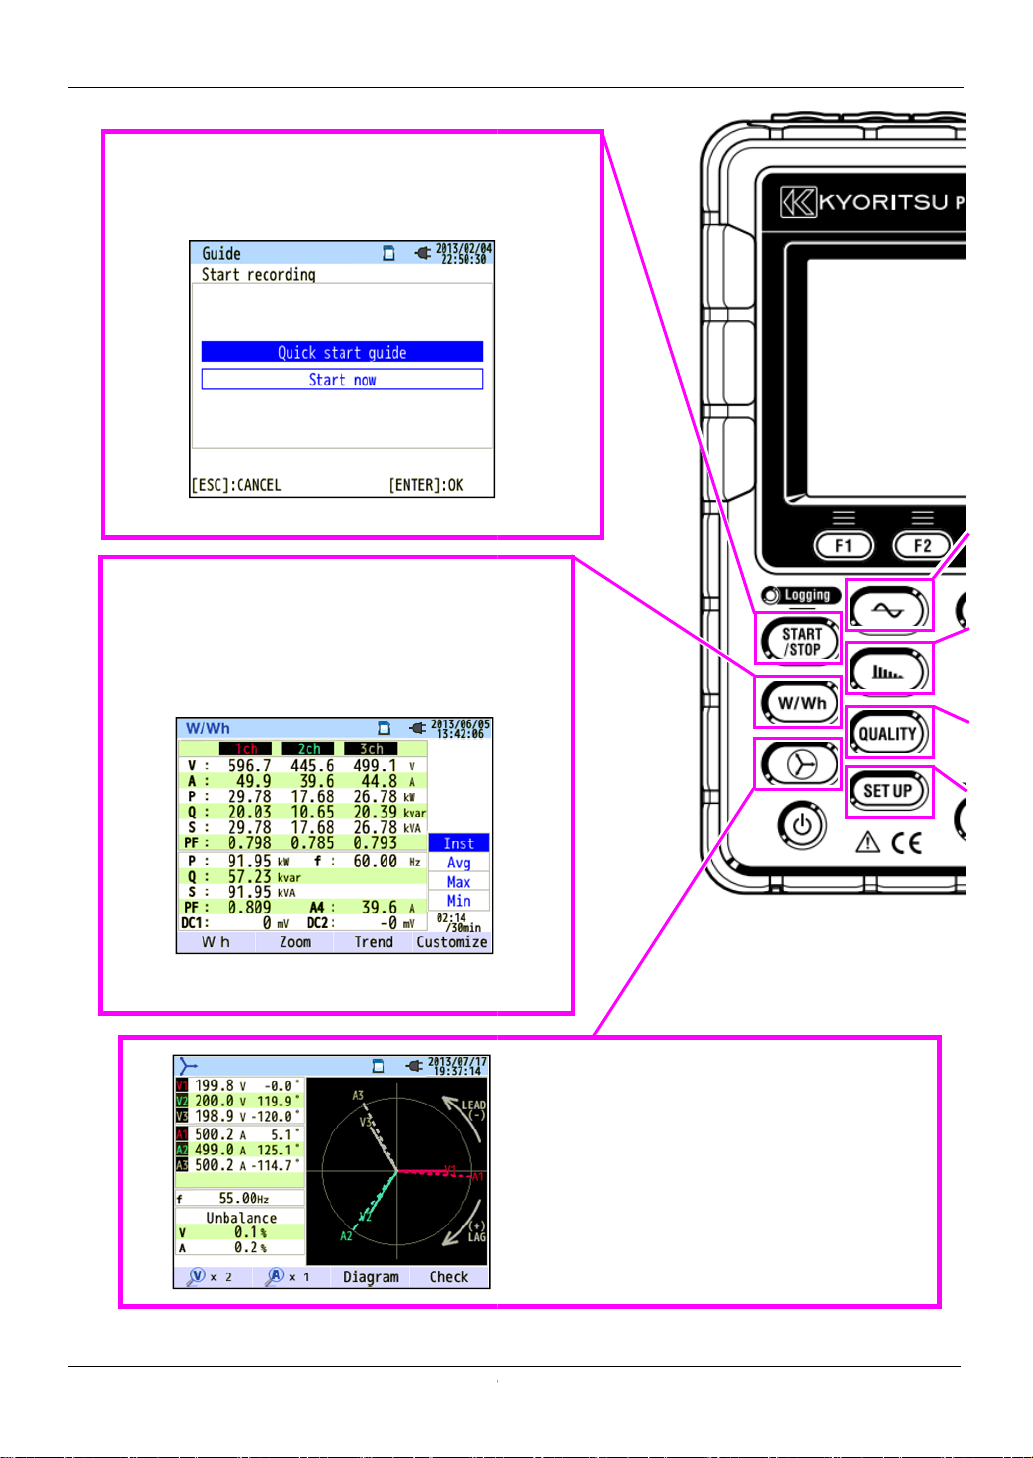
Waveform
Waveforms
Waveform
Harmonic Analysis
Harmonic components of voltage and current per CH are
displayed on a graph.
See “
graph.
See “7.
of voltage and current per CH are displayed on a
” for further details.
8. Harmonic Analysis” for further details.
Functional overview
Setting (SET UP)
Make settings for KEW6315 and measurements.
See “10. Setting” for further details.
KEW6315 -
Power Quality (QUALITY) event
Display voltage swell, dip, int, transient, inrush current
and flicker.
See “9. Power Quality” for further details.
-
Page 7
Start/ stop recording
5
start recordings with simple steps by selecting
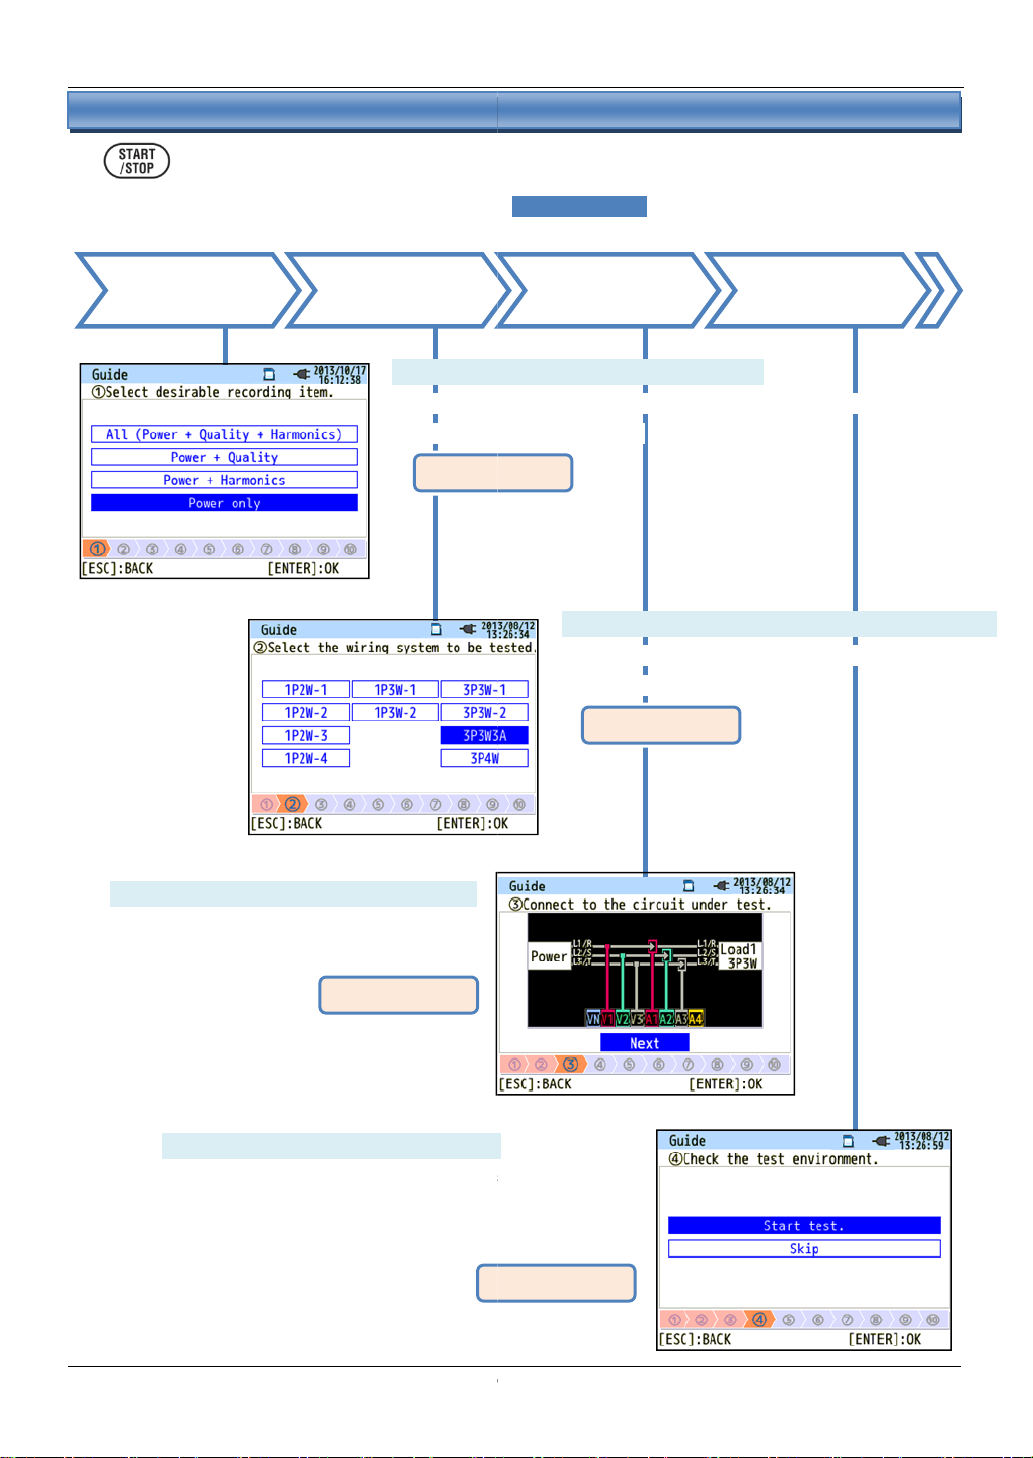
Ensure your safety and do the appropriate preparation
Select the item you want to record.
The number of selected items will have effect on file size and
also on max recording time.
2
2
.
.
S
S
t
t
a
a
r
r
t
t
/
/
S
S
t
t
o
o
p
p
R
R
e
e
c
c
o
o
r
r
d
d
i
i
n
n
g
g
Check the Test environment.
diagnosis, wiring check and detection of connected
* It is recommended to do this test for ensuring the testing
See P.40.
Select the wiring system to be measured.
2
.
S
t
a
r
t
/
Can
Select the
recording item
S
Steps for measurement
t
o
p
R
e
c
o
r
d
i
n
g
“Quick start guide”.
s before starting measurements.
Select the
wiring system
(1)
*
Confirm the
connections
(2)
* Select a proper wiring system for accurate
measurements.
See P.7.
Check the test
environment
KEW6315
(3) Connect to the circuit to be tested.
* Read and follow the safety precautions
described in the instruction manual.
-
(4)(5)
* Self-
sensors will be performed in this test.
conditions are correct.
See P.17.
See P.8.
- KEW6315
Page 8
KEW6315
6
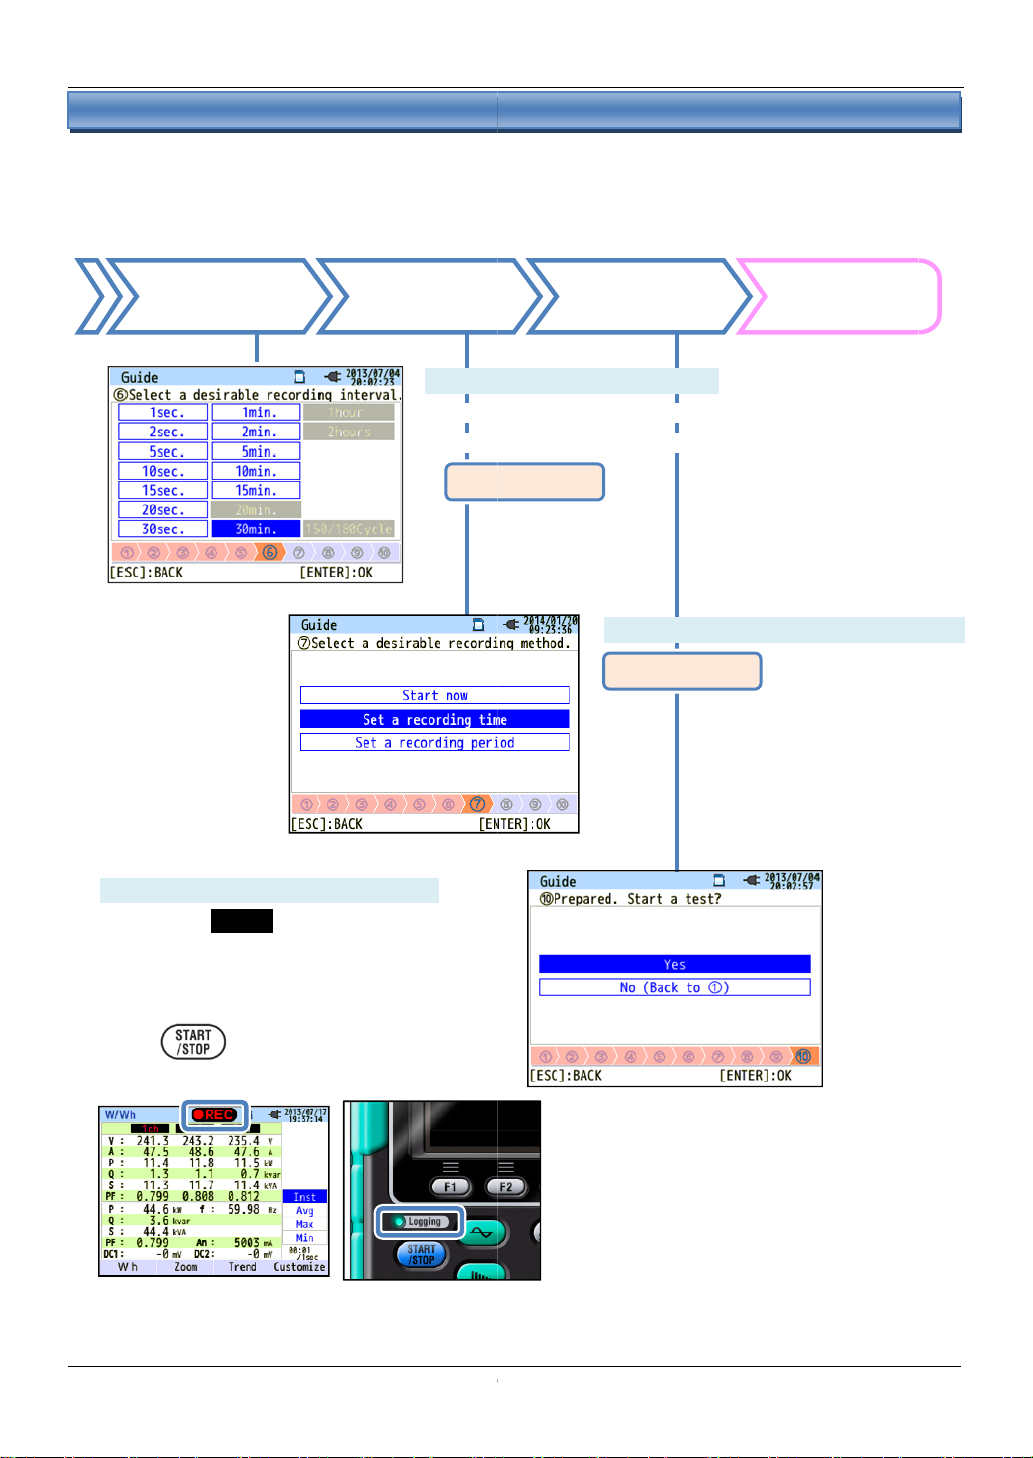
ethod
Select a recording interval.
* Selecting
case,
instructions
See P.
short interval gets the file size large. In this
Start/ stop recording
Select the
rec. interval
Select the
rec. m
(6)
Check the
selected method
Start
recording
a
a long period recording cannot be performed.
38.
(7)(8)(9) Select a recording method.
See P.11.
(10) Prepared. Recording will start.
The mark “ REC ” will appear on the screen
when the recording starts and the green LED
(status indicator) lights up.
If you want to terminate the recording, press
the “ ” button and follow the
displayed on the screen.
KEW6315 -
-
Page 9
Wiring system
Power
supply
A4
A3
A2
A1
VN
V1
A4
A3
A2
A1
VN
V1
V2
A4
A3
A2
A1
VN
V1
V2
A3
A2
A1
V3
V1
V2
A3
A2
A1
V3
V1
V2
VN
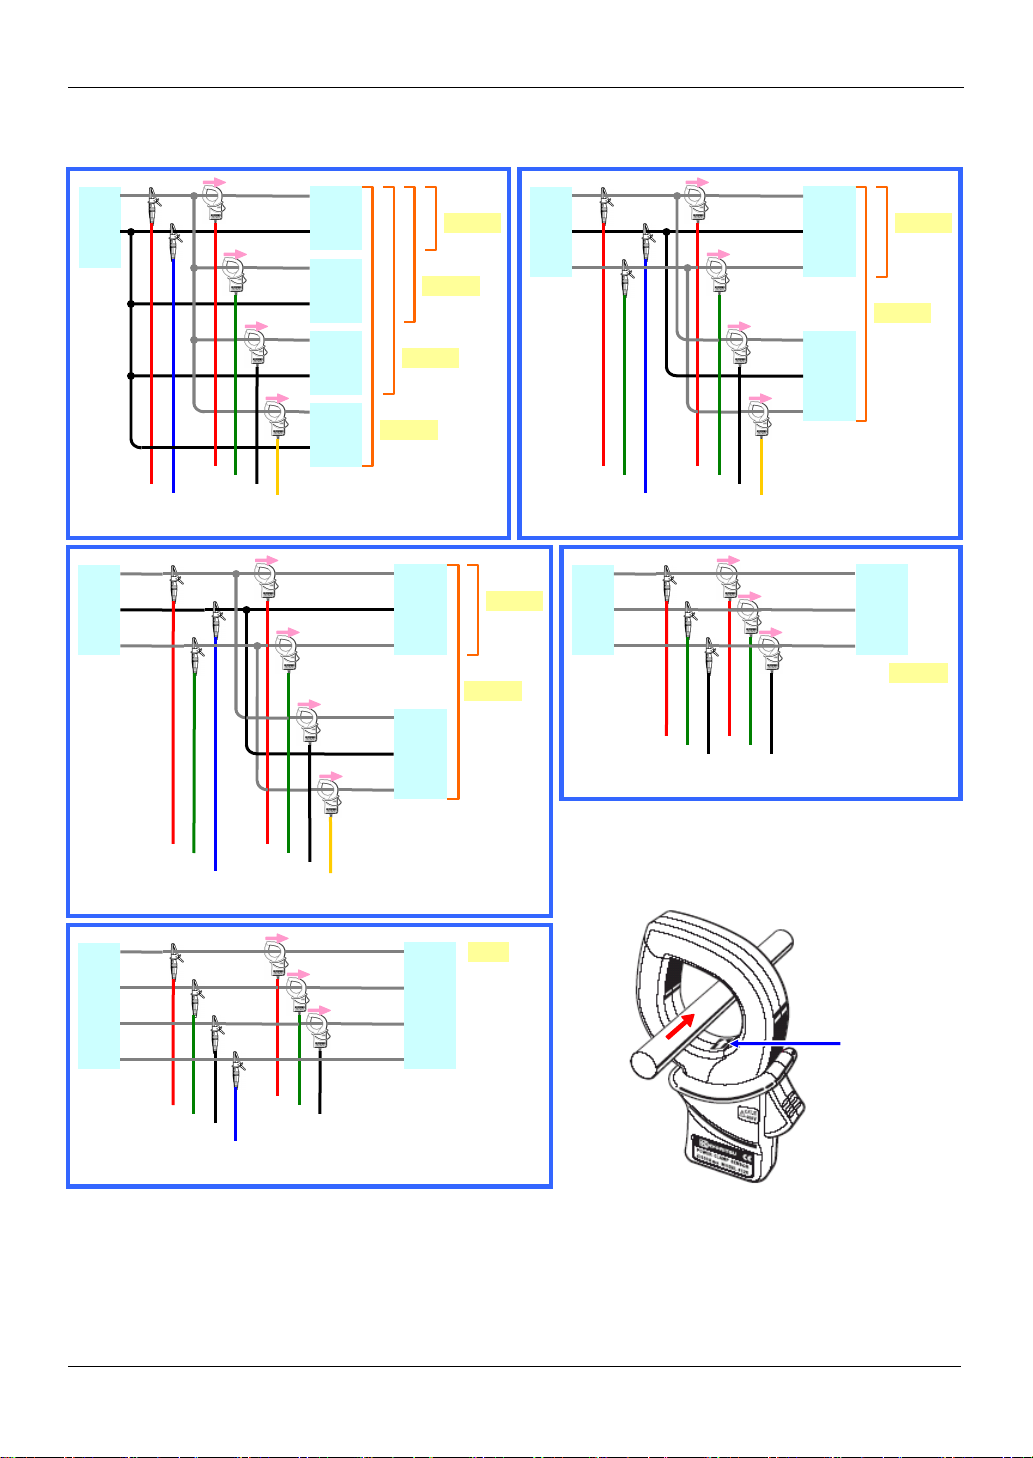
(2) Wiring system
Any of the followings can be selected.
L
N
L1(R)
supply
Power
L2(S)
L3(T)
L
N
L
N
L
N
L
N
Load
(1)
1P2W
Load
(2)
1P2W
Load
(3)
1P2W
Load
(4)
1P2W
L1(R)
L2(S)
L3(T)
L1(R)
L2(S)
L3(T)
1P2W×2
1P2W×3
1P2W×4
Load
(1)
3P3W
Load
(2)
3P3W
1P2W×1
3P3W×1
3P3W×2
KEW6315
L1
supply
Power
N
L2
L1
N
L2
Load
(1)
1P3W
1P3W×1
1P3W×2
L1
Load
N
(2)
1P3W
L2
L1(R)
supply
Power
L2(S)
L1(R)
L2(S)
Load
3P3W
L3(T)
L3(T)
3P3W3A
L1(R)
Power supply
L2(S)
L3(T)
N N
L1(R)
L2(S)
L3(T)
3P4W
Load
3P4W
Orientation of Clamp sensor
Power
source
Load
Arrow mark:
Point towards
load side.
Reverse clamping switches the symbols (+/-)
for active power (P).
- 7 - KEW6315
Page 10
KEW6315
8
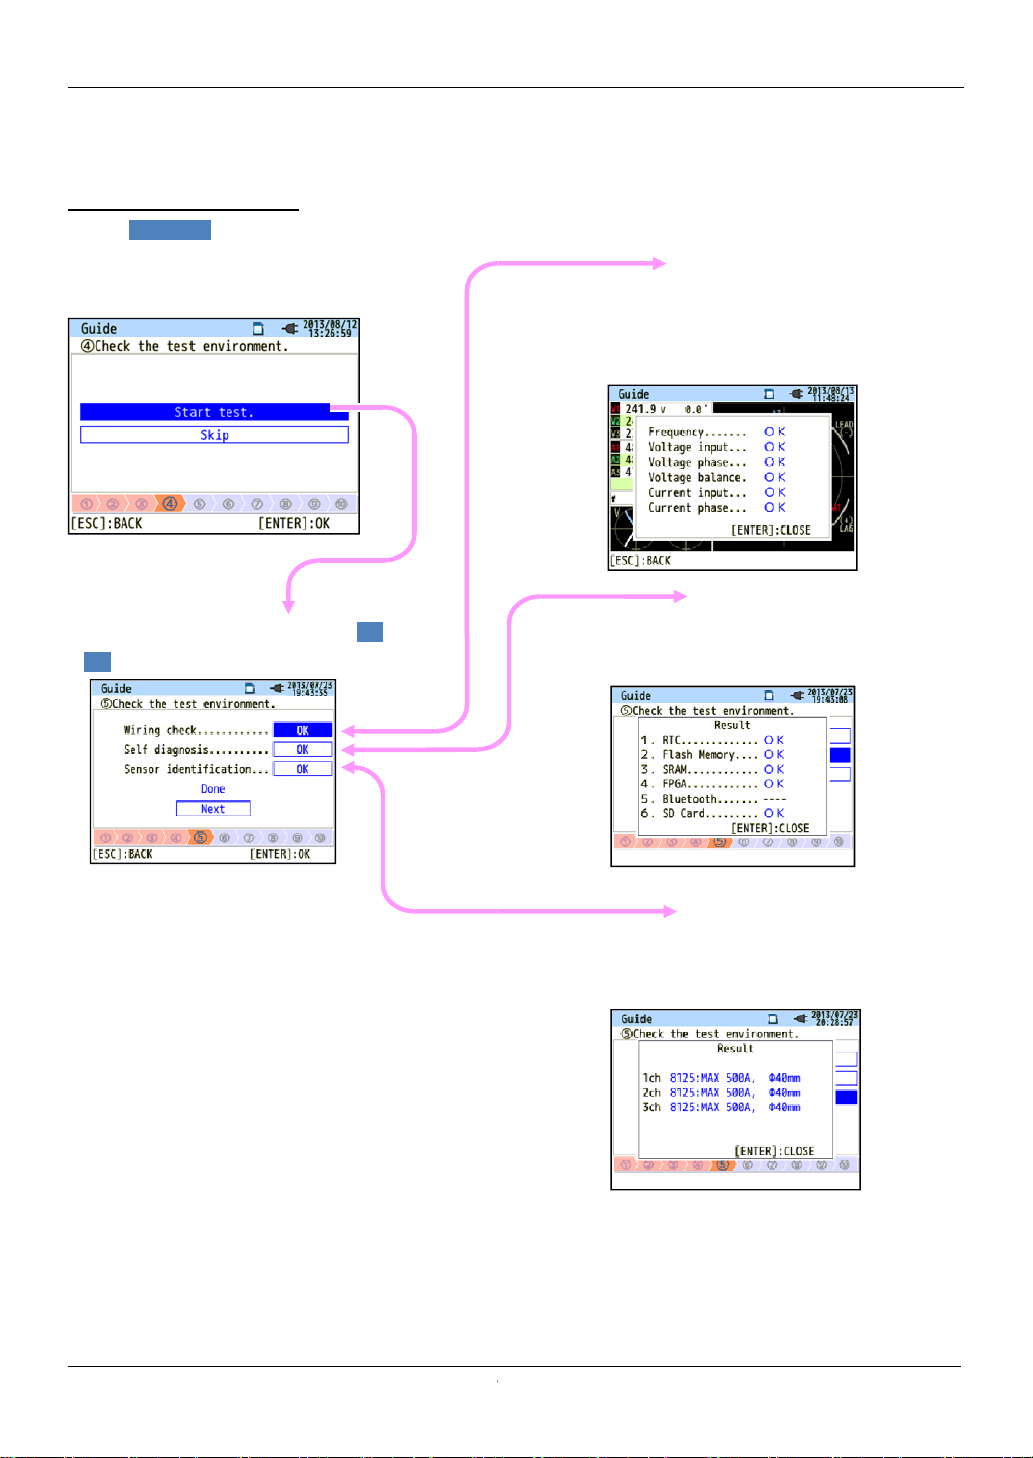
result will be
Operating condition of the instrument system will
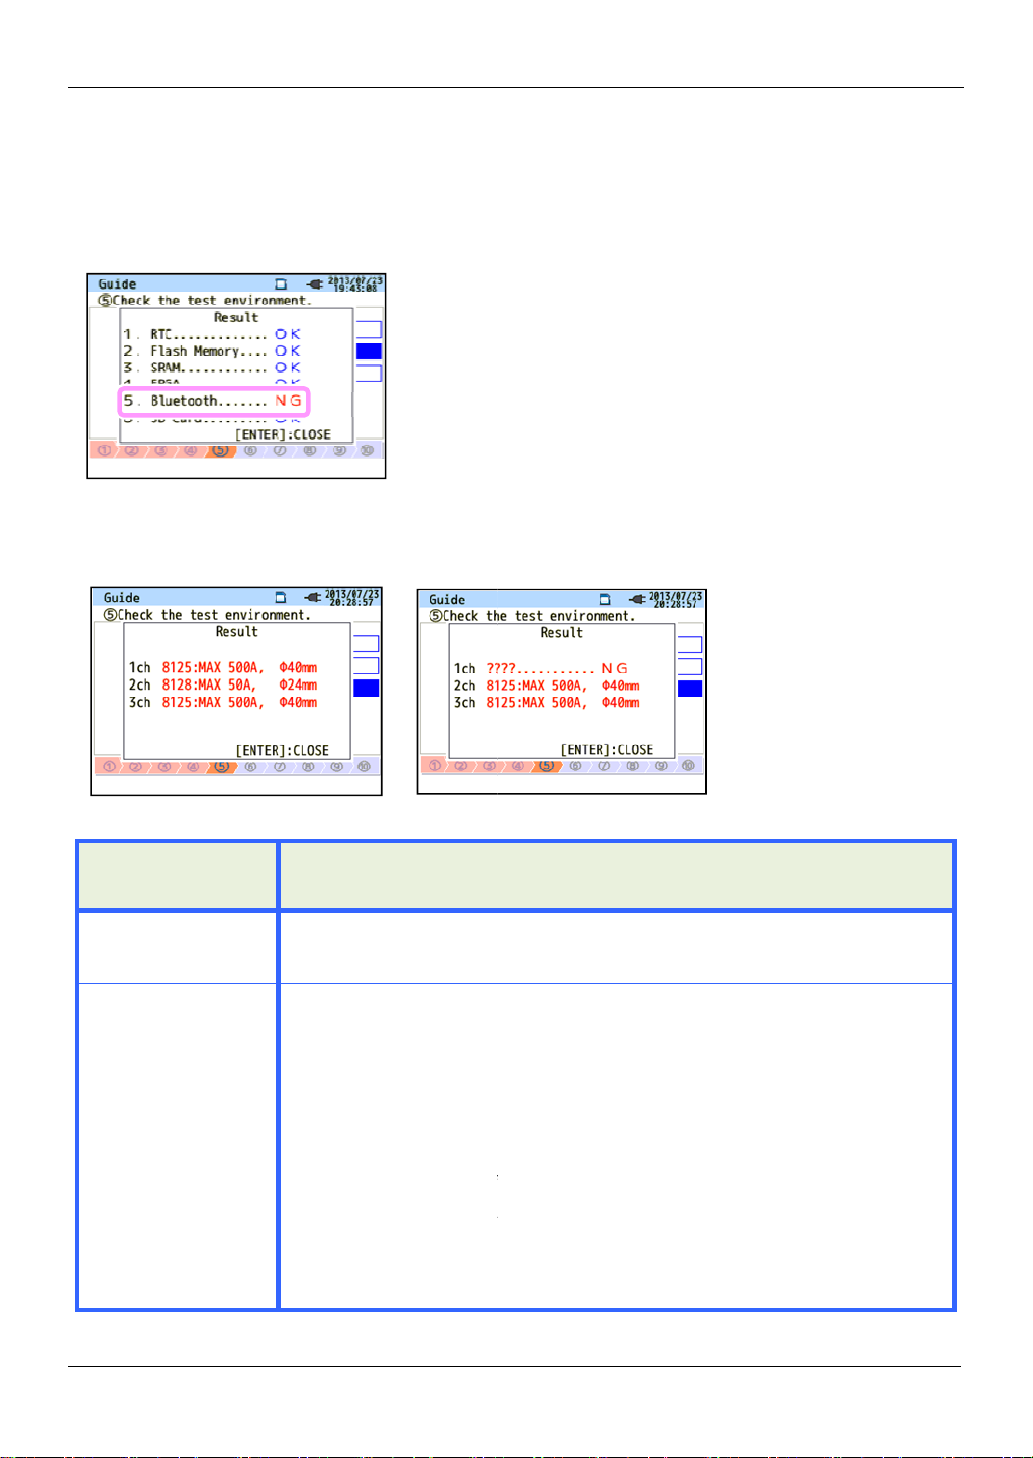
(4)/ (5) Test Environment Check
Test environment check
Select “ Start test ”and press the “ENTER”
button to start the test. The test
displayed on the screen.
Select and press the “ENTER” on “OK”/
”NG” to see the details.
Environment check
Wiring check
Test results of each item will be displayed.
* NG result may be given, even if the wiring is correct,
at the measurement site under bad power factors.
Self-diagnosis
be checked and the result will be displayed.
The connected sensors are automatically
detected and their max Ranges will be set.
Sensor detection
KEW6315 -
-
Page 11
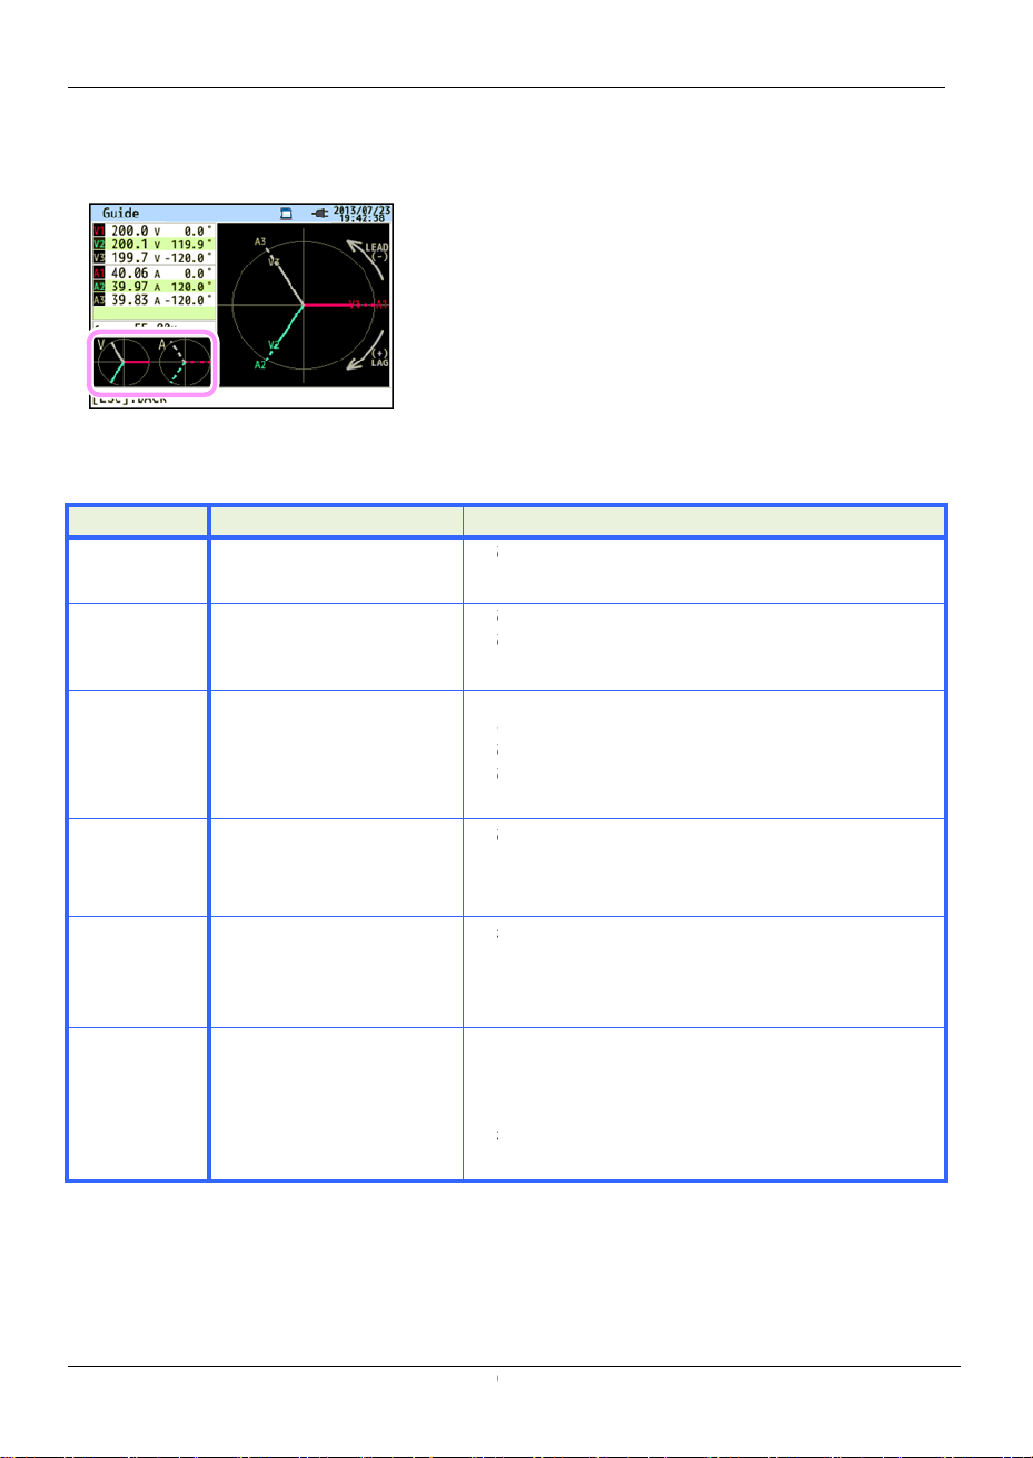
Wiring check
9
Close the result display. Then, the blinking vectors and the
values of NG items will be displayed. If all the results are
OK, the ideal vector diagram will be displayed at the lower
Voltage clip is firmly connected to the DUT?
Measuring too high harmonic components?
Voltage clip is firmly
Voltage test lead
AC v
Settings are matched with the wiring system under
test?
Voltage clip is firmly connected to the DUT?
Voltage test lead
AC v
within ±10º of reference value
Voltage test leads are properly connected?
(Connected to proper channels?)
Clamp sensors are firmly connected to the Power
input terminals on the instrument?
Setting for Current Range is appropriate for input levels?
Arrow mark on the Clamp sensor and the orientation
of flowing current coincide with each other?
(Power supply to Load)
Clamp sensors are connected properly?
NG judgment
Wiring check
Criteria of judgment and cause
left corner.
KEW6315
Check Criteria of Judgment
Frequency of V1 is within 40
Frequency
AC voltage
input
Voltage
balance
Voltage
phase
Current
input
Current
phase
- 70Hz.
AC voltage input is 10% or
more of (Nominal voltage x
VT).
AC voltage input is within
±20% of reference voltage
(V1).
* (not checked in
single-phase wiring)
Phase of AC voltage input is
(proper vector).
Current input is 5% or more
and 110% or less of (Current
Range x CT).
- Power factor (PF, absolute
value) at each CH is 0.5 or
more.
- Active power (P) at each
CH is positive value.
Causes
-
-
-
oltage input terminal on the instrument?
-
-
oltage input terminal on the instrument?
-
-
-
-
-
connected to the DUT?
is firmly connected to the
is firmly connected to the
-
- KEW6315
Page 12
KEW6315
10
If “NG” judgment is given frequently, there might be something wrong with the instrument.
in the instruction manual.
If the detection result is NG, each sensor type will be displayed in red.
Types of the connected current sensors are harmonized? Types of the current
measurements
sensors are firmly connected to the
If any failures are in doubt:
Exchange the connections of the sensors and test again.
Connect the current sensor, for
another sensor is properly detected.
If the result "NG" is given
suspected. A defect of sensor is suspected if "NG" is given for the same
another
Stop using the instrument and the sensor, if any defects are in doubt, and refer
Self-diagnosis
instrument and refer to “Troubleshooting”
Sensor detection
Criteria of judgment and cause
Self-diagnosis
Stop using the
Causes
Check
Type of
current sensor
???
(cause unknown)
KEW6315 -
-
sensors used for
- Current
-
sensor connected to
to "Troubleshooting"
Causes
should be the same.
instrument?
which "NG" is given, to the CH on which
for the same CH, a defect of the instrument is
CH.
in the instruction manual.
-
Page 13
Setting for recording method
11
date and time.
start date and time.
performs recording at the preset
as above
to 18:00 on August
KEW6315 performs recording during the selected time period at the preset
as above
, and
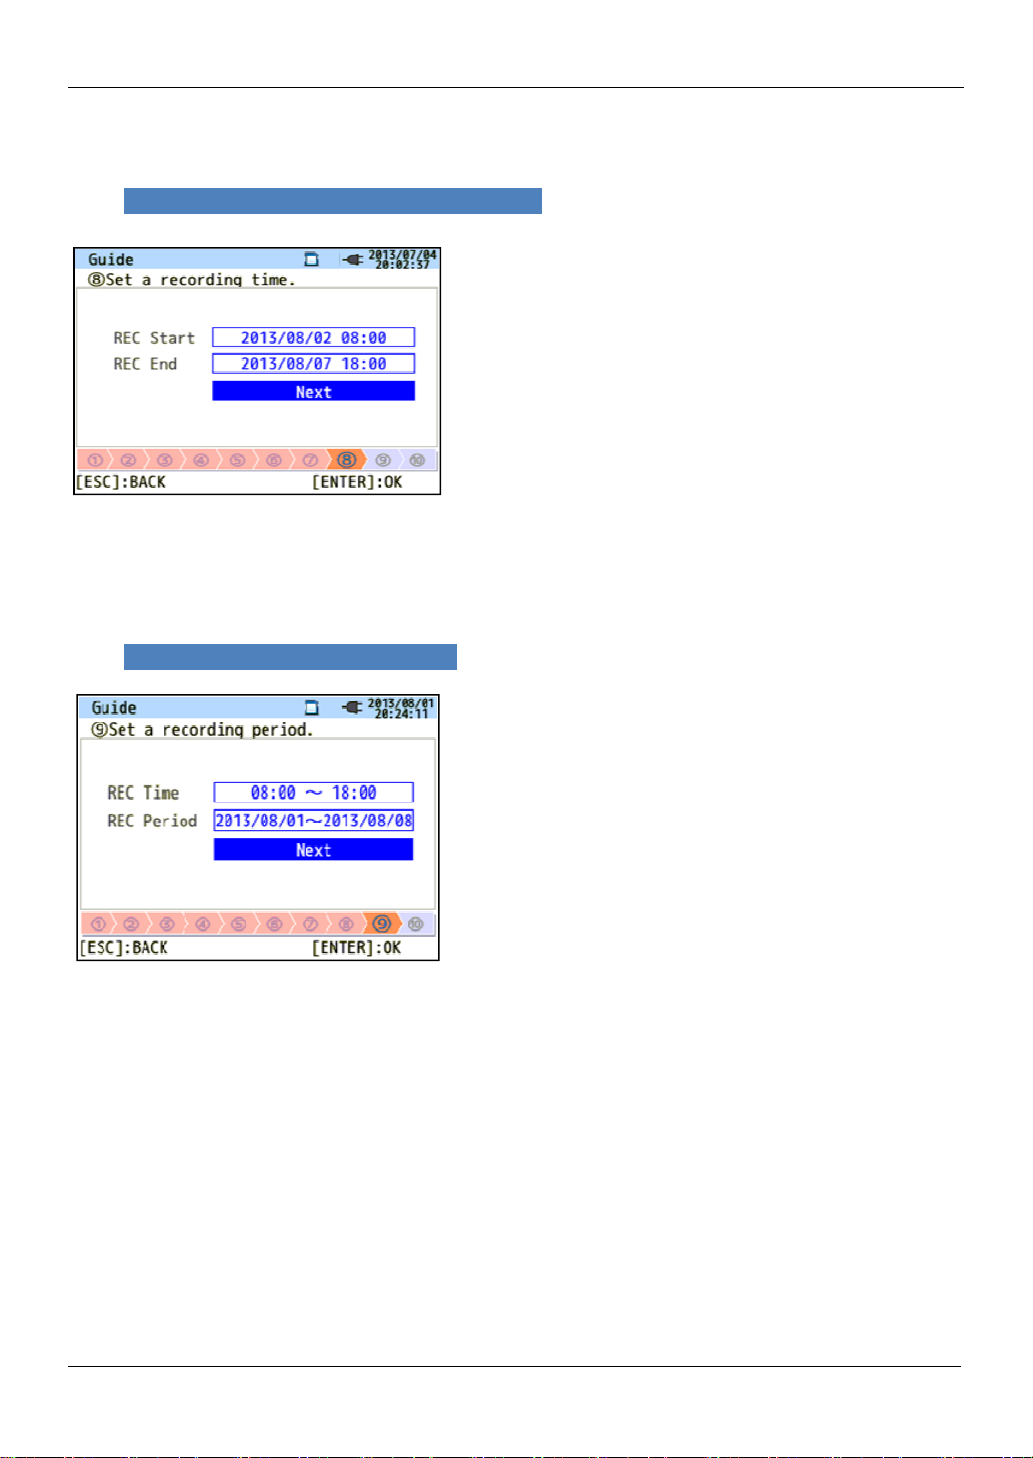
(8)/ (9) Setting for recording method
The following explains how to set recording start
KEW6315
(8) Specify the recording
During the selected period, KEW6315
Example: When the date & time are specified
From 8:00 on August 2, 2013
(9) Specify the recording time period.
intervals.
, the recording period will be as follows.
7, 2013,
recording processes during the preset time span.
Example: When the time period is specified
record data between 18:00 and 8:00.
(i) 8:00 to 18:00 on August 1, 2013,
(ii) 8:00 to 18:00 on August 2, 2013,
(iii) 8:00 to 18:00 on August 3, 2013,
(iv) 8:00 to 18:00 on August 4, 2013,
(v) 8:00 to 18:00 on August 5, 2013,
(vi) 8:00 to 18:00 on August 6, 2013,
(vii) 8:00 to 18:00 on August 7, 2013
(viii) 8:00 to 18:00 on August 8, 2013.
-
intervals, and repeats
, the recording period is as follows. KEW6315 does not
- KEW6315
Page 14
KEW6315
12
is used for selecting an item, the
the alternation.
are explained as follows
Cursor
is being selected, over the i
left is the Recording start screen. Press the
the blue highlight on the desirable recording method, and press the
Key to confirm the selection. To quit the start guide, press
Key.
display of t
then
the
ENTER
previous screen
To alter the numbers such as
over digits with the right and left
with the up and down
In the screen to the left, the tenth place of the day is being selected.
The number can be increased or decreased by 1 with the up/ down
s.
ESC
the changes.
blue highlight
, showing the item
. In the screen at the
Key and move
select
able items
Date/ Time
and alter the number
Switching of displayed parameters
Basically, the Cursor Key
selection, and the ESC Key is for canceling
Guide” as an example, Key operations
Press the
ENTER
the ESC
If the
to the left,
used. Use
press the
ENTER Key is for confirming the
Taking the procedures in “Quick Start
.
Key to move the
tems in blue letters
he
the up, down, right and left Cursor Keys can be
Cursor Keys to select the proper wiring system and
Key to confirm the selection. To return to the
and cancel the changes, press the ESC Key.
is similar to the one shown
Operating procedure
Cursor
Cursor Keys.
Cursor Keys
, move the blue highlight
Cursor Key
press the
Press the ENTER Key to confirm the selection, or
Key to return to the previous screen and cancel
KEW6315 -
-
Page 15

Instrument layout
3
3
.
.
I
I
n
n
s
s
t
t
r
r
u
u
m
m
e
e
n
n
t
t
L
L
a
a
y
y
o
o
u
u
t
t
measurement..
各部の名称
3
.
I
n
s
t
r
u
m
e
n
t
L
a
y
o
u
t
KEW6315
Front View
Display
(LCD)
Keys
Function Key
Execute the displayed function.
PRINT SCREEN Key
Save the displayed screen as BMP file.
DATA HOLD Key/ KEY LOCK Key
Hold the readings on the display.
* Measurement continues while the
readings are being held on the display.
Long press (at least 2 sec) disables
KEY
LOCK
all Keys to prevent operational
errors. Another long press (at least
2 sec) is required to restore the
disabled Keys.
LCD Key
Turn on/ off the backlight.
Long press (at least 2 sec) changes
the brightness and contrast.
Cursor Key
Select items or switch displays.
コ
- 13 - KEW6315
START/ STOP Key
Start/ stop
Status LED
Green
Red Blink: Backlight is off.
Light up: Recording& measuring
Blink: Stand-by
W/Wh
Vector View phases.
Waveform
View inst, integration
and demand values.
View voltage/ current
waveforms.
Power Key
Power on/ off.
Change and confirm: Basic, Measurement, Record-
ing and other settings, and also edit the saved data.
Menu Key
Harmonic
Analysis
Power
Quality
Confirm the entries.
Cancel setting changes and return to
the previous settings.
SETUP Key
ENTER Key
ESC Key/ RESET Key
View harmonic voltage, current
and power energy.
View the detailed info about:
swell, dip, int, transient, inrush
current and flicker.
Page 16

KEW6315
14
Connector
AC voltage Input Terminal
(VN, V1, V2, V3)
Current Input Terminal
(A1, A2, A3, A4)
Connector
Side face
SD Card Slot
Terminal Cover
Power Connector
Battery case
USB port
Analog Input/ Digital Output Terminal
Battery Cover
KEW6315 -
-
Page 17

Symbols on the LCD
Icons on the LCD
Icon Status
KEW6315 is operating with battery. This icon varies in 4 steps according to the
battery power condition.
KEW6315 is operating with AC power.
Holding the display update.
Keys are locked.
Buzzer is off.
SD card is set and available.
KEW6315
Recording the data on the SD card.
Available free space in the SD card is not enough.
Failed to access to the SD card.
Internal memory is available.
* This icon is displayed when a measurement starts without SD card.
Recording the data in the internal memory.
Available free space in the internal memory is not enough.
Stand-by mode
Recording the measured data.
Capacity of recording media is full.
USB is available.
Bluetooth is available.
- 15 - KEW6315
Page 18

KEW6315
Symbols on the LCD
Symbols displayed on the LCD
Symbols on the LCD
V*1
P
PF
DC1
An*2 Neutral current PA*3
WP+
WP-
THD
Pst
(1min)
*1
W screen: Displays of V and VL can be “customized” when “3P4W” is selected.
*2
W screen: “An” is displayed only when “3P4W” is selected.
*3
W screen: Displays of PA and C can be “customized”.
Phase voltage VL*1 Line voltage A Current
+
Active
power
Power
factor
consumption
-
regenerating
+
lagging
-
leading
Analog input
voltage at 1ch
Active power energy
(consumption)
Active power energy
(regenerating)
Reactive
Q
power
f Frequency
DC2
Analog input
voltage at 2ch
Phase
angle
WS+
WS-
Apparent power energy
(consumption)
Apparent power energy
(regenerating)
+
lagging
-
leading
+
lagging
-
leading
Voltage/ Current
total distortion factor
Voltage flicker (1 min) Pst
Short term voltage flicker
S
C*3
WQi+
WQc+
Plt
Apparent
power
Capacitance calculation
Reactive power energy
(lagging)
Reactive power energy
(leading)
Long term voltage flicker
Backlight and Contrast Adjustment
Hold down the “ ” LCD Key at least 2 sec to show the sliding bar to adjust the backlight brightness and
display contrast. Use the Cursor Key to slide the cursor on the bar for the adjustment. Press the ENTER
Key and exit from the adjustment mode. Press the ESC or LCD Key again to cancel the adjustment and
exit from the adjustment mode.
Brightness adjustment
Backlight brightness can be changed by 11 levels.
Contrast adjustment
Contrast can be changed by 11 levels.
KEW6315 - 16 -
Page 19

Power supply
4
4
.
.
G
G
e
e
t
t
t
t
i
i
n
n
g
g
S
S
t
t
a
a
r
r
t
t
e
e
d
d
測定前の確認
4
.
Power supply
KEW6315 operates with either an AC power supply or batteries. Capable of performing measurements in
the event of AC power interruption, power to the instrument is automatically restored by the batteries
installed in the instrument. AA size alkaline battery (LR6) and AA size rechargeable battery (Ni-MH) can
be both used. To charge the rechargeable battery, use the charger which is manufactured by the same
company as the batteries. KEW6315 cannot charge batteries.
If an AC supply is interrupted and the batteries have not been inserted, the instrument goes off and
all data may lost.
Battery Mark on the LCD/ Battery level
Power supply icon changes as follows, and the battery icon varies according to the battery condition.
G
e
t
t
i
n
g
S
t
a
r
t
e
d
Powered by AC
Power supply icon
Powered by
battery
Battery level
4-level
Possible continuous measurement hours:
- approx 3 hours with size AA alkaline batteries, and
- approx 4.5 hours with size AA Ni-MH (1900mA/h) batteries.
* These are ref. values with LCD turned off.
Instrument works normally.
* Voltage of full-charged Ni-MH battery is lower than the one of the
full-charged alkaline battery, so the level indicator may not be the
same as the one shown above even after fully charged.
Measurement continues, but data save is ceased.
(Further data will not be saved, but the data measured
before the battery level drops to the lowest level are
saved.)
KEW6315
How to install batteries:
Install batteries in correct polarity
as marked inside.
Battery power is consumed even if the instrument is being off. Remove all the batteries if the instrument is
to be stored and will not be in use for a long period.
- 17 - KEW6315
Page 20

KEW6315
18
Model name and software version will be displayed upon powering on the instrument. Stop using
the instrument if it does not get started properly, and refer to the
240VAC(±10%)
65Hz
20VAmax
Cord Connection
Voltage test leads
Cord connection
Match the
arrow marks.
Power cord
Rated supply voltage : 100 -
Rated supply frequency : 45 -
Max power consumption :
Start-up Screen
instruction manual.
Clamp sensor
“Trouble-shooting” in the
KEW6315 -
-
Page 21

Instantaneous value: W
19
button to toggle the screens.
Keys to switch the
values
(Integration value)
Sum of measured
(all CHs)
5
5
.
.
I
I
n
n
s
s
t
t
/
/
I
I
n
n
t
t
e
e
g
g
r
r
a
a
t
t
i
i
o
o
n
n
/
/
D
D
e
e
m
m
a
a
n
n
d
d
v
v
a
a
l
l
u
u
u
I
I
n
n
s
s
t
t
v
v
a
a
l
l
u
u
e
e
:
:
“
“
W
W
”
”
e
e
s
s
瞬時値/積算値/デマンド
5
.
I
n
s
t
/
I
n
t
e
g
r
a
Switching screens
t
i
o
n
/
D
e
m
a
n
d
v
a
l
e
s
KEW6315
Press the
I
n
瞬時値「W」
Switching the items to be displayed
Use the right and left Cursor
Keys to switch the avg, max and min inst
W (Inst value)
s
t
v
a
l
u
Wh
e
:
“
W
”
displayed systems and the up and down Cursor
.
Demand
Measured values
-
per CH
values
- KEW6315
Page 22

KEW6315
20
Changes of measured values are displayed on a graph.
Customize
Select and change the items to be displayed.
Instantaneous value: W
Trend
Zoom and display the selected items.
4-split 8-split
Zoom
KEW6315 -
-
Page 23

Integration value: Wh
21
the right and left
Switch and select the items with the up and down
I
I
n
n
t
t
e
e
g
g
r
r
a
a
t
t
i
i
o
o
n
n
v
v
a
a
l
l
u
u
e
e
:
:
“
“
W
W
h
h
”
”
D
D
e
e
m
m
a
a
n
n
d
d
I
n
t
e
g
r
a
t
i
o
n
v
a
l
u
e
:
“
積算値
積算値「「「「WWWWh」
積算値積算値
Switching the measurement items
Select the proper system with
Cursor Keys.
D
e
m
デマンド
Switching the measurement items
h」
h」h」
a
n
d
W
h
”
Cursor Keys and the CH with the up and down
Σ: sum of the all measured values
Σ: sum of measured values per CH
Cursor Keys.
KEW6315
-
- KEW6315
Page 24

KEW6315
22
Meas
period is displayed.
refreshed if any higher demand
Parameters displayed when selecting “
Time left
Count down the time set by: [SETUP] →
[Measurement] → [Demand] → [Measurement].
DEM Target
Set the value by: [SETUP]→ [Measurement]
→[Demand]→[Target].
DEM Guess
Estimate and display the demand value that would
be when this demand interval ends.
Present value x demand interval
Elapsed time from the start of the measurement
DEM Present
Demand value (average power) within a demand
interval.
(Integration values of “WP+”
from the start of measurement) x 1 hour
DEM Max with recorded date
Max demand recorded in a measuring
Displayed value will be
are detected.
Demand interval
.” on the right row.
s
Demand
KEW6315 -
-
Page 25

Demand
23
Target value
DEM G
Percentage of the predicted value against the
Target value
Audible warning
when
cycle
cycle
cycle
interval
Parameters displayed when selecting “
row.
Time left
Count down the time set by: [SETUP] →
[Measurement] → [Demand] → [Measurement].
DEM P
Load factor: percentage of the present value
against the target value. Present value
target value.
Predicted value
”
(Change in specific period)
Target
KEW6315
on the right
the predicted value
exceeds the target value.
warns
Inspection
Inspection
Demand
(Elapsed time)
Inspection
Save point
Prediction
Demand value
(present value)
-
- KEW6315
Page 26

KEW6315
24
(Elapsed time)
isplayed
(Displayed on measurement
Demand
Parameters displayed when selecting “
Measured demand with recorded date
Demand value is displayed with recorded
date & time info where the cursor is located.
Bar graph
White bar: Percentage of hidden pages
Orange bar: Percentage of the present d
pages
Target value
Demand value
Start of demand
Rec. start date& time
”
(Demand change)
Most recent rec. date& time
on the right row.
Cursor
Use the right and left Cursor
Keys to move the cursor.
End of demand
Max measured demand
screen.)
KEW6315 -
-
Page 27

Vector
25
of voltage vector.
vector.
6
6
.
.
V
V
e
e
c
c
t
t
o
o
r
r
Diagram of the selected wiring is
ベクトル
6
.
V
e
c
t
o
r
KEW6315
Wiring diagram
displayed.
Switching screens
Wiring check
Checked results will be displayed.
: toggle the line lengths
1 2 5 10
: toggle the line lengths of current
1 2 5 10
* time(s)
* time(s)
-
- KEW6315
Page 28

KEW6315
26
Keys and check for the waveforms.
Restore all the changed magnification settings and automatically
select the appropriate magnification.
: toggle the magnifications of voltage waveform (vertical).
: toggle the magnifications of
: toggle the magnifications of
7
7
.
.
W
W
a
a
v
v
e
e
f
f
o
o
r
r
m
m
波形
7
.
W
a
v
e
f
o
r
m
Waveform
Switching displayed items
Select the items with up and down Cursor
Measured values
per CH
0.1 0.5
0.1 0.5
1
1 2 5 10
current waveform (vertical).
1 2 5 10
time axis (horizontal).
2 5 10
* time(s)
* time(s)
* time(s)
KEW6315 -
-
Page 29

Harmonic analysis
27
Keys to toggle the CH
scroll the displayed degree of h
8
8
.
.
H
H
a
a
r
r
m
m
o
o
n
n
i
i
c
c
s
s
A
A
n
n
a
a
l
l
y
y
s
s
i
i
s
s
高調波解析
8
.
H
a
r
m
Switching displayed items
Graph
o
n
i
c
s
A
n
a
l
y
s
i
s
KEW6315
Use the up and down Cursor
List
Use the up and down Cursor Keys to
Measured values
per CH
Measured values
per CH
s for checking each harmonic.
armonics.
-
- KEW6315
Page 30

KEW6315
28
Logarithm
Phase angle
Current
Current
Voltage, Linear, Overall display
List, Rate of content
Harmonic analysis
Power
Zoom
RMS value
Power
KEW6315 -
-
Page 31

Harmonic analysis
[Measurement]→[Harmonics]→[MAX hold].
Parameters displayed on graph
KEW6315
Overall display
Rate of content
Harmonic content against the 1st basic wave.
When selecting “Logarithm”, 10% will be the
max percentage of the vertical axis, and the
higher content rates will not be displayed.
Zoom
Harmonic analysis: max. 50th
Graph color
If multiple CHs are used, colors harmonized with
each CH will be used and displayed.
Max value
Max values of each order will be marked and
displayed. To turn on/off this function: [SETUP]→
Scroll bar
White: Overall range up to 50th.
Dark orange: Current displayed area.
Use the left and right Cursor Keys to scroll and zoom the desirable area.
Harmonic analysis: 15/ 50th
Logarithm
Exceeding axis value
Exceeding threshold
Allowable range
Complied with IEC61000-2-4, Class3.
To change the range: [SETUP]→ [Measurement]
→[Harmonics]→[Edit allowable range].
- 29 - KEW6315
Page 32

KEW6315
30
Keys and toggle the occurred events
toggled in the following sequence.
9
9
.
.
P
P
o
o
w
w
e
e
r
r
Q
Q
u
u
a
a
l
l
i
i
t
t
y
y
E
E
v
v
e
e
n
n
t
t
電源品質
9
.
P
o
w
e
r
Q
u
a
l
i
t
y
Switching displayed items
Power quality
E
v
e
n
イベント
イベント
イベントイベント
Switching measurement items
Use the up and down Cursor
Event
t
Flicker
to be displayed on the screen.
KEW6315 -
Displayed events are
All events Swell
Dip Int Transient Inrush current
-
Page 33

Swell/ Dip/ Int/ Inrush current
Me
asured
waveform
Me
asured
waveform
(4)
(5)
(6)
(4)
(5)
(6)
(7)
(8) (9)
(1)
(2) (3)
KEW6315
Measurement method
Swell/ Dip/ Int/ Inrush current
Each event will be detected with the r.m.s. values in one gapless waveform and with a half-wave overlapping. The beginning of the waveform where the first event is detected is regarded as the start of the
event. If further events are not detected in the following waveform, the beginning of the waveform is
regarded as the end of the event. The detected event is assumed to be continued between the start to
the end of event detection.
Example: Dip event detection
*
Int events are detected in the same method.
RMS waveform
rms value(2)
rms value(1)
(1) (2) (3)
Threshold
rms value(4)
rms value(3)
Start of dip
rms value(6)
rms value (5)
rms value(8)
rms value (7) rms value(9)
(7) (8) (9)
Hysteresis
End of dip
duration
Example: Swell event detection
*
Inrush current events are detected in the same method.
RMS waveform
- 31 - KEW6315
rms value(2)
rms value(1)
Threshold
rms value(4) rms value(6) rms value(8)
rms value(3) rms value(5) rms value(7) rms value(9)
Start of swell
End of swell
duration
Page 34

KEW6315
Me
asured
waveform
RMS
waveform
Me
asured
waveform
Transient
Transient
Voltage waveforms will be monitored at approx 40ksps, gapless, to calculate and check for transient event
every 200ms. The beginning of the 200ms period where the first transient is detected is regarded as the
start of the event. If further events are not detected in the following 200ms period, the beginning of the
period is regarded as the end of the event. The detected transient is assumed to be continued between the
start to the end of event detection.
Example: Transient event detection
Start of transient
for approx 200ms
Duration
Threshold value
End of transient
Saved data
When an event occurs and is detected, KEW6315 records the type of the event, start/ end time and the
values. The following data will also be recorded. The event waveform is recorded for 200ms during the
1 sec of the data refresh period.
Event waveform
Waveforms and also event data on all the chs are recorded for approx. 200ms (50Hz: 10-cycle, 60Hz:
12-cycle) at 8192 points in total. When different events occur within 1 sec, only the waveforms which
contain the highest-priority events will be recorded. However, if the same type of events occur at the
same time, the one containing the highest (deepest) values will be recorded. If the highest (deepest)
values are also the same, the one with a longer duration will be recorded. As for the channels, there is
no priority order.
Priority order: Voltage transient-> Int-> Dip-> Swell-> Inrush current
RMS variations
Voltage/ current rms value (resolution: half-cycle) variations and event data on all chs are recorded for
1 sec at data refresh.
Example: Dip detection in 800ms period:
Waveform at event start (approx. 200ms)
Waveform at event end (approx. 200ms)
r.m.s variations at the detection of
KEW6315 - 32 -
event start (approx. 1sec)
r.m.s variations at the detection of
event end (approx. 1sec)
Page 35

Flicker
33
and toggle the items
V
F
F
l
l
i
i
c
c
k
k
e
e
r
r
フリッカ
フリッカ
フリッカフリッカ
F
l
i
c
k
e
r
Switching displayed items
KEW6315
Use the up and down Cursor Keys
Parameters displayed when selecting “
Pst Calc...
Time length required for Pst calculation.
V
Average voltage
Pst((((1min))))
Pst value is displayed and refreshed every
minute.
Short-term flicker (Pst) is displayed and refreshed
every 10 min.
MAX: the max values detected through the start to
the end of measurement, and will be refreshed
every time when the max value is exceeded.
Long-term flicker (Plt) is displayed and refreshed
every 2 hours.
MAX: the max values detected through the start to
the end of measurement, and will be refreshed
every time when the max value is exceeded.
Frequency
The value will be refreshed every second.
Pst
Plt
.
” on the right row.
-
- KEW6315
Page 36

KEW6315
34
Pst(1min)
P
when the max value is exceeded.
when
Cursor
Keys to move.
Flicker
Parameters displayed when selecting “
Pst Calc...
Time length required for Pst calculation.
Pst(1min)
Latest measured value.
Max.
Max values detected through the start to the end
of measurement, and will be refreshed every time
the max value is exceeded.
Trend graph
Change of the latest 120 data Pst(1min.).
Parameters displayed when selecting “
Plt
Plt value and the recorded date & time info where
the cursor is located.
Max.
Max values detected through the start to the end of
measurement, and will be refreshed every time
Bar graph
White bar:percentage of whole pages.
Orange bar:percentage of the present
displayed pages.
Press the right and left
(Elapsed time)
Rec. start time
” on the right row.
lt ” on the right row.
Cursor
Latest rec. time
KEW6315 -
-
Page 37

Setting (SETUP)
)
1
1
0
0
.
.
S
S
e
e
t
t
t
t
i
i
n
n
g
g
設定
1
0
.
S
e
t
t
i
n
g
Press the Key to access to any of the following five settings.
Press the Cursor Keys to move to each setting.
Basic setting Make settings for the items common to each measurment.
Meas. setting Make settings for each measurement mode.
Rec. setting Make settings for recoding.
Saved data Edit the recorded data or alter the instrument setting.
Others Configure the environmental setting.
Each setting
(External input DC)
(Frequency)
Basic
(Wiring)
(Voltage)
(Current)
Measurement
(Demand)
(Harmonics)
(Power quality)
(Flicker)
(Capacitance
Calc.)
Recording
(REC item)
(REC method)
(Manual/
Constant rec./
Time period rec.)
Saved data
(REC data)
KEW6315 setting
KEW6315
Others
(Environment)
- 35 - KEW6315
Page 38

KEW6315
Basic setting
Setting item Details of setting
Setting (SETUP)
(1)1P2W×1
(2)1P2W×2
Wiring
Voltage range 600V/1000V
VT ratio 0.01-9999.99(1.00)
Nominal voltage 50V-600V(100V)
Clamp/ current range
CT ratio 0.01-9999.99(1.00)
DC range 100mV/1.000V/10V
Frequency 50Hz/60Hz
(3)1P2W×3
(4)1P2W×4
* Current terminals that are not used in the selected wiring system can be used to
measure rms currents and harmonics.
8128:5/50A/AUTO
8127:10/100A/AUTO
8126:20/200A/AUTO
8125:50/500A/AUTO
8124/8130:100/1000A/AUTO
8129:300/1000/3000A
8141:
8142: 500mA/AUTO
8143:
8146:
8147: 1/10A/AUTO
8148:
(5)1P3W×1
(6)1P3W×2
Power Clamp sensor
Leakage current Clamp sensor
(7)3P3W×1
(8)3P3W×2
(9)3P3W3A
(10)3P4W
* Default values are highlighted in gray.
KEW6315 - 36 -
Page 39

Setting (SETUP)
Measurement setting
Setting item Details of setting
Interval Not be used/ 10min/15min/30min
Demand
Harmonics
Power quality
Flicker Filter (Ramp) 230V/220V/120V/100V
Capacitance
calculation
Inspection
cycle
Target 0.001mW-999.9TW(100.0kW)
THD(total harmonic distortion) calc. THD-F(based on the fundamental waveform)/
Allowable range Default/ customize(V/A)
MAX HOLD ON/OFF
Hysteresis against nominal V: 1 to 10%(5%)
Transient against nominal V: ±50 to ±2200Vpeak(300%)
Swell against nominal V: 100 to 200%(110%)
Dip against nominal V: 0 to 100%(90%)
Int against nominal V: 0 to 100%(10%)
InrushCurrent against “A” range: 0 to 110%(100%)
Interval: 10min/ 15min 1min/2min/5min
Interval: 30min 1min/2min/5min/10min/15min
THD-R(based on all rms values)
Target PF 0.5-1(1.000)
KEW6315
Recording setting
Setting item Details of setting
Recording
item
Recording
method
Constant
measurement
Timer
Harmonics Record/ Do not record
Power quality (event) Record/ Do not record
Interval
Start Manual/Constant rec./Time period rec.
Rec. period
Time period Start-End Hour: Minute (hh:mm)- Hour: Minute (hh:mm)
Save setting
Setting item Details of setting
REC data
KEW6315 setting
1sec/2sec/5sec/10sec/15sec/20sec/30sec/
1min/2min/5min/10min/15min/20min/30min/
1hour/2hours/150,180 cycles (approx 3sec)
REC Start Day/ Month/ Year Hour: Minute (00/00/0000 00:00)
REC End Day/ Month/ Year Hour: Minute (00/00/0000 00:00)
Start-End Day/ Month/ Year (DD/MM/YYYY)- Day/ Month/ Year (DD/MM/YYYY)
* Default values are highlighted in gray.
Delete data.
Transfer data.
Format
Save setting.
Read settings.
- 37 - KEW6315
Page 40

KEW6315
1
1
1
1
.
.
S
S
D
D
C
C
a
a
r
r
d
d
/
/
S
S
a
a
v
v
e
e
d
d
D
D
a
a
t
t
a
a
Other settings
Environment
KEW6315
setting
Setting item Details of setting
Language* Japanese/ English
Date format* YYYY/MM/DD / MM/DD/YYYY / DD/MM/YYYY
CH color*
Time* dd/mm/yyyy hh:mm:ss
ID Number 00-001 to 99-999(00-001)
Buzzer ON/OFF
Bluetooth ON/OFF
Power
Backlight
System reset
*Items listed with “*” mark will not be restored to default even after the system is reset.
* Default values are highlighted in gray.
AC power Power off in 5 min./Disable auto-off
Battery Power off in 5 min.
AC power Power off in 5 min./Disable auto-off
Battery Power off in 2 min.
white/ yellow/ orange/ red/ gray/ blue/ green
The selected colro for VN is refected on the wiring diagram only.
Reset the system. Confirmation message appears before
resetting the system.
Saved data
SD カード/保存データについて
1
1
.
S
D
C
a
r
d
/
S
a
v
e
d
D
a
t
a
Possible recording time
When the 2GB of SD is used:
REC item
Interval
1sec 13days
2sec 15days
5sec 38days
10sec 2.5months
15sec 3.5months
20sec 5months
30sec 7.5months 1.5months
1hour
2hours
150/180-cycle
* Data of power quality events are not considered to estimate the possible recording time.
The max possible time will be shortened by recording such events.
* Please ensure to use the SD cards provided with this instrument or as optional parts.
Power +Harmonics
3days
3days
7days
15days
23days
1month
Interval
1min
2min
5min
10min
15min
20min
30min
Power +Harmonics
1-year or more
2-year or more
6-year or more
10-year or more
REC item
23days
3months
6months
1-year or more
2-year or more
3-year or more
5-year or more
7-year or more
10-year or more
4days
KEW6315 38
Page 41

Saved data
|
File name:
Folder name:
Saved data
The file name will be assigned automatically. File no. is kept and saved, even after powering off the
instrument, untill the system is reset. The file number will increase until it exceeds “999”.
KEW6315
Print screen:
Press the to save the screen images as BMP files in the root directory on the SD card.
File name: PS-
|
Dest. code
* Dest. = Destination
KEW6315 Setting:
Data folder:
Press the key and move to “Saved data” tab, and then select “Save Settings”.
New folder will be created per measurement to save the interval and power quality data.
|
Interval data
KEW6315 setting
Measurement setting
Power measurement
Harmonics measurement
SD
SD:SD card
ME:Internal memory
SUP
S 0000 .PRE
000
File No.
(000-999)
.BMP
Extension
(BMP file)
| |
Dest. code
S:SD card
M:Internal memory
/ KEW
/ S
Dest. code
S:SD card
M:Internal memory
File name SUP
INI S
INP S
INH S
SD:SD card
M:Internal memory
Dest. code
File No.
(0000-9999)
(0000-9999)
S
|
0000
|
Data No.
Data No.
(0000-9999)
0000 .KEW
0000 .KEW
0000 .KEW
0000 .KEW
|
|
39 KEW6315
Power quality data
Event type
Waveform
V/ A change
|
File name EVT
WAV
VAL
S:SD card
M:Internal memory
S
S
S
Dest. code
(0000-9999)
0000 .KEW
0000 .KEW
0000 .KEW
|
Data No.
Page 42

KEW6315
●
Saved items
The following data measured on each CH will be saved according to the selected recording method.
Saved items are depending on the selected recording method and wiring system.
REC file REC item
Power +Harmonics +Event
RMS voltage (line/ phase)
RMS current
Active power
Reactive power
Apparent power
Power factor
Frequency
Neutral current(3P4W)
Power
measurement
Harmonics
measurement
V/ A Change
Event type
Waveform
V/ A phase angle
Analog input voltage,
V/A unbalance ratio
1-min Voltage flicker
Short-term V Flicker (Pst)
Long-term V Flicker (Plt)
Capacitance calculation
Active power energy
Reactive power energy
Apparent power energy
Reactive power energy
Demand (W/VA)
Target demand (W/VA)
Total harmonic distortion of V(F/R)
Total harmonic distortion of A(F/R)
Harmonic V/ A(1-50th order)
V/ A phase angle (1-50th order)
V/ A phase difference (1-50th order)
Harmonic power(1-50th order)
RMS voltage per half-cycle
RMS current per half-cycle
Event detected date&time
Event type
Measured values at event detection
V/A waveform
(1st order)
(consumption/ regenerating)
(consumption) lagging/ leading
(consumption/ regenerating)
(regenerating) lagging/ leading
1CH, 2CH
● ● ●
●
●
●
Meas./ Rec. setting
Saved items
KEW6315 40
Page 43

Data transfer
KEW6315
Data transfer
1. SD card and USB
Data in the SD card or the internal memory can be transferred to PC using USB connection or
SD card slot/ reader.
Method of transfer
USB Card reader
SD card data (file) △*1 O
Internal memory data (file) O ---------
*1
: It is reccomended to transfer the large data by use of SD card since transfering large data files by
USB requires more time than using the SD card reader. (transfer time : approx 320MB/ hour)
As to the manipulation of SD cards, please refer to the instruction manual attached to the card.
In order to save data without any problem, make sure to delete the files other than the data measured
with this instrument from the SD card beforehand.
USB
SD card
Internal memory/
SD card data
SD card slot or
card reader
2. Bluetooth
Measuring data can be checked on android devices in real-time via Bluetooth communication.
It is necessary to enable Bluetooth function prior to using Bluetooth communication.
(Setting No. 26: Bluetooth)
Before starting to use this function, download the special application “KEW Smart” from the Internet site.
The application “KEW Smart” is available on the download site for free. (Internet access is required and
charges may be incurred.)
41 KEW6315
Bluetooth
Android device
Page 44

KEW6315
MEMO
KEW6315 - 42 -
Page 45

DISTRIBUTOR
Kyoritsu reserves the rights to change specifications or designs described in this
manual without notice and without obligations.
01-14 92-2160
 Loading...