

Page 1

User Manual
TAP CURIOUS
DO0281R01 • 9/4/2018
Page 2

Table of Contents KUNBUS GmbH
Table of Contents
1 Working safely ................................................................................................................................................3
2 Scope of delivery............................................................................................................................................4
3 Introduction.....................................................................................................................................................5
4 Overview..........................................................................................................................................................6
4.1 Power supply ............................................................................................................................................8
4.2 Digital input and output ...........................................................................................................................10
4.3 Uplink interface .......................................................................................................................................11
4.4 Test inputs ..............................................................................................................................................13
4.5 Filter and overflow LEDs.........................................................................................................................15
5 Application examples...................................................................................................................................16
6 Starting TAP for the first time .....................................................................................................................17
7 Filters ............................................................................................................................................................19
7.1 Why do we use filters?............................................................................................................................19
7.2 Setting filters ...........................................................................................................................................21
7.2.1 Settings in Basic mode ............................................................................................................... 23
7.2.2 Settings in Expert mode.............................................................................................................. 28
7.3 Tabulated list of filter registers................................................................................................................36
8 Monitoring the interface...............................................................................................................................49
9 Refreshing the web server...........................................................................................................................52
10 Errors and problems ....................................................................................................................................56
11 Technical Data ..............................................................................................................................................57
11.1 Application examples..............................................................................................................................57
ii DO0281R00
Page 3

1 Working safely
Intended use
The use of TAP CURIOUS described in these instructions serves to analyze
Ethernet-based data flows. Using TAP CURIOUS for any alternative purpose is not
envisaged and can lead to loss or damage. TAP CURIOUS must not be used for
illegitimate or unlawful data espionage.
User
You are allowed to use TAP CURIOUS if you have knowledge of and
authorizations for the following areas:
– assessing the safety of electrical systems and equipment,
– installing and configuring IT systems,
– measuring and analyzing electrical functions and systems,
– occupational health and safety,
– assembling and connecting-up electrical equipment,
– accident prevention and occupational safety regulations applicable at the place
of use.
Avoiding hazards
Working safely
NOTICE
Defect caused by excessive signal voltage
Excessive signal voltage can damage TAP CURIOUS.
Apply only signal voltage that conforms to the standard.
DO0281R00 3 / 58
Page 4

2 Scope of delivery
– Box
– TAP CURIOUS
– Power pack with Euro adapters
– Plug for the power supply
– Plug for the digital input and output
– Operating instructions, Wireshark plugins and web server files on USB stick
(the latest version can be found at www.kunbus.de/support.html)
Scope of delivery
DO0281R00
4 / 58
Page 5

3 Introduction
The KUNBUS TAP CURIOUS is your network monitor for analyzing all standard
industrial Ethernet solutions. Four probe ports allow you to capture up to two
independent realtime Ethernet connections.
You can use filters to reduce data volumes or select specific analysis data. You
can configure these filters via an integrated web server. The web server can
operate in 2 different modes. "Basic" mode helps you set your filters and configure
your device. "Expert" mode was developed for people with expert knowledge of
frame filters. In this mode, you can filter a frame by all the aspects it contains.
The digital input and output allows you to create useful trigger conditions. These
can systematically help limit sporadic effects, and identify and remedy the causes.
An internal throughput delay of 0µs (zero delay) makes TAP CURIOUS almost
transparent for the data channels to be checked.
TAP CURIOUS is connected to a PC via a standard Ethernet interface. You can
operate TAP CURIOUS in 1 Gbit/s or 100 Mbit/s mode. Captured packet data is
read and analyzed using network monitors such as "Wireshark", the freely
available network analysis software.
Introduction
DO0281R00 5 / 58
Page 6
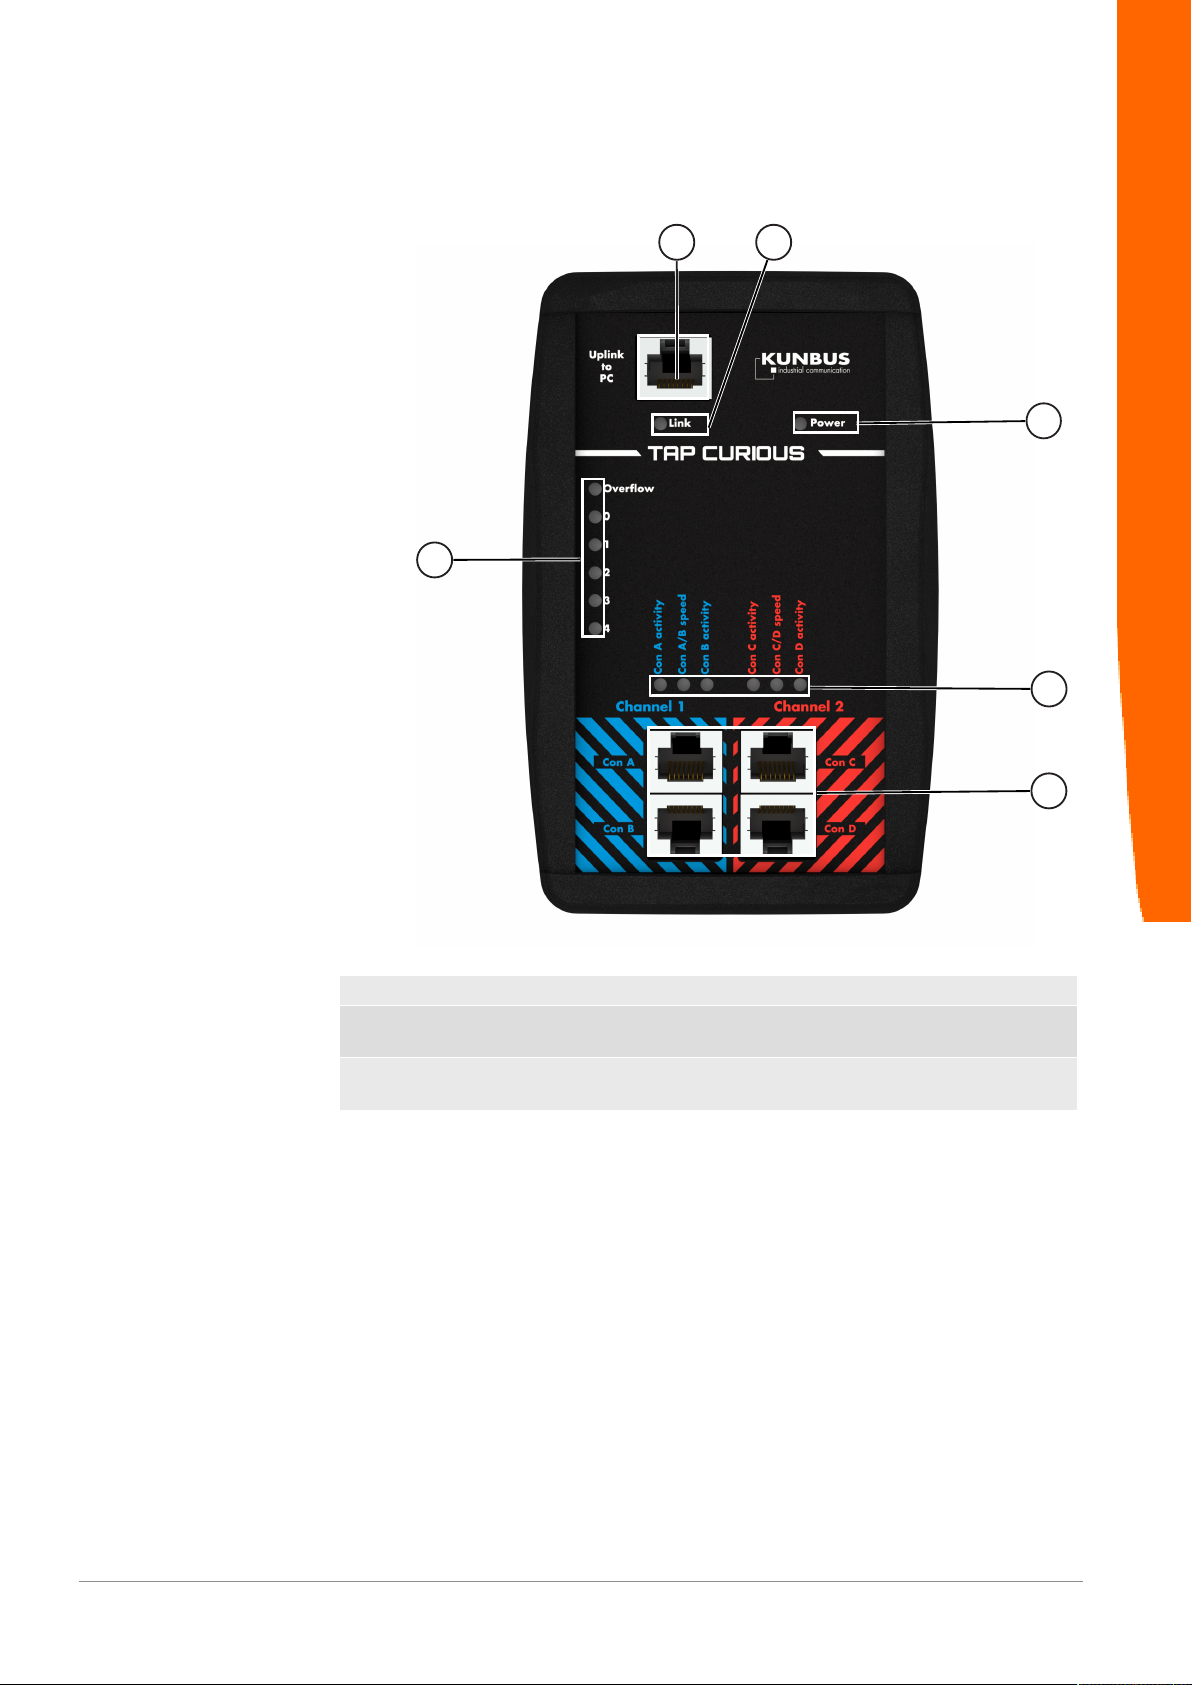
4 Overview
3
4
1 2
5
6
Overview
Illustration1: Front
1 Uplink port 2 Link LED
3 Power LED 4 Status LEDs for the 2
communication channels (5)
5 Monitoring ports
(2 communication channels)
6 LEDs for filter and overflow
DO0281R00
6 / 58
Page 7
1
2
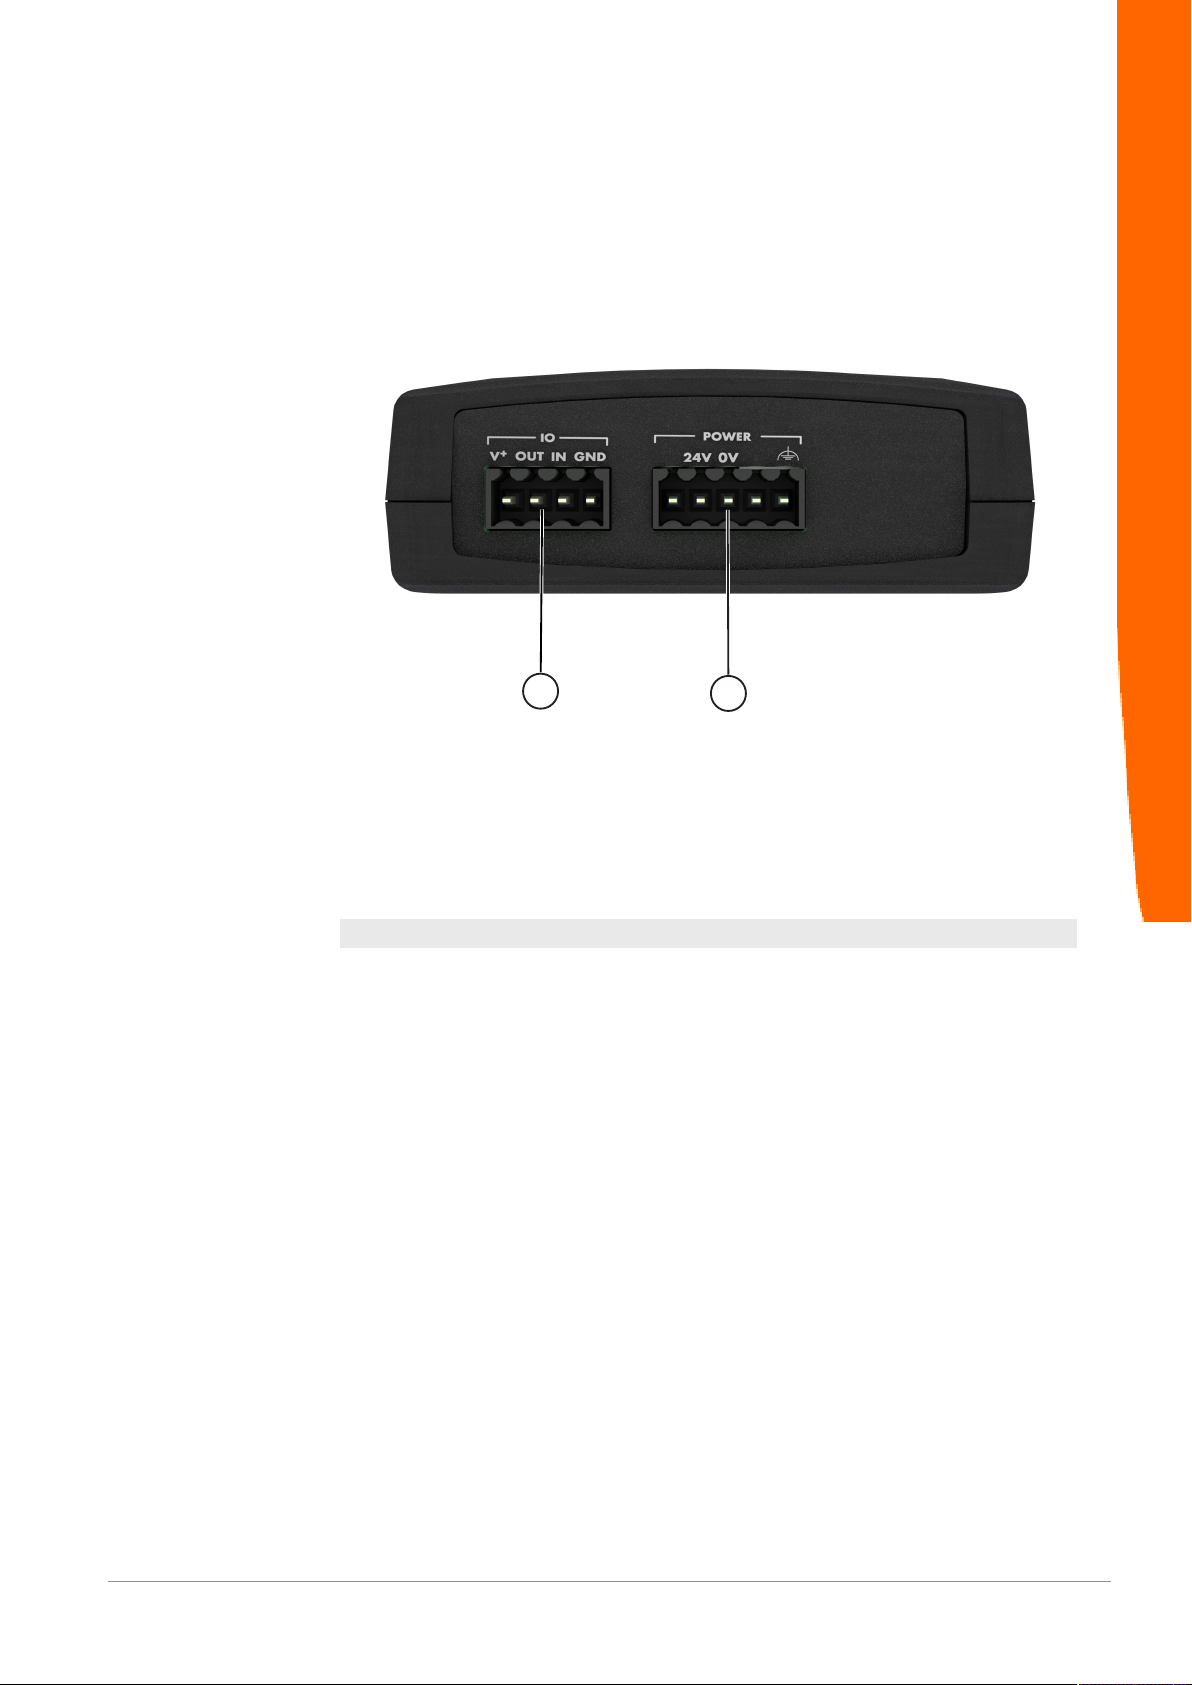
Overview
Illustration2: Top
1 Port for the power supply 2 Digital input and output
Each overview point is explained in the sections below.
DO0281R00 7 / 58
Page 8
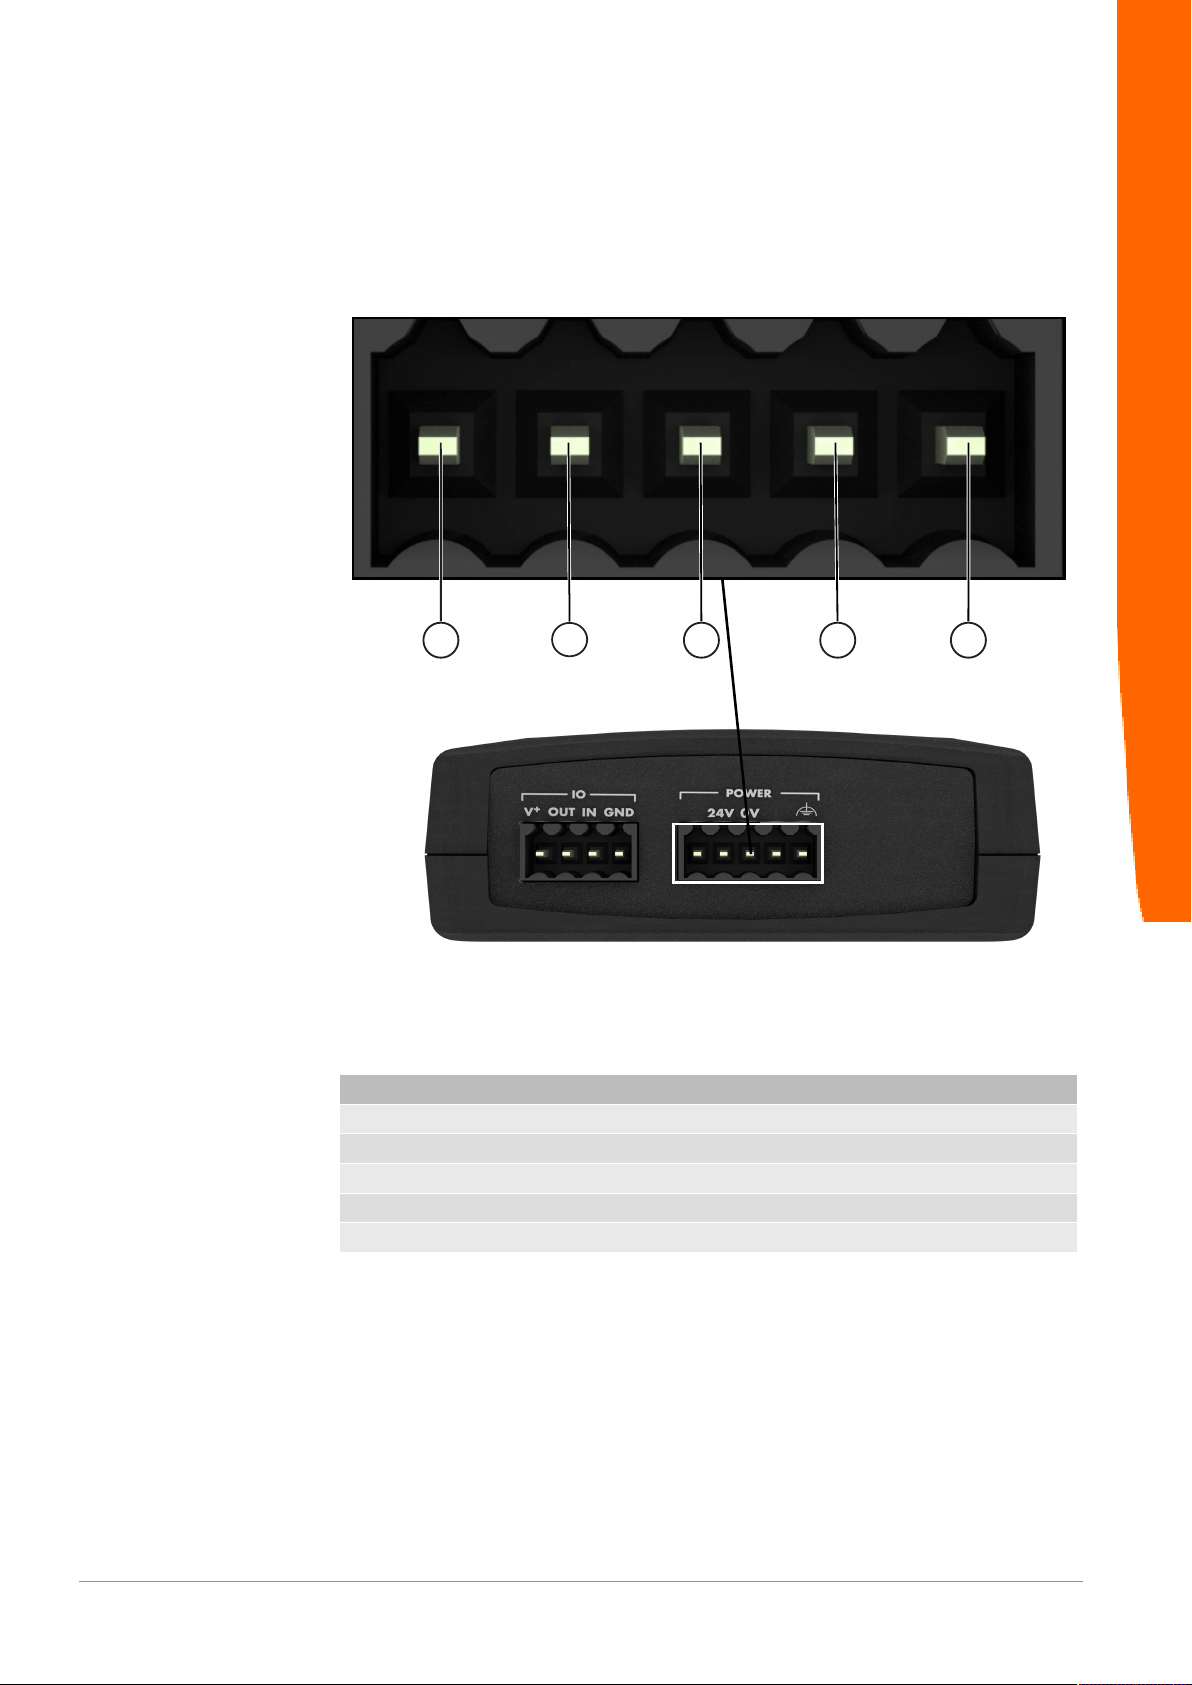
4.1 Power supply
1
2
3 4 5
TAP CURIOUS is connected to the power supply pack via a 5-pole plug. The plug
is supplied as standard.
Overview
Illustration3: Power supply
The port is assigned as follows:
Pin Assignment
1 DNC
2 20-28V
3 GND
4 DNC
5 PE
The Power LED indicates whether or not TAP CURIOUS is connected to the power
supply:
DO0281R00
8 / 58
Page 9

Overview
LED Display Meaning
Power off TAP CURIOUS is not connected to the power supply.
green TAP CURIOUS is connected to the power supply.
DO0281R00 9 / 58
Page 10
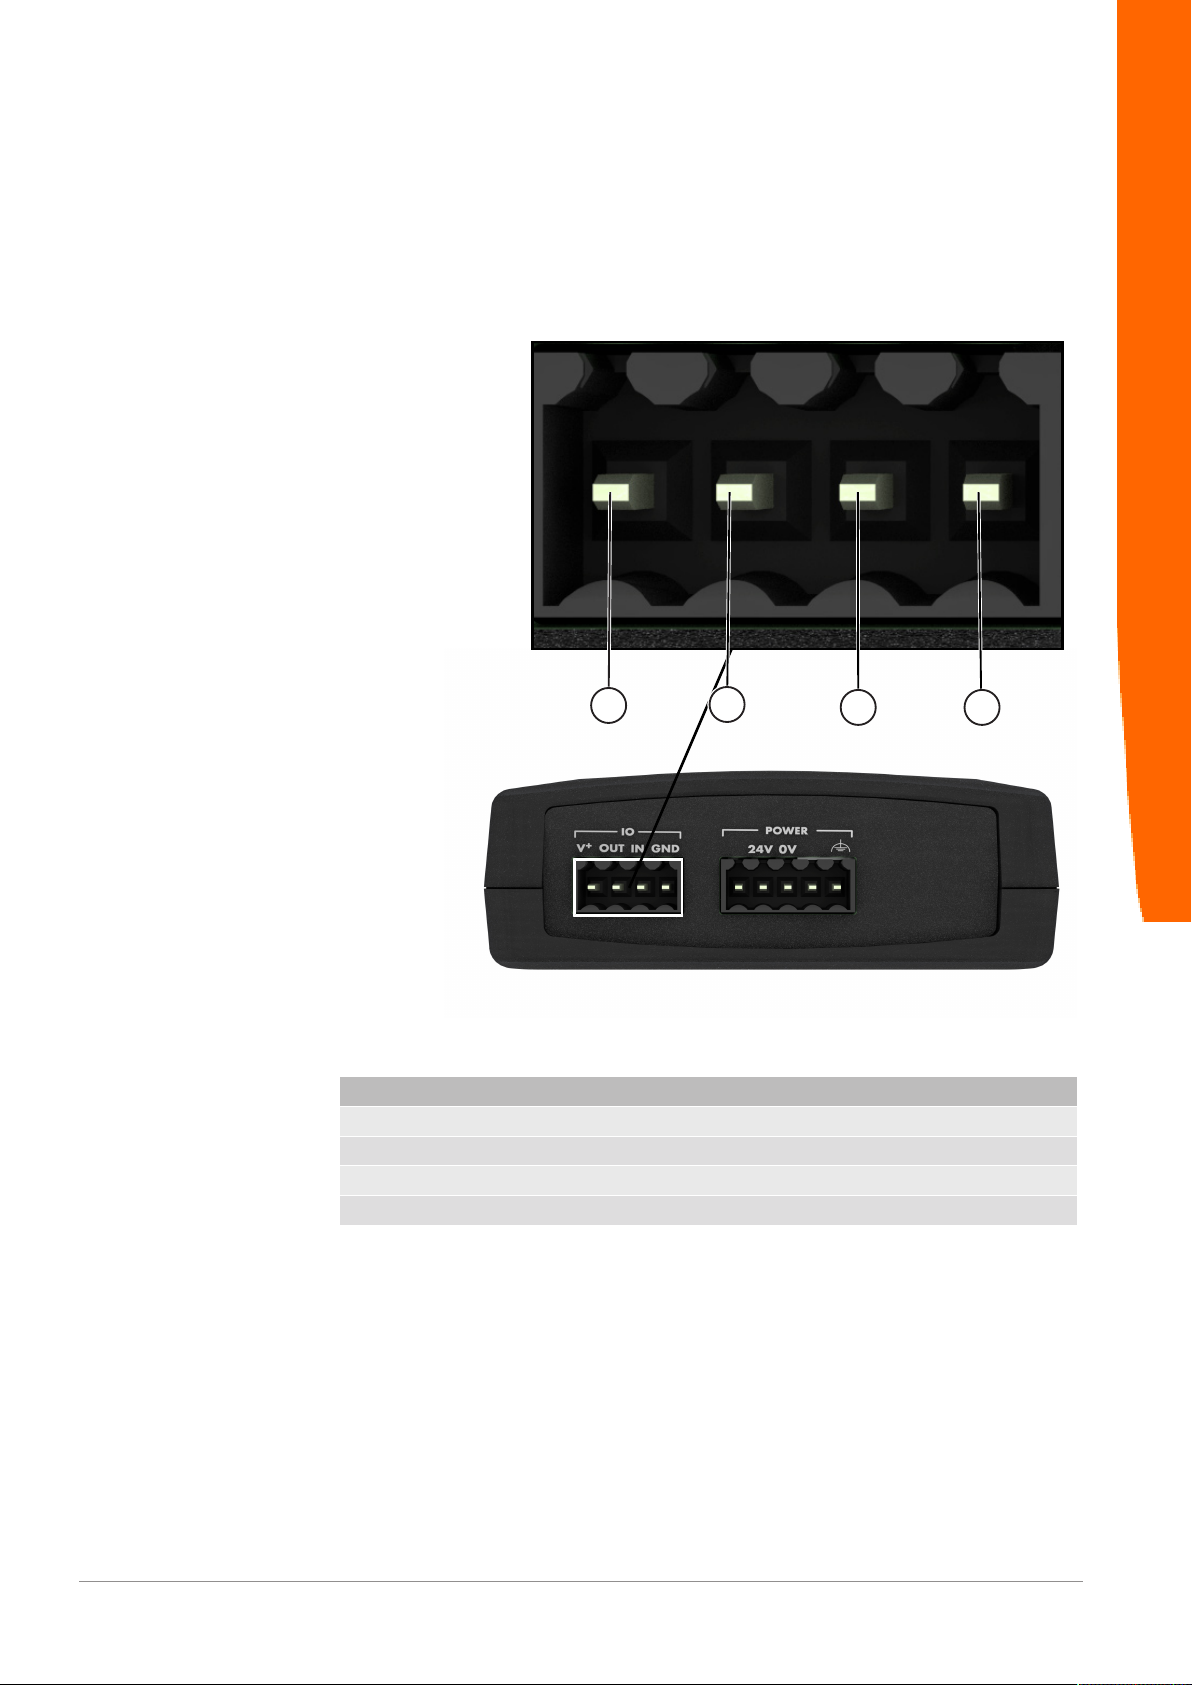
4.2 Digital input and output
1
2
3 4
TAP CURIOUS has a digital input and output. This is protected against reverse
polarity. The terminal (Weidmüller BLZF 3.50/04/180 SN BK BX) designed for the
digital input and output is supplied as standard.
Overview
DO0281R00
The port is assigned as follows:
Pin Assignment
1 20-28V
2 Digital output
3 Digital input
4 GND
10 / 58
Page 11
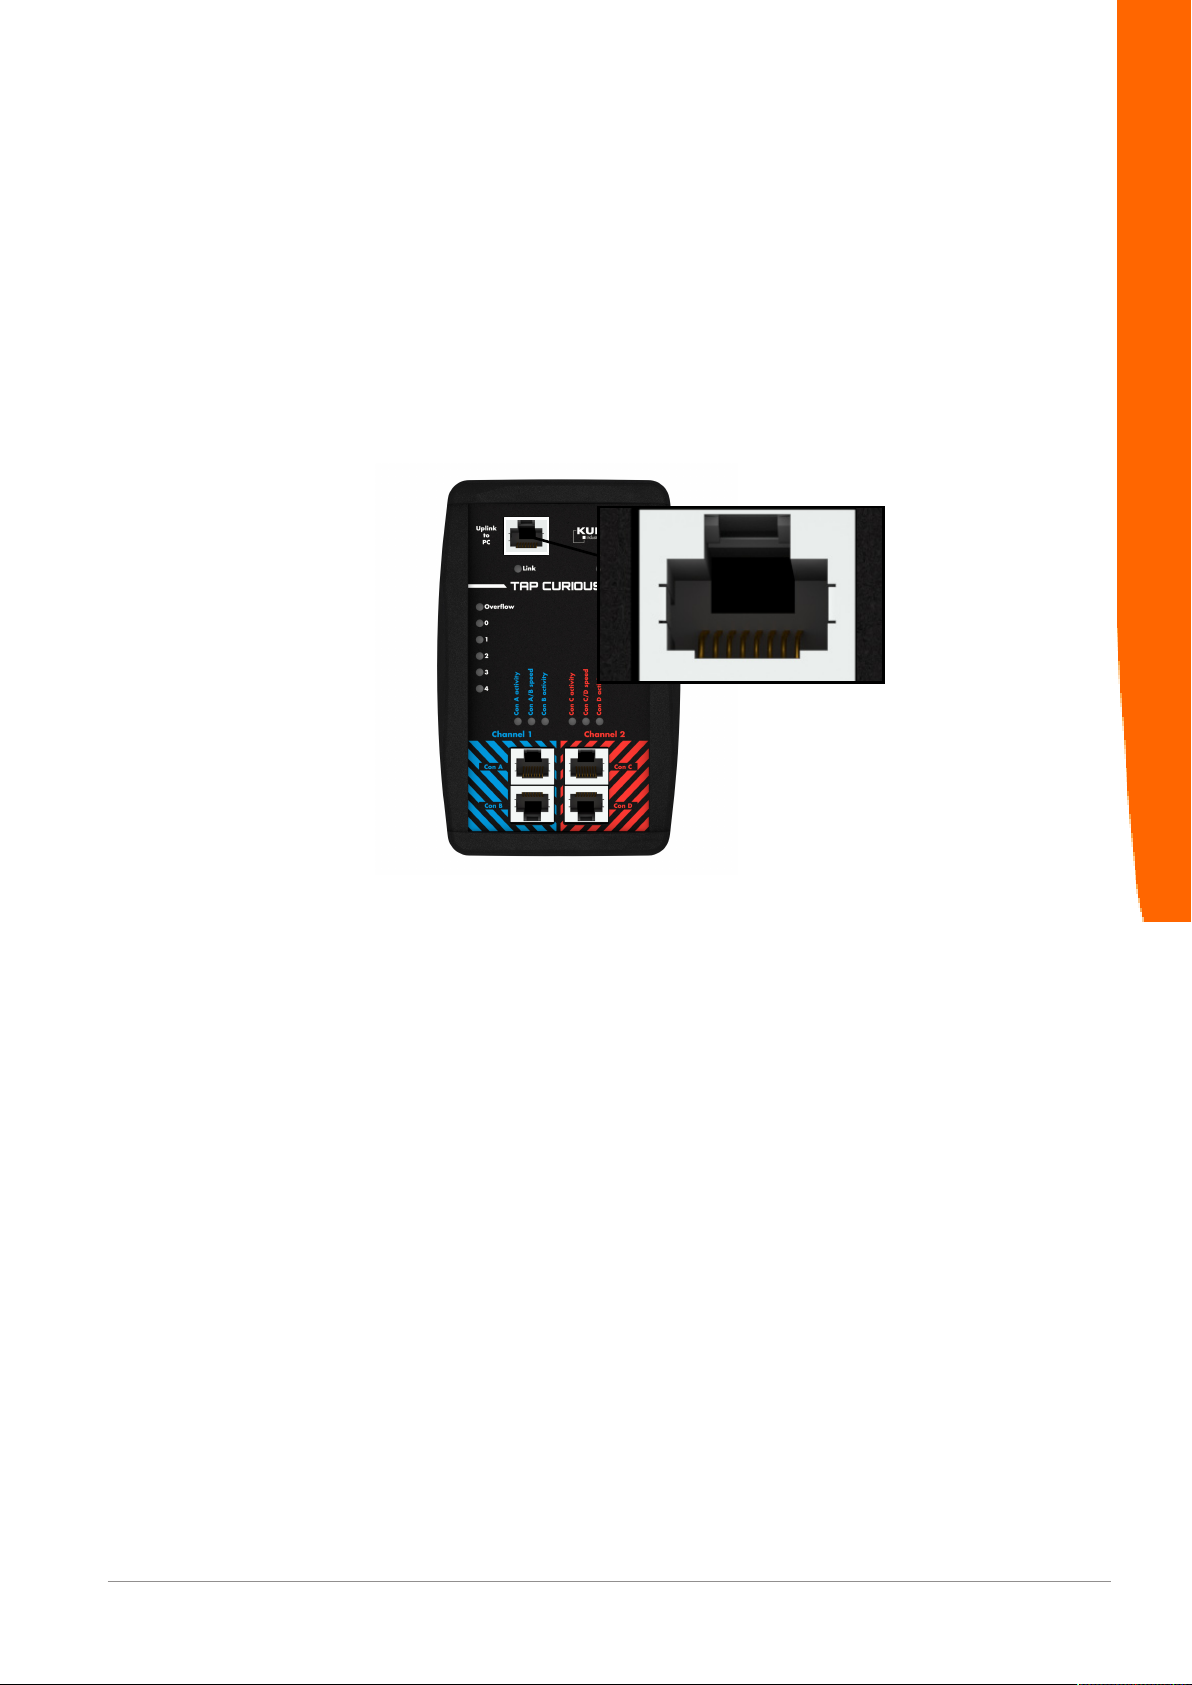
4.3 Uplink interface
You can connect TAP CURIOUS to your PC via the uplink interface.
To do this, you need an Ethernet cable with standard RJ45 plugs.
If your PC does not have a free RJ45 port, you can use a USB adapter.
Overview
Illustration4: Gigabit interface
The "Link" LED indicates the interface status:
DO0281R00 11 / 58
Page 12
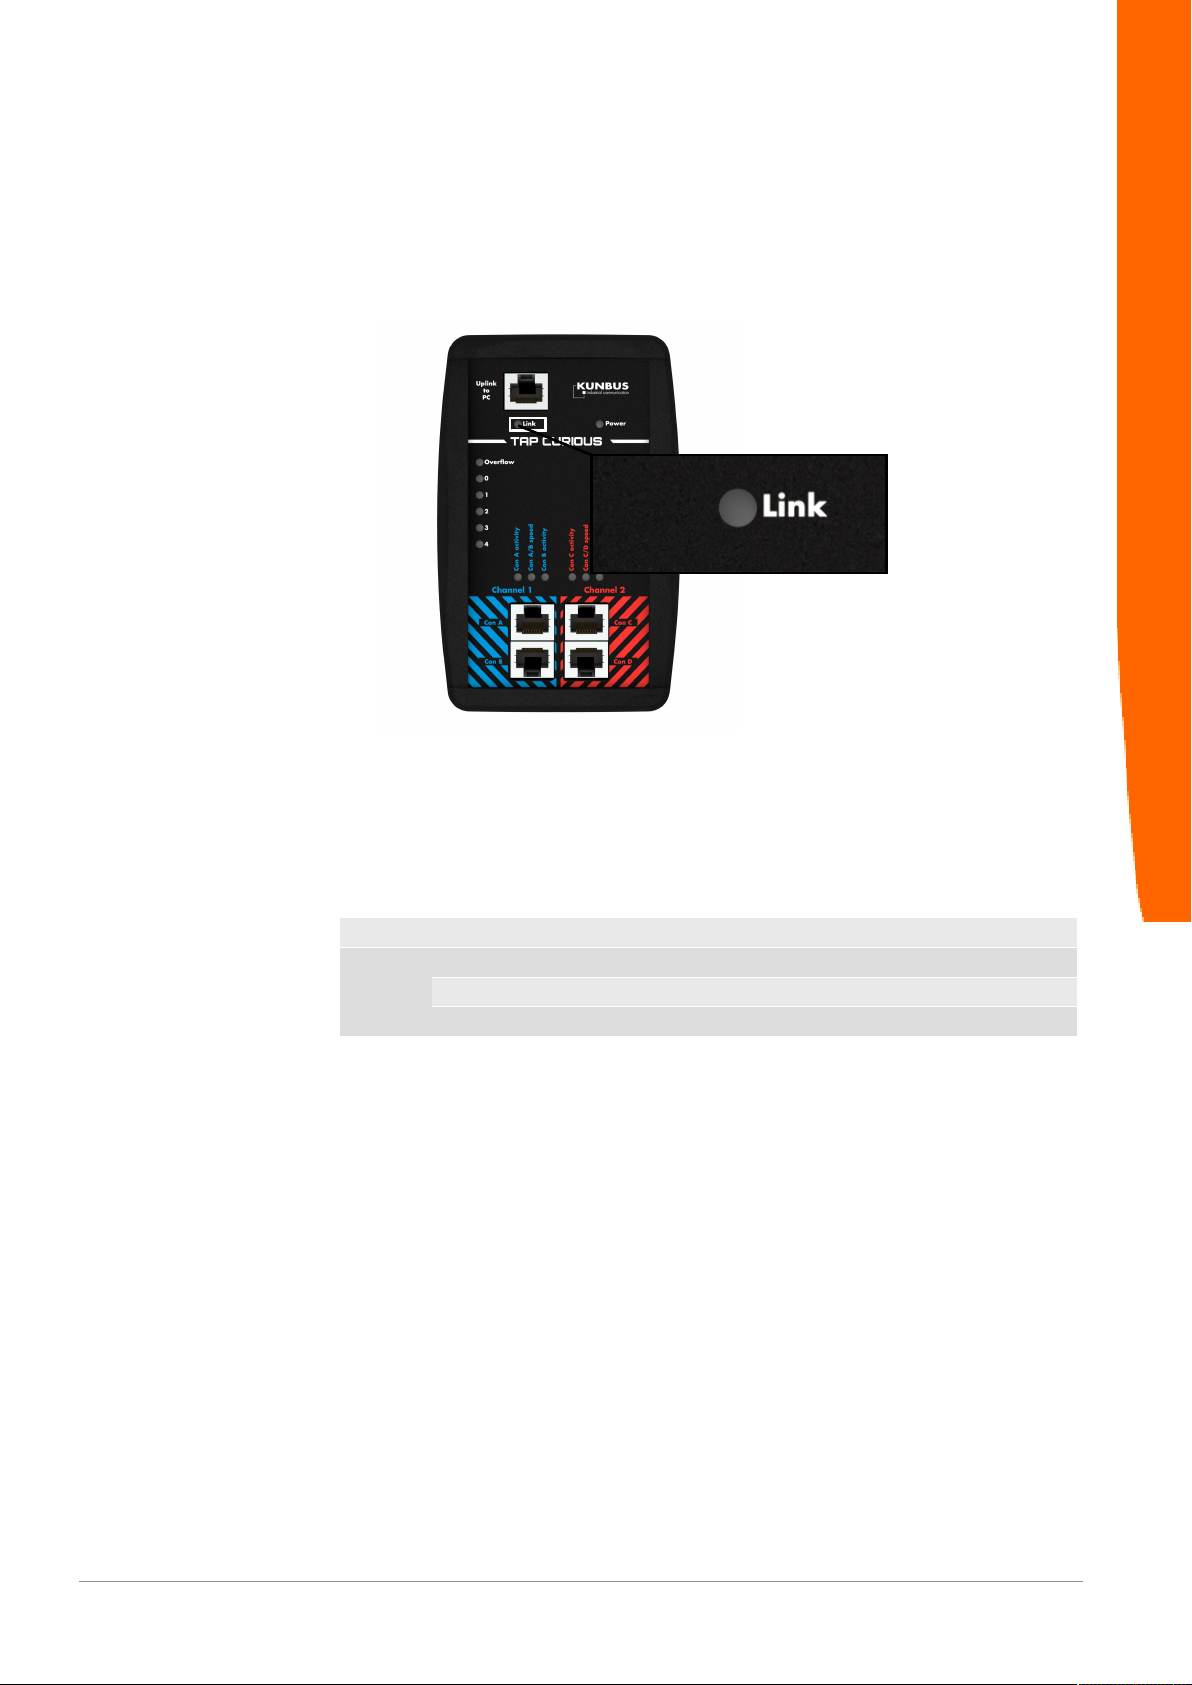
Overview
LED Display Meaning
CC-Link off No connection to the remote station
green Successfully connected to the remote station
yellow flashing Communication running
DO0281R00
12 / 58
Page 13
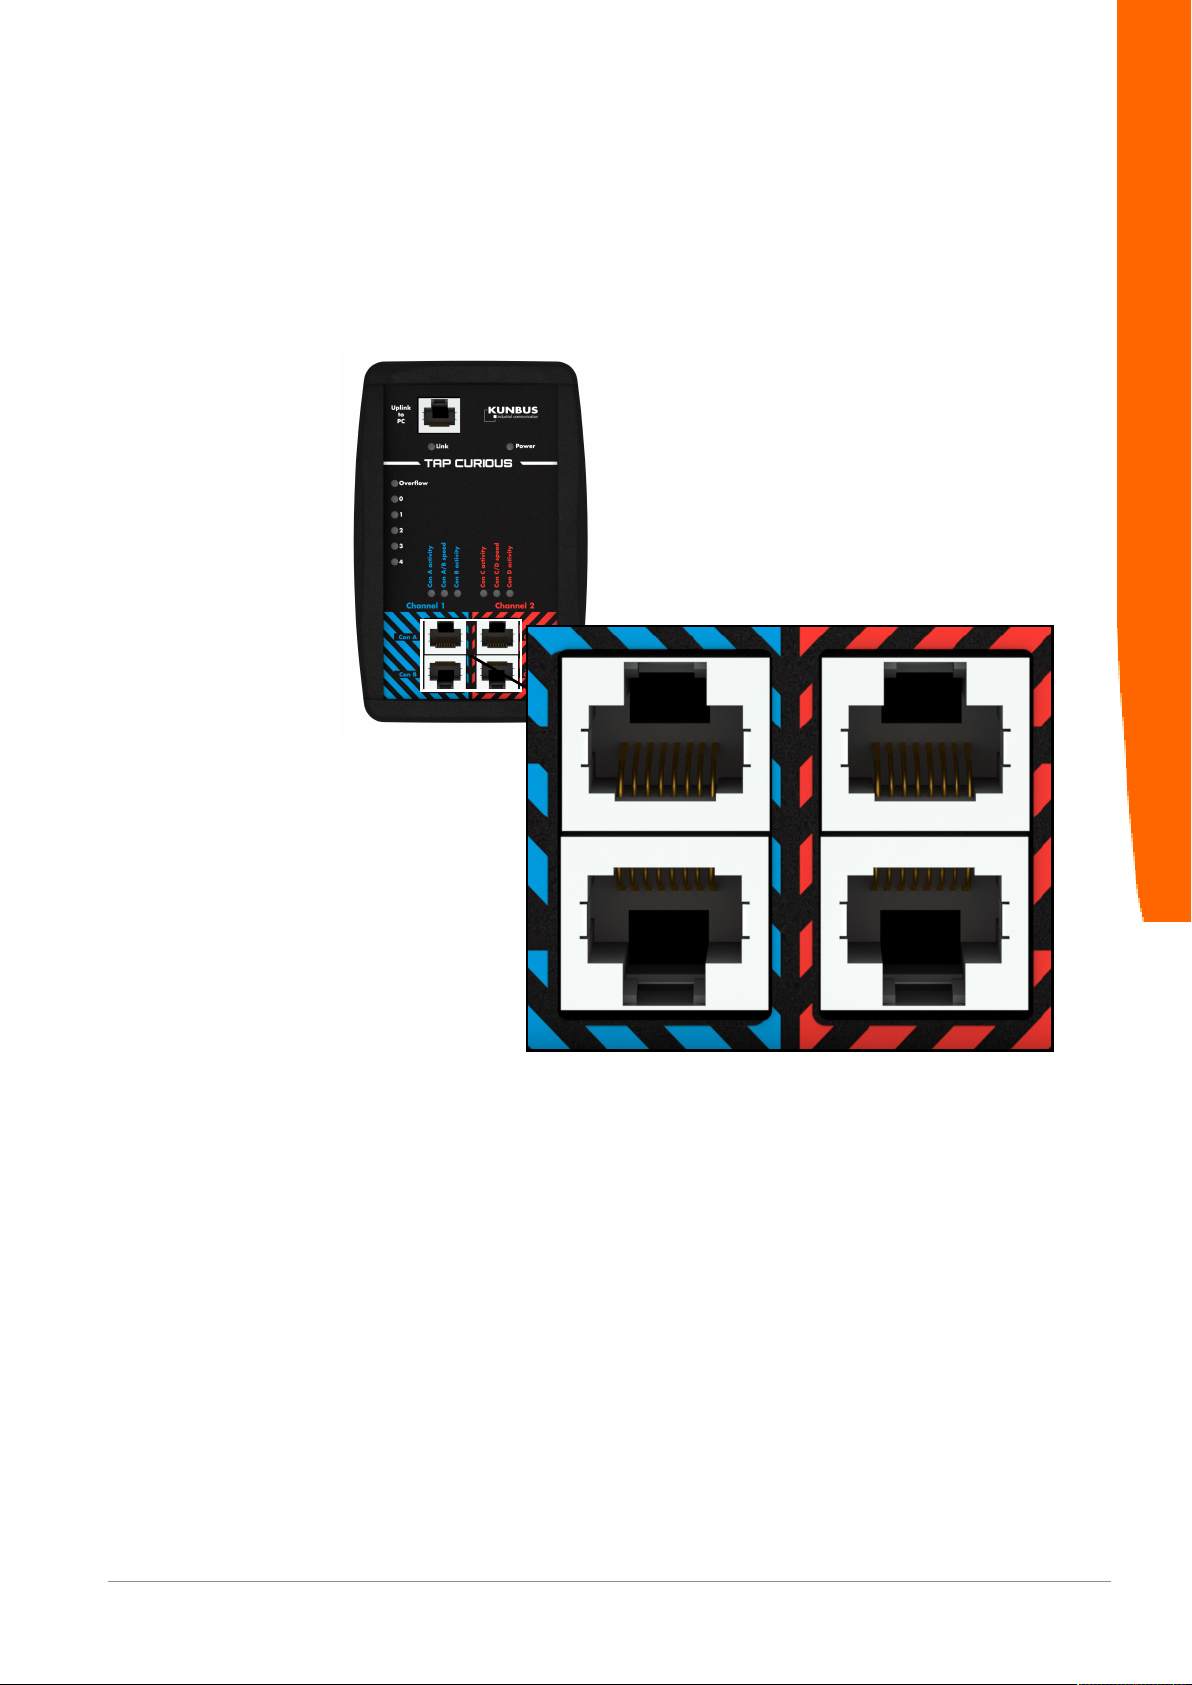
4.4 Test inputs
TAP CURIOUS has 2 communication channels for monitoring the lines. Each of
the ports Con 1 and Con 2, as well as Con 3 and Con 4, are connected directly to a
communication channel.
You can connect the ports to a device via an Ethernet cable with standard RJ45
plugs.
Overview
Illustration5: Test inputs
Status LEDs signal the status of the individual ports:
DO0281R00 13 / 58
Page 14

Overview
LED Display Meaning
Con (A, B ,C, D) activity off No communication
green flashing Communication running
red Frame has been blocked by a filter
(burn time 500ms), it is not output
via the uplink
Con (A, B ,C, D) speed green 100 Mbit/s mode
yellow 10 Mbit/s mode
DO0281R00
14 / 58
Page 15
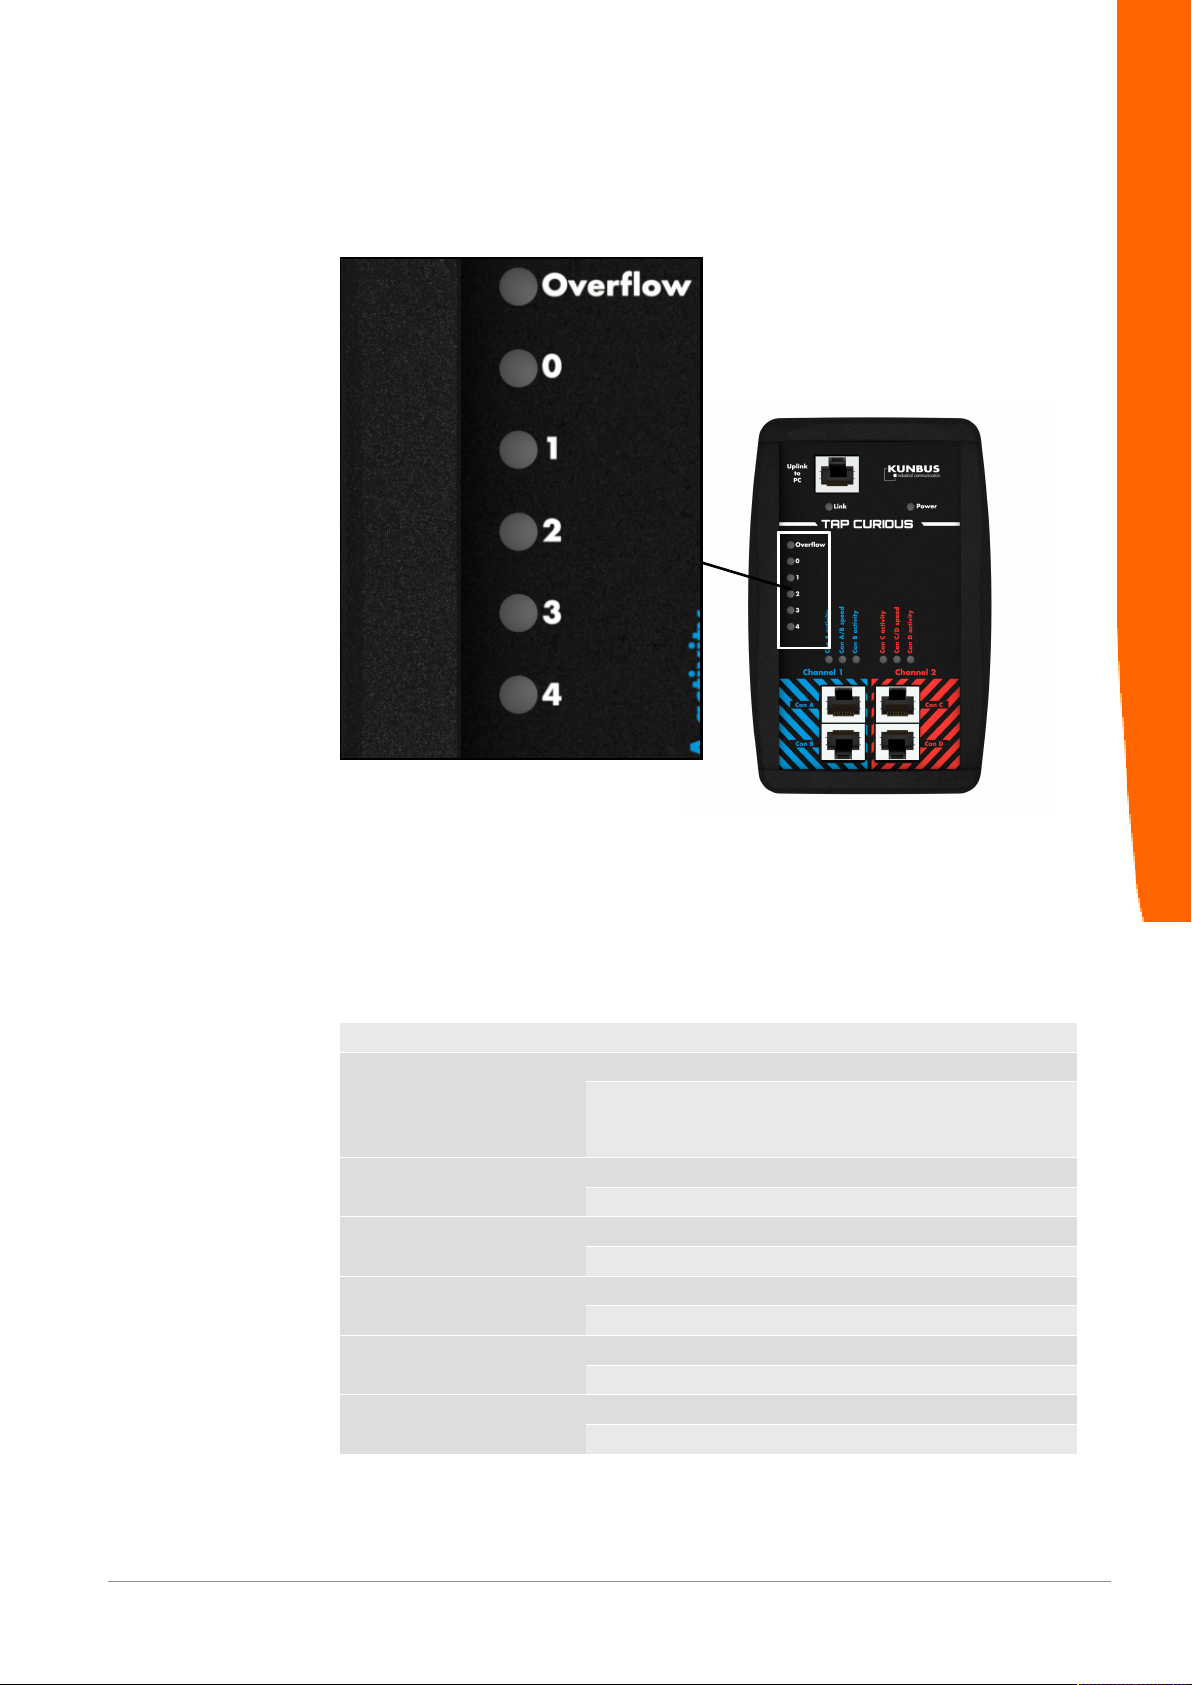
4.5 Filter and overflow LEDs
You can apply filters to the frames. The LEDs are able to show these filter results.
The "Filters [}19]" chapter explains how this works.
Overview
LED Display Meaning
Overflow off No overflow on uplink port
red Only in 100 Mbit/s mode:
Overflow on uplink port
(burn time 2s)
Filter LED0 off No filter match
green Filter match
Filter LED1 off No filter match
green Filter match
Filter LED2 off No filter match
green Filter match
Filter LED3 off No filter match
green Filter match
Filter LED4 off No filter match
green Filter match
DO0281R00 15 / 58
Page 16

5 Application examples
TAP CURIOUS is able to monitor devices in various ways. 2 examples are shown
here.
Example 1:
Connect your devices as shown to capture the communication between two
devices. This allows you to find faulty frames on the network.
Application examples
Example 2:
Connect your devices as shown to monitor the frames before and after a device
throughput. In this example, device 2 is monitored. Here, you could analyze the
following:
– Measure the device throughput time,
– Check whether frames have been distorted or truncated,
– Measure jitter on cyclical frames.
DO0281R00
16 / 58
Page 17

6 Starting TAP for the first time
◦ Unpack the device and make sure you have all the components listed in the
scope of delivery.
◦ Connect the device to the power pack supplied.
ð The POWER LED lights up.
◦ Load the "Wireshark" network analysis software onto the PC and install it. You
can download Wireshark from www.wireshark.org.
◦ Download the Wireshark plugin.DLL from the KUNBUS website and copy the
DLL file into the Wireshark plugin folder (e.g.: C:\Programs\Wireshark\plugins
\1.10.2). Download the correct DLL file for either the 32 or the 64-bit Wireshark
version, depending on which one you use:
- 32-bit version: tap32_1xxx.dll (Wireshark-Plugin WIN32)
- 32-bit version: tap32_2xxx.dll (Wireshark plugin WIN32)
- 64-bit version: tap64_1xxx.dll (Wireshark plugin WIN64)
- 64-bit version: tap64_2xxx.dll (Wireshark plugin WIN64)
xxxx denotes the version used (e.g. 1.10.2)
◦ Connect TAP CURIOUS to an Ethernet interface on the PC using a RJ45
cable. Die "Link" LED lights up as as soon as the PC and TAP CURIOUS are
connected.
◦ Connect the line to be tested to one of the probe ports. Each of the ports "Con
A" and "Con B" and ports "Con C" and "Con D" are connected directly. So
communication is possible even when TAP is deactivated. The "Speed" LEDs
show the connection speed set for the probe ports. When frames are being
transmitted on the line, the "Activity" LED flashes green.
◦ Start Wireshark on the PC and activate the "TAP" plugin in the menu at "Edit >
Preferences > Protocols > TAP".
Starting TAP for the first time
Illustration6: Wireshark plugin
◦ All available Ethernet interfaces are listed in the main window. Click on the
Ethernet interface you require to select it.
◦ Set any filters you want via the web server. This allows you to search for
specific frames and prevents your PC's main memory from becoming
overloaded.
ð You can now use Wireshark to analyze the data.
DO0281R00 17 / 58
Page 18

TAP CURIOUS expands the Ethernet packets by 20 bytes of additional
information. You can use TAP CURIOUS without the plugin or with a different
Ethernet analysis program. But you will not be able to analyze this additional
information. You might also find that the analysis program reports a data packet as
faulty due to this additional information.
Information on the additional data can be found in the chapter called "Monitoring
the interface [}51]".
Starting TAP for the first time
DO0281R00
18 / 58
Page 19

7 Filters
7.1 Why do we use filters?
TAP CURIOUS records all Ethernet frames transmitted on the connected network
line. TAP sends the Ethernet frames to the connected PC via the "Uplink to PC"
port. Wireshark writes these frames to the main memory (RAM) on your PC.
This not only makes it more difficult for your to monitor data, it can also overload
the main memory and cause your PC to crash.
To prevent this from happening, you can set various filters for each probe port.
These filters check whether the incoming frame has the properties you defined in
the filter settings. If the data have these properties, they will be written to the main
memory on your PC. If the data do not have these properties, they will be ignored.
The following filter elements are available:
Status filter
The status filter enables you to filter properties such as the receiving time or the
status of a frame. This filter is applied to the 20 bytes, which are additionally
transmitted to the standard frame.
Segment filter
You can use the segment filter to filter data for parity or disparity within the frame.
There are 16 words (4 bytes) available, and these can be checked in succession.
Filters
DO0281R00 19 / 58
Page 20

Filters
DO0281R00
You can set a total of 5 filters per probe port.
20 / 58
Page 21

7.2 Setting filters
Requirements:
ü Wireshark is installed on your PC.
ü TAP CURIOUS is properly connected.
◦ Open the Network and sharing center on your PC.
◦ Click on "Change adapter settings".
◦ Double-click to open the network connection for your TAP CURIOUS.
◦ Click on "Properties"
◦ Activate the "IPv4" protocol. You need this protocol to configure filter settings
via the web server.
◦ Open Wireshark
◦ Select the network connection for TAP CURIOUS.
Filters
ð TAP CURIOUS will transmit a broadcast frame. You can determine the current
IP address of TAP CURIOUS from this frame. When you start TAP CURIOUS
for the first time, the default IP address is 192.168.0.10.
◦ Click on “Address Resolution Protocol".
◦ Make a note of the TAP CURIOUS IP address.
◦ Enter the IP address into the address line in your browser.
ð The web server will open.
You can now set the filters you want and configure TAP CURIOUS.
DO0281R00 21 / 58
Page 22

The web server has 2 modes:
"Edit Registers (Expert)" mode is the right mode for you if you are already closely
familiar with the structure of an Ethernet frame.
"Filter Basic" mode is the right mode for you if you do not deal with this topic so
often and feel you need a little more support.
A detailed list of the parameters for filter settings and the TAP CURIOUS
configuration can be found in the chapter called "Tabulated list of filters and
configuration registers [}36]".
In the chapters that follow, we describe how to configure settings on the web
server.
Filters
DO0281R00
22 / 58
Page 23

7.2.1 Settings in Basic mode
Basic mode is the right mode for you if you want to set filters in the easiest way
possible or feel you need a little support. Filter settings you would make in multiple
registers in Expert mode can be made here from just one menu option.
ü Your TAP CURIOUS is properly installed.
ü Your network connection for TAP CURIOUS is active.
ü You have opened the web server.
◦ Click on "Filter basic"
ð Basic mode will open.
Setting filters
◦ Click on the register of a port on which you want to set filters (e.g. "Con A").
Filters
You can set filters for the selected port here.
◦ Click on the orange triangle in front of the filter option.
ð You will now see a menu in which you can set the filters.
DO0281R00 23 / 58
Page 24

Dest. address filter
Src. address filter
Ethernet type
Filters
To use any filter setting, you need to have activated the filter and saved the
settings. Do this by clicking on "On" and then "Save".
You can set the following filters:
This is where you can set frames that are transmitted to a particular MAC address.
Enter the MAC address you require.
Check the "Set filter > Negate" box to filter all frames that are not transmitted to this
MAC address.
You can combine the filter with the external input. Do this by checking the "External
input > Yes/No" box.
Check the "External input > Negate" box if the external input has to be "low".
This is where you can set frames that are transmitted from a particular MAC
address. Enter the MAC address you require.
Check the "Set filter > Negate" box to filter all frames that are not transmitted from
this MAC address.
You can combine the filter with the external input. Do this by checking the "External
input > Yes/No" box.
Check the "External input > Negate" box if the external input has to be "low".
This is where you can filter by the protocol type via which a frame's useful data are
transmitted. The values comply with the Ethernet specification.
We have gathered the values of a few important protocols for you here:
DO0281R00
Type Protocol
0x0800 IP Internet Protocol, Version 4 (IPv4)
0x0804 Address Resolution Protocol (ARP)
0x8100 VLAN Tag
0x8892 PROFINET
0x884A EtherCAT
0x88AB POWERLINK
0x88CD SERCOS III
24 / 58
Page 25

Check the "Set filter > Negate" box to filter all frames that do not match the
selected Ethernet type.
You can combine the filter with the external input. Do this by checking the "External
input > Yes/No" box.
Check the "External input > Negate" box if the external input has to be "low".
Filters
IPv4 Dest. address filter
IPv4 Src. address filter
Extern Out, LED 0-4
Saving the configuration
Loading an existing configuration
file
This is where you can set frames that are transmitted to a particular IP address.
Enter the IP address you require.
Check the "Set filter > Negate" box to filter all frames that are not transmitted to this
IP address.
You can combine the filter with the external input. Do this by checking the "External
input > Yes/No" box.
Check the "External input > Negate" box if the external input has to be "low".
This is where you can set frames that are transmitted from a particular IP address.
Enter the IP address you require.
Check the "Set filter > Negate" box to filter all frames that are not transmitted from
this IP address.
You can combine the filter with the external input. Do this by checking the "External
input > Yes/No" box.
Check the "External input > Negate" box if the external input has to be "low".
You can set what you want to do with the result of a filter here. You can show that
a filter applies via the filter LEDs or the external output.
To be able to use the configuration settings, they have to be saved.
Example:
You want to filter all frames that are transmitted from the MAC address "C8 3E A7
01 23 45". LED 2 will light up when a frame has been transmitted from MAC
address "C8 3E A7 01 23 45".
◦ In the "Dest. address filter" menu, set value "C8 3E A7 01 23 45".
◦ In the "Dest. address filter" checkbox in the "LED 2" menu, click "set".
For TAP CURIOUS to use your filter settings, they have to be saved.
As soon as you have set filter and configuration, you can save the settings so that
they can be used at a later time.
◦ Click on Export.
◦ Enter a file name
◦ Click on OK
If you have already saved a configuration in the web server, you can import this file
to TAP CURIOUS again at any time.
◦ Click on "Import".
◦ Select the file you want.
◦ Click on "OK".
DO0281R00 25 / 58
Page 26

Configuring TAP CURIOUS
◦ Click on the "Configuration" register.
Filters
Device information
Setting the connection speed
Configuration
The basic settings for TAP CURIOUS will be displayed. You can also change
certain values:
The following device information appears in "Device info":
– Serial number of TAP CURIOUS
– Software version
– MAC address
These data are specified by KUNBUS for this device and cannot be changed.
Please have these data to hand if you report a problem to our support.
You can select the connection speed for all ports in the "Config channel 1&2"
menu. The default speed is 100 Mbit.
◦ To change the default, check the "10 Mbit mode" box.
You can change the following communication parameters in the "Config TAP"
menu:
– IP address
The IP address ensures that TAP CURIOUS can be clearly identified within a
network. When assigning a new IP address, you should therefore make sure
that it is not being used by another device in the network.
If you use DHCP, you do not need to set the IP address. In this case, TAP
CURIOUS will receive the IP address from the DHCP server.
DO0281R00
26 / 58
Page 27

Using DHCP
Setting outputs filters
– Subnet
This is where you can adapt the net mask. The net mask is a bit mask that
indicates the bit position within the IP address that is being used to address the
network section. Make sure the settings you change here match your network
settings.
– Gateway address
You can set the gateway address here.
If you use a DHCP server, it can assign a free IP address to TAP CURIOUS.
The "Reset with timer" menu allows you to reset one of the filter LEDs or the
external output after a selected time.
◦ In the "Switch off delay in ms" field, enter a time after which you want the
output to be reset.
◦ Check the "Activate" box
To be able to use the configuration settings, they have to be saved and TAP
CURIOUS needs to be restarted.
Filters
DO0281R00 27 / 58
Page 28

7.2.2 Settings in Expert mode
If you are closely familiar with the structure of Ethernet frames, you can use Expert
mode to configure TAP CURIOUS and set the filters.
Setting filters
ü Your TAP CURIOUS is properly installed.
ü Your network connection for TAP CURIOUS is active.
ü You have opened the web server.
◦ Click on the register of a port on which you want to set filters (e.g. B. "CON A").
Filters
Filtering by the destination MAC
address
Set your filters here. You will find the values you require in the chapter called
"Tabulated list of filter registers [}36]".
Filter examples
In the filter examples below, the x in the register number stands for the associated
port.
Con A Register (0)01, Register (0)02, Register (0)03, …
Con B Register (1)01, Register (1)02, Register (1)03, …
Con C Register (2)01, Register (2)02, Register (2)03, …
Con D Register (3)01, Register (3)02, Register (3)03, …
Input field for MAC address: 6 bytes
Example: You want to filter all frames that have been transmitted to the MAC
address C8 3E A7 01 23 45.
Set the following filter registers:
Register Parameter Function
SegFilter1:
x07 00 00 00 00 Word offset of the MAC address
x08 01 A7 3EC8First 4 bytes of the MAC address
x09 FF FF FFFFMask on all bits
DO0281R00
SegFilter2:
28 / 58
Page 29

Filtering by protocol types IP4
and IP6
Register Parameter Function
SegFilter1:
x10 00 00 00 01 Word offset of the rest of the MAC address
x11 00 00 45 23 Last 2 bytes of the MAC address
x12 00 00 FF FF Mask on the first 2 bytes
Filter 1:
x55 00 00 00 00 No negation of SegFilter1 and 2
x56 00 00 00 03 Filter1 consists of SegFilter1 and 2
Uplink:
x65 00 00 00 00 Do not invert output
x66 00 00 00 01 Frame is output at the uplink port if filter 1 applies.
Config reg:
401 xx xx xx xE Activate filter for Con A (1110)
401 xx xx xx xD Activate filter for Con B (1101)
401 xx xx xx xB Activate filter for Con C (1011)
401 xx xx xx x7 Activate filter for Con D (0111)
Example: You want to filter all registers of protocol types IPv4 and IP6. The values
you require are:
– IP4= 0x0800
– IP6= 0x86DD
Set the following filter registers:
Filters
Register Parameter Function
SegFilter1:
x07 00 00 00 03 Word offset of protocol type
x08 00 00 00 08 IPv4 protocol type
x09 00 00 FF FF Mask on the first 2 bytes
SegFilter2:
x10 00 00 00 03 Word offset of protocol type
x11 00 00 DD 86 86 IPv6 Type
x12 00 00 FF FF Mask on the first 2 bytes
Filter 1
x55 00 00 00 00 No negation of SegFilter1
x56 00 00 00 01 Filter1 consists of SegFilter1
Filter 2
x57 00 00 00 00 No negation of SegFilter2
x58 00 00 00 02 Filter2 consists of SegFilter2
Uplink
x65 00 00 00 00 Do not invert output
x66 00 00 00 03 Frame is output at the uplink port if filter 1 or 2 applies.
ConfigReg
401 xx xx xx xE Activate filter for CON A port (1110)
DO0281R00 29 / 58
Page 30

Filtering by the source MAC
address
Filters
Input field for Src address: 6 bytes
Example: You want to filter all frames that have been transmitted from the MAC
address C8 3E A7 02 32 AB.
Set the following filter registers:
Register Parameter Function
SegFilter1:
x07 00 00 00 01 Word offset of the MAC address
x08 3E C8 xx xx First 2 bytes of the MAC address
x09 FF FF 00 00 Mask on the last 2 bytes
SegFilter2:
x10 00 00 00 02 Word offset of the rest of the MAC address
x11 AB 32 02 A7 Last 4 bytes of the MAC address
x12 FF FF FFFFMask on 4 bytes
Filter 1
x55 00 00 00 00 No negation of SegFilter1 and 2
x56 00 00 00 03 Filter1 consists of SegFilter1 and 2
Uplink
x65 00 00 00 00 Do not invert output
x66 00 00 00 01 Frame is output at the uplink port if filter 1 applies.
ConfigReg
401 xx xx xx xE Activate filter for CON A port (1110)
Filtering by the destination or
source MAC address
Input field for the destination MAC address: 6 bytes
Input field for the source MAC address: 6 bytes
Example: You want to filter all frames that are transmitted to the MAC address C8
3E A7 01 23 45 or from the MAC address C8 3E A7 02 32 AB.
Set the following filter registers:
Register Parameter Function
SegFilter1:
x07 00 00 00 00 Word offset of the destination MAC address
x08 01 A7 3EC8First 4 bytes of the destination MAC address
x09 FF FF FFFFMask on all bits
SegFilter2:
x10 00 00 00 01 Word offset of the rest of the destination MAC address
x11 xx xx 45 23 Last 2 bytes of the destination MAC address
x12 00 00 FF FF Mask on 2 bytes
SegFilter3:
x13 00 00 00 01 Word offset of the source MAC address
x14 3E C8 xx xx First 2 bytes of the source MAC address
x15 FF FF 00 00 Mask on 2 bytes
SegFilter4:
DO0281R00
30 / 58
Page 31

Filtering by the sender IP
address
Register Parameter Function
SegFilter1:
x16 00 00 00 02 Word offset of the rest of the source MAC address
x17 AB 32 02 A7 Last 2 bytes of the source MAC address
x18 FF FF FFFFMask on all bits
Filter 1
x55 00 00 00 00 No negation of SegFilter1 and 2
x56 00 00 00 03 Filter1 consists of SegFilter1 and 2
Filter 2
x57 00 00 00 00 No negation of SegFilter3 and 4
x58 00 00 00 0C Filter2 consists of SegFilter3 and 4
Uplink
x65 00 00 00 00 Do not invert output
x66 00 00 00 03 Frame is output at the uplink port if filter 1 or 2 applies.
ConfigReg
401 xx xx xx xE Activate filter for CON B port (1101)
(IPv4 0x0800 )
Input field for sender IP address: 4 bytes
Example: You want to filter all frames that have been transmitted from the IP
address 01 02 03 04.
Set the following filter registers:
Filters
Register Parameter Function
SegFilter1:
x07 00 00 00 03 Word offset of protocol type
x08 00 00 00 08 IPv4 protocol type
x09 00 00 FF FF Mask on 2 bytes
SegFilter2:
x10 00 00 00 06 Word offset of the sender IP address
x11 02 01 00 00 4 bytes of the sender IP address
x12 FF FF 00 00 Mask for all bits
SegFilter3:
x13 00 00 00 07 Word offset of the sender IP address
x14 00 00 04 03 4 bytes of the sender IP address
x15 00 00 FF FF Mask for all bits
Filter 1
x55 00 00 00 00 No negation of SegFilter1 and 2
x56 00 00 00 07 Filter1 consists of SegFilter1 and 2
Uplink
x65 00 00 00 00 Do not invert output
x66 00 00 00 01 Frame is output at the uplink port if filter 1 applies.
ConfigReg
401 xx xx xx xE Activate filter for CON B port (1101)
DO0281R00 31 / 58
Page 32

Filtering by the target IP address
(IPv4 0x0800 )
Input field for target IP address: 4 bytes
Example: You want to filter the target IP address "01 02 03 04".
Set the following filter registers:
Register Parameter Function
SegFilter1:
x07 00 00 00 03 Word offset of protocol type
x08 00 00 00 08 IPv4 protocol type
x09 00 00 FF FF Mask on 2 bytes
SegFilter2:
x10 00 00 00 07 Word offset of the target IP address is 10
x11 02 01 00 00 First 2 bytes of the target IP address
x12 FF FF 00 00 Mask on 2 bytes
SegFilter3:
x13 00 00 00 08 Word offset of the rest of the target IP address is 11
x14 00 00 04 03 Last 2 bytes of the target IP address
x15 00 00 FF FF Mask on 2 bytes
Filter 1
x55 00 00 00 00 No negation of SegFilter1,2 and 3
x56 00 00 00 07 Filter1 consists of SegFilter1,2 and 3
Uplink
x65 00 00 00 00 Do not invert output
x66 00 00 00 01 Frame is output at the uplink port if filter 1 applies.
ConfigReg
401 xx xx xx xE Activate filter for CON B port (1101)
Filters
Filtering by IP4 and external
input
Example: You want to filter by protocol type IPv4 and the external input.
Protocol type IPv4 corresponds to 0x0800. The external input is "high".
Set the following filter registers:
Register Parameter Function
SegFilter1:
x07 00 00 00 03 Word offset of protocol type
x08 00 00 00 08 IPv4 protocol type
x09 00 00 FF FF Mask on 2 bytes
Filter 1
x55 00 00 00 00 No negation of SegFilter1
x56 10 00 00 01 Filter1 consists of SegFilter1 and the external input
Uplink
x65 00 00 00 00 Do not invert output
x66 00 00 00 01 Frame is output at the uplink port if filter 1 applies.
ConfigReg
401 xx xx xx xE Activate filter for CON A port (1110)
DO0281R00
32 / 58
Page 33

Filtering by IP4 and setting the
external output
Example: You want to filter by protocol type IPv4 and set the external output if a
frame with protocol type IPv4 arrives.
Protocol type IPv4 corresponds to 0x0800.
Set the following filter registers:
Register Parameter Function
SegFilter1:
x07 00 00 00 03 Word offset of protocol type
x08 00 00 00 08 IPv4 protocol type
x09 00 00 FF FF Mask on 2 bytes
Filter 1
x55 00 00 00 00 No negation of SegFilter1
x56 00 00 00 01 Filter1 consists of SegFilter1
Uplink
x65 00 00 00 00 Do not invert output
x66 00 00 00 00 Frame is output at the uplink port if filter 1 applies.
External output
x67 00 00 00 00 No negation of ext. out
x68 00 00 00 01 Set external output if filter 1 applies
ConfigReg
401 xx xx xx xE Activate filter for CON A port (1110)
extOut_ConfigReg
402 00 00 01 01 Port Con A active, reset via a timer
extOutTimerReg
403 01 31 2D 00 Timer resets the value every 200ms
Filters
Filtering by CRC error
Example: You want to filter all frames that report a CRC error.
Set the following filter registers:
Register Parameter Function
State:
x05 08 00 00 00 CRC Error Statusbit
x06 FF 00 00 00 Mask on 1 byte
Filter 1
x55 00 00 00 00 No negation of StateFilter
x56 80 00 00 00 Filter1 consists of state filter
Uplink
x65 00 00 00 00 Do not invert output
x66 00 00 00 01 Frame is output at the uplink port if filter 1 applies.
ConfigReg
401 xx xx xx xE Activate filter for CON A port (1110)
DO0281R00 33 / 58
Page 34

Filtering by frame length
Example: You want to filter all frames that are 1012 bytes long.
Set the following filter registers:
Register Parameter Function
State:
x05 00 00 03 F4 Frame is 1012 bytes long (0x03F4)
x06 00 00 FF FF Mask on 2 bytes
Filter 1
x55 00 00 00 00 No negation of StateFilter
x56 80 00 00 00 Filter1 consists of state filter
Uplink
x65 00 00 00 00 Do not invert output
x66 00 00 00 01 Frame is output at the uplink port if filter 1 applies.
ConfigReg
401 xx xx xx xE Activate filter for CON A port (1110)
Configuring filters
You can set what you want to do with the result of a filter in the Registers menu
"401-410". You can show that a filter applies via the filter LEDs or the external
output.
Information and setting values can be found in the chapter called "TAP
configuration register [}44]".
To be able to use the configuration settings, they have to be saved.
Filters
DO0281R00
34 / 58
Page 35

Device information
Connection settings
DHCP settings
Configuration
Configuring TAP CURIOUS
Filters
◦ Click on "Config settings > Show settings".
Device information is displayed in the first line:
– Serial number of TAP CURIOUS
– Software version
– MAC address
These data are specified by KUNBUS for this device and cannot be changed.
Please have these data to hand if you report a problem to our support.
You can select the connection speed for all ports in the "Channel mode" menu. The
default speed is 100 Mbit.
◦ To change the default, check the "10 Mbit mode" box.
If you use a DHCP server, it can assign a free IP address to TAP CURIOUS.
◦ In the "Use DHCP" menu, click on "Yes" to use DHCP.
You can change the following communication parameters in the "Config TAP"
menu:
– IP address
The IP address ensures that TAP CURIOUS can be clearly identified within a
network. When assigning a new IP address, you should therefore make sure
that it is not being used by another device in the network.
If you use DHCP, you do not need to set the IP address. In this case, TAP
CURIOUS will receive the IP address from the DHCP server.
– Subnet
This is where you can adapt the net mask. The net mask is a bit mask that
indicates the bit position within the IP address that is being used to address the
network section. Make sure the settings you change here match your network
settings.
– Gateway address
You can set the gateway address here.
DO0281R00 35 / 58
Page 36

7.3 Tabulated list of filter registers
A tabulated overview of all filter registers can be found in this chapter.
Number Name of the register Name of the filter Access
X01 Time1_TargetReg Timestamp_1 RW 32 bit
X02 Time1_MaskReg RW 32 bit
X03 Time2_TargetReg Timestamp_2 RW 32 bit
X04 Time2_MaskReg RW 32 bit
X05 State_TargetReg Status RW 32 bit
X06 State_MaskReg RW 32 bit
X07 SegFilter1_PosReg Segment filter_1 RW 16 bit
X08 SegFilter1_TargetReg RW 32 bit
X09 SegFilter1_MaskReg RW 32 bit
X010 SegFilter2_PosReg Segment filter_2 RW 16 bit
X011 SegFilter2_TargetReg RW 32 bit
X012 SegFilter2_MaskReg RW 32 bit
X013 SegFilter3_PosReg Segment filter_3 RW 16 bit
X014 SegFilter3_TargetReg RW 32 bit
X015 SegFilter3_MaskReg RW 32 bit
X016 SegFilter4_PosReg Segment filter_4 RW 16 bit
X017 SegFilter4_TargetReg RW 32 bit
X018 SegFilter4_MaskReg RW 32 bit
X019 SegFilter5_PosReg Segment filter_5 RW 16 bit
X020 SegFilter5_TargetReg RW 32 bit
X021 SegFilter5_MaskReg RW 32 bit
X022 SegFilter6_PosReg Segment filter_6 RW 16 bit
X023 SegFilter6_TargetReg RW 32 bit
X024 SegFilter6_MaskReg RW 32 bit
X025 SegFilter7_PosReg Segment filter_7 RW 16 bit
X026 SegFilter7_TargetReg RW 32 bit
X027 SegFilter7_MaskReg RW 32 bit
X028 SegFilter8_PosReg Segment filter_8 RW 16 bit
X029 SegFilter8_TargetReg RW 32 bit
X030 SegFilter8_MaskReg RW 32 bit
X031 SegFilter9_PosReg Segment filter_9 RW 16 bit
X032 SegFilter9_TargetReg RW 32 bit
X033 SegFilter9_MaskReg RW 32 bit
X034 SegFilter10_PosReg Segment filter_10 RW 16 bit
X035 SegFilter10_TargetReg RW 32 bit
X036 SegFilter10_MaskReg RW 32 bit
X037 SegFilter11_PosReg Segment filter_11 RW 16 bit
X038 SegFilter11_TargetReg RW 32 bit
X039 SegFilter11_MaskReg RW 32 bit
X040 SegFilter12_PosReg Segment filter_12 RW 16 bit
X041 SegFilter12_TargetReg RW 32 bit
X042 SegFilter12_MaskReg RW 32 bit
Filters
DO0281R00
36 / 58
Page 37

Number Name of the register Name of the filter Access
X043 SegFilter13_PosReg Segment filter_13 RW 16 bit
X044 SegFilter13_TargetReg RW 32 bit
X045 SegFilter13_MaskReg RW 32 bit
X046 SegFilter14_PosReg Segment filter_14 RW 16 bit
X047 SegFilter14_TargetReg RW 32 bit
X048 SegFilter14_MaskReg RW 32 bit
X049 SegFilter15_PosReg Segment filter_15 RW 16 bit
X050 SegFilter15_TargetReg RW 32 bit
X051 SegFilter15_MaskReg RW 32 bit
X052 SegFilter16_PosReg Segment filter_16 RW 16 bit
X053 SegFilter16_TargetReg RW 32 bit
X054 SegFilter16_MaskReg RW 32 bit
X055 Filter1_NegReg Filter_1 RW 32 bit
X056 Filter1_MaskReg RW 32 bit
X057 Filter2_NegReg Filter_2 RW 32 bit
X058 Filter2_MaskReg RW 32 bit
X059 Filter3_NegReg Filter_3 RW 32 bit
X060 Filter3_MaskReg RW 32 bit
X061 Filter4_NegReg Filter_4 RW 32 bit
X062 Filter4_MaskReg RW 32 bit
X063 Filter5_NegReg Filter_5 RW 32 bit
X064 Filter5_MaskReg RW 32 bit
X065 Gbit_Filter_NegReg Gbit Upload Filter RW 32 bit
X066 Gbit_Filter_MaskReg RW 32 bit
X067 ExOut_Filter_NegReg Ext Output Filter RW 32 bit
X068 ExOut_Filter_MaskReg RW 32 bit
X069 LED0_LED2_Filter_NegReg LED0 - LED2 Filter RW 32 bit
X070 LED0_LED2_Filter_MaskReg RW 32 bit
X071 LED3_LED4_Filter_NegReg LED3 - LED4 Filter RW 32 bit
X072 LED3_LED4_Filter_MaskReg
Filters
x05-State_TargetReg
DO0281R00 37 / 58
Byte Bit Description
1 0-15 Frame length (with KUNBUS
2
3 0 Port Con A
1 Port Con B
2 Port Con C
3 Port Con D
4-7 Reserved
4 0 Short Frame
1 Long Frame
2 Lost Frame
3 CRC Error
4 Alignment Error
5 Wrong IFG
6 Wrong Preamble
additional data 20 bytes)
Page 38

x06-State_MaskReg
Byte Bit Description
1 0-31 Filter mask
2
3
4
Value = 0: → Bit ignored
Value = 1: → Bit considered
Filters
x07, x10 … x49, x52SegFilterXX_PosReg
x08, x11 … x50, x53SegFilterXX_TargetReg
x09, x12 … x51, x54SegFilterXX_MaskReg
x55, …, x63-FilterX_NegReg
Byte Bit Description
1 0-15 Byte offset for 4 bytes in the frame
2
Byte Bit Description
1 0-31 4 byte filter data for which the test is required
2
3
4
Bit Byte Description
1 0-31 Filter mask
2
3
4
Byte Bit Description
1 0 Negate result of Segment filter_1
2 0 Negate result of Segment filter_9
3 0-7 Reserved
Offset = 0 → [01 00 5e 6e] ed c2 00 24 01 3a b6 c1 08 00 45 00
Offset = 1 → 01 00 5e 6e [ed c2 00 24] 01 3a b6 c1 08 00 45 00
Offset = 2 → 01 00 5e 6e ed c2 00 24 [01 3a b6 c1] 08 00 45 00
Offset = 3 → 01 00 5e 6e ed c2 00 24 01 3a b6 c1 [08 00 45 00]
Received frame data → [c0 4a 00 01] 94 f7 c8 3e a7 00 00 95 08 06
Frame data entries in the register → 01 00 4a c0
Value = 0: → Bit ignored
Value = 1: → Bit considered
1 Negate result of Segment filter_2
2 Negate result of Segment filter_3
3 Negate result of Segment filter_4
4 Negate result of Segment filter_5
5 Negate result of Segment filter_6
6 Negate result of Segment filter_7
7 Negate result of Segment filter_8
1 Negate result of Segment filter_10
2 Negate result of Segment filter_11
3 Negate result of Segment filter_12
4 Negate result of Segment filter_13
5 Negate result of Segment filter_14
6 Negate result of Segment filter_15
7 Negate result of Segment filter_16
DO0281R00
38 / 58
Page 39

Byte Bit Description
4 0 Reserved
1 Reserved
2 Reserved
3 Reserved
4 Ext. input has to be "low"
5 Negate result of timestamp low
6 Negate result of timestamp high
7 Negate result of status
Filters
x56, …, x64-FilterX_MaskReg
Byte Bit Description
1 0 Add Segment filter_1 to the filter
1 Add Segment filter_2 to the filter
2 Add Segment filter_3 to the filter
3 Add Segment filter_4 to the filter
4 Add Segment filter_5 to the filter
5 Add Segment filter_6 to the filter
6 Add Segment filter_7 to the filter
7 Add Segment filter_8 to the filter
2 0 Add Segment filter_9 to the filter
1 Add Segment filter_10 to the filter
2 Add Segment filter_11 to the filter
3 Add Segment filter_12 to the filter
4 Add Segment filter_13 to the filter
5 Add Segment filter_14 to the filter
6 Add Segment filter_15 to the filter
7 Add Segment filter_16 to the filter
3 0-7 Reserved
4 0 Reserved
1 Reserved
2 Reserved
3 Reserved
4 Add ext. input to the filter
5 Add timestamp "low" to the filter
6 Add timestamp "high" to the filter
7 Add status filter to the filter
DO0281R00 39 / 58
Page 40

x65-Gbit_Filter_NegReg
Byte Bit Description
1 0 Negate result of Filter 1
1 Negate result of Filter 2
2 Negate result of Filter 3
3 Negate result of Filter 4
4 Negate result of Filter 5
5 Reserved
6 Reserved
7 Reserved
2 0-7 Reserved
3 0-7 Reserved
4 0-7 Reserved
Filters
x 66-Gbit_Filter_MaskReg
x68-ExOut_Filter_MaskReg
Byte Bit Description
1 0 Frame is sent if filter 1 applies
1 Frame is sent if filter 2 applies
2 Frame is sent if filter 3 applies
3 Frame is sent if filter 4 applies
4 Frame is sent if filter 5 applies
5 Reserved
6 Reserved
7 Reserved
2 0-7 Reserved
3 0-7 Reserved
4 0-7 Reserved
Byte Bit Description
1 0 Set the external output if filter 1 applies
1 Set the external output if filter 2 applies
2 Set the external output if filter 3 applies
3 Set the external output if filter 4 applies
4 Set the external output if filter 5 applies
5 Reset the external output if filter 1 applies
6 Reset the external output if filter 2 applies
7 Reset the external output if filter 3 applies
2 0 Reset the external output if filter 4 applies
1 Reset the external output if filter 5 applies
2-7 Reserved
3 0-7 Reserved
4 0-7 Reserved
DO0281R00
40 / 58
Page 41

x67-ExOut_Filter_NegReg
Byte Bit Description
1 0 Set the external output if filter 1 does not apply
1 Set the external output if filter 2 does not apply
2 Set the external output if filter 3 does not apply
3 Set the external output if filter 4 does not apply
4 Set the external output if filter 5 does not apply
5 Reset the external output if filter 1 does not apply
6 Reset the external output if filter 2 does not apply
7 Reset the external output if filter 3 does not apply
2 0 Reset the external output if filter 4 does not apply
1 Reset the external output if filter 5 does not apply
2-7 Reserved
3 0-7 Reserved
4 0-7 Reserved
Filters
x70LED0_LED2_Filter_MaskReg
Byte Bit Description
1 0 Set LED0 if filter 1 applies
1 Set LED0 if filter 2 applies
2 Set LED0 if filter 3 applies
3 Set LED0 if filter 4 applies
4 Set LED0 if filter 5 applies
5 Set LED0 if filter 1 applies
6 Reset LED0 if filter 2 applies
7 Reset LED0 if filter 3 applies
2 0 Reset LED0 if filter 4 applies
1 Reset LED0 if filter 5 applies
2 Set LED1 if filter 1 applies
3 Set LED1 if filter 2 applies
4 Set LED1 if filter 3 applies
5 Set LED1 if filter 4 applies
6 Set LED1 if filter 5 applies
7 Reset LED1 if filter 1 applies
3 0 Reset LED1 if filter 2 applies
1 Reset LED1 if filter 3 applies
2 Reset LED1 if filter 4 applies
3 Reset LED1 if filter 5 applies
4 Set LED2 if filter 1 applies
5 Set LED2 if filter 2 applies
6 Set LED2 if filter 3 applies
7 Set LED2 if filter 4 applies
DO0281R00 41 / 58
Page 42

Byte Bit Description
4 0 Set LED2 if filter 5 applies
1 Reset LED2 if filter 1 applies
2 Reset LED2 if filter 2 applies
3 Reset LED2 if filter 3 applies
4 Reset LED2 if filter 4 applies
5 Reset LED2 if filter 5 applies
6 Reserved
7 Reserved
Filters
x69-LED0_LED2_Filter_NegReg
Byte Bit Description
1 0 Set LED0 if filter 1 does not apply
1 Set LED0 if filter 2 does not apply
2 Set LED0 if filter 3 does not apply
3 Set LED0 if filter 4 does not apply
4 Set LED0 if filter 5 does not apply
5 Reset LED0 if filter 1 does not apply
6 Reset LED0 if filter 2 does not apply
7 Reset LED0 if filter 3 does not apply
2 0 Reset LED0 if filter 4 does not apply
1 Reset LED0 if filter 5 does not apply
2 Set LED1 if filter 1 does not apply
3 Set LED1 if filter 2 does not apply
4 Set LED1 if filter 3 does not apply
5 Set LED1 if filter 4 does not apply
6 Set LED1 if filter 5 does not apply
7 Reset LED1 if filter 1 does not apply
3 0 Reset LED1 if filter 2 does not apply
1 Reset LED1 if filter 3 does not apply
2 Reset LED1 if filter 4 does not apply
3 Reset LED1 if filter 5 does not apply
4 Set LED2 if filter 1 does not apply
5 Set LED2 if filter 2 does not apply
6 Set LED2 if filter 3 does not apply
7 Set LED1 if filter 4 does not apply
4 0 Set LED1 if filter 5 does not apply
1 Reset LED2 if filter 1 does not apply
2 Reset LED2 if filter 2 does not apply
3 Reset LED2 if filter 3 does not apply
4 Reset LED2 if filter 4 does not apply
5 Reset LED2 if filter 5 does not apply
6 Reserved
7 Reserved
DO0281R00
42 / 58
Page 43

x72LED3_LED4_Filter_MaskReg
Byte Bit Description
1 0 Set LED3 if filter 1 applies
1 Set LED3 if filter 2 applies
2 Set LED3 if filter 3 applies
3 Set LED3 if filter 4 applies
4 Set LED3 if filter 5 applies
5 Reset LED3 if filter 1 applies
6 Reset LED3 if filter 2 applies
7 Reset LED3 if filter 3 applies
2 0 Reset LED3 if filter 4 applies
1 Reset LED3 if filter 5 applies
2 Set LED4 if filter 1 applies
3 Set LED4 if filter 2 applies
4 Set LED4 if filter 3 applies
5 Set LED4 if filter 4 applies
6 Set LED4 if filter 5 applies
7 Reset LED4 if filter 1 applies
3 0 Reset LED4 if filter 2 applies
1 Reset LED4 if filter 3 applies
2 Reset LED4 if filter 4 applies
3 Reset LED4 if filter 5 applies
4 Reserved
5 Reserved
6 Reserved
7 Reserved
4 0 Reserved
1 Reserved
2 Reserved
3 Reserved
4 Reserved
5 Reserved
6 Reserved
7 Reserved
Filters
x71-LED3_LED4_Filter_NegReg
DO0281R00 43 / 58
Byte Bit Description
1 0 Set LED3 if filter 1 does not apply
1 Set LED3 if filter 2 does not apply
2 Set LED3 if filter 3 does not apply
3 Set LED3 if filter 4 does not apply
4 Set LED3 if filter 5 does not apply
5 Reset LED3 if filter 1 does not apply
6 Reset LED3 if filter 2 does not apply
7 Reset LED3 if filter 3 does not apply
Page 44

Byte Bit Description
2 0 Reset LED3 if filter 4 does not apply
1 Reset LED3 if filter 5 does not apply
2 Set LED4 if filter 1 does not apply
3 Set LED4 if filter 2 does not apply
4 Set LED4 if filter 3 does not apply
5 Set LED4 if filter 4 does not apply
6 Set LED4 if filter 5 does not apply
7 Reset LED4 if filter 1 does not apply
3 0 Reset LED4 if filter 2 does not apply
1 Reset LED4 if filter 3 does not apply
2 Reset LED4 if filter 4 does not apply
3 Reset LED4 if filter 5 does not apply
4 Reserved
5 Reserved
6 Reserved
7 Reserved
4 0 Reserved
1 Reserved
2 Reserved
3 Reserved
4 Reserved
5 Reserved
6 Reserved
7 Reserved
Filters
401-ConfigReg
TAP configuration register
Byte Bit Description
1 0 Con A → all frames are transmitted, irrespective of the filtering
high-active, prioritized lower than Bit 4
1 Con B → all frames are transmitted, irrespective of the filtering
high-active, prioritized lower than Bit 5
2 Con C → all frames are transmitted, irrespective of the filtering
high-active, prioritized lower than Bit 6
3 Con D → all frames are transmitted, irrespective of the filtering
high-active, prioritized lower than Bit 7
4 Con A → no frames are transmitted, irrespective of the filtering
high-active, prioritized higher than Bit 0
5 Con B → no frames are transmitted, irrespective of the filtering
high-active, prioritized higher than Bit 1
6 Con C → no frames are transmitted, irrespective of the filtering
high-active, prioritized higher than Bit 2
7 Con D → no frames are transmitted, irrespective of the filtering
high-active, prioritized higher than Bit 3
2 Reserved
3 Reserved
4 Reserved
DO0281R00
44 / 58
Page 45

402-extOut_ConfigReg
Byte Bit Description
1 0-3 0001 →0x1 -> X1.1 active port for setting the ext. out
0010 →0x2 -> X1.2 active port for setting the ext. out
0100 →0x3 -> X2.1 active port for setting the ext. out
1000 →0x4 -> X2.2 active port for setting the ext. out
4-7 0001 →0x1-> X1.1 active port for resetting the ext. out
0010 →0x2 -> X1.2 active port for resetting the ext. out
0100 →0x3 -> X2.1 active port for resetting the ext. out
1000 →0x4 -> X2.2 active port for resetting the ext. out
Output reset via timer must not be activated.
2 0 Activate reset external output via timer (switch-off delay).
The timer value is entered in 403-extOutTimerReg.
high-active
1 Reset external output
high-active
Output reset via timer must not be activated.
2-7 Reserved
3 Reserved
4 Reserved
Filters
403-extOutTimerReg
Byte Bit Description
1-4 0-31 Delay for resetting the external output
Input is in 10ns increments.
For example, 0x1312D00 corresponds to 200ms.
DO0281R00 45 / 58
Page 46

404-LED_ConfigReg
Byte Bit Description
1-4 0-5 Reset the LEDs via timer (switch-off delay), high-active
( 000001->LED0, 000010->LED1, 000100->LED2, 001000>LED3,
010000->LED4)
6-11 Reset the LEDs, high-active
Possible only when reset via timer is not active
( 000001->LED0, 000010->LED1, 000100->LED2, 001000>LED3,
010000->LED4)
LED reset via timer must not be activated.
12-15 Specify the active port for which LED0 is set.
0001 → Con A
0010 → Con B
0100 → Con C
1000 → Con D
16-19 Specify the active port for which LED1 is set.
0001 → Con A
0010 → Con B
0100 → Con C
1000 → Con D
20-23 Specify the active port for which LED2 is set.
0001 → Con A
0010 → Con B
0100 → Con C
1000 → Con D
24-27 Specify the active port for which LED3 is set.
0001 → Con A
0010 → Con B
0100 → Con C
1000 → Con D
28-31 Specify the active port for which LED4 is set.
0001 → Con A
0010 → Con B
0100 → Con C
1000 → Con D
Filters
DO0281R00
46 / 58
Page 47

405-LED_Config2Reg
Byte Bit Description
1-4 0-3 Specify the active port for which LED0 is reset.
0001 → Con A
0010 → Con B
0100 → Con C
1000 → Con D
4-7 Specify the active port for which LED1 is reset.
0001 → Con A
0010 → Con B
0100 → Con C
1000 → Con D
8-11 Specify the active port for which LED2 is reset.
0001 → Con A
0010 → Con B
0100 → Con C
1000 → Con D
12-15 Specify the active port for which LED3 is reset.
0001 → Con A
0010 → Con B
0100 → Con C
1000 → Con D
16-19 Specify the active port for which LED4 is reset.
0001 → Con A
0010 → Con B
0100 → Con C
1000 → Con D
20-31 Reserved
Filters
406-LED0_TimerReg
407-LED1_TimerReg
408-LED2_TimerReg
DO0281R00 47 / 58
Byte Bit Description
1-4 0..31 Delay until LED0 is reset.
Input is in 10ns increments.
For example, 0x1312D00 corresponds to 200ms.
Byte Bit Description
1-4 0-31 Delay until LED1 is reset.
Input is in 10ns increments.
For example, 0x1312D00 corresponds to 200ms.
Byte Bit Description
1-4 0-31 Delay until LED2 is reset.
Input is in 10ns increments.
For example, 0x1312D00 corresponds to 200ms.
Page 48

409-LED3-TimerReg
Byte Bit Description
1-4 0-31 Delay until LED3 is reset.
Input is in 10ns increments.
For example, 0x1312D00 corresponds to 200ms.
Filters
410-LED4-TimerReg
Byte Bit Description
1-4 0-31 Delay until LED4 is reset
Input is in 10ns increments.
For example, 0x1312D00 corresponds to 200ms.
DO0281R00
48 / 58
Page 49

8 Monitoring the interface
Wireshark is a free analysis program for network communication connections. It
allows you to:
– Show data traffic across an Ethernet interface after or during capture in the
form of data packets,
– observe individually captured data packets,
– sort data packets according to specific contents,
– extract binary contents (e.g. images),
– create and work-up data flow statistics.
The free program library "WinPcap" permits the transparent capture of data traffic
under Microsoft Windows®.
You can use Wireshark on most standard systems. To analyze additional
information, however, we currently offer a plugin only for Windows.
Monitoring an interface with Wireshark
Monitoring the interface
ü You have installed Wireshark. In the main window under "Capture", you will
see all identified Ethernet interfaces.
◦ Double-click to select the interface you want to monitor.
ð A status window opens. You will now see a recording of the data frame.
DO0281R00 49 / 58
Page 50

Status window
Monitoring the interface
Packet list
The status window consists of 3 areas:
– Packet list,
– Packet details,
– Packet raw data.
Wireshark displays all data packets in chronological order here. As soon as the
KUNBUS TAP spy plugin is activated, Wireshark will apply in the "Time" column
the highly-precise time stamp from TAP CURIOUS instead of the timestamp from
the operating system.
Specific values from TAP CURIOUS can be displayed in additional columns. Open
the "Edit > Preferences > Columns" menu in the "Properties" section and click on
the "Add" button to create a new column. Now select "Custom" from the drop-down
list.
as the "Field type". You can enter "TAP.port", for example, as the "Field name". As
soon as "TAP." is entered, the plugin will suggest values for selection.
To precisely analyze traces, Wireshark offers a filter function. As a result, the
display and the analysis can be limited to the most informative frames for the
analysis. The filter allows you to observe the inbound and outbound data traffic for
your own IP address or solely ping commands. When using TAP CURIOUS, it
makes sense to filter by TAP additional information. Wireshark uses the filter
expression "TAP.port == a" to show, for example, only those packets that TAP
CURIOUS has received at Port A.
DO0281R00
50 / 58
Page 51

Packet details
Once the TAP plugin is activated and Wireshark has captured the Ethernet packets
via TAP CURIOUS, you can see additional information in the lowermost line in the
"KUNBUS-TAP" section:
Number of bytes Content
4 bytes FCS (original checksum).
Identifier C8 3E A7 00 01 61.
Port on which the frame was received.
Port Value in hex.
Con A 0x80
Con B 0x40
Con C 0x20
Con D 0x10
1 Byte Error messages
Bit Error message
Bit 7 Receive error
Signal not decoded.
Bit 6 Wrong preamble
Preamble does not conform to standard IEEE
802.3.
Bit 5 Wrong IFG
Minimum waiting time of 96 bit times not reached.
Bit 4 Alignment error
The total number of bits in a frame is not divisible
by 8.
Bit 3 CRC error
The received frame is faulty.
Bit 2 Lost frame
Frame has gone astray.
Bit 1 Long frame
The maximum length of 1518 bytes/frames has
been exceeded.
Bit 0 Short frame
Minimum length of 64 bytes/frame not reached.
8 bytes Timestamp in ns.
Monitoring the interface
Packet raw data
DO0281R00 51 / 58
This section shows the packet data in hexadecimal form and as ASCII text. The
last 20 bytes in the packets contain the additional information that TAP CURIOUS
has added to the data packets.
Page 52

9 Refreshing the web server
You can refresh the web server whenever an update is available.
Requirements:
ü TAP CURIOUS is connected to your PC.
ü You have installed an FTP server on your PC.
ü You have Internet access.
◦ Download the update from our website. The latest version can always be found
at: http://tap.kunbus.de.
◦ Save the update files on your PC.
◦ Open your FTP server.
Note! In this example, we use FileZilla. If you use a different FTP server, the steps
you see may differ due to the software.
◦ Click on "File".
◦ Select "Server manager".
Refreshing the web server
◦ Click on "New server".
DO0281R00
52 / 58
Page 53

◦ Enter a name for the server (e.g. TAP CURIOUS).
Refreshing the web server
◦ Enter the following values in the "General" register:
Server IP address of your TAP CURIOUS
Protocol "FTP- File Transfer Protocol"
Encryption "Use unencrypted FTP"
Connection type "Normal"
User Admin
Password 1701
It might not be possible to establish a connection due to the proxy settings. If this is
the case, click on the "Advanced" register and check the "Bypass proxy" box.
◦ Click on "Edit".
◦ Select "Settings".
◦ Click on "Transmit".
DO0281R00 53 / 58
Page 54

◦ Enter a "1" into the "Maximum number of simultaneous transmissions" box.
◦ Click on "OK"
◦ Click on the selection arrow next to the network settings.
◦ Select the connection for TAP.
◦ Click on "Connect".
◦ Move the update files to TAP CURIOUS via drag&drop
Refreshing the web server
DO0281R00
54 / 58
Page 55

ð The update files will now be copied to your TAP CURIOUS.
FileZilla allows you to track progress in the queue. You can also see which files
have been successfully transmitted and which encountered an error.
Refreshing the web server
DO0281R00 55 / 58
Page 56

10 Errors and problems
Problem Solution
No link between the
devices.
Wireshark does not show
all packets.
Wireshark does not show
large packets.
Wireshark shows packets
as faulty.
Wireshark shows
additional packets.
Negative time stamp: If the network becomes overloaded, the network card
Changed port number
(auto crossover)
The TX and RX lines are interchanged between the
ports (crossover). If the used devices do not have AutoMDI-X, a crossover cable has to be used on one side.
In the "Capture > Options" configuration dialog, activate
"Capture packets in promiscuous mode". Some network
cards filter out certain packet types that Wireshark is
unable to display. This can be solved only by using a
card from a different manufacturer.
TAP attaches 20 bytes of additional information to the
packets. If large packets containing more than 1480
bytes of useful data are transmitted, the maximum
packet length of 1500 bytes (1518 bytes, incl. Ethernet
header and CRC) is exceeded and the packet will
normally be rejected by the Ethernet card in the
computer on which Wireshark is running. This can be
avoided by activating "Jumbo packets" in the driver.
If the TAP plugin is not activated, Wireshark (or a
different analysis program without TAP plugin) might
show a checksum error. This is due to the additional
data that TAP CURIOUS has attached to the data
packet.
You can ignore this error message.
It could be that the PC on which Wireshark is running is
sending additional broadcasts over the used interface.
You can avoid this by deactivating all elements (Client
for Microsoft networks, Internet protocol (TCP/IP), etc.)
in the LAN adapter properties under Windows.
may not output the frames in the correct sequence.
This can be because the number of RSS queues in the
network card is greater than one. To remedy the
problem, the number of queues must be set to one.
Due to the auto crossover function, the cable
assignment through the listening devices is random. As
a result, frames from device A (connected to Con A
port) can be detected when frames have been received
on Con B port.
Errors and problems
DO0281R00
56 / 58
Page 57

11 Technical Data
Size/weight
Width 91.4mm
Height 139.7mm
Depth 27.9mm
Weight approx. 150g
Environmental conditions
Operating temperature 0°C…+55°C
Storage temperature -25°C…+85°C
Humidity 95%, non-condensing
Protection class IP20
Output
Power supply 24 V DC ± 20% or
Digital input/output External power supply 24 V DC ± 20%
Number of Ethernet ports 4 for recording 2 lines
Uplink port up to 1 GBit/s (1000BASE-T Ethernet,
Probe ports up to 100 MBit/s (100BASE-TX Ethernet,
Protection class IP20
Throughput delay ~ 0 µs (zero delay)
Time stamp resolution 1ns
Diagnosis 3 LEDs per channel
Technical Data
230 V AC with mains connector
Maximum output current of 50mA Pulse
length of 1ms
Electrically isolated
RJ45 port)
RJ45 port), full and half duplex
6 LEDs for filter and overflow
Tests/certificates
CE-approved
11.1 Application examples
TAP CURIOUS is able to monitor devices in various ways. 2 examples are shown
here.
Example 1:
Connect your devices as shown to capture the communication between two
devices. This allows you to find faulty frames on the network.
DO0281R00 57 / 58
Page 58

Example 2:
Connect your devices as shown to monitor the frames before and after a device
throughput. In this example, device 2 is monitored. Here, you could analyze the
following:
– Measure the device throughput time,
– Check whether frames have been distorted or truncated,
– Measure jitter on cyclical frames.
Technical Data
DO0281R00
58 / 58
 Loading...