


2
KB
Sheet Break Detector
QUICK GUIDE

1. Quick start-up guide
Rx IR RGB
OPTIC Cables
Optics block
Connect one fiber optic cable
to Rx
Connect another cable to:
Rx = Receiver
RGB = Red, green, blue LED
IR = Infrared LED
- RGB if RGB light in use (normally)
- IR if IR light in use
Break Out
Shield
Shield
On
On
Off
Off
Com
Com
Alarm Out
FUSE
This quick guide leads the way to install, start-up and configure necessary parameters in the normal
cases.
1. PREPARING INSTALLATION
– Install fiber optic cable inside conduit. This is easier done when temperature is cool and conduit
is straight on the floor.
NOTE: DO NOT PULL FIBER OPTIC CABLE STRONGLY. It may break or cut or connector may get loose.
– Connect conduit to sensor head tube.
– Install sensor head mounting rack or mounting clamps.
2. Sensor unit installation
– Check that dry clean purge air is connected (pressure between 0.5 - 3.0 bar / 7-40 psi).
– Check that the eyelet holes are aimed at the web.
– Check that the sensor distance from the web is 10 – 30 cm ( 4 - 12").
– Check that the measurement point distance to paper edge is about 30 cm (12").
– Fix position preliminary. Tuning may change this slightly.
3. Display unit installation
– Check that fiber optic conduit bushing is
tight.
– Check that fiber optic cable is connected
to the optics block:
- Other optic cable to RX.
- Another cable to RGB or IR.
– Check the wiring of the power supply.
– Check the wiring of break signal.
– Check the wiring of alarm signal.
Fig. 1.2. Wiring diagram.
Fig. 1.1. Fiber optic cable connection.
2

4. Start-up and tuning
Preliminary tuning can be done during installation at the actual place by simulating paper on situation
with dry paper on front of sensor head. Final tuning should be always done with real paper running
situation.
– Set unit to "Mode: Maintenance" in the "Configuration" menu.
– Turn on the power.
– Select from the "Maintenance" menu "On-line signals".
– Turn the sensor head light beam so that signal le v els are on their maximum v alues (normally 100
– 700) when simulating paper in front of sensor. Paper sheet should be close its correct position.
Signal level can be adjusted with "TX Po wer" and "RX gain" in the "Measurement config" menu.
Ambient light should be < 60 %.
– Simulate break: Press "SAMPLE". Store signals as "Break level".
– Simulate paper: When the paper is front of the sensor close to its normal position, press "SAMPLE".
Store signals as "Paper level".
– Perform "Calculate Auto-limit" to find the best break detection signal.
– Select the signal suggested by KB pressing right arrow and "ENTER".
– Select "Auto-alarm" to set the alarm signal Low/High limits. Drift alarm action, alarm limit and
direction should be set as well.
– Activate the break relay by selecting operating mode ("Configuration" -› "Mode"): "Detect en-
abled".
– Check that the position memory ring is locked.
5. Final tuning
Final tuning should be always be done with real paper running situation and real break situation.
This time paper distance to the detector is stable and temperature as normal running temperature.
– Select "Configuration" -› "Mode" -› "Maintenance" (break relay deactivated).
– While the machine is running without paper press "SAMPLE" and store signals as "Break level".
This can be done when the paper machine is warm and before paper sheet is on.
– When the web (paper) is on press "SAMPLE" and store signals as "Paper level".
– Perform "Calculate Auto-Limit" to find the best break detection signal.
– Select the signal suggested by KB by pressing right arrow and "ENTER".
– Activate the break alarm relay by selecting operating mode ("Configuration" -› "Mode"): "Detect
enabled".
3

2
KB
Sheet Break Detector
INSTRUCTION MANUAL V1.2

Table of contents
Description 31.
System components.........................................31.1.
Operating principle...........................................41.2.
Installation 52.
Delivery limits...................................................52.1.
Display unit installation.....................................52.2.
Sensor head installation...................................62.3.
Fiber-optic cable installation.............................82.4.
Wiring 103.
Wiring and fiber-optic cable connection.........103.1.
Operation and configuration 124.
Display and operating keyboard....................124.1.
Configuration..................................................134.2.
Set-up.............................................................164.3.
Maintenance...................................................174.4.
Parameters.....................................................204.5.
Start-up 215.
Tuning sensor position...................................215.1.
Reference values for Paper and Break..........215.2.
Auto Limit = Configuring KB for break
5.3.
detection.........................................................21
Auto Alarm.....................................................215.4.
Examples.......................................................225.5.
Maintenance 236.
Regular maintenance.....................................236.1.
Alarms............................................................236.2.
Cleaning the sensor.......................................256.3.
Appendix 1: Quick start-up guide 267.
Appendix 2 288.
Spare parts.....................................................288.1.
Appendix 3 299.
KB model selection........................................299.1.
Appendix 4 3010.
Technical specifications..................................3010.1.
Appendix 5 3111.
Settings and variables....................................3111.1.
KB² Man W41100099V1.22August 2012

1. Description
1.1. System components
KB fiber-optic sheet break detection system contains:
– Sensor head installed above or under the web.
– Fiber-optic cable protected with a flexible conduit.
– Display unit housing the light source, detector, and the measurement computer.
KB from KPM is a solution to high temperature sheet break applications. The light source, detector,
and electronics are isolated from the high temperature environment by a 6 m (20'), 9 m (30') or 12
m (40') fiber-optic cable. While the sensor head is exposed to high temperatures, the electronics is
mounted in a less hostile environment.
Sensor head "eye" holes are kept clean by purging instrument air through the sensor housing. Flo wing
air keeps the eyelet holes clean and prev ents dirt or steam from contaminating the active optic surfaces.
Purging air helps also to keep the sensor head temperature lower in high temperature applications.
KB requires clean instrument air at 0.5 – 3.0 bar (7 - 40 psi), the rotameter or pressure regulator can
be used for the easy detection of airflow.
Fig. 1.1. KB system components. Fiber-optic cable can be 6, 9 or 12 m long.
KB² Man W41100099V1.23August 2012

1.2. Operating principle
Optical
Sensor
RGB and IR
Transmitter
Detector
Fiber optic cables
Paper Sheet
The KB operates on a proven, non-contact reflection principle. The light source can be either RGB
LED (red, green, blue) or IR LED (infrared). The optical sensor is placed above or under the web.
Applications include paper or board webs, wires or felts. Thanks to the unique RGB detection
method the color of the product or the felt has no effect on the measurement reliability. The sensor
is neither affected by dirt, steam nor temperatures up to 180 °C (356 °F) when installed according
to Kajaani Process Measurements specifications. There are no electronic components located in the
sensor head.
The optical sensor is connected through a fiber-optic cable to the RGB/IR light source located in the
display unit. The RGB/IR LEDs emit pulsed red, green, blue, or IR light onto the web surface. The
reflected light is received and transmitted through the fiber-optic cable to the detector. All light
components are analyzed fast for a reliable break detection.
A break activates a relay , which can be connected to the logic control of a paper machine. The reflected
light intensities are also available as optional 4 - 20 mA analog outputs.
Fig. 1.2. Operating principle.
The self-cleaning sensor head is a 33.7 x 1500 mm (1" x 59") stainless steel tube with two holes
serving as eyelets for the fiber-optics and outlets for purge air. Continuous airflow through the
stainless steel enclosure keeps positive pressure around the sensor head's e yes and keeps the eyelets
free of steam, dust or debris. The openings should be located towards the surface being monitored.
Fig. 1.3. Sensor eylets and purge air operation.
KB² Man W41100099V1.24August 2012

2. Installation
340 mm
85
mm
270 mm
Note: Do not mount several fiber-optic sensor heads side by side; a mutual interference may occur. Infrared dryer might also interference the measurement.
2.1. Delivery limits
Manufacturer supplied components:
– KB sensor head with position memory, 1 ea
– Mounting clamps, 2 ea
– Fiber-optic cable (6 m/20", 9 m/30" or 12 m/40"), 1 ea
– Display unit, 1 ea
– Flexible conduit for a fiber-optic cable protection (SS tubing, 25,4 mm / 1" OD), 1 ea
Options:
– Mounting rack.
– Analog output board.
2.2. Display unit installation
Install the display unit to the wall outside the machine for easy access.
Fig. 2.1. Display unit dimensions (mm).
KB² Man W41100099V1.25August 2012

2.3. Sensor head installation
Front view
52 mm
33,7
Side view
The fiber-optics cable is delivered mounted to the sensor head. Feed the free fiber -optic cable through
the flexible conduit. This is easiest, if the conduit is laying straight on the floor and the fiber-optic
cable is at room temperature. Connect the conduit to the sensor head. If you pull, pull the fiber-optic
cable from the outer jacket, not from the connectors. The maximum force for pulling from 2 cables
is 50 Newton (11 lbf). The minimum bending radius is 50 mm (2"). The sensor should be installed
about 25 cm (10") inside from the edge of the web and 15 cm (6") above it. Standard range is 10 30 cm (4 - 12").
Fig. 2.2. Typical installation.
Install the mounting clamps or the rack (optional) on paper machine’s frame or other solid mounting
structure. Leave 20 - 30 cm (8 - 12") between the clamps. It is recommended to leav e option to adjust
clamp height so that sensor head can be positioned optimally during the start-up.
Fig. 2.3. Mounting clamps.
Fig. 2.4. Mounting rack (option).
KB² Man W41100099V1.26August 2012

Slide the sensor tube through the mounting clamps. Rotate the eyes into a position towards the web
and semi-tighten the clamps. The groove in sensor head shows the direction of light beam (opposite
side). Final adjustment is done with the help of the signal level display after the unit is powered up.
The light beam is directed to the measured web. Insert the pin of the position memory ring (fig.
2.5. ) into the hole in the clamp and tighten the stop screw. If the sensor is removed for maintenance
the memory ring ensures that the sensor head is positioned exactly in the same position as before the
removal.
Fig. 2.5. Position memory.
KB² Man W41100099V1.27August 2012

2.4. Fiber-optic cable installation
NOTE: Handle fiber-optic cables with care. Do not pull strongly. Remove protective caps before connecting
to the optic block.
Route the flexible conduit with the fiber-optic cable inside it to the display unit.
1. Remove the conduit bushing from the display unit.
Fig. 2.6. Removing the conduit bushing from the display unit.
2. Guide the end of the fiber-optic cable through the conduit bushing and fasten the bushing to the
flexible conduit.
3. Place the multi air seal on top of the fiber-optic cables, fig. 2.7. point A & B.
4. Insert the multi air seal inside the conduit bushing, step C.
Fig. 2.7. Multi air seal inserting.
KB² Man W41100099V1.28August 2012

5. Open the optics block cover, slide the cables through the bushing hole, cap nut and tighten the
bushing loosely, fig. 2.8.
6. Insert one of the cables to the Rx slot and the other one to the RGB slot (or to IR slot if IR light
is used). It does not matter which one of the cables is connected to the Rx slot.
Fig. 2.8. Connecting cables to optical unit.
7. Lock the cables in place with the optic block cover, fig. 2.9. points A & B.
8. Fasten the optic block cover and tighten the cap nut of the cable bushing, points B & C.
9. Connect the instrument air 0.5 - 3.0 bar (7 - 40 psi) to the air inlet connector (point C) at the end
of the flexible conduit outside the display unit housing.
Fig. 2.9. Connecting cables to optical unit.
KB² Man W41100099V1.29August 2012
3. Wiring
Red/IR
Green
Blue
RS-485 Binary inputs
Break out
Alarm out
Shield
Analog outputs
A B
OPTIC Cable
OPTIC Cable
Shield
Shield
Shield
On
On
Off
Off
Com
Com
- +
- + - +
Break Out
Shield
Shield
On
On
Off
Off
Com
Com
Alarm Out
FUSE
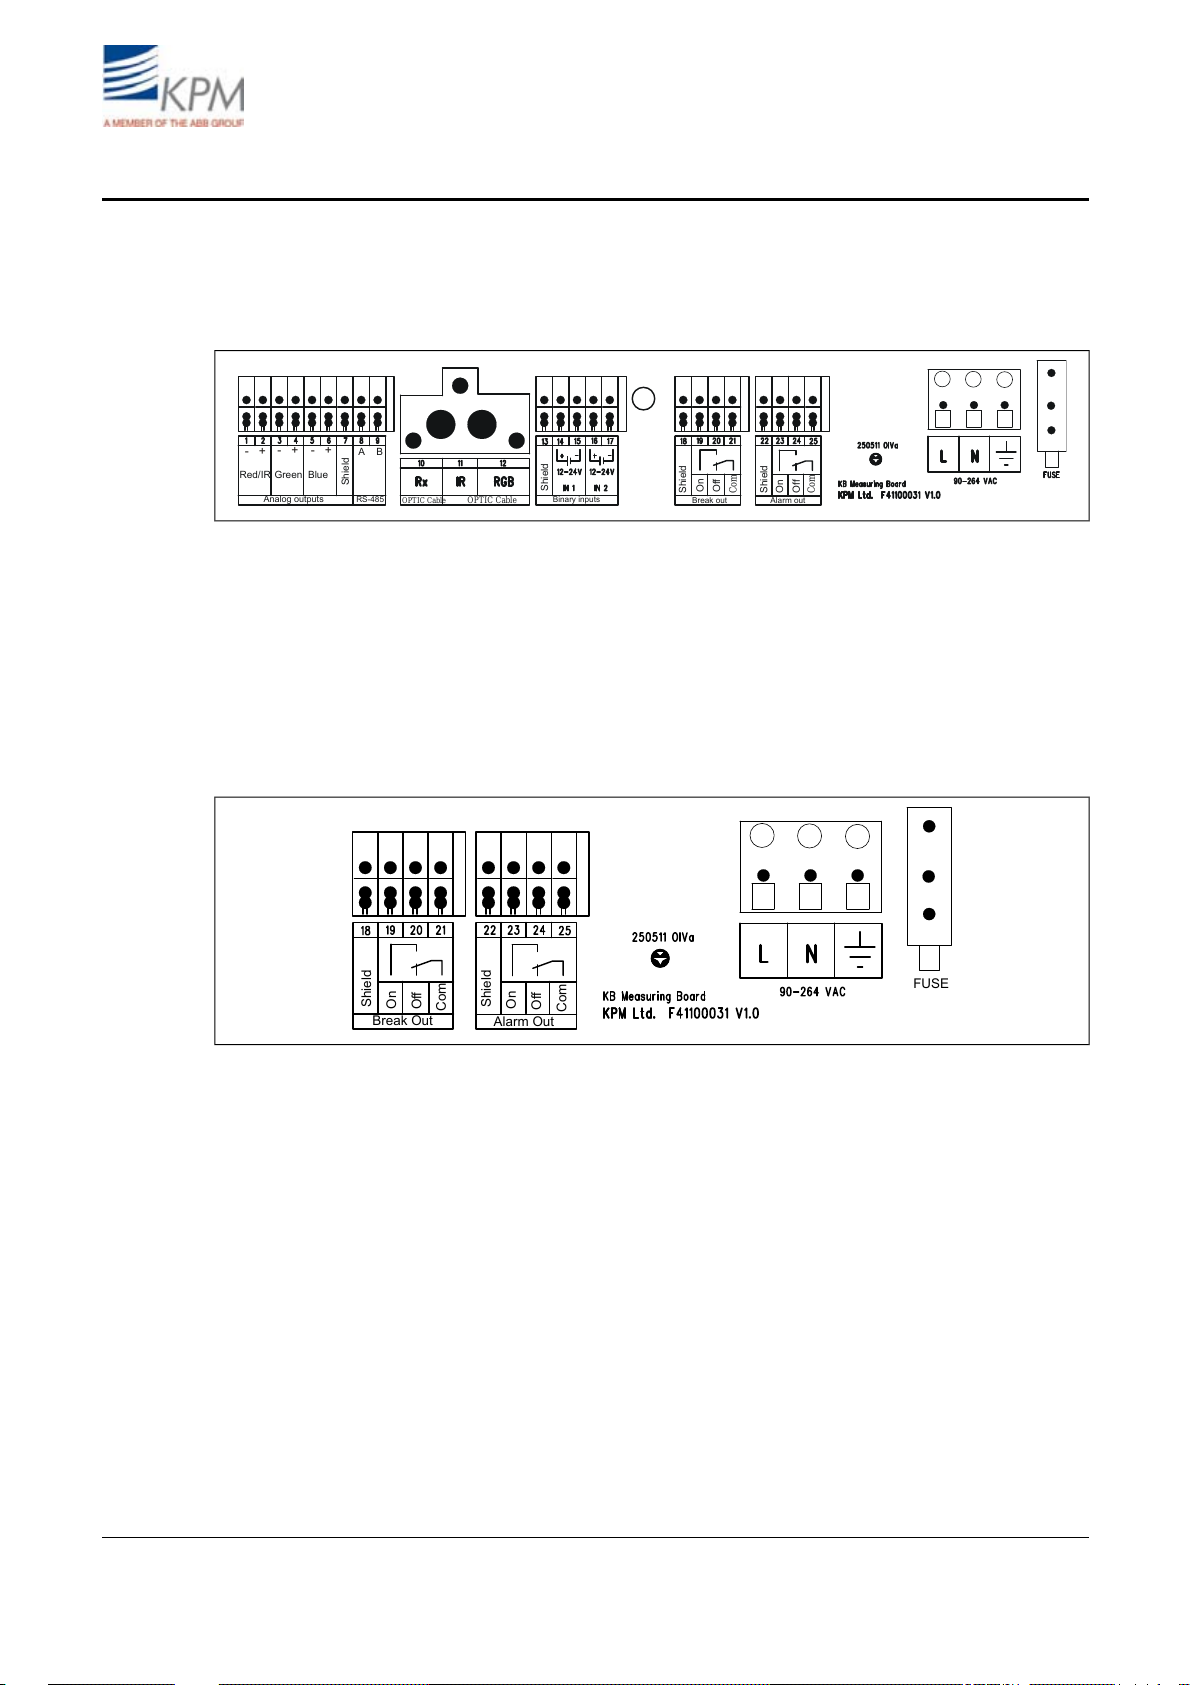
3.1. Wiring and fiber-optic cable connection
The terminals for the electrical and fiber-optic cables are located under the bottom cover of the display
unit. The layout of the KB measuring board is shown in fig. 3.1.
Fig. 3.1. KB Measuring Board layout.
Relays are of dry contact types. In normal operation the "Break Out On" relay is open and it closes
during a break. In case the power is lost or turned off the "Break Out On" relay remains open (disabled). "Break Out Off" works in the opposite way.
"Alarm Out Off" is normally closed. It opens in case the built-in self-diagnostics detects a failure. If
power is lost or turned off the "Alarm Out Off" is OPEN. "Alarm Out On" works in the opposite
way.
Fig. 3.2. Wiring of Power Supply, Break relay and Maintenance alarm.
KB² Man W41100099V1.210August 2012
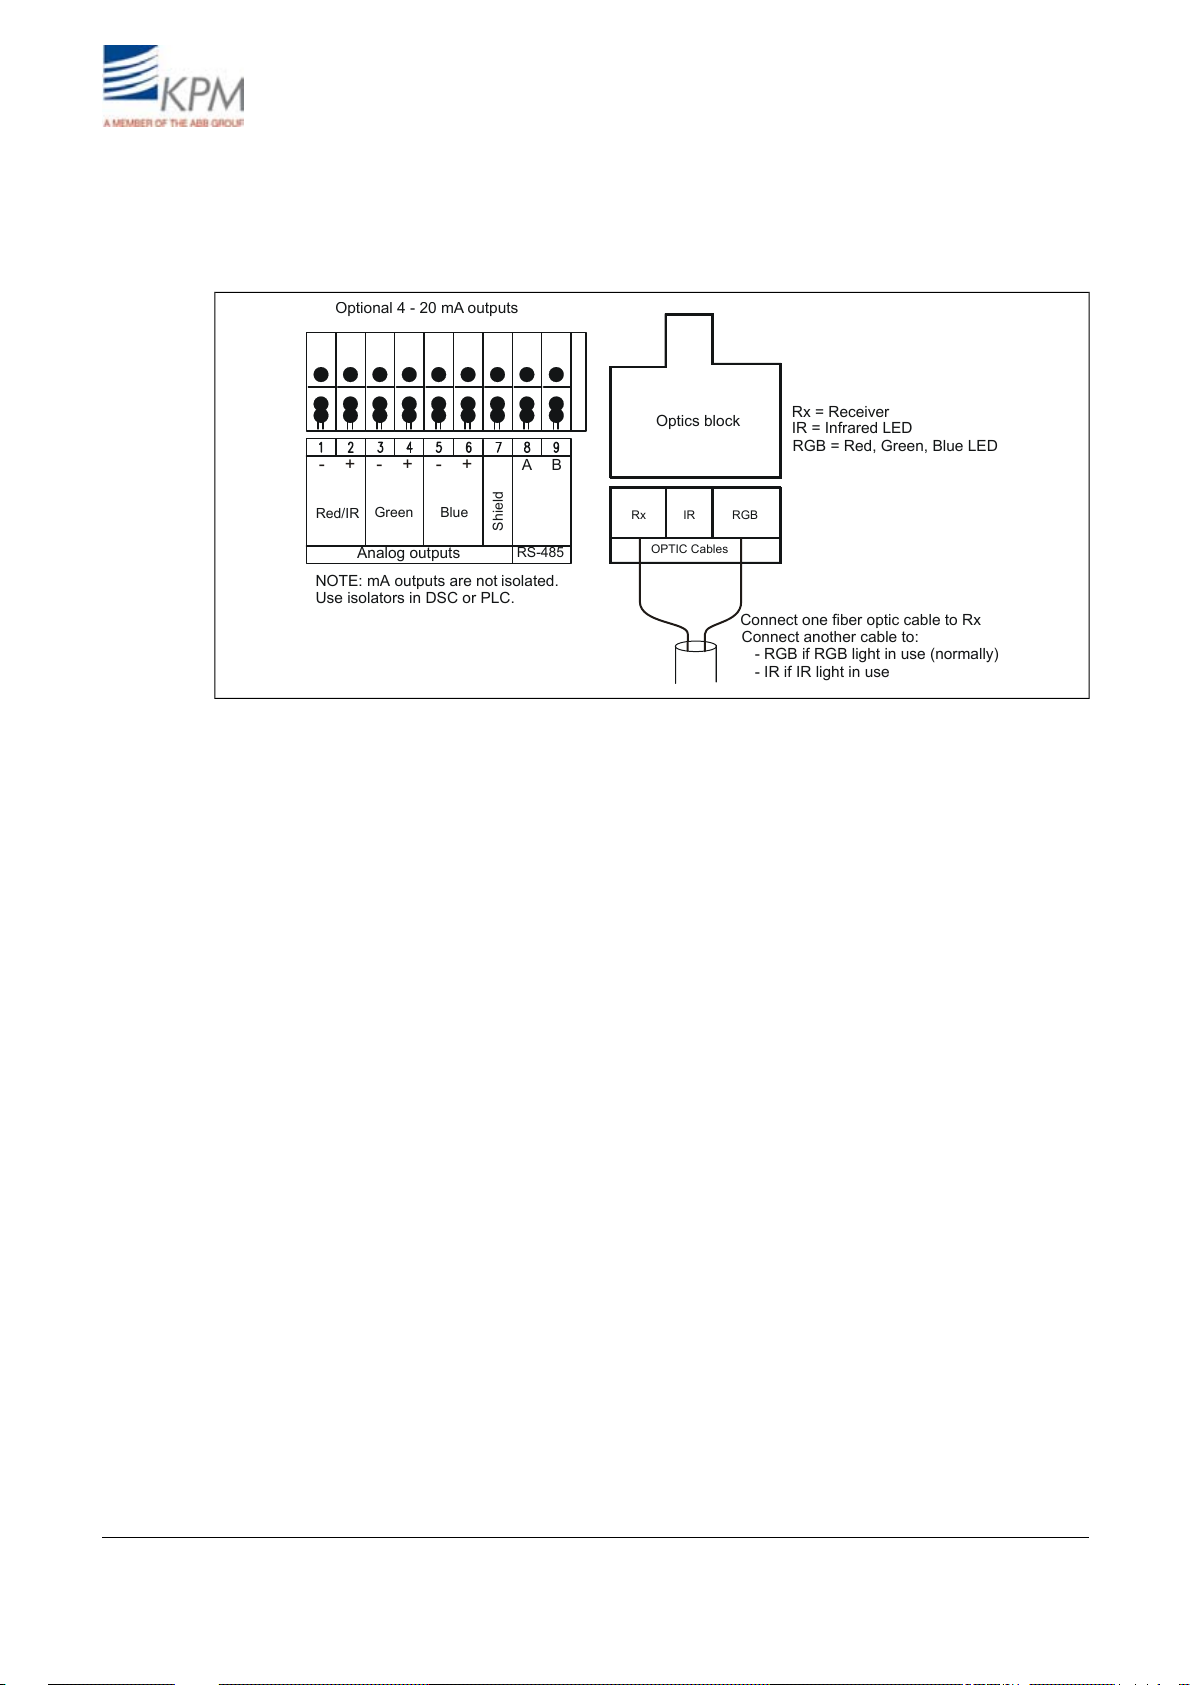
Fiber-optic cable is connected to the optics block. It does not matter which one of the two cables is
Rx IR
Red/IR
Green
Blue
RS-485
Shield
RGB
OPTIC Cables
Optional 4 - 20 mA outputs
Optics block
Connect one fiber optic cable to Rx
Connect another cable to:
Rx = Receiver
RGB = Red, Green, Blue LED
IR = Infrared LED
- RGB if RGB light in use (normally)
- IR if IR light in use
NOTE: mA outputs are not
Use isolators in DSC or PLC.
isolated.
Analog outputs
A B- + - + - +
connected to the receiver inlet (Rx). In a normal application another cable is connected to the RGB
light source. IR light source is used in special cases such as heavy steam environment or in an application where exceptionally strong light is needed.
Fig. 3.3. Fiber-optic cable and optional 4-20 mA connections.
KB² Man W41100099V1.211August 2012

4. Operation and configuration
Break
detected
ENTER
SAMPLE
ESC
ON
B
R
R/B
1.83
3.05
K
K
O
OFF
4.1. Display and operating keyboard
Fig. 4.1. Display and keyboard.
The display contains 7 lines, with 21 characters in a line. The main display (fig. 4.1) shows:
– Selected measurement signal for break detection.
– Signal level of the selected signal.
– Time.
– Break status.
– Alarms, if activated.
Common properties in other menus:
– Selected line highlighted
– Upper right corner shows:
* Number of lines/pages in that menu.
* Arrow shows, if hidden lines.
– Help menus in bottom.
Keyboard
– ON/OFF button: Switch the mains on/off.
– Arrows: Scroll the menus and rows or adjust values.
– Esc: Delete changes and/or return back to the previous menu.
– Enter: Accept data and input changes.
– Sample: Averages the measured values. After sampling the program asks if the values will be
stored for Break or Paper Reference values or deleted.
Fig. 4.2. Main display and main menu.
KB² Man W41100099V1.212August 2012

4.2. Configuration
Fig. 4.3. Configuration menu.
(Operating) Mode: Select "Detect enabled" for normal operation. For maintenance select "Maintenance" – it disables the break relay to prevent false break during the maintenance work.
Detect(ion) limit: Set the signal level trigger point for the break.
(Detect) Direction: Select, when the break is activated, if the signal level goes under ("Break <
Limit") or above ("Break > Limit") the detection limit.
Selected signal: One of the RGB-signals or combinations thereof can be selected for break detection.
The one, which gives the highest dif ference between the web-on (P APER) and the web-of f (BREAK)
situation is selected. In case IR light source is selected, then only IR is possible.
Auto-limit and Auto-alarm:
Auto-limit sets the signal type for break detection, detection level and direction, when performed.
Auto-alarm sets the alarm signal and alarm limits, when performed.
Fig. 4.4. Setting reference values for break levels.
KB records all the signal levels in BREAK/PAPER situations and stores them as reference values.
Measure break (signal) lev els: Press right arrow. To store Break signal levels in KB memory press
"ENTER". "ESC" will escape without storing. Press "Sample" in front panel to average also signal
levels and enter this display, where break and paper values can be stored.
Measure paper (ON signal) levels Press right arro w . To store Paper ON signal levels in KB memory
by press "ENTER". "ESC" will escape without storing. Press "Sample" in front panel to average also
signal levels and enter this display, where break and paper values can be stored.
Sampled signal levels: Displays both stored signal levels (PAPER and BREAK).
KB² Man W41100099V1.213August 2012

Calculate Auto-limit menu KB calculates the web-on to web-off ratio (Paper-to-Break Ratio) when
both cases has been stored as references in memory . KB also suggests the best signal for break detection and puts them in a ranking list. Normally the best signal is chosen for break detection by having
it in display and pressing right arrow and then "ENTER". Then KB sets the break trigger point
("Detection Limit") to 50 % of the difference between the web-on and the break-on levels for the
selected signal. The unit sets also automatically the detection direction.
Fig. 4.5. Calculating auto-limits.
Alarm settings:
KB can alarm in situations where the signal level is very low, very high or when signal drifts a lot.
Fig. 4.6. Alarm settings.
Observed signal: Select the R, G or B signal (IR in case of IR light source) which is used to monitor
this alarm. Normally the same signal is chosen into alarm as in break detection. Only one main color
can be chosen for alarming, no combination possible.
Low/High alarm limit: If a piece of paper gets stuck on the sensor head , signal level can go very
low or very high. The low and high alarm limits are set for this case. Alarm will go on if signal goes
below low limit (3 default) or over high limit (1000 default). Normally default values are OK.
Drift Alr: Drift alarm is used to give alarm in case measurement signal drifts. For example because
of dust or dirt on top of fiber optic lens or in the opening (makes it smaller).
There are three possibilities to use "Drift Alarm":
– Report only: In case drift is detected;
Alarm Relay is activated,
break detection and Break Relay continue to operate normally.
– Not in use: Drift detection is not used.
– Prev. break: In case of drift is detected;
Alarm Relay is activated,
break detection and Break Relay is not used (purpose is that KB will never gi ve false Break output).
KB² Man W41100099V1.214August 2012

R ( G, B ) Break on and R ( G, B ) Paper: These are stored signal values during Break and Paper.
Auto limit calculation is using these values to perform detection limit and other values. These are
only for indication in this menu to help select correct alarm limits.
Measurement config(uration):This section determines detection speed (Detect filter), measurement
intervall (cycle), light emission intensity and detector sensitivity.
Fig. 4.7. Measurement settings.
Detect filter: Set number of measurement cycles for break determination, default 3. Number 3 means
that 3 consecutive measurements are all below detection limits before break relay is activated.
Meas. cycle: Set the measurement cycle time, default 20 ms. Can be between 10 and 60 ms.
Tx Power: Select light source intensity, High/Normal. High can be chosen when the measurement
distance is high, for example over 20 cm.
Rx Gain: Detector gain – normally 1 (selectable 4.0, 3.5, 3.0, 2.5, 2.0, 1.5, 1.0, 0.5). Effects directly
on signal level. Can be adjusted lower if ambient light is too high (over 60 %).
KB² Man W41100099V1.215August 2012

4.3. Set-up
Fig. 4.8. Setup displays.
– Light source: RGB (visible Red, Green, Blue) light is recommended in a normal application. IR
(Infrared) light is used in special cases, such as heavily steamy environment and/or long measurement distance from the web.
– Date & time: Set date and time for data logging.
– Language: Select English/Finnish.
– Password: Set password. 000 = no password.
– Break effect: Select None, Beep, Lcd+Beep, Lcdlight (= blinking display).
– Alarm effect:Select None, Beep, Lcd+Beep, Lcdlight (= blinking display).
– Contrast: Set the display contrast (1 - 10), default = 10.
– Analog output setup: Output and mA-values are shown only, if the analog output board is in-
stalled.
Fig. 4.9. Analog output set-up.
– Analog output signals: On optional analog board there are three 4 - 20 mA analog outputs. You
can select any of the RGB signals and their combinations to each output. Menu is displayed only ,
if board is installed.
– Analog output limits: Set the signal levels corresponding 4 mA (LOW) and 20 mA (HIGH) for
each analog output.
– Analog output filter: Select the dampening of the analog signals. The selected filtering time is
applied to all the 3 outputs.
– mA output error mode:When the self-diagnostics finds a failure the unit sets the outputs to the
selected mode. You can set the outputs to go to 22.5 or 3.5 mA, or to freeze to the last good
number, or to continue to show the measured values although they may be wrong (mode No
eff(ect)).
KB² Man W41100099V1.216August 2012

4.4. Maintenance
In "Maintenance" section you can find device indentification, measured signal values, errors, data
logging and event logging.
On-line signals:
Fig. 4.10. On-line signals, pages 1 and 2.
Fig. 4.11. On-line signals, pages 3 and 4.
Fig. 4.12. On-line signals, page 5.
You can monitore measured and calculated signals for troubleshooting.
NOTE: "Ambient light" should be less than 60%.
When "Ambient light" value is higher that 60 % there is too much external light, which may disturb
measurement. "Signal levels" and "Ambient light" v alues can be adjusted by parameters "TX Power"
and "RX Gain", which are located in "Factory setting" menu. Smaller "RX Gain" value will help receiving less ambient light. ("Min %-Max %" shows the occurred e xtremes ambient light during one
measurement cycle).
KB² Man W41100099V1.217August 2012

Analog signals: Contains measured values and mA output for each channel.
Fig. 4.13. Analog signals.
Event log: Event log stores changes made after start setup. Stores also all boot-ups. Holds last 250
events.
Datalog:
Fig. 4.14. Datalog menus.
Contains measured minimum and maximum signals and monitored internal temperature data since
the last reset. Please; reset during start-up.
Check alarms: List of maintenance alarms, which are active at a moment. Used for troubleshooting.
Identification:
Fig. 4.15. Identification menus.
Contains ID and version information.
Default settings: Reset to configuration settings. Used e.g. if the settings are changed by accident.
KB² Man W41100099V1.218August 2012

Factory Settings
NOTE: Requires always password.
Factory setting values are set during initial setting and there is no need for customer to change them.
Please, contact Kajaani Process Measurements for more information.
Fig. 4.16. Factory settings.
Clear event log: Clears the event log.
Factory reset: Reset to factory settings.
Serial number: Set serial number.
Color balance adj(ustment):
Fig. 4.17. Color balance adjustment.
Individual gain adjustment of R, G, B, and IR lights.
KB² Man W41100099V1.219August 2012

Led current adj(ustment):
Fig. 4.18. LED current adjustment, pages 1 and 2.
Fig. 4.19. Tx local values, indicate LED light intensity level.
USB comm(unication) mode: Select commumication port mode: ScrShot/Normal.
Analog output trim: KB sends in the edit mode 4 and 20 mA in turn to the selected analog output.
With S (gain) and Z (zero offset) the output can be trimmed to correspond 20 mA (gain) and 4 mA
(zero).
4.5. Parameters
The "Parameters" display contains normally needed parameters, and they can be modified in this
display.
Fig. 4.20. Parameters display.
KB² Man W41100099V1.220August 2012

5. Start-up
5.1. Tuning sensor position
Purpose of tuning is to direct light beam so that reflectance from paper is strongest.
To observe the signal levels:
1. Go to "Maintenance" -› "On-line signals".
2. Locate large piece of paper on the estimated place of measured sheet to simulate paper on situation
3. Rotate the sensor head until the signal levels indicated in the display unit are at their strongest
4. Check the ambient light percentage ("Maintenance" -› "On-line signals"). This should be below
5. Fasten the position memory ring.
Fig. 5.1. Sensor head light and position memory ring adjustment.
to find the maximum signal level. Paper distance has effect on the signal level.
(normally from 50 – 500 with paper). This is usually the perpendicular position against the web .
60 % level. If the ambient light is too high, reduce the receiver sensitivity Rx Gain.
5.2. Reference values for Paper and Break
1. Teach the unit to recognize the Break-ON conditions.
Press "SAMPLE". After a short time measured values are displayed. Save those numbers as reference values for break “Save as break level”.
2. T each the unit to recognize the Paper -ON conditions. While P aper is on, press "SAMPLE". After
a short time measured values are displayed. Save those numbers as reference value for paper
“Save as Paper level”.
5.3. Auto Limit = Configuring KB for break detection
Auto-limit Calculation can be performed when above mentioned both reference values have been
stored in KB memory. This procedure calculates detection limit for break detection.
1. Go to "Configuration" -› "Auto-limit&Auto-alarm" -› "Calculate Auto-Limit". KB has calculated
from the Paper ON / Break ON signals "Ratio" (Paper to Break) for all the light components plus
7 calculated combinations thereof. The highest rated signal normally gives the best performance.
2. Select the 1st displayed signal for break detection with arrow right and "ENTER". KB sets the
break trigger level (Detection limit) to the mid-point (50 % v alue) between the "Break"-on/"Paper"on levels of the selected signal. KB selects the detection "Direction".
3. Set "Configuration" -› (operating) "Mode: Detect enabled" to activate the break measurement.
In the "Maintenance" mode the break relay is deactivated to prevent false alarms while working
on the unit.
5.4. Auto Alarm
1. Go to "Configuration" -› "Auto-limit&Auto-alarm" -› "Calculate Auto-Alarm".
2. Choose a signal for alarming purposes. Only one base color R, G, B or IR (no combination) can
be chosen. Normally, the same signal should be taken for alarming than for the break detection.
3. Pressing the right arrow key calculates proper alarm limits. Lo w limit is normally between 3 and
10 and high limit around 400 - 1000. They can be changed also manually . Drift alarm is calculated
to be 70 % value between paper and break.
KB² Man W41100099V1.221August 2012

5.5. Examples
Open draw
Auto-limit&Auto-alarm values:
Break: R: 6, G: 7, B: 8
Paper on: R: 104, G: 121, B: 144
Auto-limit calculation results: 1. B (blue light gives the highest difference), 144/8=18 (paper-tobreak "Ratio" = Normal to Break Ratio), 8 (blue level on "Break"), 144 (blue level on "Paper").
KB selects blue light for break detection and sets "Detect(ion) limit" to 76 =((144+8)/2)
KB sets the detect "Direction" to "Break < Limit" = break relay activates as soon as B-signal drops
below 76.
Alarm settings:
– Observed signal: Select signal which is used for break detection (B in this case).
– Low alarm Limit: Set for example 3.
– High alarm Limit: Set for example 1000.
– Drift Alarm: Select required action of "Drift Alr", recommended "Report Only".
– Drift al(arm) limit: 103 (= 0.70*(144-8)+ 8) = 70 % of range between paper on and break.
– Drift al(arm) dir(ection): Falling signal (Break < Limit).
Paper on red wire
Auto-limit&Auto-alarm values:
Break: R: 85, G: 24, B: 26
Paper on wire: R: 94, G: 125, B: 119
Auto-limit calculation results: 1. G (green light gives the highest difference), 125/24=5.2 (paperto-break "Ratio"), 24 (green level on "Break"), 125 (green level on "Paper").
KB selects green light for break detection and sets the trigger point to 74 (= (125+24) /2 ).
Alarm settings:
Same way as above in chapter "Open draw".
Observed signal: Select signal which is used for break detection (G in this case).
Low alarm Limit: Set for example 3.
High alarm Limit: Set for example 1000.
Drift Alarm: Select required action of "Drift Alr", recommended "Report Only".
Drift al(arm) limit: 94 (= 0.70*(125-24)+24) = 70 % of range between paper on and break.
Drift al(arm) dir(ection): Falling signal (Break < Limit).
KB² Man W41100099V1.222August 2012

6. Maintenance
Alarm name Possible cause Action
Sensor eyelet holes blocked. Check that the sensor head is free of debris.
Fiber optic cable in the
sensor getting dirty.
Check that the purge air is on and flow s out f rom the
sensor eyelet holes (pressure 0.5- 3 Bar).
A LED of the RGB light
source has failed or looses
the intensity.
Clean the ends of the fiber optic cables using e.g.
cotton stick w etted w ith alcohol containing cleaning
agent.
Check the signal levels of all light components. If the
one w hich is used for break detection show s low
intensity select another signal (Configuration -> auto
limit calculation ->signal selection).
Sensor head too close to the
w eb surf ace.
Move the sensor f urther aw ay from the w eb or
redirect the sensor eyelet holes slightly slantw ise at
the surf ace.
A shiny surf ace close to the
sensor head.
Redirect the sensor to avoid the disturbing reflection.
A strong light beam from a
near by lamp aimed at the
sensor head.
Move the disturbing light or redirect the sensor aw ay
from the light.
Reflection from the w eb
surf ace still too high.
Reduce the Rx (light receiver) gain in the
"Measurement config" menu (Av ailable gains 0.5, 1.0,
1.5, 2.0, 2.5, 3.0, 3.5, 4.0).
Communication betw een the
display and connection board
has jammed.
Turn off the pow er and restart the unit.
The flat cable c onnector in
the connection board is
loose.
Check that the f lat cable connector is tight.
Measuring Board failure Replace the measuring board.
Check the sensor head.
Ambient light too
high (on-line
signals, ambient
light 60%)
Check cleaning
Optic data timeout
Signal out of range,
clean meas. probe
Piece of paper on the sensor
head.
£
6.1. Regular maintenance
KB does not require any regular maintenance. Built-in self-diagnostics monitors internal signals and
raises alarm flag in case of a malfunction or certain signals reach alarm limits.
6.2. Alarms
The R, G or B signal (or IR if in use) is used to monitor the light intensity drift. Gradual drift can be
caused e.g. by dust, which is slowly building up on the fiber optics or by dirty water , which gets inside
the sensor head and stains the surface of the fiber optics.
KB² Man W41100099V1.223August 2012

3
1000
110
60
80
Cleaning alarm HIGH
Cleaning alarm LOW
Cleaning alarm DRIFT
DETECTION LIMIT
Paper
Break
Drift alarm
10
Fig. 6.1. Example of alarm limits and break detection.
KB alarms if signal goes above "Cleaning alarm HIGH" or below "Cleaning alarm LOW". "Drift
Alarm" goes on when signal level drops below "Cleaning alarm DRIFT" (here limit = 80 which is
70 % from break (10) to Paper (110). "Detection limit" is set to 60 (50 % value between paper and
break). KB informs break whenever signal drops below 60.
KB² Man W41100099V1.224August 2012

6.3. Cleaning the sensor
Fiber-optic cable head
Fiber Optic lenses should be clean all the time. Cleaning should primarily to be done through the
fiber optics opening in the sensor head. Cotton stick are the preferred means.
In case cleaning requires disassembly of the sensor head proceed as follows:
1. Release the fiber optic cable from the display unit and remove also the conduit bushing in order
to get the cable to slide inside the conduit.
2. Remove the end plate from the sensor head by removing the two fastening screws.
3. Remove the locking ring.
4. Pull the fiber-optic cable through the optical sensor housing.
5. Wipe the lenses clean with soft fabrics or paper and reinstall.
6. Eyes must be centered over the holes in the pipe.
Fig. 6.2. Dismantling the sensor housing.
Fig. 6.3. Fiber optic cable head.
KB² Man W41100099V1.225August 2012

7. Appendix 1: Quick start-up guide
Rx IR RGB
OPTIC Cables
Optics block
Connect one fiber optic cable
to Rx
Connect another cable to:
Rx = Receiver
RGB = Red, green, blue LED
IR = Infrared LED
- RGB if RGB light in use (normally)
- IR if IR light in use
Break Out
Shield
Shield
On
On
Off
Off
Com
Com
Alarm Out
FUSE
This quick guide leads the way to install, start-up and configure necessary parameters in the normal
cases.
1. PREPARING INSTALLATION
– Install fiber optic cable inside conduit. This is easier done when temperature is cool and conduit
is straight on the floor.
NOTE: DO NOT PULL FIBER OPTIC CABLE STRONGLY. It may break or cut or connector may get loose.
– Connect conduit to sensor head tube.
– Install sensor head mounting rack or mounting clamps.
2. Sensor unit installation
– Check that dry clean purge air is connected (pressure between 0.5 - 3.0 bar / 7-40 psi).
– Check that the eyelet holes are aimed at the web.
– Check that the sensor distance from the web is 10 – 30 cm ( 4 - 12").
– Check that the measurement point distance to paper edge is about 30 cm (12").
– Fix position preliminary. Tuning may change this slightly.
3. Display unit installation
– Check that fiber optic conduit bushing is
tight.
– Check that fiber optic cable is connected
to the optics block:
- Other optic cable to RX.
- Another cable to RGB or IR.
– Check the wiring of the power supply.
– Check the wiring of break signal.
– Check the wiring of alarm signal.
Fig. 7.2. Wiring diagram.
Fig. 7.1. Fiber optic cable connection.
KB² Man W41100099V1.226August 2012

4. Start-up and tuning
Preliminary tuning can be done during installation at the actual place by simulating paper on situation
with dry paper on front of sensor head. Final tuning should be always done with real paper running
situation.
– Set unit to "Mode: Maintenance" in the "Configuration" menu.
– Turn on the power.
– Select from the "Maintenance" menu "On-line signals".
– Turn the sensor head light beam so that signal le v els are on their maximum v alues (normally 100
– 700) when simulating paper in front of sensor. Paper sheet should be close its correct position.
Signal level can be adjusted with "TX Po wer" and "RX gain" in the "Measurement config" menu.
Ambient light should be < 60 %.
– Simulate break: Press "SAMPLE". Store signals as "Break level".
– Simulate paper: When the paper is front of the sensor close to its normal position, press "SAMPLE".
Store signals as "Paper level".
– Perform "Calculate Auto-limit" to find the best break detection signal.
– Select the signal suggested by KB pressing right arrow and "ENTER".
– Select "Auto-alarm" to set the alarm signal Low/High limits. Drift alarm action, alarm limit and
direction should be set as well.
– Activate the break relay by selecting operating mode ("Configuration" -› "Mode"): "Detect en-
abled".
– Check that the position memory ring is locked.
5. Final tuning
Final tuning should be always be done with real paper running situation and real break situation.
This time paper distance to the detector is stable and temperature as normal running temperature.
– Select "Configuration" -› "Mode" -› "Maintenance" (break relay deactivated).
– While the machine is running without paper press "SAMPLE" and store signals as "Break level".
This can be done when the paper machine is warm and before paper sheet is on.
– When the web (paper) is on press "SAMPLE" and store signals as "Paper level".
– Perform "Calculate Auto-Limit" to find the best break detection signal.
– Select the signal suggested by KB by pressing right arrow and "ENTER".
– Activate the break alarm relay by selecting operating mode ("Configuration" -› "Mode"): "Detect
enabled".
KB² Man W41100099V1.227August 2012

8. Appendix 2
3150001 Fiber Optic Cable 6m
3150002 Fiber Optic Cable 9m
3150003 Fiber Optic Cable 12m
2350011 KB/6 conduit, L=4370
2350012 KB/9 conduit, L=7370
2350013 KB/12 Conduit, L=10370
H41110043V1.0 End Cap
2000205 Screw (2 pcs) for end Cap M14x14 DIN 965 A4
2000033 Lock Ring 28 DIN 472 AZ
A41100095V1.0
KB Mounting Assembly
H41100102V1.0 KB Sensor Head
A41100032V1.0 KB Measuring Board
A41100021V1.0 KB Analog Board (3 X 4-20 mA)
3200002 Graphic Display Board
A41100027V1.0 Keyboard KB - KC7
A41100094V1.0 KB Mounting Rack
A41100102V1.0 KB2Display Unit
8.1. Spare parts
KB² Man W41100099V1.228August 2012

9. Appendix 3
Type Order Code Description
K B 6
K B 6 KB/6 Sheet Break Detector with 6 meters (20ft) Fiber Optic Cable
KB Display Unit, 85...264VAC, 2 x Alarm relay outputs included
Flexible Conduit for Fiber optic cable
N No Conduit
C Full Flexible SS316 Conduit 45mm (15') with Connectors
Mounting Rack
N
No adjustable mounting rack
R Adjustable SS316 Mounting Rack
Analog output
N No Analog outputs for DCS trending ( Analog outputs not needed for break alarm)
A
3x 4-20 mA outputs for DCS trending
KB-Connection PC Program
N No KB-Connection PC Program
C
KB-Connection PC Program on CD disk
RS485 / 232 Converter for PC program
N No RS485 / 232 Converter for PC program
R RS485 / 232 Converter for PC program, Rack mounting
Type Order Code Description
K B 9
K B 9 KB/9 Sheet Break Detector with 9 meters (30ft) Fiber Optic Cable
KB Display Unit, 85...264VAC, 2 x Alarm relay outputs included
Flexible Conduit for Fiber optic cable
N No Conduit
C
Full Flexible SS316 Conduit 45mm (15') with Connectors
Mounting Rack
N No adjustable mounting rack
R Adjustable SS316 Mounting Rack
Analog output
N No Analog outputs for DCS trending ( Analog outputs not needed for break alarm)
A 3x 4-20 mA outputs for DCS trending
KB-Connection PC Program
N
No KB-Connection PC Program
C KB-Connection PC Program on CD disk
RS485 / 232 Converter for PC program
N No RS485 / 232 Converter for PC program
R RS485 / 232 Converter for PC program, Rack mounting
Type Order Code Description
K B 12
K B 12 KB/12 Sheet Break Detector with 12 meters (40ft) Fiber Optic Cable
KB Display Unit, 85...264VAC, 2 x Alarm relay outputs included
Flexible Conduit for Fiber optic cable
N No Conduit
C
Full Flexible SS316 Conduit 45mm (15') with Connectors
Mounting Rack
N No adjustable mounting rack
R
Adjustable SS316 Mounting Rack
Analog output
N No Analog outputs for DCS trending ( Analog outputs not needed for break alarm)
A 3x 4-20 mA outputs for DCS trending
KB-Connection PC Program
N No KB-Connection PC Program
C KB-Connection PC Program on CD disk
RS485 / 232 Converter for PC program
N No RS485 / 232 Converter for PC program
R RS485 / 232 Converter for PC program, Rack mounting
9.1. KB model selection
KB² Man W41100099V1.229August 2012

10. Appendix 4
Ambient temperature Sensor head and fiber optic cable: -10 to 180 ºC (15 ºF to 356 ºF) Electronics unit: -10 to 60
ºC (15 ºF to 140 ºF)
Fiber optic cable KB/6: 6 m (20’), KB/9: 9 m (30’) or KB/12: 12m (40’)
Fiber optic cable conduit Airtight conduit 25,4 mm (1”) OD, AISI 316 (L6= 4370, L9=7370, L12=10370)
Installation Sensor distance from the web 5...30 cm (2...12”).
LED pulse frequency 1 kHz
Power supply 90 - 264 VAC, 50/60 Hz
Power consumption 15 W
Enclosure class IP 66 (Nema 4X)
Purge air connection Dry instrument air 0.5 – 3.0 bar (7 - 40 psi), 6/4 mm (1/4”) connector, normal consumption
30-100l/min
Digital outputs 2 x Closing or opening contact max. 250 VAC, 2A; 220 VDC, 2 A for Break signal and
Maintenance alarm
Alarm output delay Min. 15 ms from the actual break
Analog outputs Optional 3 pcs 4 - 20 mA max 600 ohm
PC connection KB PC terminal for set up and monitoring as an option. RS 485 connection to PC.
Optional RS 485 / RS 232 converter available for a PC
Dimensions (L x H x D) Electronics Unit 323 x 237 x 70 mm (12,7 x 9,3 x 2,8”), 3 kg (6,6 lbs)
and weight Sensor head Ø 33 mm (1”1/4) AISI 316, pipe 1500 mm (59”) long, 4 kg (9 lbs)
10.1. Technical specifications
KB² Man W41100099V1.230August 2012

11. Appendix 5
Parameters:
Configuration
Mode: Detect Enabled or Maintenance
Light source: RGB or IR
Selected signal: _____
Detect limit: _____________
Direction: Break < Det.Limit or Break > Det. Limit
Alarm signal: ____________
Low alarm limit: _____________
High alarm limit: _______________
Drift Alarm:_______________
Drift Alarm limit: _____________
Drift Alarm direction: _______________
Autolimit & Autoalarm:
Sampled signal levels: Paper Break
RED ________ _____
GREEN ________ _____
BLUE ________ _____
IR ________ _____
Measurement configuration:
Detect filter: __________
Measurment cycle: __________
Tx Power: __________
Rx Gain: __________
Set-up
Analog signals: Low limit High limit
Analog output 1: _______ _________ __________
Analog output 2: _______ _________ __________
Analog output 3: _______ _________ __________
11.1. Settings and variables
KB² Man W41100099V1.231August 2012

Specifications are subject to change without prior notice.
KPM reserves the right to make improvements and/or changes in
the product(s) and/or program(s) described in this document at
any time. Changes are periodically made to the information and
will be incorporated in new editions of this document.
All efforts have been made to ensure the accuracy of this
document. However, should any errors be detected, KPM would
gratefully appreciate being informed of them.
In case of errors in this document, KPM shall not be liable for
incidental or consequential damages in connection with or
arising from such errors.
Copyright © KPM. All rights reserved.
2012-08
Kajaani Process Measurements Ltd.
Kettukalliontie 9 E
FI 87100 Kajaani, Finland
E-mail: kpm@prokajaani.com
Internet address: www.prokajaani.com
 Loading...