

Page 1
INSTRUCTION MANUAL FOR THE
SeedMaster 2
Crystallization Transmitter and Automatic Seeding
Device
Document/Revision No. SeedMaster 2: Rev. 1/06 Effective: January 16, 2014.
PROCESS CONTROL KFT. PROFICON Industrial Controls Ltd.
Postal address: Postal address:
1091 BUDAPEST 1025 BUDAPEST
Haller u. 88. Mandula u. 24.
HUNGARY HUNGARY
E-mail: info@processcontrol.hu E-mail: LajosRozsa@mail.datanet.hu
www.processcontrol.hu
Page 2

2
2
CONTENTS
1
INTRODUCTION ......................................................................................................................................... 4
2 SUGAR CRYSTALLIZATION IN BRIEF ................................................................................................ 6
2.1 THE LAST STEP: CRYSTALLIZATION .......................................................................................................... 6
2.2 SUPERSATURATION: THE DRIVING FORCE OF CRYSTALLIZATION .............................................................. 6
2.3 SEEDING METHODS .................................................................................................................................. 6
2.4 CRYSTAL CONTENT .................................................................................................................................. 9
2.5 PRODUCT QUALITY AND SUPERSATURATION ............................................................................................ 9
2.6 COST OF PRODUCTION AND THE MAJOR PARAMETERS ............................................................................ 10
2.7 COMMON INSTRUMENTS IN USE FOR CRYSTALLIZATION CONTROL ......................................................... 11
2.8 MOUNTING THE K-PATENTS REFRACTOMETER ................................................................................... 12
3 THE SEEDMASTER 2 CRYSTALLIZATION TR ANSMITTER AND SEEDING DEVICE........... 14
3.1 SEEDMASTER 2 DESCRIPTION ................................................................................................................ 14
3.2 SEEDMASTER 2: A FRON T-END DEVICE .................................................................................................. 14
3.3 PRINCIPLE OF OPERATION ...................................................................................................................... 15
3.4 CALCULATED DATA ............................................................................................................................... 16
3.5 ON-LINE DATA INPUTS ........................................................................................................................... 17
3.5.1 Receiving syrup concentration data from the K-PATENTS refractometer(s) ...................................... 17
3.5.2 Receiving temperature data ................................................................................................................. 17
3.5.3 Selecting the “THIRD INPUT” transmitter ......................................................................................... 18
3.5.4 Using laboratory data instead of “THIRD INPUT” ............................................................................ 18
3.5.5 Optional data input .............................................................................................................................. 18
3.6 DIGITAL INPUTS ..................................................................................................................................... 18
3.6.1 “STRIKE ACTIVE” input DIN1 ........................................................................................................... 18
3.6.2 “SEEDED” input DIN2 ....................................................................................................................... 19
3.6.3 “CHANGE FEED SYRUP” input DIN3 .............................................................................................. 19
3.7 DATA OUTPUTS ...................................................................................................................................... 19
3.7.1 Data available for transmission ........................................................................................................... 19
3.7.2 Standard current outputs ...................................................................................................................... 20
3.8 DIGITAL (ON / OFF) OUTPUTS ............................................................................................................... 20
3.8.1 “SEED WARNING” output DO1 ......................................................................................................... 20
3.8.2 “SEEDING” output DO2 ..................................................................................................................... 20
3.9 THE MAN-MACH IN E INTERF ACE ............................................................................................................. 20
4 TECHNICAL DATA, MOUNTING AND ELECTRIC AL CONNECTIONS ...................................... 22
4.1 SPECIFICATIONS ..................................................................................................................................... 22
4.2 ELECTRICAL CONNECTIONS ................................................................................................................... 24
4.2.1 Power supply ........................................................................................................................................ 24
4.2.2 Process inputs and output s ................................................................................................................... 25
4.2.3 Digital communication ......................................................................................................................... 25
4.2.4 I / O wirings ......................................................................................................................................... 26
4.3 CONSTRUCTION DETAILS ....................................................................................................................... 28
5 SEEDMASTER 2 FEATURES IN BRIEF ............................................................................................... 31
5.1 SEEDMASTER 2: OPERATOR STATION FEATURES ............................................................................ 31
5.1.1 CONFIGURE ....................................................................................................................................... 31
5.1.2 SET UP ................................................................................................................................................. 31
5.1.3 DISPLAY .............................................................................................................................................. 31
5.1.4 MANUAL OPERATIONS ..................................................................................................................... 31
5.2 SEEDMASTER 2: TRANSMITTER FEATURES ....................................................................................... 32
5.2.1 Analog output ....................................................................................................................................... 32
5.2.2 Digital data communication ................................................................................................................. 32
5.3 SEEDMASTER 2: SEEDING FEATURES ................................................................................................. 32
5.3.1 Seeding based on DIGITAL INPUT DIN2 ........................................................................................... 33
5.3.2 Seeding on a command from a PCS using digital communication ....................................................... 33
5.3.3 MANUAL seeding................................................................................................................................. 33
Page 3

3
3
5.3.4 AUTOMATIC seeding based on SUPERSATURATION ...................................................................... 33
5.3.5 AUTOMATIC seeding based on DENSITY .......................................................................................... 33
6
START UP AND USE ............................................................................................................................. 34
6.1 START UP ............................................................................................................................................... 34
6.2 DEFAULT SETTINGS ................................................................................................................................ 34
6.3 DEVICE CONFIGURATION ....................................................................................................................... 35
6.4 BASIC KEY OPERAT IONS ......................................................................................................................... 35
7 CONFIGURE SEEDMASTER 2 ....................................................................................................... 37
7.1 START CONFIGURATION ......................................................................................................................... 37
7.2 ORGANIZING SEEDMASTER 2 INPUT / OUTPUT TRAFFIC ........................................................................ 37
7.3 CONFIGURING THE STRIKE ACTIVE SIGNAL ....................................................................................... 41
7.4 THIRD INPUT ...................................................................................................................................... 42
7.4.1 Third input: MASSECUITE DENSITY or MASSECUITE SOLIDS CONTENT ................................... 43
7.4.2 Third input: MOTOR CONSUMPTION .............................................................................................. 45
7.4.3 Third input: CRYSTAL CONTENT (laboratory) .................................................................................. 48
7.5 SEEDING .............................................................................................................................................. 50
7.6 ACTIVE INSTRUMENT ...................................................................................................................... 51
7.7 PASSWORD ......................................................................................................................................... 51
7.8 COMMUNICATION ............................................................................................................................ 52
7.8.1 Using the serial communication (COMX) ports. .................................................................................. 52
7.8.2 Using the ETHERNET. ......................................................................................................................... 53
7.8.3 Organizing the two-way data transfer.................................................................................................. 54
8 SET UP SEEDMASTER 2 ......................................................................................................................... 55
8.1 SET UP DISPLAY .................................................................................................................................. 55
8.2 SET UP INPUTS ..................................................................................................................................... 57
8.2.1 Data types and specifications. ............................................................................................................ 527
8.2.2 Handling the use of several feed syrups with different purities............................................................ 60
8.2.3 Set up syrup parameters. ...................................................................................................................... 61
8.3 SET UP DIGITAL I / O ........................................................................................................................... 62
8.4 SET UP ANALOG OUTPUT .................................................................................................................. 64
9 MANUAL SEEDING .................................................................................................................................. 65
10 DISPLAY ............................................................................................................................................. 67
10.1 MAIN DISPLAY .............................................................................................................................. 67
10.2 TREND ............................................................................................................................................. 69
10.3 STRIKE HISTORY ........................................................................................................................... 70
10.4 STANDARD DISPLAY ................................................................................................................... 70
10.5 SYSTEM INFORMATION .............................................................................................................. 71
10.6 TEST DATA ..................................................................................................................................... 72
11 COMMUNICATION ................................................................................................................................ 77
11.1 ETHERNET COMMUNICATION ................................................................................................... 77
Data transmission using the Ethernet ........................................................................................................... 77
Cable requirements and connection ............................................................................................................ 77
Cable specification ........................................................................................................................................ 77
Connecting the Ethernet cable ...................................................................................................................... 77
Connection settings ....................................................................................................................................... 78
Testing the connection .................................................................................................................................. 78
Troubleshooting ............................................................................................................................................ 79
MODBUS TCP / IP as implemented in SeedMaster 2 .................................................................................. 79
11.2 MODBUS PROTOCOL USING ONE OF THE COMX PORTS ................................................................... 81
11.3 DATA TYPES USED IN THE MODBUS REGISTERS ............................................................................... 85
11.4 REGISTER SET .................................................................................................................................... 86
Page 4

4
4
APPENDIX 2 : CONFIGURATION DATA SHEETS……………………………………………94
12 APPENDIX 1 : PROCEDURE TO EVALUATE THE “M”, “B” AND “C” COEFFICIENTS OF
THE WIKLUND-VAVR IN ECZ SATURATION FUNCTION. ..................................................................... 90
12.1 INTRODUCING THE SOLUBILITY COEFFICIENT ............................................................................................. 90
12.2 DETERMINING THE LOCAL SYRUP PARAMETERS ................................................................................. 90
12.2.1 Sample preparation for the saturation test ......................................................................................... 90
12.2.2 Saturation test .................................................................................................................................... 91
12.2.3 Evaluation .......................................................................................................................................... 91
SUBJECT INDEX……………………………………………………………………………………………..100
Page 5

1 INTRODUCTION
5
5
1 INTRODUCTION
Sugar manufacturing dates back more than one and a half century. World sugar production in year 2000
reached 150 million tons, which probably represents the largest amount of a product produced in crystalline
form.
Due to the long history of sugar manufacturing the sugar industry is regarded as a mature one, where no
exciting new developments can be expected. It has long traditions based on the work of skilled people, who
acquired their skill in controlling the various parts of the technology often during their lifetime. However, times
are changing. The fierce competition in the industry and in the market forces even industries with long
traditions to make effective use of the advanced methods of production in order to survive.
It became evident that besides better machinery and equipment in the technology, the use of new types of
equipment and know-how is a must for the plants if they wish to be competitive.
Some of the new equipment comes in the form of
• new instruments and
• computer-based automatic contr ol syste ms,
never heard of before, but there are substantial changes in the required know-how, too. In addition to the
usual chemical- and mechanical-engineering background experience in instrumentation, automatic process
control and in the use of computers and informatics became vital. Conclusion: there are substantial changes
even in a “mature” industry.
Crystalli zation is a very important step in sugar manufacturing. Final product quality and cost of production
depend very much on its execution. For quite a long time its control was the sole responsibility of the
“artisan” pan-man, but these times are over now. Instruments to provide some objective information on the
process appeared in the plants around the middle of the 20
information on syrup concentration (correlated to supersaturation) and on massecuite density or consistency
(correlated to crystal content). None of the instruments in use today are able to serve well both of these basic
needs.
Some of the common instruments are based on the change of an electrical parameter of the massecuite
(conductivity or / and capacitance). Due to their less than satisfactory operation, the frequency of the
electrical signal used kept increasing. The first conductivity probes used signals of only a few kHz frequency.
The RF (Radio Frequency) probes use signals in the 100 MHz range, while the fairly new microwave probes
use even much higher signal frequency. It is interesting to note that the well proven method to measure liquid
concentration, that is the use of refractometers dates back well over a century, and makes use of even
higher frequency, that is the frequency of light. The modern process refractometer which is available since
the 1980-s became the most accurate and reliable workhorse in this field.
Realising the potential and importance of the modern process refractometer, original research and
development was started by PROFICON Ltd., Hungary in the second half of the 1990-s to develop new
instruments providing reliable information on the most important parameter of crystallization: supersaturation,
combined with automatic seeding. The first result of this effort was the SeedMaster optional software,
which is available with the PR-01-S type K-PATENTS process refractometers. In a new development, the
SeedMaster 2 Crystallization Transmitter And Automatic Seeding Device offers more and advanced
features. Both devices are unique, represent a completely new class of instruments and are based on
several decades of experience in carrying out mill-wide automatic control projects in several countries of the
world.
IMPORTANT NOTICE:
Realizing that SeedMaster 2 is a device not comparable to any of the common ones used in crystallization,
this manual probably discusses in more detail some special issues related to the subject, than usual. While
doing so the main effort was directed to increase the realization of the importance of supersaturation in
crystallization control, a long neglected field because of the lack of a reliable instrument capable to provide
on-line data on it. Recommendations on some issues, for example: method of seeding, the value of
supersaturation during a crystallization process are really only recommendations, and though they certainly
are in line with the latest results of research in this field, it is up to the end user how she / he wants to use the
instrument.
The manufacturer of SeedMaster 2 can not be made responsible for any type of damage that might be
caused by its use.
th
century. They were intended to provide
Page 6

2 SUGAR CRYSTALLIZATION IN BRIEF
6
6
2 SUGAR CRYSTALLIZATION IN BRIEF
2.1 The last step: crystallization
The main steps of sugar manufacturing are:
• sugar extraction (from cane or beet),
• juice purification and concentr ation , and
• crystallization.
SeedMaster 2 was designed to provide all the vital information required to control the process of sugar
crystallization on an unprecedented level. It is therefore logical to concentrate further discussions on t he
process of crystallization.
Two methods to produce sugar crystals can be distinguished:
• cooling crystallization and
• evaporative crystallization.
Most of the sugar crystallized is produced in evaporative crystallization in batch or lately in continuous
evaporative crystallizers, but the basic principles of operation are the same in both types of crystallization
methods. Traditionally the vacuum pan operating in batch mode became the major piece of machinery and
enjoys wide use all over the world.
Crystallization is a very important part of sugar manufactur ing. This is a p roc ess which has a large influence
on product quality and on the cost of production, both of which are very important when competitiveness is
at stake.
During most of its long history the control of sugar crystallization in batch pans was the undisputed authority
of the pan-men, who acquired their skill during a large number of years in practice. Working mostly without
any real instruments, they used only their eyes and fingers to keep the process under control. No wonder,
they still are being regarded as “artisans” of their profession. However, artisans can be quite different, and
quite often tend to behave rather unpredictably, which is far from being compatible with the quality- and cost-
conscious requirements of industrial mass production, so representative of our times.
Modern control of crystallization must rely on the reliable on-line measurement of the parameters which are
vital in the control of the process performed by a local operator (manual control), or by an advanced
automatic process control system (PCS).
2.2 Supersaturation: the driving force of crystallization
It is well known that crystallization can take place only in solutions which contain more solids in solution than
required to saturation. In case of sugar solutions the same mass of water can dissolve different amounts of
sugar depending on its temperature: the amount of sugar is larger, if temperature is higher. A saturated
sugar solution therefore can be supersaturated either by decreasing its temperature (cooling), or by
decreasing the mass of water (evaporation).
Supersaturation is defined as the amount of sugar dissolved divided by the amount of sugar required for
saturation in the same amount of water at the same temperature. We have real supersaturation only if this
ratio is larger than 1,0 (saturation).
Supersaturation is the driving force of crystallization: crystal growth (speed of crystallization) depends very
much on this parameter. High supersaturation means faster crystal growth and vice-versa. There is no
crystal growth if supersaturation is less than 1,0, in which case instead of growing, already existing crystals
begin to dissolve. It is important to emphasise that supersaturation is a complex multivariable function of the
liquid phase (mother liquor) parameters and should be calculated taking into account all of its governing
parameters:
Supersaturation = f(C, Q, T, m, b, c) (Eq. 1.)
where:
C : syrup / mother liquor concentration (%)
Q : syrup / mother liquor purity (%)
T : temperature (˚ C)
m, b, c : syrup quality parameters (-)
Syrup quality parameters are discussed in detail in Ch. 12 APPENDIX.
It follows from its definition that, among others, concentration of the mother liquor should be measured online, undisturbed by the presence of crystals in the massecuite in order to be able to calculate it.
2.3 Seeding methods
Seeding is a very important step in the process of crystallization, which has a large influence on the quality
of the product. When completed, the crystals begin to grow in size, if supersaturation is larger than 1,0.
Page 7
2 SUGAR CRYSTALLIZATION IN BRIEF
7
7
CRITICAL SUPERSATURATION TO START NUCLEATION
1,1
1,11
1,12
1,13
1,14
1,15
1,16
1,17
1,18
1,19
1,2
74 76 78 80 82 84 86 88 90 92 94 96 98 100 102
SYRUP / MOTHER LIQUOR PURITY (%)
SUPERSTURATION.
TEMP.
60 C
TEMP.
70 C
TEMP.
75 C
TEMP.
80 C
Shock seeding is t he traditional way of seeding. It relies on the building up of high supersaturation in the
solution, when a small amount of seed crystals entered into the pan results in the formation of new crystals
(nucleation). The number of these crystals keeps growing as long as the value of supersaturation is above a
“safe” (nucleation-free) limit. The final number depends very much
• on the actual value of supersaturation, and
• on the time (time of nucleation) spent in the region of high supersaturation above the “safe” limit.
There are at least 3 important parameters in this method of seeding:
1. the actual value of supersaturation maintained in the “seeding point” and during nucleation;
2. the length of nucleation;
3. the limit value of supersaturation above which nucleation begins, if there are already crystals in the
solution.
Point 1. calls for a reliable measurement of supersaturation.
Point 2. has some difficulties of its own, too. How to determine the correct length of nucleation? The method
of trial and error can only be used, if supersaturation was the same all over the trials, which again calls for its
measurement. Even if it is known, in case of manual control of crystallization is it possible to ensure exactly
the same time for nucleation from strike to strike, even during the night shift?
Point 3. requires the knowledge of the critical supersaturation, above which nucleation begins in the
presence of already existing (seed) crystals. There are not many reliable data on this limit. A recent
publication (see below) provides data depending somewhat on syrup purity and temperature, too (the
dependence on temperature is more pronounced with low-purity syrups). In case of high syrup purity (larger
than 94 %) this supersaturation limit is about 1,12…1,13. An important point is that the formation of new
(often unwanted) crystals can begin any time supersa tur at io n excee ds the criti ca l super sat ur atio n limi t.
Fig. 2.1
(This figure is based on the equation published in:
M.Saska: Boiling point elevation of technical sugar cane solutions and its use in automatic pan boiling.
International Sugar Journal 2002, VOL. 104., No.1247., 500-507).
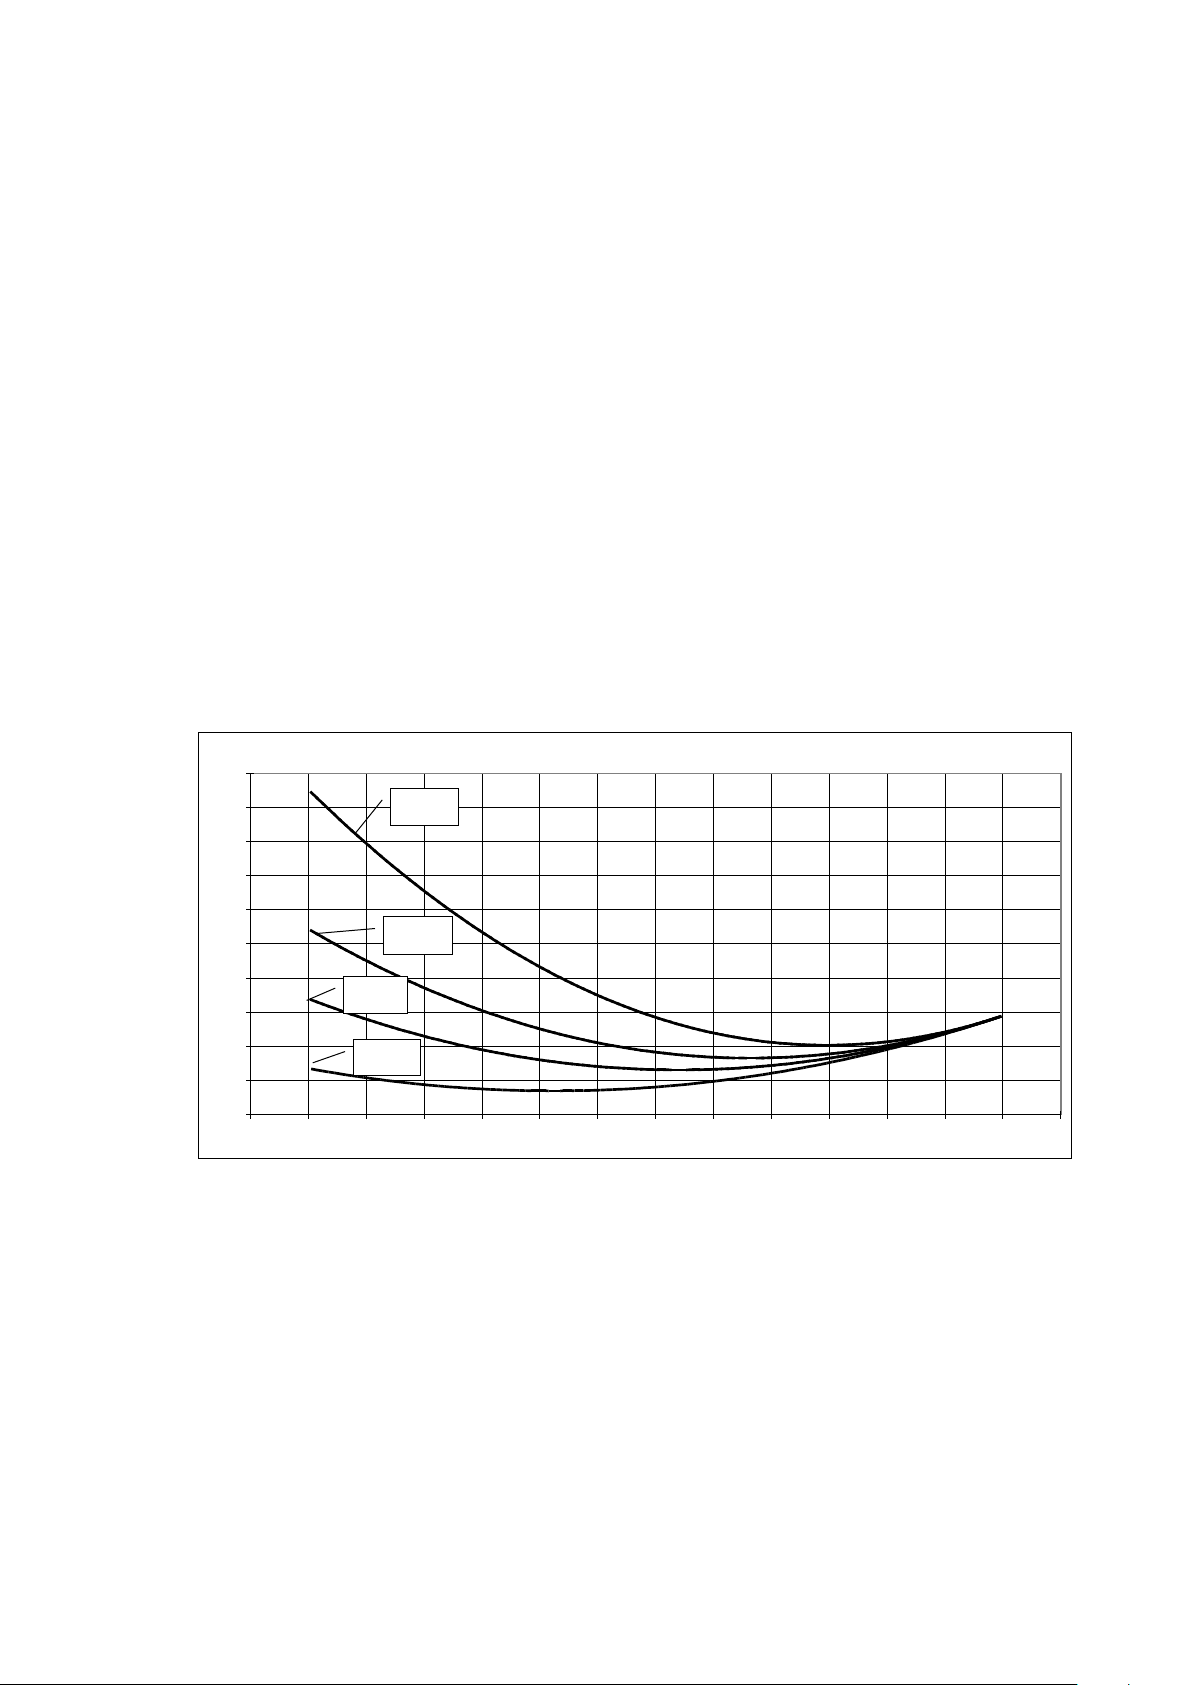
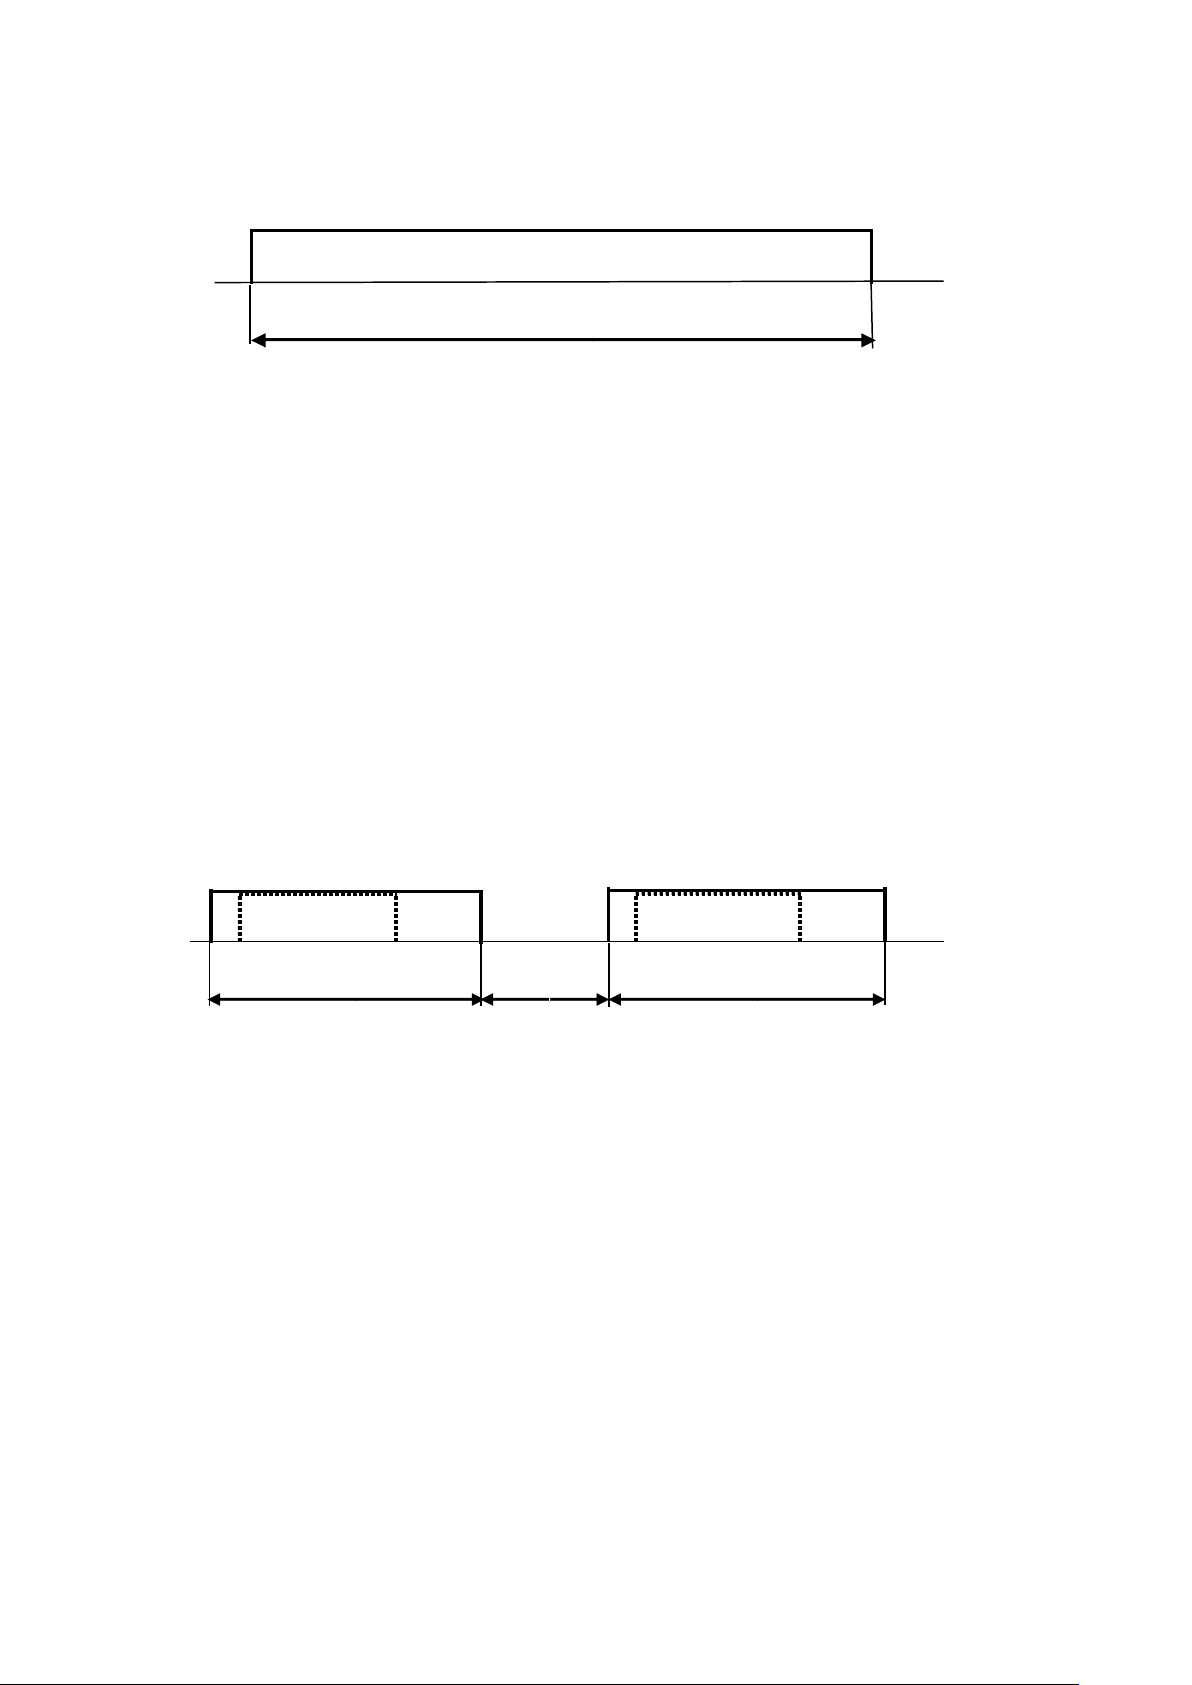
Fig.2.2 shows some of the trends typical of shock seeding. It is evident that shock seeding has quite a few
uncertainties and consequences, which make its use in modern practice unde sir able .
Page 8
2 SUGAR CRYSTALLIZATION IN BRIEF
8
8
Supersaturation
SEEDING POINT
Density
Level
Motor power
Draw in Concentrate
Graining
Boiling Boiling Discharge
up
Supersaturation
Density
Level
Motor power
SEEDING POINT
Draw in Concentrate Graining Boiling Boiling Discharge
up
Fig. 2.2
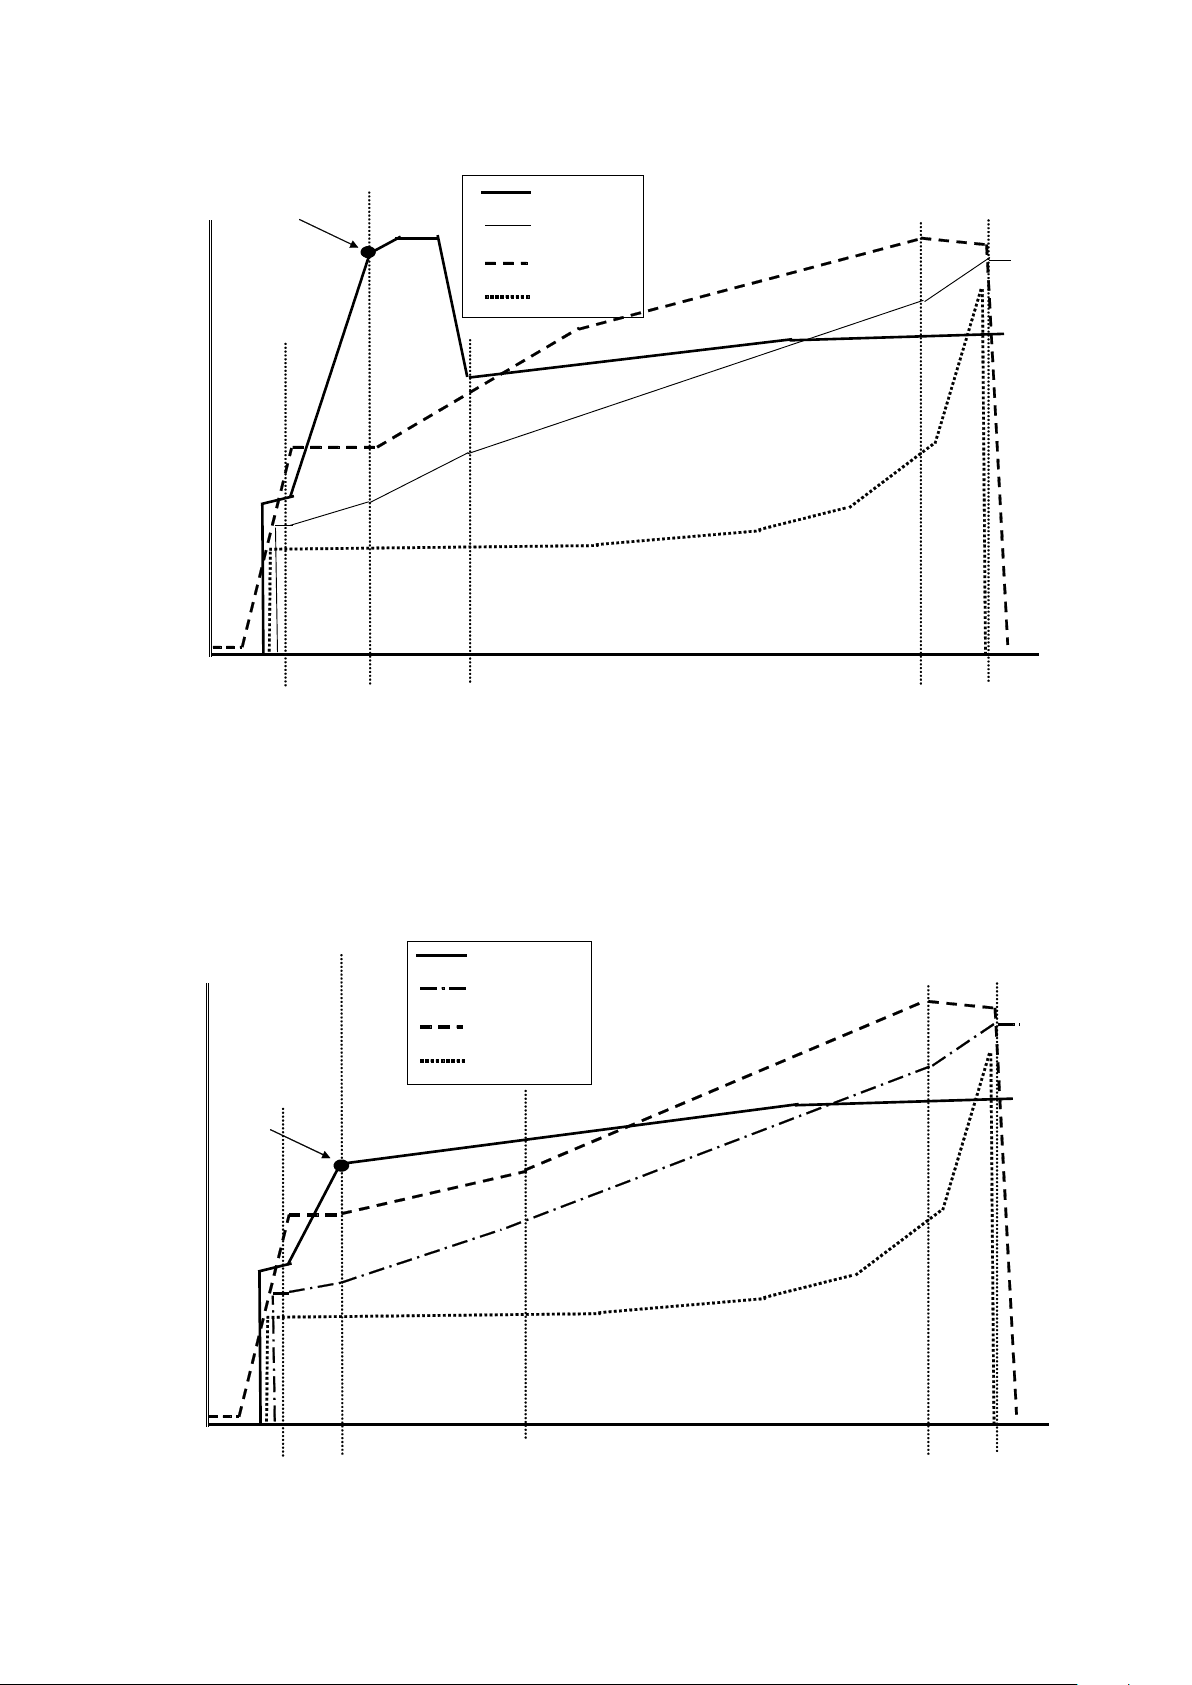
Full seeding is the advanced mode of seeding. In ideal case there are no new crystals formed during
seeding: the full required crystal crop is supplied during seeding in the form of well prepared slurry. It is
assumed that only crystal growth and no nucleation will take place during the complete length of
crystallization (during a strike in batch pans), that is the number of crystals in the end product is in ideal case
equal to the one of the seeding material.
Besides using slurry, full seeding can be implemented by using the right amount of crystal footing (magma),
too. It follows from the above that in case of full seeding and during the complete crystallization
supersaturation must not exceed its limit value. This requirement may result in somewhat longer times of
crystallization than accustomed, but will result in better sugar quality.
Fig.2.3
Fig. 2.3 shows some of the trends typical of full seeding.
Page 9
2 SUGAR CRYSTALLIZATION IN BRIEF
9
9
NOTE:
The use of slurry (or crystal footing) alone is no guarantee for correct full seeding. Besides the right amount
of slurry or footing (with the right number of crystals in it) supersaturation must not exceed its limit value.
2.4 Crystal content
Good control of the process of crystallization requires some information on the crystal content of the
massecuite, too. The amount of sugar needed to feed the growth of crystals increases as the surface area of
the crystal mass increases. Feed syrup is supplied to fill the need.
The control of crystallization in a vacuum pan, for example, should be a co-ordinated process. Control
parameters, like vacuum, heating steam (vapour) pressure, feed syrup input are connected in a complex
way to the massecuite parameters. The actual value of supersaturation depends on quite a few parameters
(see Eq. 1.) From these, concentration depends on the rate of evaporation and syrup feed, while
temperature is basically determined by the absolute pressure above the massecuite.
In batch crystallization some indirect measure of crystal content is being used to signal the end of the strike.
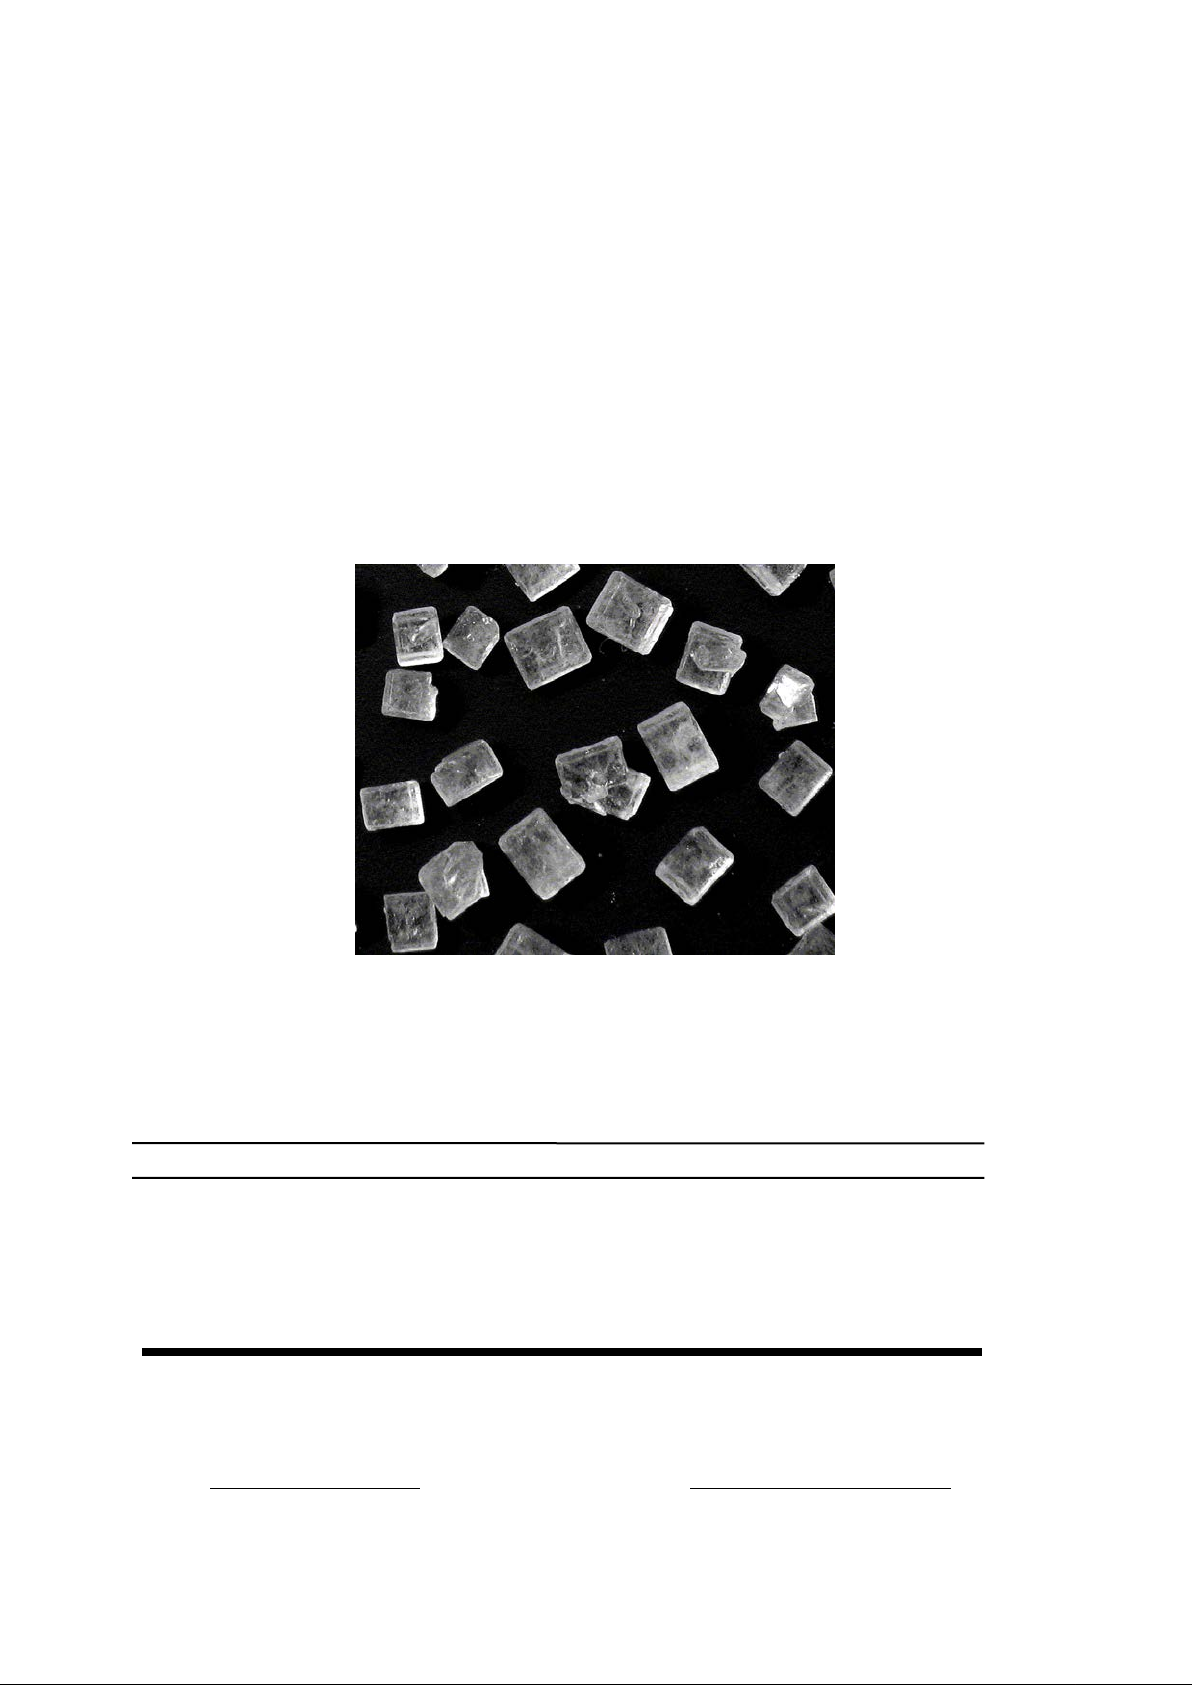
2.5 Product quality and supersaturation
The importance of supersaturation in product quality can not be overstated. Its role in seeding has already
been discussed, while Fig. 2.4 (scale: 1 by 1 mm) proves its effect all over the strike. In this figure a fairly
wide crystal size (from 1 mm to perhaps 0,05 mm) distribution can be observed. Most probably there were
much smaller size crystals, too, but they had escaped through the screen of the centrifuge only to increase
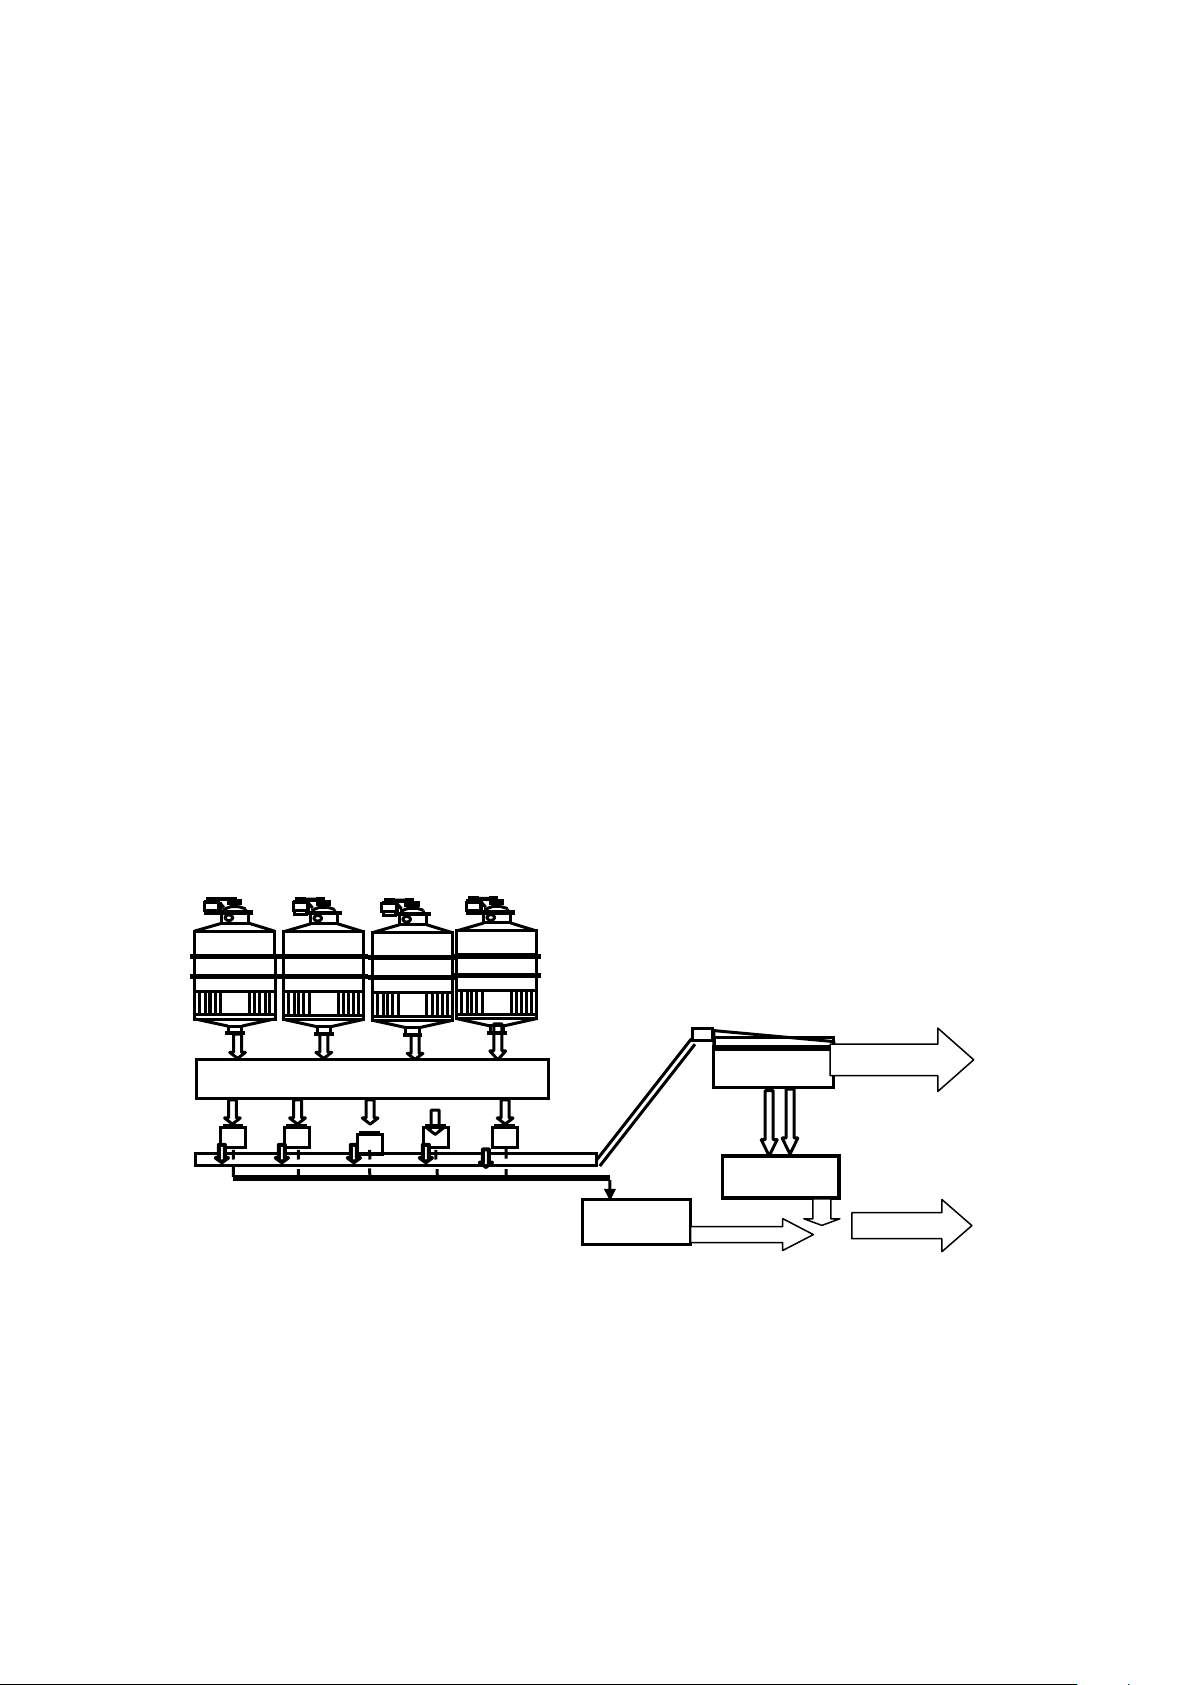
the amount of recirculated crystallized sugar in the green syrup (Fig. 2.6). It is evident that the smaller
crystals (the “young generation”) are due to spontaneous nucleation in the later phases of the strike. These
crystals therefore did not have time enough to grow to a larger size till the end of the strike (it is assumed
that the size of the seed crystals (the “old ones”) was fairly equal).
Fig. 2.4
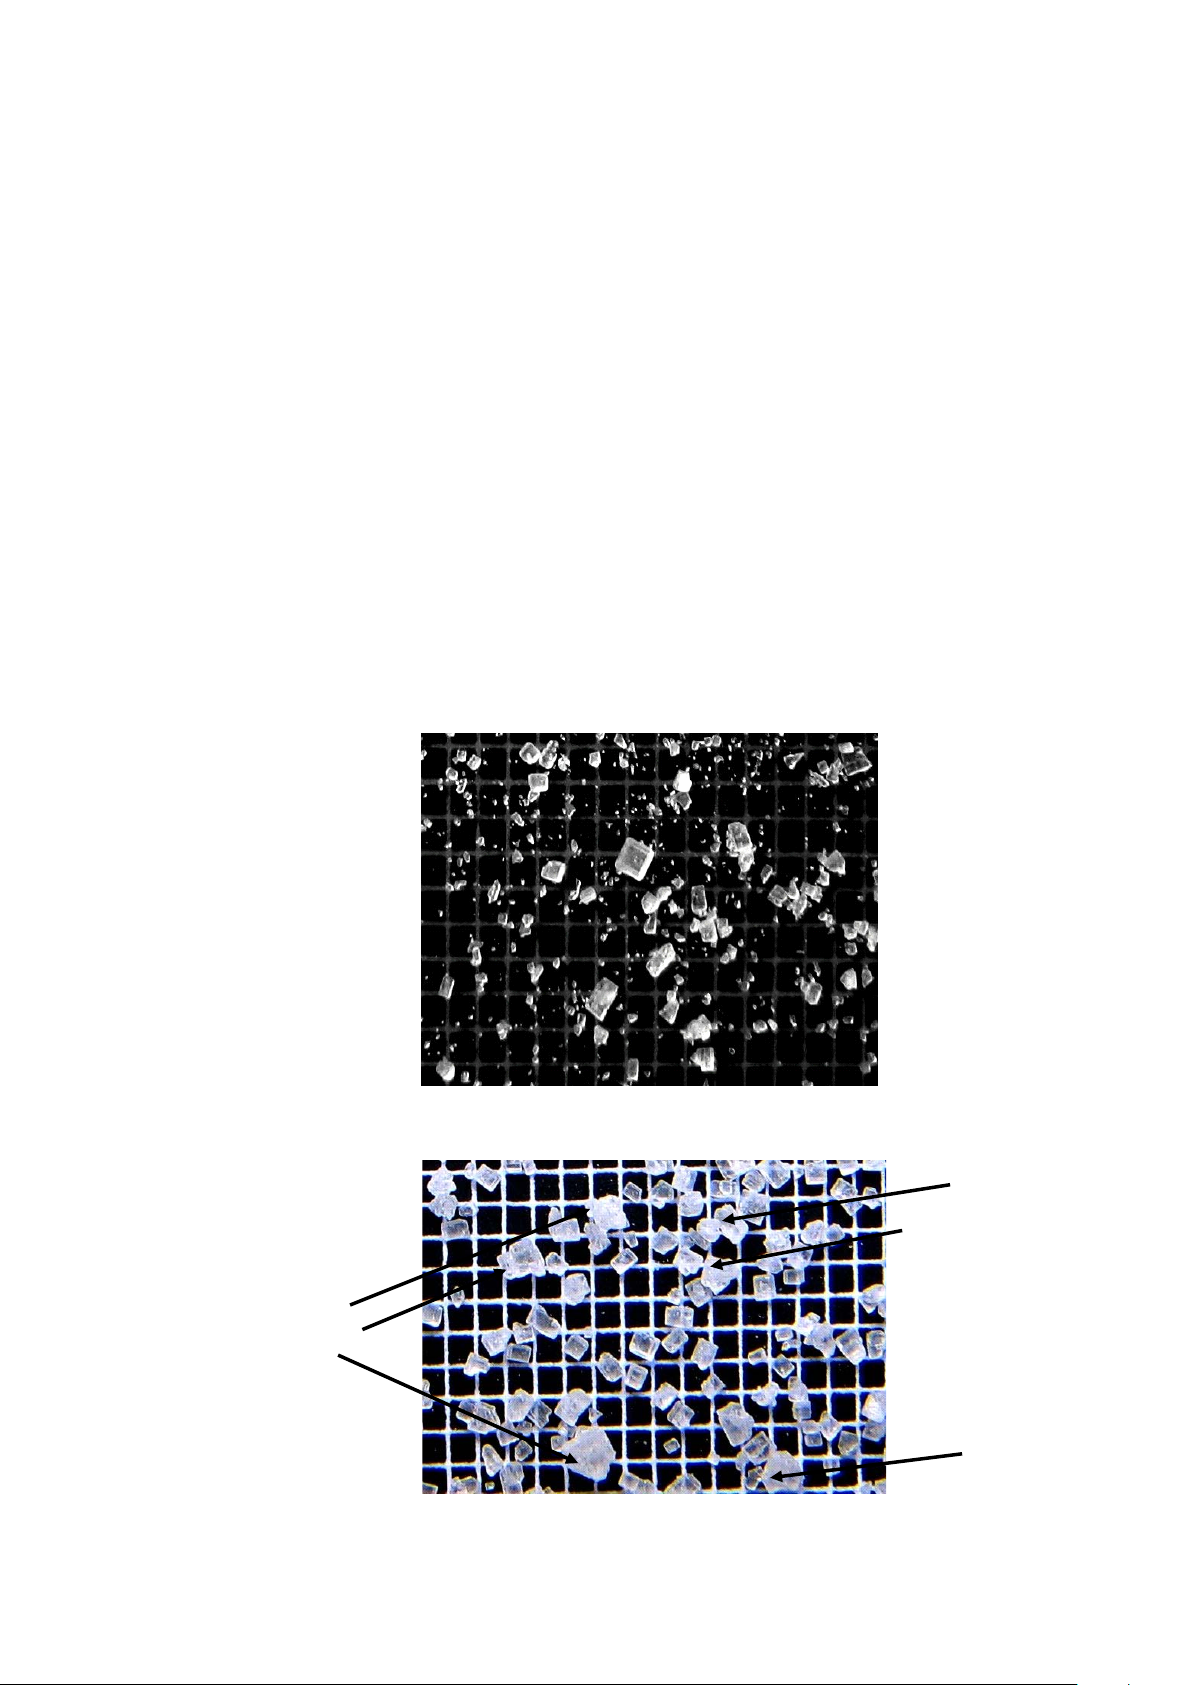
In Fig. 2.5 (scale: 1 by 1 mm) among well developed crystals quite a few conglomerates (a cluster of
mutually intergrown crystals) of different sizes can be observed.
Fig. 2.5
conglomerates
Page 10
10
10
Product
Crystals
F
conglomerates
Recirculated
sugar
Tank
Product
screen
Melter
Mixer
Centrifugals
2 SUGAR CRYSTALLIZATION IN BRIEF
It has been proved that formation of conglomerates mostly happens when the size of the crystals is in the 40
to 250 micron range. This means that the formation of conglomerates in the early phase of crystallization
(not long after seeding) results in large conglomerates at the end of the strike, while smaller conglomerates
in the end product are due to unwanted nucleation (because of too high supersaturation) in the later phases
of the strike. Bad circulation, probably resulting in high local supersaturation in some parts of the pan also
contributes to the formation of conglomerates.
It is quite common nowadays that special products require well defined grain sizes, which call for a tight
crystal size distribution. This can be achieved by good boiling control (including, of course, good control of
supersaturation), or by screening of the product, if it has a wide size distribution. This later method, however,
requires additional machinery , time and ener gy and natur ally incre ase s the cost of produ cti o n.
Besides wide crystal size distribution conglomerate content also contributes to poor product quality. It is well
known that the colour of the product has strong correlation to conglomerate content, because intergrown
crystals are more likely to retain some of the mother liquor during centrifuging. If conglomerate content is
high, product colour can only be improved with the excessive use of water in the centrifuges, which will
result – because of dissolution - in consider ab le los s of the cry stal mass.
2.6 Cost of production and the major parameters
It has bee n demonstrate d that wide crystal size distribution and conglomerates of varying sizes in the end
product are due to excessive supersaturation, which, if not controlled properly, can be present during the
complete course of crystallization (Figures 2.4 and 2.5). This proves that statements on the decreasing
importance of supersaturation after seeding has been completed are totally unfounded and false.
Conglomerate and fines content have very important effect on the cost of production. Too high fines content
makes centrifuging difficult and results in considerable loss of already crystallized sugar through the screen
baskets of the centrifuges. It is difficult to determine the amount of this loss and quite often it is neglected. It
should be realised, that the number of strikes per shift, often used in practice, is not a correct measure of the
rate of production. Fines and conglomerates result in recirculated sugar only to be melted, concentrated and
crystallized again, the end result of which is
• waste of time and energy,
• decreased effective yield of product sugar per strike and shift,
• increased use of water and
• increased cost of production.
It is well known that the speed of crystallization is higher if supersaturation is higher, that is the rate of
production increases with increasing supersaturation. It is therefore tempting to push production by
maintaining high supersaturation, but exceeding the safe limit, where spontaneous nucleation begins and
the risk of conglomeration increases, too, is accompanied with the unpleasant consequences discussed
above.
Selecting the correct supersaturation set point trajectory for a strike is therefore a kind of compromise (or
optimisation). However, any type of supersaturation control is un-conceivable without the correct on-line
measurement of supersaturati on.
Green liquor
and fines
Fig. 2.6
ines and
Page 11

2 SUGAR CRYSTALLIZATION IN BRIEF
11
11
2.7 Common instruments in use for crystallization control
There are two major types of data needed for good control of crystallization:
1. supersaturation, and
2. information related to crystal content.
The basic requirements concerning the sources of these data are:
accuracy:
supersaturation : fairly high,
crystal content : modest;
in - and on-line instruments:
should provide reliable data in real time during the full course of crystallization;
long-term stability:
it is a basic requirement.
Besides instruments providing data on vacuum, massecuite temperature, level and vapour pressure in the
calandria, common instruments in use for boiling control measure
• electrical parameters of the massecuite (conductivity, conductivity and capacitance (RF sensors),
• viscosity / consistency,
• stirrer motor consumption,
• density / solids content (nuclear),
• density / solids content (microwave),
• boil ing poi nt rise and
• refractive index.
None of these instruments provide reliable and quantitative data neither on supersaturation, nor on
crystal content, the real massecuite parameters that matter.
Conductivity is due to the presence of different types of ions in the syrup or mother liquor. It depends on
several parameters like concentration, composition and amount of non-sugars present, crystal content and
temperature. It certainly has (through syrup / mother liquor concentration) some correlation to
supersaturation (see Eq. 1.), but due to changes in other parameters governing it, it is far from being able to
provide reliable information on supersaturation.
Capacitance (RF sensors) depends mostly on the water content of syrup / mother liquor in a unit volume of
massecuite, therefore, besides concentration it show s stron g depen den ce on crys tal con tent .
Viscosity of the syrup / mother liquor depends on their concentration and temperature, but instruments in
use for boiling control do not have temperature compensation feature.
Consistency is the property of the liquid / solids (mother liquor / crystals) mixture. Viscosity / consistency are
measured in crystallization control practice by the same instrument. Consistency, however, sharply
increas es with incre asing c rystal content. At the end of a strike consistency can be 20-30 times larger than
the viscosity of the mother syrup alone.
Stirrer motor current or power consumption provide data on viscosity / consistency in a different form.
Density of the massecuite comes from two sources: density of the mother liquor and that of the solid
crystals. Besid es t he se the crystal to mother liquor ratio in the massecuite will determine its value.
Solids content of the massecuite is similarly determined by the solids content of the mother liquor, that of the
crystals and by the crystal to mother liquor ratio.
The common features of all instrument types discussed above are:
1. None of them is able to provide selective and accurate enough information on mother liquor
concentration in the presence of crystals, therefore they are unfit to give even approximate, indirect
information on supersaturation all over a strike (see Eq. 1).
2. Having completed seeding all instruments discussed above provide data which are more and more
governed by the increasing crystal content. It is logical therefore that these instruments can be put to good
use only to provide – though indirect and only approximate - information on crystal content.
There are only two principles of measurement which can be used to measure syrup concentration
selectively even in the presence of sugar crystals.
Boling point rise of a solution depends – among others – on its concentration, therefore it is correlated to
supersaturation. Supersaturation, however, is a multivariable function of several parameters. On the other
hand: boiling point rise depends on syrup / mother liquor purity and non-sugar composition, too. Boiling point
Page 12

2 SUGAR CRYSTALLIZATION IN BRIEF
12
12
rise is small with high-purity syrups and therefore requires very accurate measurement. Due to these
problems its use in the determination of supersaturation with the required accuracy and stability is very
questionable.
Refractive index of a solution has very strong and well-known correlation to its concentration. The
principle of measurement is in use all over the world since over one and a half century in laboratory,
and nowadays in process refractometer types, too. The data provided meet the requirements stated
earlier regarding its use in the calculation of supersaturation.
Summing up:
1. Supersaturation is the most important parameter of crystallization.
2. Supersaturation is a multivariable function of several syrup / mother liquor parameters (see Eq. 1).
3. Common instruments in use measure only a single parameter of the syrup or massecuite, therefore they
are unable to provide real quantitative data on supersaturation.
4. Supersaturation can only be calculated on-line by taking into account all of the parameters that govern
it. It is therefore logical that reliable and accurate on-line data on syrup / mother liquor concentration
are required. The only way to get them is by the use of a reliable process refractometer.
5. Information on supersaturation and on crystal content (even in indi rect form) is required for advanced
boiling control.
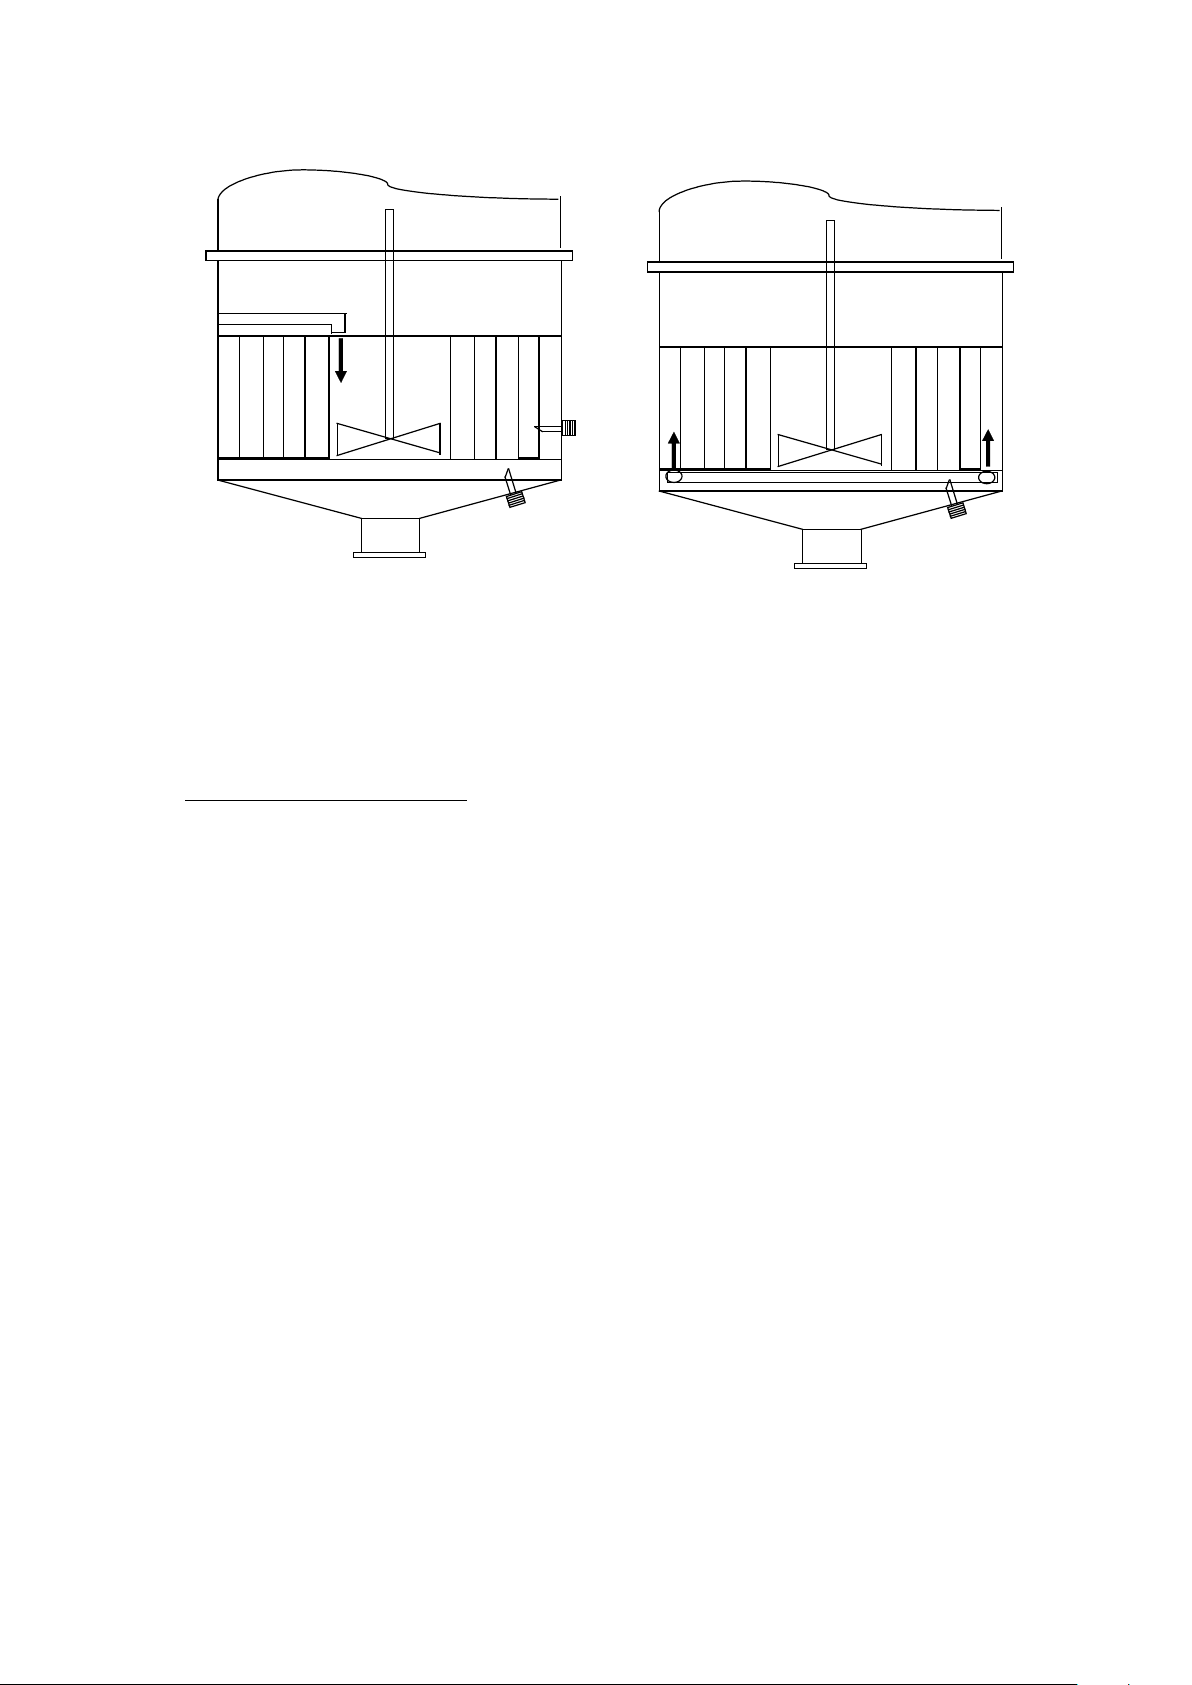
2.8 Mounting the K-PATENTS refractometer
The K-PATENTS process refractometers have proved their worth in thousands of applications including
crystallization in the sugar industry worldwide. They consist of 2 main parts:
• the Sensor Head (1 or 2) and
• the Indicating Transmitter
connected by a 10 to 100 m long cable.
Mounting the Sensor Head.
In crystallizer applications it is recommended to use the long probe version providing longer insertion length.
Selecting the best location to mount the Sensor Head is usually a case of compromise. Crystallizers are far
from being perfect: despite the use of stirrers, circulation of the massecuite becomes more and more
sluggish when the crystal content increases. This means that syrup / mother liquor concentration and
temperature, which have large influence on supersaturation will not be the same in the full massecuite
volume. The following considerations should be taken into account:
1. Select a location, where measured concentration is representative for the largest volume of the syrup or
massecuite. This requirement means that locations close to the feed syrup entry and above the calandria
should be avoided. Too short distance from the entry point results in misleading data valid for a diluted
massecuite in a relatively small volume. A too fast drop of measured concentration after opening the feed
valve is real cause for concern.
2. Supersaturation increases with decreasing temperature if syrup / mother liquor concentration is kept
constant. This means that highest supersaturation is expected where temperature is the lowest.
Temperature is the lowest at the surface of the massecuite, while it is the largest just above the calandria.
Naturally, the rising surface can not be followed with the sensor. In practice temperature in the pan bottom is
fairly close to surface temperature.
In practice, unfortunately enough, feed syrup most often enters the downtake just above the calandria or at
the lower end of the downtake. These are rather questionable designs because of two reasons:
• Due to the increasing difference between the density of the massecuite and that of the feed syrup due
to increasing crystal content, syrup entering the pan reverses direction and flows upwards in the downtake,
working more and more against the much needed circulation of the massecuite.
• This design is in complete disregard of the needs of the on-line measurement of any massecuite
parameter (see point 1 above).
A much better solution is when feed syrup enters the pan under the calandria through a circular ring pipe.
Feed should be distributed and directe d upwar ds at sever al l ocat ion s around the pan w all. T his soluti on
• instead of degrading, improves massecuite circulation, and
• provides good location under the feed pipe for instrument sensors.
Figure 2.7 shows recommended sensor locations for the two cases.
Page 13
2 SUGAR CRYSTALLIZATION IN BRIEF
13
13
Fig. 2.7 Recommended sensor head locations
NOTE:
Sensor location in a crystallizer is a problem independent from the type of sensor used. If a separate
temperature sensor is used, it should be mounted close to the refractometer Sensor Head. The same
applies to massecuite density and solids content (brix) sensors as well.
Mounting the Indicating Transmitter
It is general practice to mount the Indicating Transmitter close to the vacuum pans. The enclosure must not
be exposed to rain or direct sunshine. Avoid vibration.
FURTHER READING:
1. L. Rózsa : On-line monitoring of supersaturation in sugar cry stal liz ati on
I.S.J., 1996, 98, 660-675
2. L. Rózsa : Sensor performance in monitoring of supersaturation
I.S.J., 1997, 99, 263-268
3. L. Rózsa : The SeedMaster device
I.S.J., 1998, 100, 601-607
4. L. Rózsa : Sucrose Solubility in Impure Cane Sugar Solutions
i.S.J., 2000, 102, 230-235
5. L. Rózsa : Sensor Selection: Still an Issue in Sugar Crystallization Control
PHILSUTEC Convention 2003, Bacolod City, PHILIPPINES
6. L. Rózsa : SeedMaster 2: A universal crystallization transmitter and automatic seeding device
I.S.J. 2006, 108, 683-695
7. L. Rózsa : Sugar crystallization: Look for the devil in the details – Part 1
I.S.J. 2008, 110, 403-413
8. L. Rózsa : Sugar crystallization: Look for the devil in the details – Part 2
I.S.J. 2008, 110, 729-739
Page 14
3 THE SEEDMASTER 2 CRYSTALLIZATION TRANSMITTER …
14
14
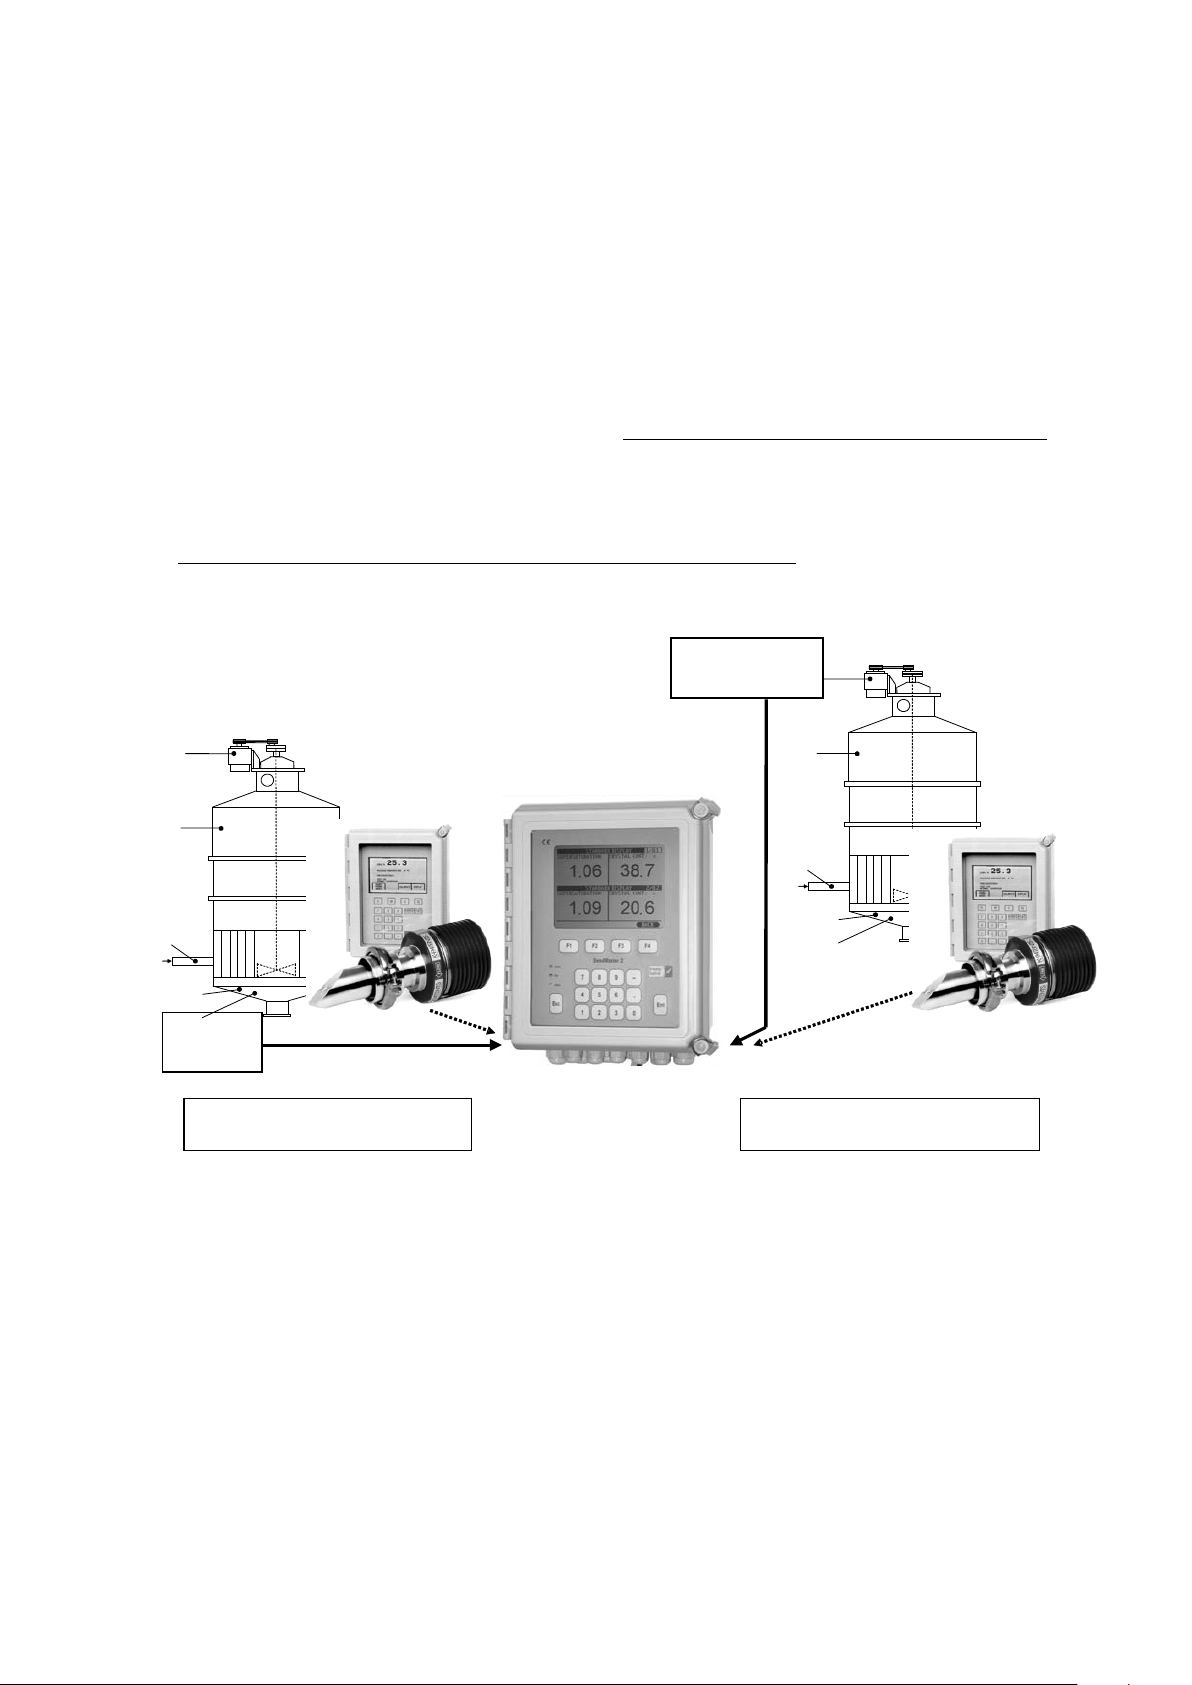
DENSITY
THIRD PARTY TRANSMITTER :
DENSITY
MOTOR CONS.
THIRD PARTY TRANSMITTER:
MOTOR CONSUMPTION
3 THE SEEDMASTER 2 CRYSTALLIZATION TRANSMITTER AND SEEDING
DEVICE
3.1 SeedMaster 2 description
The heart of SeedMaster 2 is a high performance computer specifically designed to calculate, displa y and
transmit all of the vital parameters characterising sugar crystallization simultaneously for up to 2 crystallizers.
Besides that it can perform reliable automatic seeding of the crystallizers as well. Both features require the
input of some data measured on-line by 1 (or 2) K-PATENTS process refractometer(s) and by some selected
instrument(s). Input of a few laboratory data and status information (digital inputs) are also required.
Based on these data SeedMaster 2 is able to calc ula te 7 massecuite parameters per crystallizer in real tim e,
only 2 of which are considered adequate for the advanced control of crystallization.
Some of these parameters (for example: crystal content, mother liquor purity, mean crystal size etc.), though
they are important ones, are usually rarely determined by the local laboratory, if at all. Due to the time delay
(dead-time) involved, these data, however, are more or less useless in closed loop, real time control of
crystallization.
Other instruments in use provide data only on a single massecuite parameter.
Fig. 3.1 SeedMaster 2 serving 2 vacuum pans
3.2 SeedMaster 2: a front-end device
The device was designed to be used as a “front-end” instrument mounted close to the vacuum pans or
crystallizers in order to provide all of the information required by operating personnel on site. It has a large
backlit LCD display and a keyboard (Fig. 3.2). Naturally enough, it has advanced digital communication
features to send a large amount of acquired and calculated data on-line to a Process Control System, too.
The LCD display is specified to operate in the 0 – 50 C temperature range (environment) and this applies to
SeedMaster 2 as a whole, too.
Page 15

3 THE SEEDMASTER 2 CRYSTALLIZATION TRANSMITTER …
15
15
Fig. 3.2 The SeedMaster 2 enclosure
(Display: supersaturation and cry stal co ntent )
3.3 Principle of operation
Contrary to commonly used sensors that measure massecuite parameters only indirectly linked to the really
important ones (supersaturation and crystal content), SeedMaster 2 was designed to provide information online on all of the parameters which are important for the up-to-date control of crystallizati on .
Its operation is based on the use of the K-PATENTS process refractometer, which became the workhorse of
different industries, including sugar, when accurate on- and in-li ne measu rement of liquid concentration is a
must. Syrup / mother liquor concentration data are not disturbed by the presence of crystals, steam and
vapour bubbles and the colour of the liquid. At the same time the refractometer provides data on massecuite
temperature as well. This means that data on C and T (concentration and temperature) in Eq. 1. are directly
provided by the refractometer. Though not advised, it is possible to use a separate temperature probe and
transmitter, too. Besides these data information on mother liquor purity Q is also required for the on-line
calculation of supersaturation.
Mother liquor purity is equal to feed syrup purity only up to the point of seeding. When the crystals begin and
continue to grow, mother syrup purity begins to drop accordingly. It is therefore not constant during the strike,
and should be calculated on-line together with changing crystal content. This, however, needs the use of
additional on-line data (“Third input”) from some already existing sensor (density, massecuite solids content
(brix), or stirrer motor consumption).
NOTES:
1. The use of stirrer motor power or current consumption as “Third input” is limited to batch vacuum
pans operating without strike cut(s), that is without discharging some part of the massecuite before
the end of the strike. The trend of motor consumption data should look like one of those shown in
Fig. 7.5 or Fig. 7.6.
2. As a last resort, if none of these sensors is available, a single data from the laboratory (updated
from time to time) on crystal content (% by volume) when dropping the charge (vacuum pans
operating in batch mode without strike cut(s)) can be used.
Finally, it is well known that feed syrup quality, characterised by its “m”, “b” and “c” parameters can show
considerable changes, which have to be taken into account when calculating the massecuite parameters.
Syrup quality parameters should be determined by the local laboratory (see: APPENDIX). If it is not possible,
data typical for beet and cane syrups are available. Besides these some additional laboratory data are also
required.
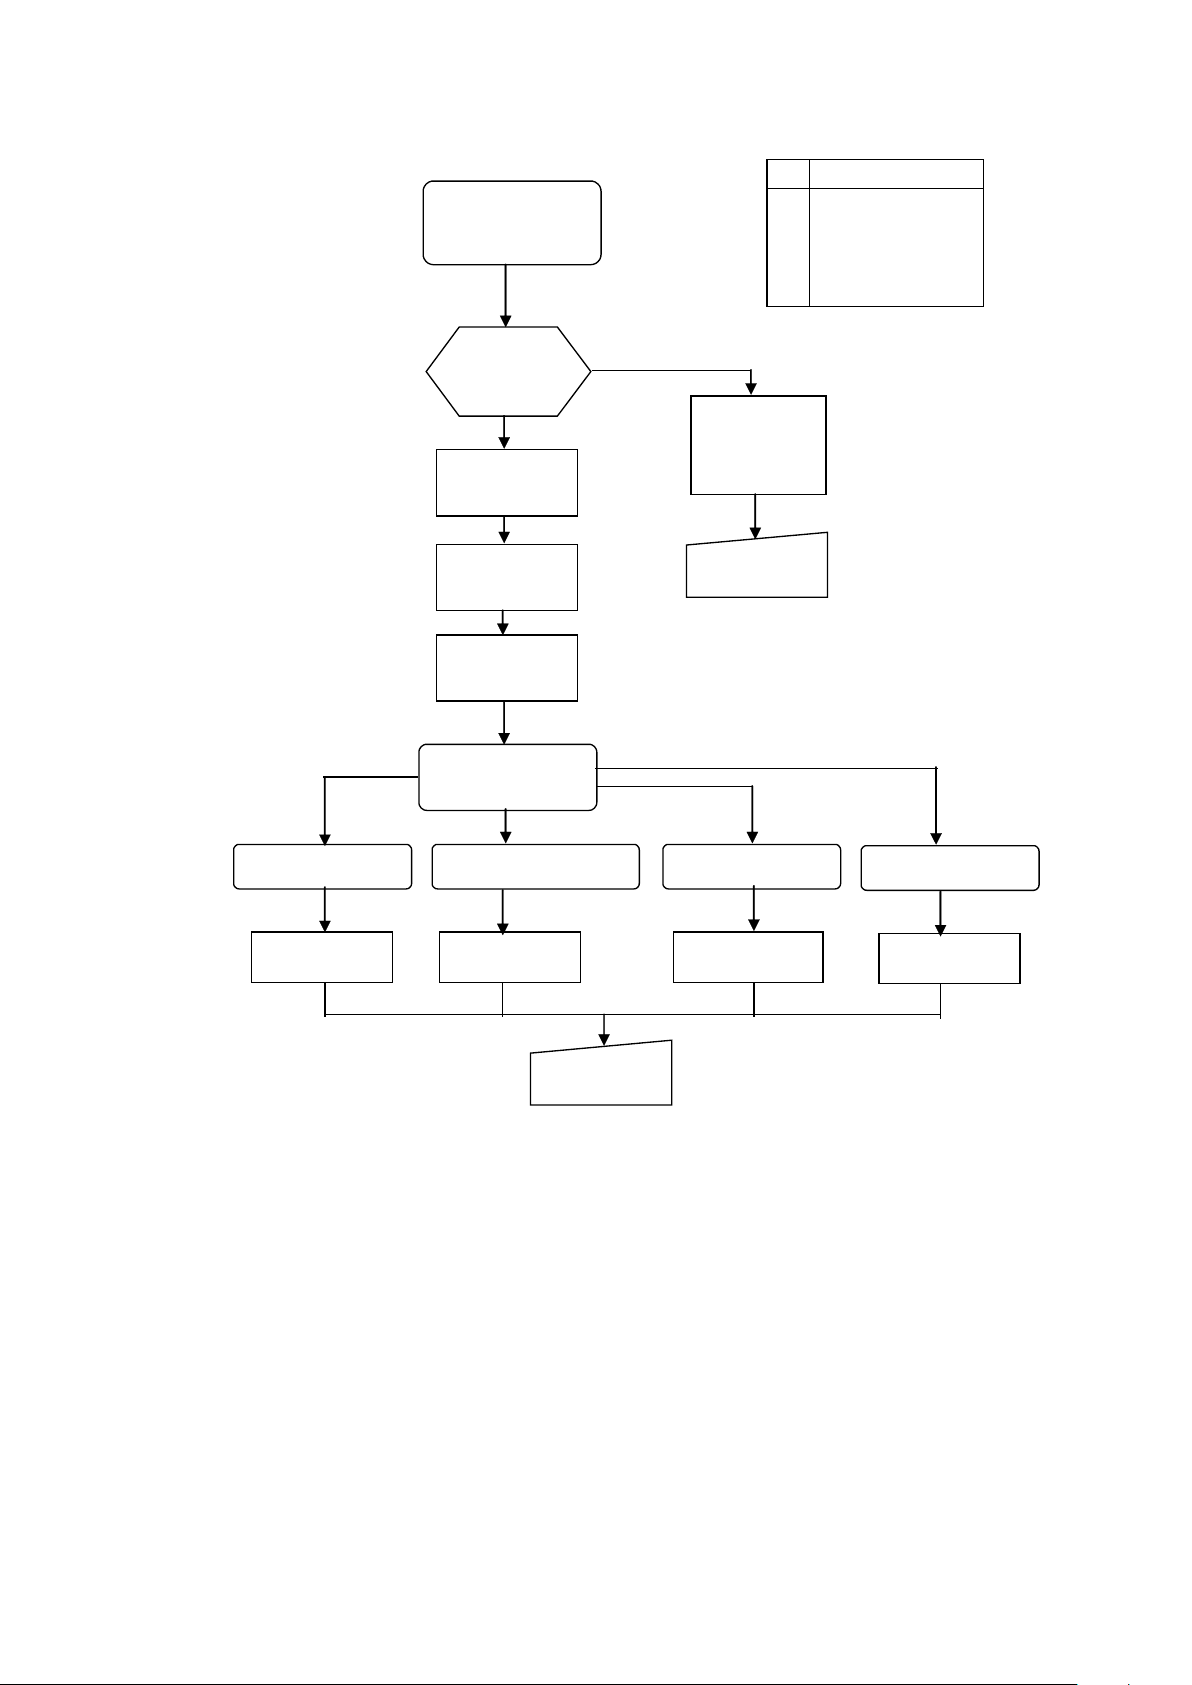
SeedMaster 2 operates in two differ ent mod es:
1. in “Stand-by mode” it is waiting for the start (“activation”) of a new strike (vacuum pans
operating in batch mode);
2. in “Active mode” it is carrying out all of the calculations and operations it was designed for
(batch vacuum pans and continuous crystallizers).
Page 16
3 THE SEEDMASTER 2 CRYSTALLIZATION TRANSMITTER …
16
16
Data base
START On-line inputs
program once Parameters
every 10 sec Digital I/O
Calculated outputs
Archive data
Strike
ACTIVE?
ACTIVE YES STAND-BY
MODE MODE
Calculations operations
Archive END
data
Seeding
operations
Decision based on
THIRD INPUT
MASS. DENSITY MASS. SOLIDS CONT. MOTOR CONS. LAB. CR. CONT.
Calculations Calculations Calculations Calculations
END
Fig. 3.4 The basic SeedMaster 2 operations
Based on the calculated data SeedMaster 2 can be programmed to carry out automatic seeding of the
crystallizer on its own, when
• supersaturation, or
• massecuite density
becomes equal to the supersaturation or density set-point selected by the technologist or pan operator.
Actual seeding is carried out by opening the seed valve (digital output) for a pre-set time interval.
If seeding of the crystallizer is carried out not by SeedMaster 2, but by another device (a control system, for
example), or by the operator, SeedMaster 2 must be notified accordingly by a digital input, or via digital
communication.
All operations discussed above can be performed independently with two crystallizers at the same time.
3.4 Calculated data
Based on the information received SeedMaster 2 carries out involved calculations on-line. These, and one or
the other of the measured data used (density, solids content, motor consumption, or laboratory crystal
content data) are combined providing information on 7 massecuite parameters (set of massecuite
parameters) per crystallizer. These are:
Page 17

3 THE SEEDMASTER 2 CRYSTALLIZATION TRANSMITTER …
17
17
1. supersaturation (-)
2. crystal content (% by volume)
3. mother liquor purity (%)
4. massecuite density (kg / m)
5. massecuite solids content (%)
6. massecuite consistency (%)
7. mean c rystal size (mm)
Parameters No.1. and No.2. are the important ones for the advanced control of crystallization.
Parameters No.1. … No.3. and No.7. represent a drastic change in the type of information available in
real time for crystallization control, while No.4….No.6 provide accustomed data.
NOTES:
1. Any 2 out of the 7 (per crystallizer) listed above can be selected for transmission by standard (0…20 mA,
or 4…20 mA) current output.
2. All of these and some other data can be transmitted to a PC (Personal Computer), or PCS (Process
Control System) via digital communication.
3. Mean crystal size data are approximate and valid only if full seeding is practiced and no dissolution
of crystals or further nucleation takes place during crystallization.
3.5 On-line data inputs
The 2 obligatory on-line (real-time) data inputs required for the correct operation of SeedMaster 2 are:
1. syrup / mother liquor concentration, and
2. massecuite temperature.
It is highly recommended to use a third on-line data input (“Third input”) as well, which can be selected
from those listed below:
3. massecuite density (kg / m), or
massecuite solids content (%), or
stirrer motor power consumption (kW), or
stirrer motor current (A).
It does not matter what kind of instrument (nuclear, microwave etc.) is being used to measure density, or
solids content. If stirrer motor consumption provides the 3
preferred.
rd
data input, power consumption (kW) data are
3.5.1 Receiving syrup concentration data from the K-PATENTS refractometer(s)
There are several ways to transmit concentration data originating from a K-PATENTS refractometer to
SeedMaster 2 (see Ch. 7.2):
1. Standard current transmission (4 – 20 mA).
The transmitter can be the refractometer itself, or the standard current may come as current output from a
DCS-, or PLC-based Process Control System (PCS) already receiving the data from the refractometer. In this
case an analogue input channel of SeedMaster 2 sh oul d be used.
2. Digital communication using ports COM1, COM2, or COM3.
It is possible to transmit concentration (and temperature) data measured by K-PATENTS PR-01-S type
refractometer(s) by using serial data communication (RS232, RS422, RS485). SeedMaster 2 has 3 serial
ports (COM1, COM2, COM3). Two of these can be used to receive data directly from 2 PR-01-S type
refractometers at the same time . Cable length should be short, not exceeding 15 meters.
3. All data exchange (inputs and outputs) between SeedMaster 2 and a PCS can be implemented by
using one of the COM1…COM3 ports and MODBUS SLAVE (ASCII RTU) protocol.
4. Data input (concentration and temperature) to SeedMaster 2 from a K-PATENTS PR-23 type
refractometer with 1 or 2 sensor heads can be implemented by directly connecting them using the standard
ETHERNET connection and UDP / IP K-PATENTS refractometer protocol.
5. All data exchange (inputs and outputs) between SeedMaster 2 and a PCS can be implemented by
using the standard ETHERNET connection and TCP / IP MODBUS TCP protocol.
3.5.2 Receiving temperature data
Massecuite temperature is always measured by the sensor probe of the K-PATENTS refractometer and may
be available for transmission as standard current (4 – 20 mA) output (option). The Indicating Transmitter of
Page 18

3 THE SEEDMASTER 2 CRYSTALLIZATION TRANSMITTER …
18
18
the refractometer has (depending on the model used) two, or only a single current output. It is possible to use
an independent temperature sensor and standard current transmitter to transmit temperature data to
SeedMaster 2 as well. SeedMaster 2 has 2 (optional) RTD Pt100 type (Resistance Temperature Detector)
inputs as well. In these cases the temperature sensor should be located as close to the refractometer sensor
head as possible in order to measure the same sample temperature. From time to time re-calibration of the
temperature transmitter is advised.
Temperature measured by the refractometer can be transmitted (together with concentration data) by using
digital data communication (C OM1, COM2, COM3 and ETHERNET ports), too.
All data input versions listed with concentration data input (3.5.1) are available.
NOTE:
It is preferred to use temperature data measured by the refractometer.
3.5.3 Selecting the “THIRD INPUT” transmitter
Whenever available a “THIRD INPUT” transmitter should be used. If there are more than one available from
those already listed, massecuite density or solids content data are preferred. From these two the one offering
higher accuracy and stability should be used. Based on practical experience it is rather difficult to calibrate
and verify these devices. It is possible to make slight corrections in the data provided by them in SeedMaster
2 itself in order to achieve a better match with more accurate refractometer and laboratory data.
If stirrer motor data are used it is preferred to use motor power consumption (kW) data, because they better
reflect the mechanical power required to drive the stirrer (voltage fluctuations and the changing power factor
are also taken into account). As a last resort, motor current data can also be used.
NOTE:
The use of stirrer motor power or current consumption as “Third input” is limited to batch vacuum
pans operating without strike cut(s), that is without discharging some part of the massecuite before
the end of the strike. The trend of motor consumption data should look like one of those shown in
Fig. 7.5 or Fig. 7.6.
3.5.4 Using laboratory data instead of “THIRD INPUT”
It is always preferred to have on-line feedback (that is: on-line information from one of the instruments listed).
However, if there is no instrument available to use as “THIRD INPUT”, laboratory data on crystal content (%
by volume) at the end of a strike can be used with batch vacuum pan applications. In this case the instrument
carries out involved calculations in order to simulate the process of crystallization on-line. Based on
occasional crystal content data from the laboratory, the simulated process of crystallization is adapted by the
instrument using these data from the laboratory. All feat ures of SeedMaster 2 are available.
3.5.5 Optional data input
An optional LEVEL transmitter can be connected to one of the analogue input channels of SeedMaster 2.
The level data may come from a PCS via digital communication, too. The use of level data is optional: if
available, they are used to refine some of the calculations and to implement a smoo th transition from one
feed syrup to an other one, if feed syrups with different purities are used in the same batch strike. It can
.provide additional information on site for the pan operator, too. If there is no on-line data on level, instead of
level mean crystal size will be displayed on the Main Display.
3.6 Digital inputs
The 2 digital inputs (per pan) are typically contact (relay or switch) types. An “ACTIVE” digital input can be
configured either as an OPEN, or CLOSED relay (or switch) contact.
3.6.1 “STRIKE ACTIVE” input DIN1
SeedMaster 2 can be operated in “Stand-by”, or in “Active” mode (Fig. 3.4). In Stand-by mode it waits for the
start of a new strike (batch pans) and no calculations are performed. Displayed data might be not correct.
The Active mode should be evoked by the start of a new strike (feeding syrup in the pan begins), and s h o uld
usually end with the drop of the charge and motor switch OFF. In the time between two active strikes
(SeedMaster 2 in Stand-by mode) the pan is usually washed and is under normal pressure. Temperature and
concentration data can be quite far from their normal ranges.
Information on the “ACTIVE “status of a pan or crystallizer might come from 3 sources, namely:
• from a relay or switch contact (digital input DIN1), or
Page 19
3 THE SEEDMASTER 2 CRYSTALLIZATION TRANSMITTER …
19
19
SEEDED DIN2
SEEDED DIN2
WAIT
STRIKE 1 ACTIVE
STRIKE 2 ACTIVE
Time
Time
S T R I K E A C T I V E
DIN1
• from the fact, that the current or power consumption of the stirrer motor exceeds a pre-set low
limit (cut off value, motor ON/OFF)), or
• from a PCS via digital communication.
NOTES:
1. The source of the “STRIKE ACTIVE” information can be selected from the above 3 during configuration.
If motor consumption or information from a PCS is being used to synchronise the operation of SeedMaster 2
to crystallizer status, digital input DIN1 can be left un-connected.
2. If motor consumption (power, or current) is used as “STRIKE ACTIVE”, un-intentional stop (due to mains
failure, motor problems etc.) of the stirrer motor during a strike will be treated as an “End of strike” signal.
3. It is advised to use a contact input for “STRIKE ACTIVE” signalisation.
3.6.2 “SEEDED” input DIN2
In order to perform the calculations correctly SeedMaster 2 needs information on the seeding of the pan.
There is no need for this input if seeding of the pan is carried out by SeedMaster 2 itself, that is if
• AUTOMATIC SEEDING was configured, or
• the operator uses the “MANUAL SEEDING” feature regularly (not advised).
However, if seeding is carried out
• either by an independent process control system (PCS), or
• the PCS commands SeedMaster 2 to do the seeding, or
• manually by the operator (pan-man) without using the “MANUAL SEEDING” feature of
SeedMaster 2,
the device must be notified on the seeding of the pan by a digital input lasting for at least 20 seconds.
In this case information may come in the form of a digital input (DIN2) signal, or via digital commu nication
from an independent control system (PCS).
NOTES:
1. Failing to provide information on seeding when needed will result in erroneous op er ation.
2. When SeedMaster 2 receives information from a PCS on seeding, it will operate the same way as it would
if MANUAL SEEDING were configured, that is it will OPEN the seeding valve (DO2, if connected) for the
configured Ton time.
3.6.3 “CHANGE FEED SYRUP” input DIN3.
If instead of a single one, 2 or 3 (maximum) feed syrups having different syrup purities are to be fed to the same batch strike the device must be informed on the execution of the change. One way to do it is to use a digital input (DIN3).
In this case information on purity and pan level may come in the form of 4-20 mA current from a PLC or DCS.
If there are no level data available, the SeedMaster 2 will use typical simulated level data in the 35-80 %
range. Operation of the DIN3 digital input will step the feed syrup purity to the one determined by the actual
current input (maximum 3 times). (For more information on feed syrup change see: 5.1.4 and 8.2.2).
3.7 Data outputs
3.7.1 Data available for transmission
Besides the 6 (out of 7) massecuite parameters 4 additional ones per pan are displayed on the LCD of
SeedMaster 2. Altogether 11 are available for transmission to an other device (PCS).
Page 20

3 THE SEEDMASTER 2 CRYSTALLIZATION TRANSMITTER …
20
20
Set of massecuite parameters:
1. supersaturation (-)
2. massecuite density (kg / m3)
3. massecuite solids content (%)
4. crystal content (% by volume)
5. massecuite consistency (%)
6. mother liquor purity (%)
7. mean c rystal size (mm)
Additional data:
8. syrup / mother liquor concentration (%)
9. stirrer motor consumption (if used) (kW, or A)
10. temperature (˚C)
11. level (%)
3.7.2 Standard current outputs
SeedMaster 2 hardware provides 2 standard current (4 – 20 mA, or 0 – 20 mA, configurable) output channels
per crystallizer. Any 2 out of the possible 11 parameters can be selected for transmission.
3.8 Digital (ON / OFF) outputs
There are 2 digital outputs available per crystallizer (DO1, DO2). These are implemented by switching
transistors (open collector) capable to switch 0,1 A (DC) current at 40 VDC, max.. The outputs are protected
against overload and overvoltage.
3.8.1 “SEED WARNING” output DO1
It is common practice to have the operator (pan-man) prepare the seed material (slurry) in advance and later
carefully stirring it for homogenisation, and fill it in the seeding vessel when seeding of the pan approaches.
The “SEED WARNING” output is configurable according to a supersaturation or density limit, and when this
limit has been reached the DO1 output will be turned ON activating a lamp or horn in order to signal the
operator that it is time to fill the seed slurry in its vessel. Having completed seeding this output will be turned
OFF automatically.
Alternatively this output can serve a different purpose, too. For example: if the seeding vessel has its own
small, motor driven stirrer, this output can be used to turn this stirrer ON in advance to homogenise the slurry
already filled in it.
3.8.2 “SEEDING” output DO2
Actual seeding of the pan is carried out by turning the DO2 output ON and opening the seeding valve for a
selected Ton time interval (configurable). This output will be operated in 3 cases:
• when AUTOMATIC SEEDING by SeedMaster 2 was configured,
• when MANUAL SEEDING by using SeedMaster 2 was carried out by the operator, and
• when it receives a command for seeding via input DIN2, or digital communication.
This same output can be used also when crystal footing is being used for seeding.
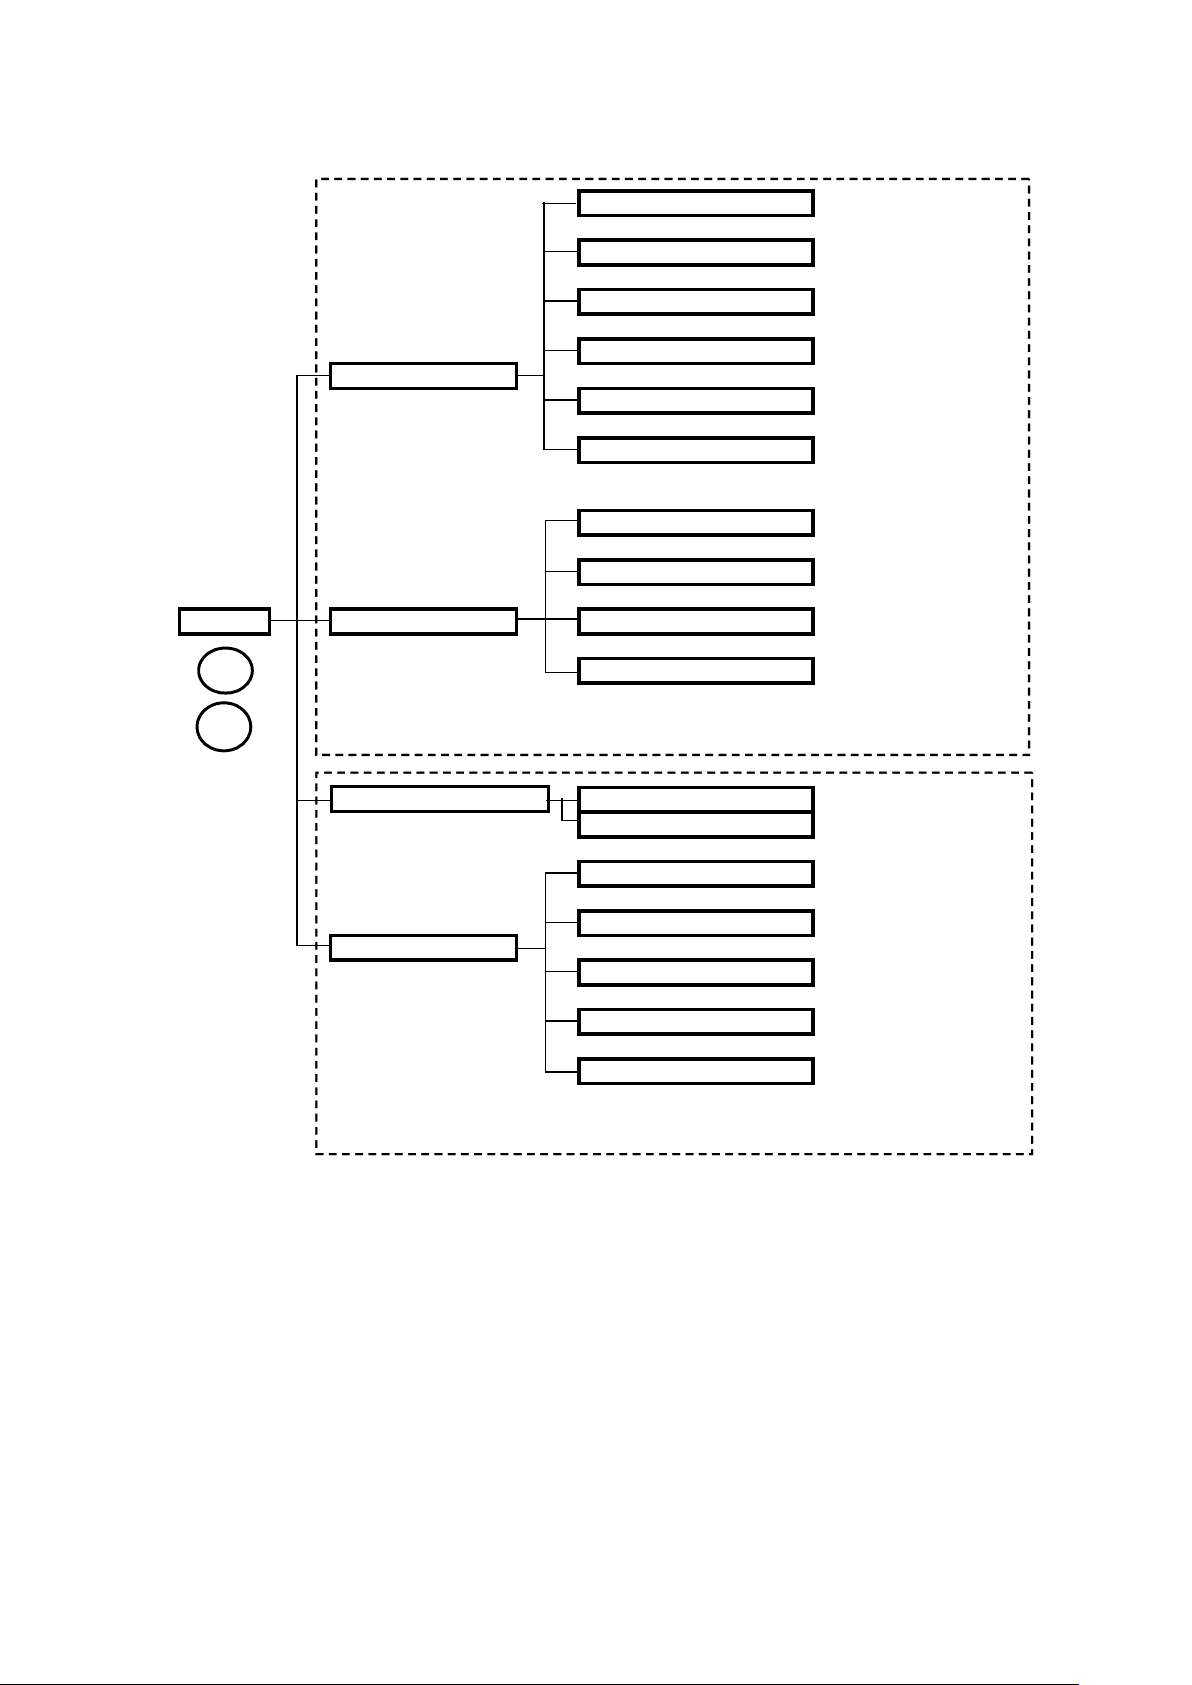
3.9 The man-machine interface
The man-machine interface of SeedMaster 2 consists of two main parts:
1. Parameterization of the device is basically tailoring (customizing) it to the application, taking into
account local circumstances and preferen ce s.
2. Operation of the device needs the built-in features of the different forms of data display, including
strike history, alarm and test data. Besides AUTOMATIC SEEDING it also provides a tool for MANUAL
SEEDING. Information on seeding details, strike
status and time are also displayed.
Page 21
3 THE SEEDMASTER 2 CRYSTALLIZATION TRANSMITTER …
21
21
STRIKE ACTIVE SIGNAL
THIRD INPUT
SEEDING
ACTIVE INSTRUMENT
CONFIGURATION
PASSWORD
COMMUNICATION
DISPLAY
INPUTS
MENU SET UP DIGITAL I / O
1 ANALOG OUTPUT
2
DEVICE PARAMETERIZATION TOOLS
MANUAL OPERATIONS MANUAL SEEDING
CHANGE FSYRUP
TREND
STRIKE HISTORY
DISPLAY
STANDARD DISPLAY
SYTEM INFORMATION
TEST DATA
DEVICE OPERATION TOOLS
Fig. 3.5 The main branches of the SELECTION TREE
Page 22

4 TECHNICAL DATA, MOUNTING AND ELECTRICAL CONNECTIONS
22
22
4 TECHNICAL DATA, MOUNTING AND ELECTRICAL CONNECTIONS
SeedMaster 2 is based on the use of a high-power 32 bit microprocessor and a high capacity (32 MB)
memory operating under a real-time operating system. This, the application program of the device together
with parameters, measured and calculated data are stored in CF (Compact Flash) memory. Parameters,
calculated and archive data are stored every minute in the memory, therefore eventual loss of power supply
will not result in loss of these data. The real-time clock chip (DALLAS DS12887) used in the device has its
own lithium battery and needs replacement only after 10 years.
In order to increase reliability and to reduce servicing, no potentiometers are used in the instrument.
4.1 Specifications
Main device features
1. On-line calculation, display and transmission of up to 7 massecuite parameters and up to 4
additional monitored data during sugar crystallization for up to 2 pans simultaneously.
2. Automatic seeding of vacuum pans based on calculated supersaturation or density set-point for
seeding selected by the local technologist.
3. Collecting all calculated and measured data for the last 4 strikes in strike history archives, which can
be displayed as trends with appropriate time data. Brief (numerical) supersaturation strike history
(last 4 strikes).
4. Advanced communication features including the Ethernet.
5. Large LCD numeric and graphic display, robust design.
Data available for transmission
1. Calculated data (all over a complete strike):
1. Supersaturation (-)
2. Crystal content (% by volume)
3. Density (kg / m)
4. Consistency (%)
5. Solids content (%)
6. Mother liquor purity (%)
7. Mean crystal size (mm)
2. Additional data monitored in real time:
1. Syrup / mother liquor concentration (%)
2. Stirrer motor consumption (if used) (kW, or A)
3. Temperature (˚C)
4. Level (optional) (%)
Inputs for calculation
1. Process inputs:
1. Syrup / mother liquor concentration measured by K-PATENTS refractometer(s)
2. Massecuite temperature measured by K-PATENTS refractometer(s), or separate
transmitter(s).
3. Third par ty tran smi tter mea s ur ing
• density, OR
• massecuite solids content, OR
• stirrer motor power, or current consumption.
4. Optional input: massecuite level.
2. Digital (ON / OFF) inputs (depending on the selected mode of operation):
1. None.
2. Maximum 3 (DIN1: “Strike active”, DIN2: “Seeded”, DIN3:”Change feed syrup”).
3. Laboratory data:
1. Feed syrup purity (%).
2. Syrup quality (“m”, “b”, “c”) parameters. Typical data and a description of a procedure to
determ ine lo cal para meter s are prov ided.
NOTE:
All inputs can be also received via digital communication.
Page 23

4 TECHNICAL DATA, MOUNTING AND ELECTRICAL CONNECTIONS
23
23
Calculated outputs
1. Analog (0-20, 4-20 mA) outputs:
Any 2 of the 7 calculated massecuite parameters (per pan).
2. Digital (ON / OFF) outputs:
1. DO1: Warning on approaching seeding (programmable).
2. DO2: Opening the seeding valve for a selected time interval.
NOTE:
All calculated and measured data can be also transmitted via digital communication.
Process interface
Inputs
1. Analog current 8 channels
Symmetr ical, galvanically isolated
Range 0(4)-20 mA, keyboard selectable
Input impedance 100 Ohm
Common mode voltage 50 V max.
2. RTD (Pt 100) (option) 2 channels
4 wire connecting mode
3. Digital (ON / OFF) 8 channels
Signal sources: passive, contact or open collector
active, + 24 Vdc
automatic signal detection
Outputs
1. Analog current 4 channels
Galvanically isolated
Range 0(4)-20 mA, keyboard selectable
Max. load 600 Ohm
2. Digital ON / OFF) 4 channels
Isolated open collector,
overvoltage and short circuit protected
3. Power supply for transmitters 1 X 24 Vdc, 200 mA max.
4. Device Status (ON/OFF) Operating / Error
Communication
1. Serial (COM1, COM2, COM3) 3 ports
Galvanically isolated
Standards RS232, RS422, RS485 (keyboard selectable)
Control signals CTS, RTS (keyboard selectable)
Baud rates 1200…38400 Baud (keyboard selectable)
Length of cable RS232 15 m max.
RS422 /485 1200 m max.
Protocols K-PATENTS refractometer protocol
MODBUS SLAVE (ASCII, RTU)
2. Ethernet 10 6 100 Base T
Connector RJ45
Protocols TCP / IP, MODBUS TCP,
UDP / IP (K-PATENTS refractometer protocol)
Front panel
Display 5,7 ‘ QVGA 320x240 graphic LCD
Keyboard Membrane switches with flexible foil cover
LED indicators Power, Run, Alarm
Power supply 100…240 V ac, 50 / 60 Hz; 10-25 VA
24 (18…30) Vdc
Page 24
4 TECHNICAL DATA, MOUNTING AND ELECTRICAL CONNECTIONS
24
24
NOTE:
AC and DC types of supply can be connected to the device at the same time. When AC supply is available it
will be selected for use, otherwise the DC supply will be the active one. Switch-over from one to the other is
automatic and bumpless.
Temperature range (ambient)
Operation 0…50 ˚C
Storage - 25…70 ˚C
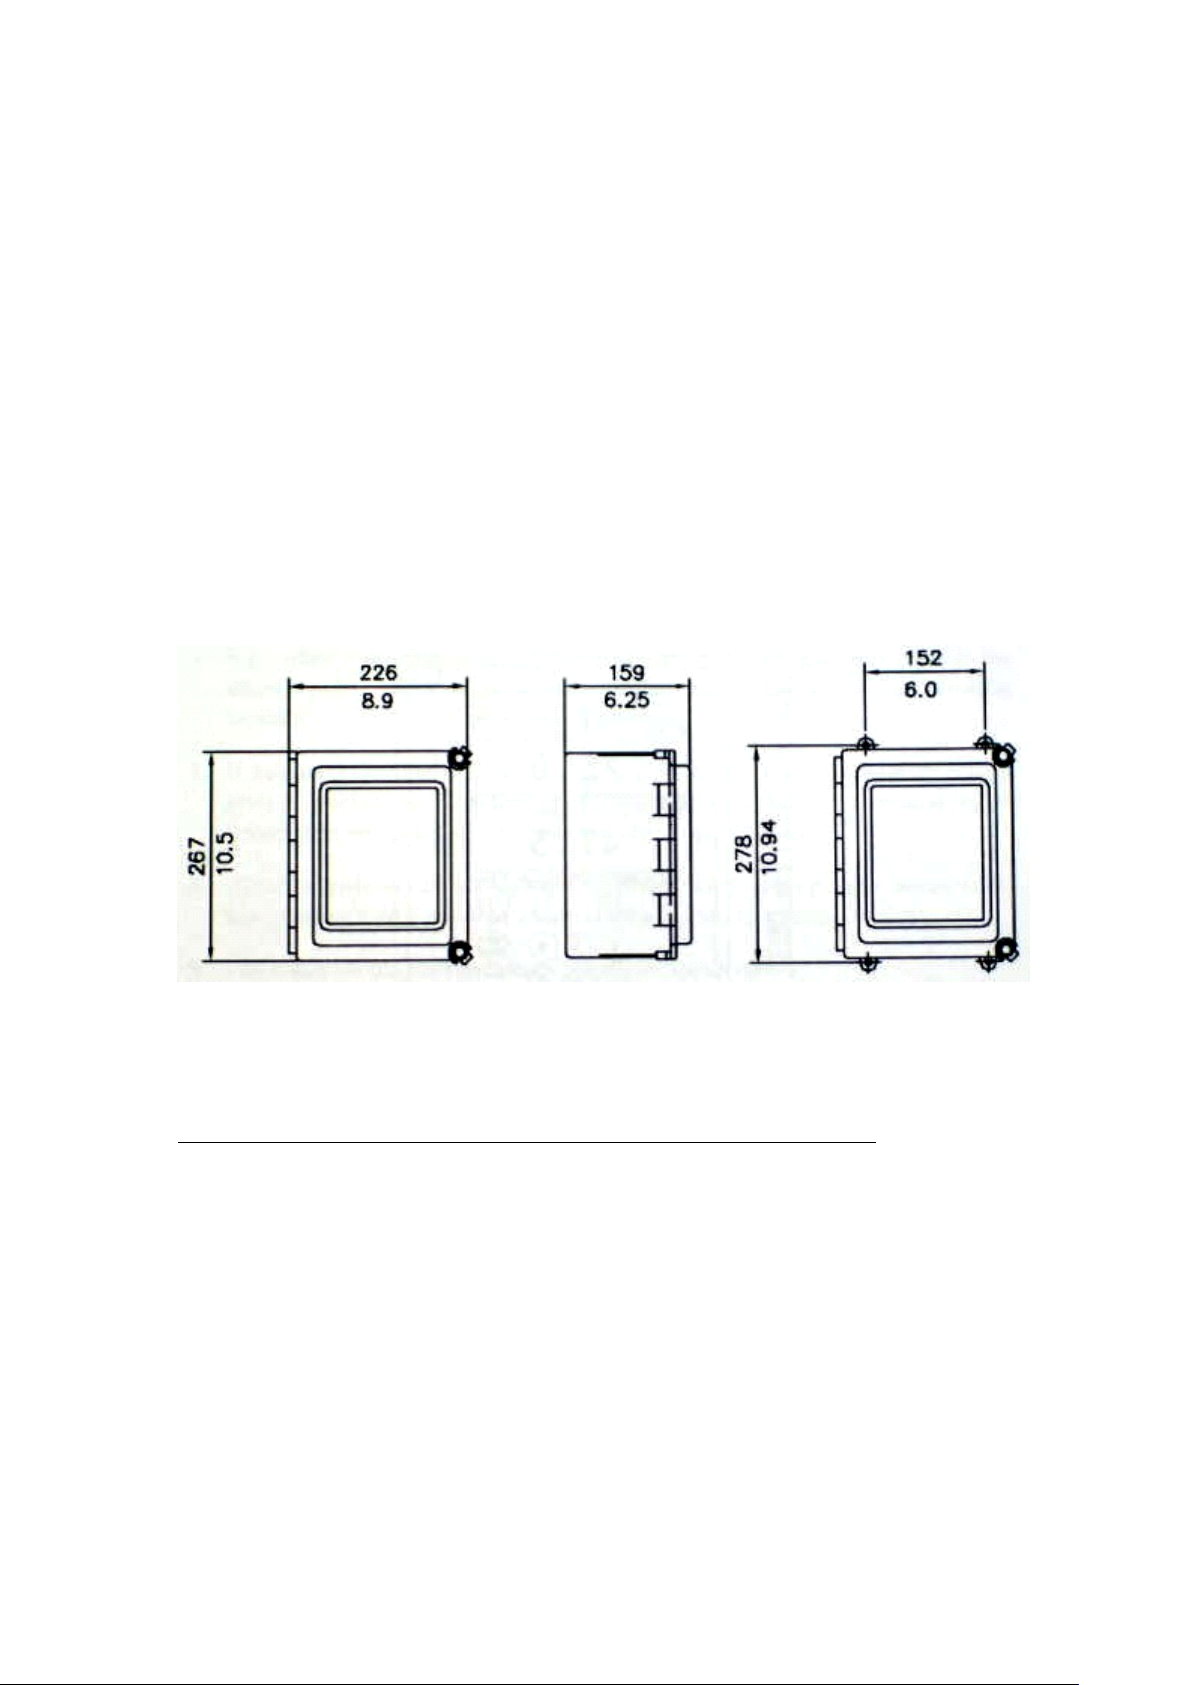
Enclosure
IP66, NEMA 4X
Size (mm / inch) H: 267 / 10,5; W: 226 / 8,9; D: 159 / 6,25
NOTE:
The SeedMaster 2 enclosure is identical to the one used by the Indicating Transmitters of the K-PATENTS
refractometer family and should be mounted taking into account the same considerations, that is:
• do not expose it to direct sunlight and rain, or splash water,
• avoid vibration,
• mount it vertically on an upright surface in a dry and well-lit area,
• do not drill mounting holes in the enclosure.
Fig. 4.1 SeedMaster 2 dimensions and mounting feet measures
4.2 Electrical connections
4.2.1 Power supply
Power to the instrument must be connected by a cable with protective earth connection. Even if DC supply is
used (see Ch. 4.1), in order to maintain the accuracy of the analog inputs the protective earth connection
must be used via the mains connector.
NOTES:
1. There is no mains switch in the instrument! An external power switch should be used.
2. Check if your mains voltage specification and that of the instrument are identical before first
switching on the instrument!
WARNING!
Check if the power is off before opening the Front panel. If the red POWER LED on the Front panel is
ON, turn off the power first by unplugging the power supply cable or switch it OFF with the external power
switch.
Page 25

4 TECHNICAL DATA, MOUNTING AND ELECTRICAL CONNECTIONS
25
25
Fig. 4.2 Electrical connections
There are two screw-type terminals for power connection in the bottom of the enclosure (se e Fig. 4.2). The
one on the right side has 3 terminals (L: line, G: ground, N: neutral) to connect the AC power input, while the
one on the left has 2 terminals with polarity markings for 24 V DC input. Both power inputs have their
dedicated fuses.
4.2.2 Process inputs and outputs
Process inputs and outputs use printed circuit spring cage terminal blocks. There are 2 connection points
(polarity is marked) per terminal block. Just above the power input level on the left side there are terminals for
8 analog input (AI) channels (0-20, or 4-20 mA, keyboard selectable) and a 24 V DC output (PS out) to
supply power for transmitters (max. load: 200 mA).
On the same level on the right side similar terminals for 4 analog output (4-20 mA) channels (AO, channels
1…4) are located. These are followed by 4 digital output channels (DO, channels 1…4), then by 8 digital
inputs (DI, channels 1…8). The digital inputs have their common terminal point (common) in the rightmost
position. All terminal points have their appropriate polarity markings.
4.2.3 Digital communication
There are screw-type terminals on the highest level (Fig. 4.2) for 3 serial communication ports (Com1, Com2,
Com3). Their connection points are colour-coded according to the selected type of communication (black:
RS232, red: RS485, blue: RS422).
The Ethernet 10/100 port is located to the left of the Com1 port.
Page 26
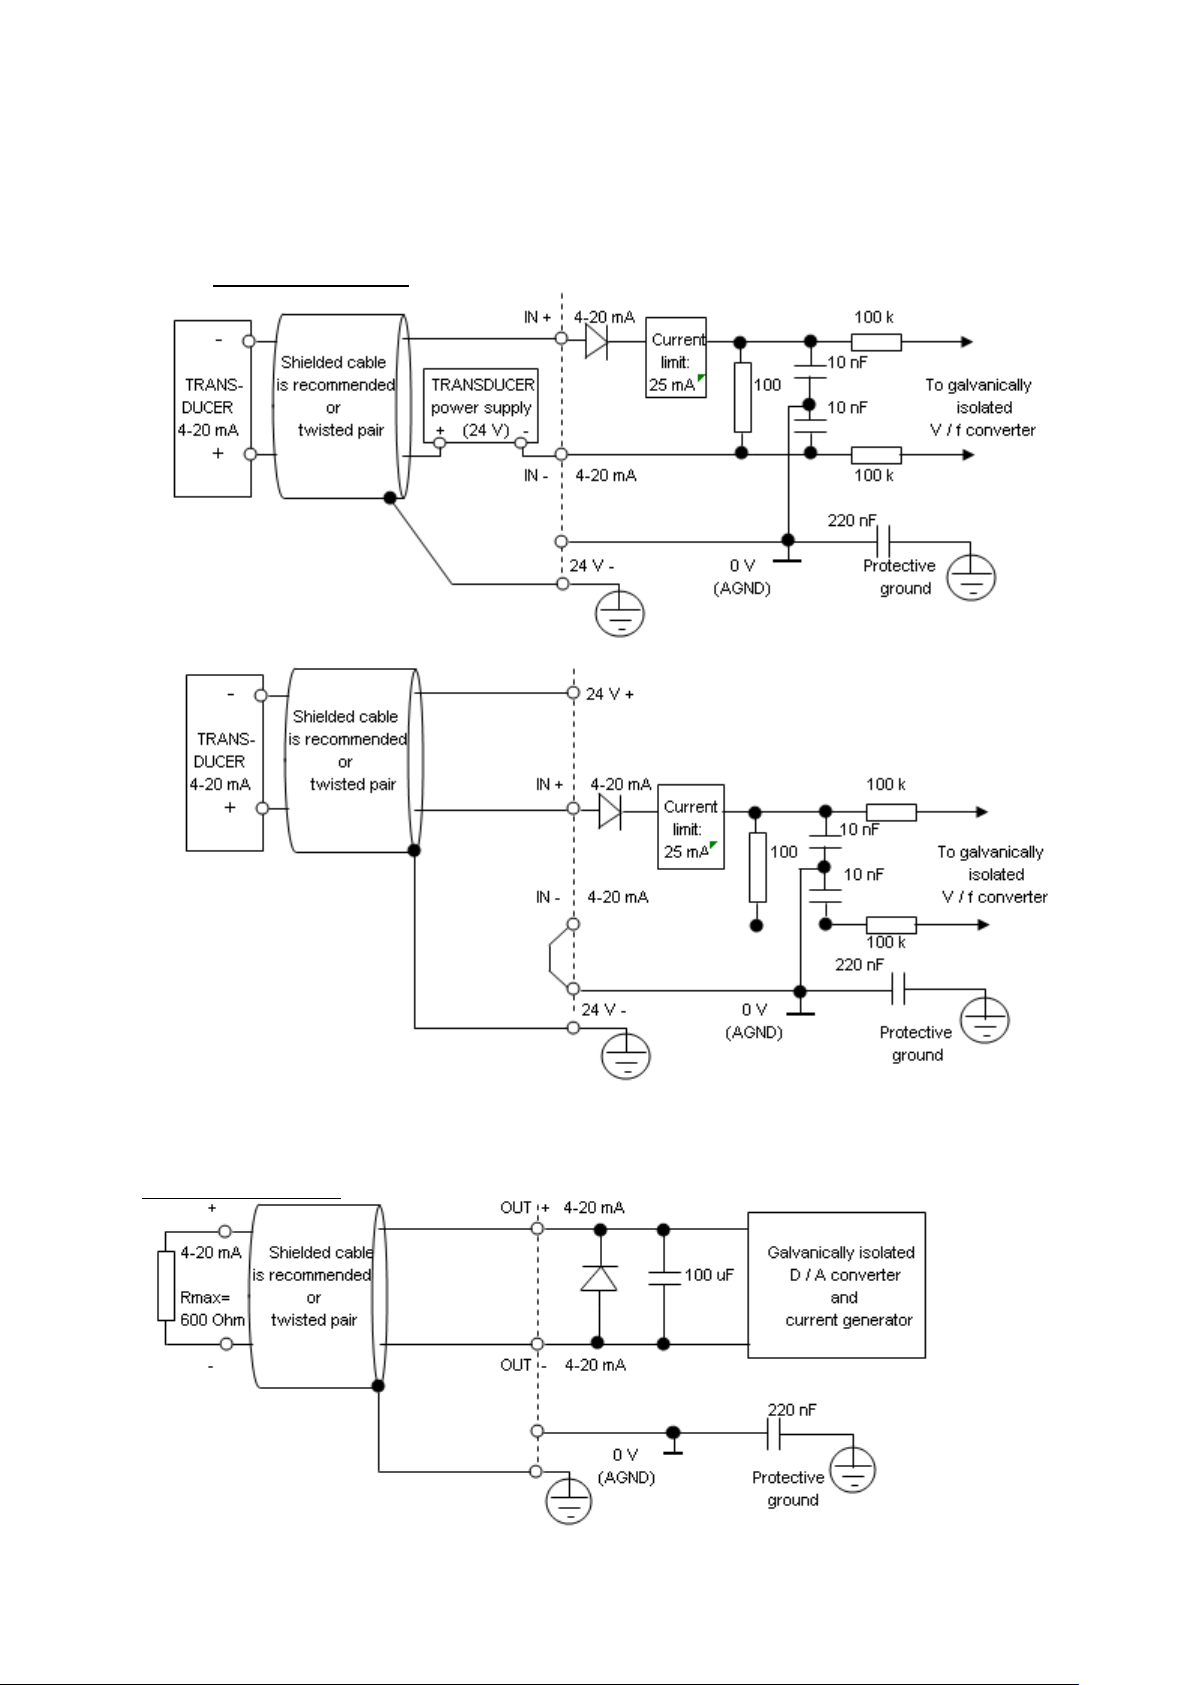
4 TECHNICAL DATA, MOUNTING AND ELECTRICAL CONNECTIONS
26
26
4.2.4 I / O wirings
Analog input channels
Simplified 4 -20 mA Analog Input and cabeling using external Transducer power supply.
Simplified 4-20 mA Analog Input and cabeling using the internal (max. 200 mA) Transducer power supply.
Fig. 4.3 Analog input versions
Analog output channel
Page 27
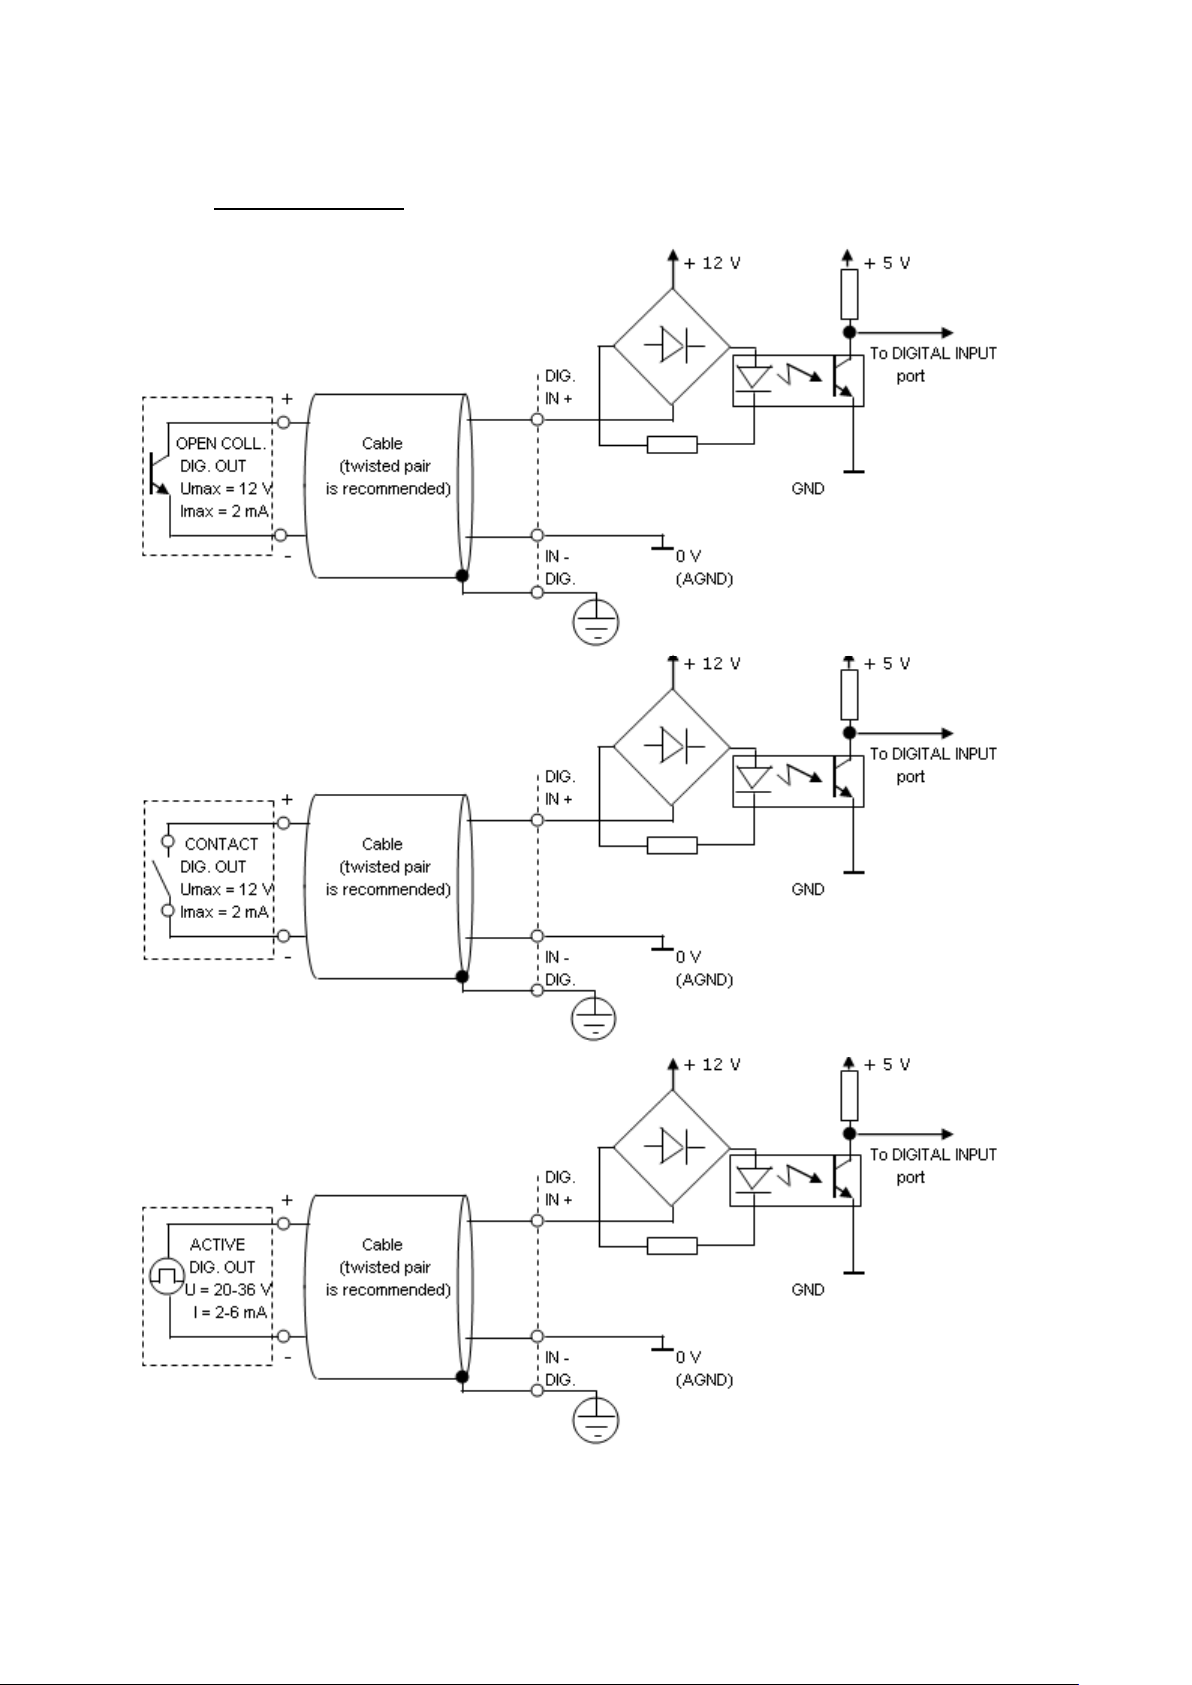
4 TECHNICAL DATA, MOUNTING AND ELECTRICAL CONNECTIONS
27
27
Fig. 4.4 Simplified 4-20 mA Analog Output and cabeling.
Digital input channels
Simplified Digital Input types and cabeling
Fig. 4.5 Digital input versions
Page 28
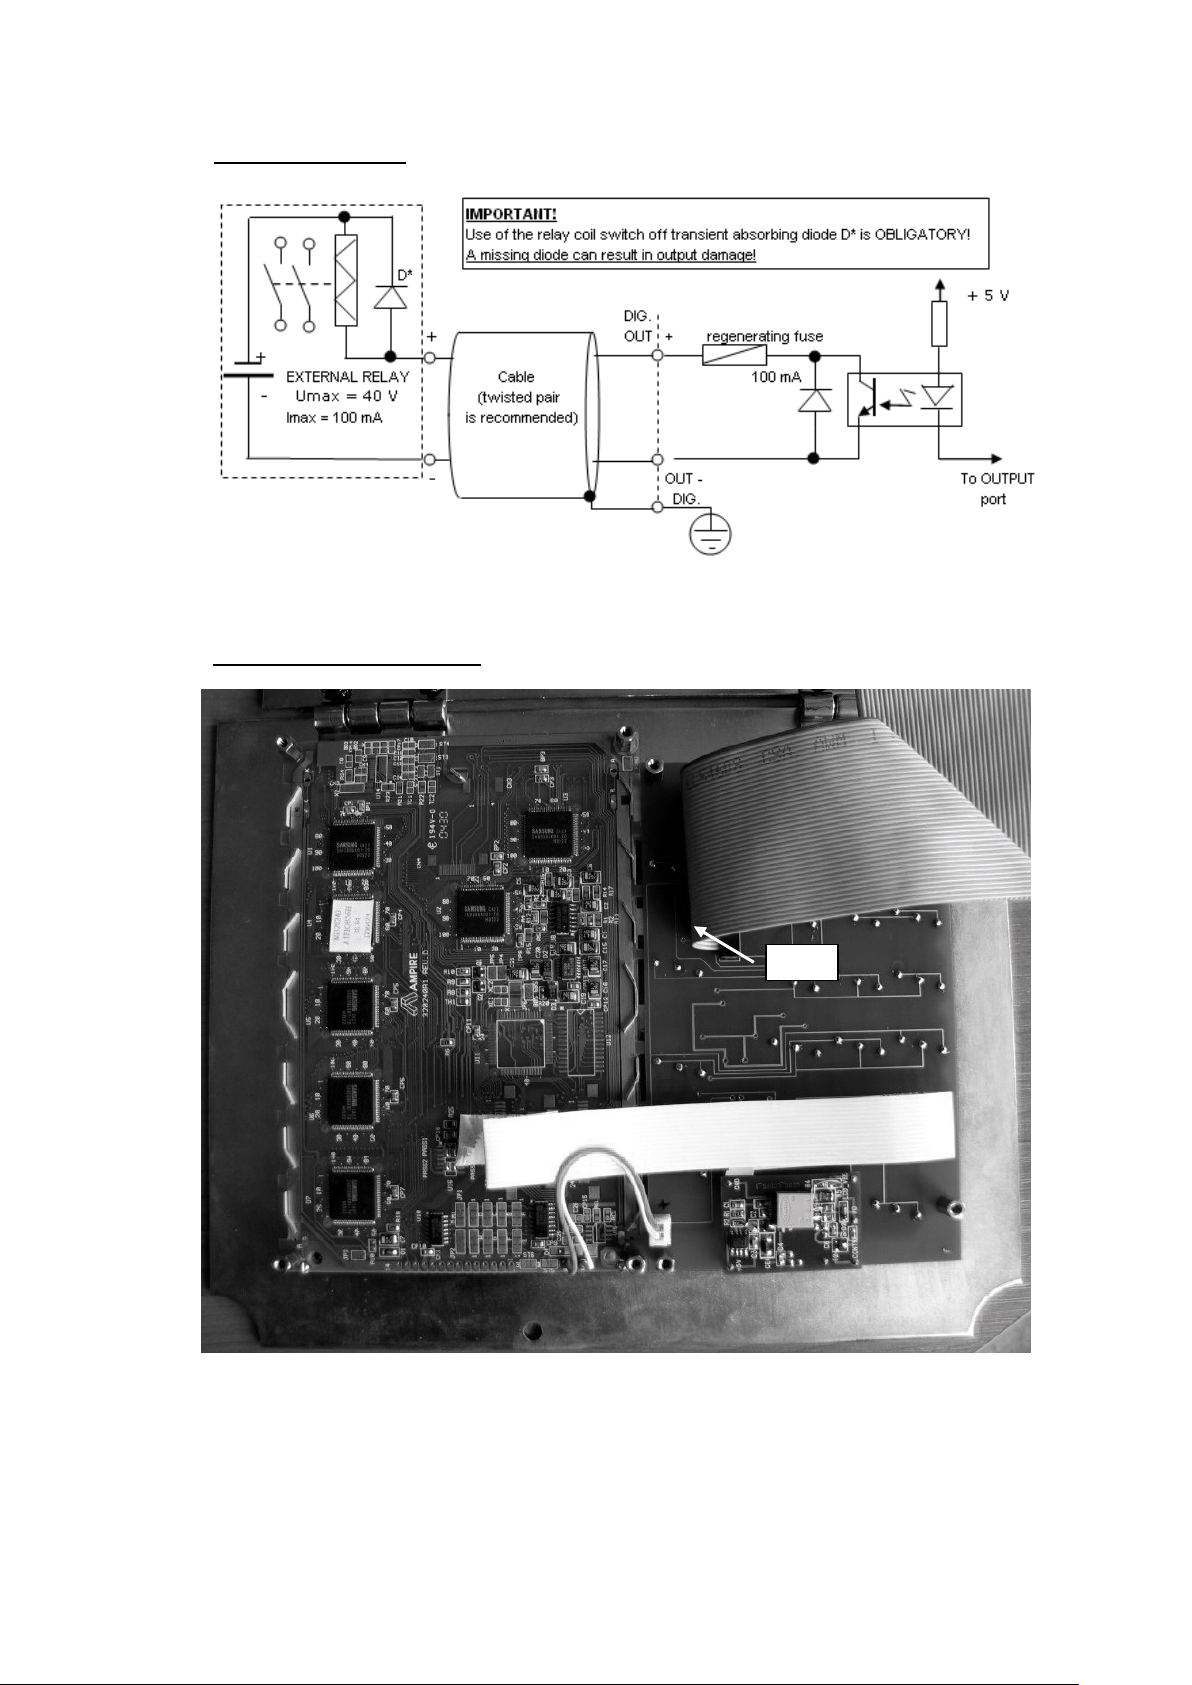
4 TECHNICAL DATA, MOUNTING AND ELECTRICAL CONNECTIONS
28
28
LCD
Digital output channel
Fig. 4.6 Simplified Digital Output and cabeling driving a relay.
4.3 Construction details
LCD and keyboard electronics
Fig. 4.7 Back of the front panel (protecting metal plate removed)
Page 29
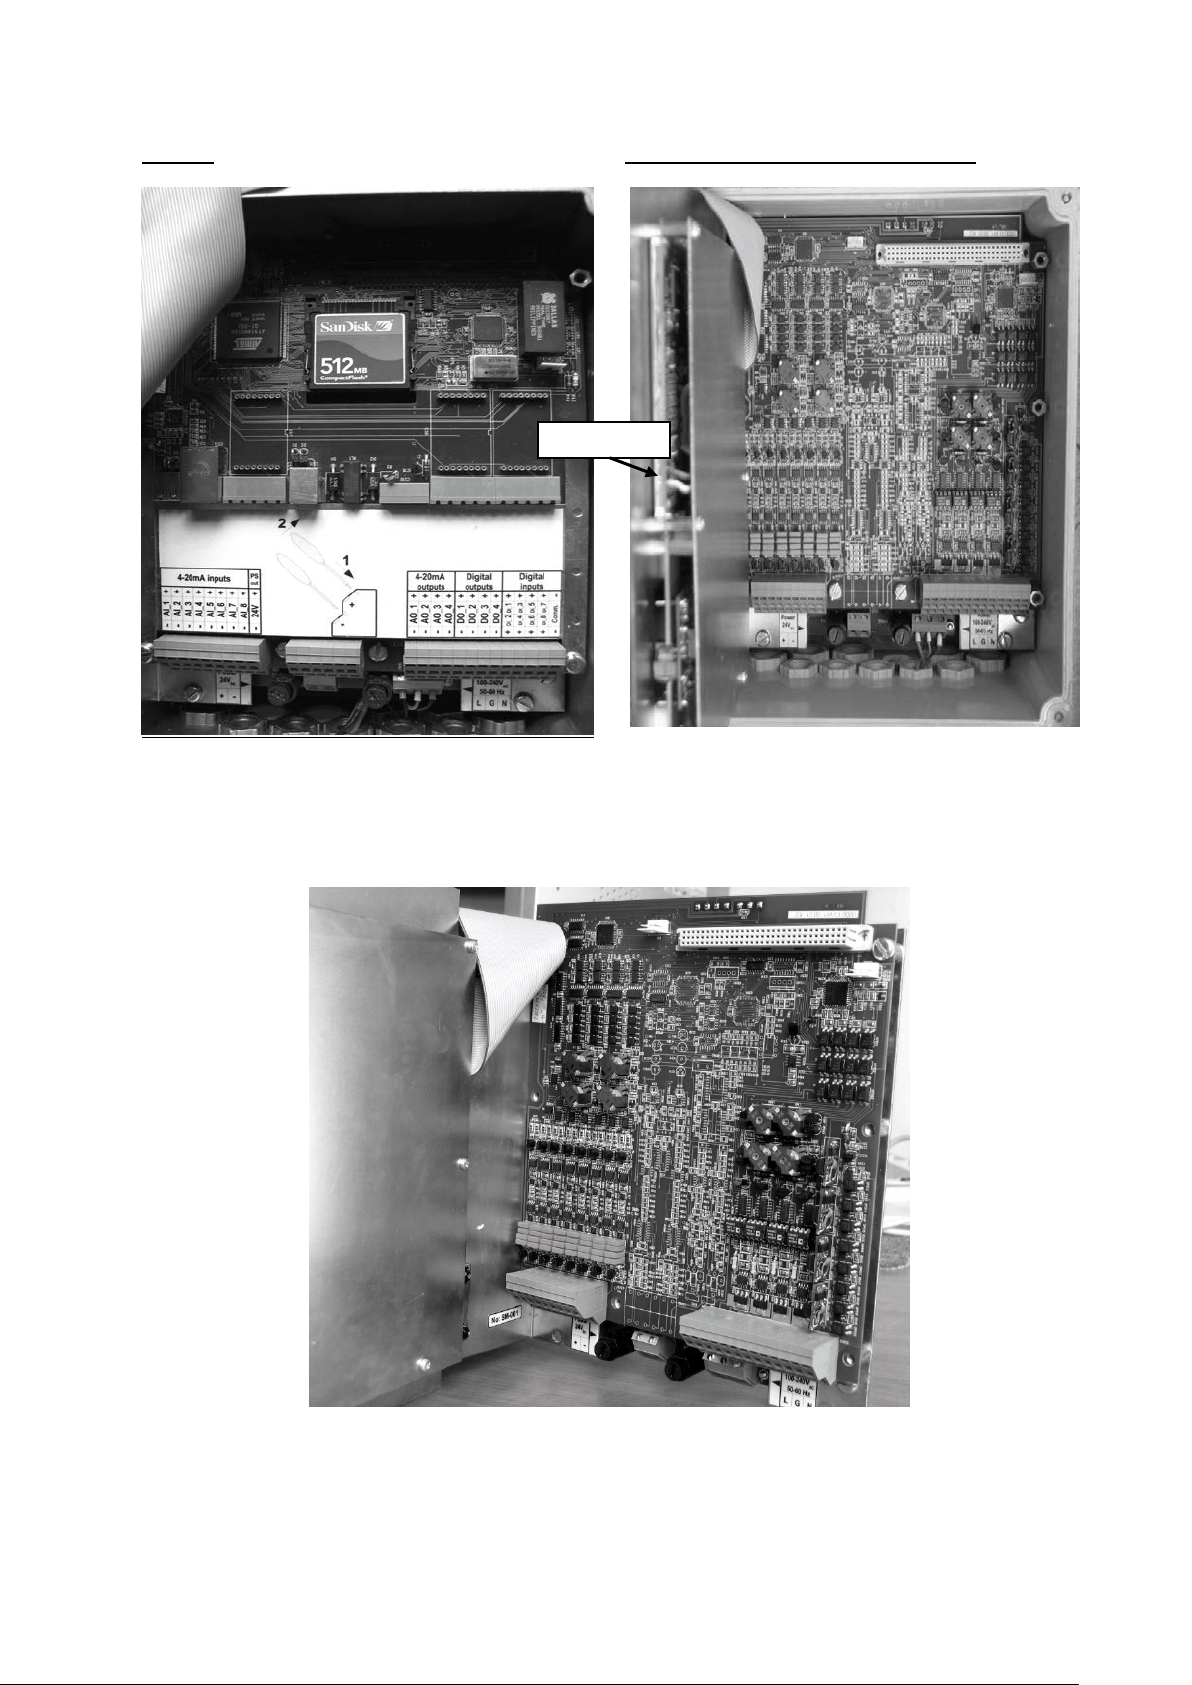
4 TECHNICAL DATA, MOUNTING AND ELECTRICAL CONNECTIONS
29
29
Front panel
Fig. 4.8 First metal plate removed
Memory The main circuit board in the enclosure.
Fig. 4.9 Front panel and the main circuit board
Fig. 4.10 Hardware removed
Page 30
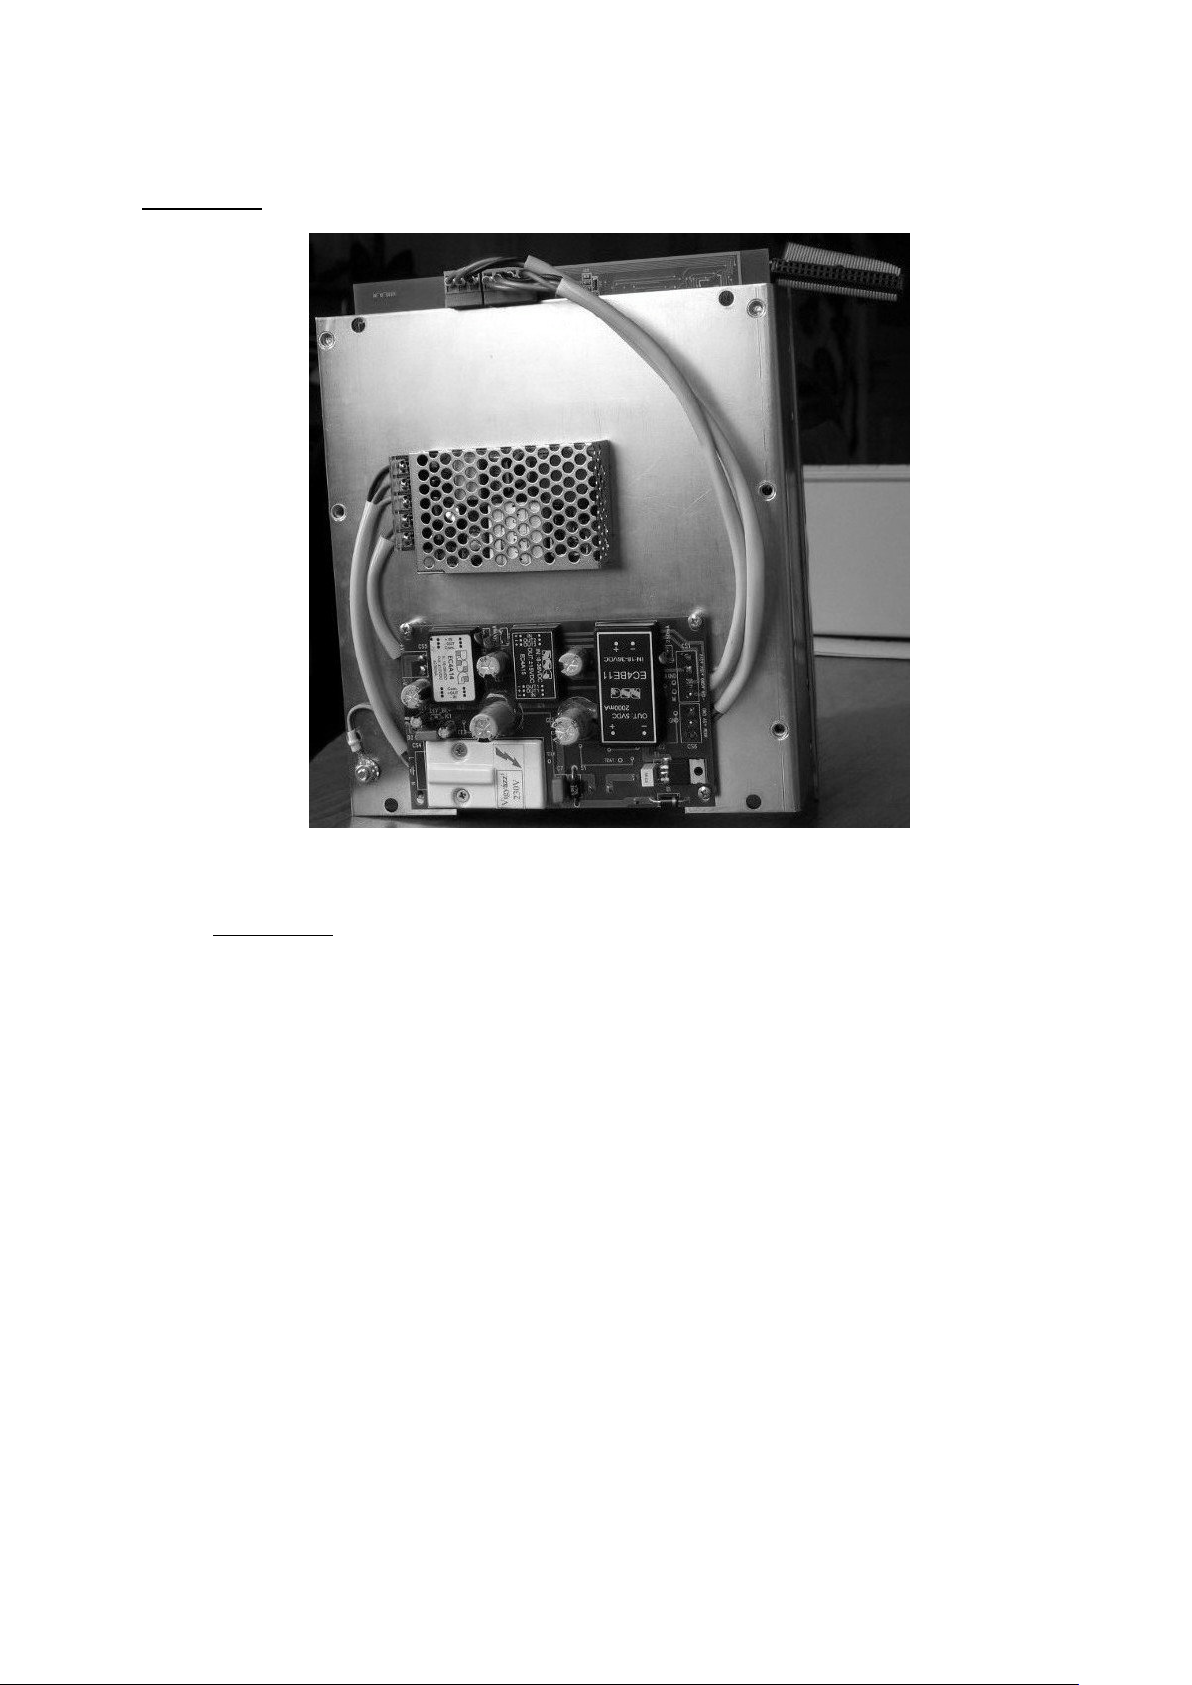
4 TECHNICAL DATA, MOUNTING AND ELECTRICAL CONNECTIONS
30
30
Power supply
Fig. 4.11 Power supply behind the main circuit board
Device status
There are 2 contact outputs which can be used to monitor the operation of SeedMaster 2. The 3
terminals are located in between the Com1 and Com2 serial port terminals.
Operating : Closed contact when operating
Common : The common electrical terminal.
Error : Closed contact when not in operation.
NOTE: the inputs + Sense and – Sense are not in use.
Page 31

6 START UP AND USE
31
31
5 SEEDMASTER 2 FEATURES IN BRIEF
5.1 SeedMaster 2: OPERATOR STATION features
SeedMaster 2 represents a new tool for the on-line, on-site monitoring of crystallizers. It can be used as a
local OPERATOR STATION providing a large range of valuable and until now un-available information for
the pan operator. See Chapter 9 for the details.
5.1.1 CONFIGURE
CONFIGURE operations are designed to customize SeedMaster 2 according to local circumstances and
preferences. This involves:
• handling the use of up to 3 different purity feed syrups in the same batch strike,
• selection of the “STRIKE ACTIVE” information,
• selection of the “THIRD INPUT”,
• seeding details,
• active instrument selection,
• password input,
• communication specification.
Details of the procedures are described in Chapter 7.
5.1.2 SET UP
SET UP operations are designed to customize SeedMaster 2 according to the particularities of the
application. This involves setting up the
• display,
• different types of inputs,
• digital inputs and outputs,
• analog outputs.
Details of the procedures are described in Chapter 8.
5.1.3 DISPLAY
DISPLAY operations present all of the available information (measured, calculated, history, trend and alarm
data, system and test information) in well organized, pre-designed forms, including:
• MAIN DISPLAY
• STANDARD DISPLAY
• TRENDS
• STRIKE HISTORIES
• SYSTEM INFORMATION
• TEST DATA
Details of the procedures are described in Chapter 9.
5.1.4 MANUAL OPERATIONS
There are two different types of manual operations, which can be performed by using the SeedMaster 2
keyboard
.
Manual seeding
In order to be able to cope with un-expected situations or due to local preference, it is possible to implement
MANUAL SEEDING of the pan any time the pan operator decides to do so, if he previous ly e nt e rs t he co rr ect
password.
The STRIKE HISTORY feature will document faithfully the supersaturation data, when MANUAL SEEDING
was implemented.
Details of the procedures are described in Chapter 9.
Page 32

6 START UP AND USE
32
32
Change feed syrup purity
If instead of a single one, 2 or 3 (maximum) feed syrups having different syrup purities are to be fed to the same batch strike the device m ust b e informe d on the execution of the change. This can be done by:
Selecting MANUAL OPERATIONS from the MENU followed by CHANGE FSYRUP and CHANGE. The operation will step the feed syrup number to the next one (from 1 to 2, then to the maximum 3). (For more information on feed syrup changes see: 3.6.3).
If a level transmitter is connected to the SeedMaster 2, using SETUP -> INPUTS -> FEED SYR. PUR up to 3
different purities and 2 level threshold data (where the change of purity should be made) can be selected from the
keyboard to implement automatic change of feed sy rup pur it y .
If a level transmitter is connected to the SeedMaster 2 up to 3 different purities and 2 level thresholds can be sent via COMMUNICATION to implement automatic change of fe ed syrup puri t y .
Finally, level, purity and level threshold data can all be sent via COMMUNICATION to implement automatic change of feed syrup purity.
5.2 SeedMaster 2: TRANSMITTER features
Besides providing all the features of an advanced OPERATOR STATION on site for the local operator,
SeedMaster 2 was designed to serve at the same time the needs of a Process Control System (PCS) as an
INTELLIGENT REMOTE TRANSMITTER.
5.2.1 Analog output
Selected measured and calculated data can be transmitted using the standard current outputs of
SeedMaster 2 (see Ch. 4, Fig. 4. 7). Specifications:
Standard current: 4 – 20 mA, or 0 – 20 mA (configurable)
Type of output: individual galvanic isolation
Load: 600 ohm max.
Number of outputs: 2x4
5.2.2 Digital data communication
SeedMaster 2 has advanced digital data communication features under the common name:
“COMMUNICATION”. It consists of
• 3 communication ports (COM1, COM2, COM3) with configurable standard (RS232, RS422, RS485)
features (protocols served: “K-PATENTS refractometer (PR-01-S)” and MODBUS SLAVE (ASCII,
RTU)), and
• 1 ETHERNET port (protocols: TCP / IP, MODBUS TCP a nd UDP / IP (“K-PATENTS refractometer
(PR-23-…)”.
By using advanced data communication it is possible to fill all of the two-way information flow requirements
between SeedMaster 2 and any type of computer or control system with a compatible network connection.
Details of the procedures are described in Chapter 11.
5.3 SeedMaster 2: SEEDING features
Seeding is a very critical operation which has a large effect on the final product parameters (see Ch. 2). It is
therefore highly recommended to make effective use of the AUTOMATIC SEEDING feature available with
SeedMaster 2.
Success of the seeding, however, depends on something else, too. It is natural that before opening the
seeding valve the seeding vessel must be filled with the correct volume of well-prepared and stirred slurry. In
order to avoid settling of the seed crystals, filling of the vessel should be carried out not long befor e actual
seeding. The operator or pan-man responsible for filling the vessel should be notified in time on approaching
seeding. It is possible to instruct SeedMaster 2 to give a warning (digital output DO1) when the selected
parameter (supersaturation or density) equals, or exceeds a “warning limit”, lower than the selected set-point
for seeding. Having reached the set-point for seeding digital output DO2 will be activated to open the seeding
valve for the selected (programmable) Ton time. At the same time DO1 will be turned off.
If the seeding vessel is furnished with a small motor driven stirrer, digital output DO1 can be used to turn the
motor automatically ON and OFF to prevent settling of the seeding crystals in the vessel.
Page 33

6 START UP AND USE
33
33
The warning on approaching seeding as well as the completion of seeding will appear on the MAIN
DISPLAY.
There are several ways to carry out seeding when using SeedMaster 2.
IMPORTANT NOTES:
1. It is the technologist’s responsibility to
• select the method of seeding (shock, or full, including the use of crystal footing), and
• the type (supersaturation, or density) and value of the set-point for seeding, too.
2. It is highly advised to use automatic seeding based on supersaturation.
3. When MANUAL SEEDING is carried out by using SeedMaster 2, the seeding valve will be open for
the same Ton time as when configured for automatic seeding.
5.3.1 Seeding based on DIGITAL INPUT DIN2
If configured so seeding will be carried out when digital input DIN2 becomes ACTIVE. The s ignal ma y come
from a relay contact, or from a manually operated switch. The seeding valve will be operated the same way
as it would if automatic seeding were configured.
NOTE:
DIN2 should remain ACTIVE for at least 20 seconds.
5.3.2 Seeding on a command from a PCS using digital communication
In this case SeedMaster 2 simply obeys a command from a PCS by opening the seeding valve the same way
as it would if automatic seeding were configured.
NOTE:
The command should remain AC T IV E for at least 20 seconds.
5.3.3 MANUAL seeding
Manual seeding might become necessary in some unusual cases. This can be done easily after entering the
correct PASSWORD any time, even if a different type of seeding was configured. Though not advised,
MANUAL seeding can be configured and used on a regular basis, too. See also 5.1.4.
NOTE:
STRIKE HISTORY will document the supersaturation data when seeding was carried out.
5.3.4 AUTOMATIC seeding based on SUPERSATURATION
Seeding of a crystallizer can be carried out by using supersaturation calculated by SeedMaster 2 on-line, an d
the set-point for seeding selected by the local technologist. When calculated data becomes equal to, or larger
than the supersaturation set-point, SeedMaster 2 will open the seeding valve for a selected time interval.
5.3.5 AUTOMATIC seeding based on DENSITY
Though seeding based on supersaturation is recommended, there are mills in operation where seeding
practice is based on density measurement. If wished, SeedMaster 2 is able to meet this requirement, too.
In this case density set-point for seeding should be used. STRIKE HISTORY will document supersaturation
data when seeding was carried out.
Page 34

6 START UP AND USE
34
34
6 START UP AND USE
6.1 Start up
It is recommended to complete electrical connections before switching SeedMaster 2 on.
WARNING:
Before switching SeedMaster 2 ON for the first time, check if the mains supply and instrument
voltage specifications are compatible.
When switched on by the mains switch it will take a minute or so until the name “SeedMaster 2” above a
sugar crystal drawing will appear on the LCD for a few seconds. It will be followed by the “MAIN DISPLAY”
showing data fields for 1or 2 crystallizers with, or without actual data.
The “MAIN DISPLAY” is the starting point for SeedMaster 2 CONFIGURATION AND SET UP.
NOTES:
1. There is no mains switch in the instrument! A separate one should be used.
2. It is recommended to prepare SeedMaster 2 for the actual application by starting with
CONFIGURATION followed by
SET UP
6.2 Default settings
There are a few settings which are used to ensure the correct operation of SeedMaster 2.
Frequency of calculations:
Massecuite parameters are calculated at 10 sec intervals for one or two crystallizers simultaneously. Timing
operations, like switching ON the seeding valve for a few seconds are independent from the frequency of
calculations.
Check of on-line data inputs / outputs:
Range excursions:
In order to decrease the effect of error in input and calculated data and to signal a blinking “Alarm”
accompanied by logging an “Event”, most of these are checked against their ranges of operation considered
“normal” during an ACTIVE strike, or the ACTIVE time of crystallization. These “normal ranges” are:
• Concentration (syrup / mother liqu or) 65 – 90 (%)
• Temperature (massecuite) 30 – 85 (˚C)
• Density (syrup / massecuite) 1250 – 1520 (kg/m)
• Solids content (syrup / massecuite) 65 – 95 (%)
• Level (optional) 0 – 100 (%)
• Supersaturation 0,7 – 2,0 (-)
• Consistency 0 – 100 (%)
• Syrup/mother liquor purity 50 – 100 (%)
• Crystal content (by volume) 0 – 65 (%)
Whenever the received or calculated data are out of range they will be replaced by the appropriate limit
values.
NOTES:
1. It is not possible to define a similar normal range in advance for motor current or power consumption,
because it can be normal in a small to any high limit range.
2. The temperature range is intended to cover cooling crystallization, too.
3. The “normal ranges” listed above can not be modified.
4. In ACTIVE mode instead of changing input data, displaying for a longer time one of the limits of its
normal range might be an indication of transmission failure.
5. It follows from the above that in STAND-BY mode (WAIT FOR START, WS on the MAIN
DISPLAY) displayed data may be out of their normal ranges, but these excursions are not signaled
as “Alarms” and are not logged in the “Events’ history” list.
Page 35

6 START UP AND USE
35
35
MAIN DISPLAY 1 / 0 . 1
SEED: SUPS.
=1 . 1 2 AUT STRT: 0
m WS
SUPS. 0 . 0 0 LI. PUR. 0 . 0 %
DENS. 0 kg/m3 LI. CONC. 0 . 0 %
MA. SOL. 0 . 0 % MO. CONS. 0 . 0
CR. CT. 0 . 0 % TEMP. 0 . 0 C
CONSIST. 0 . 0 % CR. SIZE 0 . 0 0 mm
MENU
Alarms
Input and calculated data are monitored and checked against two configurable limit values (High Limit, Low
Limit) in order to detect, signal (“Alarm” LED) and log alarm excursions in the “Events’ history” during an
ACTIVE strike.
Password
Default and “Escape code ” 0000
Seeding parameters
• Seeding valve open (Ton) time 5 sec
• Syrup quality (“m”, “b”, “c”) parameters “Typical cane”
• Type of seeding AUTO ON SUPERSAT.
• Warning on seeding (supersaturation) 0.9
6.3 Device configuration
Whenever SeedMaster 2 is switched ON, the MAIN DISPLAY will come up. Later on it can be accessed any
time by using the
• ESCAPE
key of SeedMaster 2.
Fig. 6.1 shows one of the MAIN DISPLAY versions from the 3 possible ones. When switched ON, depending
on the history of previous CONFIGURATION and SET UP operations and the present strike status, small
differences in the displayed data can be observed. The figure shows a version valid for an in-active strike
(WS: WAIT FOR START of a new strike). In this case there are no calculations in progress, therefore all data
are set to zero. Already configured syrup purity (LI. PUR.: liquor purity) together with concentration and
temperature data from an already connected refractometer are displayed.
Fig. 6.1
CONFIGURATION and SET UP can be initiated from the MAIN DISPLAY by using the MENU soft-key. For
details see Chapter 7.
6.4 Basic key operations
The 18 keys on the face-plate of SeedMaster 2 can be accessed after opening the front door of the
enclosure.
NUMBER (0…9) and SIGN ( - ) KEYS
These are used to enter the selected parameters.
ENTER
Use it to close a data entry operation.
Page 36

6 START UP AND USE
36
36
ESCAPE
It is used to return to the MAIN DISPLAY and to clear mistyped numbers.
SOFT KEYS
The 4 soft keys (F1…F4) fill different roles according to their names displayed just above them on the LCD.
They are used in selecting a branch of the selection tree (for example: DISPLAY, SET UP, CONFIG. etc.), in
moving backwards (BACK), and in selecting and accepting a data value or input signal type from an offered
few (CHANGE and ACCEPT).
1 : Selects Instrument No.1. The selected instrument number is backlit.
2 : Selects Instrument No.2. The selected instrument number is backlit.
UP/DOWN ARROW : Selects an item.
LEFT ARROW : One step back on the selection tree.
Moves the cursor left in a trend, or stops it when moving right. Stops
the cursor when moving left.
RIGHT ARROW : Enters the selected item.
Moves the cursor right in a TREND, or stops it when moving left.
Stops the cursor when moving right.
LEFT/RIGHT ARROW : Moves the cursor when entering data.
CHANGE : Modifies the current selection.
ACCEPT : Identical to ENTER (will appear only after a CHANGE).
BACK : One step back on the selection tree.
If used before ACCEPT or ENTER, returns the previous data.
ZOOM : Displays a trend in full size if only one signal is selected in TREND.
ENTER : If 2 signals are selected for TREND, pushing ENTER will ZOOM
Trend 1 to full size. Keying 2 (membrane key) on the keyboard will
ZOOM Trend 2 to full size. Pushing 1(membrane key) will bring
back Trend 1 again (in full size).
SELECT : SELECT a signal for TREND.
DOWN ARROW : Displays a selected TREND of the previous strike down to
Actual - 3.
UP ARROW : Displays a selected TREND of the next strike up to the Actual one.
ACK : ACKNOWLEDGE events.
RESET : Resets the 2 communication error counters.
Page 37

7 CONFIGURE SeedMaster 2
37
37
MAIN DISPLAY 1 / 0 . 1
SEED: SUPS.
=1 . 1 2 AUT STRT: 0
m WS
SUPS. 0 . 0 0 LI. PUR. 0 . 0 %
DENS. 0 kg/m3 LI. CONC. 0 . 0 %
MA. SOL. 0 . 0 % MO. CONS. 0 . 0
CR. CT. 0 . 0 % TEMP. 0 . 0 C
CONSIST. 0 . 0 % CR. SIZE 0 . 0 0 mm
MENU
1 / 1 /
Menu Manual seeding Menu Strike active signal
Display Third input
Set up Configuration Seeding
Configuration Active instrument
Password
Communication
7 CO NFIGURE SeedMaster 2
7.1 Start configuration
CONFIGURATION can be accessed from the MAIN DISPLAY :
Fig. 7.1
NOTES:
1. The upper half and the lower one of the LCD are distinguished as Instrument No.1, or I1, and Instrument
No.2, or I2, implemented by SeedMaster 2, respectively.
2. On first switch-on, by default, only I1 (the upper half of the LCD) is selected. It is signalled by the backl it
area in the upper right corner (1 / XXX, where 1 is the instrument number, and XXX is the TAG of the
crystallizer). The TAG can be specified during the Menu -> Set up -> Display operation.
3. Having already configured 2 active instruments, for operations with the second one push key 2 first. A
similar area (2 / YYY) in the lower half of the LCD will be backlit showing the instrument selection. Key 2 will
be backlit, too. Having selected the instrument or crystallizer, pushing MENU leads to the details of
instrument configuration (Fig. 7.2).
Fig. 7.2
The items can be accessed by using the UP or DOWN ARROW.
NOTE:
For information on the different KEY-s and KEY-OPERATIONS see: Ch. 6.4 Basic key operations.
7.2 Organizing SeedMaster 2 Input / Output traffic
The operation of SeedMaster 2 relies on the use of different types of data inputs. One group of the inputs
contains data measured on-line (real-time inputs), while another group contains different parameters. It is
possible to send commands, or control signals (Start of strike, Seeding) to the device, too.
SeedMaster 2 outputs are measured and calculated data (real-time outputs), parameters and digital (ON /
OFF) outputs.
Page 38

7 CONFIGURE SeedMaster 2
38
38
Fig. 7.3 SeedMaster 2 I / O traffic
SeedMaster 2 I / O traffic consists of the following types:
• analog I / O (AI, AO),
• digital I / O (DI, DO),
• digital communication (serial using the COMX ports, Ethernet),
• manual entry using the Keyboard (KEYB).
Page 39

7 CONFIGURE SeedMaster 2
39
39
Application examples
1.) Basic (or "stand alone") application, handling a single pan using a PR-01-S refractometer.
Automatic seeding by Seedmaster 2.
Option: SeedMaster 2 analog current outputs connected to a monitoring PCS.
SeedMaster 2
Start of strike Seed warning
Seeded
DI1…8 DO1…4
Seeding valve
Change syrup
COM1…3
PR-01-S
.
3rd input AO1…4
.
PCS
AI1…8
.
Option
SeedMaster 2 inputs:
concentration COM1…3
temperature
3rd input AI1…8
SeedMaster 2 outputs (option):
up to 4
calculated
or measured AO1…4
parameters
Due to the large flexibility resulting from the use of the above resources, a large number of I / O combinations
can be realized. Fig. 7.3 shows the basic I / O traffic organization of SeedMaster 2.
SeedMaster 2 relies on the use of process refractometers manufactured by K-PATENTS OY, Finland. The
main data output features of the presently available K-PATENTS refractometers can be summarised as
follows:
Refractometer: Analog output: Communication Communication
(4 – 20 mA) (RS232, RS422, RS485) (Ethernet)
PR-01-S 1 YES, 1 port NO
(single sensor) + 1 (option)
PR-23- … 2 NO YES
(2 sensors)
SeedMaster 2 is prepared to be used with any combination of K-PATENTS process refractometers and can
be readily integrated in a Process Control System (PCS) with compatible I / O data traffic (analog, digital I /
O, and / or digital data communication) features.
Page 40

7 CONFIGURE SeedMaster 2
40
40
2.) Basic (or "stand alone") application, handling 2 pans using a PR-23-... refractometer
with 2 sensor heads. Automatic seeding by SeedMaster 2.
concentration (A) & (B)
3.) SeedMaster 2 integrated in a PCS. Parameters and commands come from the PCS using MODBUS
communication. Automatic seeding by the PCS based on data from Seedmaster 2.
SeedMaster 2 Seed warning
COM COM1…3
PR-01-S
COM1…3, OR Ethernet
PCS
AI1…8
3rd input
Seeding valve
SeedMaster 2 inputs:
concentration COM1…3
temperature
3rd input: AI1…8, or COM1…COM3 (MODBUS) or Ethernet (MODBUS)
Commands, parameters from the PCS: COM1…COM3 (MODBUS) or Ethernet (MODBUS)
SeedMaster 2 outputs: COM1…COM3 (MODBUS) or Ethernet (MODBUS)
Option: Monitoring SeedMaster 2 inputs / outputs on a PCS using MODBUS serial communication.
Start of strike (A)
Seeded (A)
Change syrup (A) Seeding valve (A)
Pan 1 3rd input (A)
Sensor (A)
Ethernet COM1…3 PCS
PR-23-…
Sensor (B)
Start of strike (B)
Pan 2 Option
Seeded (B)
SeedMaster 2
Seed warning (A)
DI1…8 DO1…4
AI1…8
Seed warning (B)
DI1…8
Change syrup (B) DO1…4
AI1…8 Seeding valve (B)
3rd input (B)
SeedMaster 2 inputs:
Ethernet (K-PATENTS UDP / IP)
temperature (A) & (B)
3rd input: (A) & (B) AI1…AI8
Seedmaster 2outputs (option):
monitoring on a PCS, COM1…3
Page 41

7 CONFIGURE SeedMaster 2
41
41
4.) Using different types of refractometers. SeedMaster 2 data are sent to and parameters are received from a PC
MODBUS TCP communication. Automatic seeding by SeedMaster 2.
SeedMaster 2
Concentration (1)
Seed warning (1)
PR-01-S
Temperature (1)
DO1…4
Pan 1 AI1…8
Seeding valve (1)
3rd input (1)
Seed warning (2)
3rd input (2)
Seeding valve (2)
Ethernet
Sensor (A)
Ethernet
Ethernet
Pan 2
PR-23-… Switch module PCS
SeedMaster 2 inputs:
Pan 1 c oncentration (1)
temperature (1)
3rd input (1)
AI1…8
Pan 2 3rd input (2)
concentration (2)
temperature (2) Ethernet (K-PATENTS UDP / IP)
Commands and parameters from the PCS: Ethernet (MODBUS TCP)
SeedMaster 2 outputs: Ethernet (MODBUS TCP) :
NOTE:
To select the required mode of data entry / output key CHANGE followed by ACCEPT.
Selecting digital COMMUNICATION
If COMMUNICATION was selected, it is the user’s responsibility to send the required data via the selected
communication interface (see: Ch. 11.). Example: feed syrup purity will be sent by a PCS using digital data
communication:
PURITY COMMUNICATION
COMMUNICATION 94.7 %
Selecting KEYBOARD (KEYB)
If KEYBOARD (KEYB) was selected, then parameter data can be entered in the next line by using the
keyboard of the instrument. Example:
PURITY KEYBOARD
KEYBOARD 94.7 %
All data measured on-line can be accessed on the MAIN DISPLAY.
Fig. 7.4 Application examples
Page 42

7 CONFIGURE SeedMaster 2
42
42
CONFIG. -> STRIKE ACTIVE SIGNAL
1 /
STRIKE ACTIVE SIGNAL MOTOR ON / OFF
MOT. CUT-OFF CONS.
KEYBOARD
KEYBOARD 15
%
CHANGE
BACK
ACCEPT
7.3 Configuring the STRIKE ACTIVE signal
As already discussed (see: Ch. 3.3 and Fig. 3.4) the program of SeedMaster 2 can operate in the STANDBY, or in the ACTIVE mode, which are synchronized to crystallizer operations. Start of syrup feed followed by
the actual crystallization in a vacuum pan ending with the discharge of the massecuite (a “strike”) is the
ACTIVE part of the process, while the time in between two strikes (cleaning of the pan, waiting) is spen t in
STAND-BY mode by the instrument program (see Fig. 3.4). There are 3 different ways to inform SeedMaster
2 on strike status by using:
1. MOTOR ON / OFF
2. DIN1 digital input
3. COMMUNICATION
The requested mode can be selected by keying CHANGE followed by ACCEPT.
MOTOR ON/OFF
The strike (crystallization) is regarded ACTIVE whenever the motor consumption (current or power, type
is configurable) exceeds the configured MOTOR CUT-OFF CONSUMPTION (configurable). Naturally, if there
are no measured (real-time) data on motor consumption available, this type of program activation can not be
used.
MOT. CUT-OFF CONS. is the minimal value of consumption needed to consider the strike ACTIVE. It must
be specified as % of the RANGE HIGH limit selected during Set up -> Inputs (see Ch. 8.2). Acceptable limits
are: 10….70 %.
The selectable sources of MOTOR CUT-OFF CONSUMPTION data are:
• KEYBOARD (manual data entry), or
• COMMUNICATION.
NOTES:
1. Before trying to enter MOT. CUT-OFF CONS. data, specify its RANGE HIGH limit first in Set up -> Inputs.
2. Every motor switch ON means the START and every motor switch OFF means the END of a strike
or active crystallization process.
3. Un-intentional STOP of the motor (for example: loss of power) results in the END of the strike.
Fig. 7.5
The example in Fig. 7.5 shows configuration details, when the MOT. CUT-OFF CONS. data is entered
manually (source: KEYBOARD).
DIN1 DIGITAL INPUT
DIN1 is the name (and not the physical channel number) of a digital input dedicated solely to strike activation.
Its source can be connected to anyone of the available digital input channels. Channel selection and the
ACTIVE state of the input can be defined during SET UP DIGITAL I/O (for the details see Ch. 8.3.). For the
types of acceptable digital inputs and how to connect them see Fig. 4.8.
COMMUNICATION
The STRIKE ACTIVE signal might come via digital data communication from a Process Control System
(PCS). The signal is a fixed floating point number equal to ONE (1).
STRIKE ACTIVE : ONE (1)
STRIKE IN-ACTIVE: ZERO (0)
NOTE:
In both cases the STRIKE ACTIVE signal must remain ACTIVE from the start till the end of the strike.
Page 43

7 CONFIGURE SeedMaster 2
43
43
7.4 THIRD INPUT
MAIN DATA INP UT REQUIREMENTS.
SeedMaster 2 relies on the use of on-line process data.
Besides the two obligatory data:
• syrup / mother liquor concentration measured by the refractometer, and
• massecuite temperature
it is advised to use a third on-line input, too.
The primary source of this input may be a standard current transmitter measuring
• massecuite density, or
• massecuite solids content, or
• stirrer motor current or power consumption (power is preferred).
As a last resort (if none of the above is available):
• a single data on crystal content of the massecuite (% by volume) at the end of the strike
determined by the local laboratory can also be used.
On-line data from anyone of the above 3 transmitters are preferred.
Standard current transmitters can be connected directly to SeedMaster 2 using one of its analog input
channels, or to a Process Control System (PCS). In this case measured data can be transmitted to
SeedMaster 2 from the PCS via digital data communication.
OPTIONAL DATA INPUT REQUIREMENT: massecuite level.
Handling the use of different feed syrup purities in the same batch strike.
In some cases feed syrup purity is not constant during a batch strike. The strike is started with a feed syrup
having purity P1, then later on it is continued with an other (P2), and may be it is finished with the last one
(P3), where purities are gradually decreasing (P1 > P2 > P3). In practice the change from one feed syrup to
the next one is carried out when level in the pan reaches some selected limit value. This can be based on
real measured (on-line) data, or if it is not available, on the visual observation of the pan operator. The actual
change of the feed syrup (operating the feed valves) can be implemented either by a PCS, or by the pan
operator.
Supersaturation, the most important parameter of crystallization depends on syrup / mother liquor purity,
therefore changing feed syrup purity should be taken into account.
SeedMaster 2 is prepared to handle the situation in different ways, and, as a result, with different
sophistication depending on the availability of the on-line measurement of massecuite level. It is therefore
important to provide information during configuration on the availability of on-line level data.
If available, level data are used in other calculations as well.
During configuration of THIRD INPUT a question on level measurement (LEVEL MEAS. YES / NO) has to
be answered and the type of input selected (in SET UP INPUTS). If the answer was NO, then instead of
LEVEL data CR. SIZE (mean size) will be displayed on the MAIN DISPLAY.
When on -line level data are in use, information on mean crystal size is still available: go to Display -> Trend
and select CRYSTAL SIZE.
7.4.1 Third input: MASSECUITE DENSITY or MASSECUITE SOLIDS CONTENT
Fig. 7.6 shows “Third input” configuration, when MASSECUITE DENSITY and SENSOR CALIBRATION
(YES) were selected.
Page 44

7 CONFIGURE SeedMaster 2
44
44
CONFIG. -> 3RD INPUT
1 / CO NFIG. -> 3RD INPUT -> MA. DENS.
1 /
SENSOR CALIBRATI ON YES
3RD INPUT: MASSECUITE DENSITY
SEED CRYSTAL SIZE KEYBOARD
KEYBOARD 0 . 0 1 mm
PRODUCT CRYSTAL SIZE KEYBOARD
KEYBOARD 0 . 6 5 mm
LEVEL MEAS.
KEYBOARD
KEYBOARD YES
LENGTH OF CRYST. TIME 1 0 6 min
CONC. (REFR., SEED.) KEYBOARD
KEYBOARD 7 9 . 4 %
CONC. (REFR., STR. END) KEYBOARD
KEYBOARD 8 0 . 4 %
MA. DENS. (SEED.) 1 4 1 0 kg / m 3
CHANGE
BACK
ACCEPT
CHANGE
BACK
ACCEPT
a) b)
NOTE:
Where the source of data is marked as KEYBOARD, data can be entered or modified directly in the same
line.
Sensor calibration
After having selected the input, a question about “Sensor calibration” has to be answered. Density of the
syrup up to seeding (no crystals as yet) can be calculated with high accuracy (referred to 20 °C reference
temperature) based on syrup concentration data provided by the refractometer. In most cases in practice this
will be somewhat different than the density measured by a less accurate density probe. The same way
density of the massecuite at the end of the strike can be calculated based again on measured mother liquor
concentration and crystal content (% by volume, determined by the laboratory) data. In most cases it will also
be a little or more different than the density measured by the density probe.
If the answer to SENSOR CALIBRATION was YES, then the data in these two points (seeding and end of the
strike) can be used to modify the density data measured during the complete strike by the density probe in
order to have a better match of data in these two end-points. However, if the answer was NO, the original
density data will be used. In this case some of the parameters are not required (these will not appear).
Third input: MASSECUITE DENSITY
The complete list of parameters:
Parameters: Remarks:
SEED CRYSTAL SIZE Mean crystal size data is required (mm).
PRODUCT CRYSTAL SIZE Mean crystal size data is required (mm).
LEVEL MEAS. YES /NO.
LENGTH OF CRYST. TIME Time from seeding till end of strike (min). Only if previous answer was NO.
CONC. (REFR., SEED) Concentration (refr.) in the seeding point (%).
CONC. (REFR., STR. END) Concentration (refr.) at the end of strike (%).
MA. DENS. (SEED.) Density measured by the density probe in the seeding point (kg/m3).
MA. DENS. (STRIKE END) Density measured by the density probe at the end of strike (kg/m3).
CR. CONT. (LAB, SEED.) Crystal content by the lab in the seeding point, in % by vo lume, if crystal
footing is used, in other cases: 0 %.
CR. CONT. (LAB, STR. END) Crystal content measured by the lab in % by volume at the end of strike.
VOLUME RATIO Ratio of full to seeding massecuite volume.
NOTES:
1. The last item (CR. CONT. (LAB., STR. END)) should be specified in SET UP -> INPUTS. It can not be
entered, or changed here. It is automatically listed here (if specified) for completeness.
2. If the answer to LEVEL MEAS. was YES, PAN MAX. LEVEL (%) will replace LENGTH OF CRYST. TIME.
The procedure is similar if instead of MASSECUITE DENSITY MASSECUITE SOLIDS CONTENT was
selected as “Third input”.
Fig. 7.6
Page 45

7 CONFIGURE SeedMaster 2
45
45
P (kW) P (kW)
PHASE 1 END PHASE 1 END
PHASE 1 PHASE 1
0 1 2 3 4 Time 0 1 2 3 4 Time
Third input: MASSECUITE SOLIDS CONTENT
Parameters: Remarks:
SEED CRYSTAL SIZE Mean crystal size data is required (mm)
PRODUCT CRYSTAL SIZE Mean crystal size data is required (mm).
CR. CONT. (LAB, STR. END) Crystal content by the lab at the end of strike (% by volume).
LEVEL MEAS. YES / NO
LENGTH OF CRYST. TIME Time from seeding till end of strike (min). Only if previous answer was NO.
CONC. (REFR., SEED) Concentration (refr.) in the seeding point (%).
MA. SOL. (LAB, STR. END) Massecuite solids content measured by the lab at the end of strike (%).
MA. SOL. (SEED.) Massecuite solids content measured by the solids content measuring
instrument in the seeding point (%).
MA. SOL. (STR. END) Massecuite solids content measured by the solids content measuring
instrument at the end of strike (%).
NOTE:
If the answer to LEVEL MEAS. was YES, PAN MAX. LEVEL (%) will replace LENGTH OF CRYST. TIME.
7.4.2 Third input: MOTOR CONSUMPTION
PRINCIPLE OF OPERATION
Using the current or power consumption (power is preferred) as “Third input” for SeedMaster 2 offers the
least expensive solution, because only an inexpensive (probably already existing) current or power
transmitter is required.
The current or power consumption of a motor driving the stirrer in a vacuum pan depends on the viscosity /
consistency of the syrup or massecuite.
Viscosity is the property of a liquid (in this case: sugar syrup, or mother liquor), characterized by the force
acting against movement depending on the solution concentration and temperature.
Consistency is the property similar to viscosity of a mixture of a liquid and solid particles (in this case:
massecuite), depending again on solution concentration, temperature and solids (in this case: crystal)
content.
When crystal content is low, consistency barely exceeds the viscosity of the surrounding mother liquor.
Increasing crystal content, however, increases massecuite consistency, which exceeds several times liquid
viscosity. The consistency over viscosity ratio at the end of a strike can increase up to 25-30. This proves the
statement that as crystallization proceeds, the output of a consistency probe used in sugar crystallization
control is governed more and more by increasing crystal content.
The trend of motor power consumption versus time in Fig. 7.7 shows the change of viscosity (up to point 1)
and consistency (from point 1 to pan discharge) as reflected in motor power consumption. In the figure:
0 Start of strike (motor switched ON)
1 Seeding
2 Crystal content is about 20-25 (% by volume), (PHASE 1 END)
3 Crystal content is about 32-36 (% by volume)
4 End of strike (motor switched OFF)
a) b)
Fig. 7.7 Typical trends of single-speed motors
In Fig. 7.7 a) motor power from point 0 to 1 (the time needed to concentrate the syrup for seeding) is
characterized by only a small increase in motor power. From point 1 to 2 crystal content increases to about
20-25 %. It is reflected in very slowly increasing power consumption. Between points 2 and 3 crystal growth
begins to increase more rapidly, faithfully reflected in the power consumption. Finally, from point 3 crystal
Page 46

7 CONFIGURE SeedMaster 2
46
46
P (kW)
PHASE 2 START
PH. 2
PHASE 1 Low
High speed speed
Time
growth (by volume) becomes really fast, resulting in sharply increasing power consumption up to the end of
the strike (point 4).
Fig. 7.7 b) shows another similar trend, which differs from the previous one only in its 0 to point 1 section. In
this case it is interesting to observe, that having completed seeding of the pan (point 1), despite an expected
increase a considerable drop in motor consumption can be observed. This kind of change can be attributed
to a fairly thin layer of syrup flow above the calandria during syrup concentration (from 0 to 1), which
becomes wider as soon as syrup feed increases just after having seeded the pan, resulting in the observed
drop in consumption.
Finally, in Fig. 7.8 typi cal motor consumption trend is shown, when the stirrer motor operates at 2 different
speeds.
Fig. 7.8 Typical trend of a double-speed motor
Summary:
1. When stirrer motor consumption is being used as “THIRD INPUT”, its actual use can start only after
point 2, that is when crystal content has already increased at least to some low limit value.
2. From the start of a strike up to seeding (“Syrup concentration”, 0 to 1) there is no need for any
“THIRD INPUT”. Concentration from the refractometer and temperature data are enough to
calculate all output parameters.
3. During the period of “Graining” (1 to 2), or during the “High speed” operation in case of a double-speed
motor, an involved simulation of crystal growth is being used to calculate all required output
parameters.
4. During “Boiling” (2 to 3), and “Boiling up” (3 to 4), or “Low speed” operation in case of a double-speed
motor, motor consumption data are used effectively.
5. Having completed the strike the SeedMaster 2 program, by making use of data acquired at the end of
the strike, adapts some parameters to be used in the next strike during the crystal growth
simulation.
NOTE:
The use of stirrer motor power or current consumption as “Third input” is limited to batch vacuum
pans operating without strike cut(s), that is without discharging some part of the massecuite before
the end of the strike. The trend of motor consumption data should look like one of those shown in
Fig. 7.7 or Fig. 7.8.
CONFIGURATION
Configuration needs 17 data presented by scrolling the parameters on the screen. These are used to
calculate the last 2 parameters listed at the end of the parameter list.
• To select the appropriate parameter use the UP/DOWN ARROW (scrolling).
• To select YES or NO use CHANGE.
• After entering / changing data use ACCEPT, or ENTER.
Terminology:
PHASE 1 END : This is the END of the first section (phase) of the strike, during which motor
consumption data are useless (point 2 in Fig. 7.7).
PHASE 2 START : START of low-speed operation, when a double speed motor is being used.
Typical crystal content: 35…45 % by volume (Fig. 7.8).
Page 47

7 CONFIGURE SeedMaster 2
47
47
CONFIG. -> 3RD INPUT -> MOT. CONS.
1 /
SINGL E
M. CONS. (PH. 1 END) KEYBOARD
KEYBOARD 3 . 3 kW
CR. CONT. (PH. 1 END) KEYBOARD
KEYBOARD 2 5 %
MOT. CONS. (STRIKE END) KEYBOARD
KEYBOARD 7 . 1 kW
LEVEL MEAS. KEYBOARD
KEYBOARD YES
PAN MAX. LEVEL KEYBOARD
KEYBOARD 7 7 %
CONC. (REFR., PH.1 END) KEYBOARD
KEYBOARD 8 0 . 2%
PREV. ACCEPT BACK
1 / 2 SPEED
ACCEPT
CHANGE
BACK
ACCEPT
Fig. 7.9: The first page of configuration
NOTE:
1. All parameters can be entered by manual entry (KEYBOARD), or via digital data communication.
2. CR. CONT. (PH. 1 END) and FEED SYRUP PURITY have to be entered in Set-up -> Inputs.
Depending on the answer given to the first question (1 / 2 SPEED) naming of some parameters may be
different.
MOTOR: SINGLE SPEED
Parameters: Range: Notes:
1 / 2 SPEED SINGLE (single speed motor, see Fig. 7.7)
MOT. CONS. (PH. 1 END) 0 < VALUE Motor consumption at PHASE 1 END
must be larger than zero (A, or kW).
CR. CONT. (PH. 1 END) 10 – 45 % This is the laboratory crystal content at
PHASE 1 END. Typical value: 25 % by
volume (point 2 in Fig. 7.7).
MOT. CONS. (STRIKE END) 0 < VALUE Motor consumption at the end of the
strike, must be larger than zero (A, or kW).
LEVEL MEAS. YES /NO Level measurement is optional. If the answer
was NO, then instead of LEVEL data CR.
SIZE (mean size) will be displayed on the
MAIN DISPLAY.
PAN MAX. LEVEL 40 – 100 % Only if YES was selected above.
CONC. (REFR., PH. 1 END) 65 – 95 % Concentration measured by the refracto meter at PHASE 1 END.
CONC. (REFR., STR. END) 65 – 95 % Concentration measured by the refracto meter at the end of the strike.
TEMP. (REFR., PH. 1 END) 30 - 85 ˚C Temperature measured by the refracto meter at PHASE 1 END : only if the motor
operates with SINGLE speed.
TEMP. (REFR., STRIKE END) 30 - 85 ˚C Temperature measured by the refractometer
at the end of strike or cooling crystallization.
CR. CONT. (STRIKE END) 0 - 60 % Crystal content at the end of the strike
(% by volume). It must be specified in
Set up -> Inputs, and can not be entered
or modified here.
SEED CRYSTAL SIZE 0.005 – 1,5 If shock, or full seeding is practiced 0.01
mm is typical. The range covers the typical
values when crystal footing (magma) is used
for seeding.
PRODUCT CRYSTAL SIZE 0.03 - 6 Size in mm.
LENGTH OF CRYST. TIME 30 – 420 min Length of the real time of crystallization
(from seeding to the end) in minutes. After the
1
be accessed by going to DISPLAY -> TEST > OTHER DATA
st
strike the time of the last crystallization can
Page 48

7 CONFIGURE SeedMaster 2
48
48
AVERAGE SUPERSAT. 1< VALUE From seeding to the end of strike. After the
1st strike average supersaturation during the
the last strike can be accessed by going to
DISPLAY -> TEST - > OTHER DATA, or use
the STRIKE HISTORY screen.
FEED SYRUP PURITY 55 – 100 % It must be specified in Set up -> Inputs,
and can not be entered or modified here.
BIAS CR. CONT. - 5…+ 5 % Crystal content bias in % (by volume).
Effective only above 46 %. Can be used
to adjust calculated data to the final crystal
content data determined by the laboratory,
MOTOR CAL. PARAM. 0 - 100 The “Motor calibration parameter” will be
automatically recalculated whenever motor
consumption, concentration, or temperature
data are changed. Though it is possible to
enter manual data, it is advised to use the
data calculated by SeedMaster 2.
CRYST. PARAMETER 0 – 1,5 The “Crystallization parameter” will be auto-
matically recalculated if parameters governing
crystallization are changed. Though it is
possible to enter manual data, it is advised to
use the data calculated by SeedMaster 2.
This parameter might be slightly modified by
the SeedMaster 2 program itself from strike to
strike (adaptation).
MOTOR: DOUBLE SPEED (HIGH followed by LOW SPEED operation, see Fig. 7.8)
If right at the beginning DOUBLE SPEED was selected for the motor, the procedure will be very similar. The
only exception: instead of parameters valid at PH. 1 END, when single speed was selected, the same
parameters valid at PH. 2 START should be used.
NOTES:
Most of the parameters listed above are self-explanatory. Some of them, however, need further explanation.
In this case PHASE 1 means the part of crystallization when the motor is not used as a sensor. Calculated
data are based on crystal growth simulation.
CR. CONT. (PH. 2 START): This is the crystal content just after changing the motor speed to LOW. It should
be determined by the laboratory.
CRYSTAL CONTENT data (% by volume) should be determined by the laboratory.
MOTOR CONSUMPTION data in different points of crystallization: these data can be easily determined by
using the DISPLAY -> TREND -> THIRD INPUT (MOTOR CONSUMPTION) trend of a strike. It is advised
to check and modify consumption data when starting a new campaign, or doing maintenance work on the
drive chain of the stirrer.
CONCENTRATION and TEMPERATURE data in different points are displayed on the refractometer LCD, or
their trends can be used.
LENGTH OF CRYSTALLIZATION TIME and AVERAGE SUPERSATURATION (from seeding till the end of
the strike) can be determined or estimated several ways: use their trend curves, go to DISPLAY-> TEST > OTHER DATA or to STRIKE HISTORY.
IMPORTANT:
It is important that the parameters should be determined based on data of the same strike. It is
advised to do a complete check of the parameters at least once at the start of a new campaign. Once
entered, only changing data (for example: feed syrup purity, crystal size etc.) should be modified.
This will result in the automatic recalculation of the CRYSTALLIZATION and / or MOTOR
CALIBRATION PARAMETER.
7.4.3 Third input: CRYSTAL CONTENT (laboratory)
The SeedMaster 2 software contains an advanced crystal growth simulation program that can be used when
no on-line “Third input” data (massecuite density, solids content, or motor consumption) are available. In this
case occasional laboratory data on crystal content (% by volume) of the massecuite at the end of
crystallization / strike should be used.
Calculations of output data will be based in this case on the on-line measurem ent of
• syrup / mother liquor concentration,
• massecuite temperature, and
• occasional crystal content dat a determi ned by the labor atory.
Page 49

7 CONFIGURE SeedMaster 2
49
49
CONFIG.->3R D INPUT-> CR. CONTENT
1 /
LEVEL MEAS.
KEYBOARD
KEYBOARD
YES
PAN MAX. LEVEL
KEYBOARD
KEYBOARD 8 7 . 5 %
CONC. (REFR., SEED.)
KEYBOARD
KEYBOARD 8 0 . 5 %
CONC. (REFR., STR . END.)
KEYBOARD
KEYBOARD 8 1 . 5 %
TEMP. (REFR., SEED.)
KEYBOARD
KEYBOARD 6 9 . 5 C
TEMP. (REFR., STR. END)
KEYBOARD
KEYBOARD 7 1 . 5 C
CR. CONT. (STR. END)
KEYBOARD
PREV.
ACCEPT BACK
BACK
ACCEPT
It is advised to check data, including crystal content from time to time, or when, for example, feed syrup purity
has been changed considerably and change configuration parameters, if needed.
NOTES:
Use on-line data from a massecuite density, solids content or motor consumption transmitter
whenever available.
All parameters can be entered by manual entry (KEYBOARD) or via digital data communication.
Parameters: Range: Notes:
LEVEL MEAS. YES / NO Level measurement is optional. If the answer
was NO, then instead of LEVEL data CR.
SIZE (mean size) will be displayed on the
MAIN DISPLAY.
PAN MAX LEVEL 40 - 100 % If level is measured and available, max
level in %.
CONC. (REFR., SEED.) 65 - 95 % Concentration measured by the refracto meter when seeding.
CONC.(REFR., STRIKE END) 65 - 95 % Concentration measured by the refracto meter at the end of the strike.
TEMP. (REFR., SEED.) 30 - 85 ˚C Temperature measured by the refracto meter when seeding.
TEMP. (REFR., STRIKE END) 30 - 85 ˚C Temperature measured by the refracto meter at the end of str ike, or cooli ng
crystallization.
CR. CONT. (STRIKE END) 0 – 60 % Crystal content at the end of the strike (% by
volume). It must be specified in Set up ->
Inputs, and can not be entered or modified
here.
SEED CRYSTAL SIZE 0.005 – 1.5 mm If shock, or full seeding with slurry is practiced
0.01 mm is typical.
PRODUCT CRYSTAL SIZE 0.03 - 6 mm Mean product crystal size.
LENGTH OF CRYST. TIME 30 - 420 min Length of the real time of crystallization (from
seeding to the end) in minutes. After the 1st
strike the time of the last crystallization can
be accessed by going to DISPLAY -> TEST > OTHER DATA
AVERAGE SUPERSAT. 1< VALUE From seeding to the end of strike. After the
1
last strike can be accessed by going to
DISPLAY-> TEST -> OTHER DATA, or use
the STRIKE HISTORY screen.
FEED SYRUP PURITY 55 - 100 % It must be specified in Set up -> I n puts,
and can not be entered or modified here.
Fig. 7.10 The first page of configuration
st
strike average supersaturation during the
Page 50

7 CONFIGURE SeedMaster 2
50
50
CONFIG . - > SEEDI NG 1 / 0. 1
SEEDING VALVE 5 s
AUTO SEED ON SUPERS.
WARNING KEYBOARD
KEYBOARD 0 . 8
SET- POINT KEYBOARD
KEYBOARD 1 . 12
CHANGE
BACK
ACCEPT
CRYST. PARAMETER 0 – 1.5 The “Crystallization parameter” will be auto matically recalculated, if parameters gover ning crystallization are changed. Though it is
possible to enter manual data, it is advised to
use the data calculated by the SeedMaster 2.
7.5 SEEDING
The configuration of seeding is straightforward (Fig. 7.11).
Fig. 7.11
Parameters:
SEEDING VALVE Value to be entered is the time in seconds during which the
dedicated digital output DO2 to the seeding valve will keep it OPEN. (See
Set up -> Digital I/O, Ch. 8.3).
There are different ways to initiate seeding:
MANUAL SEED Select MANUAL OPERATIONS and MANUAL SEED. PASSWORD is
required to do manual seeding. Seeding is carried out by using
SeedMaster 2 according to the data specified above. Accordingly, no
WARNING digital output (DO1) and warning message on the MAIN
DISPLAY will be shown. The output to the seeding valve (DO2)
operates the same way as if AUTO SEED had been configured.
SEEDING on DIGITAL In this case digital input DIN2 (in its ACTIVE state) commands
SeedMaster 2 to carry out seeding. The digital input can be a
contact (a simple manual switch or relay), or a digital output
(contact, transistor collector, or 0-24 VDC) operated by a Process
Control System (PCS). In response SeedMaster 2 will operate the DO2
digital output the same way as if AUTO SEED had been configured.
SEEDING using digital data 1. Seeding is the responsibility of a PCS, which commands SeedMaster 2
COMMUNICATION via digital data communication to carry out seeding. In response
SeedMaster 2 will operate the DO2 digital output the same way as if
AUTO SEED had been configured (see page 88).
2. If the PCS operates the seeding valve directly, the DO2 digital output of
SeedMaster 2 should be left unconnected. SeedMaster 2 has to be
notified on the seeding operation (digital data communication, or digital
input DIN2).
AUTO SEED Seeding is carried out automatically by SeedMaster 2. There are 2
versions:
AUTO SEED on SUPERSATURATION, and
AUTO SEED on DENSITY
set point.
Appropriate WARNING and SET POINT values should be entered. The DO1 digital output will be turned ON
when supersaturation, or density exceeds the selected value for WARNING. Similarly, the DO2 digital output
will be turned ON to open the seeding valve for the selected time interval when supersaturation or density
equals, or exceeds the selected SET- POINT.
Page 51

7 CONFIGURE SeedMaster 2
51
51
CONFIG ->ACTIVE I NSTRUMENT 1 /
ACTIVE INSTRUMENT: BOTH
CHANGE
BACK
ACCEPT
NOTES:
1. Selecting MANUAL SEED means that seeding is carried out on a regular basis using the “Manual
seed” selection in the Menu. However, even if any other type of seeding had been configured
previously, manual seeding can be performed at once any time as an exception by selecting
“Manual seed”. Password is needed.
2. If the seeding valve is operated directly by a PCS based on data received from SeedMaster 2, by
configuring AUTO SEED and selecting the same SET- POINT (supersaturation, or density) for
seeding as the one used in the PCS will result in approximately synchronous operation of the two
devices. This means that both will attempt to open the seeding valve at the same time, but only the PCS
will succeed, because in this case the DO2 digital output of the SeedMaster 2 should be left
unconnected. The advantage: there is no need for any outside information (digital input DIN2, or
information via digital data communication) on the completion of seeding performed by the PCS. Not
to forget: the set-points of seeding in the two devices must be identical!
3. In any case: SeedMaster 2 always needs information in time when seeding was carried out.
This may come from any one of the outside sources (Digital input, or COMMUNICATION), or it
can be self-generated (MANUAL or AUTOMATIC seeding).
7.6 ACTIVE INSTRUMENT
SeedMaster 2 can serve up to 2 vacuum pans or crystallizers. The device can be configured to serve only
one (I1, or I2), or 2 instruments (see: Ch. 7.1) simultaneously. Configuration is very simple (Fig. 7.12).
Fig. 7.12
Possible selections: NO. 1, NO. 2, and BOTH
7.7 PASSWORD
Password is needed to carry out MANUAL SEEDING of the crystallizer. The password is a 4-character
number, replaced by stars when typing.
The default password number: 1324.
Page 52

7 CONFIGURE SeedMaster 2
52
52
CONFIG ->PASSWORD 1 /
ENTER OLD PASSWORD : * * * *
ENTER NEW PASSWORD : * * * *
RETYPE NEW PASSWORD : * * * *
CHANGE
BACK
ACCEPT
1 / 0 . 1 1 / 0 . 1
Menu Com port Menu Com1
Ethernet Com2
Configuration Configuration Com3
Communication Communication
Com port
)
Fig. 7.13
The old password can be changed by entering the old one followed by a new one twice (Fig. 7.13). When
found correct, the text
PASSWORD CHANGED!
will be displayed.
NOTE:
In order to prevent the situation when due to a forgotten password MANUAL SEEDING becomes
impossible, the number 0000 (Escape code) as OLD PASSWORD will be accepted.
7.8 COMMUNICATION
COMMUNICATION may use one or more of the 3 serial communication ports or the ETHERNET port of
SeedMaster 2.
7.8.1 Using the serial communication (COMX) ports.
Fig. 7.14 shows the configuration details when a serial port (COM 1) was selected.
a) b
Page 53

7 CONFIGURE SeedMaster 2
53
53
CONFIG ->COMMUN. ->COM1 PORT 1 / 0 . 1
PORT NAME COM1
DEVICE NR. 1 / 0 . 1
TYP E R S232
FLOW C. NO
BAUDRATE 9600
DATA BITS 8
STOP BITS 1
PARITY NO
PROTOCOL K-PATENTS SLAVE
MODE ASCII
CHANGE
BACK
ACCEPT
Fig. 7.14 Configuring the SeedMaster 2 – K-PATENTS PR-01-S communication
using the COM1 port .
The possible selections:
PORT NAME COM1 (already selected)
DEVICE NR. 1 / 0.1 ; 2 / 0.2
TYPE RS232, RS485, RS422 MD, RS422 PP
(MD: MODBUS; PP: POINT-TO POINT
FLOW C. NO, RTS/CTS, XOFF/XON
BAUDRATE 1200, 2400, 4800, 9600, 19200, 38400
DATA BITS 7, 8, 9
STOP BITS 1, 2
PARITY NO, ODD, EVEN
PROTOCOL K-PATENTS SLAVE, MODBUS SLAVE
MODE ASCII
Terms used:
K-PATENTS SLAVE It is the protocol used by the K-PATENTS PR-01-S type
process refractometer.
MODBUS SLAVE If selected,
MODB. DEV. ADDR.: 21
RESPONSE TIME : 1 msec
7.8.2 Using the ETHERNET.
Ethernet communication can be used to
• connect a PR-23 refractometer to the SeedMaster 2 and
• connect the SeedMaster 2 to a Process Control System (PCS) (see Fig. 7.4)
Fig. 7.15 shows the configuration details when using the ETHERNET.
Page 54

7 CONFIGURE SeedMaster 2
54
54
1 / 0 . 1 CONF.->COMM.->ETHERNET 1 / 0.1
Menu Com port PCS COMMUNICATION
Ethernet PROTOCOL MODBUS TCP
Configuration SM 2 IP ADDRESS 1 9 2 . 1 6 8 . 0 . 1 0 0
NETWORK MASK 2 5 5 . 2 5 5 . 2 5 5 . 0
Communication GATEWAY 1 9 2 . 1 6 8 . 0 . 1
MODB. DEV. ADDR. 1
DHCP SERVER NO
DTR COMMUNICATION
PROTOCOL K-PATENTS UDP / IP
PR-23 IP ADDRESS 1 9 2 . 1 6 8 . 0 . X X X
BACK
a) b)
Fig. 7.15 Configuring the Ethernet communication
NOTES:
SM2 IP ADDRESS IP address of SeedMaster 2.
It must be entered even if only the refractometer is connected to its Ethernet port.
The first three dot-separated 3-character numbers in the SM2 IP ADDRESS must
be identical to the similar ones of the refractometer. They will be automatically
copied in the PR-23 IP ADDRESS field.
NETWORK MASK AND GATEWAY
If the SeedMaster 2 is connected to a network, they should be set according to the
network parameters.
MODB. DEV. ADDR. MODBUS device address: 1…254
DHCP SERVER If YES was selected, the SeedMaster 2 will provide the IP addresses to the network
participants.
Attention: only one DHCP server can be configured in a network.
PR-23 IP ADDRESS IP address of the refractometer, for example: 192.168. 0. 1
The last 3 characters in the PR-23 IP ADDRESS can be selected in the 1…254
range, but they must be different than the similar ones in the SM2 IP ADDRESS.
Only the last 3 characters (XXX) can be changed.
Attention: check if the IP address set in the refractometer is identical to the PR-23
IP ADDRESS.
7.8.3 Organizing the two-way data transfer.
Data measured on-line by the instruments can be sent either directly to SeedMaster 2 or to the PCS. In the
later case the PCS will transmit them to SeedMaster 2 for use. The CONFIGURATION and SET UP
parameters of SeedMaster 2 will tell the device where to get these data from (see Ch. 7.2).
Communication between SeedMaster 2 and a PCS may operate in both ways and it must be based on the
exchange of fixed data fields containing data registers. It is the user’s responsibility to organize the data fields
containing the registers and program the communication in the PCS.
For a detailed description of communication and data exchange see Ch. 11.
NOTE:
The communication program of the PCS should be configured taking into account the organization of
data in SeedMaster 2. Naturally if two instruments (I1 and I2) are active, both of them should have
their own data fields in the PCS.
Page 55

8 SET UP SeedMaster 2
55
55
SEEDED
MAIN DISPLAY 1 / 0 . 1 SEEDED MAIN DISPLAY 1 / 0 . 1
SEED: SUPS
=1 .12 AUT STRT: 141M BU
SEED: SUPS = 1 .12 AUT STRT: 141M BU
SUPS.
1 . 1 4 LI. PUR. 9 2 .2 %
SUPS.
1 . 1 4 LI. PUR.
9 2 .2 %
DENS. 1 4
8 1 kg/m3
LI. CONC. 8 1 . 2 %
DENS. 1 4
8 1 kg/m3
LI. CONC. 8 1 . 2 %
MA. SOL. 8 8 . 7 % MO. CONS. 3 6 . 4 A MA. SOL. 8 8 . 7 % MO. CONS. 3 6 . 4 A
CR. CT. 4 1 . 3 % TEMP. 6 9 . 8 C CR. CT. 4 1 . 3 % TEMP. 6 9 . 8 C
CONSIST.
7
8 . 2 % LEVEL 7 7 . 5 %
CONSIST.
7
8 . 2 %
LEVEL 7 7 . 5 %
WARNSD
MAIN
DISPLAY 2 / 0 . 2
SEED: SUPS
=1 .12 AUT STRT: 21M SC
SUPS. 1 . 0 5 LI. PUR. 9 5. 2 %
DENS. 1
4 0 1 kg/m 3 LI. CONC. 8 1 . 2 %
MA. SOL. 8 1 . 2 % MO. CONS. 3 6 . 4 A
CR. CT. 0 . 0 % TEMP. 6 9. 8 C
CONSIST.
2
8 . 2 %
LEVEL 3 7 . 5 %
MENU
2
1
2
1
MENU
1
1 / 0 . 1
Menu Manual seeding
Display
Set up
Configuration
8 SET UP SeedMaster 2
Actual use of SeedMaster 2 can follow only after having completed the CONFIGURATION and SET UP
operations. It is advised to start with CONFIGURATION.
SET UP defines some display parameters and the details of data inputs and outputs.
8.1 Set up DISPLAY
Set up DISPLAY can be accessed from the MAIN DISPLAY:
Fig. 8.1
NOTES:
1. The upper half and the lower one of the LCD are distinguished as
Instrument No.1, or I1, and Instrument No.2, or I2,
Implemented by SeedMaster 2, respectively.
2. If both instruments are active, that is there are two crystallizers served, the appropriate instrument must be
selected first. By default, I1 (the upper half of the LCD) is selected. It is signaled by the backlit area in the
upper right corner (1 / XXX, where 1 is the instrument number, and XXX is the TAG of the Crystallizer),
and by the backlit number in the lowest row of the screen.
3. For operations with the second crystallizer push key 2 first. A similar area (2 / YYY) in the lower half
of the LCD will be backlit showing instrument selection.
After having selected the instrument pushing MENU brings up the screen shown in Fig. 8.2, where “Set up”
should be selected. The selected item is shown inverted (white characters on black background).
NOTE: For information on the different KEY-s and KEY-OPERATIONS see: Ch. 6.4 Basic key
Fig. 8.2
operations.
Entering the selected Display leads to the details of display set up (Fig. 8.3 a) and Fig. 8.3 b)).
Page 56

56
56
1 / 0 . 1 SET UP -> DISPLAY 1 / 0 . 1
Menu Display TIME SCALE 20 MIN . / MARK
Inputs DATE AND TIME 17:14:45
Set up Digital I/O TAG 0 . 1
Analog output STANDARD DISPLAY SUPERS .
-
MA . SOL.
CHANGE
BACK
ACCEPT
SET UP -> DISPLAY 1 / 0 . 1 SET UP -> DISPLAY -> DATE AND TIME 1 / 0 . 1
TIME SCALE 20 MIN./M ARK
DATE AND TIME 17:14:45
OLD TIME:
2005 - 02 - 24 17 : 14 : 45
TAG 0 . 1
STANDARD DISPLAY SUP E RS . - MA . SOL.
NEW TIME:
>2005 - 02 - 24 18 : 32 : 12
ACCEPT
BACK
BACK
CHANGE
BACK
8 SET UP SeedMaster 2
a) b)
Fig. 8.3
TIME SCALE The time (horizontal) scale of TREND-s will be defined by
selecting 10, 20, 40 or 60 minutes/mark.
DATE AND TIME Set or change current date and time.
(CHANGE (Fig.8.4 a), LEFT/RIGHT ARROW, enter new
dat a, ACCEPT or ENTER, BACK (Fig.8.4 b))
NOTE: Date and time should be changed when the strike(s) is (are) inactive. Otherwise erroneous
time information will be displayed (strike time STRT on the MAIN DISPLAY, TREND).
a) b)
Fig. 8.4
TAG There is an area in the upper right corners of the two instruments reserved for
TAG entry: 1 / XXX and 2 / YYY .Here 1 and 2 (fixed) are used to number the
two independent instruments (I1, I2) implemented by SeedMaster 2, while XXX
and YYY denote user configurable TAG-s. The first character can be used to
identify a group of pans or crystallizers, for example: 0 refinery product, 1 fi rst (or
“A”) product, 2 second (or “B”) product etc., while the remaining 2 characters can
be used to number the pans or crystallizers belonging to a group. Alternatively,
the second character can be the decimal point, too.
STANDARD DISPLAY Contrary to the MAIN DISPLAY which lists 10 data per crystallizer, this type
of data display can be used to display only 2 selected ones per crystallizer,
but with much larger characters. Any 2 from the 11 data (if available) can be
selected. (CHANGE (Fig. 8.5 a), select signal in Fig. 8.5 b), CHANGE, ACCEPT
or ENTER).
NOTE: Starting from 01.06.2012. the background color, brightness (normal and stand-by) of the LCD
can be selected, too.
Page 57

57
57
SET UP - > DISPLAY -> 1 / 0 . 1 SET UP -> DISPLAY -> ST. DISPLAY 1 / 0 . 1
TIME SCALE 20 MIN./MARK SIGNAL 1: SUPERSATURATION
DATE AND TIME 17:14:45 SIGNAL 2: DENSITY
TAG 0 . 1
STANDARD DIS PLAY SUPERS . - MA . SOL.
CHANGE
BACK
ACCEPT
CHANGE
BACK
8 SET UP SeedMaster 2
a) b)
Fig. 8.5
8.2 Set up INPUTS
8.2.1 Data types and specifications
Calculations running in SeedMaster 2 rely on 2 types of data inputs:
1. data measured on-line (real-time data) by some instruments, and
2. data determined time to time in the local laboratory.
The possible types of data sources are (see Ch. 7.2):
On-line data : Transmitter, Communication.
Laboratory data : Transmitter, Keyboard, Communication.
Inputs from standard current transmitters.
SeedMaster 2 has 8 individually isolated standard current (4-20 mA, or 0-20 mA, configurable) input
channels. These can be connected to any device (including traditional transmitters and PCS-s) capable to
transmit measured data as standard current out pu t.
Inputs from K-PATENTS PR-01-S type process refractometer(s).
One or both of the data (concentration, temperature) measured on-line by a K-PATENTS ref ractometer can
be transmitted to SeedMaster 2 by using one or two out of its 3 Serial Communication Ports (COMX).
Inputs from the K-PATENTS PR-23-…type process refractometer(s).
One or both of the data (concentration, temperature) measured on-line by K-PATENTS refractometer(s) can
be transmitted to SeedMaster 2 by using the Ethernet. Up to two sensor heads can be connected to the
Indicating Transmitter (ITR) of a PR-23-… type refractometer.
Inputs transmitted from a PCS using digital COMMUNICATION.
If the instruments are already transmitting their data to a PCS, one or all of these data together with
laboratory data can be transmitted to SeedMaster 2 by using digital data communication. Communication
may be based on the use of one of the 3 COMX Ports, or the ETHERNET.
Laboratory data
Some laboratory data, like feed syrup purity (%) and crystal content (at the end of strike, % by volume) can
be entered using standard current (4-20 mA), keyboard manual entry, or digital data communication (COMX
port, or Ethernet).
NOTE: Feed syrup purity can be sent as standard current only if purity is constant all over the strike (one
feed syrup only).
Syrup parameters (“m”, “b” and “c”) can be entered by keyboard manual entry, or by digital data
communication (COMX port, or Ethernet).
SUMMARY OF DATA INPUTS:
On-line (real-time) data:
• Mother liquor concentrat ion (% )
• Temperature (˚C)
Page 58

58
58
SET UP -> INPUTS
1 / 0 . 1
SET UP -> INPUTS -> MO. LIQ. CONC.
1 / 0 . 1
MO. LI. CONCENTR.
SERIAL KP.
MO. LIQ. CONCENTR.
COMMUNICATION
RANGE
65 - 90
TEMPERATURE
COMMUNICATION
LOW LIMIT
66 %
MASSECUITE DENSITY
COMMUNICATION
HIGH LIMIT
85 %
MOTOR CONSUMPTION
TRANSMITTER
CONC. BIAS
0
CR. CONTENT (LAB.)
COMMUNICATION
ENGINEERING UNIT
%
LEVEL
TRANSMITTER
FEED SYRUP DATA
KEYBOARD
SYRUP PARAMETERS
KEYBOARD
CONCENTRATION CORRECTION KEYBOARD
• Massecuite density (kg/m), OR
• Massecuite solids content (%), OR
• Stirrer motor consumption (A, or kW)
• Level (%) (optional)
Laboratory data:
• Crystal content (at the end of strike) (% by volume)
• Feed syrup purity (%)
• Syrup parameters (- )
8 SET UP SeedMaster 2
a) b)
Fig. 8.6
Fig. 8.6 a) shows an actual input set up (here it is assumed that THIRD INPUT has already been configured
as MASSECUITE DENSITY, see Ch. 7.3.1). By keying CHANGE (Fig. 8.6 a)) other available modes of
transferring concentration data (for example: TRANSMITTER) will be offered for selection.
NOTES:
1. “THIRD INPUT” should be defined during CONFIGURATION. The selected THIRD INPUT (in Fig.
8.6 a): MASSECUITE DENSITY) will appear on the display, but the (non-selected) MASSECUITE
SOLIDS CONTENT will be missing and vice versa.
2. MOTOR CONSUMPTION will be always listed, because its data might be used not only as THIRD
INPUT when selected, but as data needed to detect the STRIKE ACTIVE state as well (see Ch. 7.3).
3. A limited small temperature bias (+ / - 5 C) can be added to the measured temperature data.
Specifying RANGE data.
Having selected the appropriate item (Fig. 8.6 a)) use the RIGHT ARROW to enter RANGE data (Fig. 8.6 b)).
Pushing CHANGE will bring up the screen shown in Fig. 8.7 to do the data entry.
Page 59

59
59
SET UP -> INP. -> CONC. -> RANGE 1 / 0 . 1
MIN. MAX.
CURRENT VALUE : 6 0 9 0
NEW VALUE : 6 5 9 0
BACK
BACK
BACK
ACCEPT
SET UP -> INPUTS -> LEVEL. 1 / 0 . 1
LEVEL TRANSMITTER
CLEAR
STANDARD CURRENT 4 - 20 mA
RANGE 0 - 100
LOW LIMIT 5 %
HIGH LIMIT 8 2 %
CHANNEL NOT SELECTED
ENGINEERING UNIT %
CHANGE
BACK
ACCEPT
8 SET UP SeedMaster 2
Fig. 8.7
The procedure is similar with all data source types. The new RANGE data must be within the limits specified
by the default values of the same parameter (see Ch. 6.2).
These RANGE data are used to detect RANGE EXURSIONS documented in the 3 different lists on EVENTS.
Specifying ALARM LIMIT data.
LOW LIMIT and HIGH LIMIT data can be entered one by one (see Fig. 8.6 b)).
NOTES:
1. In the STRIKE ACTIVE state data inputs and data outputs are monitored for RANGE EXCURSIONS. If
detected, the excursions will be logged complete with their names and time stamps in the EVENTS’
HISTORY, and the effected data will be replaced for the calculations by their appropriate range limit
values (RANGE MIN., or RANGE MAX.).
2. In the STRIKE ACTIVE state data inputs and data outputs are monitored for ALARM EXCURSIONS. If
detected, the excursions will be logged complete with their names and time stamps in the EVENTS’
HISTORY without any further action.
Engineering units.
The ENGINEERING UNIT can not be changed: it is automatically selected according to the type of the
selected THIRD INPUT.
The two exceptions are MOTOR CONSUMPTION, in which case A, or kW, and TEMPERATURE, where
Celsius ©, or Fahrenheit (F) can be selected by using CHANGE and ACCEPT or ENTER.
Specifying TRANSMITTER PARAMETERS.
If TRANSMITTER is specified as an input source, fur th er spe cifi cat ion is needed (F ig. 8.8) .
Fig. 8.8
Page 60

8 SET UP SeedMaster 2
60
60
NAME (signal) Selected source: TRANSM ITTER
CLEAR Clears (makes free) an already reserved ANALOG INPUT
CHANNEL of SeedMaster 2.
STANDARD CURRENT 0-20 mA, or 4-20 mA can be selected.
RANGE (TRANSMITTER) Select RANGE to change it, then enter new data in the
upcoming next picture similar to Fig. 8.7. RANGE MIN. and
MAX. data are determined by the standard current transmitter: 4
(or 0) mA current specifies RANGE MIN. and 20 mA current
sp ecifies RANGE MAX.
LOW and HIGH LIMIT-s Signal LOW and HIGH limits are used in detecting alarm
limit excursions during the ACTIVE part of a strike. These
result in a lit or blinking ALARM LED on the faceplate of the
instrument.
CHANNEL Selection can be changed (available free channels will be
presented one by one for selection).
An already selected analog input channel can be freed.
(Select CLEAR, then CHANGE). In response the text in
the CHANNEL row will change to: NOT SELECTED.
NOTE:
The TRANSMITTER RANGE specified here has nothing to do with the detection of RANGE EXCURSIONS.
It is needed to “translate” the standard current (0 / 4 to 20 mA) into meaningful measured data (for example:
temperature: 71,5 C).
8.2.2 Handling the use of several feed syrups with different purities.
In some cases feed syrup purity is not constant during a batch strike. The strike is started with a feed syrup
having purity P1, then later on it is continued with an other (P2), and may be it is finished with the last one
(P3), where purities are gradually decreasing (P1 > P2 > P3). In practice the change from one feed syrup to
the next one is carried out when level in the pan reaches some selected limit value. This can be based on
real measured (on-line) data, or if it is not available, on the visual observation of the pan operator. The actual
change of the feed syrup (operating the feed valves) can be implemented either by a PCS, or by the pan
operator.
Supersaturation, the most important parameter of crystallization depends on syrup / mother liquor purity,
therefore changing feed syrup purity should be taken into account. Depending on whether on-line data on
massecuite level are available, or not, there are different ways to handle changing feed syrup purity.
Real-time data on level are available.
There are 2 ways to handle changing feed syrup purity.
AUTOMATIC: In this case up to 3 feed syrup purities (P1, P2, P3 in descending order) and up to 2 level
limits (L1, L2 in increasing order) can be specified during SET UP SYRUP
PARAMETERS.
Calculations in SeedMaster 2 will be started with purity P1. When measured level reaches
L1, calculations will take into account the change of feed syrup purity from P1 to P2. If use
of 3 different purities was specified, the change at level L2 will initiate the use of P3 from that
point up to the end of the strike.
NOTE: The availability of level measurement will result in a smooth transition when the
change(s) take place.
MANUAL : This is a special case of AUTOMATIC, meaning that if AUTOMATIC operation was specified
during SET UP, it is still possible to initiate feed syrup change any time either by using digital
input (DIN3), if available, or to use the KEYBOARD (MANUAL OPERATIONS).
NOTE: The availability of level measurement will result in a smooth transition when the
change(s) take place.
There are no real-time data on level are available.
MANUAL : Feed syrup purities (P1, P2, P3) and level limits (L1, L2) have to be specified the same way
as in the former case, where level data are available.
It is the operator’s or the control system’s responsibility to initiate the actual change of feed
syrup when assumed level equals the specified one. Besides that, SeedMaster 2 has to be
notified on the change either by digital input DIN3, or by CHANGE FEED SYRUP
(MANUAL OPERATIONS).
Page 61

8 SET UP SeedMaster 2
61
61
SET UP -> INPUTS
1 / 0 . 1
SET UP -> INPUTS -> FEED SYR. PURITY.
1 / 0 . 1
FEED SYR. PURITY
KEYBOARD
MO. LIQ. CONCENTR.
COMMUNICATION
NO. OF DIFF. PURITIES
3
TEMPERATURE
COMMUNICATION
PURITY NO1
95 %
MASSECUITE DENSITY
COMMUNICATION
PURITY NO2
91 %
MOTOR CONSUMPTION
TRANSMITTER
PURITY NO3
88%
CR. CONTENT (LAB.)
COMMUNICATION
AUTO CHANGE
YES
LEVEL
TRANSMITTER
LEVEL NO1
68 %
FEED SYRUP DATA
KEYBOARD
LEVEL NO2
75 %
SYRUP PARAMETERS
KEYBOARD
LEVEL MAX
82 %
CONCENTRATION CORRECTION KEYBOARD
RANGE
50-100
LOW LIMIT
65%
HIGH LIMIT
96%
ENGINEERING UNIT
%
NOTE: Due to the lack of measured data on level, the transitions will result in small steps
when they take place.
IMPORTANT:
1. In practice feed syrup with the highest available purity (P1) is being used during the major part of a
strike. The volume of feed syrups with lower purities usually is not large as compared to the volume
of feed syrup of purity P1.
2. Due to the above practice, the effect of changes in feed syrup purities effects only the last part of a
strike (supersaturation will be a little bit lower than is the case when the highest purity (P1) syrup is
in use all over the strike).
3. Cases when feed syrup would be changed from a lower purity to a higher one (going backwards)
should be avoided.
4. SeedMaster 2 itself will not really carry out the feed syrup change (it will not operate any feed valve).
It is assumed, that it will be done by a PCS, or by the pan operator in harmony with the specified
data (P1, P2, P3, L1, L2).
Fig. 8.9 shows a possible set up, where 3 different feed syrup purities and appropriate level limits with AUTO feed
syrup change have been specified.
For more information on feed syrup purity change see 3.6.3 and 5.1.4.
a) b)
Fig. 8.9 Handling different feed syrup purities
8.2.3 Set up SYRUP PARAMETERS.
The important feed syrup quality parameters “m”, “b” and “c” can be entered by using the SET UP -> INPUTS
-> SYRUP PARAM. display (Fig. 8. 10), if KEYBOARD entry was previously selected (see Fig. 8.6 a)).
Page 62

62
62
SET UP - > INPUTS - > SYRUP P ARAM.
1 /
TYPICAL BEET
TYPICAL BEET
m:
0 . 1 7 8
b:
0 . 8 2
c:
- 2 . 1
CHANGE
BACK
ACCEPT
SYRUP PARAM.
8 SET UP SeedMaster 2
Fig. 8. 10
Selecting the quality parameters (see Ch.12.1):
There are 2 fixed (“built in”) sets of quality parameters called “TYPICAL BEET” and “TYPICAL CANE”.
The parameter data:
TYPICAL BEET m: 0.178 TYPICAL CANE m: - 0. 06265
b : 0.82 b : 0.982
c : - 2.1 c : - 2.1
The listed data on beet are regarded as typical (source: McGINNIS: Beet Sugar Technology, 3
rd
Edition),
while those on cane are based on Thieme’s data (L. Rózsa: Sucrose solubility in impure cane sugar
solutions, International Sugar Journal, May 2000).
Besides the 2 fixed sets of parameters it is possible to select LABORATORY as well:
m:
b :
c :
In this case quality parameters determined by the local laboratory can be entered.
NOTES:
1. It is advised to use local syrup quality parameters whenever possible.
2. The description of a procedure to determine these parameters can be found in the “APPENDIX”.
3. Setting m = c =0 (with any value of b) will result in a constant saturation function value Fsat = 1,0. This is
the case of a pure sucrose solution, that is non-sugar content and its effect on solubility will be
neglected.
CONCENTRATION CORRECTION:
It might be needed with low purity (purity < 80 %) syrups /mother liquor based on laboratory data.
K = 1 when typical correction is used.
8.3 Set up DIGITAL I / O
DIGITAL INPUTS (see Chapters 3.6.1, 3.6.2)
There are 8 digital input (DIN) channels. These can be anyone of the 3 possible input types (see: Ch. 4.1,
Figure 4.5).
There are 3 digital inputs per crystallizer which can be used: STRIKE ACTIVE, SEEDED and CHANGE
SYRUP inputs.
During a digital input set up operation the terminology familiar with the use of relays is used. An input is
regarded ACTIVE, when a contact type input is CLOSED, or OPEN (configurable).
For the 3 selectable input types OPEN and CLOSED has the following meaning:
Input : Contact Transistor collector DC voltage
OPEN : Open contact Transistor is non-conducting 0 VDC
CLOSED: Closed contact Transistor is conducting 24 VDC
Page 63

8 SET UP SeedMaster 2
63
63
SET UP -> DIGITAL I / O 1 / 0 . 1 SET UP -> DIGIT. I/O -> STRIKE ACT. 1 / 0 . 1
CH . TYPE ACTIVE
CHANNEL
DI_3
IN
ACTIVE
CLOSED
STRIKE ACTIVE : DI_3 DIN1 CLOSED
SEEDED : AUTO - ON SUPERS.
CHANGE SYRUP : AUTO
OUT
SEED WARNI NG : DO_1 DO1 ON
SEED VALVE : DO_2 DO2 ON
CHANGE
BACK
CHANGE
BACK
The STRIKE ACTIVE and SEEDED information might come from different sources determined during
configuration (see: Ch. 7.3, 7.5). Set up of a digital input is required (and possible) only if DIN1, DIN2 and / or
DIN3 was already selected during configuration.
STRIKE ACTIVE input (DIN1):
The STRIKE ACTIVE DIGITAL INPUT can be used to synchronize SeedMaster 2 operations to the
crystallizer. DIN1 is the name (and not the channel number) of a digital input dedicated solely to strike
activation.
The use of digital input is not obligatory (see Ch. 7.3). In the example of Fig. 8.11 a) the STRIKE ACTIVE
information is provided by the previously configured DIN1 digital input. Its source can be connected to
anyone of the free digital input channels. In the example of Fig. 8.11 a) it should be connected to Channel
DI_3 (see Fig. 4.2).
a) b)
Fig. 8.11
In Fig. 8.11 a) data for the DIGITAL I/O are organized in 3 columns:
CH : input / output channel number
TYPE : digital input and digital output identifiers (fixed)
ACTIVE : status defined as ACTIVE
Channel selection and the ACTIVE state of the DIGITAL INPUTS can be defined by typing CHANGE. This
will bring up a new display (Fig. 8.11 b)), where the changes can be made.
For possible STRIKE ACTIVE selections (during CONFIGURATION) see Ch. 7.3.
For the types of acceptable digital inputs and how to connect them see Fig. 4.5.
NOTE:
1. The STRIKE ACTIVE signal must be ACTIVE all over the strike (from the start of the strike till dropping
the charge). See Ch. 3.6.1.
2. The use of DIGITAL INPUT or COMMUNICATION is recommended to signal the STRIKE ACTIVE status
for SeedMaster 2. Though MOTOR CONSUMPTION (motor ON / OFF) can also be used, un-intentional
stop of the motor (due for example to mains failure) will result in erroneous operation.
SEEDED input (DIN2):
It is recommended to use the AUTOMATIC SEEDING feature of SeedMaster 2, in which case there is no
need for this input. Fig. 8.11 a) shows an example where automatic seeding based on supersaturation was
previously configured. Possible seeding selections (during CONFIGURATION):
MANUAL SEED
AUTO SEED ON SUPERSATURATION
AUTO SEED ON DENSITY
SEEDING ON DIGITAL INPUT
SEEDING ON COMMAND using digital communication
Set up of DIGITAL INPUT DIN2 is required (and possible) only if SEEDING ON DIGITAL INPUT was
selected during the configuration of Seeding (see: Ch. 7.5).
Page 64

8 SET UP SeedMaster 2
64
64
NOTE:
The SEEDED input signal must be ACTIVE all over the strike (from seeding till dropping the charge). See
Ch. 3.6.2.
CHANGE SYRUP input (DIN3 ):
This digital input can be used to inform SeedMaster 2 on the change of feed syrup.
NOTE:
It is advised to use momentary digital input (pushbutton, or pulse input lasting for a few seconds).
DIGITAL OUTPUTS
There are 2 dedicated digital outputs assigned to each crystallizer. They are switching transistor types,
conducting current when ON, and non-conducting when switched OFF (capacity: 0.1 A, 48 V (DC), max.).
The outputs are overvoltage and overload protected (see: Ch.4.1 and Fig. 4.6).
DO1and DO2 are the names of outputs dedicated to a specific task. Available free channels (DO_1…DO_4)
can be assigned to anyone of these outputs.
SEED WARNING (DO1) output:
This output is intended to be used for remote signalling (horn, signal lamp) of the approaching seeding in
order to warn the pan operator to make the seeding material (slurry) ready. It will be operated only when
AUTO SEED (ON SUPERSATURATION, or ON DENSITY) was configured. This output can be used for
other tasks as well. For example: if the seeding vessel is furnished with a small motor-driven stirrer, this
motor can be turned on in order to homogenize the seeding slurry, and turned off automatically when seeding
has been completed.
SEED VALVE (DO2) output:
This output should be used to OPEN and CLOSE the seeding valve. The Ton time can be configured (see:
Ch. 7.5).
This output will be operated in all variants of seeding, that is when
MANUAL SEED,
AUTO SEED ON SUPERSATURATION,
AUTO SEED ON DENSITY,
SEEDING ON DIGITAL INPUT or
SEEDING ON COMMAND using digital communication
was configured. However, it can be left un-connected, if seeding is carried out directly by a PCS or manually
by the pan-man. In these later cases, however, SeedMaster 2 has to be notified on seeding carried out by an
other device (for example by using DIN2).
NOTE:
Selections in column CH can be changed for both signal types, but the ACTIVE status can be changed only
with DIGITAL INPUTS.
8.4 Set up ANALOG OUTPUT
There are 4 standard current outputs (4-20 mA, or 0-20 mA, configurable) available. These can be assigned
to any one of the measured or calculated data.
Page 65

65
65
SET UP -> ANALOG OUTPUT -> 1 / 0 . 1 SET UP -> AN. OUTPUT -> SUPERSAT. 1 / 0 . 1
CH . CURR. mA RANGE CLEAR
AO_2 4 - 20 0 . 7 - 2 STANDARD CURRENT 4 - 20 mA
DENSITY : RANGE 0 . 7 - 2
MA . SOLIDS C. : LOW LIMIT 0 . 9
CRYST. CONT
. : AO_1 4 - 20 0 -60 HIGH LIMIT 1 . 1 8
MEAN CR. SIZE : CHANNEL AO_2
CONSISTENCY : ENGINEERING UNIT -MO. LI. PURITY :
MO. LI. CONC. :
MOTOR CONS. :
CHANGE
BACK
ACCEPT
CHANGE
BACK
SUPERSATUR. :
SET UP - > AN . OUT -> SUPERS. -> RANGE 1 / 0 . 1
MIN. MAX.
CURRENT VALUE : 0,7 2
NEW VALUE : > 0,7 1,8
CHANGE
BACK
8 SET UP SeedMaster 2
a) b)
Fig. 8.12
Figure 8.12 a) shows how to set up an output (SUPERSATURATION) channel.
To modify type CHANGE and continue the Set up as shown in Fig. 8.12 b) and Fig. 8.13.
To free an already reserved output channel select item (Fig. 8.12 a)), then select CLEAR and type CHANGE
(Fig. 8.12 b)).
To add a new output select item (for example: DENSITY) and type CHANGE (Fig. 8.12 a)).
Select CHANNEL and type CHANGE (Fig. 8.12 b)). Available free channels will be offered automatically. If
there is no available channel, make one free first.
Fig. 8.13
IMPORTANT NOTE:
Having completed selections or changes during any SET UP operation it is highly recommended to
check if the final settings are really correct (go to SET UP -> ANALOG OUTPUT). Do not forget to
close the operations by pushing the ACCEPT or ENTER key.
9 MANUAL SEEDING
It is highly recommended to practice automatic seeding whenever possible. It will result in reproducible
strikes, which, if the set-point for seeding was selected properly (see: Ch. 2.5) and the process of
crystallization was also controlled well, will provide consequently high-quality product.
Manual seeding can be the selected (though not recommended) mode of seeding. However, in un-common
situations manual seeding of the crystallizer might be necessary. The mode of seeding (MANUAL SEED, or
AUTO SEED) can and should be configured in advance during CONFIGURE -> SEEDING (see: Ch. 7.5).
Page 66

9 MANUAL SEEDING
66
66
1 / 0. 1 MANUAL SEED 1 / 0 . 1
Menu Manual seeding
Display
PLEASE ENTER PASSWORD
Set up
Configuration
ACCEPT
BACK
MANUAL SEED 1 / 0 . 1
PASSWORD OK
MANUAL SEEDING OK
SEED
BACK
However, manual seeding by using the MENU soft key of the MAIN DISPLAY can be initiated any time, not
influenced by the selected mode of seeding.
a) b)
Fig. 9.1
When doing manual seeding the pan operator will have all the information at his disposal on the SeedMaster
2 display. Naturally, if the SUPERSATURATION reading is below 1.00, attempts to seed the crystallizer will
only result in waste of seeding material (slurry) and time. Supersaturation when seeding will be documented
in the Strike history.
To perform manual seeding of the pan PASSWORD entry is required (Fig. 9.1 b)). The password is a 4character number, which should be defined during configuration (see Ch. 7.8 ). The correct password will be
OK-d and the actual seeding becomes possible: pushing the SEED soft-key performs the operation and
confirms its completion (MANUAL SEED OK, Fig. 9.10).
F ig. 9. 2
NOTES:
1. Before doing MANUAL SEEDING for the first time by using SeedMaster 2 it is necessary to
SET UP a digital output to operate the seeding valve. (see Ch. 7.3). The seeding valve will be
OPEN for a selected Ton time. The default value of Ton is set to 5 sec.
2. If there are 2 instruments (I1 and I2) in use always check and select the right crystallizer with the
right TAG first .
3. The problem of a forgotten PASSWORD can be circumvented by configuring a new one (see
Ch. 7.8).
Page 67

10 DISPLAY
67
67
SEEDED MAIN DISPLAY 1 / 0 . 1 SEEDED MAIN DISPLAY 1 / 0 . 1
SEED: SUPS =1 .12 AUT STRT: 141M B U SEED: SUPS =1 .12 AUT ST RT : 141M BU
SUPS.
1 . 1 4 LI. PUR. 9 2 .2 %
SUPS.
1 . 1 4 LI. PUR. 9 2 .2 %
DENS. 1 4
8 1 k g/m3 LI. CONC. 8 1 . 2 %
DENS. 1 4
8 1 kg/m3 LI. CONC. 8 1 . 2 %
MA. SOL. 8 8 . 7 % MO. CONS. 3 6 . 4 A MA. SO L. 8 8 . 7 % MO. CONS. 3 6 . 4 A
CR. CT. 4 1 . 3 % TEMP. 6 9 . 8 C CR. CT. 4 1 . 3 % TEMP. 6 9 . 8 C
CONSIST.
7 8 . 2 % LEVEL 7 7 . 5 %
CONSIST.
7 8 . 2 % LEVEL 7 7 . 5 %
WARNSD MAIN DISPLAY 2 / 0 . 2
SEED: SUPS =1 .12 AUT STRT: 21M SC
SUPS. 1 . 0 5 LI. PUR. 9 5. 2 %
DENS. 1
4 0 1 kg/m3 LI. CONC. 8 1 . 2 %
MA. SOL. 8 1 . 2 % MO. CONS. 3 6 . 4 A
CR. CT. 0 . 0 % TEMP. 6 9. 8 C
CONSIST.
2 8 . 2 % LEVEL 3 7 . 5 %
MENU
2
1
2
1
MENU
1
WARNSD MAIN DISPLAY 2 / 0 . 2
SEED: SUPS =1 .12 AUT STRT : 21M SC
SUPS. 1 . 0 5 LI. PUR. 9 5. 2 %
DENS. 1
4 0 1 kg/m3 LI. CONC. 8 1 . 2 %
MA. SOL. 8 1 . 2 % MO. CONS. 3 6 . 4 A
CR. CT. 0 . 0 % TEMP. 6 9. 8 C
CONSIST.
2 8 . 2 % LEVEL 3 7 . 5 %
2
MENU
10 DISPLAY
10.1 MAIN DISPLAY
The MAIN DISPLAY will appear after every switch ON of SeedMaster 2.
It can be accessed any time by pushing the ESCAPE key.
The MAIN DISPLAY was designed to provide all of the major information on a strike for 2 pans at the same
time. The LCD is split into 2 identical halves (Instruments No.1 and No.2., or I1 and I2). Depending on the
number of pans served the upper, lower or both halves can be used (Fig. 10.1). The MAIN DISPLAY is the
only one where (if set up accordingly) most of the major data (10 out of the possible 11 for each) are
displayed for both pans. The serial number and the TAG of the active (selected) instrument is backlit. All
further operations will be carried out with the active instrument and the pan so identified. To switch between
the two simply push soft key 1 or 2 on the MAIN DISPLAY.
a) b)
c)
Fig. 10.1
NOTE:
If both halves of the display are used, that is if there are 2 crystallizers served, by default I1 (served by the
upper half of the LCD) is selected on switch ON of SeedMaster 2.
For operations with the second crystallizer push soft key 2 first.
Page 68

10 DISPLAY
68
68
WARNSD MAIN DISPLAY 2 / 0 . 2
SEED: SUPS =1 .12 AUT STRT: 21 m SC
).
DISPLAY STRUCTURE : rows 1 and 2.
Row 1:
Column 1: Information on seeding:
BLANK : blank (seeding is not in close as yet).
WARNSD : warning on approaching seeding (see: Ch. 7.5).
SEEDED : seeding is over.
Column 2: MAIN DISPLAY
Column 3: 2 / 0.2 Instrument number over TAG of the crystallizer (see: Ch. 8.1).
This area is backlit when the instrument is selected.
Column 1 Column 2 Column 3
Fig. 10.2
Row 2:
Column 1: Information on seeding:
SEED : SUPS, or DENS (automatic seeding based on supersaturation or density
Column 2: =N.NN or =XXXX : set-point for automatic se edin g (super sa tur ati on or density).
AUT, or MAN : mode of seeding (automatic or manual).
STRT: XXX m : length of time (STRIKE ACTIVE TIME) of the strike in minutes.
Column 3: Strike status:
WS : Wait for Start (STAND-BY mode)
SC : Syrup Concentration preceding seeding
GR : Graining (up to 25 % by volume crystal content)
BU : Boiling up
DISPLAY STRUCTURE : data displa y.
There are 10 data organized in 2 columns which can be displayed for each crystallizer.
COLUMN 1:
SUPS. N.NN -- SUPERSATURATION. If the displayed data is equal to 1.00, the
syrup is saturated. A less than 1.00 value means that the syrup is
not saturated as yet. Real sup ersat ur ati on (a nd cry stal growt h)
exists only if the displayed value is larger than 1.00.
DENS. NNNN kg/m3 DENSITY. Massecuite density.
MA. SOL. NN.N % MASSECUITE SOLIDS CONTENT. During syrup concentration
(SC) up to seeding it is equal to the syrup (liquor) concentration (LI.
CONC.) measured by the refractometer.
CR. CT. NN.N % CRYSTAL CONTENT by volume.
CONSIST. NN.N % MASSECUITE CONSISTENCY. During syrup concentration
(SC) up to seeding it is equal to syrup viscosity. Range: 0 – 100 %.
COLUMN 2:
LI. PUR. NN.N % MOTHER LIQUOR PURITY. During syrup concentration (SC) up to
seeding the displayed value is equal to the feed syrup purity
determined by the local laboratory.
LI. CONC. NN.N % MOTHER LIQUOR CONCENTRAT ION. Concentration measured by
the refractometer.
MO. CONS. NN.N kW MOTOR CONSUMPTION (kW, or A). The use of stirrer motor
consumption data is not obligatory. If used, power consumption
is preferred.
TEMP. NN.N C MASSECUITE TEMPERATURE (˚C or ˚F). Temperature measu-
red by the refractometer is preferred.
(LEVEL NN.N %) MASSECUITE LEVEL. The use of level data is not obligatory.
Page 69

10 DISPLAY
69
69
1 / 0 . 1 1 / 0 . 1
Menu Manual seeding Menu Trend
Display Strike history
Set up Display Standard display
Configuration System inform.
Test data
DISPL AY - > TREND - > TREND 1 OF 2 1 / 0 . 1 DISPLAY -> TREND -> TREND 2 OF 2 1 / 0 . 1
SUPERSAT . MO. LIQ. PUR. SUPERSAT . MO. LIQ. PUR.
DENSITY 3RD INPUT DENSITY 3RD INPUT
MASS. SOLIDS C. MO. LIQ. CONC. MASS. SOLIDS C. M O. L IQ. CONC.
CRYSTAL CONTENT TEMPERATURE CRYSTAL CONTENT TEMPERATURE
CONSISTENCY LEVEL CONSISTENCY LEVEL
SUPER SATURATION : 1 .0 9 Act. 1 / 0 . 1
1.22
1.01
0.8
21:27 22:27 23:27 1:27
SELECT
BACK
SELECT
ZOOM
(MEAN CR. SIZE N.NN mm) If LEVEL was not configured during configuration,
instead of LEVEL mean crystal size will be displayed.
10.2 TREND
The MAIN DISPLAY is the starting point to access different types of information displays by selecting Display
and the RIGHT ARROW soft key (Fig. 10.2 a).
There are up to 11 measured and calculated parameters which can be trended. Select Trend and enter the
service by pushing the RIGHT ARROW soft key (Fig. 10.3 b)).
a) b)
Fig. 10.3
TRENDING A SINGLE PARAMETER
Trend of a single parameter (for example: SUPERSATURATION) is shown in Fig. 10.4 b). If LEVEL was not
configured during configuration, instead of LEVEL data MEAN CR. SIZE will be displayed. Select a
parameter by using the UP / DOWN ARROW and SELECT.
a) b)
Fig. 10.4
Scaling of the vertical axis is automatically adjusted to result in best trend resolution. The last data value is
the one located in the crossing point (“cursor”) of the horizontal and vertical dashed lines. The data value
(belonging to the cursor position) is numerically displayed after the parameter name. It is followed by the text
“Act.”, meaning that the trend is based on actual, or current strike data.
Pushing the ZOOM key will pop up Fig. 10.5 trending the same data, but using the full screen. The trend
display provides additional possibi lit ies :
• The cursor can be moved and stopped along the trend by using the LEFT or RIGHT ARROW (soft
keys), while the value of the parameter will be displayed numerically.
• Movement of the cursor can be stopped either by a repeated push of the same, or the opposite key.
Besides the current (“Act.”) trend of the selected parameter additional 3 trends of the same parameter based
on data of the 3 previous strikes can be displayed by using the DOWN or UP ARROW soft keys. Strikes will
be identified by the text:
Page 70

10 DISPLAY
70
70
SUPER SATURATION: 1.0 1 Act . - 1 1 / 0 . 1
1.23
1.02
0.8
21:27 22:27 23:27 1:27
MASS. SOLIDS C.: 88 .9 % Act. 1 / 0 . 1
90
81
65
21:27 22:27 23:27 1:27
SUPERSATURATION : 1 .09 Act. 1 / 0 . 1
1.22
1.01
0.8
21:27 22:27 23:27 1:27
2
MENU
“Act. – N” where N = 1…3.
Fig. 10.5
To return to the MAIN DISPLAY push ESCAPE.
TRENDING 2 PARAMETERS
It is possible to trend 2 selected parameters at the same time, too (Fig. 10.6). Having selected the first one
(Fig. 10.4 a)) a second parameter can be selected (UP / DOWN ARROW, Fig. 10.4 b)). By moving the 2
cursors at the same time (LEFT ARROW, RIGHT ARROW) data pairs belonging to the same time will be
displayed numerically.
The cursors can be stopped by a repeated push of the selected horizontal arrow, or by pushing the one of the
opposite direction. It is also possible to view trends of the same parameter pairs based on data acquired
during 3 previous strikes (DOWN ARROW, UP ARROW).
Pushing ENTER will zoom Signal 1 to full size. If followed by keying 2 on the keyboard Signal 2 will appear in
full size. Keying 1 or 2 brings back one or the other of the two signals in full size.
To return to the MAIN DISPLAY push ESCAPE.
10.3 STRIKE HISTORY
It is impo rtant to provide reliable information on strikes for the technologists and pan operators right on the
plant floor. The most important parameter of crystallization is supersaturation, but additional massecuite
parameters might provide useful information, too.
There are two ways to obtain information on strikes monitored by SeedMaster 2.
Fig. 10.6
Page 71

10 DISPLAY
71
71
DISPLAY->STRIKE HISTORY : SUPERS.
1 / 0 . 1
NO . SEED MAX. MIN. END AV.
ACT. 1 . 1 2 1 . 1 6 1 . 0 7 1 . 0 9 1 . 1 3
- 1 1 . 1 2 1 . 1 6 1 . 0 8 1 . 0 8 1 . 1 1
- 2 1 . 1 2 1 . 1 5 1 . 0 7 1 . 1 0 1 . 1 5
- 3 1 . 1 2 1 . 1 4 1 . 0 7 1 . 0 9 1 . 1 3
BACK
BACK
STRIKE HISTORY
STRIKE HISTORY (Fig. 10.7) contains condensed numerical information on supersaturation in critical points
of up to 4 strikes (current or actual and 3 previous strikes). These supersaturation data are:
SEED : Supersaturation in the seeding point (not depending on the mode of seeding).
MAX. : Highest supersaturation after seeding has been compl eted .
MIN. : Lowest supersaturation after seeding has been completed.
END : Supersaturation at the end of the strike.
AV. : Average supersaturation from seeding to the end of strike.
Fig. 10.7
NOTES:
1. Less than 1,00 supersaturation when seeding (SEED) results in loss (dissolution) of the seed
crystals. This can lead to low crystal content when dropping the charge. If it was higher than the critical
supersaturation (see Fig. 2.1), than most probably shock seeding was practiced, and / or
spontaneous nucleation took place.
2. If the MAX value was larger than the critical supersaturation it most probably will be shown in inferior
product quality (fines and conglomerate content, product color, see Ch. 2.5).
3. Less than 1,00 MIN or END value results in the loss of already crystallized sugar, low crystal content
and / or long strike time.
4. The average value of supersaturation is inversely proportional to crystallization time.
5. The average value can be directly used to answer the appropriate question during Configuration.
6. In case of mains failure during a strike AV can not be calculated. N.A. will be displayed.
IMPORTANT:
STRIKE HISTORY provides a very efficient and fast method to asses the level of control (manual or
automatic) exercised.
DETAILED STRIKE HISTORY
Detailed strike history, that is in-depth information on up to 11 massecuite parameters and measured data
acquired during the last 4 strikes (current, or actual and 3 previous ones) can be obtained by using the
TREND-s, which are automatically prepared by SeedMaster 2 (see Ch. 10.2).
WHEN USED EFFECTIVELY, STRIKE HISTORY TOOLS CAN HELP TO VASTLY IMPROVE
CRYSTALLIZATION PRACTICE. If a PCS is in use, strike history data can be sent to it for further use (see
Ch. 11).
10.4 STANDARD DISPLAY
The STANDARD DISPLAY (Fig. 10.8) can be used to display 2 (per crystallizer) preferred parameters of the
massecuite with large characters. The 2 parameters can be selected from those available (maximum 11) for
this type of display during the SET UP -> DISPLAY operations (see Ch. 8.1).
Page 72

10 DISPLAY
72
72
WARNSD STANDARD DISP LAY P1:95.2% 1 / 0 . 1
SUPERSATURATION : MASS. SOLIDS C.: %
0.81 72.8
SEEDED
STANDARD DIS PLAY P2:92.32 %
2 / 0 . 2
SUPERSATURATION : MASS. DENSITY: kg/m3
1.12 1482
BACK
WARNSD SYSTEM INFORMATION 1 / 0 . 1
INPUT OUTPUT SEEDING
CONC . : SER . SER . : 0 AUTO SUPS .
TEMP . : SER . 0 - 20 : 0 SETP . : 1 . 12
MOTOR: 4 - 20 4 - 20 : 2
SW. ver sion: 1.1
SYSTEM INFO RMATION 2 / 0 . 2
INPUT OUTPUT SEEDING
CONC . : SER. SER . : 0
TEMP . : SER. 0 - 20 : 0 COMM.
DENS.: COMM. 4 - 20 : 2
SW. ver sion: 1.1
BACK
Fig. 10.8
This is a display – only presentation of the selected data. Information on seeding and on the purity of the feed
syrup currently in use is also presented. The only operation (BACK) results in the return to the previous step
on the selection tr ee.
10.5 SYSTEM INFORMATION
SYSTEM INFORMATION provides a brief summary on data inputs and outputs and on the selected mode of
seeding (Fig. 10.9).
Fig. 10.9
The 1st row shows :
1. current information on seeding :
BLANK : blank (no seeding in close as yet)
WARNSD : warning on approaching seeding (see Ch. 7.5)
SEEDED : seeding is over.
2. INSTRUMENT NO. over TAG.
The INPUT column lists the types of inputs configured for the CONCENTRATION, TEMPERATURE and
THIRD INPUT data. The last one is identified by the actual name of the type of input (MOTOR, DENS., MA.
SOL., CR. CONT. meaning motor consumption, density, massecuite solids content and crystal content
determined by the laboratory) selected during configuration.
Possibilities:
SER. : Data input directly from the refractometer using communication (COMX port).
4 – 20 : Standard current, mA.
0 – 20 Standard current , mA
MAN : Laboratory crystal content data (see Ch. 7.3.3), manual entry.
COMM. : Data transfer via digital communication (COMX or Ethernet).
Page 73

10 DISPLAY
73
73
1 / 0. 1 1 / 0 . 1
Menu
Trend Menu Analog input
Strike history Analog output
Display Standard display Display Digital I/O
System information COMX ports
Test Test Other data
Events
Modbus reg.
DISPL AY - > TEST -> ANALOG INPUT
ANALOG INPUTS
AI_1 : 12.4 mA AI_5 : 18.9 mA
AI_2 : 0 mA AI_6 : 0 mA
AI_3 : 0 mA AI_7 : 0 mA
AI_4 : 0 mA AI_8 : 0 mA
BACK
The OUTPUT column lists the number of serial (COMX.), digital communication (COMM.) and Standard
current (0-20 mA and 4-20 mA) outputs.
The SEEDING column provides information on the type of seeding selected (MANUAL, AUTO SUPS., or
AUTO DENS. With the selected SET POINT or commanded via COMMUNICATION).
SW. version X.X provides information on the software version used in the device.
10.6 TEST DATA
The TEST display is a tool to check the operation of SeedMaster 2 hardware and some of its software.
Analog input
a) b)
Fig. 10. 10
Fig. 10.11
In Fig. 10.11 current (actual) analog (standard current) inputs from 2 transmitters (for example: 2 motor
consumption transmitters) are shown.
NOTE:
SeedMaster 2 has 8 analog inputs which can serve 2 instruments. If 2 pans are served, it is recommend ed to
reserve channels AI_1…AI_4 for instrument I1 and inputs AI_5…AI_8 for instrument I2, respectively, which
makes instrument identification and eventual addition of further inputs easier.
Page 74

10 DISPLAY
74
74
DISPLAY -> TEST -> ANALOG OUTPUT
ANALOG OUTPUTS
AO_1 : 7 . 2500 mA
AO_2 : 14 . 2000 mA
AO_3 : 4 . 0000 mA
AO_4 : 4 . 0000 mA
BACK
DISPLAY -> TEST -> DIGITAL I / O
DIGITAL INPUTS ( DI_1…DI_8 ) :
1 2 3 4 5 6 7 8
1 0 0 0 0 0 0 0
DIGITAL OUTPUTS ( DO_1…DO_4 ) :
1 2 3 4
1 0 0 0
BACK
DISPLAY -> TEST -> COMX port 1 / 0 . 1
0 0
0 0
0 0
0 0
0 0
0 0
0 0
0 0
0 0
0 0
0 0
ERRORS: 0 0
Concentration:
: 3 Temperature : 3
BACK
RESET
Analog output
Actual standard current output can be checked using this feature (Fig. 10.12).
Fig. 10.12
Digital I / O
Status information on digital I / O-s :
Fig. 10.13
COMX port
Fig. 10.14
Page 75

10 DISPLAY
75
75
DISPLAY -> TEST -> OTHER DATA
CRYST. PARAMETER : 0 , 0 2 7 2 8 5
TIME OF CRYST. (M) : 9 8 min
AVERAGE SUPERS. : 1 , 1 2
BACK
Display -> Test -> COMX port is used to test serial data input (concentration and temperature data from a
PR-01-S refractometer) during the ACTIVE MODE of operation (see Ch. 3.3). Whenever concentration or
temperature data are outside their normal ranges the data will be replaced by the appropriate RANGE HIGH,
or LOW limit values and the error counters Concentration and / or Temperature will be incremented. The
contents of the 2 counters can be cleared by using RESET.
NOTE:
Concentration or temperature data are regarded normal when they are within ranges characteristic of the
usual active crystallization procedures (see Ch. 6.2). However, they can be outside their respective normal
ranges for example after dropping the charge or during cleaning of the pans (concentration or temperature
can be too high). This kind of data monitoring is therefore only active when the strike is ACTIVE, too.
Other data
Fig. 10.15
CRYST. PARAMETER : It is used in crystal growth calculations. It is automatically calculated
(re-calculated) after completing or modifying configuration.
TIME OF CRYST. (M) : Time measured from seeding till the end of strike (minu tes) .
AVERAGE SUPERS. : Average supersaturation from seeding till the end of strike.
NOTES:
1. After the first complete strike, TIME OF CRYSTALLIZATION and AVERAGE SUPERSATURATION
data can be used to refine the data given previously to the related questions during configuration.
2. After a mains failure during a strike AVERAGE SUPERSATURATION can not be calculated. N.A.
will be displayed.
Events
Events are categorised as
• non-acknowledged,
• acknowledged and
• history
types. All three have their dedicated screens with exact date and time data, instrument identification number
(1 / or 2 /), name of the signal and event type (RANGE EXCURSION, HIGH / LOW ALARM). Acknowledged
events are cleared from the list of non-acknowledged ones. The Events History list contains all events until
they fill available memory, when the oldest events will be overwritten with the most recent ones.
Page 76
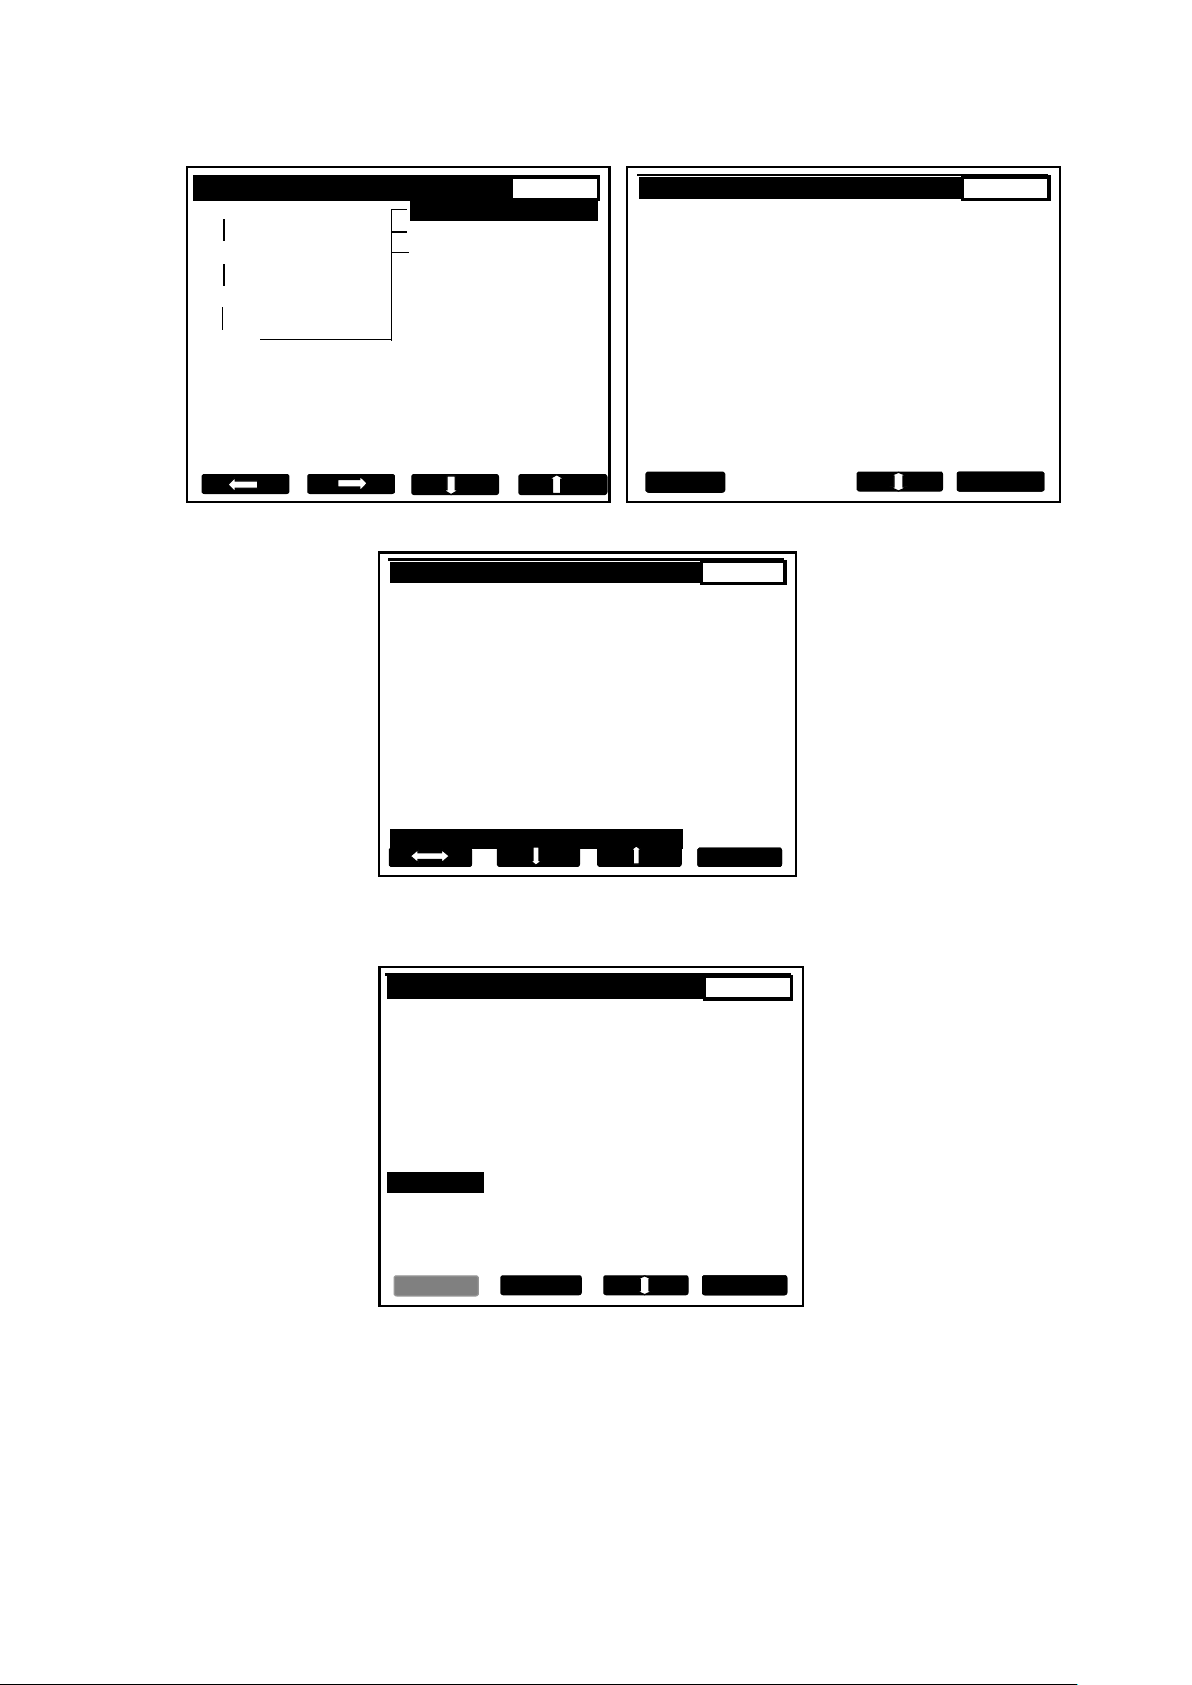
10 DISPLAY
76
76
1 / 0 . 1 TEST->EVENTS->NON-ACKNOWLEDGED 1 / 0 . 1
Menu Non-acknowledged YEAR:2005 MONTH: 07
Acknowledged DAY: 29 HOUR: 14
Display History
HH:MM EVENTS
14:16 1 / CR. CONT. LAB
RANGE E.
Test 14:22 1 / MA. SOL.
HIGH AL.
14:25 2 / MO. CONS.
LOW AL.
Events
BACK
ACKN.
TEST->EVENTS->HÍSTORY 1 / 0 . 1
EVENTS' YEAR:2005 MONTH: 07
HISTORY DAY: 29 HOUR: 14
HH:MM EVENTS
13:02 2 / LEVEL RANGE E.
13:02 2 / LEVEL RANGE E. OK
14:08 1 / L I. CONC. HIGH AL.
14:11 1 / L I. CONC. HIGH AL. OK
14:15 1 / DENS. OUT
HIGH AL.
14:16 1 / CR. CONT. LAB
RANGE E.
14:16 1 / CR. CONT. LAB
RANGE E. OK
14:15 1 / DENS. OUT
HIGH AL. OK
14:22 1 / MA. SOL . HIGH AL.
14:25 2 / MO. CONS.
LOW AL.
ACKN.
BACK
TEST -> MODBUS REG. 1 / 0 . 1
Base address 0
Reg. addr. Type Value
0 float 0 . 00000
2 float 0 . 00000
4 float 0 . 00000
6 float 0 . 00000
8 float 0 . 00000
10 float 0 . 00000
12 float 0 . 00000
14 float 94 . 6699
16 float 0 . 17800
18 float 0 . 82800
20 float - 2 . 10000
CHANGE
BACK
ACCEPT
a) b)
c)
Fig. 10.16
MODBUS registers
Fig. 10.17
Communication when using the MODBUS protocol can be checked. Register addresses, type of data
(floating, word) and data values are displayed. Base address can be changed.
NOTE:
For communication details when using the MODBUS protocol see Chapter 11.
Page 77

11 COMMUNICATION
77
77
11 COMMUNICATION
11.1 ETHERNET COMMUNICATION
It is possible to use the Ethernet port of SeedMaster 2 to implement two-way communication with a
computer, a Process Control System (PCS), or with any other intelligent device having an Ethernet interface
with TCP / IP protocol support.
There are two ways to use Ethernet communication with SeedMaster 2:
• direct communication with a computer (for example: with a PC), and
• by integrating SeedMaster 2 in a LAN (Local Area Network) using
a HUB, a SWITCH or ROUTER,
a WLAN (wireless network WiFi), or
optical cables (FDDI, Fiber Ethernet).
Data transmission using the Ethernet
Measured and calculated data, parameters and digital (ON/OFF) data can be transmitted in both directions
between SeedMaster 2 and a computer, or a PCS.
Communication is based on the use of the MODBUS TCP / IP protocol. This is a client/server type
communication among devices connected in an Ethernet TCP/IP network. It is actually the network version of
the MODICON MODBUS RTU protocol.
A TCP:502 port is reserved for the communication. Playing the role of a MODBUS server SeedMaster 2 is
waiting for requests from clients (PC, PCS, SCADA). Data to be transmitted are stored in Register Tables in
the server. The MODBUS client asks for the transmission of these data. The communication structure is of
the request / answer type, that is the client asks for data from the server which responds by sending them.
A detailed description of the pr otoc ol can be found in:
Modbus Messaging Implementation Guide V1 0a.pdf
and in
Modbus Application Protocol V1 1a.pdf
Cable requirements and connection
Cable specification
SeedMaster 2 uses the standard 10/100BASE-T Cat 5E twisted pair cable with RJ45 type connector. The
maximum length of the cable is 100 m.
Direct connection to a computer: use a Cat E cross-over patch cable.
Using a wall type connector : use a Cat E straight-through patch cable.
Using other network devices : when using a HUB, SWITCH, ROUTER or WLAN access
point read the instructions for their correct connection.
If the application requires larger than 100 m cable length, or there is considerable electromagnetic
interference in the area use FDDI (Fiber Distributed Data Interface) connection with a media converter.
Connecting the Ethernet cable
To connect the cable to SeedMaster 2 open the front cover of the enclosure, loosen the front panel screw
and swing the panel open. The RJ45 type Ethernet connector is marked and can be accessed easily (Fig.
4.2). Insert the cable in one of the cable glands and plug the cable into the connector. Connect the other end
of the cable to the appropriate connector of the computer or other device (HUB, SWITCH, ROUTER or
WLAN access point).
WARNING:
It is advised to do the connection with mains power switched off.
NOTE:
SeedMaster 2 can be used with networks operating at 10 or 100 Mbit/sec speed of transmission. Speed
detection and adjustment is automatic.
Page 78

11 COMMUNICATION
78
78
Connection settings
Setting the IP address of SeedMaster 2
SeedMaster 2 uses the Ipv4 protocol for Ethernet communication, which requires setting of its IP address.
The factory setting of the IP address is: 192.168.0.100
The subnet mask : 255.255.255.0
If the device is connected to a single computer there is no need to change the IP address. If it is connected to
a local network (LAN), then ask the system administrator to assign an address for SeedMaster 2.
To change the IP address select:
Menu -> Configuration -> Interface -> Ethernet -> SeedMaster 2 (see Ch. 7.7.2 and Fig. 7.13).
SeedMaster 2 can operate as a DHCP (Dynamic Host Control Protocol) server, too. In this case it is abl e to
supply IP address(es) to the computer(s) connected to it automatically. This mode of operation can be
configured by selecting:
Menu -> Configuration -> Interface -> Ethernet -> SeedMaster 2 : DHCP SERVER = YES.
Consult your network administrator about the use of this mode of operation.
Setting the IP address of the computer
The description here supposes the use of the Windows XP operating system, but it is valid for all computers
running a Microsoft operating system. Consult the manual of the operating system in use.
NOTE:
Changing of network settings requires system administrator level authorization.
Steps to set the IP address:
1. Start -> Control Panel ->Network and Dial- up Connections
2. Net Connections
3. Local Connection
4. Properties
5. TCP / IP protocol -> Properties
The IP address can be entered or changed in the displayed window. There are two possible ways to do it:
• Obtain an IP address automatically.
In this case SeedMaster 2 should be operating as a DHCP server and must be configured
accordingly:
Menu -> Configuration -> Interface -> Ethernet -> SeedMaster 2 : DHCP SERVER = YES
There is no need to set any IP address in the computer because it will be assigned
automatically by SeedMaster 2.
• Use the following IP address.
Data entry windows :
IP ADRESS : 192.168.0.102
NETWORK MASK : 255.255.255.0
GATEWAY : 192.168.0.1
When finished, connect the computer and SeedMaster 2 with a cross-over patch cable.
NOTES:
1. The computer and SeedMaster 2 must be operating on the same subnet. This means that in their IP
addresses the first 3 numbers separated by points must be identical in both devices, while the fourth ones
must be different, but not equal to 0 or 255.
2. The Network mask must be identical in both devices.
Testing the connection
The RJ45 type connector of SeedMaster 2 has two diagnostic LED-s. The orange LED indicates a working
physical connection, while the green one ind icat es data traff i c in the cable.
To test the connection switch ON SeedMaster 2 first and check if the orange LED is lit, indicating that the
cable was plugged at both ends, the two devices are powered and the cable is of the required type.
Page 79

11 COMMUNICATION
79
79
A F RAH RAL RNH RNL
A F BN D1 … DN
A F RAH RAL RNH RNL BN D1 … DN
There is a ping command available in the Windows operating systems which can be used to test the
connection. This command sends small packages of data through the Ethernet network, which have to be
answered by the receiving device.
To start ping select
Start -> Command Prompt, enter
cmd.exe and OK, then
write ping and the IP address and OK in the opening window, for example:
ping 192.168.0.101
OK
If the connection is OK, then SeedMaster 2 will answer all requests and the number of lost data packets in
the Ping statistics will be zero. If there are errors during transmission error messages will be displayed, for
example: Destination host unreachable.
Troubleshooting
If a ping command results in an error message in the computer, check if
1. SeedMaster 2 is switched ON,
2. the LED-s of the RJ45 type connector are lit, if not, check if
• both ends of the cable are connected,
• the cable is of the required type (Cat E cross-over patch cable).
3. If the orange LED is lit the physical connection is OK.
4. If the green LED is not flashing during ping, check the IP address setting.
5. If SeedMaster 2 is not directly connected to a computer, but via a local network, there may be a
routing problem. Consult your network administrator.
MODBUS TCP / IP as implemented in SeedMaster 2
SeedMaster 2 operates as a SLAVE commu ni cati on stat ion. This means that data requests are obeyed if the
requested information (the registers containing it) exists.
SeedMaster 2 obeys MODBUS/TCP Class 1 type requests, that is:
Reading a Bloc of Registers (command code: 3)
Writing a Bloc of Registers (command code :16 (decimal))
Simply put: only reading and writing of Modbus registers is implemented.
Data available for transmission complete with their register addresses are collected in a table (see: MODBUS
Register Table).
MODBUS commands
READ MODBUS REGISTER (Command 3)
Query:
Response:
WRITE MODBUS REGISTER (Command 16 (decimal))
Query:
Page 80

11 COMMUNICATION
80
80
A F RAH
RAL RNH
RNL
Field name
Length Description
Client Server
Transaction ID 2 bytes
MODBUS Set by the
Copies the ID
transaction Client
set by the Client
identity in the response
Protocol ID 2 bytes
0 = MODBUS Set by the Copies the ID
Client set by the Client
in the response
Length
2 bytes Number of the Set by the
Set by the
bytes which Client
Server
follow (Request)
(Response)
Device ID 1 byte
Identity of the Set by the
Copies the ID
serial line, or
Client set by the Client
Ethernet device
in the response
Response:
Notation:
A SeedMaster 2 address (station address)
F command code
RAH, RAL base address of MODBUS registers,
RAH: high, RAL: low address byte
RNH, RNL number of MODBUS registers,
RNH: high, RNL: low byte of the number
BN number of data bytes sent (0…255)
D1…Dn data bytes, n=number of registers*2,
high byte first
Length of a MODBUS register: 2 bytes
The MODBUS /TCP messages consist of 3 parts:
• Header (7 bytes)
• Command code (1 byte)
• Data bytes
Header structure:
Transmission example:
The numbers shown are hexadecimal without spaces (the spaces inserted below are only to make read ing
easier).
Client’s request to READ REGISTERS:
25 00 00 00 00 06 15 03 00 00 00 0C complete message
25 00 00 00 00 06 15 header, SeedMaster 2 ID = 15(hex) = 21 (decimal)
03 command code (READ)
00 00 register base address
00 0C number of registers = 0C (hex) = 12 (decimal)
6 bytes
SeedMaster 2 response:
25 00 00 00 00 1B 15 03 18 6B 85 42 9D 85 1F 42 8B 97 ED 44 B7 6E CC 42 AC 00 00 00 00 00 00 00 00
Page 81

11 COMMUNICATION
81
81
MODBUS REGISTER
HIGH byte LOW byte
Most Significant Bit Least Significant Bit
15 0
High address MODBUS register Low address MODBUS register
High byte Low byte High byte Low byte
S Exponent Mantissa
31 30 23 22 0
25 00 00 00 00 1B 15 header, ID = 15 (hex)
03 command code (READ)
18 number of bytes = 18 (hex) = 24 (dec)
6B 85 42 9D 85 1F data (24 (dec) bytes)
42 8B 97 ED 44 B7
1B (hex) = 27 (dec) 6E CC 42 AC 00 00
bytes follow 00 00 00 00 00 00
18 (hex) bytes
Client’s request to WRITE REGISTERS:
0F 00 00 00 00 0E 15 10 00 80 04 08 80 00 42 9E 8A 3D 42 8D complete message
0F 00 00 00 00 0E 15 header, SeedMaster 2 ID = 15
10 command code (WRITE)
00 80 register base address
04 number of registers
08 number of bytes
80 00 42 9E 8A 3D 42 8D data
The Client requests writing the 8 data bytes in the registers of SeedMaster 2 with MODBUS address 15 (hex)
starting from base address 0080 (hex).
SeedMaster 2 will acknowledge the request with the following message:
0F 00 00 00 00 06 15 10 00 80 00 04 complete message
0F 00 00 00 00 06 15 header, SeedMaster 2 ID = 15
10 command code (WRITE)
00 80 register base address
00 04 number of registers
Numbers in the MODBUS registers
Storage of data in the MODBUS registers: Hbyte Lbyte
WORD data
This type of data is stored in 2 bytes (16 bits). T here is no sign stor ed and the range is 0 – 65535.
FLOATING POINT data
Floating point data in SeedMaster 2 comply with the IEEE 754 / 1985 SHORT REAL (SINGLE PRECISION)
format specification. The number consists of 3 parts:
• sign,
• exponent and
• mantissa,
which are stored in 4 bytes. Consequently, storage of floating point numbers requires 2 MODBUS registers.
The value of the sign bit S is 0, if the number is positive, and 1, if it is negative. Due to the fact that the
numbers do not use the 2-s complement notation, + 0 and – 0 are also represented.
The Mantissa is stored in normalized form w hich mea ns tha t:
bit 22 = 2-1, bit 21 = 2-2, … , and bit 0 = 2
-23
.
Page 82

11 COMMUNICATION
82
82
The Exponent field contains the sum of the actual exponent and a bias. Bias is used to make the number in
the Exponent field always positive. The value of Bias is always 127. The largest and the smallest value of the
exponent is used for error signalization, therefore the range of the exponent is – 127…+ 127.
-23
Floating point number = (-1)*S*(1+Bit22*2-1+Bit21*2-2+…+Bit0*2
11.2 MODBUS protocol using one of the COMX ports
SeedMaster 2 is able to exchange different types of data by using one of the serial COMX ports of the
device. The applied protocol is the MODBUS protocol. Both the MODBUS RTU and the MODBUS ASCII are
implemented in SeedMaster 2.
SeedMaster 2 operates as a SLAVE device/station. The MASTER, typically a PC sends requests to a slave
station and the addressed SeedMaster 2 answers if the required information (registers) are available.
The accessible data are listed in the SeedMaster 2 register set table (see: SeedMaster 2 register set, page
85).
A subset of the MODBUS protocol is implemented:
Command 3: Read Multiple Registers
Command 16: Write Multiple Registers
Important note:
The slave address parameter – together with the parameters of the serial line and the protocol- has t o be
given / defined before the installation of SeedMaster 2.
Remark: for more details please use “Modicon Modbus Protocol Reference Guide PI MBUS 300 Rev. J”.
The COMX ports of SeedMaster 2
There are 3 COM ports (COM1 to COM3, galvanically isolated) in the SeedMaster 2 device.
It is recommended to use COM1 for communication with a PCS or PC.
COM2 and COM3 can be used for connecting 1 or 2 refractometers to SeedM aster 2.
Setting the protocol parameters
The parameters of the serial line and the protocol have to be defined before the installation of SeedMaster 2
(see Ch. 7.7.1 for details).
The physical type of the serial line is user selectable:
• RS232
• RS485
• RS422 point to point
• RS422 multidrop
The serial line parameters:
Baud rate: 1200…38400
Data format : RTU mode
Bits per Byte: 1 start bit
8 data bits, least significant bit sent first
1 bit for even/odd parity; no parity bit for not defined parity
1 stop bit if parity is used; 2 stop bits if parity is not defined
Data format : ASCII mode
Bits per Byte: 1 start bit
7 data bits,
least significant bit sent first
1 bit for even/odd parity; no parity bit for not defined parity
1 stop bit if parity is used; 2 stop bits if parity is not defined
Users can configure SeedMaster 2 for Even or Odd Parity checking or for No Parity checking (only when
using ASCII mode)
For example if the eight data bits are 1100 0101, the total quantity of 1 bits in the frame is four. If Even Parity
is used, t he frame’s parity bit will be 0, making the total quantity of 1 bits still an even number (four). If Odd
Parity is used the parity bit will be 1, making an odd quantity (five).
Exponent-127
) *2
Page 83

11 COMMUNICATION
83
83
ASCII Framing
In ASCII mode messages start with a ‘colon’ ( : ) , and end with a ‘carriage return – line feed’ (CRLF) pair.
Coding System: One hexadecimal character contained in each ASCII character of the message, i.e. 1 byte
data transmission requires transmission of 2 characters.
The allowable characters transmitted for all other fields are hexadecimal 0–9, A–F.
Networked devices monitor the network bus continuously for the ‘colon’ character.
When one is received each device decodes the next field (the address field) to find out if it was its own device
address.
Intervals of up to one second can elapse between characters within the message.
If a greater interval occurs the receiving device assumes an error has occurred.
A typical message frame is shown below.
START: : (colon, 3A hex)
ADDRESS (device) : 2 hex characters
FUNCTION code : 2 hex characters code
DATA : 2…2N characters
LRC CHECK : 2 characters
END : CRLF (0D and 0A hex)
LRC : is the Error Check Field, Longitudinal Redundancy Check
(LRC) is used.
LRC Checking
Messages include an error checking field that is based on the Longitudinal Redundancy Check (LRC)
method. The LRC field checks the contents of the message exclusive of the colon start and CRLF end pair. It
is applied regardless of any parity check method used for the individual characters of the message. The LRC
field is one byte containing an 8 bit binary value. The LRC value is calculated by the transmitting device
which appends the LRC to the message. The receiving device calculates an LRC during receipt of the
message and compares the calculated value to the actual value it received in the LRC field. If the two values
are not equal an error will result. The LRC is calculated by adding together successive 8 bit bytes of the
message discarding any carries, and then two’s complementing the result. It is performed on the ASCII
message field contents excluding the colon character that starts the message, and excluding the CRLF pair
at the end of the message.
RTU Framing
In RTU mode messages start with a silent interval of at least 3.5 character times.
The first field then transmitted is the device address.
The data transmitted are bytes represented as 2 hexadecimal characters. The allowable characters
transmitted for all fields are hexadecimal 0-9 and A-F.
Networked devices monitor the network bus continuously including the silent intervals, too. When the first
field (the address field) was received, each device decodes it to find out if it was its own device address.
Following the last transmitted character a similar interval of at least 3.5 character times marks the end of the
message. The final CRC field has to be valid for a successful receive / transmit operation.
A typical message frame is shown below
DEVICE ADDRESS 1 byte hexadecimal address
FUNCTION CODE 1 byte hexadecimal code
DATA FIELD N bytes hexadecimal data
CRC CHECK 2 bytes hexadecimal CRC
CRC is the Error Check Field, 2 bytes. Cyclical Redundancy Check (CRC) is used.
CRC checking
In RTU mode messages include an error checking field that is based on a Cyclical Redundancy Check (CRC)
method. The CRC field checks the contents of the entire message. It is applied regardless of any parity check
method used for the individual characters of the message. Messages include a 2 bytes long CRC field.
CRC has to be calculated on the message except the CRC itself.
The polynomial used for calculation: A001H.
The next steps perform the CRC calculations:
1. Fill the CRC word with FFFF (hex) start value.
Page 84

11 COMMUNICATION
84
84
A F RAH
RAL
RNH
RNL
CH
CL
A F BN
D1 … DN
CH
CL
A F RAH RAL RNH RNL BN
D1 … CH
CL
A F RAH
RAL
RNH
RNL
CH
CL
Slave
Function
(high byte)
(low byte)
No of
No of
CRC
code
11h
03h
00h
00h
00h
40h
CRC
Slave
address
Function
code
No of the
bytes sent
Data bytes
CRC
(2 bytes)
2. XOR CRC high with the 1st data byte, the result remains in the CRC word.
3. Shift CRC 1 bit right.
4. If the most significant bit of the CRC was 0 before the shift, the next step is step 3 (go to step 3).
5. If the least significant bit of the CRC was 1 before the shift (1 was shifted out) then XOR CRC and the
CRC calculation polynomial A001 (hex), the result remains in the CRC word.
6. Repeat steps 3 & 4 until 8 shifts.
7. XOR CRC and the next data byte, the result remains in the CRC word.
8. Repeat 3-7 steps with all data bytes.
9. The result is the CRC code to be sent or verified.
The implemented MODBUS commands:
Read multiple MODBUS registers command, function code : 03(03h):
Query:
Response:
Write multiple MODBUS registers command, function code : 16 (10h):
Query:
Response:
where
A – slave address
F – function code
RAH, RAL – starting address of the MODBUS registers, order: high byte first
RNH, RNL – number of the MODBUS registers, order: high byte first
BN – number of the data bytes sent (0..255)
D1….Dn – n data bytes, n=BN*2, order: high byte first
CH, CL – CRC control code, order: high byte first
Examples
•Function code: 3 (read), RTU mode
Read the first 32 data (64 registers, i. e. 128 bytes) from the „read data” table of the 1
SeedMaster 2 having the station address 17 (11h):
Query:
address
code
1st register
address
1st register
address
registers
(high byte)
registers
(low byte)
st
Crystallizer of
(2 bytes)
Response:
Page 85

11 COMMUNICATION
85
85
(1byte)
11h
03h
80h
128 bytes
CRC
Slave
Function
byte)
byte)
No of
registers
No of
registers
No of
Data bytes
CRC
code
11h
10h
00h
180h
00h
40h
80h
128 bytes
CRC
Slave
Function
(high byte)
(low byte)
No of
No of
CRC
code
11h
10h
00h
00h
00h
40h
CRC
First register:
(reg1)
Second register:
(reg2)
High byte (reg1_Hi)
Low byte (reg1_Lo)
High byte (reg2_Hi)
low byte (reg2_Lo)
MSB
LSB
reg2_Hi
reg2_Lo
reg1_Hi
reg1_Lo
reg2_Hi
reg2_Lo
reg1_Hi
reg1_Lo
Exponent (8bit)
Mantissa (23 bit)
•Function code: 16 (write), RTU mode
Write the first 32 data (64 registers, i. e. 128 bytes) into the „write data” table of the 2nd
Crystallizer of SeedMaster 2 having station address 17 (11h):
Query:
address
Response:
address
Remark: Byte order on the MODBUS communication: High byte first, Low byte second.
code
1st register
address
(high
code
1st register
address
(low
1st register
address
(high
byte)
1st register
address
(low
byte)
registers
(high byte)
bytes
(1 byte)
registers
(low byte)
(2
bytes)
(2 bytes)
11.3 Data types used in the MODBUS registers
A single MODBUS register has 2 bytes for data storage.
Byte (8 bit unsigned integer)
Low or high byte of a MODBUS register, value range 0…255 (00h…FFh)
Word (16 bit unsigned integer)
One MODBUS register can be a word type variable, value range 0 .. 65535 (0000h … FFFFh)
Real (FLOAT)
All of the SeedMaster 2 data / variables are 4 byte real type.
The real values have the standard IEEE 754/1985 SHORT REAL (SINGLE PRECISION) 4 byte format and
are stored in two consecutive registers.
The value range is +/-(8.43*10
Measured and calculated data of SeedMaster 2 are of the 4 byte real, IEEE standard type.
This way a SeedMaster 2 real (float) data can be accessed by reading 2 registers.
Data on the serial line reading a measured value:
The received bytes have to be arranged as shown below to form a real number:
-37
– 3.4*10
+38
), the resolution is 7 decimals.
The number format:
S: Bit31 sign of the number, 0 if the real number is positive.
Page 86

11 COMMUNICATION
86
86
Base addresses
Type
Name
0
Crystallizer 1 Read only
O1 RO
128
Crystallizer 1 Read-Write
O1 RW
256
Crystallizer 2 Read only
O2 RO
384
Crystallizer 2 Read-Write
O2 RW
Offset address
Register name
Type
O1 RO
O1 RW
O2 RO
O2 RW
128
130
132
134
136
138
140
Exponent: Bit30..Bit23 the value is the exponent of the number+127. The range is -126…127
Mantissa : Bit22..Bit0 normalized, highest bit means ½, the next one ¼ and so on.
Value of the real number can be calculated using the formula below:
Exponent-127
Value= (-1)*S * (1+Bit22*2-1+Bit21*2-2+Bit20*2-3+…...+Bit0*2
Remark: The -0 is „not a number”.
11.4 Register set
SeedMaster 2 can handle 2 crystallizers simultaneously.
There are dedicated “read” and “write” data tables for both crystallizers, using two identical register sets for
communication. One table (read only, or RO) stores measured and calculated data. The other table (read
and write, RW) serves for writing parameters or to input data into SeedMaster 2.
The register sets are identical, so the addresses can be calculated as follows:
Address= base address + offset address
-23
) *2
SeedMaster 2 register set
(decimal)
(decimal)
0 Concentration (syrup, m. l.) Real 0
2 Temperature Real 2
4 Massecuite density Real 4
256
258
260
384
386
388
6 Massecuite solids content Real 6
8 Motor consumption Real 8
10 Crystal content (laboratory) Real 10
12 Level Real 12
262
264
266
268
390
392
394
396
Page 87

11 COMMUNICATION
87
87
142
144
18
146
20
148
22
150
24
152
26
154
28
156
30 158
32
160
34
162
36
164
38
166
40
168
42
170
44
172
46
174
48
176
50
178
52
180
54
182
56
184
14 Mean crystal size Real 14
16 Syrup „m” parameter Real 16
18 Syrup „b” parameter Real
20 Syrup „c” parameter Real
22 Real
24 Pan max. level Real
26 Motor cut-off consumption Real
28 Motor cons. (Phase 1 end) Real
30 Motor cons. (strike end) Real
32 Motor constant Real
270
272
274
276
278
280
282
284
286
288
398
400
402
404
406
408
410
412
414
416
34 Crystal cont. (Phase 1 end) Real
36 Conc. (Refr., Phase 1 end) Real
38 Conc. (Refr., strike end) Real
40 Temp. (Refr., Phase 1 end) Real
42 Temp. (Refr., strike end) Real
44 Crystal cont. (lab., seeding) Real
46 Crystal cont. (lab., str. End) Real
48 Seed crystal size Real
50 Product crystal size Real
52 Length of crystal time Real
290
292
294
296
298
300
302
304
306
308
418
420
422
424
426
428
430
432
434
436
54 Average supersaturation Real
56 Supersaturation Real
310
312
438
440
Page 88

11 COMMUNICATION
88
88
58
186
60
188
62
190
64
192
66
194
68
196
70
198
72
200
74
202
76
204
78
206
80
208
82
210
84
212
86
214
88
216
90
218
92
220
94
222
96
224
98
226
100
228
58 Crystal content Real
60 Consistency Real
62 Mother liq. Purity Real
64 Strike Act SEED Real
66 MIN Real
68 MAX Real
70 END Real
72 Strike Act-1 SEED Real
74 MIN Real
76 MAX Real
314
316
318
320
322
324
326
328
330
332
442
444
446
448
450
452
454
456
458
460
78 END Real
80 Strike Act-2 SEED Real
82 MIN Real
84 MAX Real
86 END Real
88 Strike Act-3 SEED Real
90 MIN Real
92 MAX Real
94 END Real
96 Warn seed value (supersat.) Real
334
336
338
340
342
344
346
348
350
352
462
464
466
468
470
472
474
476
478
480
98 Warn seed value (density) Real
100 Set-point (seeding, supers.) Real
354
356
482
484
Page 89

11 COMMUNICATION
89
89
102
230
Strike active (start of str.)
104
232
See
105
233
Seeding
106
234
Type of seed warning
107
235
Type of seeding set
108
236
Level (measured)
109
237
Purity
110
238
Purity No.2.
112
240
Purity No.3.
114
242
Level L1
116
244
Level L2
118
246
Level (maximal)
120
248
102 Set-point (seeding, density) Real
104
105
106
107
108
109
110
112
114
d warning WORD
WORD
(supers./density)
(supers./density)
No.1. REAL
REAL
REAL
WORD
WORD
-point
WORD
WORD
358
360
361
362
363
364
365
366
368
370
486
488
489
490
491
492
493
494
496
498
116
118
120
1. WORD content (command) to START STRIKE : 1
2. WORD content (command) to STOP STRIKE : 0
3. WORD content (command) to SEED : 1
4. WORD content (command) to de-activate SEED : 0
REAL
REAL
REAL
NOTES:
372
374
376
500
502
504
Page 90

12 APPENDECES
90
90
SATURATION COEFFICIENT VERSUS NONSUGAR TO WATER RATIO ( NS/W)
(m = 0.194; b = 0.771; c = -1.8)
0,92
0,94
0,96
0,98
1
1,02
1,04
1,06
1,08
1,1
1,12
0 0,2 0,4 0,6 0,8 1 1,2 1,4 1,6 1,8
NONSUGAR TO WAT ER RATIO (NS/W)
12 APPENDIX 1 : PROCEDURE TO EVALUATE THE “m”, “b” AND “c”
COEFFICIENTS OF THE WIKLUND-VAVRINECZ SATURATION FUNCTION.
12.1 Introducing the solubility coefficient
By analyzing a large amount of data on sugar solubility in beat sugar molasses collected by different researchers,
Wiklund and Vavrinecz developed an equation (saturation function) for the calculation of the solubility (or
saturation) coefficient.
The solubility coefficient is defined by the ratio
Z’
C = ----- Z
where:
Z’ : sugar in solution in the impure sugar solution at saturation, g/100 g water.
Z : sugar in solution at saturation in the pure sugar solution at the same temperature, g/100 g
water.
The solubility coefficient can be calculated by the saturation function as
Fsat = C = m.NS/W + b + (1-b). EXP(c.NS/W) (
where:
NS/W : nonsugar to water ratio
m, b, c : syrup quality parameters to be determined by the local labor ator y .
NOTE :
The syrup quality parameters depend only on the composition of the nonsugars. They do not depend on the
temperature or on the amount of nonsugars.
Solubility coefficient versus non-sugar to water (N/W) ratio
Eq. 2)
Fig. A.1
Fig. A.1 shows the saturation function with parameters typical for beat sugar molasses.
It can be seen (and proved, too), that above some NS/W ratio (in this case about 1.2) the function can be
represented by a straight line with a slope equal to “m”. Below this NS/W value the function is more and more
represented by the exponential part.
One of the several possible ways to determine the local syrup quality parameters in the laboratory is described
below.
Page 91

12 APPENDECES
91
91
ORIGINAL SAMPLES :
SOL (g)
S (g)
Q (%)
NS (g)
W (g)
Gsample (g)
1
83,22
51,37
61,73
31,85
16,78
100,00
2
83,22
51,37
61,73
31,85
16,78
100,00
3
83,22
51,37
61,73
31,85
16,78
100,00
4
83,22
51,37
61,73
31,85
16,78
100,00
5
83,22
51,37
61,73
31,85
16,78
100,00
6
83,22
51,37
61,73
31,85
16,78
100,00
7
83,22
51,37
61,73
31,85
16,78
100,00
Selected
Calculated
range :
water :
(NS/W)*
W* (g)
Wadd (g)
1
1,90
16,78
0,00
2
1,6
19,91
3,13
3
1,2
26,54
9,76
4 1 31,85
15,07
5
0,7
45,50
28,72
6
0,4
79,63
62,85
7
0,2
159,25
142,47
8 0
12.2 Determining the local syrup parameters
12.2.1 Sample preparation for the saturation test
A) Take 7-10 samples 100 g each from the same low-purity final molasses (green syrup) and determine
concentration, sugar content and purity data in the lab. Calculate non-sugar and water content, too. Put the
samples in vessels which can be well sealed later on in order to prevent evaporation or leakage.
EXAMPLE :
where :
SOL (%, g) : solids content (concentration)
S (%, g) : sugar content
Q (%) : purity = 100.S/SOL
NS (g) : non-sugar content = SOL - S
W (g) : water content = Gsample - SOL
B) Calculate the non-sugar to water ratio (NS/W) and enter it for sample No.1, which from now on will represent
the original sample with its original NS/W ratio . Select (NS/W )* values which will r esult i n well dis tribut ed data in
the complete range from (NS/W)* = 0 to the original one.
Using the selected (NS/W)* and the original water content (W) calculate new water content (W*) and water to add
(Wadd) data for samples No.2-No.7.
NOTE : when (NS/W)* = 0, the saturation coefficient is always equal to 1.0.
SOL.(100 - Q)
NS/W = ----------------------
100.(100 - SOL)
W* = NS/(NS/W)* (g)
Wadd = W* - W (g)
EXAMPLE (continued) :
Add the listed amount (Wadd) of pure water to each sample. Sample preparation is now complete.
Page 92

12 APPENDECES
92
92
MEASURED AND CALCULATED DATA AT SATURATION :
SOL (%)
S (%)
Q (%)
S/W
SAT.COEFF.
1
83,71
54,00
64,51
331,49
1,149
2
82,50
54,70
66,30
312,57
1,083
3
80,50
57,46
71,38
294,67
1,021
4
79,30
59,20
74,65
285,99
0,991
5
77,90
62,20
79,85
281,45
0,975
6
76,20
66,30
87,01
278,57
0,965
7
75,10
70,10
93,34
281,53
0,976
8
1,000
(NS/W)**
SAT.COEFF.
12.2.2 Saturation test
A) Use increasing amounts of icing sugar and during continuous mixing add them to the samples. The weight of
sugar to add should be a little more than enough to saturate the sample. Having added the sugar, close the
sample containers carefully and put them in a common temperature controlled bath, where they should be kept at
constant temperature and well mixed for several hours.
Select the temperature of the bath to equal for example 60 C. The actual value is not critical, it can be in the 4070 C range, but it should be kept constant by a temperature controller at its set-point.
B) Saturation of the samples with sugar needs good mixing and even so may take several hours. It can be
regarded as complete when the change in the concentration of the sample liquid becomes negligible.
12.2.3 Evaluation
A) When the saturation test is complete, remove undissolved crystal sugar from the samples and determine
concentration, sugar content and purity data for each sample in the laboratory.
Calculate the S/W (sugar to water) ratio for each sample and by using the pure sugar solubility data valid for the
selected sample temperature calculate the solubility coefficient for the samples.
SOL. Q
S/W = ------------- (g sugar/100 g water)
(100 -Q)
Use look-up tables (collected by Grut, or Vavrinecz) to get data valid for pure sugar solubility at the selected
saturation temperature. For completeness some of these data are presented here:
Sugar solubility data (g/100 g water) for pure solutions according to Grut and Vavrinecz:
Temperature (C) Grut (SG) Vavrinecz (SV)
50 262.0 258.63
55 277.0 272.81
60 293.0 288.56
65 311.0 305.96
70 331.0 325.15
S/W S/W
SAT. COEFF. = --------- , OR SAT. COEFF. = --------- SV SG
EXAMPLE (continued) :
(In this example SV is being used).
B) Calculate the final nonsugar to water ratios (NS/W)** of the samples based on the laboratory data, then draw
the Saturation Coefficient versus (NS/W)** chart using Excel.
EXAMPLE (continued):
Page 93

12 APPENDECES
93
93
1
1,824
1,149
2
1,589
1,083
3
1,182
1,021
4
0,971
0,991
5
0,710
0,975
6
0,416
0,965
7
0,201
0,976
8 0 1,000
SAT.COEFF.
0,96
0,98
1
1,02
1,04
1,06
1,08
1,1
1,12
1,14
1,16
0 0,2
0,4
0,6 0,8 1
1,2 1,4
1,6
1,8 2
SAMPLE NONSUGAR TO WA TER RATIOS (NS/W)**
SATURATION COEFFICIENT
y = 0,1936x + 0,788
R2 = 0,9717
1
1,02
1,04
1,06
1,08
1,1
1,12
1,14
1,16
1 1,1 1,2 1,3 1,4 1,5 1,6 1,7 1,8 1,9
SAMPLE NONSUGAR TO WATER RATIOS (NS/W)**
Fig. A.2
It can be seen (Fig. A2.) that the linear part of the chart starts at about (NS/W)** = 1.2. This belongs to sample
numbers 1, 2 and 3. Separate these data on another chart and do the linear least square calculation in Excel
(Fig. A3.) :
Now we already have the “m” and “b” parameters :
m = 0.194 b = 0.788
Fig. A.3
Page 94

12 APPENDECES
94
94
(NS/W)**
SAT.COEFF.
S.C.-m.(N/W)**-b
1
1,824
1,150
2 1,589
1,085
3
1,182
1,022
4
0,971
0,992
0,0150
5
0,710
0,977
0,0498
6
0,416
0,967
0,0969
7
0,201
0,977
0,1489
8
0,000
1,000
0,2110
SATURATION COEFFICIENT - m.(NS/W)** - b
y = 0,211e
-2,4677x
R
2
= 0, 9423
0,0000
0,0500
0,1000
0,1500
0,2000
0,2500
0,000 0,100
0,200 0,300 0,400 0,500 0,600 0,700
0,800 0,900 1,000
SAMPLE NONSUGAR TO WATER RATIOS (NS/W)**
Let us continue with the part of the chart valid for lower nonsugar to water ratios (sample numbers 4, 5, 6, 7).
Calculate
SAT.COEFF - m.(NS/W)** - b
data for these samples and do again a least squares fit in Excel for these data using 1-b as Y axis intercept :
Now we have completed the task by finding from the data fit :
c = - 2,47
The complete set of parameters is :
m = 0,194
b = 0,789
c = - 2,47
Fig. A5. shows th e sample data on the saturation coeff icient and the value of th e saturation functio n
using the above set of quality parameters.
Fig. A.4
Page 95

12 APPENDECES
95
95
SAM PLE SATURATION COEFFICIENTS AND V ALUES OF T HE SATURATION FUNCTION
0,9
0,95
1
1,05
1,1
1,15
0 0,2 0,4 0,6 0,8
1 1,2 1,4 1,6 1,8 2
NONSUGAR TO WATER RAT IO
SAT.COEFF.
SATFUN.
Fig. A.5
NOTES:
1. The W iklund-Vavr inecz saturation f unction is the result of extensive research on sugar solubilit y in
beat sugar molasses. Unfortunately, there are very few similar data on cane sugar molasses.
However, there seem s to be no reason why the basic equation co uld not be used with cane sugar
molasses. Som e of the scarce data available indic ates that the “m”, “b” and “c” par ameters can dif fer
significantl y from those valid f or beat sugar. The result of thes e differences is more pronounced with
low purity syrups. Based on data collected by Thieme on cane syrups the parameters have been
determined (L.Rózsa: Sucrose solubil ity in impure cane sugar solutions, INTER NATIONAL SUGAR
JOURNAL, 2000, VOL. 102, 230-235):
m = - 0, 06265 b = 0,982 c = - 2,1
2. It is important to do the saturation test starting with low purity (C product) sample (“original
sample”), in order to get fair ly accur ate linear equatio n on the linear part of the function. Ac curac y can
be improved by using more samples, too.
3. The first (exponential) part of the saturation function can quite often be well represented by a
constant “c” usually equal to -2.1, or -1.8.
4. How often should th e syrup quality parameters be determined depends on se v er al fac tor s , lik e t ype
of the sugar beat or c ane processed, fertilizer being used b y the farmers, storage temperature etc.
and has to be determined based on local experience.
Page 96

12 APPENDECES
96
96
APPENDIX 2 : CONFIGURATION DATA SHEETS
Page 97

12 APPENDECES
97
97
SeedMaster 2 CONFIGURATION DATA SHEET Device number: 1
Process Control Kft. Instrument TAG: /
THIRD INPUT : MASSECUITE SOLIDS CONTENT
Plant:
Date :
DATA: NOTES:
+ SENSOR CALIBRATION NO
YES Selectable.
SEED CRYSTAL SIZE mm Mean crystal size.
PRODUCT CRYSTAL SIZE mm Mean crystal size.
CR. CONT. (LAB, STR. END) % Product crystal content by volume, laboratory data.
X LEVEL MEAS. YES Selectable.
X PAN MAX. LEVEL % Level data are available.
# LEVEL MEAS. NO Selectable.
# LENGTH OF CRYST. TIME min If level data are not available.
CONC. (REFR., SEED.) % Concentration measured by the refractometer just before seeding.
+ MA. SOL. (LAB, STR. END) ------------ % If calibration was selected. Laboratory data at strike end.
+ MA. SOL. (SEED.) ------------ % Concentration just before seeding (microwave or nuclear probe).
+ MA. SOL. (STR. END) ------------ % Solids content at strike end (microwave or nuclear probe).
SYRUP PARAMETERS: STANDARD BEET STANDARD CANE
LOCAL : m = b = c =
FEED SYRUP PURITY: P1 = % CHANGE OF FEED SYURP WHEN:
P2 = % L1 = %
P3 = % L2 = %
Page 98

98
98
SeedMaster 2 CONFIGURATION DATA SHEET
Device number: 1
Process Control Kft.
Instrument TAG: /
THIRD INPUT : MASSECUITE DENSITY
Plant:
Date :
DATA: NOTES:
SENSOR CALIBRATION YES Selectable.
SEED CRYSTAL SIZE mm Mean crystal size when seeding, or in the calibration point.
PRODUCT CRYSTAL SIZE mm Mean crystal size.
X LEVEL MEAS. YES Selectable.
X PAN MAX. LEVEL % Level data are available.
# LEVEL MEAS. NO Selectable.
# LENGTH OF CRYST. TIME min If level data are not available.
CONC. (REFR., SEED. ) % Conc.by the refractometer when seeding, or in the calibration point.
CONC. (REFR., STR. END.) %
Concentration measured by the refract ometer at strike end.
MA. DENS. (SEED.) % Density when seeding or in the cal. point ( m icr owave/nuclear probe) .
MA. DENS. (STR. END) %
Density at strike end (microwave or nuclear probe).
CR. CONT. (LAB, STR. END) % Product crystal content by volume, laboratory data.
VOLUME RATIO ( ) Max. massecuite volume / massecuite volume in the seeding or
calibration point. Tipycal data with batch pans: 1,8….2,2.
SYRUP PARAMETERS:
STANDARD BEET STANDARD CANE
LOCAL : m = b = c =
FEED SYRUP PURITY: P1 =
% CHANGE OF FEED SYURP WHEN:
P2 = % L1 = %
P3 = % L2 = %
12 APPENDECES
Page 99

12 APPENDECES
99
99
SeedMaster 2 CONFIGURATION DATA SHEET Device number: 1
Process Control Kft. Instrument TAG: 2 / 3.1
THIRD INPUT : MOTOR (POWER / CURRENT) CONSUMPTION
Plant:
P (kW)
Date :
I (A)
DATA: NOTES:
+ 1 / 2 SPEED
SINGLE Selectable
+ MOT. CONS. (PH. 1 END)
A Motor cons.
+
CR. CONT. (PH. 1 END)
% *Tipically >= 25 %
MOT. CONS. (STRIKE END) A Motor cons. PH. 1
X LEVEL MEAS.
Selectable.
X PAN MAX. LEVEL %
Level data are available.
# LEVEL MEAS. Selectable.
# LENGTH OF CRYST. TIME min If level data are not available.
CONC. (REFR., PH. 1 END) % Concentration measured by the refractometer (PH. 1 END).
CONC. (REFR., STR. END) % Concentration measured by the refractometer at strike end.
TEMP. (REFR., PH. 1 END) deg C Temperature measured by the refractometer (PH. 1 END).
TEMP. (REFR., STRIKE END) deg C Temperature measured by the refractometer at strike end.
CR. CONT. (STR. END) % Crystal content by volume. Laboratory data (Y_prod).
SEED CRYSTAL SIZE mm Mean crystal size (a_seed).
PRODUCT CRYSTAL SIZE mm Mean crystal size (a_prod).
LENGTH OF CRYST. TIME min
From completion of seeding to end of strike.
AVERAGE SUPERSAT. ( ) From seeding to strike end. After the first strike it is available in SM 2.
FEED SYRUP PURITY
% Highest feed syrup purity.
BIAS CR. CONT. % Additional term if crystal content is > 46 %.
MOT. CAL. PARAM.
Automatically calculated by SeedMaster 2.
CRYST. PARAMETER Automatically calculated by SeedMaster 2. It is subject to adaptation.
SYRUP PARAMETERS:
STANDARD BEET STANDARD CANE
LOCAL : m = b = c =
FEED SYRUP PURITY: P1 = % CHANGE OF FEED SYURP WHEN:
P2 = % L1 = %
P3 =
% L2 =
%
NOTE: * If full seeding with crystal footing is practiced, crystal content when seeding can exceed this value. It can be calculated as
Y_seed = Y_prod*(a_seed^3 / a_prod^3)*V (%); V is the ratio of full to seeding massecuite volume (tipically ~ 2).
Page 100

12 APPENDECES
100
100
SeedMaster 2 CONFIGURATION DATA SHEET Device number: 1
Process Control Kft. Instrument TAG: /
THIRD INPUT : MOTOR (POWER / CURRENT) CONSUMPTION
Plant:
P (kW)
Date :
I (A)
DATA: NOTES:
1 / 2 SPEED
DOUBLE Selectable
MOT. CONS. (PH. 2 START) A Motor cons.
CR. CONT. (PH. 2 START) %
Tipically >= 25 %
MOT. CONS. (STRIKE END)
A Motor cons. PH. 2
X LEVEL MEAS. YES Selectable.
X
PAN MAX. LEVEL % Level data are available.
#
LEVEL MEAS. NO Selectable.
# LENGTH OF CRYST. TIME min If level data are not available.
CONC. (REFR., PH. 2 ST.) % Conc. measured by the refractometer (PH. 2 START).
CONC. (REFR., STR. END) % Concentration measured by the refractometer at strike end.
TEMP. (REFR., PH. 2 ST.) deg C Temperature measured by the refractometer (PH. 2 START).
TEMP. (REFR., STRIKE END) deg C Temperature measured by the refractometer at strike end.
CR. CONT. (STR. END)
% Crystal content by volume. Laboratory data (Y_prod)
SEED CRYSTAL SIZE mm Mean crystal size (a_seed).
PRODUCT CRYSTAL SIZE mm Mean crystal size (a_prod).
LENGTH OF CRYST. TIME
min From completion of seeding to end of strike.
AVERAGE SUPERSAT. ( ) From seeding to strike end. After the first strike it is available in SM 2.
FEED SYRUP PURITY % Highest feed syrup purity.
BIAS CR. CONT. % Additional term if crystal content is > 46 %.
MOT. CAL. PARAM. Automatically calculated by SeedMaster 2.
CRYST. PARAMETER Automatically calculated by SeedMaster 2. It is subject to adaptation.
SYRUP PARAMETERS:
STANDARD BEET STANDARD CANE
LOCAL :
m = b = c =
FEED SYRUP PURITY:
P1 = % CHANGE OF FEED SYURP WHEN:
P2 = % L1 = %
P3 =
% L2 = %
 Loading...