


Compact Vibrometer 107В
Operating Instructions Manual

Vibrometer 107В

Vibrometer 107В
Page
INTRODUCTION................................................................................1
1. SPECIFICATION.......................................................................1
1.1. Standard Conditions for Operation
1.2. System Specication
1.3. ISO-10816
2. 107B INSTRUMENT DESCRIPTION AND FUNCTION...........4
2.1. Getting know the instrument and its Accessories
2.1.1. Operation key
3. TAKING MEASUREMENT WITH THE INSTRUMENT.............5
3.1. Instrument Display and Measurement Mode
3.1.1. Set up of accelerometer sensitivity factor
3.1.2. Setting system real time and date
3.1.3. Setting up LCD back light
3.2. Selection of Measurement Mode
3.3. Measurement Procedure
3.3.1. Accelerometer mounting
3.3.2. Taking vibration measurements
3.3.3. Make new directory / save / read / delete le
3.3.4. Vibration result and spectrum overview
4. DELIVERY SET..................................................................................10
CONTENT

Vibrometer 107В

Vibrometer 107В
Introduction
This manual is intended for the study of the Compact FFT Vibrometer -107В (hereinafter
“Instrument”). The manual contains the description of the instrument, delivery set,
operating principles and specication.
FFT Vibrometer - 107В is a compact, handheld, microprocessor based vibration-measuring
instrument designed to measure vibration parameters of the rotating machine according to
ISO 10816, as well as other international standards which have been set on the same level
- vibration acceleration, RMS vibration velocity, vibration displacement and Vibration
spectrum analysis in FFT. It allows to measure the dynamic signals followed up by the
record it into the non-volatile memory, as well overview and analyze the spectrum.
1.0 Specication
1.1 Standard Conditions for Operation:
s Ambient temperature, -10 to 55°С, (±5)°С;
s Relative humidity 80% at temperature 30°С;
s Atmospheric pressure, 84 to 106.7 KPa (630 - 800 mm Hg);
s Vibration frequency, not more than 30 Hz;
s Max acceleration, 10 m/s2;
s Pulses per minute, 10 - 50;
s Maximum acceleration in respect to shock, 50 m/s2;
s Pulse duration 10 - 12.5 msec;
s Total shock number 1000.
1.2 System Specication
1.2.1 Setting range of accelerometer conversion ratio (sensitivity), pC*s2/m - 0.1 to
1

Vibrometer 107В
500.
1.2.2 Maximum input charge value, pC - 2000.
1.2.3 Noise oor, not more than, pC, not more than - 0.03
1.2.4 The dynamic range measurement of the RMS (root-mean-square) values of
vibration acceleration, vibration velocity and vibration displacement is limited by
the maximum input charge value on the top and the level of noise floor of charge
amplifier at the bottom and depends upon conversion ratio of the accelerometer
(vibration transducer).
Table-1
Measurable Frequency Range Dynamic Range
Parameter Hz RMS
Vibration Acceleration 2 - 10000 0.01 - 200 m/s2
Vibration Velocity 2 - 16 0.8 - 1000 mm/s
10 - 1000 0.1 - 79 mm/s
Vibration Displacement 2 - 16 0.05 - 50 mm
10 - 100 0.003 - 1.2 mm
10 - 1000 0.003 - 0.02 mm
1.2.5 The limits of relative error at the charge measurement, the error of accelerometer
is not taken into account, in the frequency band, Hz:10 to 0.707 cut-off frequencies of
low-pass lter ±5 %.
1.2.6 Damping at cut-off frequencies of low-pass lter, dB, not more than -3dB at cut-off
frequency of low-pass lter, no more than -7.5%.
1.2.7 Frequency ranges of spectrum analysis: cut-off frequencies of low-pass lter, Hz
- 100, 200, 300, 400, 500, 600, 700, 800, 900, 1000, 2000, 3000, 4000, 5000, 6000,
7000, 8000, 9000, 10000: cut-off frequency of low-pass lter, Hz -10.
1.2.8 Spectrum resolution, lines - 800.
1.2.9 Weight function - Hanning function.
1.2.10 Calculating time of FFT spectrum, not more than: 20 sec.
2

Vibrometer 107В
1.2.11 Absolute error of sinusoidal signal frequency, not more than, ± 0.75•(Fв / 800),
where Fв – upper frequency of band analysis.
1.2.12 The error of magnitude wave constituent, more than -1.5dB.
1.2.13 Operating mode setting, not more than -1min.
1.2.14 When measuring the signals with amplitude factor up to 5, the limits of
complementary error of the instrument (without vibratory converter) do not exceed
0.5 of the basic error limits.
1.2.15 Display: graphical LCD, 64 х 98 points.
1.2.16 Power supply, 3.6V NiMH battery. Battery power control.
1.2.17 Continuous operation on batteries, not less than 8hours.
1.2.18 Current consumption 220V, 50 Hz AC, not more than 5VA.
1.2.19 Electric strength and insulation resistance of the instrument corrsponds to the
requirements of GOST 22261-94.
1.2.20 The limits of complementary error of the instrument at voltage changing from
3.6Volts to 2.8Volts.
1.2.21 The limits of complementary error of the instrument (without vibratory
converter), caused by the change of climate and mechanical factors, within the
range from standard values to the limit operating values, do not exceed 0.5 of
the of basic error limits.
1.2.22 The instrument operates normally when affected by acoustic noise with acoustic
pressure 100 dB in the frequency band from 125 to 8000 Hz. Acoustic noise factor is
not more than 0.03 %/dB.
1.2.23 The instrument stands the impact of external magnetic eld 80 А/m , 50 Hz,
inuence coefcient of the magnetic eld, however, is not more than 0.05 %/А•m-1.
1.2.24 Probability of no-failure operation, not less than 0.92 per 2000 hrs.
1.2.25 The average instrument life, not less than 10 years.
1.2.26 Failure time, 1000 hours. The average failure time is set for standard conditions
for operation.
1.2.27 Dimensions, not more than 55 х 118 х 28 (mm).
1.2.28 Weight, not more than 210 gram.
3

Vibrometer 107В
1.3. Reference ISO 10816-3
Measuring points for horizontal machine set
4
Guide for Vibration Severity Zone - ISO 10816-3
11 0.44
7.1 0.28
4,5 0.18
3,5 0.11
2,8 0.07
2,3 0.04
1.4 0.03
0,71 0.02
mm/s rms inch/s rms
Group 4 Group 3 Group 2 Group 1
<<< Classification
140 5.51
113 4.45
90 3.54
71 2.80
56 2.20
45 1.77
36 1.42
28 1.10
22 0.87
18 0.71
11 0.43
µm rms mil rms
rigid flexible rigid flexible rigid flexible rigid flexible
<<< Foundation
Pumps > 15 kW Medium sized machines Large machines
radial, axial, mixed flow
15 kW < P ≤ 300 kW
300 kW < P < 50 MW
<<< Machine Type
integrated driver external driver motors motors
160 mm ≤ H < 315 mm 315 mm ≤ H
Group 4 Group 3 Group 2 Group 1
<<< Classification
A
Newly commissioned
C
Restricted for long-term operation
B No restriction for long-term operation
D
Vibration and others causes damage

Vibrometer 107В
2.0 107B Instrument Description and Function
General view of the instrument and piezoelectric accelerometer with cable is shows in Fig-1.
4
1. 107B Vibrometer
2. Accelerometer, 1.5m
2 3. Detachable measuring tip
Fig-1a: Sensor w/cable 4. Socket for measuring probe
5. USB socket for PC com
3 6. Socket for AC charger
Fig-1b: Measuring tip 7. LED, AC charge indicator
Fig-1c: 107B Vibrometer
2.1 Getting to know the Instrument and its Accessories
The instrument is built from a light and strong alloy casing protected by silicon sleeve
with the rechargeable internal battery power supply, socket for the measuring probe
and USB port for le upload to PC for data management, see Fig-2a. The socket to
connect the instrument to the accelerometer, external power source and USB port are
located in the upper side panel of the instrument. The only six push button keypad and
LCD are located on the front panel. One LED indicators placed in standing end indicate
device connected to the external AC power source, Fig-2b.
Fig-2a. Top view of 107B Fig-2b: LED at standing side
Processor unit is the main component of the instrument; it provides control over the
measurement circuit, data measurement, signal analysis and data display. Using the
5
1
6 5 4
7

Vibrometer 107В
keypad, the user can operate the instrument.
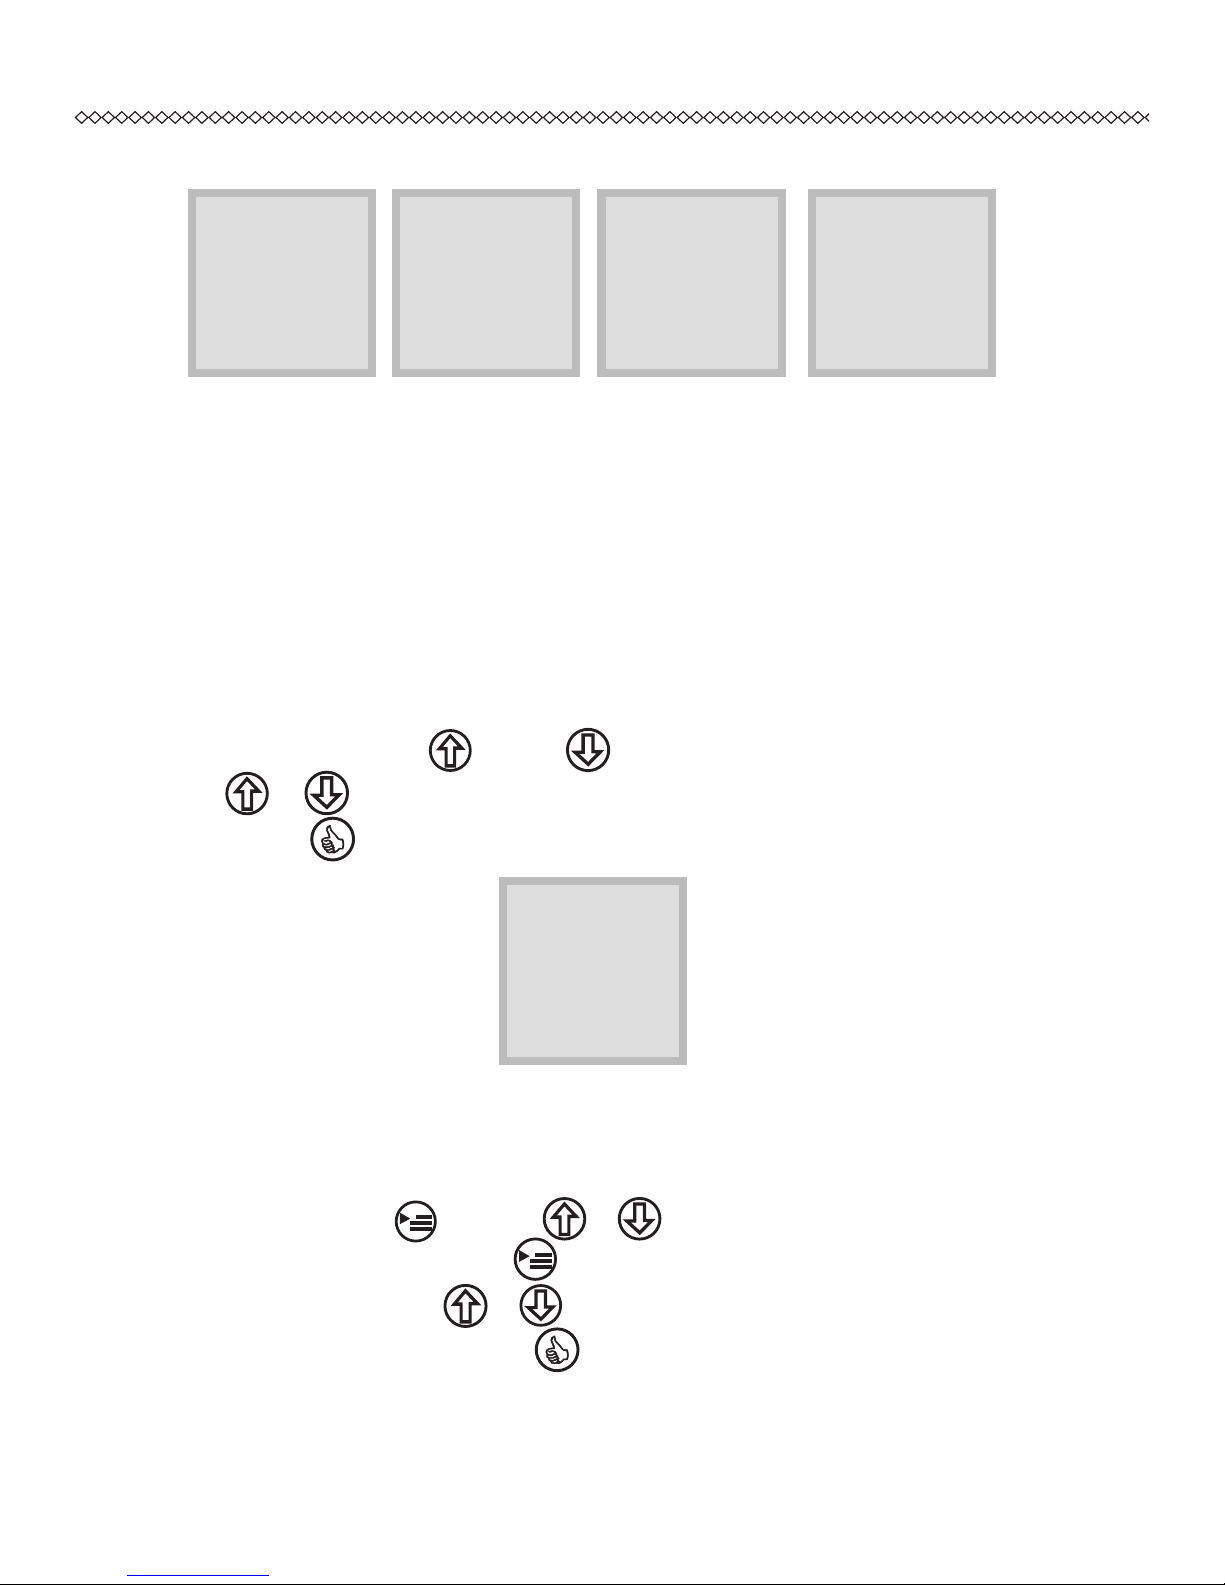
The initial state of the instrument displayed on the screen shows the last measurement
mode with setting, see Fig-2.1a, Fig-2.1b or Fig-2.1c depend last end mode.
Fig-2.1a Fig-2.1b Fig-2.1c
2.1.1 Operation key
Six buttons of the keypad perform several functions.
Turn ON key Setup menu / Hold down + forward /back key
OK / Start Return / back to earlier step key / OFF (press and hold)
Adjust up Adjust down
3.0 Taking Measurement with the Instrument
Before using the instrument, it is a good practices to check proper mechanical
functioning of the controls, connectors and power state when switch on.
Note the device automatically switches off after 150 seconds when no further operation.
3.1 Instrument Display and Measurement Mode
Press button to turn on your instrument.
The instrument will display prompt self-test prompt as Fig-3a, when completed screen
display to last measurement mode, Fig-3a, 3b, 3c or 3d.
6
V e l o c i t y MM / S
1 0 - 1 0 0 0
H z
*
6 .6 2 pc 3. 2 7 v
2 5m a r 0 7 1 5 :5 0 : 21
A c c e l er . M / S
2
1 0 - 8 0 0
H z
*
6 . 6 2 pc 3 . 2 7 v
2 5 m a r 0 7 1 5 : 5 0 : 3 8
D is p l ac e m e n t u M
1 0 - 1 0 0 0 H z
*
6 .6 2 pc 3. 2 7 v
2 5m a r 0 7 1 5 :5 1 : 15
Vibrometer 107В
Fig-3a Fig-3b Fig-3c Fig-3d
The upper screen line shows the measurement modes. The next line displays the
frequency band in which the RMS value is measured. The other two lines indicate
respectively the conversion ratio value of piezoelectric accelerometer with respect to
charge pC X S2/m and battery voltage, date and real time information.
3.1.1 Initial setup of accelerometer sensitivity factor and frequency band
To start measuring, set the conversion ratio of piezoelectric accelerometer with respect
to charge by pressing follow by key to display Fig-3.1, the using as either
or key to input accelerometer sensitivity value provide by the OEM and
follow by key.
Fig-3.1
To set the value of upper limit of frequency band in which the measurement will be
conducted. Press and using or key to change the cut-off frequency
of LF (low lters) follow press again for change of cut-off of HPF (high pass
lter) and same using or key to change the new input value.
To conrm the input values, press to accept. The device will automatically switch
display to last mode selected to ready for taking new vibration measurement.
7
A c c e l e r o m e t e r :
S =
6 . 6 2
•
•
•
Vi brome te r
Ko HTe c t 7 9 5 m 1 0 7
(c ) 0 7 0108v3.01c
No .0 7 0 1081059
ww w.k ohtect. co m
V e l o c i t y MM / S
1 0 - 1 0 0 0
H z
*
6 .6 2 pc 3. 2 7 v
2 5m a r 0 7 1 5 :5 0 : 21
A cc e l er . M / S
2
1 0 - 8 0 0
H z
*
6 .6 2 pc 3. 2 7 v
2 5m a r 0 7 1 5 :5 0 : 38
D is p l ac e m e n t u M
1 0 - 1 0 0 0
H z
*
6 .6 2 pc 3. 2 7 v
2 5m a r 0 7 1 5 :5 1 : 15

Vibrometer 107В
Note: The instrument memorizes the cut-off frequency of low-pass lter per each
measurement mode A, V and S even after auto-off.
3.1.2 Setting the system real time and date
At any operation mode display, press three times to enter date / time menu
follow by to see set items.
Press and to set desire date and time and follow to conrm correct
input setting.
When all date and time settings are correctly input, press twice to return
operation mode display to begin new task.
3.1.3 Setting up LCD back light
At any operation mode display, press four times to turn back light ON/OFF.
To exit, press .
3.2 Selection of Measurement Mode
After turn on the device and input all initial setting, 107B display the default velocity
measurement mode shows in Fig-3b. To select other mode, just press or
button to get to desire display measurement mode or other operation.
3.3 Measurement Procedure
3.3.1 Accelerometer mounting
The following mounting methods are recommended for the accelerometer: stud bolt
М5, magnetic base (magnet retention force: pulling 50…70 Н; shift 15…20 Н) and
handheld probe. Mounting method defines the upper limit of operating frequency
performance: stud bolt with metallic silicone adhesive – up to 20 kHz, magnet – up
to 3 kHz, handheld probe up to 900 Hz.
8
•
•
•
•
Vibrometer 107В
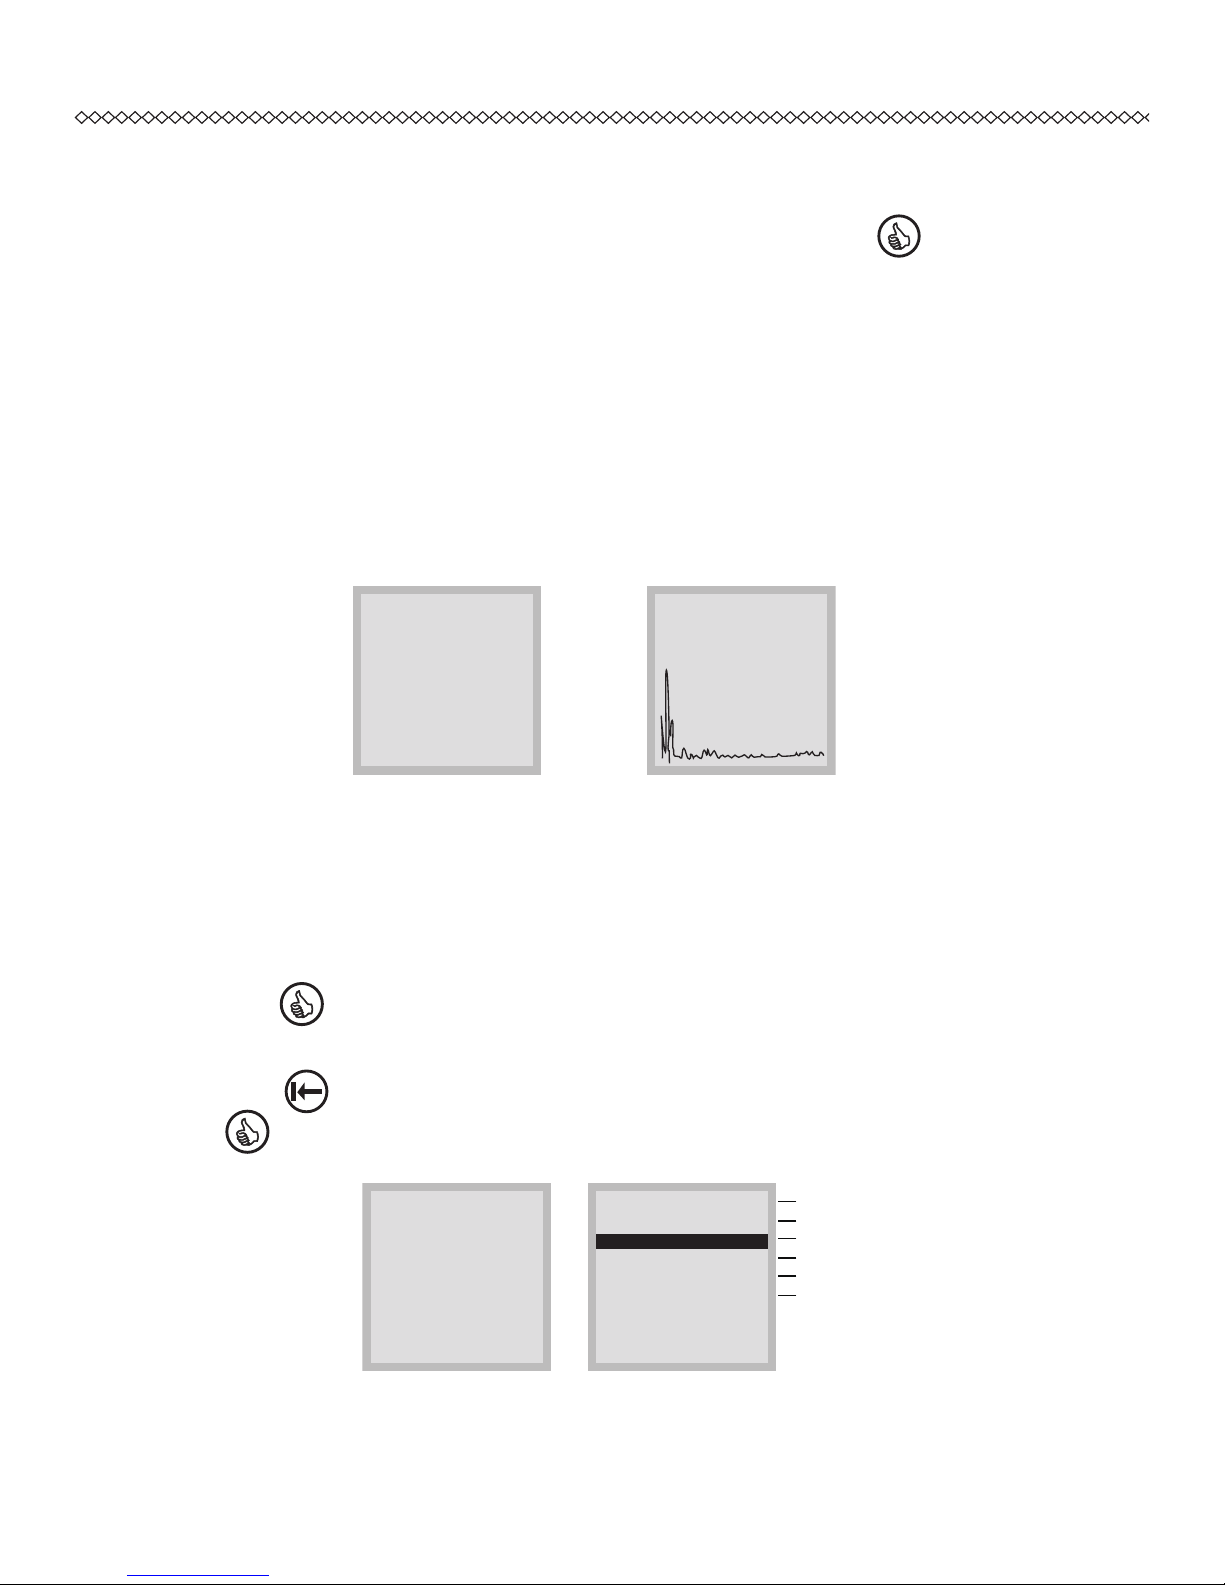
3.3.2 Taking vibration measurements
After selected the desire measurement display, (e.g. Fig 3.2, press to start
vibration measurement (107B automatic adjustment of the internal amplier and
measuring - the number of averaging is set automatically depending upon the upper
frequency).
Measurement process terminates automatically after measurement and result
calculation to display the measured overall vibration reading and waveform, see
Fig-3.3.
Measurement process can be interrupted by pressing the turn “ON” key.
Fig-3.2 Fig-3.3
Velocity measuring mode Result is RMS value & waveform
3.3.3 Make new directory / save / read / delete les
To save vibration reading with spectrum in the instrument as Fig-3.3:
Press key follow by choosing the desired directory to save
OR.
Press to return main display to go to “My documents” mode, Fig-3.4 and press
to enter main directory as Fig-3.5 to save.
Fig-3.4 Fig-3.5
9
V e r o c i t y MM / S
1 0 - 1 0 0 0
H z
*
6 .6 2 pc 3. 2 7 v
2 5m a r 0 7 1 5 :5 0 : 21
V
0 . 0 9 6 0 2
M y d o cu m e n t s
*
6 .6 2 pc 3. 2 7 v
2 5m a r 0 7 1 5 :5 0 : 52
/ 0 3 2 5 _ 0 1 0 7 0 2
. .
0 3 2 5 _ 1 5 3 7 1 7
S y s t e m _ 1 0 5 9
1 0 7 B _ 0 7 0 2 2 7 . b i n
0 3 2 5 _ 0 1 3 4 1 5 . f f t
< d i r >
2 5 . 0 3 . 0 7 1 5 : 3 7
Current sub-directory
Back to earlier directory
Directory name
System directory folder
System update file “xxx.bin”
Vibration data date file “xx..x.fft”
•
•
•
•
•

Vibrometer 107В
Note: 107B will self generated directory or le names in term of date and time (“0325”
mean 25 March and “103415” mean 10hrs, 34 mins, 15 sec). File name that follow by
“fft” extension format representing data le, see Fig-3.5
By pressing each time, the display right lower section will change from
selection to make new directory, save, read or delete folder/le.
Press or to move to desired directory (directory line are shows with
series of numeric without “xxx.fft” extension) to be saved.
Press to conrm data saved.
Note: sub-directory created are only allow max. 10 data les to be saved.
3.3.4 Vibration result and spectrum overview
When the FFT spectrum measurements has recorded and displayed the result, you
may view the spectrum of the waveform, using the following keys obtain required
information:
To view desired spectrum detail info, go to “Documents” display mode and press
then using or key to look for deired data le and press to
read measurement data.
Press and hold to display, Fig- 3.6a. The display will show the peak value for
specic frequency in the velocity measured mode, while peak - to - peak value in
the displacement mode.
To switch horizontal compression scale, press while still hold down on
key.
Note: (Horizontal compression scale: х8 - all 800 lines at the display (98 points across),
х1 – spectrum fragment out of 98 lines at the display).
10
•
•
•
•
•

Vibrometer 107В
11
Fig-3.6a Fig-3.6b Fig-3.6c
To switch spectrum between “LIN”/ “LOG” reading or view the vibration shock
energy in dB, press to toggle while still holding down on key, see Fig-3.6c.
To exit and review last spectrum measured, press to toggle.
To move the cursor (over the frequency peaks), press key and review the
spectrum by press again. Fig-3.7a (10.02Hz) Fig-3.7b (57.59Hz)
Fig-3.7a Fig-3.7b
4.0 Delivery Set
S/No: Description Qty Note
1 107B, Vibrometer w/chargeable battery builtin 1
2 Vibration accelerometer w/1.5m cable attached 1
3 Magnetic adaptor for accelerometer 1
4 External measuring tip for accelerometer 1
5 AC batter charger,220-230 Volts 1
6 Carrying case with form-inserted 1
7 Operating instruction manual in CD-ROM 1
8 CD-ROM PC software 1
9 USB PC Communication cable 1
10 Maker Calibration Certicate 1
Table-4.0
•
•
•
V
0 . 0 6 8 0 2
1 0. 0 2 Hz x 8 L’ I N
L =0 . 0 16 7 5
V
0 . 0 6 8 0 2
5 7. 9 7 2H z x8 L’ I N
L =0 . 0 19 0 4
V
0 . 0 6 8 0 2
3 2. 5 5 Hz x 8 L’ I N
L =0 . 0 18 5 5
S
2 . 0 3 9
4 6 . 3 4
2 66 . 7 Hz X8 L IN
L =0 . 6 65 7
1 . 88 3
S
8 6 . 5 3
d B
4 0. 0 6 Hz x 1 L OG
L =8 6 d B

 Loading...