


P-16+ / P-6
User’s Guide
KLA-TENCOR CONFIDENTIAL
Family: Profiler Product Line: Profiler P1X / PX Model: P-16+ / P-6
Software Version 7.31/7.35 MNL, USER PN- 0142530-000 AB
One Technology Drive., Milpitas, CA 95035
Phone: (408) 875-3000 FAX: (408) 571-2722

TRADEMARKS
P-16+ / P-6 is a trademark of KLA-Tencor Corporation. All other brand and product names may be trademarks of their
respective companies.
P-16+ / P-6 User’s Guide KLA-TENCOR CONFIDENTIAL 0142530-000 AB
3/13/09

KLA-Tencor P-16+ / P-6 User’s Guide
EC COMPLIANCE
At the time of printing, the P-16+ / P-6 Profiler complies with the
essential requirements of the EC (Electromagnetic Compatibility)
Directives listed below:
EC Directives EC 89/392/EEC
EC 89/336/EEC
EC 93/68/EEC
Machinery, Annex 1 EC 98/37/EEC
Low Voltage, Annex 1 EC 73/23/EEC
Harmonized Electromagnetic Standards EN 50082-2:1995
EN 50081-2:1993
EN 55011:2000
Harmonized Safety Standards EN 60204-1:1992
IEC 61010-1, 2001
EN 61010-1:2001 (2nd Edition)
EN 61000-6-2:2005
EN 61000-6-4:2007
IEC 61010-1
Product Safety Assessment SEMI S2-0703
Ergonomic Assessment SEMI S8-0705
Fire Risk Assessment SEMI S14-0704
RoHS Compliance: All P-16+ and P-6 external
peripherals and computer
components used (main
scanner exempt) comply
with the European Union's
Directive 2002/95/EC,
Restrictions of Hazardous
Substances ("RoHS"
Directive).
COPYRIGHT
This document is a copyrighted work of KLA-Tencor Corporation.
Unauthorized copying of its content is strictly prohibited. KLA-Tencor
provides this document without warranty in any form, either expressed
or implied.
0142530-000 AB KLA-Tencor Confidential
3/13/09

KLA-Tencor P-16+ / P-6 User’s Guide
KLA-Tencor Confidential 0142530-000 AB
3/13/09

Table of Contents
Chapter 1 Introduction & Safety
INSTRUMENT OVERVIEW. . . . . . . . . . . . . . . . . . . . . . . . . . . . . . . . . . . . . . . . . . . . . . . . . . . . . . . . . . . . . . . . . . . . .1-1
AFETY . . . . . . . . . . . . . . . . . . . . . . . . . . . . . . . . . . . . . . . . . . . . . . . . . . . . . . . . . . . . . . . . . . . . . . . . . . . . . . . . . . .1-1
S
Introduction. . . . . . . . . . . . . . . . . . . . . . . . . . . . . . . . . . . . . . . . . . . . . . . . . . . . . . . . . . . . . . . . . . . . . . . . . . . . .1-1
Safety Symbols and Related Keywords . . . . . . . . . . . . . . . . . . . . . . . . . . . . . . . . . . . . . . . . . . . . . . . . . . . . . .1-1
Lockout/Tagout Procedure. . . . . . . . . . . . . . . . . . . . . . . . . . . . . . . . . . . . . . . . . . . . . . . . . . . . . . . . . . . . . . . . .1-2
Stage and Head Movement Hazards . . . . . . . . . . . . . . . . . . . . . . . . . . . . . . . . . . . . . . . . . . . . . . . . . . . . . . . . .1-4
Chapter 2 Basic Skills
OVERVIEW . . . . . . . . . . . . . . . . . . . . . . . . . . . . . . . . . . . . . . . . . . . . . . . . . . . . . . . . . . . . . . . . . . . . . . . . . . . . . . . .2-1
RGONOMIC CONSIDERATIONS . . . . . . . . . . . . . . . . . . . . . . . . . . . . . . . . . . . . . . . . . . . . . . . . . . . . . . . . . . . . . . .2-1
E
OWERING UP THE PROFILE R . . . . . . . . . . . . . . . . . . . . . . . . . . . . . . . . . . . . . . . . . . . . . . . . . . . . . . . . . . . . . . . .2-2
P
Introduction. . . . . . . . . . . . . . . . . . . . . . . . . . . . . . . . . . . . . . . . . . . . . . . . . . . . . . . . . . . . . . . . . . . . . . . . . . . . .2-2
Power Up Procedure. . . . . . . . . . . . . . . . . . . . . . . . . . . . . . . . . . . . . . . . . . . . . . . . . . . . . . . . . . . . . . . . . . . . . .2-2
L
OGGING INTO PROFILER SECURITY . . . . . . . . . . . . . . . . . . . . . . . . . . . . . . . . . . . . . . . . . . . . . . . . . . . . . . . . . . .2-2
TARTING THE PROFILER APPLICATION . . . . . . . . . . . . . . . . . . . . . . . . . . . . . . . . . . . . . . . . . . . . . . . . . . . . . . . .2-3
S
Introduction. . . . . . . . . . . . . . . . . . . . . . . . . . . . . . . . . . . . . . . . . . . . . . . . . . . . . . . . . . . . . . . . . . . . . . . . . . . . .2-3
Profiler Start-Up Procedure. . . . . . . . . . . . . . . . . . . . . . . . . . . . . . . . . . . . . . . . . . . . . . . . . . . . . . . . . . . . . . . .2-3
N
AVIGATING BETWEEN PROGRAM LEVEL SCREENS . . . . . . . . . . . . . . . . . . . . . . . . . . . . . . . . . . . . . . . . . . . . . .2-5
Introduction. . . . . . . . . . . . . . . . . . . . . . . . . . . . . . . . . . . . . . . . . . . . . . . . . . . . . . . . . . . . . . . . . . . . . . . . . . . . .2-5
Navigation Procedure . . . . . . . . . . . . . . . . . . . . . . . . . . . . . . . . . . . . . . . . . . . . . . . . . . . . . . . . . . . . . . . . . . . . .2-6
E
XITING THE PROFILER APPLICATION . . . . . . . . . . . . . . . . . . . . . . . . . . . . . . . . . . . . . . . . . . . . . . . . . . . . . . . . .2-6
Introduction. . . . . . . . . . . . . . . . . . . . . . . . . . . . . . . . . . . . . . . . . . . . . . . . . . . . . . . . . . . . . . . . . . . . . . . . . . . . .2-6
Profiler Exit Procedure . . . . . . . . . . . . . . . . . . . . . . . . . . . . . . . . . . . . . . . . . . . . . . . . . . . . . . . . . . . . . . . . . . .2-6
C
LEARING A STATUS BAR MESSAGE . . . . . . . . . . . . . . . . . . . . . . . . . . . . . . . . . . . . . . . . . . . . . . . . . . . . . . . . . . .2-7
Introduction. . . . . . . . . . . . . . . . . . . . . . . . . . . . . . . . . . . . . . . . . . . . . . . . . . . . . . . . . . . . . . . . . . . . . . . . . . . . .2-7
Clearing a Status Bar Message Procedure . . . . . . . . . . . . . . . . . . . . . . . . . . . . . . . . . . . . . . . . . . . . . . . . . . . .2-7
P
ROTECTING THE STYLUS ARM ASSEMBLY. . . . . . . . . . . . . . . . . . . . . . . . . . . . . . . . . . . . . . . . . . . . . . . . . . . . . .2-8
System Provisions for Stylus Protection . . . . . . . . . . . . . . . . . . . . . . . . . . . . . . . . . . . . . . . . . . . . . . . . . . . . . .2-8
Potential Stylus Damage During Scans. . . . . . . . . . . . . . . . . . . . . . . . . . . . . . . . . . . . . . . . . . . . . . . . . . . . . . .2-8
L
OADING A SAMPLE . . . . . . . . . . . . . . . . . . . . . . . . . . . . . . . . . . . . . . . . . . . . . . . . . . . . . . . . . . . . . . . . . . . . . . .2-10
DJUSTING THE VIDEO IMAGE . . . . . . . . . . . . . . . . . . . . . . . . . . . . . . . . . . . . . . . . . . . . . . . . . . . . . . . . . . . . . . .2-12
A
Introduction. . . . . . . . . . . . . . . . . . . . . . . . . . . . . . . . . . . . . . . . . . . . . . . . . . . . . . . . . . . . . . . . . . . . . . . . . . . .2-12
Video Image Adjustment Procedure. . . . . . . . . . . . . . . . . . . . . . . . . . . . . . . . . . . . . . . . . . . . . . . . . . . . . . . .2-12
U
SING FILE NAME CONVENTIONS . . . . . . . . . . . . . . . . . . . . . . . . . . . . . . . . . . . . . . . . . . . . . . . . . . . . . . . . . . . .2-13
Introduction. . . . . . . . . . . . . . . . . . . . . . . . . . . . . . . . . . . . . . . . . . . . . . . . . . . . . . . . . . . . . . . . . . . . . . . . . . . .2-13
Naming and Saving Files . . . . . . . . . . . . . . . . . . . . . . . . . . . . . . . . . . . . . . . . . . . . . . . . . . . . . . . . . . . . . . . . .2-13
S
AVING VIDEO IMAGES . . . . . . . . . . . . . . . . . . . . . . . . . . . . . . . . . . . . . . . . . . . . . . . . . . . . . . . . . . . . . . . . . . . . .2-13
Introduction. . . . . . . . . . . . . . . . . . . . . . . . . . . . . . . . . . . . . . . . . . . . . . . . . . . . . . . . . . . . . . . . . . . . . . . . . . . .2-13
Naming and Saving Video Images Procedure . . . . . . . . . . . . . . . . . . . . . . . . . . . . . . . . . . . . . . . . . . . . . . . .2-13
E
XPORTING DATA GRAPHS . . . . . . . . . . . . . . . . . . . . . . . . . . . . . . . . . . . . . . . . . . . . . . . . . . . . . . . . . . . . . . . . . .2-14
Introduction. . . . . . . . . . . . . . . . . . . . . . . . . . . . . . . . . . . . . . . . . . . . . . . . . . . . . . . . . . . . . . . . . . . . . . . . . . . .2-14
EXPORTING DATA FROM THE DATABASE FILE MANAGER. . . . . . . . . . . . . . . . . . . . . . . . . . . . . . . . . . . . . . . . .2-16
P/N 0142530-000 AB TOC-1
Friday, March 13, 2009

KLA-Tencor P-16+ / P-6 User’s Guide
Chapter 3 Scan Recipes
INTRODUCTION. . . . . . . . . . . . . . . . . . . . . . . . . . . . . . . . . . . . . . . . . . . . . . . . . . . . . . . . . . . . . . . . . . . . . . . . . . . . 3-1
CCESSING THE SCAN RECIPE CATALOG SCREEN . . . . . . . . . . . . . . . . . . . . . . . . . . . . . . . . . . . . . . . . . . . . . . . 3-2
A
SCAN RECIPE CATALOG SCREEN COMPONENTS. . . . . . . . . . . . . . . . . . . . . . . . . . . . . . . . . . . . . . . . . . . . . . . . . 3-3
Screen Tools . . . . . . . . . . . . . . . . . . . . . . . . . . . . . . . . . . . . . . . . . . . . . . . . . . . . . . . . . . . . . . . . . . . . . . . . . . . . 3-3
Catalog Screen Access Buttons . . . . . . . . . . . . . . . . . . . . . . . . . . . . . . . . . . . . . . . . . . . . . . . . . . . . . . . . . . . . 3-9
List Window . . . . . . . . . . . . . . . . . . . . . . . . . . . . . . . . . . . . . . . . . . . . . . . . . . . . . . . . . . . . . . . . . . . . . . . . . . 3-10
System Status Message . . . . . . . . . . . . . . . . . . . . . . . . . . . . . . . . . . . . . . . . . . . . . . . . . . . . . . . . . . . . . . . . . . 3-12
C
REATING AND EDITING A SCAN RECIPE . . . . . . . . . . . . . . . . . . . . . . . . . . . . . . . . . . . . . . . . . . . . . . . . . . . . . 3-12
Accessing the Scan Recipe Editor . . . . . . . . . . . . . . . . . . . . . . . . . . . . . . . . . . . . . . . . . . . . . . . . . . . . . . . . . 3-13
Recipe Editor for 2D and 3D Scans. . . . . . . . . . . . . . . . . . . . . . . . . . . . . . . . . . . . . . . . . . . . . . . . . . . . . . . . 3-13
Scan Parameter Definition Window . . . . . . . . . . . . . . . . . . . . . . . . . . . . . . . . . . . . . . . . . . . . . . . . . . . . . . . 3-14
Feature Detection (Only for 2D Scans) . . . . . . . . . . . . . . . . . . . . . . . . . . . . . . . . . . . . . . . . . . . . . . . . . . . . . 3-31
Filters and Cursors . . . . . . . . . . . . . . . . . . . . . . . . . . . . . . . . . . . . . . . . . . . . . . . . . . . . . . . . . . . . . . . . . . . . 3-38
Filters Cursors Menu for a 3D Recipe . . . . . . . . . . . . . . . . . . . . . . . . . . . . . . . . . . . . . . . . . . . . . . . . . . . . . 3-48
Unit Output . . . . . . . . . . . . . . . . . . . . . . . . . . . . . . . . . . . . . . . . . . . . . . . . . . . . . . . . . . . . . . . . . . . . . . . . . . . 3-51
General Parameters . . . . . . . . . . . . . . . . . . . . . . . . . . . . . . . . . . . . . . . . . . . . . . . . . . . . . . . . . . . . . . . . . . . . 3-51
Roughness and Waviness Parameters. . . . . . . . . . . . . . . . . . . . . . . . . . . . . . . . . . . . . . . . . . . . . . . . . . . . . . 3-55
Bearing Ratio and Cutting Depth . . . . . . . . . . . . . . . . . . . . . . . . . . . . . . . . . . . . . . . . . . . . . . . . . . . . . . . . . 3-63
High Spot Count and Peak Count . . . . . . . . . . . . . . . . . . . . . . . . . . . . . . . . . . . . . . . . . . . . . . . . . . . . . . . . . 3-67
Histogram Leveling and Depth Analysis . . . . . . . . . . . . . . . . . . . . . . . . . . . . . . . . . . . . . . . . . . . . . . . . . . . 3-70
H
ISTOGRAM DEPTH . . . . . . . . . . . . . . . . . . . . . . . . . . . . . . . . . . . . . . . . . . . . . . . . . . . . . . . . . . . . . . . . . . . . . . . 3-76
NALYSIS . . . . . . . . . . . . . . . . . . . . . . . . . . . . . . . . . . . . . . . . . . . . . . . . . . . . . . . . . . . . . . . . . . . . . . . . . . 3-77
CMP A
Introduction. . . . . . . . . . . . . . . . . . . . . . . . . . . . . . . . . . . . . . . . . . . . . . . . . . . . . . . . . . . . . . . . . . . . . . . . . . . 3-77
Preliminary
Arrays . . . . . . . . . . . . . . . . . . . . . . . . . . . . . . . . . . . . . . . . . . . . . . . . . . . . . . . . . . . . . . . . . . . . . . . . . . . . . . . 3-80
Lines . . . . . . . . . . . . . . . . . . . . . . . . . . . . . . . . . . . . . . . . . . . . . . . . . . . . . . . . . . . . . . . . . . . . . . . . . . . . . . . . . 3-82
Pads . . . . . . . . . . . . . . . . . . . . . . . . . . . . . . . . . . . . . . . . . . . . . . . . . . . . . . . . . . . . . . . . . . . . . . . . . . . . . . . . . 3-83
F
EATURE FIND . . . . . . . . . . . . . . . . . . . . . . . . . . . . . . . . . . . . . . . . . . . . . . . . . . . . . . . . . . . . . . . . . . . . . . . . . . . 3-84
Search For: Trench / Line . . . . . . . . . . . . . . . . . . . . . . . . . . . . . . . . . . . . . . . . . . . . . . . . . . . . . . . . . . . . . . . 3-86
Search For Model Feature . . . . . . . . . . . . . . . . . . . . . . . . . . . . . . . . . . . . . . . . . . . . . . . . . . . . . . . . . . . . . . . 3-88
Search Patterns: Center Outward, Top to Bottom,
or Bottom to Top . . . . . . . . . . . . . . . . . . . . . . . . . . . . . . . . . . . . . . . . . . . . . . . . . . . . . . . . . . . . . . . . . . . . . . . 3-91
X Scan Size (µm) . . . . . . . . . . . . . . . . . . . . . . . . . . . . . . . . . . . . . . . . . . . . . . . . . . . . . . . . . . . . . . . . . . . . . . . 3-91
Traces. . . . . . . . . . . . . . . . . . . . . . . . . . . . . . . . . . . . . . . . . . . . . . . . . . . . . . . . . . . . . . . . . . . . . . . . . . . . . . . . 3-91
Y Spacing (µm) . . . . . . . . . . . . . . . . . . . . . . . . . . . . . . . . . . . . . . . . . . . . . . . . . . . . . . . . . . . . . . . . . . . . . . . . 3-92
Scan Speed (µm/s) . . . . . . . . . . . . . . . . . . . . . . . . . . . . . . . . . . . . . . . . . . . . . . . . . . . . . . . . . . . . . . . . . . . . . . 3-92
Sampling (Hz) . . . . . . . . . . . . . . . . . . . . . . . . . . . . . . . . . . . . . . . . . . . . . . . . . . . . . . . . . . . . . . . . . . . . . . . . . 3-92
Failure Option: Save Search Data, Skip Current Scan, or Scan at Center . . . . . . . . . . . . . . . . . . . . . . . . 3-93
Scan Offset from Center (µm) . . . . . . . . . . . . . . . . . . . . . . . . . . . . . . . . . . . . . . . . . . . . . . . . . . . . . . . . . . . . 3-93
Feature Characteristics: Feature Down or Feature Up . . . . . . . . . . . . . . . . . . . . . . . . . . . . . . . . . . . . . . . 3-94
Feature Depth / Height (nm) . . . . . . . . . . . . . . . . . . . . . . . . . . . . . . . . . . . . . . . . . . . . . . . . . . . . . . . . . . . . . 3-94
X Width (µm) . . . . . . . . . . . . . . . . . . . . . . . . . . . . . . . . . . . . . . . . . . . . . . . . . . . . . . . . . . . . . . . . . . . . . . . . . 3-94
Model . . . . . . . . . . . . . . . . . . . . . . . . . . . . . . . . . . . . . . . . . . . . . . . . . . . . . . . . . . . . . . . . . . . . . . . . . . . . . . . . 3-95
Matching Methods: Edge Base or Depth Base . . . . . . . . . . . . . . . . . . . . . . . . . . . . . . . . . . . . . . . . . . . . . . . 3-96
Matching Scores . . . . . . . . . . . . . . . . . . . . . . . . . . . . . . . . . . . . . . . . . . . . . . . . . . . . . . . . . . . . . . . . . . . . . . . 3-97
Reference Point (µm) . . . . . . . . . . . . . . . . . . . . . . . . . . . . . . . . . . . . . . . . . . . . . . . . . . . . . . . . . . . . . . . . . . . 3-98
Diagnostic Options . . . . . . . . . . . . . . . . . . . . . . . . . . . . . . . . . . . . . . . . . . . . . . . . . . . . . . . . . . . . . . . . . . . . . 3-98
Entering Comments . . . . . . . . . . . . . . . . . . . . . . . . . . . . . . . . . . . . . . . . . . . . . . . . . . . . . . . . . . . . . . . . . . . 3-100
TOC-2 KLA-Tencor Confidential 0142530-000 AB
3/13/09

KLA-Tencor P-16+ / P-6 User’s Guide
Chapter 4 XY View Screen
INTRODUCTION. . . . . . . . . . . . . . . . . . . . . . . . . . . . . . . . . . . . . . . . . . . . . . . . . . . . . . . . . . . . . . . . . . . . . . . . . . . . .4-1
TARTING THE XY VIEW APPLICATION. . . . . . . . . . . . . . . . . . . . . . . . . . . . . . . . . . . . . . . . . . . . . . . . . . . . . . . . .4-1
S
Procedure. . . . . . . . . . . . . . . . . . . . . . . . . . . . . . . . . . . . . . . . . . . . . . . . . . . . . . . . . . . . . . . . . . . . . . . . . . . . . . .4-1
XY View Window Features . . . . . . . . . . . . . . . . . . . . . . . . . . . . . . . . . . . . . . . . . . . . . . . . . . . . . . . . . . . . . . . .4-1
S
ETTING THE MAGNIFICATION. . . . . . . . . . . . . . . . . . . . . . . . . . . . . . . . . . . . . . . . . . . . . . . . . . . . . . . . . . . . . . . .4-9
Introduction. . . . . . . . . . . . . . . . . . . . . . . . . . . . . . . . . . . . . . . . . . . . . . . . . . . . . . . . . . . . . . . . . . . . . . . . . . . . .4-9
Changing the Magnification . . . . . . . . . . . . . . . . . . . . . . . . . . . . . . . . . . . . . . . . . . . . . . . . . . . . . . . . . . . . . .4-10
Resetting the Zoom to “0.00”. . . . . . . . . . . . . . . . . . . . . . . . . . . . . . . . . . . . . . . . . . . . . . . . . . . . . . . . . . . . . .4-10
Saving the Current Zoom Position . . . . . . . . . . . . . . . . . . . . . . . . . . . . . . . . . . . . . . . . . . . . . . . . . . . . . . . . .4-10
F
OCUSING THE VIEW. . . . . . . . . . . . . . . . . . . . . . . . . . . . . . . . . . . . . . . . . . . . . . . . . . . . . . . . . . . . . . . . . . . . . . .4-11
Introduction. . . . . . . . . . . . . . . . . . . . . . . . . . . . . . . . . . . . . . . . . . . . . . . . . . . . . . . . . . . . . . . . . . . . . . . . . . . .4-11
Focus the Optics – Top- or Side-View . . . . . . . . . . . . . . . . . . . . . . . . . . . . . . . . . . . . . . . . . . . . . . . . . . . . . . . 4-11
P
OSITIONING THE SCAN SITE . . . . . . . . . . . . . . . . . . . . . . . . . . . . . . . . . . . . . . . . . . . . . . . . . . . . . . . . . . . . . . . .4-13
Introduction. . . . . . . . . . . . . . . . . . . . . . . . . . . . . . . . . . . . . . . . . . . . . . . . . . . . . . . . . . . . . . . . . . . . . . . . . . . .4-13
USING DIE GRID NAVIGATION (OPTIONAL FEATURE, P-16+ ONLY) . . . . . . . . . . . . . . . . . . . . . . . . . . . . . . . . .4-16
Introduction. . . . . . . . . . . . . . . . . . . . . . . . . . . . . . . . . . . . . . . . . . . . . . . . . . . . . . . . . . . . . . . . . . . . . . . . . . . .4-16
Creating a Die Grid . . . . . . . . . . . . . . . . . . . . . . . . . . . . . . . . . . . . . . . . . . . . . . . . . . . . . . . . . . . . . . . . . . . . .4-18
Loading a Die Grid (Turning ON Die Grid Navigation) for a Single Scan . . . . . . . . . . . . . . . . . . . . . . . . .4-25
Clearing a Die Grid (Turn OFF Die Grid Navigation) . . . . . . . . . . . . . . . . . . . . . . . . . . . . . . . . . . . . . . . . .4-28
Navigating Across the Wafer Using the Die Grid . . . . . . . . . . . . . . . . . . . . . . . . . . . . . . . . . . . . . . . . . . . . .4-28
Enabling the Dropout Die Option . . . . . . . . . . . . . . . . . . . . . . . . . . . . . . . . . . . . . . . . . . . . . . . . . . . . . . . . . .4-28
Clearing Dropout Dies From the Grid . . . . . . . . . . . . . . . . . . . . . . . . . . . . . . . . . . . . . . . . . . . . . . . . . . . . . .4-28
Moving to Partial Dies . . . . . . . . . . . . . . . . . . . . . . . . . . . . . . . . . . . . . . . . . . . . . . . . . . . . . . . . . . . . . . . . . . .4-28
Displaying Grid Numbers in the Die Grid Navigation Window . . . . . . . . . . . . . . . . . . . . . . . . . . . . . . . . .4-29
To Change the Font and Color of the Grid Numbers . . . . . . . . . . . . . . . . . . . . . . . . . . . . . . . . . . . . . . . . . .4-29
A
LIGNING THE SAMPLE. . . . . . . . . . . . . . . . . . . . . . . . . . . . . . . . . . . . . . . . . . . . . . . . . . . . . . . . . . . . . . . . . . . . .4-29
Introduction. . . . . . . . . . . . . . . . . . . . . . . . . . . . . . . . . . . . . . . . . . . . . . . . . . . . . . . . . . . . . . . . . . . . . . . . . . . .4-29
Procedure. . . . . . . . . . . . . . . . . . . . . . . . . . . . . . . . . . . . . . . . . . . . . . . . . . . . . . . . . . . . . . . . . . . . . . . . . . . . . .4-29
Preliminary
Chapter 5 View Scan Window
2D SCREEN FUNCTION. . . . . . . . . . . . . . . . . . . . . . . . . . . . . . . . . . . . . . . . . . . . . . . . . . . . . . . . . . . . . . . . . . . . . . .5-1
2D Scan Information Field. . . . . . . . . . . . . . . . . . . . . . . . . . . . . . . . . . . . . . . . . . . . . . . . . . . . . . . . . . . . . . . . .5-2
Scan Information Field - 2D Sequence Recipe Column . . . . . . . . . . . . . . . . . . . . . . . . . . . . . . . . . . . . . . . . .5-3
Real Time Scan Trace Window . . . . . . . . . . . . . . . . . . . . . . . . . . . . . . . . . . . . . . . . . . . . . . . . . . . . . . . . . . . . .5-4
2D View Scan Screen Tool Bar . . . . . . . . . . . . . . . . . . . . . . . . . . . . . . . . . . . . . . . . . . . . . . . . . . . . . . . . . . . . .5-4
2D View Scan Screen Menu Bar . . . . . . . . . . . . . . . . . . . . . . . . . . . . . . . . . . . . . . . . . . . . . . . . . . . . . . . . . . . .5-5
3D S
CREEN FUNCTION. . . . . . . . . . . . . . . . . . . . . . . . . . . . . . . . . . . . . . . . . . . . . . . . . . . . . . . . . . . . . . . . . . . . . . .5-9
3D Scan Information Field. . . . . . . . . . . . . . . . . . . . . . . . . . . . . . . . . . . . . . . . . . . . . . . . . . . . . . . . . . . . . . . .5-10
Scan Information Field - 3D Sequence Recipe Column . . . . . . . . . . . . . . . . . . . . . . . . . . . . . . . . . . . . . . . .5-11
3D View Scan Screen Tool Bar . . . . . . . . . . . . . . . . . . . . . . . . . . . . . . . . . . . . . . . . . . . . . . . . . . . . . . . . . . . .5-11
3D View Scan Screen Menu Bar . . . . . . . . . . . . . . . . . . . . . . . . . . . . . . . . . . . . . . . . . . . . . . . . . . . . . . . . . . .5-12
Video Image. . . . . . . . . . . . . . . . . . . . . . . . . . . . . . . . . . . . . . . . . . . . . . . . . . . . . . . . . . . . . . . . . . . . . . . . . . . .5-13
Real Time Scan Window . . . . . . . . . . . . . . . . . . . . . . . . . . . . . . . . . . . . . . . . . . . . . . . . . . . . . . . . . . . . . . . . .5-14
Wafer Image Display . . . . . . . . . . . . . . . . . . . . . . . . . . . . . . . . . . . . . . . . . . . . . . . . . . . . . . . . . . . . . . . . . . . .5-14
Scan Site Image Display . . . . . . . . . . . . . . . . . . . . . . . . . . . . . . . . . . . . . . . . . . . . . . . . . . . . . . . . . . . . . . . . . .5-15
A
BORTING A SCAN . . . . . . . . . . . . . . . . . . . . . . . . . . . . . . . . . . . . . . . . . . . . . . . . . . . . . . . . . . . . . . . . . . . . . . . .5-15
0142530-000 AB KLA-Tencor Confidential TOC-3
3/13/09

KLA-Tencor P-16+ / P-6 User’s Guide
Chapter 6 Sequence Recipe and Data
INTRODUCTION. . . . . . . . . . . . . . . . . . . . . . . . . . . . . . . . . . . . . . . . . . . . . . . . . . . . . . . . . . . . . . . . . . . . . . . . . . . . 6-1
TARTING THE SEQUENCE EDITOR APPLICATION. . . . . . . . . . . . . . . . . . . . . . . . . . . . . . . . . . . . . . . . . . . . . . . . 6-2
S
CREATING A SEQUENCE RECIPE. . . . . . . . . . . . . . . . . . . . . . . . . . . . . . . . . . . . . . . . . . . . . . . . . . . . . . . . . . . . . . 6-2
EQUENCE EDITOR WINDOW FEATURES . . . . . . . . . . . . . . . . . . . . . . . . . . . . . . . . . . . . . . . . . . . . . . . . . . . . . . 6-19
S
Sequence Editor Menus . . . . . . . . . . . . . . . . . . . . . . . . . . . . . . . . . . . . . . . . . . . . . . . . . . . . . . . . . . . . . . . . . 6-19
Sequence Editor Toolbar . . . . . . . . . . . . . . . . . . . . . . . . . . . . . . . . . . . . . . . . . . . . . . . . . . . . . . . . . . . . . . . . 6-19
Displaying the Sequence Information Dialog Box . . . . . . . . . . . . . . . . . . . . . . . . . . . . . . . . . . . . . . . . . . . . 6-22
E
DITING THE OPTIONS FIELD IN THE SEQUENCE EDITOR . . . . . . . . . . . . . . . . . . . . . . . . . . . . . . . . . . . . . . . . 6-23
Semi-Automatic. . . . . . . . . . . . . . . . . . . . . . . . . . . . . . . . . . . . . . . . . . . . . . . . . . . . . . . . . . . . . . . . . . . . . . . . 6-23
Set Deskew Mode . . . . . . . . . . . . . . . . . . . . . . . . . . . . . . . . . . . . . . . . . . . . . . . . . . . . . . . . . . . . . . . . . . . . . . 6-24
Teaching the Base Angle (P-16+ Only) . . . . . . . . . . . . . . . . . . . . . . . . . . . . . . . . . . . . . . . . . . . . . . . . . . . . . 6-27
R
UNNING A SEQUENCE . . . . . . . . . . . . . . . . . . . . . . . . . . . . . . . . . . . . . . . . . . . . . . . . . . . . . . . . . . . . . . . . . . . . 6-28
QUEUE . . . . . . . . . . . . . . . . . . . . . . . . . . . . . . . . . . . . . . . . . . . . . . . . . . . . . . . . . . . . . . . . . . . . . . . . . . . . . . . . . 6-28
Setting up a Queue . . . . . . . . . . . . . . . . . . . . . . . . . . . . . . . . . . . . . . . . . . . . . . . . . . . . . . . . . . . . . . . . . . . . . 6-28
Adding Sequence Recipes to the Queue at Runtime . . . . . . . . . . . . . . . . . . . . . . . . . . . . . . . . . . . . . . . . . . 6-30
C
ORRELATION SCANS . . . . . . . . . . . . . . . . . . . . . . . . . . . . . . . . . . . . . . . . . . . . . . . . . . . . . . . . . . . . . . . . . . . . . 6-31
Viewing the Correlation Scan Data. . . . . . . . . . . . . . . . . . . . . . . . . . . . . . . . . . . . . . . . . . . . . . . . . . . . . . . . 6-32
VIEWING SAVED SEQUENCE DATA. . . . . . . . . . . . . . . . . . . . . . . . . . . . . . . . . . . . . . . . . . . . . . . . . . . . . . . . . . . 6-33
Viewing Old Sequence Data . . . . . . . . . . . . . . . . . . . . . . . . . . . . . . . . . . . . . . . . . . . . . . . . . . . . . . . . . . . . . . 6-33
Recovering Sequence Data . . . . . . . . . . . . . . . . . . . . . . . . . . . . . . . . . . . . . . . . . . . . . . . . . . . . . . . . . . . . . . . 6-33
Calculating Combined Sequence Statistics. . . . . . . . . . . . . . . . . . . . . . . . . . . . . . . . . . . . . . . . . . . . . . . . . . 6-34
U
SING MULTI ANALYSIS IN SEQUENCE . . . . . . . . . . . . . . . . . . . . . . . . . . . . . . . . . . . . . . . . . . . . . . . . . . . . . . . 6-34
Viewing Multi Analysis Results . . . . . . . . . . . . . . . . . . . . . . . . . . . . . . . . . . . . . . . . . . . . . . . . . . . . . . . . . . . 6-35
Preliminary
VIEWING SEQUENCE DATA . . . . . . . . . . . . . . . . . . . . . . . . . . . . . . . . . . . . . . . . . . . . . . . . . . . . . . . . . . . . . . . . . 6-36
Viewing Wafer Summary Data . . . . . . . . . . . . . . . . . . . . . . . . . . . . . . . . . . . . . . . . . . . . . . . . . . . . . . . . . . . 6-36
Sequence Summary Options . . . . . . . . . . . . . . . . . . . . . . . . . . . . . . . . . . . . . . . . . . . . . . . . . . . . . . . . . . . . . 6-36
Viewing Sequence Data with the Corresponding Trace, Site-by-Site . . . . . . . . . . . . . . . . . . . . . . . . . . . . 6-37
S
EQUENCING WITH MANUAL DESKEW (APPLIES TO BOTH P-16+ AND P-6). . . . . . . . . . . . . . . . . . . . . . . . . . 6-38
DESKEWING TWICE TO ALIGN THETA (P-16+ ONLY) . . . . . . . . . . . . . . . . . . . . . . . . . . . . . . . . . . . . . . . . . . . . 6-39
EQUENCING WITH PATTERN RECOGNITION DESKEW
S
(OPTIONAL PATTERN RECOGNITION FEATURE, P-16+ ONLY) . . . . . . . . . . . . . . . . . . . . . . . . . . . . . . . . . . . . . 6-39
ROPING WITH PATTERN RECOGNITION (P-16+ ONLY) . . . . . . . . . . . . . . . . . . . . . . . . . . . . . . . . . . . . . . . . . 6-44
G
Introduction. . . . . . . . . . . . . . . . . . . . . . . . . . . . . . . . . . . . . . . . . . . . . . . . . . . . . . . . . . . . . . . . . . . . . . . . . . . 6-44
Setup Procedure . . . . . . . . . . . . . . . . . . . . . . . . . . . . . . . . . . . . . . . . . . . . . . . . . . . . . . . . . . . . . . . . . . . . . . . 6-44
S
EQUENCING WITH SITE-BY-SITE PATTERN RECOGNITION (P-16+ ONLY) . . . . . . . . . . . . . . . . . . . . . . . . . . . 6-47
SAVING SEQUENCES. . . . . . . . . . . . . . . . . . . . . . . . . . . . . . . . . . . . . . . . . . . . . . . . . . . . . . . . . . . . . . . . . . . . . . . 6-47
AVING THE SEQUENCE DATA . . . . . . . . . . . . . . . . . . . . . . . . . . . . . . . . . . . . . . . . . . . . . . . . . . . . . . . . . . . . . . 6-48
S
Chapter 7 Analyzing 3D Scan Data
INTRODUCTION. . . . . . . . . . . . . . . . . . . . . . . . . . . . . . . . . . . . . . . . . . . . . . . . . . . . . . . . . . . . . . . . . . . . . . . . . . . . 7-1
TARTING THE 3D ANALYSIS APPLICATION . . . . . . . . . . . . . . . . . . . . . . . . . . . . . . . . . . . . . . . . . . . . . . . . . . . . 7-1
S
NALYSIS SCREEN FEATURES . . . . . . . . . . . . . . . . . . . . . . . . . . . . . . . . . . . . . . . . . . . . . . . . . . . . . . . . . . . . . 7-2
3D A
Analysis Screen – Image Orientation . . . . . . . . . . . . . . . . . . . . . . . . . . . . . . . . . . . . . . . . . . . . . . . . . . . . . . . 7-2
Graphics Buttons and Their Function). . . . . . . . . . . . . . . . . . . . . . . . . . . . . . . . . . . . . . . . . . . . . . . . . . . . . . 7-6
Analysis Menu Bar . . . . . . . . . . . . . . . . . . . . . . . . . . . . . . . . . . . . . . . . . . . . . . . . . . . . . . . . . . . . . . . . . . . . . 7-16
L
INE-BY-LINE LEVELING . . . . . . . . . . . . . . . . . . . . . . . . . . . . . . . . . . . . . . . . . . . . . . . . . . . . . . . . . . . . . . . . . . 7-32
TOC-4 KLA-Tencor Confidential 0142530-000 AB
3/13/09

KLA-Tencor P-16+ / P-6 User’s Guide
Introduction. . . . . . . . . . . . . . . . . . . . . . . . . . . . . . . . . . . . . . . . . . . . . . . . . . . . . . . . . . . . . . . . . . . . . . . . . . . .7-32
Activating Line Leveling . . . . . . . . . . . . . . . . . . . . . . . . . . . . . . . . . . . . . . . . . . . . . . . . . . . . . . . . . . . . . . . . .7-32
C
USTOMIZING THE SCAN IMAGE . . . . . . . . . . . . . . . . . . . . . . . . . . . . . . . . . . . . . . . . . . . . . . . . . . . . . . . . . . . . .7-36
Setting the Image Proportions . . . . . . . . . . . . . . . . . . . . . . . . . . . . . . . . . . . . . . . . . . . . . . . . . . . . . . . . . . . . .7-36
Setting the Shading Mode . . . . . . . . . . . . . . . . . . . . . . . . . . . . . . . . . . . . . . . . . . . . . . . . . . . . . . . . . . . . . . . .7-36
C
USTOMIZING THE VIEW . . . . . . . . . . . . . . . . . . . . . . . . . . . . . . . . . . . . . . . . . . . . . . . . . . . . . . . . . . . . . . . . . . .7-37
Changing the Image Colors . . . . . . . . . . . . . . . . . . . . . . . . . . . . . . . . . . . . . . . . . . . . . . . . . . . . . . . . . . . . . . .7-37
Changing the Scan Height Colors . . . . . . . . . . . . . . . . . . . . . . . . . . . . . . . . . . . . . . . . . . . . . . . . . . . . . . . . . .7-37
Removing Banding with Line Leveling. . . . . . . . . . . . . . . . . . . . . . . . . . . . . . . . . . . . . . . . . . . . . . . . . . . . . .7-37
U
SING IMAGE ARITHMETIC TO COMPARE DATA . . . . . . . . . . . . . . . . . . . . . . . . . . . . . . . . . . . . . . . . . . . . . . . .7-39
AVING SCAN DATA. . . . . . . . . . . . . . . . . . . . . . . . . . . . . . . . . . . . . . . . . . . . . . . . . . . . . . . . . . . . . . . . . . . . . . . .7-40
S
Saving 3D Scan Data. . . . . . . . . . . . . . . . . . . . . . . . . . . . . . . . . . . . . . . . . . . . . . . . . . . . . . . . . . . . . . . . . . . . .7-40
Creating and Saving 2D Slice Data from a 3D Scan . . . . . . . . . . . . . . . . . . . . . . . . . . . . . . . . . . . . . . . . . . .7-41
Chapter 8 APEX 2D/3D - Getting Started
INTRODUCTION. . . . . . . . . . . . . . . . . . . . . . . . . . . . . . . . . . . . . . . . . . . . . . . . . . . . . . . . . . . . . . . . . . . . . . . . . . . . .8-1
ICENCE AGREEMENT. . . . . . . . . . . . . . . . . . . . . . . . . . . . . . . . . . . . . . . . . . . . . . . . . . . . . . . . . . . . . . . . . . . . . . .8-1
L
OVERVIEW OF APEX 2D/3D . . . . . . . . . . . . . . . . . . . . . . . . . . . . . . . . . . . . . . . . . . . . . . . . . . . . . . . . . . . . . . . . . .8-1
Preliminary
Chapter 9 Stress (Optional feature)
Introduction. . . . . . . . . . . . . . . . . . . . . . . . . . . . . . . . . . . . . . . . . . . . . . . . . . . . . . . . . . . . . . . . . . . . . . . . . . . . .9-1
THEORY . . . . . . . . . . . . . . . . . . . . . . . . . . . . . . . . . . . . . . . . . . . . . . . . . . . . . . . . . . . . . . . . . . . . . . . . . . . . . . . . . .9-1
Stoney Equation . . . . . . . . . . . . . . . . . . . . . . . . . . . . . . . . . . . . . . . . . . . . . . . . . . . . . . . . . . . . . . . . . . . . . . . . .9-1
Polynomial Fit . . . . . . . . . . . . . . . . . . . . . . . . . . . . . . . . . . . . . . . . . . . . . . . . . . . . . . . . . . . . . . . . . . . . . . . . . . .9-3
Least Square Fit . . . . . . . . . . . . . . . . . . . . . . . . . . . . . . . . . . . . . . . . . . . . . . . . . . . . . . . . . . . . . . . . . . . . . . . . .9-4
T
HE 2D STRESS APPLICATION WINDOW (P-16+ AND P-6) . . . . . . . . . . . . . . . . . . . . . . . . . . . . . . . . . . . . . . . . . .9-5
The Stress Screen Tool Bar . . . . . . . . . . . . . . . . . . . . . . . . . . . . . . . . . . . . . . . . . . . . . . . . . . . . . . . . . . . . . . . .9-5
Stress Recipe Catalog . . . . . . . . . . . . . . . . . . . . . . . . . . . . . . . . . . . . . . . . . . . . . . . . . . . . . . . . . . . . . . . . . . . . .9-6
Stress Scan Data File Catalog . . . . . . . . . . . . . . . . . . . . . . . . . . . . . . . . . . . . . . . . . . . . . . . . . . . . . . . . . . . . . .9-6
C
REATING A STRESS RECIPE. . . . . . . . . . . . . . . . . . . . . . . . . . . . . . . . . . . . . . . . . . . . . . . . . . . . . . . . . . . . . . . . . .9-6
Number of Stress Points . . . . . . . . . . . . . . . . . . . . . . . . . . . . . . . . . . . . . . . . . . . . . . . . . . . . . . . . . . . . . . . . . . .9-6
Scan Start Position . . . . . . . . . . . . . . . . . . . . . . . . . . . . . . . . . . . . . . . . . . . . . . . . . . . . . . . . . . . . . . . . . . . . . . .9-6
Scan Parameters . . . . . . . . . . . . . . . . . . . . . . . . . . . . . . . . . . . . . . . . . . . . . . . . . . . . . . . . . . . . . . . . . . . . . . . . .9-7
Substrate Specification . . . . . . . . . . . . . . . . . . . . . . . . . . . . . . . . . . . . . . . . . . . . . . . . . . . . . . . . . . . . . . . . . . . .9-7
C
REATING STRESS DATA. . . . . . . . . . . . . . . . . . . . . . . . . . . . . . . . . . . . . . . . . . . . . . . . . . . . . . . . . . . . . . . . . . . . .9-8
Load a Wafer on the Stress Locator . . . . . . . . . . . . . . . . . . . . . . . . . . . . . . . . . . . . . . . . . . . . . . . . . . . . . . . . .9-8
Loading Wafers. . . . . . . . . . . . . . . . . . . . . . . . . . . . . . . . . . . . . . . . . . . . . . . . . . . . . . . . . . . . . . . . . . . . . . . . . .9-8
Taking a Pre-Stress Scan . . . . . . . . . . . . . . . . . . . . . . . . . . . . . . . . . . . . . . . . . . . . . . . . . . . . . . . . . . . . . . . . .9-10
Taking a Post-Stress Scan. . . . . . . . . . . . . . . . . . . . . . . . . . . . . . . . . . . . . . . . . . . . . . . . . . . . . . . . . . . . . . . . .9-10
Analyzing Stress Scan Results . . . . . . . . . . . . . . . . . . . . . . . . . . . . . . . . . . . . . . . . . . . . . . . . . . . . . . . . . . . . .9-10
Chapter 10 3D Stress (optional Feature, P-16+ only)
Introduction. . . . . . . . . . . . . . . . . . . . . . . . . . . . . . . . . . . . . . . . . . . . . . . . . . . . . . . . . . . . . . . . . . . . . . . . . . . .10-1
Definitions . . . . . . . . . . . . . . . . . . . . . . . . . . . . . . . . . . . . . . . . . . . . . . . . . . . . . . . . . . . . . . . . . . . . . . . . . . . . .10-1
The 3D Stress Application Window. . . . . . . . . . . . . . . . . . . . . . . . . . . . . . . . . . . . . . . . . . . . . . . . . . . . . . . . .10-3
0142530-000 AB KLA-Tencor Confidential TOC-5
3/13/09

KLA-Tencor P-16+ / P-6 User’s Guide
Creating a 3D Stress Recipe. . . . . . . . . . . . . . . . . . . . . . . . . . . . . . . . . . . . . . . . . . . . . . . . . . . . . . . . . . . . . . 10-4
Adding New Substrates to the Substrate Database . . . . . . . . . . . . . . . . . . . . . . . . . . . . . . . . . . . . . . . . . . . 10-6
Saving a Stress Recipe . . . . . . . . . . . . . . . . . . . . . . . . . . . . . . . . . . . . . . . . . . . . . . . . . . . . . . . . . . . . . . . . . . 10-7
Taking 3D Stress Data. . . . . . . . . . . . . . . . . . . . . . . . . . . . . . . . . . . . . . . . . . . . . . . . . . . . . . . . . . . . . . . . . . . 10-8
Creating and Analyzing 3D Stress Data . . . . . . . . . . . . . . . . . . . . . . . . . . . . . . . . . . . . . . . . . . . . . . . . . . . . 10-8
Saving the Stress Difference Data . . . . . . . . . . . . . . . . . . . . . . . . . . . . . . . . . . . . . . . . . . . . . . . . . . . . . . . . 10-18
Chapter 11 System Security
INTRODUCTION. . . . . . . . . . . . . . . . . . . . . . . . . . . . . . . . . . . . . . . . . . . . . . . . . . . . . . . . . . . . . . . . . . . . . . . . . . . .11-1
KLA-Tencor Operating System Security . . . . . . . . . . . . . . . . . . . . . . . . . . . . . . . . . . . . . . . . . . . . . . . . . . . .11-1
LOGIN AND LOGOUT PROCEDURE . . . . . . . . . . . . . . . . . . . . . . . . . . . . . . . . . . . . . . . . . . . . . . . . . . . . . . . . . . . .11-2
ONFIGURING KLA-TENCOR SECURITY . . . . . . . . . . . . . . . . . . . . . . . . . . . . . . . . . . . . . . . . . . . . . . . . . . . . . . .11-3
C
PROCEDURE TO MODIFY SECURITY SETTINGS . . . . . . . . . . . . . . . . . . . . . . . . . . . . . . . . . . . . . . . . . . . . . . . . . .11-4
ROUP USER ADMIN - MANAGE USERS . . . . . . . . . . . . . . . . . . . . . . . . . . . . . . . . . . . . . . . . . . . . . . . . . . . . . . . .11-5
G
ROCEDURE TO CHANGE THE AUTOLOGONUSER PASSWORD . . . . . . . . . . . . . . . . . . . . . . . . . . . . . . . . . . . . . .11-6
P
ACCESS POLICY SETTINGS . . . . . . . . . . . . . . . . . . . . . . . . . . . . . . . . . . . . . . . . . . . . . . . . . . . . . . . . . . . . . . . . . . 11-8
ROCEDURE TO CHANGE ACCESS POLICY SETTINGS . . . . . . . . . . . . . . . . . . . . . . . . . . . . . . . . . . . . . . . . . . . . . 11-9
P
PPLICATION LIFECYCLE . . . . . . . . . . . . . . . . . . . . . . . . . . . . . . . . . . . . . . . . . . . . . . . . . . . . . . . . . . . . . . . . . .11-15
A
PROCEDURE TO CHANGE APPLICATION LIFECYCLE SETTINGS . . . . . . . . . . . . . . . . . . . . . . . . . . . . . . . . . . . . 11-16
LOBAL SETTINGS. . . . . . . . . . . . . . . . . . . . . . . . . . . . . . . . . . . . . . . . . . . . . . . . . . . . . . . . . . . . . . . . . . . . . . . .11-17
G
ROCEDURE TO CHANGE THE GLOBAL SETTINGS . . . . . . . . . . . . . . . . . . . . . . . . . . . . . . . . . . . . . . . . . . . . . . 11-19
P
SECURITY GROUPS. . . . . . . . . . . . . . . . . . . . . . . . . . . . . . . . . . . . . . . . . . . . . . . . . . . . . . . . . . . . . . . . . . . . . . . .11-20
OMPUTER MANAGEMENT/USER ACCOUNTS . . . . . . . . . . . . . . . . . . . . . . . . . . . . . . . . . . . . . . . . . . . . . . . . . .11-21
C
Preliminary
ROCEDURE TO CREATE A NEW USER ACCOUNT . . . . . . . . . . . . . . . . . . . . . . . . . . . . . . . . . . . . . . . . . . . . . . .11-21
P
PROCEDURE TO ADD USERS TO SECURITY GROUPS . . . . . . . . . . . . . . . . . . . . . . . . . . . . . . . . . . . . . . . . . . . . . 11-23
ROCEDURE TO ADD SECURITY GROUPS TO USER ACCOUNTS . . . . . . . . . . . . . . . . . . . . . . . . . . . . . . . . . . . . 11-26
P
Chapter 12 Calibrations
STANDARD CALIBRATION MATRIX. . . . . . . . . . . . . . . . . . . . . . . . . . . . . . . . . . . . . . . . . . . . . . . . . . . . . . . . . . . 12-1
PPLIED FORCE CALIBRATION. . . . . . . . . . . . . . . . . . . . . . . . . . . . . . . . . . . . . . . . . . . . . . . . . . . . . . . . . . . . . . 12-1
A
Introduction. . . . . . . . . . . . . . . . . . . . . . . . . . . . . . . . . . . . . . . . . . . . . . . . . . . . . . . . . . . . . . . . . . . . . . . . . . . 12-1
Applied Force Calibration Procedure. . . . . . . . . . . . . . . . . . . . . . . . . . . . . . . . . . . . . . . . . . . . . . . . . . . . . . 12-2
V
IDEO CALIBRATION . . . . . . . . . . . . . . . . . . . . . . . . . . . . . . . . . . . . . . . . . . . . . . . . . . . . . . . . . . . . . . . . . . . . . . 12-3
Introduction. . . . . . . . . . . . . . . . . . . . . . . . . . . . . . . . . . . . . . . . . . . . . . . . . . . . . . . . . . . . . . . . . . . . . . . . . . . 12-3
Video Calibration Procedure . . . . . . . . . . . . . . . . . . . . . . . . . . . . . . . . . . . . . . . . . . . . . . . . . . . . . . . . . . . . . 12-3
S
CAN POSITION OFFSET CALIBRATION . . . . . . . . . . . . . . . . . . . . . . . . . . . . . . . . . . . . . . . . . . . . . . . . . . . . . . . 12-6
Introduction. . . . . . . . . . . . . . . . . . . . . . . . . . . . . . . . . . . . . . . . . . . . . . . . . . . . . . . . . . . . . . . . . . . . . . . . . . . 12-6
S
TEP HEIGHT CALIBRATION . . . . . . . . . . . . . . . . . . . . . . . . . . . . . . . . . . . . . . . . . . . . . . . . . . . . . . . . . . . . . . . . 12-6
Calibration Procedure:. . . . . . . . . . . . . . . . . . . . . . . . . . . . . . . . . . . . . . . . . . . . . . . . . . . . . . . . . . . . . . . . . . 12-7
ERIES LEVEL CALIBRATIONS . . . . . . . . . . . . . . . . . . . . . . . . . . . . . . . . . . . . . . . . . . . . . . . . . . . . . . . . . 12-12
P-16 S
Level Calibration Procedure . . . . . . . . . . . . . . . . . . . . . . . . . . . . . . . . . . . . . . . . . . . . . . . . . . . . . . . . . . . . 12-13
Level Calibration Confirmation . . . . . . . . . . . . . . . . . . . . . . . . . . . . . . . . . . . . . . . . . . . . . . . . . . . . . . . . . 12-15
P-6 L
EVELING . . . . . . . . . . . . . . . . . . . . . . . . . . . . . . . . . . . . . . . . . . . . . . . . . . . . . . . . . . . . . . . . . . . . . . . . . . 12-19
WAFER CENTER CALIBRATION. . . . . . . . . . . . . . . . . . . . . . . . . . . . . . . . . . . . . . . . . . . . . . . . . . . . . . . . . . . . . 12-19
TOC-6 KLA-Tencor Confidential 0142530-000 AB
3/13/09

KLA-Tencor P-16+ / P-6 User’s Guide
Chapter 13 Stylus Change Procedure
INTRODUCTION. . . . . . . . . . . . . . . . . . . . . . . . . . . . . . . . . . . . . . . . . . . . . . . . . . . . . . . . . . . . . . . . . . . . . . . . . . . .13-1
TYLUS REMOVAL AND REPLACEMENT . . . . . . . . . . . . . . . . . . . . . . . . . . . . . . . . . . . . . . . . . . . . . . . . . . . . . . . .13-2
S
Stylus Removal . . . . . . . . . . . . . . . . . . . . . . . . . . . . . . . . . . . . . . . . . . . . . . . . . . . . . . . . . . . . . . . . . . . . . . . . .13-3
Stylus Replacement. . . . . . . . . . . . . . . . . . . . . . . . . . . . . . . . . . . . . . . . . . . . . . . . . . . . . . . . . . . . . . . . . . . . . .13-7
Scan Position Offset Calibration . . . . . . . . . . . . . . . . . . . . . . . . . . . . . . . . . . . . . . . . . . . . . . . . . . . . . . . . . .13-9
Chapter 14 Configuration
OPERATING ENVIRONMENT . . . . . . . . . . . . . . . . . . . . . . . . . . . . . . . . . . . . . . . . . . . . . . . . . . . . . . . . . . . . . . . . .14-1
YSTEM GEOMETRY . . . . . . . . . . . . . . . . . . . . . . . . . . . . . . . . . . . . . . . . . . . . . . . . . . . . . . . . . . . . . . . . . . . . . . .14-1
S
Level and Tilt . . . . . . . . . . . . . . . . . . . . . . . . . . . . . . . . . . . . . . . . . . . . . . . . . . . . . . . . . . . . . . . . . . . . . . . . . .14-2
INTRODUCTION TO SYSTEM CONFIGURATION . . . . . . . . . . . . . . . . . . . . . . . . . . . . . . . . . . . . . . . . . . . . . . . . . . .14-5
STAGE CONFIGURATION . . . . . . . . . . . . . . . . . . . . . . . . . . . . . . . . . . . . . . . . . . . . . . . . . . . . . . . . . . . . . . . . . . . .14-6
Theta Soft Home Position. . . . . . . . . . . . . . . . . . . . . . . . . . . . . . . . . . . . . . . . . . . . . . . . . . . . . . . . . . . . . . . . .14-7
Teach Lowest Elevator Position. . . . . . . . . . . . . . . . . . . . . . . . . . . . . . . . . . . . . . . . . . . . . . . . . . . . . . . . . . . .14-7
Elevator Focus Speed . . . . . . . . . . . . . . . . . . . . . . . . . . . . . . . . . . . . . . . . . . . . . . . . . . . . . . . . . . . . . . . . . . . .14-9
Elevator Slow Focus Speed . . . . . . . . . . . . . . . . . . . . . . . . . . . . . . . . . . . . . . . . . . . . . . . . . . . . . . . . . . . . . . .14-9
Move Elevator to Safe Position Before Moving Stage . . . . . . . . . . . . . . . . . . . . . . . . . . . . . . . . . . . . . . . . . .14-9
Elevator Safe Position. . . . . . . . . . . . . . . . . . . . . . . . . . . . . . . . . . . . . . . . . . . . . . . . . . . . . . . . . . . . . . . . . . .14-10
S
YSTEM CONFIGURATION . . . . . . . . . . . . . . . . . . . . . . . . . . . . . . . . . . . . . . . . . . . . . . . . . . . . . . . . . . . . . . . . . .14-10
Editing the System Configuration . . . . . . . . . . . . . . . . . . . . . . . . . . . . . . . . . . . . . . . . . . . . . . . . . . . . . . . . .14-10
Instrument Setup Configuration Dialog Box . . . . . . . . . . . . . . . . . . . . . . . . . . . . . . . . . . . . . . . . . . . . . . . .14-11
S
AFE AREA CONFIGURATION . . . . . . . . . . . . . . . . . . . . . . . . . . . . . . . . . . . . . . . . . . . . . . . . . . . . . . . . . . . . . . .14-12
LICENSE OPTIONS . . . . . . . . . . . . . . . . . . . . . . . . . . . . . . . . . . . . . . . . . . . . . . . . . . . . . . . . . . . . . . . . . . . . . . . .14-15
ECIPE TRANSPORT OPTIONS . . . . . . . . . . . . . . . . . . . . . . . . . . . . . . . . . . . . . . . . . . . . . . . . . . . . . . . . . . . . . . .14-16
R
Data Export Paths Configuration . . . . . . . . . . . . . . . . . . . . . . . . . . . . . . . . . . . . . . . . . . . . . . . . . . . . . . . . .14-16
SEQUENCE EXECUTION OPTIONS . . . . . . . . . . . . . . . . . . . . . . . . . . . . . . . . . . . . . . . . . . . . . . . . . . . . . . . . . . . .14-17
Open Sequence Execution Options Dialog Box . . . . . . . . . . . . . . . . . . . . . . . . . . . . . . . . . . . . . . . . . . . . . .14-17
P
ROXIMITY SENSOR CONFIGURATION (P-16+ ONLY) . . . . . . . . . . . . . . . . . . . . . . . . . . . . . . . . . . . . . . . . . . . .14-17
Configuration Procedure . . . . . . . . . . . . . . . . . . . . . . . . . . . . . . . . . . . . . . . . . . . . . . . . . . . . . . . . . . . . . . . .14-17
Options. . . . . . . . . . . . . . . . . . . . . . . . . . . . . . . . . . . . . . . . . . . . . . . . . . . . . . . . . . . . . . . . . . . . . . . . . . . . . . .14-18
P
RECISI ON LOCATORS (P-16+ ONLY) . . . . . . . . . . . . . . . . . . . . . . . . . . . . . . . . . . . . . . . . . . . . . . . . . . . . . . . .14-19
Wafer Precision Locators. . . . . . . . . . . . . . . . . . . . . . . . . . . . . . . . . . . . . . . . . . . . . . . . . . . . . . . . . . . . . . . .14-19
Three Point Disk Locator. . . . . . . . . . . . . . . . . . . . . . . . . . . . . . . . . . . . . . . . . . . . . . . . . . . . . . . . . . . . . . . .14-21
Precision Locators - Description . . . . . . . . . . . . . . . . . . . . . . . . . . . . . . . . . . . . . . . . . . . . . . . . . . . . . . . . . .14-24
P-6 P
RECISION LOCATORS . . . . . . . . . . . . . . . . . . . . . . . . . . . . . . . . . . . . . . . . . . . . . . . . . . . . . . . . . . . . . . . . .14-25
Preliminary
Chapter 15 Preventive Maintenance
INTRODUCTION. . . . . . . . . . . . . . . . . . . . . . . . . . . . . . . . . . . . . . . . . . . . . . . . . . . . . . . . . . . . . . . . . . . . . . . . . . . .15-1
ERIODIC PREVENTIVE MAINTENANCE . . . . . . . . . . . . . . . . . . . . . . . . . . . . . . . . . . . . . . . . . . . . . . . . . . . . . . . .15-1
P
Weekly PM Procedures . . . . . . . . . . . . . . . . . . . . . . . . . . . . . . . . . . . . . . . . . . . . . . . . . . . . . . . . . . . . . . . . . .15-1
Monthly PM Procedures . . . . . . . . . . . . . . . . . . . . . . . . . . . . . . . . . . . . . . . . . . . . . . . . . . . . . . . . . . . . . . . . .15-2
Semi-Annual PM Procedures. . . . . . . . . . . . . . . . . . . . . . . . . . . . . . . . . . . . . . . . . . . . . . . . . . . . . . . . . . . . . .15-2
0142530-000 AB KLA-Tencor Confidential TOC-7
3/13/09

KLA-Tencor P-16+ / P-6 User’s Guide
Chapter 16 Backup and Restore
Introduction. . . . . . . . . . . . . . . . . . . . . . . . . . . . . . . . . . . . . . . . . . . . . . . . . . . . . . . . . . . . . . . . . . . . . . . . . . . 16-1
Profiler Backup Procedure . . . . . . . . . . . . . . . . . . . . . . . . . . . . . . . . . . . . . . . . . . . . . . . . . . . . . . . . . . . . . . 16-1
Appendix A Hazardous Materials
INTRODUCTION. . . . . . . . . . . . . . . . . . . . . . . . . . . . . . . . . . . . . . . . . . . . . . . . . . . . . . . . . . . . . . . . . . . . . . . . . . . . A-1
HAZARDOUS MATERIAL CONTENT. . . . . . . . . . . . . . . . . . . . . . . . . . . . . . . . . . . . . . . . . . . . . . . . . . . . . . . . . . . . A-1
AZARDOUS MATERIALS LIST . . . . . . . . . . . . . . . . . . . . . . . . . . . . . . . . . . . . . . . . . . . . . . . . . . . . . . . . . . . . . . . A-2
H
Appendix A P Series Profiler - Preparing for Shipment
INTRODUCTION. . . . . . . . . . . . . . . . . . . . . . . . . . . . . . . . . . . . . . . . . . . . . . . . . . . . . . . . . . . . . . . . . . . . . . . . . . . . B-1
ROCEDURE . . . . . . . . . . . . . . . . . . . . . . . . . . . . . . . . . . . . . . . . . . . . . . . . . . . . . . . . . . . . . . . . . . . . . . . . . . . . . . B-1
P
Preliminary
TOC-8 KLA-Tencor Confidential 0142530-000 AB
3/13/09

List of Figures
Chapter 1 Introduction & Safety
Figure 1.1 Power Cord Plug Lockout/Tagout . . . . . . . . . . . . . . . . . . . . . . . . . . . . . . . . . . . . . . . . . . . . . . . 1-3
Chapter 2 Basic Skills
Figure 2.1 Logon Dialog . . . . . . . . . . . . . . . . . . . . . . . . . . . . . . . . . . . . . . . . . . . . . . . . . . . . . . . . . . . . . . . 2-2
Figure 2.2 Program Icons . . . . . . . . . . . . . . . . . . . . . . . . . . . . . . . . . . . . . . . . . . . . . . . . . . . . . . . . . . . . . . 2-3
Figure 2.3 Profiler Catalog Screen . . . . . . . . . . . . . . . . . . . . . . . . . . . . . . . . . . . . . . . . . . . . . . . . . . . . . . . 2-4
Figure 2.4 Profiler Configuration Screen . . . . . . . . . . . . . . . . . . . . . . . . . . . . . . . . . . . . . . . . . . . . . . . . . . 2-6
Figure 2.5 Clearing the Status Diagnostic Messages . . . . . . . . . . . . . . . . . . . . . . . . . . . . . . . . . . . . . . . . . 2-7
Figure 2.6 Contact Scan Stylus Tip . . . . . . . . . . . . . . . . . . . . . . . . . . . . . . . . . . . . . . . . . . . . . . . . . . . . . . . 2-9
Figure 2.7 Scan Recipe Window in the Catalog Screen . . . . . . . . . . . . . . . . . . . . . . . . . . . . . . . . . . . . . . 2-10
Figure 2.8 XY View Screen . . . . . . . . . . . . . . . . . . . . . . . . . . . . . . . . . . . . . . . . . . . . . . . . . . . . . . . . . . . 2-11
Figure 2.9 Video Control Dialog Box . . . . . . . . . . . . . . . . . . . . . . . . . . . . . . . . . . . . . . . . . . . . . . . . . . . . 2-12
Figure 2.10 Export File Formats in Drop-Down Menu . . . . . . . . . . . . . . . . . . . . . . . . . . . . . . . . . . . . . . . . 2-14
Figure 2.11 Catalog Screen – Database File Manager Icon . . . . . . . . . . . . . . . . . . . . . . . . . . . . . . . . . . . . 2-14
Figure 2.12 Data Catalog Screen for Export of Data or Recipes . . . . . . . . . . . . . . . . . . . . . . . . . . . . . . . . 2-15
Figure 2.13 Graphics Export Dialog Box . . . . . . . . . . . . . . . . . . . . . . . . . . . . . . . . . . . . . . . . . . . . . . . . . . 2-15
Figure 2.14 Data Catalog Screen for Export of Data or Recipes . . . . . . . . . . . . . . . . . . . . . . . . . . . . . . . . 2-17
Chapter 3 Scan Recipes
Figure 3.1 Catalog Sequence Recipe Screen . . . . . . . . . . . . . . . . . . . . . . . . . . . . . . . . . . . . . . . . . . . . . . . . 3-2
Figure 3.2 Catalog Sequence Recipe Screen . . . . . . . . . . . . . . . . . . . . . . . . . . . . . . . . . . . . . . . . . . . . . . . . 3-3
Figure 3.3 Title Bar for Catalog Screen . . . . . . . . . . . . . . . . . . . . . . . . . . . . . . . . . . . . . . . . . . . . . . . . . . . 3-4
Figure 3.4 Menu Bar for
Figure 3.5 ToolBar Icons . . . . . . . . . . . . . . . . . . . . . . . . . . . . . . . . . . . . . . . . . . . . . . . . . . . . . . . . . . . . . . . 3-8
Figure 3.6 Scan Recipe information in the List Window . . . . . . . . . . . . . . . . . . . . . . . . . . . . . . . . . . . . . 3-10
Figure 3.7 Tool Bar Buttons . . . . . . . . . . . . . . . . . . . . . . . . . . . . . . . . . . . . . . . . . . . . . . . . . . . . . . . . . . . 3-11
Figure 3.8 System Status Message Field . . . . . . . . . . . . . . . . . . . . . . . . . . . . . . . . . . . . . . . . . . . . . . . . . . 3-12
Figure 3.9 Recipe Editor for a 2D UNTITLED Recipe . . . . . . . . . . . . . . . . . . . . . . . . . . . . . . . . . . . . . . 3-14
Figure 3.10 3D Parameters in the Information Display Window . . . . . . . . . . . . . . . . . . . . . . . . . . . . . . . . 3-14
Figure 3.11 2D Scan Category Parameters . . . . . . . . . . . . . . . . . . . . . . . . . . . . . . . . . . . . . . . . . . . . . . . . . 3-15
Figure 3.12 X Scan Size (mm) . . . . . . . . . . . . . . . . . . . . . . . . . . . . . . . . . . . . . . . . . . . . . . . . . . . . . . . . . . 3-15
Figure 3.13 Scan Trace Comparison - Large vs. Small Stylus Radius . . . . . . . . . . . . . . . . . . . . . . . . . . . . 3-17
Figure 3.14 Data Collection When Using a Large Radius Stylus . . . . . . . . . . . . . . . . . . . . . . . . . . . . . . . . 3-18
Figure 3.15 Data Collection When Using a Small Radius Stylus . . . . . . . . . . . . . . . . . . . . . . . . . . . . . . . . 3-19
Figure 3.16 2D Scan Options With Sampling Rate Menu . . . . . . . . . . . . . . . . . . . . . . . . . . . . . . . . . . . . . 3-19
Figure 3.17 Teach Scan Length, from the 2D Scan Teach Button . . . . . . . . . . . . . . . . . . . . . . . . . . . . . . . 3-22
Figure 3.18 3D Scan Parameters . . . . . . . . . . . . . . . . . . . . . . . . . . . . . . . . . . . . . . . . . . . . . . . . . . . . . . . . . 3-23
Figure 3.19 Traces - Scan Perimeter with Traces . . . . . . . . . . . . . . . . . . . . . . . . . . . . . . . . . . . . . . . . . . . . 3-24
Figure 3.20 Scan Time - Scan Parameters Definition . . . . . . . . . . . . . . . . . . . . . . . . . . . . . . . . . . . . . . . . . 3-26
Figure 3.21 Stylus Parameters (2D and 3D) . . . . . . . . . . . . . . . . . . . . . . . . . . . . . . . . . . . . . . . . . . . . . . . . 3-27
Figure 3.22 Vertical Ranging - Profile Types . . . . . . . . . . . . . . . . . . . . . . . . . . . . . . . . . . . . . . . . . . . . . . . 3-30
Figure 3.23 Feature Detection - Recipe Editor . . . . . . . . . . . . . . . . . . . . . . . . . . . . . . . . . . . . . . . . . . . . . . 3-32
Figure 3.24 Feature Detection Point Locations on a Step . . . . . . . . . . . . . . . . . . . . . . . . . . . . . . . . . . . . . .3-33
Figure 3.25 Feature Detection Point Locations for Convex and Concave . . . . . . . . . . . . . . . . . . . . . . . . . 3-33
Scan Recipe Screen . . . . . . . . . . . . . . . . . . . . . . . . . . . . . . . . . . . . . . . . . . . . . . . 3-5
P/N 0142530-000 AB LOF-1
3/13/09

KLA-Tencor P-16+ / P-6 User’s Guide
Figure 3.26 Detection Variables - Feature Detection - Recipe Editor . . . . . . . . . . . . . . . . . . . . . . . . . . . . . 3-35
Figure 3.27 Scan Trace (Red) with First Derivative (Dark Blue) Overlaid on the Same Graph . . . . . . . . . 3-37
Figure 3.28 Filters Parameters - Noise Filter Menu . . . . . . . . . . . . . . . . . . . . . . . . . . . . . . . . . . . . . . . . . .3-38
Figure 3.29 Cursor Parameters - Recipe Editor . . . . . . . . . . . . . . . . . . . . . . . . . . . . . . . . . . . . . . . . . . . . . .3-39
Figure 3.30 Analysis Screen with Trace in Need of Leveling . . . . . . . . . . . . . . . . . . . . . . . . . . . . . . . . . . .3-40
Figure 3.31 Cursor Boundary Setting on Unleveled Trace . . . . . . . . . . . . . . . . . . . . . . . . . . . . . . . . . . . . .3-41
Figure 3.32 Setting Measurement Cursors . . . . . . . . . . . . . . . . . . . . . . . . . . . . . . . . . . . . . . . . . . . . . . . . . .3-42
Figure 3.33 Measurement Cursor on Level Trace . . . . . . . . . . . . . . . . . . . . . . . . . . . . . . . . . . . . . . . . . . . . 3-42
Figure 3.34 Cursor Parameters - Recipe Editor . . . . . . . . . . . . . . . . . . . . . . . . . . . . . . . . . . . . . . . . . . . . . .3-43
Figure 3.35 Measurement Cursors - Relative to Feature Detection . . . . . . . . . . . . . . . . . . . . . . . . . . . . . . .3-44
Figure 3.36 Median Filter Application in Glitch Removal . . . . . . . . . . . . . . . . . . . . . . . . . . . . . . . . . . . . .3-46
Figure 3.37 2D and 3D Median Filter Options . . . . . . . . . . . . . . . . . . . . . . . . . . . . . . . . . . . . . . . . . . . . . .3-47
Figure 3.38 Y Lead Screw Filter Application . . . . . . . . . . . . . . . . . . . . . . . . . . . . . . . . . . . . . . . . . . . . . . . 3-48
Figure 3.39 3D Measurement Cursor Box . . . . . . . . . . . . . . . . . . . . . . . . . . . . . . . . . . . . . . . . . . . . . . . . . .3-49
Figure 3.40 Recipe Editor - Choosing 3D Cursors . . . . . . . . . . . . . . . . . . . . . . . . . . . . . . . . . . . . . . . . . . . 3-50
Figure 3.41 Recipe Screen with Unit Output Dialog Box . . . . . . . . . . . . . . . . . . . . . . . . . . . . . . . . . . . . . . 3-51
Figure 3.42 General Parameters - Recipe Editor . . . . . . . . . . . . . . . . . . . . . . . . . . . . . . . . . . . . . . . . . . . . . 3-52
Figure 3.43 Waviness vs. Roughness . . . . . . . . . . . . . . . . . . . . . . . . . . . . . . . . . . . . . . . . . . . . . . . . . . . . .3-56
Figure 3.44 Roughness/Waviness Filter Analysis . . . . . . . . . . . . . . . . . . . . . . . . . . . . . . . . . . . . . . . . . . . .3-56
Figure 3.45 Recipe Editor Showing 2D and 3D Roughness/Waviness Parameters . . . . . . . . . . . . . . . . . .3-57
Figure 3.46 3D Roughness Parameters . . . . . . . . . . . . . . . . . . . . . . . . . . . . . . . . . . . . . . . . . . . . . . . . . . . .3-61
Figure 3.47 Bearing Ration and Cutting Depth Parameters . . . . . . . . . . . . . . . . . . . . . . . . . . . . . . . . . . . .3-63
Figure 3.48 2D Bearing Ratio . . . . . . . . . . . . . . . . . . . . . . . . . . . . . . . . . . . . . . . . . . . . . . . . . . . . . . . . . . .3-64
Figure 3.49 Depth for 2D Bearing Ratio . . . . . . . . . . . . . . . . . . . . . . . . . . . . . . . . . . . . . . . . . . . . . . . . . . .3-64
Figure 3.50 Cutting Depth . . . . . . . . . . . . . . . . . . . . . . . . . . . . . . . . . . . . . . . . . . . . . . . . . . . . . . . . . . . . . .3-65
Figure 3.51 Bearing Ratio and Cutting Depth Parameters . . . . . . . . . . . . . . . . . . . . . . . . . . . . . . . . . . . . . 3-67
Preliminary
Figure 3.52 High Spot Count . . . . . . . . . . . . . . . . . . . . . . . . . . . . . . . . . . . . . . . . . . . . . . . . . . . . . . . . . . .3-68
Figure 3.53 Peak Count . . . . . . . . . . . . . . . . . . . . . . . . . . . . . . . . . . . . . . . . . . . . . . . . . . . . . . . . . . . . . . . . 3-69
Figure 3.54 2D Peak Count (PC) . . . . . . . . . . . . . . . . . . . . . . . . . . . . . . . . . . . . . . . . . . . . . . . . . . . . . . . . . 3-69
Figure 3.55 Histogram Leveling Parameters . . . . . . . . . . . . . . . . . . . . . . . . . . . . . . . . . . . . . . . . . . . . . . . .3-72
Figure 3.56 Histograms of Scans A and B . . . . . . . . . . . . . . . . . . . . . . . . . . . . . . . . . . . . . . . . . . . . . . . . . .3-73
Figure 3.57 Multiple Bins (Mode) Used to Define a Plane . . . . . . . . . . . . . . . . . . . . . . . . . . . . . . . . . . . . .3-73
Figure 3.58 Flat Surface Scan of a Single Object . . . . . . . . . . . . . . . . . . . . . . . . . . . . . . . . . . . . . . . . . . . . 3-74
Figure 3.59 Most Populous Plane Trace Variation . . . . . . . . . . . . . . . . . . . . . . . . . . . . . . . . . . . . . . . . . . .3-75
Figure 3.60 Histogram of a Scan . . . . . . . . . . . . . . . . . . . . . . . . . . . . . . . . . . . . . . . . . . . . . . . . . . . . . . . . . 3-76
Figure 3.61 Histogram Depth . . . . . . . . . . . . . . . . . . . . . . . . . . . . . . . . . . . . . . . . . . . . . . . . . . . . . . . . . . .3-77
Figure 3.62 CMP Analysis - Lines or Array . . . . . . . . . . . . . . . . . . . . . . . . . . . . . . . . . . . . . . . . . . . . . . . . 3-78
Figure 3.63 CMP Analysis - PADS . . . . . . . . . . . . . . . . . . . . . . . . . . . . . . . . . . . . . . . . . . . . . . . . . . . . . . . 3-79
Figure 3.64 Sample Array . . . . . . . . . . . . . . . . . . . . . . . . . . . . . . . . . . . . . . . . . . . . . . . . . . . . . . . . . . . . . .3-80
Figure 3.65 ER and CR . . . . . . . . . . . . . . . . . . . . . . . . . . . . . . . . . . . . . . . . . . . . . . . . . . . . . . . . . . . . . . . . 3-81
Figure 3.66 Sample Array of Lines . . . . . . . . . . . . . . . . . . . . . . . . . . . . . . . . . . . . . . . . . . . . . . . . . . . . . . .3-82
Figure 3.67 Sample Pad . . . . . . . . . . . . . . . . . . . . . . . . . . . . . . . . . . . . . . . . . . . . . . . . . . . . . . . . . . . . . . . .3-83
Figure 3.68 Feature Find Parameter Definition . . . . . . . . . . . . . . . . . . . . . . . . . . . . . . . . . . . . . . . . . . . . . .3-85
Figure 3.69 Trench / Line Features . . . . . . . . . . . . . . . . . . . . . . . . . . . . . . . . . . . . . . . . . . . . . . . . . . . . . . .3-87
Figure 3.70 Trench / Line Scan . . . . . . . . . . . . . . . . . . . . . . . . . . . . . . . . . . . . . . . . . . . . . . . . . . . . . . . . . . 3-88
Figure 3.71 Edge of an Array of 5 µm Lines . . . . . . . . . . . . . . . . . . . . . . . . . . . . . . . . . . . . . . . . . . . . . . . . 3-89
Figure 3.72 Model Feature Search for the Edge of an Array of 5 mm Lines . . . . . . . . . . . . . . . . . . . . . . . 3-89
Figure 3.73 Model Feature Scan . . . . . . . . . . . . . . . . . . . . . . . . . . . . . . . . . . . . . . . . . . . . . . . . . . . . . . . . . 3-90
Figure 3.74 5µm Lines Measurement Pattern . . . . . . . . . . . . . . . . . . . . . . . . . . . . . . . . . . . . . . . . . . . . . . . 3-94
Figure 3.75 Feature Find Definition for Model Feature . . . . . . . . . . . . . . . . . . . . . . . . . . . . . . . . . . . . . . .3-96
Figure 3.76 Dual Damascene Example for Model Feature using Depth Based Matching . . . . . . . . . . . . . 3-97
LOF-2 KLA-Tencor Confidential 0142530-000 AB
3/13/09

KLA-Tencor P-16+ / P-6 User’s Guide
Figure 3.77 Recipe Information Dialog Box . . . . . . . . . . . . . . . . . . . . . . . . . . . . . . . . . . . . . . . . . . . . . . . 3-100
Chapter 4 XY View Screen
Figure 4.1 XY View Screen . . . . . . . . . . . . . . . . . . . . . . . . . . . . . . . . . . . . . . . . . . . . . . . . . . . . . . . . . . . . 4-1
Figure 4.2 Move Extents Dialog Box. . . . . . . . . . . . . . . . . . . . . . . . . . . . . . . . . . . . . . . . . . . . . . . . . . . . . . 4-5
Figure 4.3 Move To Position Dialog Box . . . . . . . . . . . . . . . . . . . . . . . . . . . . . . . . . . . . . . . . . . . . . . . . . . 4-5
Figure 4.4 Distance Dialog Box . . . . . . . . . . . . . . . . . . . . . . . . . . . . . . . . . . . . . . . . . . . . . . . . . . . . . . . . . 4-8
Figure 4.5 View Menu and the Stage and Zoom Coordinate Field . . . . . . . . . . . . . . . . . . . . . . . . . . . . . . 4-10
Figure 4.6 Save Zoom Position Dialog Box . . . . . . . . . . . . . . . . . . . . . . . . . . . . . . . . . . . . . . . . . . . . . . . 4-11
Figure 4.7 P-16+ MicroHead Measurement Head. . . . . . . . . . . . . . . . . . . . . . . . . . . . . . . . . . . . . . . . . . . 4-12
Figure 4.8 P-16+ Focusing the Optics (Dual-View Optics). . . . . . . . . . . . . . . . . . . . . . . . . . . . . . . . . . . . 4-13
Figure 4.9 Coordinate System of the KLA-Tencor Profiler Stage . . . . . . . . . . . . . . . . . . . . . . . . . . . . . . 4-14
Figure 4.10 XY View Screen Tool Bar . . . . . . . . . . . . . . . . . . . . . . . . . . . . . . . . . . . . . . . . . . . . . . . . . . . . 4-15
Figure 4.11 XY View Screen . . . . . . . . . . . . . . . . . . . . . . . . . . . . . . . . . . . . . . . . . . . . . . . . . . . . . . . . . . . 4-16
Figure 4.12 Teach Die Grid Screen with Loaded Die Grid . . . . . . . . . . . . . . . . . . . . . . . . . . . . . . . . . . . . . 4-17
Figure 4.13 Scan Catalog Screen . . . . . . . . . . . . . . . . . . . . . . . . . . . . . . . . . . . . . . . . . . . . . . . . . . . . . . . . . 4-19
Figure 4.14 Warning – Automatic Null . . . . . . . . . . . . . . . . . . . . . . . . . . . . . . . . . . . . . . . . . . . . . . . . . . . . 4-19
Figure 4.15 Teach Die Grid Screen . . . . . . . . . . . . . . . . . . . . . . . . . . . . . . . . . . . . . . . . . . . . . . . . . . . . . . . 4-20
Figure 4.16 Teach Die Grid - Teach First Position . . . . . . . . . . . . . . . . . . . . . . . . . . . . . . . . . . . . . . . . . . . 4-21
Figure 4.17 Teach Die Grid - Teach Feature . . . . . . . . . . . . . . . . . . . . . . . . . . . . . . . . . . . . . . . . . . . . . . . . 4-22
Figure 4.18 Teach Die Grid - Lower Right Corner . . . . . . . . . . . . . . . . . . . . . . . . . . . . . . . . . . . . . . . . . . . 4-23
Figure 4.19 Teach Die Grid - With Feature in Navigation Window . . . . . . . . . . . . . . . . . . . . . . . . . . . . . . 4-24
Figure 4.20 Teach Die Grid - Die Grid Simulation in Navigation Window . . . . . . . . . . . . . . . . . . . . . . . . 4-24
Figure 4.21 Sequence Editor with Die Grid Menu . . . . . . . . . . . . . . . . . . . . . . . . . . . . . . . . . . . . . . . . . . . 4-26
Figure 4.22 Load Sequence Die Grid . . . . . . . . . . . . . . . . . . . . . . . . . . . . . . . . . . . . . . . . . . . . . . . . . . . . . 4-27
Figure 4.23 Die Grid Menu From the Menu Bar . . . . . . . . . . . . . . . . . . . . . . . . . . . . . . . . . . . . . . . . . . . . . 4-28
Figure 4.24 Setting Alignment Angle . . . . . . . . . . . . . . . . . . . . . . . . . . . . . . . . . . . . . . . . . . . . . . . . . . . . . 4-30
Figure 4.25 Move Menu . . . . . . . . . . . . . . . . . . . . . . . . . . . . . . . . . . . . . . . . . . . . . . . . . . . . . . . . . . . . . . . . . 4-31
Preliminary
Chapter 5 View Scan Window
Figure 5.1 2D Single Scan View Scan Window . . . . . . . . . . . . . . . . . . . . . . . . . . . . . . . . . . . . . . . . . . . . . 5-1
Figure 5.2 2D Scan Window - Scan Information Field . . . . . . . . . . . . . . . . . . . . . . . . . . . . . . . . . . . . . . . .5-2
Figure 5.3 2D Scan Window - Scan Information Field . . . . . . . . . . . . . . . . . . . . . . . . . . . . . . . . . . . . . . . .5-3
Figure 5.4 Scan screen - real time Trace Window . . . . . . . . . . . . . . . . . . . . . . . . . . . . . . . . . . . . . . . . . . . 5-4
Figure 5.5 2D View Scan Screen Menu Bar . . . . . . . . . . . . . . . . . . . . . . . . . . . . . . . . . . . . . . . . . . . . . . . . 5-5
Figure 5.6 3D View Scan Screen During a Single Scan . . . . . . . . . . . . . . . . . . . . . . . . . . . . . . . . . . . . . . . 5-9
Figure 5.7 3D View Scan Screen During a Scan Sequence . . . . . . . . . . . . . . . . . . . . . . . . . . . . . . . . . . . 5-10
Figure 5.8 3D Scan Window - Scan Information Field . . . . . . . . . . . . . . . . . . . . . . . . . . . . . . . . . . . . . . . 5-10
Figure 5.9 3D Scan Window - Scan Information Field . . . . . . . . . . . . . . . . . . . . . . . . . . . . . . . . . . . . . . . 5-11
Figure 5.10 View Scan Screen Menu Bar . . . . . . . . . . . . . . . . . . . . . . . . . . . . . . . . . . . . . . . . . . . . . . . . . . 5-12
Figure 5.11 Top View Image of the 3D Scan In Progress . . . . . . . . . . . . . . . . . . . . . . . . . . . . . . . . . . . . . . 5-14
Figure 5.12 Sequence Scan Screen with Die Measurement Site Map . . . . . . . . . . . . . . . . . . . . . . . . . . . . 5-15
Chapter 6 Sequence Recipe and Data
Figure 6.1 Sequence Editor Screen . . . . . . . . . . . . . . . . . . . . . . . . . . . . . . . . . . . . . . . . . . . . . . . . . . . . . . . 6-2
Figure 6.2 Sequence Recipe Catalog Screen . . . . . . . . . . . . . . . . . . . . . . . . . . . . . . . . . . . . . . . . . . . . . . . . 6-3
Figure 6.3 Scan Sequence Catalog . . . . . . . . . . . . . . . . . . . . . . . . . . . . . . . . . . . . . . . . . . . . . . . . . . . . . . . 6-4
Figure 6.4 Sequence Editor for NEW Recipe with Pattern Recognition . . . . . . . . . . . . . . . . . . . . . . . . . . 6-5
Figure 6.5 Options Section in the Sequence Editor (Optional feature, P-16+ only) . . . . . . . . . . . . . . . . . . 6-6
0142530-000 AB KLA-Tencor Confidential LOF-3
3/13/09

KLA-Tencor P-16+ / P-6 User’s Guide
Figure 6.6 Die Grid Menu . . . . . . . . . . . . . . . . . . . . . . . . . . . . . . . . . . . . . . . . . . . . . . . . . . . . . . . . . . . . . . 6-7
Figure 6.7 Load Die Grid Dialog Box . . . . . . . . . . . . . . . . . . . . . . . . . . . . . . . . . . . . . . . . . . . . . . . . . . . . .6-7
Figure 6.8 Sequence Editor . . . . . . . . . . . . . . . . . . . . . . . . . . . . . . . . . . . . . . . . . . . . . . . . . . . . . . . . . . . . .6-8
Figure 6.9 Sequence Editor . . . . . . . . . . . . . . . . . . . . . . . . . . . . . . . . . . . . . . . . . . . . . . . . . . . . . . . . . . . . .6-8
Figure 6.10 Pattern Rec. Deskew Teach: Site 1 Screen . . . . . . . . . . . . . . . . . . . . . . . . . . . . . . . . . . . . . . . . .6-9
Figure 6.11 Deskew Options Dialog Box . . . . . . . . . . . . . . . . . . . . . . . . . . . . . . . . . . . . . . . . . . . . . . . . . . 6-10
Figure 6.12 Data Options . . . . . . . . . . . . . . . . . . . . . . . . . . . . . . . . . . . . . . . . . . . . . . . . . . . . . . . . . . . . . . . 6-11
Figure 6.13 Sequence Editor Set Up for New Recipe . . . . . . . . . . . . . . . . . . . . . . . . . . . . . . . . . . . . . . . . .6-12
Figure 6.14 Sequence Editor - Teach Scan Location . . . . . . . . . . . . . . . . . . . . . . . . . . . . . . . . . . . . . . . . . .6-13
Figure 6.15 Teach Location for First Recipe Scan . . . . . . . . . . . . . . . . . . . . . . . . . . . . . . . . . . . . . . . . . . . 6-14
Figure 6.16 Sequence Editor . . . . . . . . . . . . . . . . . . . . . . . . . . . . . . . . . . . . . . . . . . . . . . . . . . . . . . . . . . . .6-15
Figure 6.17 Sequence Editor with Die Grid Menu . . . . . . . . . . . . . . . . . . . . . . . . . . . . . . . . . . . . . . . . . . . 6-16
Figure 6.18 XY View with Sequence Scan Sites . . . . . . . . . . . . . . . . . . . . . . . . . . . . . . . . . . . . . . . . . . . . .6-17
Figure 6.19 Sequence Editor Message Box . . . . . . . . . . . . . . . . . . . . . . . . . . . . . . . . . . . . . . . . . . . . . . . . .6-17
Figure 6.20 Sequence Editor with New Scan Sites . . . . . . . . . . . . . . . . . . . . . . . . . . . . . . . . . . . . . . . . . . .6-18
Figure 6.21 Sequence Editor – Sequence Menu . . . . . . . . . . . . . . . . . . . . . . . . . . . . . . . . . . . . . . . . . . . . . 6-22
Figure 6.22 Sequence Information Dialog Box . . . . . . . . . . . . . . . . . . . . . . . . . . . . . . . . . . . . . . . . . . . . . .6-22
Figure 6.23 Sequence Editor – Mode Menu . . . . . . . . . . . . . . . . . . . . . . . . . . . . . . . . . . . . . . . . . . . . . . . .6-23
Figure 6.24 Sequence Editor . . . . . . . . . . . . . . . . . . . . . . . . . . . . . . . . . . . . . . . . . . . . . . . . . . . . . . . . . . . . 6-25
Figure 6.25 Data Options . . . . . . . . . . . . . . . . . . . . . . . . . . . . . . . . . . . . . . . . . . . . . . . . . . . . . . . . . . . . . . . 6-25
Figure 6.26 Sequence Editor . . . . . . . . . . . . . . . . . . . . . . . . . . . . . . . . . . . . . . . . . . . . . . . . . . . . . . . . . . . .6-27
Figure 6.27 Queue Editor . . . . . . . . . . . . . . . . . . . . . . . . . . . . . . . . . . . . . . . . . . . . . . . . . . . . . . . . . . . . . . .6-29
Figure 6.28 Runtime View with the Sequence Queue . . . . . . . . . . . . . . . . . . . . . . . . . . . . . . . . . . . . . . . . .6-30
Figure 6.29 Correlation Scan Sequence . . . . . . . . . . . . . . . . . . . . . . . . . . . . . . . . . . . . . . . . . . . . . . . . . . . .6-31
Figure 6.30 Correlation Sub-scan Window . . . . . . . . . . . . . . . . . . . . . . . . . . . . . . . . . . . . . . . . . . . . . . . . .6-33
Figure 6.31 Sequence Parameter Data window . . . . . . . . . . . . . . . . . . . . . . . . . . . . . . . . . . . . . . . . . . . . . . 6-36
Preliminary
Figure 6.32 Sequence Summary Options Dialog Box . . . . . . . . . . . . . . . . . . . . . . . . . . . . . . . . . . . . . . . . .6-37
Figure 6.33 Deskew Options Dialog Box . . . . . . . . . . . . . . . . . . . . . . . . . . . . . . . . . . . . . . . . . . . . . . . . . . 6-39
Figure 6.34 Profiler Sequence Editor Window . . . . . . . . . . . . . . . . . . . . . . . . . . . . . . . . . . . . . . . . . . . . . . 6-42
Figure 6.35 Pattern Rec. Deskew Teach Window After Teach . . . . . . . . . . . . . . . . . . . . . . . . . . . . . . . . . .6-43
Figure 6.36 Pattern Recognition and Deskew Options Dialog Box . . . . . . . . . . . . . . . . . . . . . . . . . . . . . . 6-44
Figure 6.37 Groping Retry Layers . . . . . . . . . . . . . . . . . . . . . . . . . . . . . . . . . . . . . . . . . . . . . . . . . . . . . . . .6-45
Figure 6.38 Analysis Screen with File Menu . . . . . . . . . . . . . . . . . . . . . . . . . . . . . . . . . . . . . . . . . . . . . . . .6-49
Figure 6.39 Save Data Set Dialog Box . . . . . . . . . . . . . . . . . . . . . . . . . . . . . . . . . . . . . . . . . . . . . . . . . . . . 6-49
Chapter 7 Analyzing 3D Scan Data
Figure 7.1 Scan Catalog Screen with Scan Data Active. . . . . . . . . . . . . . . . . . . . . . . . . . . . . . . . . . . . . . . .7-1
Figure 7.2 3D Analysis Screen with 3D Object Displayed . . . . . . . . . . . . . . . . . . . . . . . . . . . . . . . . . . . . . 7-2
Figure 7.3 Analysis Tool Bar Image Rotation Buttons . . . . . . . . . . . . . . . . . . . . . . . . . . . . . . . . . . . . . . . .7-2
Figure 7.4 Manual Image Rotation Handles . . . . . . . . . . . . . . . . . . . . . . . . . . . . . . . . . . . . . . . . . . . . . . . .7-4
Figure 7.5 Image Rotation Using the Rotate Image Menu . . . . . . . . . . . . . . . . . . . . . . . . . . . . . . . . . . . . .7-5
Figure 7.6 Right-Click Menu – Mouse Tools . . . . . . . . . . . . . . . . . . . . . . . . . . . . . . . . . . . . . . . . . . . . . . . 7-6
Figure 7.7 Analysis Tool Bar Graphics Buttons . . . . . . . . . . . . . . . . . . . . . . . . . . . . . . . . . . . . . . . . . . . . . 7-6
Figure 7.8 Analysis Screen - Tool Activation . . . . . . . . . . . . . . . . . . . . . . . . . . . . . . . . . . . . . . . . . . . . . . . 7-7
Figure 7.9 Analysis Screen - Zoom Active . . . . . . . . . . . . . . . . . . . . . . . . . . . . . . . . . . . . . . . . . . . . . . . . . 7-8
Figure 7.10 Analysis Screen with Zoom Box . . . . . . . . . . . . . . . . . . . . . . . . . . . . . . . . . . . . . . . . . . . . . . . .7-8
Figure 7.11 Analysis Screen – Using the Zoom In Icon . . . . . . . . . . . . . . . . . . . . . . . . . . . . . . . . . . . . . . . .7-9
Figure 7.12 Analysis Screen – Zoomed In Area . . . . . . . . . . . . . . . . . . . . . . . . . . . . . . . . . . . . . . . . . . . . . 7-10
Figure 7.13 Analysis Screen – Unzoom Using Right-Click Menu . . . . . . . . . . . . . . . . . . . . . . . . . . . . . . . 7-10
Figure 7.14 Analysis Screen Menu Bar . . . . . . . . . . . . . . . . . . . . . . . . . . . . . . . . . . . . . . . . . . . . . . . . . . . . 7-16
LOF-4 KLA-Tencor Confidential 0142530-000 AB
3/13/09

KLA-Tencor P-16+ / P-6 User’s Guide
Figure 7.15 Parameters Menu from the Analysis Screen Menu Bar . . . . . . . . . . . . . . . . . . . . . . . . . . . . . . 7-25
Figure 7.16 3D Recipe Editor . . . . . . . . . . . . . . . . . . . . . . . . . . . . . . . . . . . . . . . . . . . . . . . . . . . . . . . . . . . 7-26
Figure 7.17 3D Recipe Editor with Roughness/Waviness Options . . . . . . . . . . . . . . . . . . . . . . . . . . . . . . . 7-27
Figure 7.18 Bearing Ratio/Cutting Depth in Recipe Editor . . . . . . . . . . . . . . . . . . . . . . . . . . . . . . . . . . . . 7-28
Figure 7.19 Recipe Editor - 3D Cursors Window . . . . . . . . . . . . . . . . . . . . . . . . . . . . . . . . . . . . . . . . . . . . 7-33
Figure 7.20 3D Line by Line Leveling Cursor Parameters . . . . . . . . . . . . . . . . . . . . . . . . . . . . . . . . . . . . . 7-33
Figure 7.21 3D Line by Line Leveling Cursor Field . . . . . . . . . . . . . . . . . . . . . . . . . . . . . . . . . . . . . . . . . . 7-34
Figure 7.22 Line Leveling Top View Analysis Screen . . . . . . . . . . . . . . . . . . . . . . . . . . . . . . . . . . . . . . . .7-35
Figure 7.23 Recipe Editor with 3D Cursors Window Displayed . . . . . . . . . . . . . . . . . . . . . . . . . . . . . . . . 7-36
Figure 7.24 Set Viewing Parameters Dialog Box . . . . . . . . . . . . . . . . . . . . . . . . . . . . . . . . . . . . . . . . . . . . 7-37
Figure 7.25 Line Leveling Dialog Box After Cursors Positioned . . . . . . . . . . . . . . . . . . . . . . . . . . . . . . . . 7-38
Figure 7.26 Image Arithmetic Dialog Box . . . . . . . . . . . . . . . . . . . . . . . . . . . . . . . . . . . . . . . . . . . . . . . . . 7-39
Figure 7.27 Analysis Screen - Analysis Tool Bar . . . . . . . . . . . . . . . . . . . . . . . . . . . . . . . . . . . . . . . . . . . . 7-41
Figure 7.28 3D Analysis Tool Bar with Slice Tool Activated . . . . . . . . . . . . . . . . . . . . . . . . . . . . . . . . . . 7-41
Figure 7.29 Analysis Screen with View . . . . . . . . . . . . . . . . . . . . . . . . . . . . . . . . . . . . . . . . . . . . . . . . . . . 7-42
Figure 7.30 Analysis Screen with Slice Tool Active . . . . . . . . . . . . . . . . . . . . . . . . . . . . . . . . . . . . . . . . . 7-43
Figure 7.31 Analysis Screen with Both 2D and 3D Images . . . . . . . . . . . . . . . . . . . . . . . . . . . . . . . . . . . . 7-43
Figure 7.32 Analysis Screen with Both 2D and 3D Images . . . . . . . . . . . . . . . . . . . . . . . . . . . . . . . . . . . . 7-44
Figure 7.33 Analysis Window with File Menu . . . . . . . . . . . . . . . . . . . . . . . . . . . . . . . . . . . . . . . . . . . . . . 7-44
Chapter 8 APEX 2D/3D - Getting Started
Preliminary
Figure 8.1 Empty Document . . . . . . . . . . . . . . . . . . . . . . . . . . . . . . . . . . . . . . . . . . . . . . . . . . . . . . . . . . . . 8-1
Figure 8.2 General Toolbar . . . . . . . . . . . . . . . . . . . . . . . . . . . . . . . . . . . . . . . . . . . . . . . . . . . . . . . . . . . . . 8-2
Figure 8.3 Studiables Directory . . . . . . . . . . . . . . . . . . . . . . . . . . . . . . . . . . . . . . . . . . . . . . . . . . . . . . . . . . 8-2
Chapter 9 Stress (Optional feature)
Figure 9.1 Stress Calculation Regions . . . . . . . . . . . . . . . . . . . . . . . . . . . . . . . . . . . . . . . . . . . . . . . . . . . . . 9-2
Figure 9.2 13 Point Least Square Fit Calculation Illustration . . . . . . . . . . . . . . . . . . . . . . . . . . . . . . . . . . .9-4
Figure 9.3 Precision Locator on the Stage (P-16+) . . . . . . . . . . . . . . . . . . . . . . . . . . . . . . . . . . . . . . . . . . . 9-9
Chapter 10 3D Stress (optional Feature, P-16+ only)
Figure 10.1 The 3D Stress Catalog Window . . . . . . . . . . . . . . . . . . . . . . . . . . . . . . . . . . . . . . . . . . . . . . . . 10-3
Figure 10.2 3D Stress Buttons Found in the 3D Stress Catalog Window . . . . . . . . . . . . . . . . . . . . . . . . . . 10-3
Figure 10.3 3D Stress Recipe Editor Window . . . . . . . . . . . . . . . . . . . . . . . . . . . . . . . . . . . . . . . . . . . . . . 10-4
Figure 10.4 Edit Substrates Window . . . . . . . . . . . . . . . . . . . . . . . . . . . . . . . . . . . . . . . . . . . . . . . . . . . . . . 10-6
Figure 10.5 Substrate Properties Window . . . . . . . . . . . . . . . . . . . . . . . . . . . . . . . . . . . . . . . . . . . . . . . . . . 10-7
Figure 10.6 Edit Substrate Buttons . . . . . . . . . . . . . . . . . . . . . . . . . . . . . . . . . . . . . . . . . . . . . . . . . . . . . . . 10-7
Figure 10.7 Recipe Dropdown Menu . . . . . . . . . . . . . . . . . . . . . . . . . . . . . . . . . . . . . . . . . . . . . . . . . . . . . 10-8
Figure 10.8 3D Stress Catalog Window and Stress Data Button . . . . . . . . . . . . . . . . . . . . . . . . . . . . . . . . 10-9
Figure 10.9 Pre and Post Measurement Data Designation . . . . . . . . . . . . . . . . . . . . . . . . . . . . . . . . . . . . . 10-9
Figure 10.10 Film Thickness Window . . . . . . . . . . . . . . . . . . . . . . . . . . . . . . . . . . . . . . . . . . . . . . . . . . . . 10-10
Figure 10.11 Default Format of the 3D Stress Analysis Window in Apex . . . . . . . . . . . . . . . . . . . . . . . . . 10-11
Figure 10.12 Stress Map Calculated by Apex Software . . . . . . . . . . . . . . . . . . . . . . . . . . . . . . . . . . . . . . . 10-12
Figure 10.13 3D Stress Toolbar in Apex Software . . . . . . . . . . . . . . . . . . . . . . . . . . . . . . . . . . . . . . . . . . . 10-12
Figure 10.14 3D Stress Dialogue Box . . . . . . . . . . . . . . . . . . . . . . . . . . . . . . . . . . . . . . . . . . . . . . . . . . . . . 10-15
Figure 10.15 Angular Data Image in Apex Software . . . . . . . . . . . . . . . . . . . . . . . . . . . . . . . . . . . . . . . . . 10-16
Figure 10.16 Save As Window for Saving Only the Xml Data Files . . . . . . . . . . . . . . . . . . . . . . . . . . . . . 10-17
Figure 10.17 3D Stress File Selection Dialogue Box . . . . . . . . . . . . . . . . . . . . . . . . . . . . . . . . . . . . . . . . . 10-18
0142530-000 AB KLA-Tencor Confidential LOF-5
3/13/09

KLA-Tencor P-16+ / P-6 User’s Guide
Chapter 11 System Security
Figure 11.1 Log On Dialog . . . . . . . . . . . . . . . . . . . . . . . . . . . . . . . . . . . . . . . . . . . . . . . . . . . . . . . . . . . . .11-1
Figure 11.2 Log On Dialog at Runtime . . . . . . . . . . . . . . . . . . . . . . . . . . . . . . . . . . . . . . . . . . . . . . . . . . . . 11-2
Figure 11.3 Security Configuration Editor . . . . . . . . . . . . . . . . . . . . . . . . . . . . . . . . . . . . . . . . . . . . . . . . . 11-3
Figure 11.4 XML Configuration Saved . . . . . . . . . . . . . . . . . . . . . . . . . . . . . . . . . . . . . . . . . . . . . . . . . . . . 11-5
Figure 11.5 Group User Admin - Manage Users . . . . . . . . . . . . . . . . . . . . . . . . . . . . . . . . . . . . . . . . . . . . .11-5
Figure 11.6 Load from OS Import Users . . . . . . . . . . . . . . . . . . . . . . . . . . . . . . . . . . . . . . . . . . . . . . . . . . . 11-6
Figure 11.7 Choose Users From Local System . . . . . . . . . . . . . . . . . . . . . . . . . . . . . . . . . . . . . . . . . . . . . . 11-6
Figure 11.8 Edit Users . . . . . . . . . . . . . . . . . . . . . . . . . . . . . . . . . . . . . . . . . . . . . . . . . . . . . . . . . . . . . . . . .11-7
Figure 11.9 Change User Password . . . . . . . . . . . . . . . . . . . . . . . . . . . . . . . . . . . . . . . . . . . . . . . . . . . . . . .11-7
Figure 11.10 Save Users to Local System . . . . . . . . . . . . . . . . . . . . . . . . . . . . . . . . . . . . . . . . . . . . . . . . . . .11-8
Figure 11.11 Access Policy Settings . . . . . . . . . . . . . . . . . . . . . . . . . . . . . . . . . . . . . . . . . . . . . . . . . . . . . . .11-9
Figure 11.12 Edit Access Policy Setting for Windows Shutdown Command . . . . . . . . . . . . . . . . . . . . . . . 11-10
Figure 11.13 Saving the Access Policy Setting . . . . . . . . . . . . . . . . . . . . . . . . . . . . . . . . . . . . . . . . . . . . . .11-10
Figure 11.14 Application Lifecycle . . . . . . . . . . . . . . . . . . . . . . . . . . . . . . . . . . . . . . . . . . . . . . . . . . . . . . .11-15
Figure 11.15 Add Programs to the Control List . . . . . . . . . . . . . . . . . . . . . . . . . . . . . . . . . . . . . . . . . . . . . 11-16
Figure 11.16 Save Changes to the Control List . . . . . . . . . . . . . . . . . . . . . . . . . . . . . . . . . . . . . . . . . . . . . . 11-17
Figure 11.17 Global Settings . . . . . . . . . . . . . . . . . . . . . . . . . . . . . . . . . . . . . . . . . . . . . . . . . . . . . . . . . . . . 11-18
Figure 11.18 Modify Global Settings . . . . . . . . . . . . . . . . . . . . . . . . . . . . . . . . . . . . . . . . . . . . . . . . . . . . . 11-19
Figure 11.19 Persist Autologon to Operating System . . . . . . . . . . . . . . . . . . . . . . . . . . . . . . . . . . . . . . . . .11-19
Figure 11.20 My Computer/Manage . . . . . . . . . . . . . . . . . . . . . . . . . . . . . . . . . . . . . . . . . . . . . . . . . . . . . .11-21
Figure 11.21 User Account Management . . . . . . . . . . . . . . . . . . . . . . . . . . . . . . . . . . . . . . . . . . . . . . . . . . 11-22
Figure 11.22 New User Interface . . . . . . . . . . . . . . . . . . . . . . . . . . . . . . . . . . . . . . . . . . . . . . . . . . . . . . . . .11-22
Figure 11.23 Security Group Management . . . . . . . . . . . . . . . . . . . . . . . . . . . . . . . . . . . . . . . . . . . . . . . . . 11-23
Figure 11.24 Profiler Security Group Members . . . . . . . . . . . . . . . . . . . . . . . . . . . . . . . . . . . . . . . . . . . . . 11-24
Preliminary
Figure 11.25 Add a User to a Security Group . . . . . . . . . . . . . . . . . . . . . . . . . . . . . . . . . . . . . . . . . . . . . . . 11-25
Figure 11.26 Windows XP User:Engineer . . . . . . . . . . . . . . . . . . . . . . . . . . . . . . . . . . . . . . . . . . . . . . . . . . 11-26
Figure 11.27 Add a Security Group to a User . . . . . . . . . . . . . . . . . . . . . . . . . . . . . . . . . . . . . . . . . . . . . . .11-26
Figure 11.28 Examples of Operator and Engineer Security Group Access . . . . . . . . . . . . . . . . . . . . . . . . . 11-27
Chapter 12 Calibrations
Figure 12.1 Catalog Screen - Choose Calibration . . . . . . . . . . . . . . . . . . . . . . . . . . . . . . . . . . . . . . . . . . . . 12-2
Figure 12.2 Calibrations Screen . . . . . . . . . . . . . . . . . . . . . . . . . . . . . . . . . . . . . . . . . . . . . . . . . . . . . . . . . .12-2
Figure 12.3 Applied Force Calibration Window . . . . . . . . . . . . . . . . . . . . . . . . . . . . . . . . . . . . . . . . . . . . .12-2
Figure 12.4 Manual Load from the Video Calibration Screen . . . . . . . . . . . . . . . . . . . . . . . . . . . . . . . . . . 12-4
Figure 12.5 Message Prompt and Focus Button . . . . . . . . . . . . . . . . . . . . . . . . . . . . . . . . . . . . . . . . . . . . .12-5
Figure 12.6 XY Video Display Message Box . . . . . . . . . . . . . . . . . . . . . . . . . . . . . . . . . . . . . . . . . . . . . . . 12-6
Figure 12.7 Step Height Calibration Factors . . . . . . . . . . . . . . . . . . . . . . . . . . . . . . . . . . . . . . . . . . . . . . . .12-7
Figure 12.8 Navigation Window Right-Click Menu . . . . . . . . . . . . . . . . . . . . . . . . . . . . . . . . . . . . . . . . . . .12-8
Figure 12.9 Move To Position Dialog Box . . . . . . . . . . . . . . . . . . . . . . . . . . . . . . . . . . . . . . . . . . . . . . . . . . . 12-8
Figure 12.10 Calibration Menu in the Calibration Screen . . . . . . . . . . . . . . . . . . . . . . . . . . . . . . . . . . . . . . . 12-9
Figure 12.11 Step Height Calibration Options Dialog Box . . . . . . . . . . . . . . . . . . . . . . . . . . . . . . . . . . . . .12-10
Figure 12.12 Saving the New Calibration . . . . . . . . . . . . . . . . . . . . . . . . . . . . . . . . . . . . . . . . . . . . . . . . . .12-12
Figure 12.13 Calibration Screen . . . . . . . . . . . . . . . . . . . . . . . . . . . . . . . . . . . . . . . . . . . . . . . . . . . . . . . . . 12-13
Figure 12.14 Level Calibration Warning . . . . . . . . . . . . . . . . . . . . . . . . . . . . . . . . . . . . . . . . . . . . . . . . . . .12-14
Figure 12.15 Tilt Calibration System Status Load Wafer Message . . . . . . . . . . . . . . . . . . . . . . . . . . . . . . .12-14
Figure 12.16 Tilt Axis Angle Calibration Value Dialog Box . . . . . . . . . . . . . . . . . . . . . . . . . . . . . . . . . . .12-15
Figure 12.17 Activating Focus in the XY VIEW Screen . . . . . . . . . . . . . . . . . . . . . . . . . . . . . . . . . . . . . . .12-16
Figure 12.18 Move To Menu . . . . . . . . . . . . . . . . . . . . . . . . . . . . . . . . . . . . . . . . . . . . . . . . . . . . . . . . . . . . 12-16
LOF-6 KLA-Tencor Confidential 0142530-000 AB
3/13/09

KLA-Tencor P-16+ / P-6 User’s Guide
Figure 12.19 Move To Position Dialog Box . . . . . . . . . . . . . . . . . . . . . . . . . . . . . . . . . . . . . . . . . . . . . . . . 12-17
Figure 12.20 Teach Lowest Elevator Position Screen . . . . . . . . . . . . . . . . . . . . . . . . . . . . . . . . . . . . . . . . . 12-17
Figure 12.21 Move To Menu . . . . . . . . . . . . . . . . . . . . . . . . . . . . . . . . . . . . . . . . . . . . . . . . . . . . . . . . . . . . 12-18
Figure 12.22 Move To Position Dialog Box . . . . . . . . . . . . . . . . . . . . . . . . . . . . . . . . . . . . . . . . . . . . . . . . 12-18
Figure 12.23 P6 Precision Standard Locator Chuck . . . . . . . . . . . . . . . . . . . . . . . . . . . . . . . . . . . . . . . . . . 12-19
Chapter 13 Stylus Change Procedure
Figure 13.1 Profiler [Catalog] - Click on the Calibration Icon . . . . . . . . . . . . . . . . . . . . . . . . . . . . . . . . . . 13-3
Figure 13.2 Stylus Force Calibration Button . . . . . . . . . . . . . . . . . . . . . . . . . . . . . . . . . . . . . . . . . . . . . . . . 13-3
Figure 13.3 Configuration Screen . . . . . . . . . . . . . . . . . . . . . . . . . . . . . . . . . . . . . . . . . . . . . . . . . . . . . . . . 13-4
Figure 13.4 Stylus ID Dialog Box . . . . . . . . . . . . . . . . . . . . . . . . . . . . . . . . . . . . . . . . . . . . . . . . . . . . . . . . 13-5
Figure 13.5 Message Box for Stylus Name Affirmation . . . . . . . . . . . . . . . . . . . . . . . . . . . . . . . . . . . . . . . 13-5
Figure 13.6 Message Box for Stylus Change Permission . . . . . . . . . . . . . . . . . . . . . . . . . . . . . . . . . . . . . . 13-6
Figure 13.7 Supporting Stylus Mount During Stylus Change . . . . . . . . . . . . . . . . . . . . . . . . . . . . . . . . . . . 13-6
Figure 13.8 Sensor Assembly - Loosening Stylus Clamp Screw . . . . . . . . . . . . . . . . . . . . . . . . . . . . . . . . 13-7
Figure 13.9 Sensor Assembly - Seating the New Stylus . . . . . . . . . . . . . . . . . . . . . . . . . . . . . . . . . . . . . . . 13-7
Figure 13.10 Supporting Stylus and Mount During Tightening Procedure . . . . . . . . . . . . . . . . . . . . . . . . . 13-8
Figure 13.11 Sensor Assembly - Seating the New Stylus . . . . . . . . . . . . . . . . . . . . . . . . . . . . . . . . . . . . . . . 13-8
Figure 13.12 Message Box for Stylus Change Permission . . . . . . . . . . . . . . . . . . . . . . . . . . . . . . . . . . . . . . 13-9
Figure 13.13 KLA-Tencor ProCal Wafer . . . . . . . . . . . . . . . . . . . . . . . . . . . . . . . . . . . . . . . . . . . . . . . . . . 13-10
Figure 13.14 Message Box Requesting SPO Standard Placement . . . . . . . . . . . . . . . . . . . . . . . . . . . . . . . 13-10
Figure 13.15 Manual Load from the Scan Offset Calibration Window . . . . . . . . . . . . . . . . . . . . . . . . . . . 13-11
Figure 13.16 Scan Position Offset Calibration Options dialog box . . . . . . . . . . . . . . . . . . . . . . . . . . . . . . 13-11
Figure 13.17 Window Buttons - _OFF150- Recipe Editor . . . . . . . . . . . . . . . . . . . . . . . . . . . . . . . . . . . . . 13-12
Figure 13.18 Scan Position Offset Calibration Options dialog box . . . . . . . . . . . . . . . . . . . . . . . . . . . . . . 13-13
Figure 13.19 Set Default Dialog Box . . . . . . . . . . . . . . . . . . . . . . . . . . . . . . . . . . . . . . . . . . . . . . . . . . . . . . . 13-13
Figure 13.20 Scan Parameter Definition - _OFF150 - Recipe Editor . . . . . . . . . . . . . . . . . . . . . . . . . . . . . . 13-14
Figure 13.21 ZOOM IN - Scan Offset Calibration . . . . . . . . . . . . . . . . . . . . . . . . . . . . . . . . . . . . . . . . . . . 13-14
Figure 13.22 KLA-Tencor ProCal Wafer . . . . . . . . . . . . . . . . . . . . . . . . . . . . . . . . . . . . . . . . . . . . . . . . . . 13-16
Figure 13.23 Aligning the Tool with Screen Crosshair . . . . . . . . . . . . . . . . . . . . . . . . . . . . . . . . . . . . . . . . 13-16
Figure 13.24 Align Screen Crosshair with 150 mm Crosshair Pattern . . . . . . . . . . . . . . . . . . . . . . . . . . . . 13-17
Figure 13.25 Manual Load from the Scan Offset Calibration Window . . . . . . . . . . . . . . . . . . . . . . . . . . . 13-17
Figure 13.26 Scan: _OFF150 Window . . . . . . . . . . . . . . . . . . . . . . . . . . . . . . . . . . . . . . . . . . . . . . . . . . . . 13-18
Figure 13.27 Trace Path Through Upper Triangle . . . . . . . . . . . . . . . . . . . . . . . . . . . . . . . . . . . . . . . . . . . 13-18
Figure 13.28 Data Analysis Window. . . . . . . . . . . . . . . . . . . . . . . . . . . . . . . . . . . . . . . . . . . . . . . . . . . . . . 13-19
Figure 13.29 Scan Data Portion of the Analysis Window . . . . . . . . . . . . . . . . . . . . . . . . . . . . . . . . . . . . . . 13-19
Figure 13.30 Coarse Scan Data Analysis Window . . . . . . . . . . . . . . . . . . . . . . . . . . . . . . . . . . . . . . . . . . . 13-20
Figure 13.31 “Unknown Situation” Corrective Action . . . . . . . . . . . . . . . . . . . . . . . . . . . . . . . . . . . . . . . . 13-20
Figure 13.32 Pre Acceptance Analysis Screen . . . . . . . . . . . . . . . . . . . . . . . . . . . . . . . . . . . . . . . . . . . . . . 13-21
Figure 13.33 Analysis Screen with Cursors Manually Placed . . . . . . . . . . . . . . . . . . . . . . . . . . . . . . . . . . 13-21
Figure 13.34 Scan Offset Calibration, Analysis Information Window . . . . . . . . . . . . . . . . . . . . . . . . . . . . 13-22
Figure 13.35 Hand Selecting the Triangle Data in Analysis Screen . . . . . . . . . . . . . . . . . . . . . . . . . . . . . . 13-23
Figure 13.36 Accepting Adjusted Scan Results . . . . . . . . . . . . . . . . . . . . . . . . . . . . . . . . . . . . . . . . . . . . . 13-23
Preliminary
Chapter 14 Configuration
Figure 14.1 System Geometry . . . . . . . . . . . . . . . . . . . . . . . . . . . . . . . . . . . . . . . . . . . . . . . . . . . . . . . . . . . 14-1
Figure 14.2 Example Sample Stage Tilt Calibration Scan . . . . . . . . . . . . . . . . . . . . . . . . . . . . . . . . . . . . . 14-3
Figure 14.3 Example Sample Stage X-Direction Cross-Section Calculation . . . . . . . . . . . . . . . . . . . . . . . 14-4
Figure 14.4 Example Y-Direction Cross-Section Calculation . . . . . . . . . . . . . . . . . . . . . . . . . . . . . . . . . . 14-4
Figure 14.5 Stylus Details . . . . . . . . . . . . . . . . . . . . . . . . . . . . . . . . . . . . . . . . . . . . . . . . . . . . . . . . . . . . . . 14-5
0142530-000 AB KLA-Tencor Confidential LOF-7
3/13/09

KLA-Tencor P-16+ / P-6 User’s Guide
Figure 14.6 Choose Calibration . . . . . . . . . . . . . . . . . . . . . . . . . . . . . . . . . . . . . . . . . . . . . . . . . . . . . . . . . . 14-6
Figure 14.7 Stage Configuration Parameters . . . . . . . . . . . . . . . . . . . . . . . . . . . . . . . . . . . . . . . . . . . . . . . .14-7
Figure 14.8 Configuration Screen - Lowest Elevator Position . . . . . . . . . . . . . . . . . . . . . . . . . . . . . . . . . . 14-8
Figure 14.9 Configuration Screen . . . . . . . . . . . . . . . . . . . . . . . . . . . . . . . . . . . . . . . . . . . . . . . . . . . . . . . 14-10
Figure 14.10 System Configuration Dialog Box . . . . . . . . . . . . . . . . . . . . . . . . . . . . . . . . . . . . . . . . . . . . . 14-11
Figure 14.11 Instrument Setup Dialog Box . . . . . . . . . . . . . . . . . . . . . . . . . . . . . . . . . . . . . . . . . . . . . . . . . 14-11
Figure 14.12 Configuration Screen . . . . . . . . . . . . . . . . . . . . . . . . . . . . . . . . . . . . . . . . . . . . . . . . . . . . . . . 14-12
Figure 14.13 Safe Area Configuration - Sample Configuration Menu . . . . . . . . . . . . . . . . . . . . . . . . . . . .14-13
Figure 14.14 Safe Area Configuration - Edit Safe Area Values . . . . . . . . . . . . . . . . . . . . . . . . . . . . . . . . .14-14
Figure 14.15 License Options . . . . . . . . . . . . . . . . . . . . . . . . . . . . . . . . . . . . . . . . . . . . . . . . . . . . . . . . . . . 14-15
Figure 14.16 Recipe Transport Options . . . . . . . . . . . . . . . . . . . . . . . . . . . . . . . . . . . . . . . . . . . . . . . . . . . .14-16
Figure 14.17 Sequence Execution Options Dialog Box . . . . . . . . . . . . . . . . . . . . . . . . . . . . . . . . . . . . . . . 14-17
Figure 14.18 Proximity Sensor Configuration . . . . . . . . . . . . . . . . . . . . . . . . . . . . . . . . . . . . . . . . . . . . . . . 14-18
Figure 14.19 Lightweight Stage Table Top . . . . . . . . . . . . . . . . . . . . . . . . . . . . . . . . . . . . . . . . . . . . . . . . . 14-20
Figure 14.20 Precision Locator . . . . . . . . . . . . . . . . . . . . . . . . . . . . . . . . . . . . . . . . . . . . . . . . . . . . . . . . . . 14-20
Figure 14.21 Three Point Disk Locator . . . . . . . . . . . . . . . . . . . . . . . . . . . . . . . . . . . . . . . . . . . . . . . . . . . . 14-21
Figure 14.22 Three Point Disk Locator Base Plate . . . . . . . . . . . . . . . . . . . . . . . . . . . . . . . . . . . . . . . . . . .14-22
Figure 14.23 Center Hub Screw . . . . . . . . . . . . . . . . . . . . . . . . . . . . . . . . . . . . . . . . . . . . . . . . . . . . . . . . . .14-22
Figure 14.24 Disk Support for the Three Point Disk Locator . . . . . . . . . . . . . . . . . . . . . . . . . . . . . . . . . . . 14-23
Figure 14.25 P-6 Precision Standard Locator Chuck . . . . . . . . . . . . . . . . . . . . . . . . . . . . . . . . . . . . . . . . . .14-25
Figure 14.26 P-6 Stress Chuck . . . . . . . . . . . . . . . . . . . . . . . . . . . . . . . . . . . . . . . . . . . . . . . . . . . . . . . . . . .14-26
Chapter 15 Preventive Maintenance
Chapter 16 Backup and Restore
Figure 16.1 Windows Run Function . . . . . . . . . . . . . . . . . . . . . . . . . . . . . . . . . . . . . . . . . . . . . . . . . . . . . . 16-1
Preliminary
Figure 16.2 Profiler Backup Command . . . . . . . . . . . . . . . . . . . . . . . . . . . . . . . . . . . . . . . . . . . . . . . . . . . . 16-2
Figure 16.3 Profiler Backup Command Confirmation . . . . . . . . . . . . . . . . . . . . . . . . . . . . . . . . . . . . . . . .16-3
Figure 16.4 Profiler Backup Complete . . . . . . . . . . . . . . . . . . . . . . . . . . . . . . . . . . . . . . . . . . . . . . . . . . . .16-3
Figure 16.5 Profiler BackupFiles . . . . . . . . . . . . . . . . . . . . . . . . . . . . . . . . . . . . . . . . . . . . . . . . . . . . . . . . .16-4
Figure 16.6 Profiler Restore Command . . . . . . . . . . . . . . . . . . . . . . . . . . . . . . . . . . . . . . . . . . . . . . . . . . . . 16-5
Figure 16.7 Profiler Restore Directory Selection . . . . . . . . . . . . . . . . . . . . . . . . . . . . . . . . . . . . . . . . . . . .16-5
Figure 16.8 Profiler Restore Directory Selection . . . . . . . . . . . . . . . . . . . . . . . . . . . . . . . . . . . . . . . . . . . .16-6
Figure 16.9 Profiler Restore Command Confirmation . . . . . . . . . . . . . . . . . . . . . . . . . . . . . . . . . . . . . . . . 16-6
Figure 16.10 Profiler Restore Complete . . . . . . . . . . . . . . . . . . . . . . . . . . . . . . . . . . . . . . . . . . . . . . . . . . . .16-7
Appendix A Hazardous Materials
Figure A.1 Hazardous Content Symbol . . . . . . . . . . . . . . . . . . . . . . . . . . . . . . . . . . . . . . . . . . . . . . . . . . . A-2
Appendix A P Series Profiler - Preparing for Shipment
Figure 1.1 P-6 Hook . . . . . . . . . . . . . . . . . . . . . . . . . . . . . . . . . . . . . . . . . . . . . . . . . . . . . . . . . . . . . . . . . . B-3
LOF-8 KLA-Tencor Confidential 0142530-000 AB
3/13/09

List of Tables
Chapter 1 Introduction & Safety
Chapter 2 Basic Skills
Table 2.1 Profiler Program Access Icons . . . . . . . . . . . . . . . . . . . . . . . . . . . . . . . . . . . . . . . . . . . . . . . . . . . . 2-5
Table 2.2 Stylus Arm Assembly Protection . . . . . . . . . . . . . . . . . . . . . . . . . . . . . . . . . . . . . . . . . . . . . . . . . . 2-8
Table 2.3 Special Characters Allowed for Naming Purposes . . . . . . . . . . . . . . . . . . . . . . . . . . . . . . . . . . . . 2-13
Table 2.4 Graphics Export Dialog Features . . . . . . . . . . . . . . . . . . . . . . . . . . . . . . . . . . . . . . . . . . . . . . . . . 2-16
Chapter 3 Scan Recipes
Table 3.1 GEM Status Display . . . . . . . . . . . . . . . . . . . . . . . . . . . . . . . . . . . . . . . . . . . . . . . . . . . . . . . . . . . . 3-4
Table 3.2 Edit Menu Options Description. . . . . . . . . . . . . . . . . . . . . . . . . . . . . . . . . . . . . . . . . . . . . . . . . . . . 3-5
Table 3.3 File Menu Options Description . . . . . . . . . . . . . . . . . . . . . . . . . . . . . . . . . . . . . . . . . . . . . . . . . . . . 3-6
Table 3.4 Sample Menu Options Description . . . . . . . . . . . . . . . . . . . . . . . . . . . . . . . . . . . . . . . . . . . . . . . . . 3-6
Table 3.5 Vacuum Menu Options Description . . . . . . . . . . . . . . . . . . . . . . . . . . . . . . . . . . . . . . . . . . . . . . . . 3-6
Table 3.6 Host Menu Options Description (Only available with GEM/SECS Option) . . . . . . . . . . . . . . . . . 3-7
Table 3.7 Diagnostics Menu Options Description. . . . . . . . . . . . . . . . . . . . . . . . . . . . . . . . . . . . . . . . . . . . . . 3-7
Table 3.8 Loadport Menu Options Description. . . . . . . . . . . . . . . . . . . . . . . . . . . . . . . . . . . . . . . . . . . . . . . . 3-7
Table 3.9 Task Menu Options Description . . . . . . . . . . . . . . . . . . . . . . . . . . . . . . . . . . . . . . . . . . . . . . . . . . . 3-7
Table 3.10 ToolBar for the Scan Recipe Catalog Screen . . . . . . . . . . . . . . . . . . . . . . . . . . . . . . . . . . . . . . . . . 3-8
Table 3.11 Catalog Screen Access Buttons . . . . . . . . . . . . . . . . . . . . . . . . . . . . . . . . . . . . . . . . . . . . . . . . . . . . 3-9
Table 3.12 Scan Recipe List Window Function Access Buttons . . . . . . . . . . . . . . . . . . . . . . . . . . . . . . . . . . 3-11
Table 3.13 Show Position Options . . . . . . . . . . . . . . . . . . . . . . . . . . . . . . . . . . . . . . . . . . . . . . . . . . . . . . . . . 3-21
Table 3.14 3D Scan Parameters Summary . . . . . . . . . . . . . . . . . . . . . . . . . . . . . . . . . . . . . . . . . . . . . . . . . . . 3-22
Table 3.15 Show Position Options . . . . . . . . . . . . . . . . . . . . . . . . . . . . . . . . . . . . . . . . . . . . . . . . . . . . . . . . . 3-25
Table 3.16 Stylus Force Ranges for the Different Head Configurations. . . . . . . . . . . . . . . . . . . . . . . . . . . . . 3-28
Table 3.17 Range and Resolution Scan Parameters for the MicroHead V LF Head. . . . . . . . . . . . . . . . . . . 3-29
Table 3.18 Range and Resolution Scan Parameters for the MicroHead V SR Head. . . . . . . . . . . . . . . . . . . 3-29
Table 3.19 Range and Resolution Scan Parameters for the MicroHead V XR Head . . . . . . . . . . . . . . . . . . 3-29
Table 3.20 Profile Types . . . . . . . . . . . . . . . . . . . . . . . . . . . . . . . . . . . . . . . . . . . . . . . . . . . . . . . . . . . . . . . . . 3-30
Table 3.21 Feature Detection Descriptions (See Figure 3.24 and Figure 3.25.). . . . . . . . . . . . . . . . . . . . . . . 3-34
Table 3.22 2D General Parameters . . . . . . . . . . . . . . . . . . . . . . . . . . . . . . . . . . . . . . . . . . . . . . . . . . . . . . . . . 3-53
Table 3.23 3D General Parameters . . . . . . . . . . . . . . . . . . . . . . . . . . . . . . . . . . . . . . . . . . . . . . . . . . . . . . . . . 3-55
Table 3.24 2D Roughness Parameters . . . . . . . . . . . . . . . . . . . . . . . . . . . . . . . . . . . . . . . . . . . . . . . . . . . . . . . 3-58
Table 3.25 2D Waviness Parameters . . . . . . . . . . . . . . . . . . . . . . . . . . . . . . . . . . . . . . . . . . . . . . . . . . . . . . . . 3-60
Table 3.26 3D Roughness Parameters . . . . . . . . . . . . . . . . . . . . . . . . . . . . . . . . . . . . . . . . . . . . . . . . . . . . . . . 3-61
Table 3.27 Feature Find Recipe Parameters . . . . . . . . . . . . . . . . . . . . . . . . . . . . . . . . . . . . . . . . . . . . . . . . . . 3-85
Table 3.28 Diagnostic Options . . . . . . . . . . . . . . . . . . . . . . . . . . . . . . . . . . . . . . . . . . . . . . . . . . . . . . . . . . . . 3-99
Table 3.29 Standard - Diagnostic Options. . . . . . . . . . . . . . . . . . . . . . . . . . . . . . . . . . . . . . . . . . . . . . . . . . . . 3-99
Table 3.30 Linearity Calibration Only – Diagnostic Options . . . . . . . . . . . . . . . . . . . . . . . . . . . . . . . . . . . . . 3-99
Chapter 4 XY View Screen
Table 4.1 View Menu Description. . . . . . . . . . . . . . . . . . . . . . . . . . . . . . . . . . . . . . . . . . . . . . . . . . . . . . . . . . 4-3
Table 4.2 Die Grid Menu. . . . . . . . . . . . . . . . . . . . . . . . . . . . . . . . . . . . . . . . . . . . . . . . . . . . . . . . . . . . . . . . . 4-4
Table 4.3 Move Menu . . . . . . . . . . . . . . . . . . . . . . . . . . . . . . . . . . . . . . . . . . . . . . . . . . . . . . . . . . . . . . . . . . . 4-5
Table 4.4 Direction Menu . . . . . . . . . . . . . . . . . . . . . . . . . . . . . . . . . . . . . . . . . . . . . . . . . . . . . . . . . . . . . . . . 4-6
P/N 0142530-000 AB LOT-1
Friday, March 13, 2009

KLA-Tencor P-16+ / P-6 User’s Guide
Table 4.5 Actions Menu. . . . . . . . . . . . . . . . . . . . . . . . . . . . . . . . . . . . . . . . . . . . . . . . . . . . . . . . . . . . . . . . . . 4-7
Table 4.6 Sample Menu . . . . . . . . . . . . . . . . . . . . . . . . . . . . . . . . . . . . . . . . . . . . . . . . . . . . . . . . . . . . . . . . . . 4-7
Table 4.7 Vacuum Menu . . . . . . . . . . . . . . . . . . . . . . . . . . . . . . . . . . . . . . . . . . . . . . . . . . . . . . . . . . . . . . . . . 4-7
Table 4.8 Stylus Menu . . . . . . . . . . . . . . . . . . . . . . . . . . . . . . . . . . . . . . . . . . . . . . . . . . . . . . . . . . . . . . . . . . . 4-8
Table 4.9 XY View window Tool Bar Buttons . . . . . . . . . . . . . . . . . . . . . . . . . . . . . . . . . . . . . . . . . . . . . . . . 4-8
Table 4.10 Locating a Scan Site. . . . . . . . . . . . . . . . . . . . . . . . . . . . . . . . . . . . . . . . . . . . . . . . . . . . . . . . . . . . 4-14
Chapter 5 View Scan Window
Table 5.1 Scan Screen - Recipe Information Column . . . . . . . . . . . . . . . . . . . . . . . . . . . . . . . . . . . . . . . . . . . 5-2
Table 5.2 View Scan Screen - 2D Location Information Column. . . . . . . . . . . . . . . . . . . . . . . . . . . . . . . . . . 5-2
Table 5.3 View Scan Screen - 2D Location Information Column. . . . . . . . . . . . . . . . . . . . . . . . . . . . . . . . . . 5-3
Table 5.4 2D View Scan Window Tool Bar Buttons. . . . . . . . . . . . . . . . . . . . . . . . . . . . . . . . . . . . . . . . . . . . 5-5
Table 5.5 2D View Scan Screen - File Menu. . . . . . . . . . . . . . . . . . . . . . . . . . . . . . . . . . . . . . . . . . . . . . . . . . 5-6
Table 5.6 2D View Scan Screen - View Menu . . . . . . . . . . . . . . . . . . . . . . . . . . . . . . . . . . . . . . . . . . . . . . . . 5-6
Table 5.7 2D View Scan Screen - Image Menu. . . . . . . . . . . . . . . . . . . . . . . . . . . . . . . . . . . . . . . . . . . . . . . . 5-7
Table 5.8 2D View Scan Screen - Trace Menu . . . . . . . . . . . . . . . . . . . . . . . . . . . . . . . . . . . . . . . . . . . . . . . . 5-7
Table 5.9 2D View Scan Screen - Scan Menu. . . . . . . . . . . . . . . . . . . . . . . . . . . . . . . . . . . . . . . . . . . . . . . . . 5-7
Table 5.10 2D View Scan Screen - Sequence Menu . . . . . . . . . . . . . . . . . . . . . . . . . . . . . . . . . . . . . . . . . . . . . 5-7
Table 5.11 2D View Scan Screen - Pan Menu. . . . . . . . . . . . . . . . . . . . . . . . . . . . . . . . . . . . . . . . . . . . . . . . . . 5-8
Table 5.12 View Scan Screen - 3D Location Information Column. . . . . . . . . . . . . . . . . . . . . . . . . . . . . . . . . 5-11
Table 5.13 3D View Scan Screen - File Menu. . . . . . . . . . . . . . . . . . . . . . . . . . . . . . . . . . . . . . . . . . . . . . . . . 5-12
Table 5.14 3D View Scan Screen - Trace Menu . . . . . . . . . . . . . . . . . . . . . . . . . . . . . . . . . . . . . . . . . . . . . . . 5-12
Table 5.15 3D View Scan Screen - Image Menu. . . . . . . . . . . . . . . . . . . . . . . . . . . . . . . . . . . . . . . . . . . . . . . 5-12
Table 5.17 3D View Scan Screen - Sequence Menu . . . . . . . . . . . . . . . . . . . . . . . . . . . . . . . . . . . . . . . . . . . . 5-13
Table 5.18 3D View Scan Screen - Pan Menu. . . . . . . . . . . . . . . . . . . . . . . . . . . . . . . . . . . . . . . . . . . . . . . . . 5-13
Table 5.16 3D View Scan Screen - Scan Menu. . . . . . . . . . . . . . . . . . . . . . . . . . . . . . . . . . . . . . . . . . . . . . . . 5-13
Preliminary
Chapter 6 Sequence Recipe and Data
Table 6.1 Sequence Editor window buttons. . . . . . . . . . . . . . . . . . . . . . . . . . . . . . . . . . . . . . . . . . . . . . . . . . 6-19
Table 6.2 Sequence List Buttons . . . . . . . . . . . . . . . . . . . . . . . . . . . . . . . . . . . . . . . . . . . . . . . . . . . . . . . . . . 6-20
Table 6.3 Options Buttons . . . . . . . . . . . . . . . . . . . . . . . . . . . . . . . . . . . . . . . . . . . . . . . . . . . . . . . . . . . . . . . 6-20
Table 6.4 Site Buttons . . . . . . . . . . . . . . . . . . . . . . . . . . . . . . . . . . . . . . . . . . . . . . . . . . . . . . . . . . . . . . . . . . 6-21
Table 6.5 Mode Drop-down Menu Options . . . . . . . . . . . . . . . . . . . . . . . . . . . . . . . . . . . . . . . . . . . . . . . . . 6-24
Table 6.6 If Fail Drop-down Menu . . . . . . . . . . . . . . . . . . . . . . . . . . . . . . . . . . . . . . . . . . . . . . . . . . . . . . . . 6-24
Table 6.7 Save and Export Options . . . . . . . . . . . . . . . . . . . . . . . . . . . . . . . . . . . . . . . . . . . . . . . . . . . . . . . . 6-26
Table 6.8 Export Options . . . . . . . . . . . . . . . . . . . . . . . . . . . . . . . . . . . . . . . . . . . . . . . . . . . . . . . . . . . . . . . . 6-26
Table 6.9 Print Option . . . . . . . . . . . . . . . . . . . . . . . . . . . . . . . . . . . . . . . . . . . . . . . . . . . . . . . . . . . . . . . . . . 6-26
Table 6.10 Pattern Examples . . . . . . . . . . . . . . . . . . . . . . . . . . . . . . . . . . . . . . . . . . . . . . . . . . . . . . . . . . . . . . 6-40
Table 6.11 Pattern Search Criteria . . . . . . . . . . . . . . . . . . . . . . . . . . . . . . . . . . . . . . . . . . . . . . . . . . . . . . . . . . 6-41
Table 6.12 Groping Parameters . . . . . . . . . . . . . . . . . . . . . . . . . . . . . . . . . . . . . . . . . . . . . . . . . . . . . . . . . . . . 6-45
Chapter 7 Analyzing 3D Scan Data
Table 7.2 Manual Image Rotation Buttons . . . . . . . . . . . . . . . . . . . . . . . . . . . . . . . . . . . . . . . . . . . . . . . . . . . 7-3
Table 7.1 Automatic Image Rotation Buttons . . . . . . . . . . . . . . . . . . . . . . . . . . . . . . . . . . . . . . . . . . . . . . . . . 7-3
Table 7.3 Image Rotation Using the Arrow Keys . . . . . . . . . . . . . . . . . . . . . . . . . . . . . . . . . . . . . . . . . . . . . . 7-4
Table 7.4 Rotate Image Menu Options (From View Menu) . . . . . . . . . . . . . . . . . . . . . . . . . . . . . . . . . . . . . . 7-5
Table 7.5 Analysis Toolbar Buttons. . . . . . . . . . . . . . . . . . . . . . . . . . . . . . . . . . . . . . . . . . . . . . . . . . . . . . . . 7-11
Table 7.6 Analysis Side Toolbar Buttons . . . . . . . . . . . . . . . . . . . . . . . . . . . . . . . . . . . . . . . . . . . . . . . . . . . 7-12
Table 7.7 File Menu Operations. . . . . . . . . . . . . . . . . . . . . . . . . . . . . . . . . . . . . . . . . . . . . . . . . . . . . . . . . . . 7-16
LOT-2 KLA-Tencor Confidential 0142530-000 AB
Friday, March 13, 2009

KLA-Tencor P-16+ / P-6 User’s Guide
Table 7.8 Edit Menu Option . . . . . . . . . . . . . . . . . . . . . . . . . . . . . . . . . . . . . . . . . . . . . . . . . . . . . . . . . . . . . 7-17
Table 7.9 View Menu Options. . . . . . . . . . . . . . . . . . . . . . . . . . . . . . . . . . . . . . . . . . . . . . . . . . . . . . . . . . . . 7-18
Table 7.10 Change Menu Option From the View Menu . . . . . . . . . . . . . . . . . . . . . . . . . . . . . . . . . . . . . . . . . 7-22
Table 7.11 Change Menu Option From the View Menu . . . . . . . . . . . . . . . . . . . . . . . . . . . . . . . . . . . . . . . . . 7-23
Table 7.12 Operations Menu Options (From Menu Bar) . . . . . . . . . . . . . . . . . . . . . . . . . . . . . . . . . . . . . . . . 7-28
Table 7.13 Data Menu Options (From Menu Bar) . . . . . . . . . . . . . . . . . . . . . . . . . . . . . . . . . . . . . . . . . . . . . 7-30
Table 7.14 Tools Menu Options (From Menu Bar). . . . . . . . . . . . . . . . . . . . . . . . . . . . . . . . . . . . . . . . . . . . . 7-31
Chapter 8 APEX 2D/3D - Getting Started
Chapter 9 Stress (Optional feature)
Table 9.1 Tool Bar Icons . . . . . . . . . . . . . . . . . . . . . . . . . . . . . . . . . . . . . . . . . . . . . . . . . . . . . . . . . . . . . . . . . 9-5
Table 9.2 Elastic Constant of Substrates . . . . . . . . . . . . . . . . . . . . . . . . . . . . . . . . . . . . . . . . . . . . . . . . . . . . . 9-8
Table 9.3 Stress Calculation Results Box Contents. . . . . . . . . . . . . . . . . . . . . . . . . . . . . . . . . . . . . . . . . . . . 9-11
Chapter 10 3D Stress (optional Feature, P-16+ only)
Table 10.1 Common Terms Defined . . . . . . . . . . . . . . . . . . . . . . . . . . . . . . . . . . . . . . . . . . . . . . . . . . . . . . . . 10-1
Table 10.2 Field Descriptions in the 3D Stress Recipe Editor Window . . . . . . . . . . . . . . . . . . . . . . . . . . . . . 10-5
Table 10.3 Field Descriptions in the Alignment Section of the Recipe Editor . . . . . . . . . . . . . . . . . . . . . . . . 10-5
Table 10.4 Field Descriptions in the Substrate Specification Section of the Recipe Editor . . . . . . . . . . . . . . 10-6
Table 10.5 Tool Bar Icons for the Stress Map Image Cursors . . . . . . . . . . . . . . . . . . . . . . . . . . . . . . . . . . . 10-13
Table 10.6 Tool Bar Icons for Adjusting Image Rendered . . . . . . . . . . . . . . . . . . . . . . . . . . . . . . . . . . . . . . 10-14
Preliminary
Chapter 11 System Security
Table 11.1 Security Configuration Editor Sections. . . . . . . . . . . . . . . . . . . . . . . . . . . . . . . . . . . . . . . . . . . . . 11-4
Table 11.2 Access Policy Settings. . . . . . . . . . . . . . . . . . . . . . . . . . . . . . . . . . . . . . . . . . . . . . . . . . . . . . . . . 11-11
Chapter 12 Calibrations
Table 12.1 Standard Calibration Matrix . . . . . . . . . . . . . . . . . . . . . . . . . . . . . . . . . . . . . . . . . . . . . . . . . . . . . 12-1
Chapter 13 Stylus Change Procedure
Table 13.1 Available L-Stylus Radius. . . . . . . . . . . . . . . . . . . . . . . . . . . . . . . . . . . . . . . . . . . . . . . . . . . . . . . 13-1
Chapter 14 Configuration
Chapter 15 Preventive Maintenance
Table 15.1 Weekly PM Procedures . . . . . . . . . . . . . . . . . . . . . . . . . . . . . . . . . . . . . . . . . . . . . . . . . . . . . . . . . 15-1
Table 15.2 Monthly PM Procedures . . . . . . . . . . . . . . . . . . . . . . . . . . . . . . . . . . . . . . . . . . . . . . . . . . . . . . . . 15-2
Table 15.3 Semi-Annual PM Procedures . . . . . . . . . . . . . . . . . . . . . . . . . . . . . . . . . . . . . . . . . . . . . . . . . . . . 15-2
Chapter 16 Backup and Restore
Appendix A Hazardous Materials
Table A.1 Hazardous Materials List. . . . . . . . . . . . . . . . . . . . . . . . . . . . . . . . . . . . . . . . . . . . . . . . . . . . . . . . . A-2
Appendix A P Series Profiler - Preparing for Shipment
Table B.1 Minimum Parts Required. . . . . . . . . . . . . . . . . . . . . . . . . . . . . . . . . . . . . . . . . . . . . . . . . . . . . . . . . B-1
0142530-000 AB KLA-Tencor Confidential LOT-3
Friday, March 13, 2009

KLA-Tencor P-16+ / P-6 User’s Guide
Preliminary
LOT-4 KLA-Tencor Confidential 0142530-000 AB
Friday, March 13, 2009
KLA-Tencor P-16+ / P-6 User’s Guide Introduction & Safety - Instrument Overview
INTRODUCTION & SAFETY Chapter 1
INSTRUMENT OVERVIEW 1
The KLA-Tencor P-16+ / P-6 Profiler is a highly sensitive surface profiler that
measures step height, roughness, and waviness on sample surfaces. The KLA-Tencor
Profiler systems use stylus-based scanning to achieve high resolution.
The P-16+ / P-6 system offers the option between three head configurations, each
with a different vertical range: the MicroHead II V SR (standard range), MicroHead
V LF(low force), and the MicroHead V XR (extended range).
The MicroHead V SR (standard range) has a vertical range of 327
capable of scanning at forces between 0.5 and 50 mg.
The MicroHead V LF (low force) has a vertical range of 131
of scanning with a stylus force between 0.05 and 50 mg. Low force is useful
when scanning soft materials such as gold, indium, or photoresist.
The MicroHead V XR (extended range) extends the vertical range to 1000
It is capable of scanning at forces between 0.5 and 50 mg.
Contact KLA-Tencor for detailed specifications.
SAFETY 1
μm and is
μm. It is capable
μm.
1
yeliminary
Introduction 1
This safety chapter presents an overview of the safety issues involved in the
use of the P-16+ Profiler or P-6 Profiler system.
This Chapter describes:
♦
Safety Symbols and Related Keywords on page 1-1
♦
Lockout/Tagout Procedure on page 1-3
♦
Stage and Head Movement Hazards on page 1-4
Safety Symbols and Related Keywords 1
WARNING: Warnings indicate a potentially hazardous situation which,
if not avoided, could result in personal injury or death.
CAUTION: Cautions indicate that equipment could be damaged, the
operating environment compromised, or data could be lost or
corrupted.
0142530-000 AB KLA-Tencor Confidential 1-1
3/13/09
Introduction & Safety - Safety KLA-Tencor P-16+ / P-6 User’s Guide
DANGER: Dangers indicate an imminently hazardous situation which,
if not avoided, will result in death or serious injury. This signal word is
limited to extreme situations.
PINCH POINT: Pinch Point indicates a situation where the user, if not
careful, could get a hand or finger pinched.
LIFTING HAZARD: Lifting Hazard indicates a procedure where the
user, if not using the proper technique or the correct number of people,
could be injured.
LASER WARNING: Laser Hazard indicates a procedure or situation
in which a laser beam could contact or damage eye tissue..
IMPORTANT: Important highlights critical details about the section for
the reader.
Lockout/Tagout Procedure 1
Introduction
Lockout/tagout is a safety procedure consisting of notifying affected
employees, turning off the system, unplugging the power source cord from the
electric outlet and placing a locked and tagged shield around the plug to
prevent it from being plugged in while the system is being serviced.
During normal operation, the system presents no hazards to its user or to
others in the area of its operation. In normal operation, enclosure panels and
shielding covers protect operators and other personnel working near the
system against electrical and other hazards that could arise from the operation
or failure of the system.
Only qualified service personnel are authorized to remove panels or covers. In
situations requiring service personnel to work near components that present a
potential electrical shock, the lockout/tagout procedure should be followed. In
addition to electrical hazards, some mechanical dangers such as pinch or
crush hazards can also be avoided through the lockout/tagout procedure.
1-2 KLA-Tencor Confidential 0142530-000 AB
3/13/09
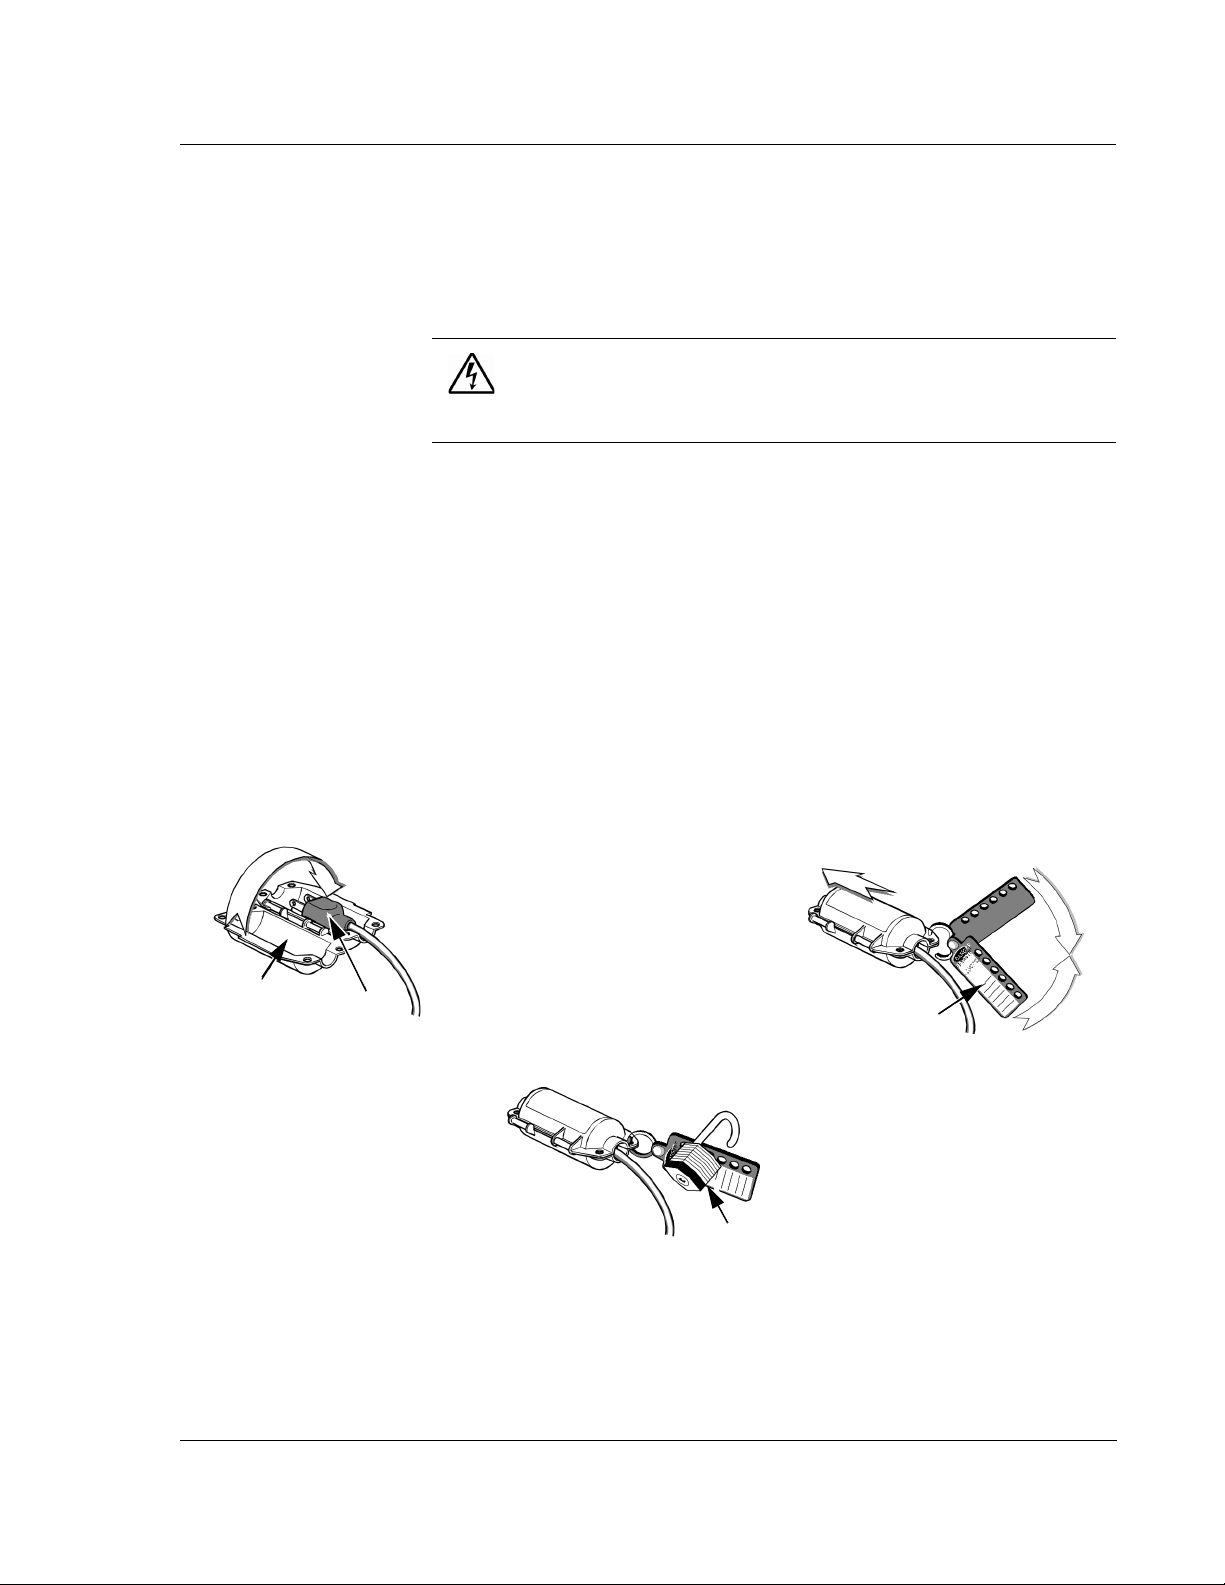
KLA-Tencor P-16+ / P-6 User’s Guide Introduction & Safety - Safety
STEP 1 STEP 2
STEP 3
Plug
Lockout Device
Padlock
Ta g
Lockout/Tagout Procedure 1
If the system is hardwired to facilities power, the lockout/tagout procedure is
to be set by the system owner. Service personnel authorized to perform this
type of lockout/tagout must be trained by the system owner in accordance
with their set procedures.
HAZARDOUS VOLTAGE - SHOCK HAZARD: For personal safety
and system reliability, only qualified service personnel, trained on
service procedures for the system being serviced, are authorized to
open or remove the panels or any protective electrical shielding.
For systems using the power cord disconnect lockout/tagout procedure for a
non-emergency system shutdown, use the following steps:
1. Notify all affected personnel that a lockout is required.
2. Close all running software.
3. After ensuring that the system software has been properly shut down to
avoid system start-up problems later, turn off the system by pressing the
OFF button on the computer and unplug the power supply.
yeliminary
4. Disconnect the Main Power Cord from the outlet and secure it in the Plug
Lockout device as illustrated in Figure 1.1, step 1.
Figure 1.1 Power Cord Plug Lockout/Tagout
5. Attach the lockout hasp with warning tag to the lockout device, as
0142530-000 AB KLA-Tencor Confidential 1-3
3/13/09
shown in Figure 1.1, step 2.

Introduction & Safety - Safety KLA-Tencor P-16+ / P-6 User’s Guide
6. Place a padlock through one of the holes on the lockout hasp as shown in
Figure 1.1, step 3. Make sure the device is secured in the closed position.
7. Before locking the padlock, place the eyelet of an approved lockout tag
over the hook of the padlock. Important information must be included on
this tag:
♦ Your name and/or your ID number.
♦ Your contact number.
♦ Date and Time.
♦ Reason for Lockout.
8. Verify that the power chord cannot be plugged in to live AC Power.
9. After the system has been locked out, verify that the system cannot
operate. For example, press the ON switch on the User Interface and
verify that the indicator lamp does not illuminate, that no other indicators
on the system show that electrical energy has been applied.
Restoring the system to Service
1. When the system is ready for return to normal operation, notify all
affected employees, and check the equipment area to see that no one is
exposed.
2. When the equipment area is clear, remove the padlock and tag that you
have put in place.
3. Reconnect the power cord into the AC outlet.
4. Announce “Power On!” to everyone presently near the system before
actually restoring power.
5. Press the Power On button on the User Interface to start the system.
6. Verify the system operates properly.
Stage and Head Movement Hazards 1
The system is designed so the user is not exposed to any internal moving parts
during normal operation. The system is interlocked to prevent stage or head
movement when the stage door is open. If stage or head movement is
attempted with the door open, the system is automatically disabled.
For any of the stage or head movements to be hazardous to the user, the door
interlock must be defeated and the user must have hands, fingers, or loose
clothing inside the measurement chamber during a stage or head movement
procedure. The normal scanning speed stage movements are very slow, and
barely detectable to the eye. The manual load procedure and stage positioning
move at a higher speed. If these movements are attempted with the door open,
interlock defeated, and a finger, hand, or loose clothing positioned to interfere
with the stage movement, an injury could occur.
1
1-4 KLA-Tencor Confidential 0142530-000 AB
3/13/09
KLA-Tencor P-16+ / P-6 User’s Guide Introduction & Safety - Safety
If none of the components are in motion when the door is opened, or when the
interlock is tripped, the system can be activated again by closing the door or
by returning the interlock to its normal operating position. If a scan is taking
place, if one of the components is in motion, or if an attempt is made to
activate the motion system with the interlock tripped, the entire system must
be rebooted.
CAUTION: Under no circumstances should the operator defeat any of
the safety interlocks. There are no operator procedures that require
the door to be open during normal operation. Operation of the system
in service mode with interlocks defeated should only be performed by
trained and qualified KLA -Tencor service Personnel.
yeliminary
0142530-000 AB KLA-Tencor Confidential 1-5
3/13/09

Introduction & Safety - Safety KLA-Tencor P-16+ / P-6 User’s Guide
1-6 KLA-Tencor Confidential 0142530-000 AB
3/13/09

KLA-Tencor P-16+ / P-6 User’s Guide Basic Skills - Overview
BASIC SKILLS Chapter 2
OVERVIEW 2
Before beginning the use of the P-16+ / P-6 Profiler system, become familiar with
basic skills — such as starting and shutting down the system, and operating the
system buttons, keyboard, trackball, Microsoft Windows, Profiler application, and
other components
ERGONOMIC CONSIDERATIONS 2
KLA-Tencor equipment has been designed and manufactured with safety and
ergonomic principles.
Good Ergonomic Practices
Avoid repetition of movement to the point of excessive fatigue.
Maintain good posture that facilitates circulation and sound biomechanics.
Exercise regularly. Follow suggestions of your health care practitioners.
Vary your tasks. Do not perform the same tasks with your hands without
interruption, or work intensely in the same bodily position for long periods.
Avoid awkward postures.
Eliminate poor access, inadequate clearances, and excessive reach.
Redesign work sites with ergonomics in mind.
2
Preliminary
When Using The Keyboard
Good ergonomics are important when working at the keyboard. Apply these
techniques in your job:
Avoid eyestrain by adjusting the zoom on the monitor, and by looking away to
various distances every few minutes. Sit 18 to 24 inches away from the monitor.
It should be set so the top of the screen is even with your eyes.
Adjust your chair so it positions you well in relation to the monitor, floor,and
keyboard. Support your lower back and rest your feet flat on the floor.
Keep your elbows in a relaxed position next to your side, while keeping your
back straight and shoulders back, down, and relaxed.
Avoid bending, angling, or arching your wrists. Do not twist your wrists in an
angled position for more than a brief period. Rest your palm on a soft surface.
Place your fingers slightly lower than your wrist.
Use the minimum amount of force that is needed to push down the keys.
Keep your fingers and thumbs in a relaxed, natural position.
Do not rest your wrists on the edge of the keyboard platform while typing.
Refrain from using a wrist rest for setting your wrist on while keyboarding.
0142530-000 AB KLA-Tencor Confidential 2-1
Friday, March 13, 2009

Basic Skills - Powering Up the Profiler KLA-Tencor P-16+ / P-6 User’s Guide
POWERING UP THE PROFILER 2
Introduction 2
By powering up the computer, the system launches Windows.
Power Up Procedure 2
1. Press the ON/OFF button on the monitor to activate the monitor.
2. Press the
The Computer starts, Windows is launched, and the Windows desktop is
displayed.
ON/OFF button on the Computer.
LOGGING INTO PROFILER SECURITY 2
After logging into Windows XP as an Administrator, either automatically (default
setting) or manually, you will need to log into profiler security.
NOTE: To have Profiler and Windows XP function properly, you must
log into Windows XP as an Administrator. Profiler security login is then
responsible for granting the user the correct access level.
Preliminary
1. After Windows XP is loaded, you will be presented with the LogOn
dialog shown in Figure 2.1.
Figure 2.1 Logon Dialog
2. Enter a valid User Name that has been previously created, such as
Administrator.
3. Enter a valid Password (case sensitive) that is associated with the User
Name.
2-2 KLA-Tencor Confidential 0142530-000 AB
Friday, March 13, 2009

KLA-Tencor P-16+ / P-6 User’s Guide Basic Skills - Starting the Profiler Application
Step 1 When the boot cycle
is complete and the log on is
complete, double-click the
Profiler icon to initiate
system start-up.
4. The E10 state is not being tracked by the software, so it can be left at the
default value.
5. Click on Logon
STARTING THE PROFILER APPLICATION 2
Introduction 2
The Profiler application is the interface with the P-16+/P-6 Profiler system from
which the scan functions are performed and viewed.
Profiler Start-Up Procedure 2
1. Use the trackball to locate the Profiler icon with the screen cursor. Double-click
the
Profiler icon to initiate startup of the P-16+ / P-6 Profiler system. (See Figure
2.2.)
Figure 2.2 Program Icons
Preliminary
0142530-000 AB KLA-Tencor Confidential 2-3
Friday, March 13, 2009

Basic Skills - Starting the Profiler Application KLA-Tencor P-16+ / P-6 User’s Guide
2. The system goes through its initiation at the end of which the Profiler Catalog
screen appears. (See Figure 2.3.)
Figure 2.3 Profiler Catalog Screen
Preliminary
2-4 KLA-Tencor Confidential 0142530-000 AB
Friday, March 13, 2009

KLA-Tencor P-16+ / P-6 User’s Guide Basic Skills - Navigating Between Program Level Screens
This is the starting point for operating the instrument. In this screen, scan and
sequence recipes can be accessed for system operation. Each icon along the right
side of the screen opens another application that contains the parameters or
controls for a specific type of task. (See Table 2.1)
Table 2.1 Profiler Program Access Icons
Icon Description Icon Description
Configuration
Displays the Profiler Configuration
screen. This screen provides access to
various configuration windows.
Database File Manager
Displays the screen that provides
access to files for export/import and
delete.
Calibration
Displays the Profiler Calibration screen.
This screen provides access to system
calibration windows used for accessing
various calibration procedures.
Scan
Displays the Profiler Catalog screen.
This screen provides access to the Scan
recipes, Sequence recipes, and data
files.
Stress
Displays the Profiler Stress catalog
screen. This screen contains access
to the recipe and data file screens.
GEM/SECS
Displays the GEM/SECS screen.
This screen is used to configure the
system relationship with its host.
NAVIGATING BETWEEN PROGRAM LEVEL SCREENS 2
Introduction 2
The program level Profiler screens all have the program icons along the right border
of the screen. These icons can be used to navigate between the various other program
screens contained in the Profiler software.
Preliminary
0142530-000 AB KLA-Tencor Confidential 2-5
Friday, March 13, 2009

Basic Skills - Exiting the Profiler Application KLA-Tencor P-16+ / P-6 User’s Guide
To change to a different
program function, click
the related icon.
Navigation Procedure 2
Use the following procedure to navigate between screens:
Click the icon of the required program screen. (See Figure 2.4.)
This closes the current program screen and accesses the chosen one. This could
generate a message box that inquires if changes to settings, or data are to be
saved or discarded. Choose the required answer and follow any instruction.
Functions performed in some screens automatically access other screens.
EXAMPLE:
Performing a scan in the XY View screen generates the scan screen then the
Analysis screen.
The above screens do not contain the program icons. To change or exit, click
in the Menu Bar and choose
necessary to click the control button at the top left corner of the screen and
choose
displays the program screen from which the procedure was entered.
Figure 2.4 Profiler Configuration Screen
Close from its drop-down menu. This closes the current screen and
Exit from the drop-down menu. In some cases it is
File
Preliminary
EXITING THE PROFILER APPLICATION 2
Introduction 2
This procedure is used to close the Profiler and Windows applications.
Profiler Exit Procedure 2
1. Close all screens up to a program screen (program level screens are represented
by one of the program icons at the right side of the screen).
2. Click the control button at the top left of the screen to display the menu.
3. Choose
Close from the drop-down menu.
2-6 KLA-Tencor Confidential 0142530-000 AB
Friday, March 13, 2009

KLA-Tencor P-16+ / P-6 User’s Guide Basic Skills - Clearing a Status Bar Message
Clear Status button to
clear Status Bar
4. A Profiler Container (message box) appears asking, “Are you sure you want to
exit the Profiler?” Click
NOTE: The Profiler system will initialize upon shutdown..
Yes to exit.
5. Choose
Shut Down from the menu.
CLEARING A STATUS BAR MESSAGE 2
Introduction 2
Messages appear in the status bar at the bottom of the window when an action or
circumstances create the potential for instrument malfunction, such as occurs with a
motion error. The system status bar also presents messages that guide the user through
many of the system procedures. When a message appears, the status bar at the bottom
of the screen becomes red and the status bar must be cleared before it can display any
new messages.
Clearing a Status Bar Message Procedure 2
After reading the message in the status bar at the bottom left of the screen, click the
Clear Status button on bottom right of the status bar to proceed. See Figure 2.5.
Figure 2.5 Clearing the Status Diagnostic Messages
Preliminary
0142530-000 AB KLA-Tencor Confidential 2-7
Friday, March 13, 2009

Basic Skills - Protecting the Stylus Arm Assembly KLA-Tencor P-16+ / P-6 User’s Guide
PROTECTING THE STYLUS ARM ASSEMBLY 2
System Provisions for Stylus Protection 2
The P-16+ / P-6 Profiler incorporates several design features that protect the stylus
from damage. (See Table 2.2)
Table 2.2 Stylus Arm Assembly Protection
Protection Name Stylus Arm Protective Measure Description of Result
Data Point Saturation During an ascending scan, the scan is
terminated when the stylus reaches its
upper limit of travel (when it has pivoted
up as high as it can go)
Lowest Elevator
Position
Proximity Sensor (P-16
Only)
As a safety factor, the elevator can be
programmed to lower only to a preset
limit.
The Proximity Sensor is designed to
detect the sample as the head lowers and
slow the descent.
Preliminary
Potential Stylus Damage During Scans 2
Despite precautionary features, there are still circumstances where damage can occur.
Damage occurs whenever the stylus is down and a vertical wall that is fixed to
the stage moves against the stylus shaft.
The stylus can be damaged whenever it encounters an obstacle higher than the
bevel height of the stylus tip (higher than 440
L-style stylus. (See Figure 2.6.)
The stylus automatically retracts and the scan
is terminated. In the Scan window, the trace
ascends and flat lines at the top of its range.
With the
when the measurement head is lowered, it only
goes as far as the setting allows, thus
protecting the stylus and sample from damage.
With the Proximity Sensor ON, the head slows
and stops as it nears the sample surface.
If the Proximity Sensor is turned OFF, (or not
available, as in the P-6 model), then the head
descent slows when it reaches 1000 μm above
the Lowest Elevator Position. The system then
depends on the stylus contact with the sample
surface to stop the head descent. If the stylus
is coming down in a hole or off the edge of the
sample, the system or the sample could be
damaged by contact with the sensor assembly.
Lowest Elevator Position properly set,
µm (17 mils) for the MicroHead
2-8 KLA-Tencor Confidential 0142530-000 AB
Friday, March 13, 2009

KLA-Tencor P-16+ / P-6 User’s Guide Basic Skills - Protecting the Stylus Arm Assembly
Scan Direction
Damage can
occur with steps
higher than the
bevel height.
Bevel Height
Bevel Height is
440 µm (17 mil) for
MicroHead L-styli
The stylus can be damaged by a shorter object if it has sharp corners or burrs
that bite into the stylus tip.
Figure 2.6 Contact Scan Stylus Tip
If the stylus is lowered or a scan is started when the sample is not directly under
the stylus, damage to the stylus could occur.
This is most likely to happen when lowering the measurement head such that the
stylus drops into the center hole of a hard disk or misses the edge of the sample.
Then when the stage is moved, the stylus is damaged.
CAUTION: Do not move the stage unless the stylus is well above the
sample surface.
CAUTION: Do not start a scan unless the stylus is directly over the
sample or damage to the stylus or head could occur.
If a sample or precision locator is changed without resetting the Lowest
Elevator Position, the head can lower onto the locator if the stylus misses the
locator surface.
NOTE: The stylus tip is located about 4 mm (165 mils) below the
measurement head.
CAUTION: If changing the sample or precision locator to a different
height, reset the Lowest Elevator Position. Otherwise, damage to the
stylus or the measurement head can occur.
Preliminary
0142530-000 AB KLA-Tencor Confidential 2-9
Friday, March 13, 2009

Basic Skills - Loading a Sample KLA-Tencor P-16+ / P-6 User’s Guide
Step 1 When the screen opens,
click the
Scan Recipe button.
Step 2 With a Scan Recipe
highlighted, click the XY icon to
display the XY View screen.
List window
When designing custom jigs or fixtures, consider the precautions noted in this section.
For instance, when designing a custom hard disk locator, its center section must be
flush with the top of the disk surface. Care must be exercised when nulling where
there is a hole in a jig, a vacuum hole, or a groove in a surface.
For hard disks only, when measuring the disk, avoid nulling in the Disk Locator hole.
NOTE: The KLA-Tencor Warranty Policy does not cover damage to
the stylus arm assembly or the pivot caused by operator error or
carelessness.
LOADING A SAMPLE 2
1. Open the Scan Recipe window. (Click the Scan Recipe button in the Catalog
screen. See Figure 2.7.)
2. Once the Scan Recipe window is active, with a recipe highlighted, click the
View
button to display the XY View screen. (See Figure 2.7.)
Figure 2.7 Scan Recipe Window in the Catalog Screen
XY
Preliminary
2-10 KLA-Tencor Confidential 0142530-000 AB
Friday, March 13, 2009

KLA-Tencor P-16+ / P-6 User’s Guide Basic Skills - Loading a Sample
Menu Bar
Too l B a r
Sample Navigation
Window
Video Display Window
Step 3 Click MAN LOAD
to move the stage to the
door.
Figure 2.8 XY View Screen
Preliminary
3. Click MAN LOAD (see Figure 2.8) in the Tool Bar to move the stage to the door.
(See Figure 2.8.)
4. Open the door.
CAUTION: Do not open the door until the stage has completely
stopped moving. All motors stop immediately when the door is opened.
(Unless the interlock is disabled.)
5. Place the sample on the stage in the proper orientation.
6. Turn on the vacuum switch located on the left inside edge of the door.
The sample should now be securely in place on the stage.
7. Close the door.
8. Click
MAN LOAD to move the stage back under the system head.
0142530-000 AB KLA-Tencor Confidential 2-11
Friday, March 13, 2009

Basic Skills - Adjusting the Video Image KLA-Tencor P-16+ / P-6 User’s Guide
Step 5 When desired
results are achieved,
click
Apply.
Step 6 Click
Exit.
Step 4 Use the slide
bar or directly enter
the value required.
ADJUSTING THE VIDEO IMAGE 2
Introduction 2
The Video Controls allow the view of a particular sample surface to be optimized.
The brightness and contrast can be varied for the camera.
NOTE: Changing the focus can invalidate sequences that use pattern
recognition because the sample image is less likely to match the
stored image in the pattern recognition files.
The purpose of adjusting the video image is to clarify the image resolution and
contrast so it can be clearly viewed.
Video Image Adjustment Procedure 2
1. With a sample loaded on the stage, click the FOCUS button to null the stylus on
the sample surface and focus at the chosen magnification. (See Figure 2.8.)
2. Click
3. Select
View in the Menu Bar to display its menu.
Video Controls.
The
Video Controls dialog box appears. (See Figure 2.9.)
Preliminary
Figure 2.9 Video Control Dialog Box
4. Adjust contrast and brightness controls by moving sliders left or right.
5. When values for
Contrast and Lamp Brightness are set, click Apply.
6. When the adjustments are complete, click Exit. The settings are stored.
NOTE: If the video image is too bright or too dark, even after
making adjustment to the video controls, the problem could be
due to auto brightness, adjustment during the focus routine.
Adjust the contrast to 0 and the lamp brightness to the
mid-point and then return to Step 1, re-focusing the image.
If the problem persists, contact KLA-Tencor.
2-12 KLA-Tencor Confidential 0142530-000 AB
Friday, March 13, 2009

KLA-Tencor P-16+ / P-6 User’s Guide Basic Skills - Using File Name Conventions
USING FILE NAME CONVENTIONS 2
Introduction 2
Scan and sequence recipes and data can be saved, as well as graphs and video images.
In the Windows OS naming convention only the following special characters are
allowed:
Table 2.3 Special Characters Allowed for Naming Purposes
_ underscore - hyphen { left brace
! exclamation point & ampersand } right brace
% percent sign ( left parenthesis ‘ single quotation mark
# number sign ) right parenthesis ' apostrophe
$ dollar sign
Naming and Saving Files 2
1. When saving a file, click File to display its menu. Click the Save… button. A
dialog box appears. The content and appearance differ slightly depending on
what is being saved and the screen from which
2. Choose the appropriate folder in which to store the item being saved.
3. Create a distinct file name for the item being saved. It is best to make the name
representative of the content of the file if possible. The name can be up to 72
characters in length and should not contain empty spaces. Enter the file name in
the file name field.
4. Set any other necessary options required to properly store the information in the
file. For example you may see a setting to change the content format of the file
to either
5. Click
Statistics or Trace. These options are only for sequence data.
Save to save the data in the named file.
Save… was chosen.
SAVING VIDEO IMAGES 2
Introduction 2
A video image can be captured in the XY View window and saved to a file. Many
standard image output file formats are supported.
Naming and Saving Video Images Procedure 2
Preliminary
1. Go to either the XY View or Theta View window, and click the View menu.
2. Select
3. Choose the location in which the image is to be saved.
4. Next to
5. Select the format that the image is to be saved in.
6. Click
0142530-000 AB KLA-Tencor Confidential 2-13
Friday, March 13, 2009
Save Image to File to display the Save Image As dialog box.
File name, enter a name for the image file that is to be created.
Save to save the video image.

Basic Skills - Exporting Data Graphs KLA-Tencor P-16+ / P-6 User’s Guide
Step 1 Click the
Database File Manager
icon to open it screen.
EXPORTING DATA GRAPHS 2
Introduction 2
Data graphs are contained in the Scan Data catalog, Sequence Data catalog and in the
Analysis screen when the scan data is being analyzed. 2D and 3D graphs can be
exported directly from the Analysis screen during scan data analysis. 2D and 3D
graphs from the Scan Data catalog can be exported in two ways: from the Analysis
screen, and from the Database File Manager.
2D and 3D data graphs from the Sequence Data catalog can be exported only from the
analysis screen because the file must be opened and the desired graph chosen and
displayed before it can be exported.
The data graph is exported as a graphic image as Bitmap format (*.bmp), TIFF (*.tif),
JPEG (*.jpg), or Word Metafile Format (*.wmf).
Figure 2.10 Export File Formats in Drop-Down Menu
Preliminary
Exporting Graph from the
Database File Manager
Exporting the Graph from the Scans Catalog (Scan Data Only) 2
1. Go to any top level screen containing the system icons and click the Database
File Manager
Figure 2.11 Catalog Screen – Database File Manager Icon
icon. (See Figure 2.11.)
2-14 KLA-Tencor Confidential 0142530-000 AB
Friday, March 13, 2009

KLA-Tencor P-16+ / P-6 User’s Guide Basic Skills - Exporting Data Graphs
Step 2 Click 3D to display 3D data or recipes.
2. In the Database Catalog screen, choose either the 2D or 3D button in the tool bar.
Depending on the Catalog group chosen, this displays the 2D or 3D data or
recipe sets. (See Figure 2.12.)
Figure 2.12 Data Catalog Screen for Export of Data or Recipes
Preliminary
To Open the Export Dialog
Box from the Database
Screen
3. Choose
Scan Data from the Catalog buttons at the left of the screen.
4. Navigate to the folder containing the required graph.
5. If the file name is known and there is no need to see the graph, click the file
name of the graph, and click
This opens the export dialog box titled
Figure 2.13 Graphics Export Dialog Box
Graph Export… at the bottom of the screen.
Save As. (See Figure 2.13.)
0142530-000 AB KLA-Tencor Confidential 2-15
Friday, March 13, 2009

Basic Skills - Exporting Data from the Database File Manager KLA-Tencor P-16+ / P-6 User’s Guide
6. Set the required variables in the Save As dialog box. See Table 2.4 for an
explanation of the variables to be set.
Table 2.4 Graphics Export Dialog Features
Var iab le Description
Save In
File Name
Save as Type
Export Size
This drop-down menu provides a browse feature from
which to search for the folder that the graphic is to be
exported to or the application that is to analyze it. The
location must be and displayed in the
Type the File Name, up to 68 -characters in length.
From the drop-down menu, select the graphic format:
(BMP, TIFF, WMF, EPS, or JPEG).
Allows the user to keep the original size or resample to
a smaller size, or change to a larger format.
Save In: field.
7. Complete the information in the dialog box.
8. After all the information has been entered, click
Save to complete the export.
Exporting the Graph from within Analysis Program (Scan and Sequence Data)
2
1. When the operator needs to see the scan graph before exporting it, after entering
the Scan Data or Sequence Data folder containing the scan file, double-click the
file. This opens the Analysis screen with the graph displayed.
Preliminary
2. If the correct graph is displayed, resize or reorient it as required before export.
3. Choose
Export Graph… from the File menu to open the Save As (export) dialog
box.
4. Fill in the required information.
5. After all the information has been entered, click
Save to complete the export.
EXPORTING DATA FROM THE DATABASE FILE MANAGER 2
Export of data files from the Database File Manager is performed the same way for
both Scan Data and Sequence Data sets.
1. From the Database File Manager choose either 2D or 3D files.
2-16 KLA-Tencor Confidential 0142530-000 AB
Friday, March 13, 2009

KLA-Tencor P-16+ / P-6 User’s Guide Basic Skills - Exporting Data from the Database File Manager
Step 1 Click 2D or 3D to display related files.
Two sets of buttons
produce the Import and
Export dialog boxes.
The File menu also has
menu items for
Import
and
Export dialog box
activation.
2. Choose either the Scan Data or Sequence Data catalog button. This displays the
related 2D or 3D data files in the chosen catalog.
Figure 2.14 Data Catalog Screen for Export of Data or Recipes
Preliminary
3. Navigate to the required data set and click it to highlight it.
There are three ways to access the
Export Directory
The
dialog box.
Export… button at the bottom of the screen
The Export Data icon in the tool bar at the top of the screen
The
4. Select
This displays the
Export… menu item in the File menu
Export… from one of its access points.
Export Sequence (or Scan) Data -- Select Export Directory
dialog box.
From the
Export to: drop-down menu, choose the directory/folder that the data is
to be exported to. The actual path and folder name are displayed at the bottom
left of the dialog box.
5. Choose an export format, either ASCII, Binary, or Simple Binary.
ASCII - Exports data in text format for viewing in programs such as Excel
Binary - Binary files are used for transporting data between Profiler
systems or to offline Profiler software. When sending data to KLA-Tencor
for analysis, binary is the preferred format.
Simple Binary - Binary file format with a header that contains the
minimum required to interpret the data and generally does not change
between software versions. This allows easier transporting data to third
party data analysis programs such as Apex, SPIP, etc.
6. Click
OK to export the data to the destination folder.
Export Sequence (or Scan) Data -- Select
0142530-000 AB KLA-Tencor Confidential 2-17
Friday, March 13, 2009

Basic Skills - Exporting Data from the Database File Manager KLA-Tencor P-16+ / P-6 User’s Guide
Preliminary
2-18 KLA-Tencor Confidential 0142530-000 AB
Friday, March 13, 2009

KLA-Tencor P-16+ / P-6 User’s Guide Scan Recipes - Introduction
SCAN RECIPES Chapter 3
INTRODUCTION 3
The P-16+ / P-6 Profiler system performs scans of sample surfaces using recipes that
set the parameters of each scan. Each recipe can be used alone or, in conjunction with
other recipes in a sequence to gather necessary data from a given sample. Some
system calibrations use recipes to perform vital data gathering and analysis so the
system can be calibrated for optimum performance.
The P-16+ / P-6 Profiler system is capable of high resolution scans in two or three
dimensional formats. The three dimensional scan uses a combination of parallel
traces. The length of the traces, the distance between parallel traces, and the
frequency of data point collection are all defined in the recipe. The two dimensional
trace is a collection of data points made at a recipe specified frequency either as one
trace, or a recipe specified number of traces over the same scan position, which are
then averaged. The data is then presented in either a two or three dimensional
graphical format for observation and analysis.
3
0142530-000 AB KLA-Tencor Confidential 3-1
3/13/09

Scan Recipes - Accessing the Scan Recipe Catalog Screen KLA-Tencor P-16+ / P-6 User’s Guide
These buttons
determine which set
of files are active in
the Information
Display window. The
active button appears
depressed.
Scan Recipe is
chosen as indicated
by its depressed
button. The Scan
Recipe list is displayed
in the Information
Display window.
List window.
The Control Button
contains the menu item
to close the screen.
The tool bar contains commonly
used commands in icon format.
These Command buttons present recipe
interaction functions in a button format.
The menu bar contains
drop-down menus for
various functions.
ACCESSING THE SCAN RECIPE CATALOG SCREEN 3
The Catalog screen is the first screen to appear when the Profiler application is
opened. The functional areas in the screen are described in Figure 3.1 and Figure 3.2.
Figure 3.1 Catalog Sequence Recipe Screen
3-2 KLA-Tencor Confidential 0142530-000 AB
3/13/09

KLA-Tencor P-16+ / P-6 User’s Guide Scan Recipes - Scan Recipe Catalog Screen Components
The current path to the set
of files displayed in the List
window is shown here.
When a recipe is chosen,
its name appears in this
box.
The System Status
Message area.
The List window contains the list of currently available recipes for
whichever scan type and dimension is indicated
Figure 3.2 Catalog Sequence Recipe Screen
SCAN RECIPE CATALOG SCREEN COMPONENTS 3
0142530-000 AB KLA-Tencor Confidential 3-3
3/13/09
If the Scan Recipe button is not chosen, click it. After the Scan Recipe button is clicked, the List window changes to the Scan Recipe list. The Scan Recipe screen is divided into functional components. Each is discussed in the following section, Scan Recipe Catalog Screen Components on page 3-3.
Screen Tools 3
The Catalog Screen Tools section is divided into three parts: Title Bar, Menu Bar, and
the Tool Bar. An additional tool bar is located below the List window and is discussed
in List Window on page 3-10.

Scan Recipes - Scan Recipe Catalog Screen Components KLA-Tencor P-16+ / P-6 User’s Guide
Control Menu Button Screen Title Area Close Button is visible.
If the GEM/SECS option is being used, this status line
displays the current communication status with the system
host. Double-click this field to open the GEM/SECS dialog
box. This is not visible if the option is not activated.
Title Bar 3
The Title Bar contains the Control menu button, the Screen Title Bar, and the
Close/Minimize icons (see Figure 3.3) or the GEM Status for systems equipped with
the GEM/SECS option.
Figure 3.3 Title Bar for Catalog Screen
Screen Title Area: This identifies the current active screen. (See Figure 3.3.) It
is not interactive.
GEM/SECS Status Display (Optional Feature): This area displays the current
GEM status. To view the
Display. (See Figure 3.3.) Settings in the dialog box should only be changed by
those with a thorough knowledge of GEM/SECS functions in the system.
GEM Status dialog box double-click the GEM Status
CAUTION: Only system engineers familiar with the GEM operation
should change any settings in the GEM Status dialog box. Changing
these settings could disrupt processing.
The following table presents the possible GEM Status messages and the significance
of each message.
Table 3.1 GEM Status Display
GEM STATUS Description
Online/Local
Online/Remote
GEM Offline This means that the GEM communication link is
GEM Disabled This means that the communication link is temporarily
Online -The P-16+ / P-6 Profiler system is in the operating
mode.
Local - In this state, the P-16+ / P-6 Profiler system is
controlling its own activity.
Online -This P-16+ / P-6 Profiler system is in the
operating mode.
Remote - In this state, control of the P-16+ / P-6 Profiler
system comes from the host.
suspended.
disabled for a user defined purpose.
3-4 KLA-Tencor Confidential 0142530-000 AB
3/13/09

KLA-Tencor P-16+ / P-6 User’s Guide Scan Recipes - Scan Recipe Catalog Screen Components
Menu Bar 3
The following tables present the content of each drop-down menu in the Menu Bar
for the
Scan Recipe Catalog screen.
NOTE: One or more of the menu options in a given drop-down menu
might be grayed out. This can be due to the permission status of the
operator currently logged onto the system, it being an option that is not
currently available because it requires other system options to be
enabled before use, or the option’s unavailability at this stage in the
procedure.
.
Figure 3.4 Menu Bar for Scan Recipe Screen
Table 3.2 Edit Menu Options Description
Edit Menu Description
New This opens the Recipe Editor screen with an untitled recipe that is using the format of the
highlighted recipe in the catalog screen. The recipe title is “UNTITLED” until the new recipe
parameters are set and it is saved with a new name.
View/Modify This opens the Recipe Editor screen displaying the parameters of the recipe that
is highlighted on the
2D This displays the 2D list of Scan Recipes in the Catalog display area. (See Figure 3.2.)
3D This displays the 3D list of Scan Recipes in the Catalog display area. (See Figure 3.2.)
Scan Recipe screen.
0142530-000 AB KLA-Tencor Confidential 3-5
3/13/09

Scan Recipes - Scan Recipe Catalog Screen Components KLA-Tencor P-16+ / P-6 User’s Guide
Table 3.3 File Menu Options Description
File Menu Description
START Starts the currently highlighted scan procedure. The screen changes to the scan
screen. In the screen depicted in Figure 3.2, it would start the _STEPHTH recipe scan.
Teach Die Grid (Supported on the P-16+ with the pattern recognition option) Opens the Teach
Die Grid procedure in the XY View Screen.
XY view Brings up the XY View screen, which is the typical scan screen.
Print Brings up the Print Manager for printing recipes.
Exit Exits the Scan screen. This sometimes prompts the display of dialog box asking if the
current changes are to be saved.
Table 3.4 Sample Menu Options Description
Sample Menu Description
Manual Load This moves the sample stage to the Stage Door of the system (the manual load
door) so a sample can be manually loaded onto the stage.
Table 3.5 Vacuum Menu Options Description
Vacuum Menu Description
Off This button is inactive in the P-16+ / P-6 Profiler because the Vacuum switch is manual.
On This button is inactive in the P-16+ / P-6 Profiler because the Vacuum switch is manual.
3-6 KLA-Tencor Confidential 0142530-000 AB
3/13/09

KLA-Tencor P-16+ / P-6 User’s Guide Scan Recipes - Scan Recipe Catalog Screen Components
Table 3.6 Host Menu Options Description (Only available with GEM/SECS Option)
Host Menu Description
Go Offline This takes the P-16+ / P-6 Profiler system offline. This is used to prevent the
system from responding to a host during a user defined operation.
Attempt Online This attempts contact with the host to open the system communication link.
The system then operates according to its predetermined GEM parameters.
Local This is an Online state where there is communication with the Host but in which the
P-16+ / P-6 Profiler system controls the system’s operation.
Remote This is an Online state where there is communication with the Host and in which the
host controls the P-16+ / P-6 Profiler system operation.
Table 3.7 Diagnostics Menu Options Description
Diagnostics Menu Description
ARAMS - This function is not used by P-16+ / P-6 systems.
Table 3.8 Loadport Menu Options Description
Loadport Menu Description
Loadport - This function is not used by P-16+ / P-6 systems.
Table 3.9 Task Menu Options Description
Tasks Menu Description
Configuration - Link to the Configuration page.
Calibration - Link to the Calibration page.
Scan Catalog - Link to the Scan Catalog.
Database Catalog - Link to the Database Catalog.
Stress - Link to the Stress Function (optional feature).
Gem-Secs - Link to the GEM-SECS function (optional feature).
Defect Review - Link to the Defect Review function (optional feature).
0142530-000 AB KLA-Tencor Confidential 3-7
3/13/09

Scan Recipes - Scan Recipe Catalog Screen Components KLA-Tencor P-16+ / P-6 User’s Guide
Too lB ar 3
The ToolBar has eight icons that work as short cuts to functions.
Figure 3.5 ToolBar Icons
The function of each icon is described in Table 3.10.
Table 3.10 ToolBar for the Scan Recipe Catalog Screen
Too l Bar Icon Description
Prints the currently highlighted recipe.
Starts a scan using the highlighted recipe in the List window.
Switches to XY View screen with the current recipe active, ready for a scan to be run.
Switches to the XY View screen to teach Die Grid
(P-16+ Only with Optional Pattern
Recognition Feature).
Displays the following in the List window:
2D Scan Recipes, when in the Scan Recipe Catalog screen;
2D Sequence Recipes, when in the
Displays the following in the List window:
Sequence Recipe Catalog screen
3D Scan Recipes, when in the Catalog Scan Recipe screen;
3D Sequence Recipes, when in the
Launches Apex application and sends the current file to Apex in a separate window.
Catalog Sequence Recipe screen.
3-8 KLA-Tencor Confidential 0142530-000 AB
3/13/09

KLA-Tencor P-16+ / P-6 User’s Guide Scan Recipes - Scan Recipe Catalog Screen Components
Catalog Screen Access Buttons 3
The Catalog screen presents access to four sets of information. The Scan Recipe and
the Sequence Recipe screen, provide access to the currently defined recipes available
for execution in the P-16+ / P-6 Profiler system. Two data screens provide access to
saved Sequence and Scan data file information.
Table 3.11 Catalog Screen Access Buttons
Tool Bar Icon Description
This button displays the list of currently available Scan Recipe folders, which when chosen,
display their recipes in the Catalog screen’s List window. (See Figure 3.2.)
This button displays the list of currently available Scan Data folders, which when chosen,
display their data set in the Catalog screen’s List window. (See Figure 3.2.)
This button displays the list of currently available Sequence Recipe folders, which when
chosen, present their recipes in the Catalog screen’s List window. (See Figure 3.2.)
This button displays the list of currently available Sequence Data folders, which when
chosen, present their data sets in the Catalog screen’s List window. (See Figure 3.2.)
0142530-000 AB KLA-Tencor Confidential 3-9
3/13/09

Scan Recipes - Scan Recipe Catalog Screen Components KLA-Tencor P-16+ / P-6 User’s Guide
The Scan Recipe Name displays the currently
highlighted (chosen) recipe. If a scan is initiated
from this screen, this recipe is used.
This portion of the
Information Display is
the List window,
containing the list of
available recipes that
can be used for scans.
These Function Buttons
operate on the chosen recipe.
They duplicate other menu
and tool button functions.
The Recipe Path provides
the directory path to the
current set of recipes
displayed in the List window.
List Window 3
List Window for Scan Recipe 3
When the Scan Recipe button is clicked, the List Window displays the Scan Recipe
information and associated function buttons. (See Figure 3.6.)
Figure 3.6 Scan Recipe information in the List Window
3-10 KLA-Tencor Confidential 0142530-000 AB
Recipe Path Display
This area is used for navigating to a particular folder of recipes in a directory. The
recipes in the List window are contained in the highlighted folder in the Recipe Path
display.
Scan Recipe Name Display
This field contains the name of the currently chosen scan recipe. The recipe is chosen
by clicking on a recipe in the List window so that the recipe highlights. (See
Figure 3.6.) The recipe in the
current recipe. If the
(see Figure 3.6), or the
Figure 3.5 and Table 3.10), is clicked, a scan is performed using the current recipe.
Scan Recipe Name display is designated to be the
START button, at the bottom of the Information Display window
START button in the Scan Recipe Catalog tool bar (see
3/13/09

KLA-Tencor P-16+ / P-6 User’s Guide Scan Recipes - Scan Recipe Catalog Screen Components
The 2D
button appears depressed and
The
3D button appears extruded and
normal, showing that it is not active.
Recipe List Window
This area contains the list of scan recipes that have been created for the various types
of scans used by the system. Scan Recipes are categorized into 2D Scan recipes and
3D Scan recipes. The recipes are accessible by clicking on either the 2D button or the
3D button in the tool bar at the top of the screen. (See Figure 3.7.) To determine
which list is active, look at the 2D and 3D buttons. The active buttons appear to be
depressed and highlighted. The inactive buttons appear extruded outward. (See
Figure 3.7.)
Figure 3.7 Tool Bar Buttons
When a recipe in the current list is clicked on, it highlights and its name appears in the
Scan Recipe Name display box at the top of the Information Display Window. In
addition, the current recipe is featured in the Scan Recipe Editor screen that appears
when the
View/Modify button (a function button under the Information Display
window) is activated. (See Figure 3.6.)
Function Buttons - Scan Recipe List Window
The function buttons, located at the bottom of the Information Display window,
operate on the recipes in the recipe List window. If the button is not accessible, it
appears as a 2D object, not 3D, and it is grayed out. Buttons might be inaccessible
because:
The system is operating in a Security level that does not grant the current Log
On access permission to perform the corresponding function, or
A preceding (or set-up) activity is required before the function can be activated.
Table 3.12 Scan Recipe List Window Function Access Buttons
Function Icon Description
This prints the currently highlighted Recipe. This function is also performed by the printer
icon in the tool bar.
This opens the Recipe Editor for the creation of a New recipe. In the recipe editor, the title is
“UNTITLED” until the recipe is named. The recipe content contains the default parameters.
The same function is also found in the Edit menu under N
This opens the Recipe Editor allowing modification of the currently highlighted recipe. The
same function is also found in the Edit menu under V
ew.
iew/Modify.
0142530-000 AB KLA-Tencor Confidential 3-11
3/13/09

Scan Recipes - Creating and Editing a Scan Recipe KLA-Tencor P-16+ / P-6 User’s Guide
The System Status Message area
can contain messages, warnings,
and system activity.
To clear the message box, click Clear
Status
. This permanently erases the
message.
Table 3.12 Scan Recipe List Window Function Access Buttons (Continued)
Function Icon Description
This opens the real-time display screen and begins the scan procedure associated with the
currently highlighted scan recipe. This function is also performed by the START button in the
tool bar at the top of the screen.
This opens the XY View screen with the currently highlighted recipe in place to teach a scan.
This function is also performed by the XY Icon in the tool bar at the top of the screen.
System Status Message 3
This portion of the screen contains current system status messages. These messages
can contain any of the following:
Instructions to the user.
Warnings or Cautions
Current system activity.
It is important to check this field for system information if the system appears to be
stalled or inactive. This message field can contain valuable information for system
troubleshooting.
Figure 3.8 System Status Message Field
CREATING AND EDITING A SCAN RECIPE 3
This section presents the procedure for creating a Scan Recipe. Included are:
Accessing the Scan Recipe Editor where the recipe is created
A description of the parameters required to create a recipe
Naming the New Recipe
Testing the New Recipe
3-12 KLA-Tencor Confidential 0142530-000 AB
3/13/09

KLA-Tencor P-16+ / P-6 User’s Guide Scan Recipes - Creating and Editing a Scan Recipe
Accessing the Scan Recipe Editor 3
The actual creation of a scan recipe is performed in the Editor screen. This means that
recipe creation and editing is restricted to those whose password permits access to the
Recipe Editor. Use the following procedure to access the Recipe Editor screen:
1. Open the Profiler Catalog screen. (See Table 3.10.)
2. Choose the
Scan Recipe button to display the Scan Recipe catalog.
3. Choose 2D or 3D scan recipes by clicking on the appropriate icon.
4. Click
New, located among the function buttons at the bottom of the Information
Display window. In the
has no effect on a
Scan Recipe list, a recipe is highlighted in the list. This
New recipe. The new recipe is generated using default
parameters.
5. Click
New, located among the function buttons at the bottom of the Information
Display window.
Recipe Editor for 2D and 3D Scans 3
Introduction 3
When New is clicked, the Recipe Editor appears with an UNTITLED recipe. (See
Figure 3.9.) The
Editor
has eight windows for the 2D recipes and nine for the 3D recipes that, together,
contain all the variable scan recipe parameters. Each of these windows is accessed
through its own access button on the left side of the
Figure 3.9.) These windows are discussed one at a time, starting with the top button
and working down, until all the parameters required for defining a recipe are
explained.
UNTITLED recipe contains the default scan parameters. The Recipe
Recipe Editor Screen. (See
0142530-000 AB KLA-Tencor Confidential 3-13
3/13/09

Scan Recipes - Creating and Editing a Scan Recipe KLA-Tencor P-16+ / P-6 User’s Guide
The Title bar shows that the
recipe name is currently
UNTITLED and the screen
is
Recipe Editor.
Each Parameter button
displays its parameters in
the Information Display
window.
The Information Display window
contains the parameter set
related to the currently activated
Parameter button. The current
Parameter button appears to be
indented, as the
Scan
Parameter Definition
does in
this illustration.
3D Scan contains scan
characteristics. (The 2D
version contains fewer
variables.)
Scan Time category
contains parameters that
are results of above actions.
Stylus category contains
Stylus force and size
parameters.
Vertical Ranging category
contains vertical size
(height, depth and scan
profile of the scan.)
Figure 3.9 Recipe Editor for a 2D UNTITLED Recipe
Scan Parameter Definition Window 3
Figure 3.10 3D Parameters in the Information Display Window
3-14 KLA-Tencor Confidential 0142530-000 AB
3/13/09

KLA-Tencor P-16+ / P-6 User’s Guide Scan Recipes - Creating and Editing a Scan Recipe
Step 1 Click the menu arrow to
display the drop-down menu. To
choose the number of microns (μm)
in the scan length, click the
appropriate number.
The Scan Parameter Definition button displays four categories of 2D or 3D scan
parameters:
2D Scan or 3D Scan; Scan Time; Stylus; and Vertical Ranging.
2D Scan Category Parameters - Scan Parameters Definition 3
The parameters defined in this category deal with the actual mechanics of the 2D
scan. Each is discussed in Figure 3.11.
Figure 3.11 2D Scan Category Parameters
1.
X Scan Size (μm). This variable sets the length of the actual scan. It is set in one
of two ways: drop down and user definable.
NOTE: The scan length can also be changed when using the Teach
function. See Step 3. on page 3-20 for more details. See the Note.
Figure 3.12 X Scan Size (μm)
0142530-000 AB KLA-Tencor Confidential 3-15
3/13/09

Scan Recipes - Creating and Editing a Scan Recipe KLA-Tencor P-16+ / P-6 User’s Guide
2. Scan Speed (μm/s) - This parameter sets the speed at which the scan is
performed. It has a range between
1 μm/s and 25000 μm/s, with numerous
options within this range displayed in its drop-down menu and is not
user-definable.
NOTE: For short scans, 2mm and smaller, the general rule of thumb is
to keep the scan time between 5 and 10 seconds. This is shown in the
recipe and can also be determined by dividing the scan length by the
scan speed. This rule does not always apply, such as when using the 2
µm HAR stylus with a 50 µm/sec scan speed reccomended limit. This
rule also generally does not apply for long scans of the substrate,
typically performed for stress measurements.
CAUTION: When scanning soft material (e.g., copper, aluminum, and
photoresist) it might be required to reduce the applied force and scan
speed.
CAUTION: If the scan speed is set too fast when using a small
applied force, features might be missed or inaccurately traced.
3.
Sampling Rate (Hz) - is the frequency at which data points are collected. The
Sampling Rate sets the number of data points that are collected per second
during a scan. Figure 3.13 illustrates the impact of stylus radius in generating a
scan trace
NOTE: Optimal Sampling Rate is between 50 and 200 Hz.
3-16 KLA-Tencor Confidential 0142530-000 AB
3/13/09

KLA-Tencor P-16+ / P-6 User’s Guide Scan Recipes - Creating and Editing a Scan Recipe
Stylus Radius
Stylus A with
large radius.
Sample Surface
Scan Direction
Stylus Radius
Stylus Path A
Stylus Path B
Stylus B with
small radius.
Figure 3.13 illustrates the impact of stylus radius in generating a scan trace..
Figure 3.13 Scan Trace Comparison - Large vs. Small Stylus Radius
0142530-000 AB KLA-Tencor Confidential 3-17
3/13/09
Comparing the Scan Path of the large radius stylus and the small radius stylus,
assessment can be made regarding the validity of higher frequency data
collection. In general, the larger radius styli do not detect the smallest features.
They give traces that can resemble a statistical average.

Scan Recipes - Creating and Editing a Scan Recipe KLA-Tencor P-16+ / P-6 User’s Guide
Stylus Path A (large radius stylus) Low Frequency Data Collection
Low and High Frequency Data Traces
are nearly the same since a large radius
stylus was used.
Stylus Path A (large radius stylus) High Frequency Data Collection
Low Frequency Data Trace
High Frequency Data Trace
Sample Surface
Figure 3.14 Data Collection When Using a Large Radius Stylus
If the Stylus chosen is small enough to detect the features of interest in the scan,
then a sampling rate and scan speed should be optimized to accurately record the
level of detail required from the scan.
3-18 KLA-Tencor Confidential 0142530-000 AB
3/13/09

KLA-Tencor P-16+ / P-6 User’s Guide Scan Recipes - Creating and Editing a Scan Recipe
Stylus Path B (small radius stylus) Low Frequency Data Collection
Stylus Path B (small radius stylus) Medium Frequency Data Collection
Stylus Path B (small radius stylus) - High Frequency Data Collection
Low Frequency Data Trace
Medium Frequency Data Trace
High Frequency Data Trace
Sample Surface
As the Data Points get closer (higher frequency), the Data Trace
becomes more distinct, resembling Stylus Path B, which used a
Small Radius Stylus to scan.
Small Radius Stylus, Stylus Path B
Step 3 Click the menu
arrow next to the
Sampling Rate field.
Figure 3.15 Data Collection When Using a Small Radius Stylus
Figure 3.16 2D Scan Options With Sampling Rate Menu
0142530-000 AB KLA-Tencor Confidential 3-19
3/13/09

Scan Recipes - Creating and Editing a Scan Recipe KLA-Tencor P-16+ / P-6 User’s Guide
1. Multi-Scan Average - This is a 2D option that allows the user to repeat a single
scan up to 10 times so that the scan data can be averaged by the number of scans
performed. This feature provides an opportunity to minimize the noise factors in
a scan.
2.
Scan Direction - Arrow - This option dictates the direction of the scan, from left
to right or from right to left .
ye Changing The Scan Direction: Click the arrow to cause it to point the
opposite direction.
NOTE: DO NOT use unless it is absolutely necessary.
The recommended direction is left to right because it
gives better repeatability, protects the stylus, and provides better data.
Scan Direction - Teach - When the Teach button is clicked on, it opens in the XY
3.
View. This screen allows the user to set the scan position and scan size.
a. Click the radio button next to the desired reference position,
or
End, that is to be established with respect to the scan feature in the Teach
Scan Length
screen. This can also be changed in the XY View to allow the
Start, Center,
user to view the start, middle, and end of the scan, which can be very
useful when the scan size exceeds the field of view.
NOTE: The Reference Position is for user convenience only. The
coordinates stored in the sequence recipe are the always scan center.
This allows the user to change the scan size and have it expand or
contract about the center of the feature.
3-20 KLA-Tencor Confidential 0142530-000 AB
3/13/09

KLA-Tencor P-16+ / P-6 User’s Guide Scan Recipes - Creating and Editing a Scan Recipe
Scan Feature
Click here to position Start
Outcome
Scan Feature
Click here to position Center
Outcome
Scan Feature
Click here to position End
Outcome
Table 3.13 Show Position Options
Option Description Graphic Representation
Start The
Start setting is used in the Video portion of the XY
view screen to position the start of the scan at the
intersection of the Video screen crosshairs. Wherever the
user clicks in the video image, that position becomes the
starting scan position, and appears at the center of the
Video screen, with the scan distance presented as an
arrow.
Center The
view screen to position the center of the scan at the
intersection of the Video screen crosshairs. Wherever the
user clicks in the video image, that position becomes the
center of the scan, and appears at the center of the Video
screen, with the scan distance presented as an arrow.
End The
screen to position the end of the scan at the intersection of
the Video screen crosshairs. Wherever the user clicks in
the video image, that position becomes the end of the
scan, and appears at the center of the Video screen, with
the scan distance presented as an arrow.
Center setting is used in the Video portion of the XY
End setting is used in the Video portion of the XY view
a.
b. Locate the desired feature in the XY View portion of the screen. Click the
reference position (start, center, or end). The screen then positions the scan
length arrow over the scan feature according to the chosen position. The
reference position is at the center of the video screen crosshairs.
NOTE: When in the Teach Scan Length (XY view) screen, it is possible
to change the scan length by clicking on a position in the video screen
and dragging the new length. After changing the scan length, it is
recommended to check the scan speed and sampling rate to ensure
optimal performance..
0142530-000 AB KLA-Tencor Confidential 3-21
3/13/09

Scan Recipes - Creating and Editing a Scan Recipe KLA-Tencor P-16+ / P-6 User’s Guide
With the feature in the field of view,
click in the appropriate reference
point (start, center, or end) for the
scan. The system positions that
point center screen and places the
scan arrow over the scan in the
appropriate place.
EXAMPLE: If the
circled feature is to
be scanned…
and the reference
is set on center…
Click the center of the scan travel
distance in the image and that point
is positioned center stage with the
scan trace through it.
Figure 3.17 Teach Scan Length, from the 2D Scan Teach Button
Table 3.14 3D Scan Parameters Summary
Parameter Setting 2D, 3D or Both Description and Location
X Scan Size Both X direction scan length; Step 1. on page 3-15.
Y Scan Size 3D The length in the Y-direction through which the X-direction scans are made
Scan Speed Both The speed at which the scan is performed.
Sampling Rate Both The rate at which data points on the scan are recorded for analysis.
Traces 3D This is the number of scans that are made to encompass the Y-distance
3D Scan Category Parameters - Scan Parameters Definition 3
The parameters discussed in this section are those that are additions to or differ from
the 2D parameters already presented. For information on parameters that are identical
for 2D and 3D scans, see the descriptions in the 2D recipe section. (See Table 3.14 for
identification of which parameter settings are 2D or 3D.)
at each
requirement.
Y Spacing interval.
3-22 KLA-Tencor Confidential 0142530-000 AB
3/13/09

KLA-Tencor P-16+ / P-6 User’s Guide Scan Recipes - Creating and Editing a Scan Recipe
Set the Y Scan
Size
by clicking
on the menu
arrow and
choosing the
desired size, or by
highlighting the
current number
and typing in the
new number.
Table 3.14 3D Scan Parameters Summary (Continued)
Parameter Setting 2D, 3D or Both Description and Location
Multi-Scan Average 2D The number of single identical scans which are performed and used to
create a scan data set that represents the average of the scans.
Spacing 3D This is the distance between X scans performed across the Y direction of
the 3D scan area.
Scan Direction Both The direction in which the scan is performed.
Teach… Both Displays the
Teach Scan Length screen that is used to determine the start,
center or end of the scan. Can also be used to drag a new scan length.
Show Position Both Displays the current position and provides an opportunity to set a new
position at which the scan, of scan length set in
X Scan Size, is started, is
centered, or ends.
Y Scan Size (μm)
This parameter defines the size, in the Y-direction, of the 3D area to be scanned. It is
the area across which the number of scans defined in the parameter
Traces are divided
up. (See Figure 3.19 on page 3-24.)
NOTE: If the variable in the Spacing parameter is changed, the Y Scan
changes to accommodate the number of Traces at the new
Size
Spacing distance.
Setting or Changing
Y Scan Size - Use one of the following procedures:
Click the menu arrow to the right of the
desired size.
Highlight the current number and type in the new number. (See also
Automatic Parameter Adjustment: in Step on page 3-24.)
Figure 3.18 3D Scan Parameters
Y Scan Size field and click the
0142530-000 AB KLA-Tencor Confidential 3-23
3/13/09

Scan Recipes - Creating and Editing a Scan Recipe KLA-Tencor P-16+ / P-6 User’s Guide
X Scan Size
Y Scan Size
This scan contains 8 traces,
illustrated as dotted line arrows.
The number of traces is defined
in the
Traces parameter.
Feature being scanned
Traces
This assigns the number of scans that are made in the X-direction across the
Size
direction. In Figure 3.19, the number in the Traces variable box would be 8.
Figure 3.19 Traces - Scan Perimeter with Traces
Y Scan Size is set [Y Scan Size = (Traces -1) x Y Spacing], when the Traces:
If the
parameter is entered, the
Y Spacing parameter automatically adjusts to reflect the
appropriate spacing between scans.
Y Scan
Setting the Number of
highlight the current
Traces: To change the number of Traces in a 3D scan,
Traces value and type in the new number of traces. (See also
Automatic Parameter Adjustment: in Y Spacing (mm) on page 3-24.)
NOTE: The first trace occurs at y = 0 µm. Setting the number of
traces to an odd number ensures that the y-spacing will be an even
number. For example, a 100 µm y-size and 11 traces produces 10 µm
between each trace.
Spacing (μm)
Y
This variable sets the distance in the Y-direction between X-direction scan traces in a
3D scan. The spacing is very important to final 3D data collection set because,
together with the stylus radius, it determines the essential resolution of the feature that
is scanned.
Consider to following example: If the distance between scans is too great with respect
to the stylus radius, important variations in the scanned feature might be missed.
3-24 KLA-Tencor Confidential 0142530-000 AB
3/13/09

KLA-Tencor P-16+ / P-6 User’s Guide Scan Recipes - Creating and Editing a Scan Recipe
Scan Feature
Click here to position
Outcome
Start
x
Scan Feature
Click here to position
Outcome
Center
x
Scan Feature
Click here to position
Outcome
End
x
Automatic Parameter Adjustment: - In general, a connection exists in the software
such that, when certain parameters are changed, other parameters are readjusted to
accommodate the changes. The adjustments occur between the
and
Y Spacing parameters. After setting a parameter, the user might click on the other
Y Scan Size, Traces,
parameters and notice a minor adjustment to the parameter that had just been set. This
happens to balance the numbers between
Show Position - For 3D scans, the three options in this box are used for positioning the
Y Scan Size, Traces, and Y Spacing.
scan area parameters box.
Table 3.15 Show Position Options
Show Position
Option
Start The Start setting is used in the Video portion of the XY
Center The
Description Graphic Representation
view screen to position the upper left corner of the scan
area box in the Video screen crosshairs. Wherever the
user clicks in the video image, that position becomes the
upper left corner of the scan area box, and appears at the
center of the Video screen.
This is not the actual place where the scan starts.
Start only defines the upper left corner of the scan
area box. Literal START is near the lower left corner.
Center setting is used in the Video portion of the XY
view screen to position the center of the scan area box in
the center of the Video screen crosshairs. Wherever the
user clicks in the video image, that position becomes the
center of the scan area box, and appears at the center of
the Video screen.
End The
End setting is used in the Video portion of the XY view
screen to position the lower right corner of the scan area
box in the center of the Video screen crosshairs. Wherever
the user clicks in the video image, that position becomes
the end of the scan area box, and appears at the center of
the Video screen.
This is not the actual place where the scan ends.
End
only defines the lower right corner of the scan area
box. Literal END is near the upper right corner.
0142530-000 AB KLA-Tencor Confidential 3-25
3/13/09

Scan Recipes - Creating and Editing a Scan Recipe KLA-Tencor P-16+ / P-6 User’s Guide
The Scan Time parameters
are display only.
Scan Time Parameters (2D and 3D) - Scan Parameters Definition 3
The Scan Time parameters box displays time and data point values, broken down into
general components. (See Figure 3.20.) No values can be set or defined in this portion
of the screen. These values are read only because they are determined by parameters
set in other fields.
NOTE: These values are system generated from parameters set in
other fields.
Figure 3.20 Scan Time - Scan Parameters Definition
3-26 KLA-Tencor Confidential 0142530-000 AB
Individual Traces (s)
This defines the number of seconds required to complete one scan. This time
parameter divides
X Scan Size (μm) by Scan speed (μm/s) and adds the result to the
approximate move time.
3/13/09

KLA-Tencor P-16+ / P-6 User’s Guide Scan Recipes - Creating and Editing a Scan Recipe
Applied Force is the only
parameter in
Stylus that is
adjustable. Click the menu
arrow to display the menu and
choose the force.
13 µm is SR sensor
low gain range
For 2D and 3D [X Scan Size / Scan speed] + move time = Individual Traces (s)
Total (hr:mi n : s) - This is the total time that it takes to complete the set of scans
defined in the scan recipe section,
Number of Data Points: - This is the total number of scan data points collected during
2D or 3D Scan.
the scan.
For 3D [(X Scan Size / Scan Speed) x Sampling Rate x Traces] + the number of traces
= Number of Data Points
For 2D [X Scan Size / Scan Speed] x Sampling Rate x Multi-Scan Average
= Number of Data Points
Point Interval
Point Interval is the distance between data points in the X-direction of each trace.
For 2D and 3D Scan Speed (μm) / Sampling Rate (Hz) = Point Interval:
Stylus Parameters (2D and 3D) - Scan Parameters Definition 3
The Stylus parameters box contains those variables that deal with the stylus operation.
Only the Applied force variable is accessible for change in this screen.
Figure 3.21 Stylus Parameters (2D and 3D)
Applied Force (mg)
This is the force exerted by the stylus on the sample surface. With each different
stylus radius there are recommended limits that should be taken into consideration
when setting the
Applied Force. The Applied Force should not exceed the
recommended maximum force.
0142530-000 AB KLA-Tencor Confidential 3-27
3/13/09

Scan Recipes - Creating and Editing a Scan Recipe KLA-Tencor P-16+ / P-6 User’s Guide
Changing the Applied Force setting:
Table 3.16 Stylus Force Ranges for the Different Head Configurations
MicroHead V LF MicroHead V SR MicroHead V XR
0.05-50 mg 0.5-50 mg 0.5-50 mg
1. Click the menu arrow next to the variable box to display its menu.
2. Click the desired force setting.
Stylus Radius (μm)
Stylus Radius is the manufacturers stated radius of the stylus. The stylus radius cannot
be changed in this screen.
CAUTION: Recommendations and limits are only correct if the “Stylus
Change Procedure” was followed when the stylus was installed.
Use the Stylus Change Procedure to change the stylus radius setting. (See Stylus
Change Procedure on page 1.)
Recommended Maximum (mg)
Each stylus type is associated with a maximum applied force setting. The maximum
setting is deemed to be safe for the stylus and the sample while performing normal
scans. This force should not be exceeded.
Vertical Ranging Parameters (2D and 3D) - Scan Parameters Definition 3
Vertical Ranging contains two parameters: Range/Resolution and Profile Type. These
two parameters are used together to set up the system for:
Range: The maximum feature measurement limit (theoretical), up or down, that
is considered when scanning for a feature,
Resolution: The theoretical vertical resolution of the electronics.
Three set of ranges are available. The primary differences between the ranges are in
their resolution capabilities, and the ability in the 131
range to set the direction in which the range is applied. The ranges are described
below.
μm, 327 μm, and 1000 μm
3-28 KLA-Tencor Confidential 0142530-000 AB
3/13/09

KLA-Tencor P-16+ / P-6 User’s Guide Scan Recipes - Creating and Editing a Scan Recipe
Range/Resolution
This parameter sets the maximum size limit of the features that can be scanned in
each given range, and the minimum feature size that can be resolved (positively
detected). Three ranges are available. (See Table 3.17.)
Table 3.17 Range and Resolution Scan Parameters for the MicroHead V LF Head
Vertical Range (μm) Resolution (Å)
± 3.2 (6.5 total) 0.004
± 13 (26 total) 0.016
± 65 (131 total) 0.08
Table 3.18 Range and Resolution Scan Parameters for the MicroHead V SR Head
Vertical Range (μm) Resolution (Å)
± 6.5 (13 total) 0.008
± 32 (64 total) 0.04
± 173 (327 total) 0.2
Table 3.19 Range and Resolution Scan Parameters for the MicroHead V XR Head
Vertical Range (μm) Resolution (Å)
± 6.5 (13 total) 0.008
± 65 (131 total) 0.08
± 500 (1000 total) 0.6
NOTE: The Resolution numbers in Table 3.17, Table 3.18, and
Table 3.19 are theoretical. Noise levels effect the resolution.
0142530-000 AB KLA-Tencor Confidential 3-29
3/13/09

Scan Recipes - Creating and Editing a Scan Recipe KLA-Tencor P-16+ / P-6 User’s Guide
For the 131, 327, and 1000 μm
ranges, the three Profile Types allow
the user to choose features that go
up or down from the sample surface
the full range, or split the difference
between up and down features.
Saturated Data Points If, in the course of a scan, the upper limit of any one of the ranges is reached, the
system aborts the scan and a message is issued reporting that there are too many
saturation data points. The scan appears as complete, however, the end of the
trace is only a continuation of the last data point, not actual scan data.
Figure 3.22 Vertical Ranging - Profile Types
Profile Type: Available choices for each range and the resultant scan traces
Table 3.20 Profile Types
Profile Type Range Description
131 μm
131 μm scans features that are approximately 52 μm up or down from the scan’s starting
point.
327 μm
327 μm scans features that are approximately 130 μm up or down from the scan’s
starting point.
1000 μm
1000 μm scans features that are approximately 400 μm up or down from the scan’s
starting point.
64 μm This scans features that are approximately 26 μm up or down from the scan’s starting
point.
26 μm This scans features that are approximately 10 μm up or down from the scan’s starting
point.
13 μm This scans features that are approximately 5 μm up or down from the scan’s starting
point.
6.5 μm This scans features that are approximately 2.5 μm up or down from the scan’s starting
point.
131 μm
131 μm scans features ≈ 100 μm up from the scan’s starting point.
327 μm
1000 μm
μm scans features ≈ 240 μm up from the scan’s starting point.
327
3-30 KLA-Tencor Confidential 0142530-000 AB
1000 μm scans features ≈ 750 μm up from the scan’s starting point.
3/13/09

KLA-Tencor P-16+ / P-6 User’s Guide Scan Recipes - Creating and Editing a Scan Recipe
Table 3.20 Profile Types (Continued)
Profile Type Range Description
131 μm
327 μm
1000 μm
131 μm scans features ≈ 100 μm down from the scan’s starting point.
327 μm scans features ≈ 240 μm down from the scan’s starting point.
1000 μm scans features ≈ 750 μm down from the scan’s starting point.
Feature Detection (Only for 2D Scans) 3
Feature Detection is used to enable automatic detection of some common classes of
profile features (see Figure 3.24 and Figure 3.25). Feature detection makes it possible
to automatically and reliably set the position of the measurement and leveling cursors
relative to the rising and falling edge of a step-like feature or the apex of an arc-like
feature.
In conjunction with feature detection, both the location of the edge (or the apex of an
arc) and the step width can be calculated and displayed in the Analysis window for up
edge, up base, down edge, down base, and Bump. Convex, concave, and Model
Feature Detection do not support feature width calculations since they only detect one
point in the scan..
0142530-000 AB KLA-Tencor Confidential 3-31
3/13/09

Scan Recipes - Creating and Editing a Scan Recipe KLA-Tencor P-16+ / P-6 User’s Guide
Accessing the Feature Detection parameters: 3
In the Recipe Editor, click the Feature Detection button. (See Figure 3.23.) For
information on how to display the
Editor on page 13.
Figure 3.23 Feature Detection - Recipe Editor
Recipe Editor, see Accessing the Scan Recipe
3-32 KLA-Tencor Confidential 0142530-000 AB
3/13/09

KLA-Tencor P-16+ / P-6 User’s Guide Scan Recipes - Creating and Editing a Scan Recipe
Example of a Step feature
A trace of the Step feature
illustrated above.
DownEdge
DownBaseUpBase
UpEdge
DownBase
DownEdge UpEdge
UpBase
A trace of the reverse Step
feature.
A trace of the Convex feature.
A trace of the Concave feature.
The word Convex, as used in
feature detection, is the point at
the apex of the convex trace.
The word
Concave, as used in
feature detection, is the point at
the apex of the concave trace.
Feature
This parameter allows the user to choose between six different features that can be
detected and identified during a scan.
Figure 3.24 Feature Detection Point Locations on a Step
0142530-000 AB KLA-Tencor Confidential 3-33
3/13/09
Figure 3.25 Feature Detection Point Locations for Convex and Concave

Scan Recipes - Creating and Editing a Scan Recipe KLA-Tencor P-16+ / P-6 User’s Guide
Table 3.21 Feature Detection Descriptions (See Figure 3.24 and Figure 3.25.)
Feature Description
None No feature detection is being used.
UpEdge At the trailing edge of a feature rise, it is the point at which
the trace begins the plateau. (See Figure 3.24.)
NOTE: This point location can be modified by using Distance
parameter in the General Parameters Window.
to Edge
UpBase At the trailing edge of a plateau, it is the point at which the
trace begins to turn upward. (See Figure 3.24.)
DownEdge At the trailing edge of a plateau, it is the point at which the
trace begins to turn downward. (See Figure 3.24.)
DownBase At the trailing edge of a feature decline, it is the point at
which the trace begins the plateau. (See Figure 3.24.)
Convex This is the point at the apex of a convex feature. (See
Figure 3.25.)
Concave This is the point at the apex of a concave feature. (See
Figure 3.25.)
Bump This is detection of a bump feature, similar to concave,
except it supports width and height calculations common to
solar cell lines and C4 bumps.
Model This is detection of features that cannot be easily found with
the other available algorithms (e.g: upedge, convex, bump,
etc). Model feature detection is a very powerful analysis tool
for oddly shaped feature, features without clearly defined
edges, features that can change shape based on process
conditions, shallow step heights, etc.
Selecting a feature for detection:
1. Click the menu arrow next to the feature box to display its menu.
2. Click the desired feature to select it. If necessary, use the scroll bar to reveal
other features.
3-34 KLA-Tencor Confidential 0142530-000 AB
3/13/09

KLA-Tencor P-16+ / P-6 User’s Guide Scan Recipes - Creating and Editing a Scan Recipe
Detection parameters are
changed by clicking in the
appropriate variable box to
highlight the current number.
Then type in the new number.
For Up Edge, Up Base, Down edge, Down Base, Convex, and Concave:
Feature Number
If there are multiple edges detected in the scan,
Feature Number provides a way to
select a specific edge for detection. (See Figure 3.26.)
Figure 3.26 Detection Variables - Feature Detection - Recipe Editor
Slope Threshold
This factor sets the value at which any rise or fall in a trace is considered to be a slope.
This means that the
Slope Threshold defines a point at which the system recognizes a
trace line as following or preceding an edge, convex or concave point. (See Figure
3.26.)
0142530-000 AB KLA-Tencor Confidential 3-35
3/13/09
Use values between 0 and 50
Default is 10 for a step and 1 for an apex point..
Plateau Threshold
This factor affects finding the end of the feature. For example, when up edge is
selected, the slope threshold will be used to find the up edge and the plateau threshold
will be used to find the down edge (end of the feature). In the case where the rising
and falling edges have similar slopes, use the same value for the slope and plateau
thresholds. If they are different, then each needs to be optimized to properly detect the
edges.
Use values between 0 and 50
Default is 10 for a step and 1 for an apex point.

Scan Recipes - Creating and Editing a Scan Recipe KLA-Tencor P-16+ / P-6 User’s Guide
Min. Plateau Width
Minimum Plateau Width defines the minimum horizontal distance between rising and
falling edges (or falling and rising edges). This parameter is useful to differentiate
between features of similar shape, but different width. It can also be useful to prevent
false detection of a feature.
Use values between 0.005 and 1000
μm.
Apply Gaussian Noise Filter Before Detection
This is used so that feature detection can detect designated features. (See Figure
3.27.) Up edge, up base, down edge, down base, convex, and concave Feature
Detection operate on the first derivative of the trace. As can be seen in the figure,
without any filtering the derivative does not have a clear inflection at the rising and
falling edges of the steps. Since each motion of the stylus up and down due to
roughness or noise is a change in slope, filtering for Feature Detection is critical to
smooth the profile and produce clear derivatives at the rising and falling edges, as can
be seen in the figure after applying a filter.
It does not apply the filter to scan used for parameter calculations. It is only used
for the purpose of Feature Detection. For use of the Gaussian Filter with scan data,
see Filters on page 3-38.
NOTE: It is always recommended to apply a filter to the data. Filtering
can be very useful to obtain robust Feature detection performance.
3-36 KLA-Tencor Confidential 0142530-000 AB
3/13/09

KLA-Tencor P-16+ / P-6 User’s Guide Scan Recipes - Creating and Editing a Scan Recipe
Deriviative without
filtering does not
produce clear
inflection points at
the rising and
falling edges.
Deriviative with
filtering shows
clear inflection
points at the rising
and falling edges.
Figure 3.27 Scan Trace (Red) with First Derivative (Dark Blue) Overlaid on the
Same Graph
Bump and Model Feature Detection
0142530-000 AB KLA-Tencor Confidential 3-37
3/13/09

Scan Recipes - Creating and Editing a Scan Recipe KLA-Tencor P-16+ / P-6 User’s Guide
Step 1 Click the menu arrow to
display the cutoff menu.
Step 2 Click the desired Short
Wavelength Cutoff.
Filters and Cursors 3
Filters 3
Two filters are available for removing noise from scan data, either as the scan is
taking place, or after the scan occurs but before the data is saved. The oldest filter is
the RC Filter.
Filter
, is the best of the two and is generally chosen when a filter is required.
Noise Filter
The Noise Filter is a Short Wavelength Cutoff filter. This is an adjustable software
filter used to reject short wavelength components of scan data. When used with the
Waviness Filter (Long Wavelength Cutoff), it also isolates band passes for
wavelengths.
RC stands for Resister Capacitor Filter. The second, the Gaussian Noise
Selecting the
1. Click the
Short Wavelength Cutoff: (See Figure 3.28.)
Noise Filter menu arrow to display its menu.
2. Click the desired Shortwave Cutoff or type in the desired value.
NOTE: The availability of cutoffs is dependent on the scan speed. A
short wavelength cutoff cannot be entered if it is longer than the
currently selected long wavelength cutoff, or shorter than the value of
the analog cutoff.
Short wavelength cutoff ≤ Long wavelength cutoff
Short wavelength cutoff ≥ Analog cutoff
Figure 3.28 Filters Parameters - Noise Filter Menu
3-38 KLA-Tencor Confidential 0142530-000 AB
Waviness Filter
The Waviness Filter is the Long Wavelength Cutoff filter. It is an adjustable software
filter to separate long wavelength components of scan data.
To Select the
1. Click the
Long Wavelength Cutoff:
Waviness Filter menu arrow next to display its menu.
3/13/09

KLA-Tencor P-16+ / P-6 User’s Guide Scan Recipes - Creating and Editing a Scan Recipe
Cursor parameters can be
changed using the screen
variable boxes by clicking in
the appropriate variable box to
highlight the current number.
Then type in the new number.
The limits of the cursor boundary
are displayed in the X1 and X2
columns for the various cursors.
Cursor positions can also be
changed by adjusting their
position in the data analysis
program.
2. Click the desired Long Wavelength Cutoff value or type in the desired value.
NOTE: The availability of cutoffs is dependent on the scan speed. The
systems prevents the accidental entry of a long wavelength cutoff that
is shorter than the currently selected short wavelength cutoff or the
value of the analog cutoff.
Cursors 3
Cursors are used for two general purposes:
Measurement Cursors are used to gather data either between the two sets of
cursors or within the boundaries of the cursor itself.
Leveling Cursors are used to level the data points in the trace so the trace
features fairly represent the actual scanned surface.
Figure 3.29 Cursor Parameters - Recipe Editor
0142530-000 AB KLA-Tencor Confidential 3-39
3/13/09
Each cursor has limits that can be set. The limits of the cursor boundary are displayed
in X1 and X2 in the
Cursors parameters box. The cursor limits are set relative to the
starting point of the scan, or relative to the feature detected by the Feature Detection
algorithms, if enabled. These values can be set in the window by clicking on the
current value in the variable box and typing in the new value.
The easiest way is to set the cursors is in the analysis screen, after the scan, using the
click and drag procedure. The procedure is described in the following discussion. (For
more information on leveling cursors see Leveling Cursors on page 3-40.)

Scan Recipes - Creating and Editing a Scan Recipe KLA-Tencor P-16+ / P-6 User’s Guide
The Leveling Cursors are the top set
The Measurement Cursors are the
bottom set.
The trace is shown running from the
top left to the bottom right of the
screen. This clearly shows the need
for data leveling.
Figure 3.30 Analysis Screen with Trace in Need of Leveling
3-40 KLA-Tencor Confidential 0142530-000 AB
Leveling Cursors
In general, the most effective way to set the
Leveling Cursors is in the Analysis screen
by clicking and dragging them into position. When they are in position, use the CALC
procedure to enter the new
Cursors variables. By visually positioning the cursors, the
leveling positions are correct for the actual scan.
Setting the Leveling Cursor positions:
1. After the scan is complete, the
Analysis screen is displayed. Click LEVEL to
activate the Leveling Cursors.
2. Reposition the leveling cursors using the following procedure. Click the
LEVEL
button in the tool bar. This activates the Leveling cursors. The active cursor
header is displayed as a 3D rectangle. The cursor header being moved is
indented while the other cursor is in relief. The Measurement cursor heads
appear as 2D line boxes.
a. As the track ball cursor approaches one of the active cursor heads, the
cursor head changes appearance to indented and the track ball cursor
appears as a double arrow.
Click and hold on the cursor that is to be moved. Drag it to the desired
position, using the track ball to move it. Release the mouse button when
the cursor is in position.
3. When the cursor is in position, set each cursor boundary using the following
procedure:
a. Move the track ball cursor down into the black scan trace screen. The
boundary that the arrow is pointing at is the one that is moves. (See
Figure 3.31.)
3/13/09

KLA-Tencor P-16+ / P-6 User’s Guide Scan Recipes - Creating and Editing a Scan Recipe
Step 3 When the Leveling Cursor
is placed in the general area that it
is to be used, move the track ball
cursor down into the black trace
screen to position the cursor
boundaries.
A single arrow points at the cursor
boundary that is to be adjusted.
Click and hold the mouse button
and use the track ball to move the
cursor boundary into place.
Step 4 After Leveling cursors have
been set, click
LEVEL to level the
trace.
b. Click and hold the mouse button while using the track ball to drag the
boundary into position for leveling the scan. Release the mouse button
when the boundary is correctly positioned.
NOTE: Both cursors should be positioned on the same X-plane. The
cursor boundaries should be positioned on the same plain, avoiding
noise peaks or valleys. This generally gives a flat scan trace.
c. Repeat Step 1 and Step 3 for the remaining cursor.
4. Click the
LEVEL button to level the trace. (See Figure 3.31.) This cause the trace
to be leveled and displays the trace with the Measurement Cursors active. (See
Figure 3.33 for a leveled trace.)
Figure 3.31 Cursor Boundary Setting on Unleveled Trace
0142530-000 AB KLA-Tencor Confidential 3-41
3/13/09
Measurement Cursors
The Measurement cursors are used to measure various attributes of the scan. Some
measurements are obtained between the cursors, while others are made within the
boundary of a single cursor.

Scan Recipes - Creating and Editing a Scan Recipe KLA-Tencor P-16+ / P-6 User’s Guide
In this illustration, the left cursor
is set on the sample surface.
Sample Surface
In this illustration, the
right cursor is set on
the top of the step.
Step 1 The leveled trace appears
with the Measurement Cursors
active. If the
Measurement
Cursors
are not active, click the
NORM button in the tool bar.
Move the cursor into the graph
area and position it next to the
cursor boundary that is to be
moved. It appears as an arrow.
1. It is important to set the measurement cursors to accurately measure the desired
feature. In Figure 3.32 the left cursor is set on the sample surface with the cursor
borders positioned to measure a relatively flat trace segment. The right cursor is
positioned to detect the height of the step being measured. (See Figure 3.32.)
Figure 3.32 Setting Measurement Cursors
a. The Measurement cursor header appears as a 3D rectangles. The Leveling
cursors appear as 2D line boxes. (See Figure 3.33.)
Figure 3.33 Measurement Cursor on Level Trace
3-42 KLA-Tencor Confidential 0142530-000 AB
3/13/09

KLA-Tencor P-16+ / P-6 User’s Guide Scan Recipes - Creating and Editing a Scan Recipe
Cursor parameters (limits) are
automatically changed when
the
CALC button is clicked in
the
Analysis screen.
b. As the track ball cursor approaches one of the active cursors, the cursor
header changes to appear indented and the track ball cursor appears as a
double arrow as shown in Figure 3.6.
Click and hold on the cursor that is to be moved. Drag it to the desired
position using the track ball to move it. Release the mouse button when the
cursor is in position.
2. When the cursor is in position, set each cursor boundary using the following
procedure:
a. Move the track ball cursor down into the black scan trace screen. The
boundary that the cursor arrow is pointing at is the one that moves. (See
Figure 3.33.)
b. Click and hold the mouse button while using the track ball to drag the
boundary into position for its intended measurement in the scan. Release
the mouse button when the boundary is correctly positioned.
c. Repeat Step 1 and Step 3 for the remaining cursor.
d. Click the
CALC button to record the cursor positions in the recipe and
calculate the measurement parameters.
3. When the trace has been leveled and the Measurement cursors have been placed,
click the
CALC button to cause the system to recalculate the data with new
cursor positions. The new positions are saved as part of the recipe.
The Recalculation process places the cursor limits in the
the
Recipe Editor. (See Figure 3.34.)
Figure 3.34 Cursor Parameters - Recipe Editor
Cursors window of
0142530-000 AB KLA-Tencor Confidential 3-43
3/13/09

Scan Recipes - Creating and Editing a Scan Recipe KLA-Tencor P-16+ / P-6 User’s Guide
A trace of the Step
feature illustrated
above.
UpEdge
1 micron
(μm)
Trace distance
0 1 -1
If
UpEdge is chosen as the Feature Detection point,
it becomes the zero coordinate. Everything to the left
is negative and to the right is positive.
In this illustration, with UpEdge chosen
for Feature Detection, the left cursor limits
would be -9 and -6.
In this illustration, with UpEdge chosen
for Feature Detection, the right cursor
limits would be +0.3 and +4.
-6
Relative to Feature Detected
When there is a check (9) in its checkbox, the cursor limits are set relative to the
feature that is defined in the
Editor
. (See Feature Detection (Only for 2D Scans) on page 3-31.) The feature
Feature Detection parameters window in the Recipe
becomes the 0 point (the origin of the new coordinate system), with the points to the
left being negative and those to the right being positive. (See Figure 3.35.) The
cursors are set using the same method previously described. The system
automatically places the measurement and leveling cursors relative to the actual
feature instead of relative to the starting point of the scan.
NOTE: If Relative to Feature Detected is not checked, there should be
no negative numbers in any cursor position because the start of the
scan is the “0” point.
Figure 3.35 Measurement Cursors - Relative to Feature Detection
3-44 KLA-Tencor Confidential 0142530-000 AB
Second Order Curve Removal
This option is designed to remove a secondary curvature from the overall trace of a
curved surface. Features should then appear relative to a flat surface.
3/13/09

KLA-Tencor P-16+ / P-6 User’s Guide Scan Recipes - Creating and Editing a Scan Recipe
Median Filter for 2D and 3D Data
This filter can be chosen as part of the recipe to help filter out spikes from
environmental noise and particulate contamination. A median filter can be turned on
before the scan, allowing the system to filter the data before the first viewing. It can
also be used on saved data. With the data open in the Analysis screen, the saved data
from single scans and sequences can be changed by opening the recipe used to create
the scan from the Analysis screen, and changing the filter size in that recipe.
The median filter is used for both 2D and 3D data, with each type having its own
menu of kernel sizes for the filters being applied to the data. When the filter is applied
before the scan, the data is filtered and permanently changed.
The median filter works as a smoothing tool, taking out glitches and smoothing the
trace surface in direct proportion to the size of the kernel. The median if found for the
effected points in the kernel and is applied to data. The larger the kernel, the greater
the smoothing effect on the data. In general, the smaller the kernel (i.e., the 1 x 3 for
2D and the 3 x 3 for 3D), the less the data is manipulated.
0142530-000 AB KLA-Tencor Confidential 3-45
3/13/09

Scan Recipes - Creating and Editing a Scan Recipe KLA-Tencor P-16+ / P-6 User’s Guide
1 x 3 point median filter
before and after application
BEFORE APPLICATION AFTER APPLICATION
1 x 7 point median filter
before and after application
BEFORE APPLICATION AFTER APPLICATION
Notice how much smoother the 1 x 7
filter (below) made the scan than that of
the 1 x 3 filter (above).
Figure 3.36 Median Filter Application in Glitch Removal
The median filter is a major component of the Glitch Removal process used on data in
the Analysis screen for both 2D and 3D data.
The available filter sizes (kernels) for 2D data are: 1 x 3, 1 x 5, and 1 x 7 points.
The available filter sizes (kernels) for 3D data are: 3 x 3, 5 x 5, and 7 x 7 points.
To add a filter or change the filter size on existing data, use the following procedure:
1. From the Analysis screen, click
2. Select
3-46 KLA-Tencor Confidential 0142530-000 AB
Recipe. This opens the recipe used to generate the data.
Edit to display its menu.
3/13/09

KLA-Tencor P-16+ / P-6 User’s Guide Scan Recipes - Creating and Editing a Scan Recipe
2D Median Filter options.
3D Median Filter options
3. Click Filters/Cursors to display the Filters and Cursors parameters.
4. Click the menu-arrow for either the 2D or 3D Median Filter to display the
options. (See Figure 3.37.)
5. Choose the required filter size for the 2D or 3D data.
Figure 3.37 2D and 3D Median Filter Options
6. Click the Analysis screen icon in the tool bar to return to the Analysis screen for
the affected data.
For additional use of the median filter, see “Activate 3D Glitch Removal Tool.” on
page 15.
Y Lead Screw Filter 3
This filter can be used only with large 3D scans. The Y Lead Screw Filter is designed
to remove the Y lead screw noise present in die level 3D scan data.
The Y lead screw noise is a periodic sine wave in the data, due to the coupling of
stage motion in the Y direction together with the Y lead screw motion into the
measured Z Value.
The Y Lead Screw Filter uses a Fast Fourier Transform (FFT) function to find the
amplitude and the phase of the sine wave in the data. The period is already known,
defined by the Y lead screw hardware. A plane with the sine wave amplitude, phase,
and period is then generated and subtracted from the data.
Y Lead Screw Filter Constraints
For the Y Lead Screw Filter to be effective, the Y-direction scan length and the noise
wavelength must meet the following conditions:
Y-direction scan length
Y spacing ≤ Wavelength ÷ 4
When entering values in the parameter fields the Filter Width should be smaller than 3
wavelengths to avoid distortion. The default (0.9) is recommended.
≥ Wavelength x 2, and
0142530-000 AB KLA-Tencor Confidential 3-47
3/13/09

Scan Recipes - Creating and Editing a Scan Recipe KLA-Tencor P-16+ / P-6 User’s Guide
Scan image before
applying the Y
Lead Screw Filter
Scan image after
applying the Y Lead
Screw Filter
Apply Filter
The Apply Filter option is enabled by default. This means that the filter is applied to
every 3D scan that meets the parameters described in the Y Lead Screw Filter
Constraints.
Wavelength
The Wavelength is the spatial frequency or period of the wave (periodical signal). The
wavelength is the center of the notch filter, the frequency component which is
reduced in the data set. The default value (1000) is set to match the disturbance
artificially induced by the Y lead screw. If the value is changed, the value must be a
positive floating number with a maximum of two decimal points.
Filter Width
The Filter Width is the a value reflecting the number of wavelengths. The default
value for the Filter Width is 0.9 times the wavelength.
Filter Reduction
The default value for the Filter Reduction is 95% of the Wavelength. The Filter
Reduction means that the frequency component at the wavelength is reduced by the
given percentage (e.g., 95% reduction for the default reduction value). The value
must be a positive floating number with a maximum of two decimal points.
Figure 3.38 Y Lead Screw Filter Application
Filters Cursors Menu for a 3D Recipe 3
Introduction 3
The 3D Cursors screen is designed to allow the user to view the cursor coordinates,
and manipulate the cursor position and boundaries by coordinate. (See Figure 3.51.)
3-48 KLA-Tencor Confidential 0142530-000 AB
3/13/09

KLA-Tencor P-16+ / P-6 User’s Guide Scan Recipes - Creating and Editing a Scan Recipe
3D Measurement Cursor 3
The 3D measurement cursor is used to isolate an area of the scan, from which the
measurements designated in the recipe for inclusion in the Analysis data (such as
some of the parameters in General Parameters on page 51 and Roughness and
Waviness Parameters on page 55), can be reported. If no numbers are entered in the
3D Measurement Cursor variable boxes to define the measurement area, the data is
compiled for the entire scan area.
Figure 3.39 3D Measurement Cursor Box
Setting the Cursors: Click and Drag
Cursor Positioning Using
Click-and-Drag
Set the Box Position in the
3D Measurement Cursor
Variable Boxes
The 3D Measurement Cursor box is associated with the Activate Height Tool button
in the Analysis screen tool bar. In the Analysis screen, if the Activate Height
Tool button is clicked on, a box appears that can be resized and moved using the
click-and-drag method. As the box is drug around the scan image, the height of all
data points in the box is averaged with respect to sample plane and reported under
Height in the analysis statistics at the left side of the screen.
After the box is sized and positioned, its position can be entered in the 3D
Measurement Cursor variable boxes.
1. Click the
2. Choose
CALC icon in the toolbar or click Operations in the menu bar
Recalc, to recalculate the parameters and place the cursor locations in
the 3D Measurement Cursor variable boxes.
Setting the Cursors: Manually Entering Coordinates
Manually setting the cursors is accomplished by entering the coordinate position of
the intended measurement box (Active Height Tool) directly into the
Cursors
variable boxes.
3D Measurement
X Start Level 3
This option is used to level the 3D scan with respect to the X starting position of the
scan. It assumes that the entire X=0 length of the scan is on the same plane, having no
holes or steps. If this box is checked, the other options are not used in the leveling
process. This option only levels in one direction, with respect to the X=0 plane.
To activate the
X Start Level option, click in the empty checkbox next to X Start Level.
(See Figure 3.40.)
The 3D scan progresses with each initial trace data point being used for the scan
leveling in the Y direction (using the X=0 point of each scan trace).
0142530-000 AB KLA-Tencor Confidential 3-49
3/13/09

Scan Recipes - Creating and Editing a Scan Recipe KLA-Tencor P-16+ / P-6 User’s Guide
To open the 3D Cursors
window, click Filters Cursors.
Click to put a check
in the check box to
activate the X Start
Level.
Figure 3.40 Recipe Editor - Choosing 3D Cursors
Line by Line Leveling 3
Clicking the Enable Automated Line by Line Leveling option enables the line by
line leveling algorithm to level the surface. There are two ways to set up the leveling:
Default Line Position (see Use Default Line Position [0% 50% 50% 100%]
on page 7-34) and Defined Line Position (see Use Defined Line Positions
on page 7-34).
3-50 KLA-Tencor Confidential 0142530-000 AB
3/13/09

KLA-Tencor P-16+ / P-6 User’s Guide Scan Recipes - Creating and Editing a Scan Recipe
Unit Output 3
Unit Output is designed to give the user an opportunity to determine units of output
for the parameters calculated and to set automatic crossover values for unit changes.
The options here let the user choose the units for the 2D graphical display through the
recipe that is used to generate the scan.
Figure 3.41 Recipe Screen with Unit Output Dialog Box
General Parameters 3
The General Parameters window contains a variety of surface analysis calculations
which are performed on the scan data when the options are chosen before the scan, or
if they are applied to the scan data after the original data has been saved.
For each surface analysis option chosen, a post scan calculation is performed and
displayed on the Analysis screen. To access the
General Parameters button in the Recipe Editor screen. (See Figure 3.42.)
0142530-000 AB KLA-Tencor Confidential 3-51
3/13/09
General Parameters window, click the

Scan Recipes - Creating and Editing a Scan Recipe KLA-Tencor P-16+ / P-6 User’s Guide
To display the General
Parameters options in the
Information Display window
of the Recipe Editor, click
the General Parameters
button.
The 2D options are only for
2D scans and are not
available for 3D scans.
The 3D options are
only for 3D scans.
2D cannot be applied
to 3D scans.
Figure 3.42 General Parameters - Recipe Editor
2D General Parameters (Normal Trace) 3
These parameters represent calculations that are performed using the data from a
scan. If the options are chosen before the scan is performed, and are part of the scan
recipe, the calculations are automatically performed by the software and displayed in
the Analysis screen upon completion of the scan. Parameters from the 2D General
Parameters are for single trace analysis. For 3D scans, the 2D parameters can be
calculated for a cross-section of the 3D scan.
3-52 KLA-Tencor Confidential 0142530-000 AB
3/13/09
 Loading...