

Page 1

Delta X
Counter surveillance sweeping system
User’s Manual
07.11.2016
Page 2

Delta X. User’s Manual
Content
Content .......................................................................................................................................................... 1
General description ....................................................................................................................................... 3
Introduction .............................................................................................................................................. 3
Features ..................................................................................................................................................... 3
Working modes ......................................................................................................................................... 4
Specification .............................................................................................................................................. 6
Supplied set ............................................................................................................................................... 8
Warnings ....................................................................................................................................................... 9
Startup ......................................................................................................................................................... 10
Setup ....................................................................................................................................................... 10
Connections ............................................................................................................................................. 10
Running the software .............................................................................................................................. 10
Settings ........................................................................................................................................................ 12
Calibration / Data .................................................................................................................................... 12
Bands ....................................................................................................................................................... 13
Known signals .......................................................................................................................................... 17
Controls and elements ................................................................................................................................ 21
Menu ....................................................................................................................................................... 21
Signals ...................................................................................................................................................... 21
Updating masks of separate known signals ........................................................................................ 24
Detector .................................................................................................................................................. 24
Spectrum ................................................................................................................................................. 26
Spectrogram ........................................................................................................................................ 27
Persistence .......................................................................................................................................... 28
Waterfall .............................................................................................................................................. 28
Manual modes............................................................................................................................................. 30
Wide-Range Analyzer .............................................................................................................................. 30
Capturing known signals ..................................................................................................................... 30
Test detection and adjustment of thresholds ..................................................................................... 31
Signal Analyzer ........................................................................................................................................ 32
Spectrum ............................................................................................................................................. 33
Demodulation...................................................................................................................................... 33
Physical locating of the transmitter .................................................................................................... 34
Directed microwave antenna MWA-6 ................................................................................................ 36
Adding signals to the Known Signals table .......................................................................................... 36
Detecting modes ......................................................................................................................................... 37
Stop / View Log ....................................................................................................................................... 37
Selecting log and date ......................................................................................................................... 37
Viewing signals and alarms ................................................................................................................. 38
Update Masks .......................................................................................................................................... 40
RF Sweep ................................................................................................................................................. 42
Preparations ........................................................................................................................................ 42
Initial parameters ................................................................................................................................ 43
Detection process................................................................................................................................ 43
Detection distance .............................................................................................................................. 45
Scanning the area ................................................................................................................................ 45
False alarms ......................................................................................................................................... 46
Results of detection ............................................................................................................................ 47
Training ................................................................................................................................................ 47
Guard 24/7 .............................................................................................................................................. 48
1
Page 3

Delta X. User’s Manual
Reaction time ...................................................................................................................................... 48
Initial parameters ................................................................................................................................ 48
Usage of 2 antennas ............................................................................................................................ 49
Antenna connections .......................................................................................................................... 50
Detection process................................................................................................................................ 50
Car Tracker Detector ............................................................................................................................... 50
GPS trackers ........................................................................................................................................ 50
Algorithm of detecting the periodical exchange ................................................................................. 51
Location change algorithm .................................................................................................................. 52
LF Probe ................................................................................................................................................... 52
Elements and controls ......................................................................................................................... 53
AC wires ............................................................................................................................................... 54
Low-voltage wires - Telephone, Ethernet and alarm .......................................................................... 56
Infrared ................................................................................................................................................ 59
Very low frequency ............................................................................................................................. 60
2
Page 4
Delta X. User’s Manual
General description
Introduction
Welcome to the world of professional counter surveillance! The Delta X system will make your searches
quick and easy, while providing highly reliable results. The system’s hardware incorporates a powerful
spectrum analyzer which provides super-fast speed of measurements with extreme sensitivity, while the
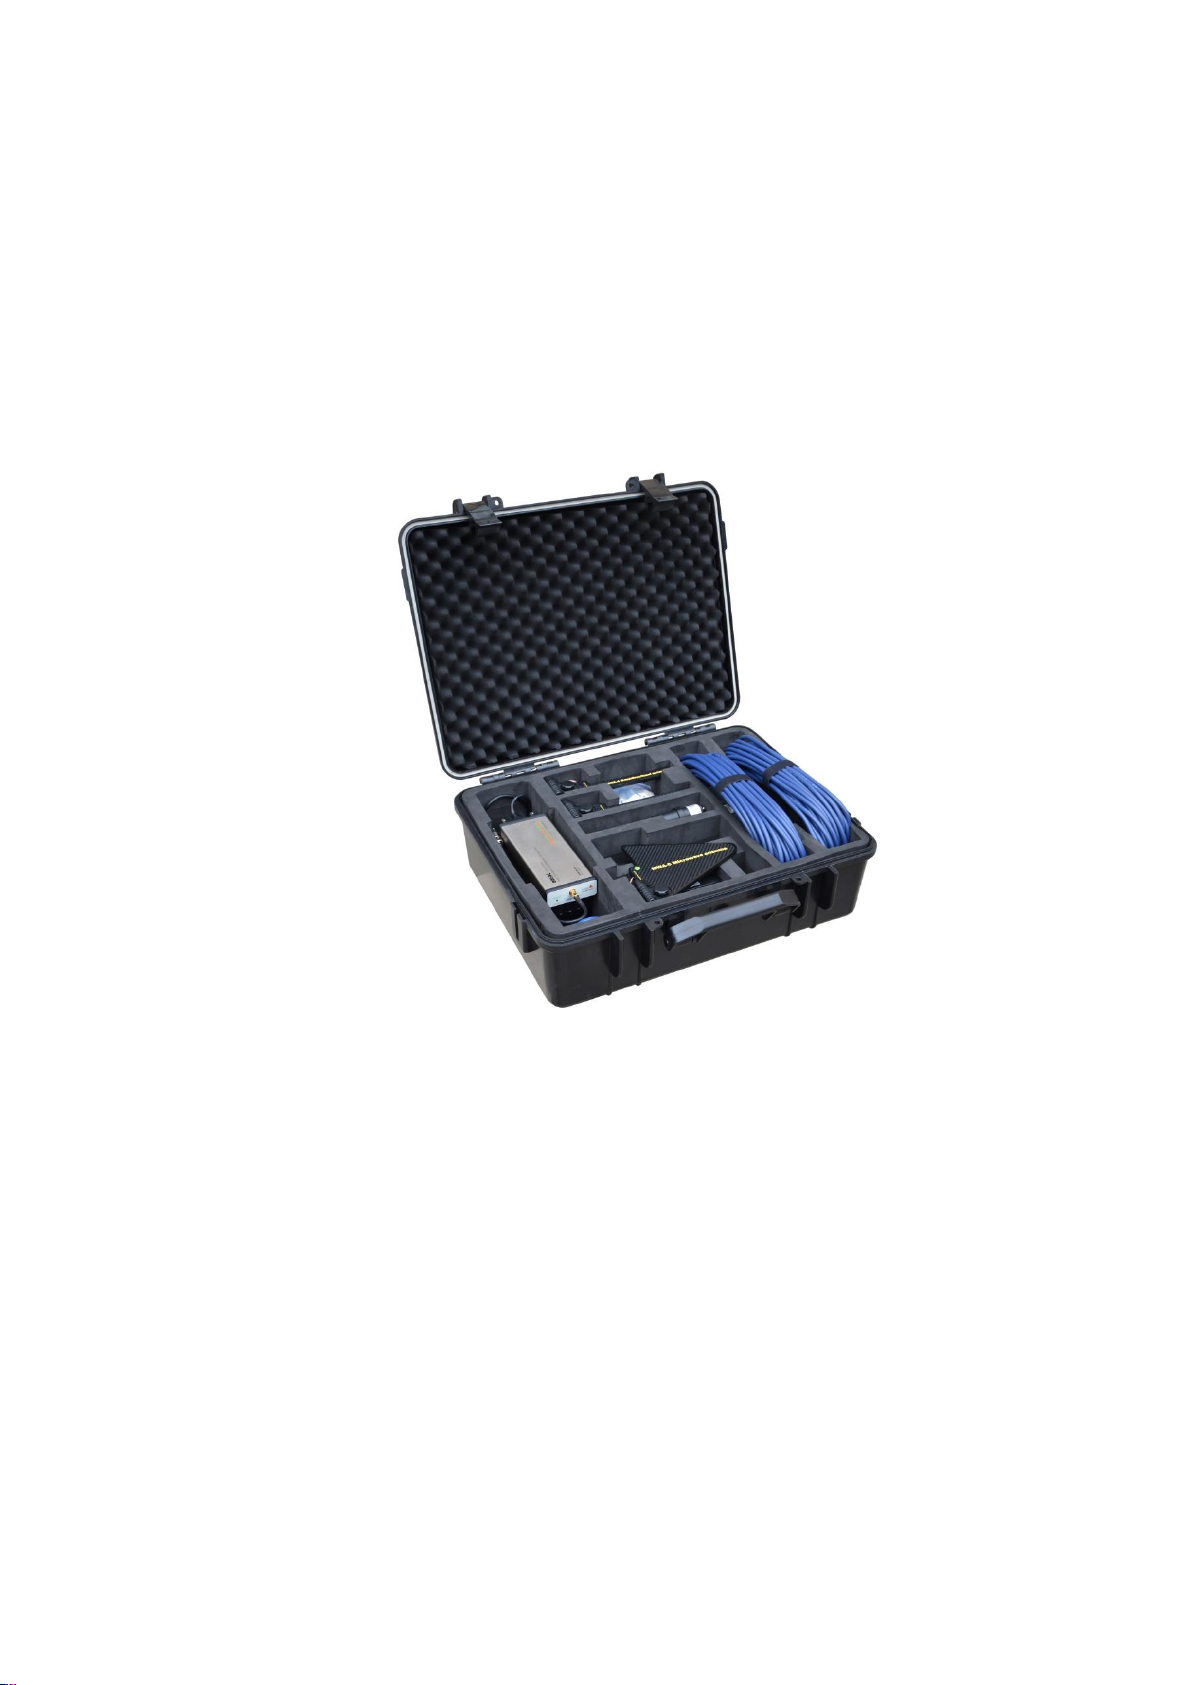
antenna switcher and low-frequency converter extend the system’s functionality. The supplied set
includes the full set of equipment needed for professional detection: omnidirectional antennas, directed
microwave antenna, infrared and electromagnetic probe, cables, adapters, etc.
Features
Quickly and reliably detects all kinds of RF listening devices, including analog, digital, constantly
existing and intermittent, sending audio or video, with or without encryption
Finds hidden surveillance devices employing the digital standards GSM, 3G, 4G/LTE, Bluetooth,
Wi-Fi, DECT, etc.
Detects illegal information transmission in AC, telephone, Ethernet, alarm and other wires as
well as in the infrared range
Can work in instant detection mode, guarding mode, locating and the car tracker detection
Has 20-50 times higher sensitivity comparing to conventional RF detectors
Can monitor the RF environment 24 hours a day with data logging
Capable of detecting covert bugging devices with accumulation function and transmitters
hidden within the spectrums of other signals
Supports storage of an unlimited quantity of signals. Full information is stored in the log and can
be reviewed during the detection or later. Multiple logs are supported.
Demodulation of audio in FM, AM, USB, LSB, CW (adjustable BW 3…240 kHz)
3
Page 5

Delta X. User’s Manual
Powered from the laptop’s USB
Exclusive features of the 2000/6 Real-Time version:
High update rate, 2000-3000 MHz per second
Frequency range 40 kHz – 6000 MHz
Detected signal’s existence time: 2-3 seconds
Instantly detects digital signals with short bursts
Can detect and locate the transmitter simultaneously
Exclusive features of the 100/12 version:
Update rate 100 MHz per second
Frequency range 100 kHz – 12400 MHz
Detected signal’s existence time: 60-120 seconds
Detects digital signals with short bursts by accumulating data
Exclusive features of the 100/4 version:
Update rate 100 MHz per second
Frequency range 40 kHz – 4400 MHz
Detected signal’s existence time: 45 seconds
Detects digital signals with short bursts by accumulating data
Functions of the software:
Rich visual representation: Spectrogram/Persistence, Waterfall, Alarms graph
The Known Signals table allows the system to reject TV, FM and other ‘friendly’ signals while
maintaining high sensitivity to unknown signals.
The Detector allows the operator to perform location of a bugging device with both visual and
audio notification
The Alarm Threshold decreases the false alarm rate
The Hold Max Danger feature selects and shows the strongest signals for their location as the
system is moved during detection
The Update Mask procedure allows the operator to quickly adjust the system to the local RF
environment on order to reject safe signals
Sorting and filtering is supported in the Signals table
The Report function allows the operator to export all obtained information about the desired
signals
Is easily localizable to any language
Working modes
o Stop / View Log
Review of the detection results stored in the log. The Signals table, Spectrogram, Waterfall and
Alarms graph give full information about the detected signals and alarm events
o Update masks
Quick preparation for detection – the system automatically accumulates the broadcasting and
other safe signals existing in the area in order to pass them during the subsequent detection
4
Page 6

o RF Sweep
The main detection mode. Provides maximum reaction time and the highest sensitivity. The
operator can move the system or its antenna during the detection.
o Guard 24/7
Rejection of short transmissions and usage of two antennas reduces false alarms in this mode.
Suitable for 24 hour detection without unwanted false alarms
o Car Tracker Detector
Detection of vehicle mounted GPS trackers transmitting the coordinates via mobile networks
o LF Probe
Checking of AC, Ethernet, Telephone and Alarm wires and the infrared for the presence of
unwanted bugging signals
o Wide-Range Analyzer
Manual mode for preliminary studying of the RF environment
o Signal Analyzer
Analysis, demodulation and physical locating of detected signals
o Settings
Includes the general settings and information about the mobile networks and wireless bands
existing in the area as well as the known signals table
Delta X. User’s Manual
5
Page 7
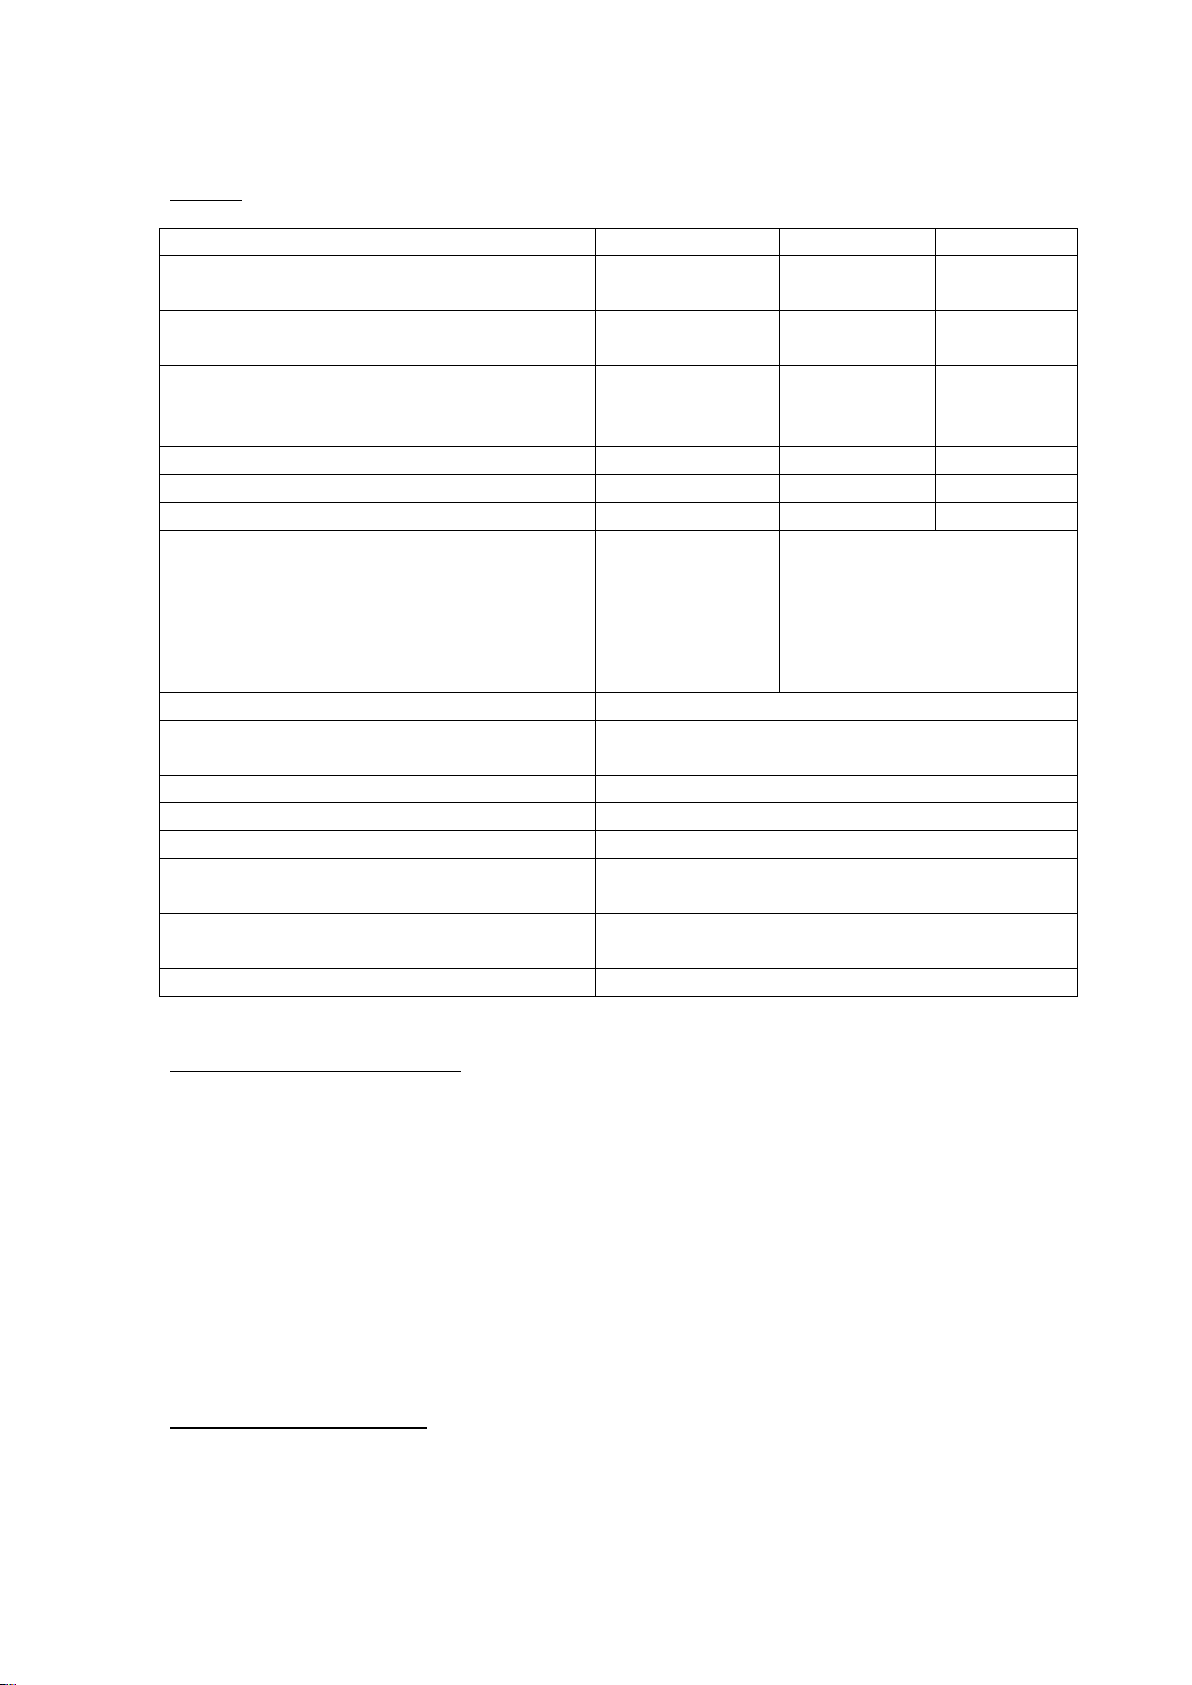
Specification
2000/6 Real-Time
100/12
100/4
Update rate
2000-3000
MHz/sec
100 MHz/sec
100 MHz/sec
Frequency range
40 kHz - 6000
MHz
100 kHz –
12400 MHz
40 kHz –
4400 MHz
Time of detection
(Minimal time of signal’s existence needed for
its detection)
2-3 sec
60-120
seconds
45 seconds
Spectrum resolution
9 kHz
15 kHz
15 kHz
Occupied disk space per 24 hours
12 Gb
1 Gb
0.5 Gb
Temperature Range
0°C to +65°C
0°C to +50°C
0°C to +70°C
Demands on computer
3rd gen. or newer
Intel dual/quad
Core i-series
1 x USB 3.0
2 x USB 2.0
Windows 7, 8 , 10
Intel® Atom™ N2600 or Intel®
Core™ i3
2 x USB 2.0
Windows 7, 8, 10
Displayed dynamic range
-90…-10 dBm
Displayed spectrum spans
0.5, 1, 2, 5, 10, 25, 50, 100, 200, 500, 1000, 2000,
3000, 6000 MHz
Spectrum graphs
Spectrogram, Waterfall
Spectrogram’s displayed data
Persistence, Live, Max, Threshold
Detector’s modes
Wide-Range, Signal
Fields of ‘Signals’ table
Frequency, Bandwidth, Name, dbm Level, dbm
Peak Level, Danger Level, Peak Danger Level
Fields of ‘Bands’ table
Begin, End, Name, Type, Threshold, Priority,
Tracker detection
Fields of ‘Known Signals’ table
Frequency, BW, Name, Modulation
General
Delta X. User’s Manual
ODA-4 omnidirectional antenna
Can be used with any RF equipment, including receivers, spectrum analyzers, RF detectors, etc.
Is capable of receiving the entire frequency range 40 kHz – 6000 MHz with increased sensitivity
in the range of 80 MHz - 4000 MHz
Tripod mountable (tripod supplied)
The tripod can convert to a hand-held unit for manual probing (locating procedure)
Connector type: BNC
80 cm cable
Dimensions (without tripod) 20 x 3.5 x 0.6 cm
Mode of use: receive
Indoor use only
MWA-6 microwave antenna
Can be used with any RF equipment, including receivers, spectrum analyzers, RF detectors, etc.
Is particularly good for the location of GSM, CDMA, 3G, 4G (LTE, Wi-Max), Wi-Fi 2.4GHz,
Bluetooth, Wi-Fi 5GHz, DECT and other digital transmissions
6
Page 8

Delta X. User’s Manual
Frequency range 800-6500 MHz
Directed (log-periodic)
Typical forward gain: 6 dBi
Tripod mountable (tripod supplied)
The tripod can convert to a hand-held unit for manual probing (locating procedure)
Connector type: SMA
80 cm cable
Dimensions (without tripod) 18 x 14.5 x 0.7 cm
Mode of use: receive
Indoor use only
MWA-12 microwave antenna
Can be used with any RF equipment, including receivers, spectrum analyzers, RF detectors, etc.
Is particularly good for locating digital transmissions above 2GHz: 4G (LTE on the upper ranges,
Wi-Max), Wi-Fi 2.4GHz, Bluetooth, Wi-Fi 5GHz; For tracing other microwave sources, including
bugging devices
Frequency range 2000-12000 MHz
Directed (log-periodic)
Typical forward gain: 8 dBi
Tripod mountable (tripod supplied)
The tripod can convert to a hand-held unit for manual probing (locating procedure)
Connector type: SMA
80 cm cable
Dimensions (without tripod) 8 x 6 x 0.7 cm
Mode of use: receive
Indoor use only
MLP-LINE - electromagnetic probe
Detects electronics emitting an electromagnetic field
Frequency range 50 kHz – 4 MHz
Omni-directed 360°
Tripod mountable (tripod supplied)
The tripod can convert to a hand-held unit for manual probing (locating procedure)
Connector type: MiniDIN8
120 cm cable
Dimensions (without tripod) 18 x 6.2 x 3 cm
AC-LINE – high voltage probe
Used in the Delta X for the detection of illegal signals in 110V/220V wires
Frequency range 50 kHz – 10 MHz
Compatible with 110V and 220V
Connector type: MiniDIN8
120 cm cable
Dimensions 8 x 7 x 3 cm
Telephone/low voltage probe
Used in the Delta X for the detection of illegal signals in Ethernet, telephone, alarm and other
low-voltage wires
7
Page 9
Delta X. User’s Manual
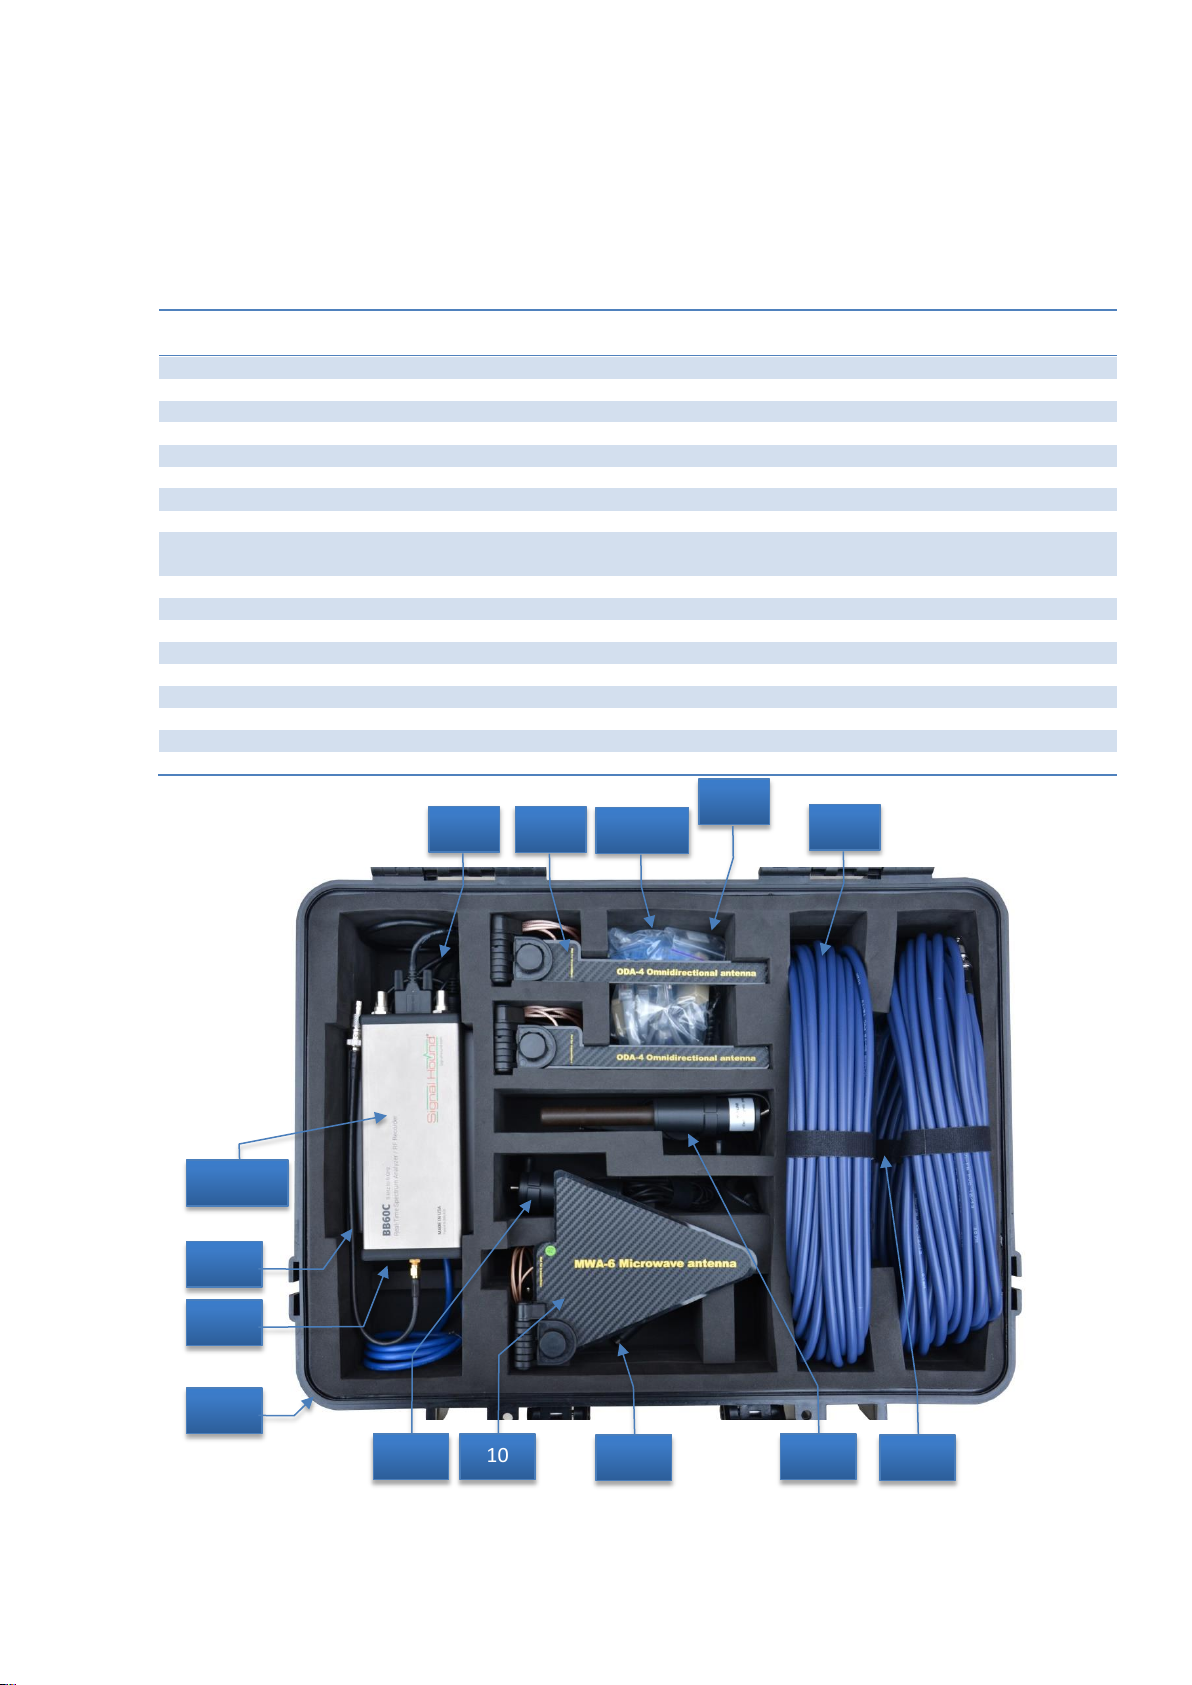
Item
2000/6
Real Time
100/12
100/4
1. Spectrum analyzer SignalHound BB60C
1
2. Spectrum analyzer SignalHound USB-SA124B
1
3. Spectrum analyzer SignalHound USB-SA44B
1
4. Software Delta X 1.0 on the USB flash memory
1 1 1
5. USB cable with the incorporated chip
1 1 1
6. DS-Line 2 Pro - antenna switcher/LF converter
1 1 1
7. Carry case
1 1 1
8. ODA-4 - omnidirectional antenna
2 2 2
9. Coaxial extension cable 20 m BNC male to BNC
female
2 2 2
10. MWA-6 - microwave antenna
1 1 1
11. MWA-12 - microwave antenna
1
12. AC Line - high voltage probe
1 1 1
13. Low voltage probe with alligator connectors
1 1 1
14. In-line modular adapter
1 1 1
15. IR Line - infrared probe
1 1 1
16. MLP Line - very low frequency probe
1 1 1
17. Probe extension cable
1 1 1
18. Cable BNC to SMA
1 1 1
1 / 2 / 3
4
5
6
7
8
18
10
12
13, 14
15
16
17
9
Frequency range 50 kHz – 10 MHz
Maximum voltage 100V
Connectors: 1) modular telephone plug RJ-11; 2) ‘alligator’ connectors
Extendable spring cable, up to 6 meters
Supplied set
8
Page 10

Delta X. User’s Manual
Warnings
The spectrum analyzer’s input attenuator and front end switches are sensitive to Electro-Static
Discharge (ESD) and have a damage level just above +20 dBm peak. Cases of breakage due to this reason
will not be accepted under the product’s warranty.
Some common events which may lead to the front end damage and the loss of warranty include:
Applying more than +20 dBm peak power, such as an antenna exposed to a radar pulse or used
near a signal exceeding 2 Watt (nonlinear junction detector, transceiver)
ESD from a passive antenna, either from discharge to an antenna element, or from connecting a
large antenna or cable which has built up a static charge
Connecting to an active antenna which is already powered up
The general recommendations are:
Never connect any signals or outputs of active equipment directly into the Input 50 Ohm
connector of the spectrum analyzer
Do not use active antennas
Do not turn on 2-5 Watt VHF/UHF transceivers and NLJD (nonlinear junction detectors) in a
close proximity to the antenna
9
Page 11
Delta X. User’s Manual
Startup
Setup
Use a laptop in accordance with the specifications above. Insufficient processing power may result in
unstable operation.
Run the Delta X Setup.exe on the supplied USB flash drive. The software and the drivers will be installed
automatically.
Connections
Connect the spectrum analyzer to the computer using the supplied USB cable:
BB60A/C is connected to one USB 3.0 slot (signal cable) and one USB 3.0 or 2.0 slot (power
cable)
USB-SA124A/B is connected to 2 x USB 2.0 or 3.0 slots (one signal and one power cable)
USB-SA44A/B is connected to USB 2.0 or 3.0 slot
To make sure the spectrum analyzer’s drivers are installed correctly, install the analyzer’s proprietary
Spike software and run it. The software should detect the device and start measurements. The Spike
software may take longer to start if the spectrum analyzer is being connected to the computer for the
first time. For some models of analyzers, a connection to the internet may be needed when the Spike
software is started for the first time (some calibration data files should be downloaded).
Connect the DS-Line 2 Pro antenna switcher / LF converter to the USB 2.0 or 3.0 with the help of
the supplied cable with the incorporated controller. The device should power on at this
moment, switching its inputs in turn as a confirmation.
Connect the ODA-4 antenna to the RF input of the spectrum analyzer marked as ‘Input 50 Ohm’.
Use the BNC-to-SMA adapter.
The equipment is now ready to start.
Running the software
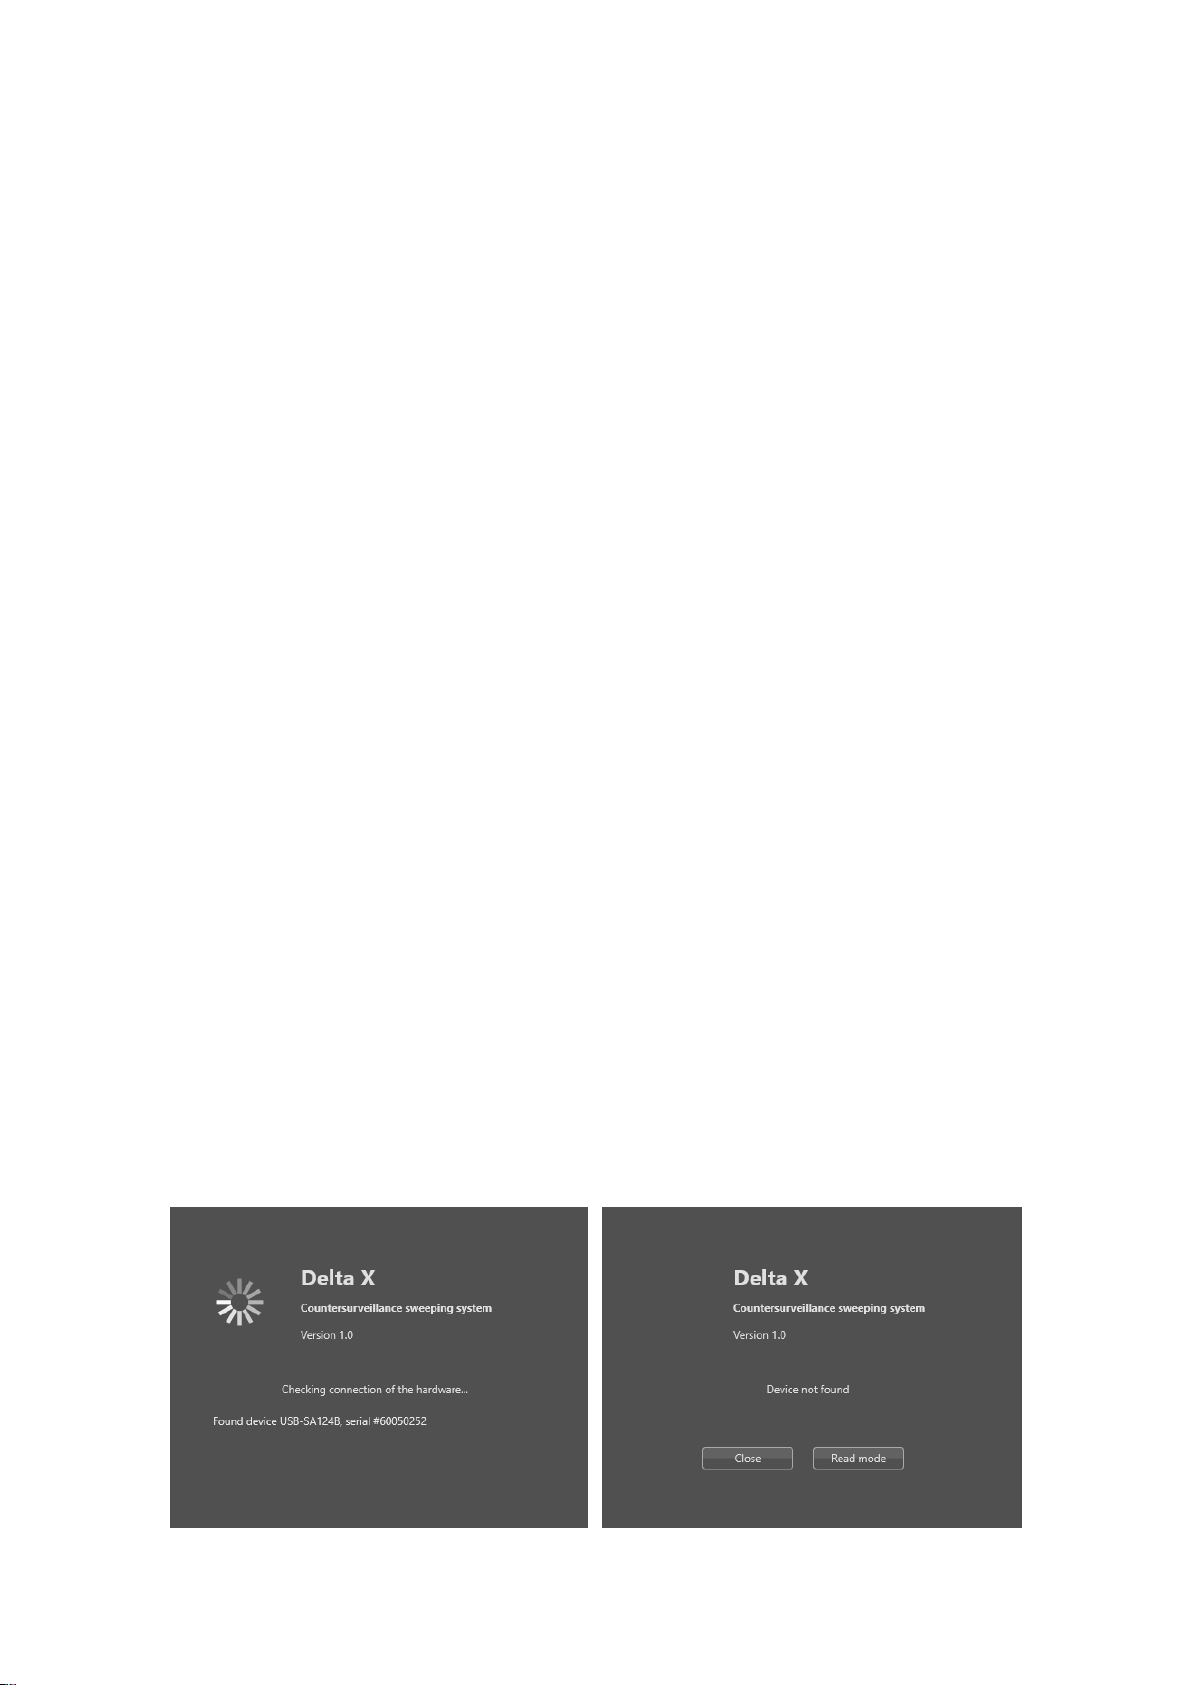
Start the Delta X software. The Startup window will appear on the screen and the procedure of finding
the connected hardware will be performed.
10
Page 12

Delta X. User’s Manual
In case of detecting the necessary equipment (the cable with the incorporated controller and the
spectrum analyzer) the ‘Found device’ will appear and the main window will open.
If there is no connection, there will be a ‘Device not found’ message. The software can be closed or run
in the Read mode for reviewing the logs and changing settings.
11
Page 13
Delta X. User’s Manual
2000/6 Real-Time
100/12
100/4
Occupied disk space per 24 hours
12 Gb
1 Gb
0.5 Gb
Settings
When the software is started for the first time, some required settings are missing. The application will
ask the operator to perform calibration and fill the ‘Bands/Known signals’ tables by entering to the
Settings automatically.
The settings should be changed in the following cases:
Calibration should be performed once, for the first time
Bands should be set individually for each country, state or region (area)
Known signals should be set individually for each country, region (area) and city
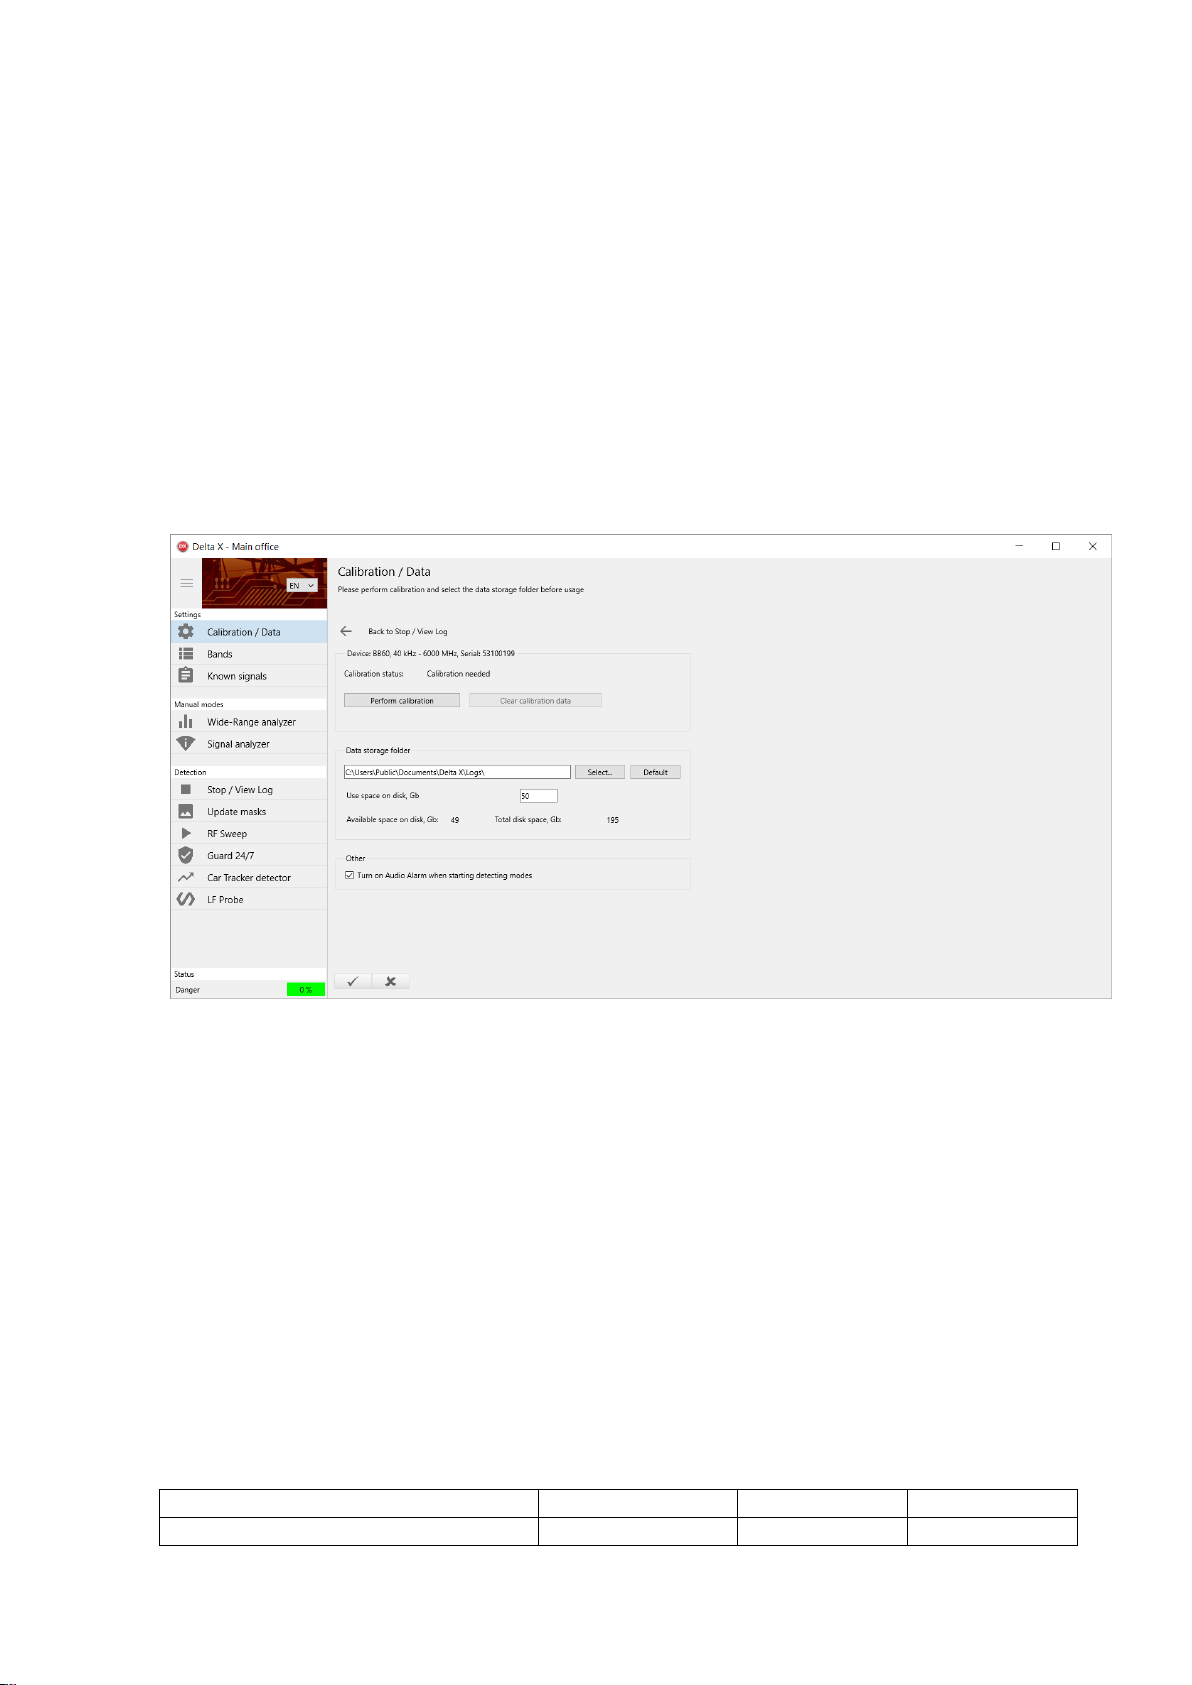
Calibration / Data
Calibration is needed for the compensation of the changing dynamic range on different frequencies,
thus making the spectrum traces smoother and more understandable.
Perform the calibration once on each computer the system is being used on.
Disconnect the antenna or cable from the spectrum analyzer’s RF input (marked as ‘Input 50 Ohm’) and
press the ‘Perform calibration’ button. The procedure will finish in few minutes. The antenna should
then be connected again.
If necessary, the data storage folder can be changed. In the case of changing the data storage path after
using the system, it is recommended to manually delete the previous folder to free up disk space.
The ‘Use space on disk’ allows the operator to limit the space occupied by the logs. After reaching the
limit the Delta X software will automatically delete the older logs when it is in detection mode.
Take into consideration the occupied disk space per 24 hours of detection:
12
Page 14
Delta X. User’s Manual
Add
record
Delete
record
Apply
changes
Discard
changes
If you are planning to use the Delta X system in the Guard 24/7 mode, we suggest selection of a laptop
with an increased disk space. To speed up the data writing and reading we suggest using a high speed
SSD.
Please note that the logging of data during the detection may be suspended if the selected disk does not
have free space.
With the ‘Turn on audio when starting detecting modes’ on the software will activate the Audio alarm
function automatically each time the detection is started.
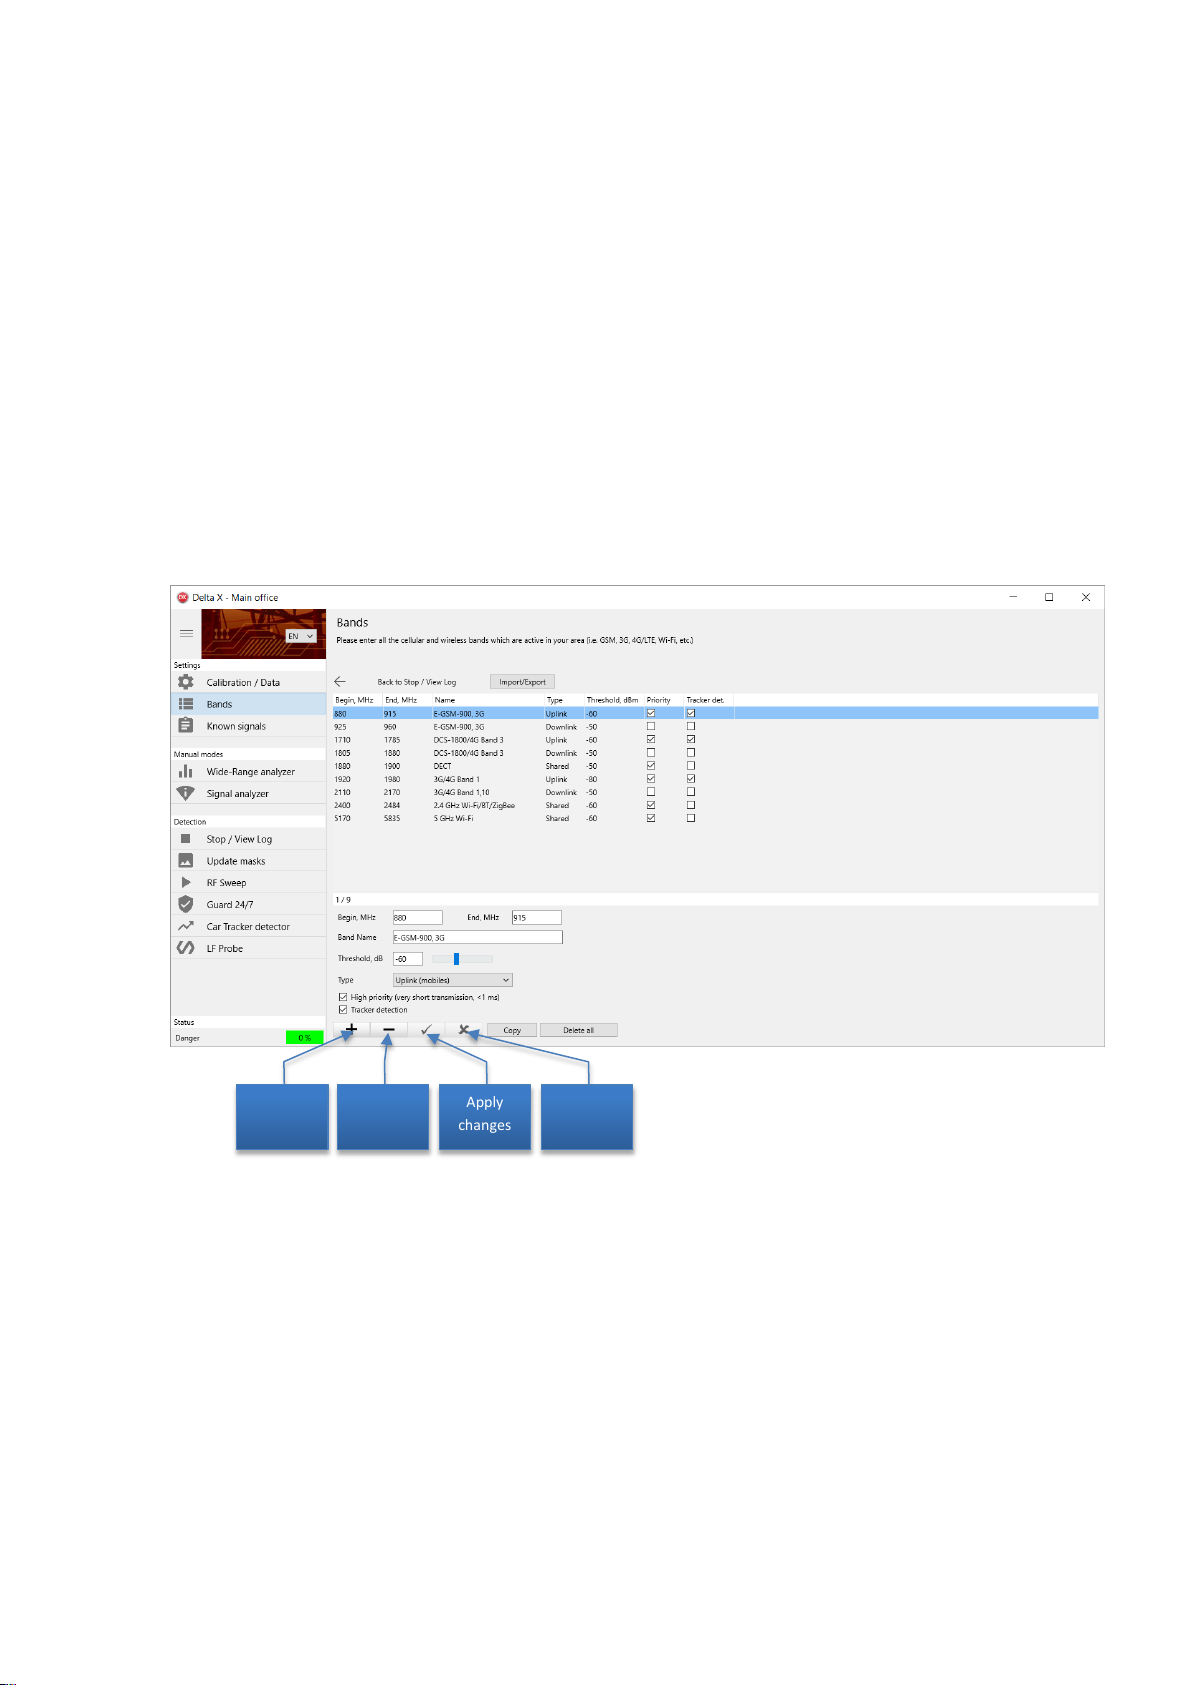
Bands
The Bands table contains information about the mobile and wireless bands existing in the country or
region of use.
The software handles mobile and wireless bands in a special way, significantly decreasing the quantity of
unwanted signals and simplifying the detection process. Therefore the information in the table is very
important for the correct working of the system.
The mobile networks and wireless bands can be divided into the following groups:
GSM
CDMA/3G
4G/LTE
Wireless bands and DECT
13
Page 15
Delta X. User’s Manual
GSM
UMTS
4G/LTE
900 (E-GSM)
Band 1 (2100)
Band 1 (2100)
1800 (DCS)
Band 8 (900)
Band 3 (1800 +)
Import of
one record
Import of all
records
External file
name
The bands can be entered and edited manually, but it is recommended to use the Import/Export
function to quickly import already prepared data. Use the data files supplied on the flash drive.
There are files for specific countries, containing the general lists of mobile and wireless standards.
If a country data file is present, it can be quickly imported using the Import/Export function. If there is
no data file for your country, use the files listing the mobile and wireless standards and import the
bands which are used in your country.
The following files are supported with the system and written to the flash drive: ‘GSM Bands’, ‘CDMA
Bands’, ‘3G Bands’, ‘4G LTE Bands’ and ‘Wireless Bands’.
Gather information about the mobile standards and bands used in your country from the internet or by
contacting the corresponding authorities and import the necessary bands into the Delta X software.
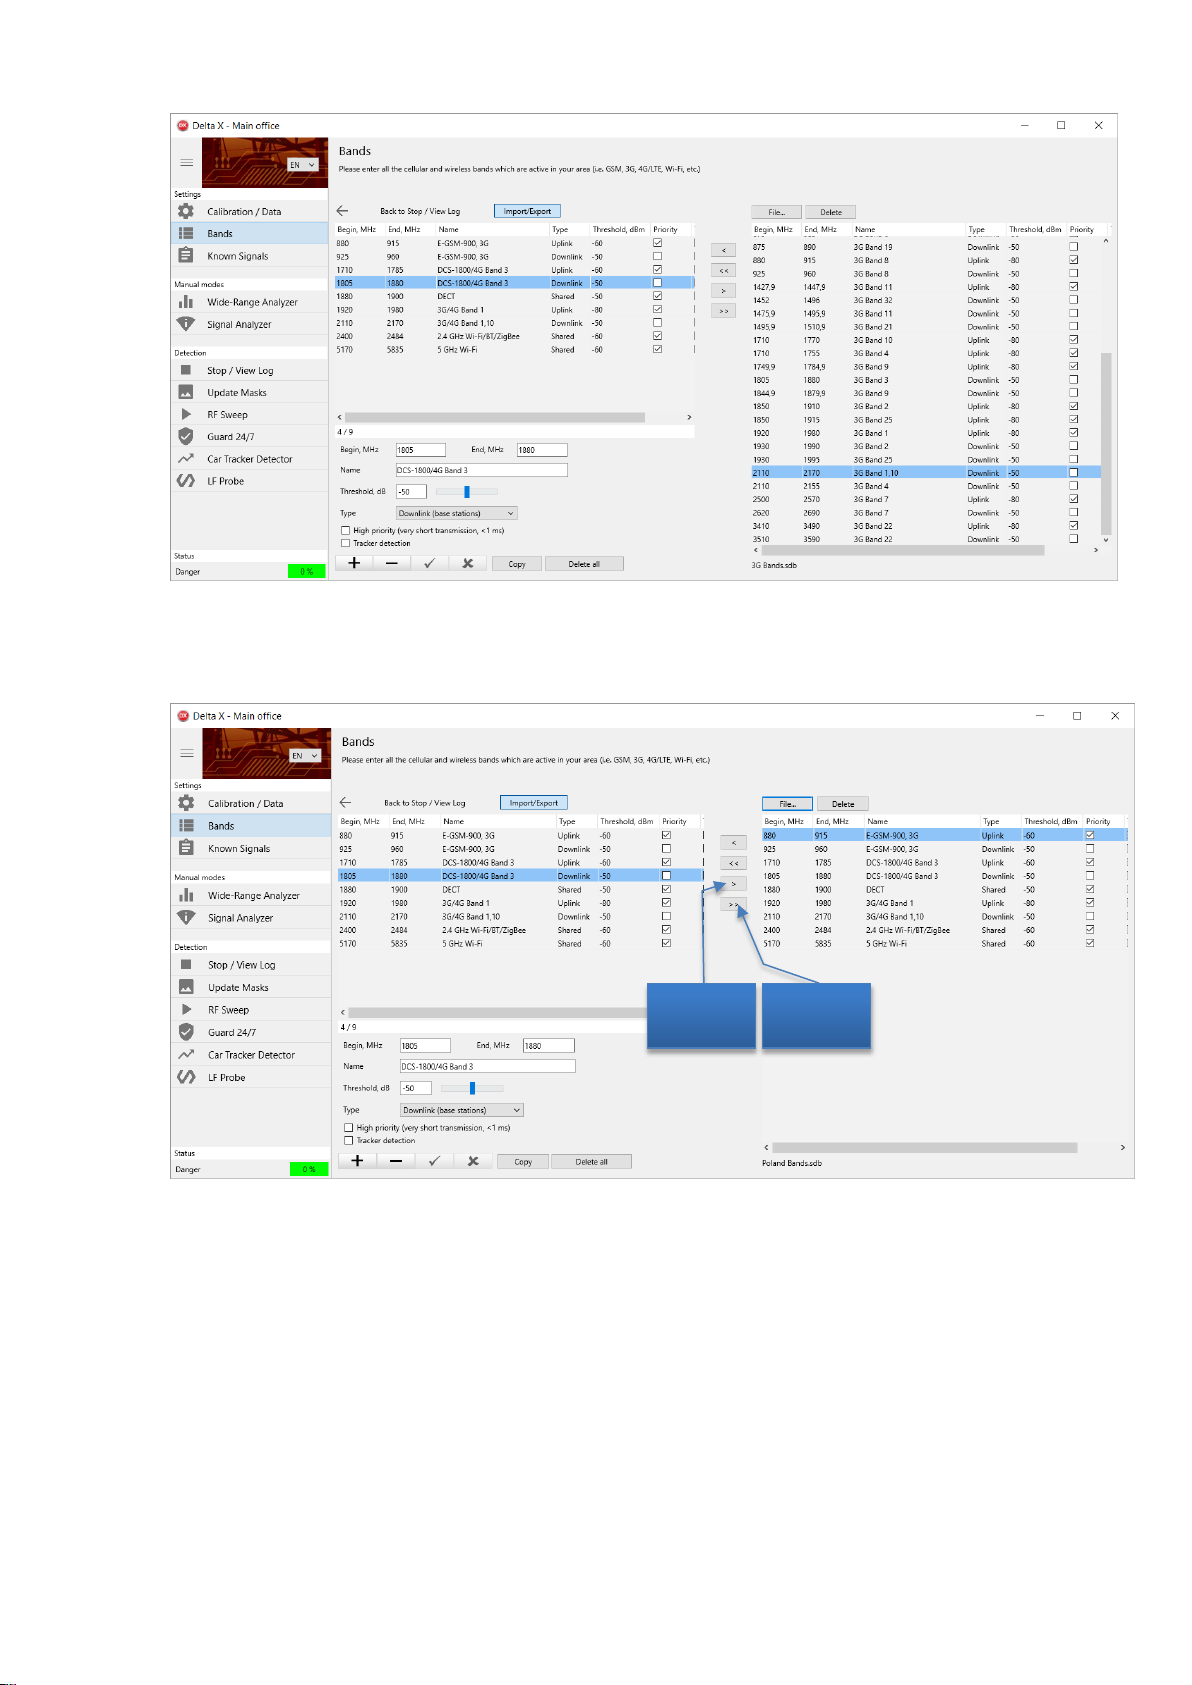
Below is an example of creating the Bands table for Poland. The internet mentions the following
information about the mobile standards used in Poland:
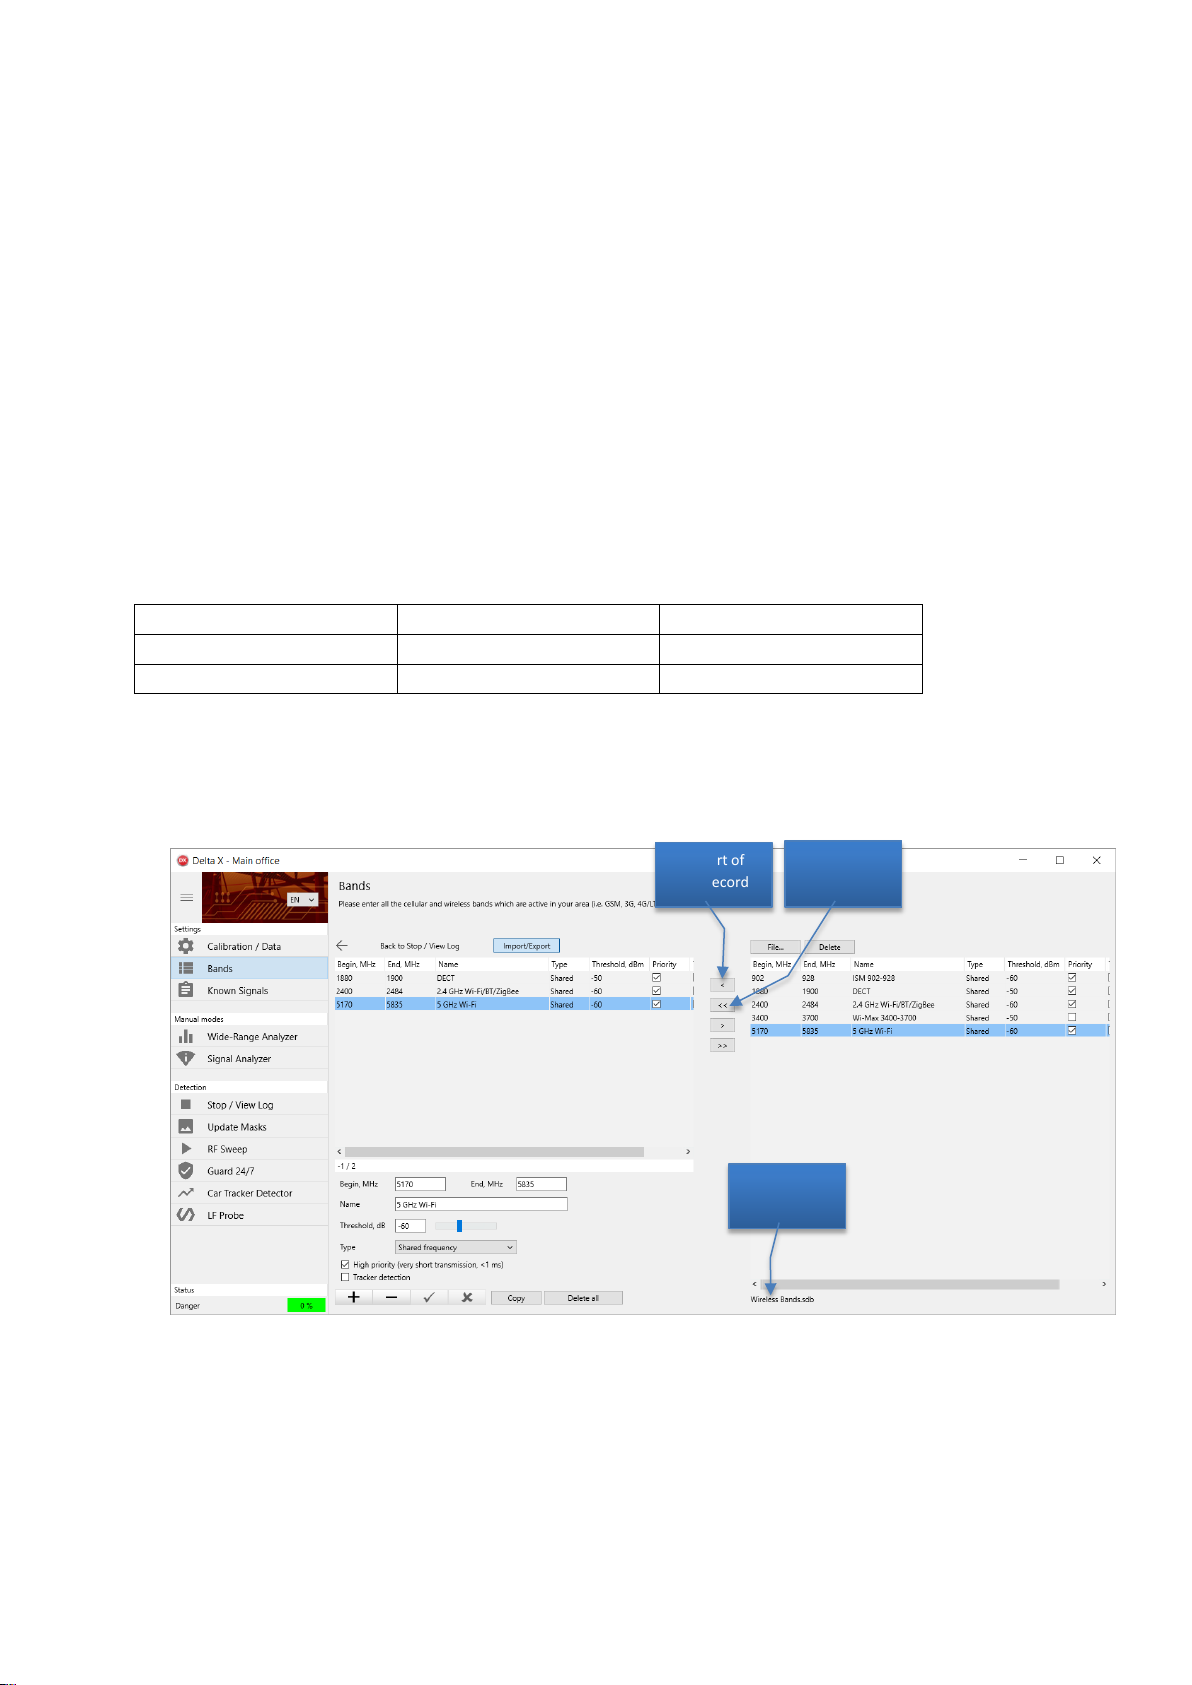
1. Clear the Bands table by pressing the Delete All button and press the Import/Export button
2. Press the File button, select the path to the flash drive and open the ‘Wireless Bands’ file. Import
the ‘DECT’, ‘2.4 GHz Wi-Fi’ and ‘5GHz Wi-Fi’ bands by pressing the < button:
3. Open the ‘GSM Bands’ file and import the ‘E-GSM’ Uplink/Downlink bands and the ‘DCS-1800’
Uplink/Downlink bands:
14
Page 16
Delta X. User’s Manual
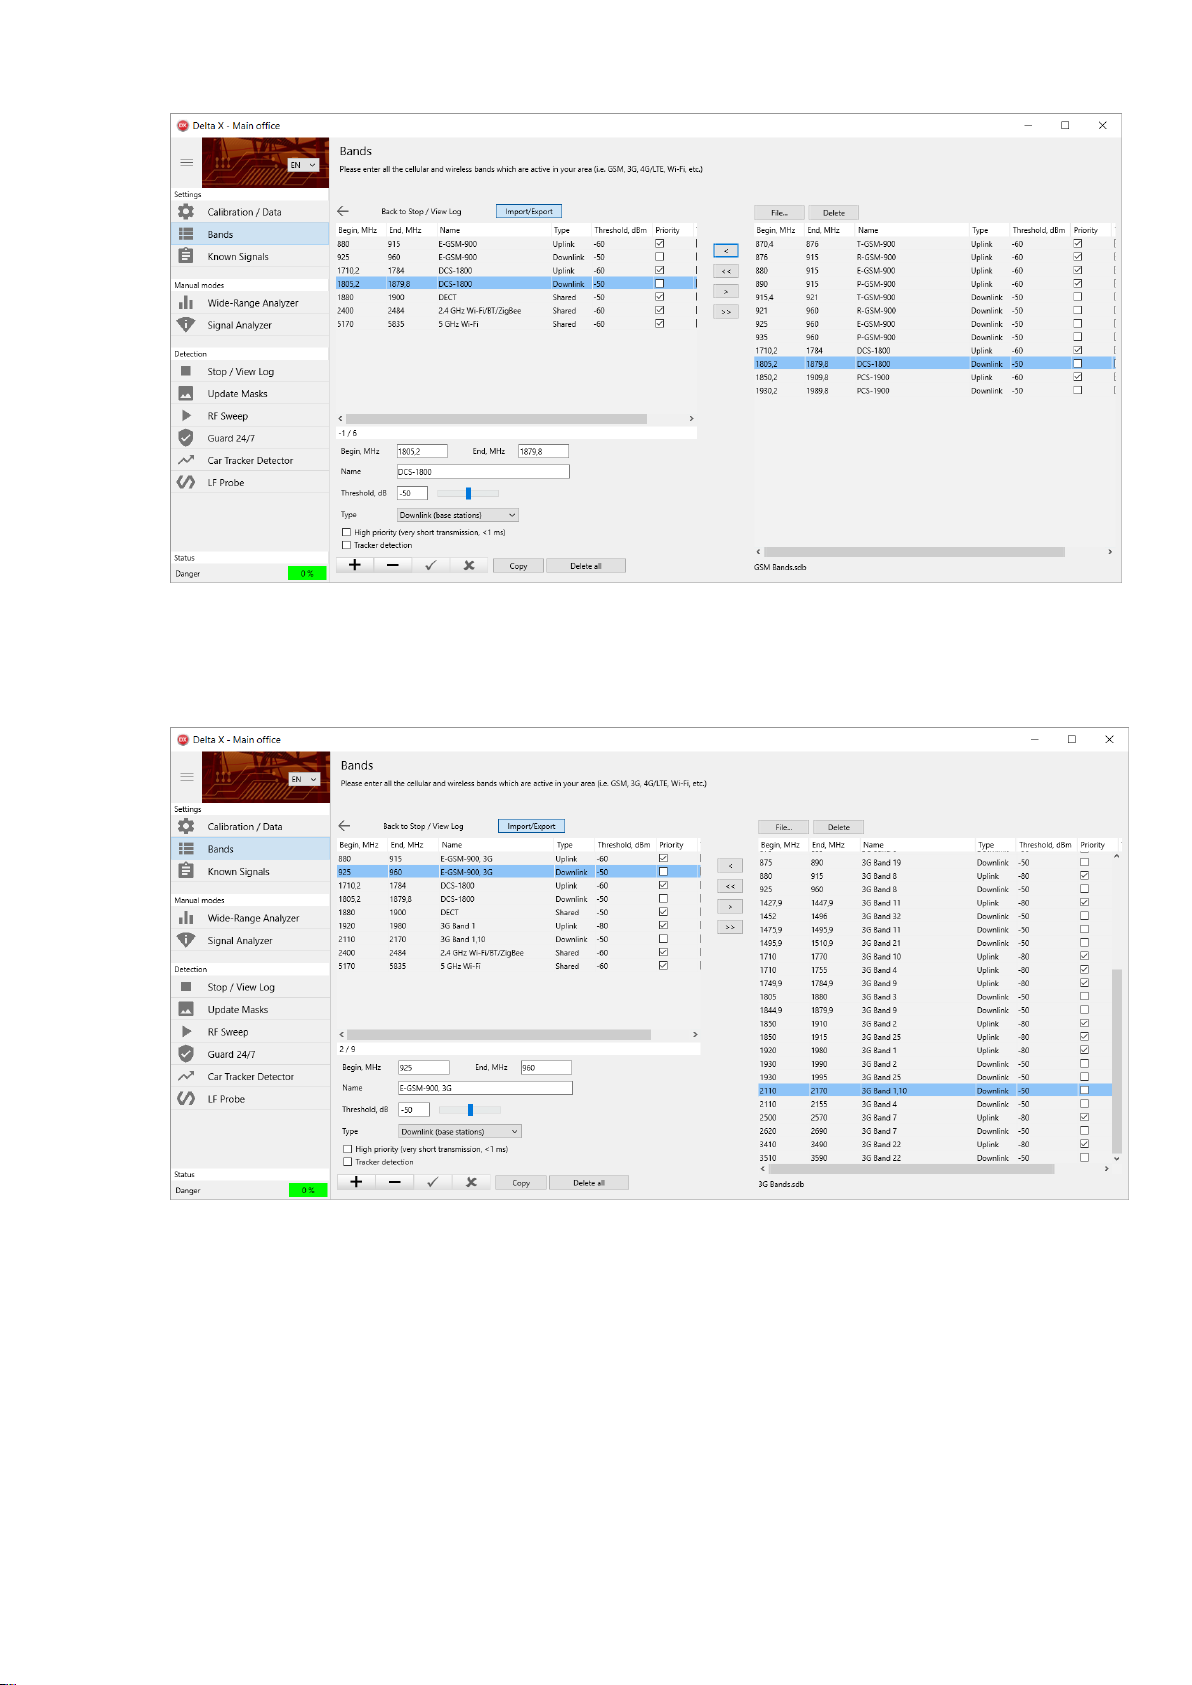
4. Open the ‘3G Bands’ and import the ‘Band 1’ Uplink and Downlink. It is also necessary to import the
‘Band 8’ Uplink and Downlink but since they completely coincide with the already existing ‘E-GSM-900’,
rename the ‘E-GSM-900’ to ‘E-GSM-900, 3G’. Rename both the Uplink and Downlink:
5. Open the ‘4G (LTE) Bands’. Since the ‘4G/LTE Band 1’ coincide with the ‘3G Band 1’, rename the
existing ‘3G Band 1’ to ‘3G/4G Band 1’. Rename both the Uplink and Downlink.
Since the ‘4G/LTE Band 3’ coincides with the existing ‘DCS-1800’, rename the existing band to ‘DCS1800/4G Band 3’ (both downlink and uplink). Adjust the frequency edges slightly to include both the
‘DCS-1800’ and ‘4G Band 3’:
15
Page 17
Delta X. User’s Manual
Export all
records
Export one
record
6. Press ‘File’ and enter ‘Poland Bands’ to create a new file. Then, export all the records using the >>
button.
Press the ‘Import/Export’ to leave the mode. Now, all the collected band data for Poland is stored in the
external file and is available for future use.
In case of using the Delta X in another country, the Band table’s records can be quickly imported from
the corresponding country data file or from the files containing all bands for each standard.
If manual editing in the Bands table is needed, use the corresponding navigation buttons to add and
delete records, apply and discard changes.
There are the following types of bands:
Uplinks: Used by mobile devices for sending information to base stations
16
Page 18

Delta X. User’s Manual
Downlinks: Used by base stations for sending data to the mobile devices
Shared frequency: The band is used by both sides of communication simultaneously. This
technology is used by some 4G/LTE bands, Wi-Fi, Bluetooth, ZigBee and DECT.
There are the following rules for bands:
Both the uplink and downlink bands should be imported or created according to the mobile
standard
Do not create nor import the bands which are absent in your country/state
No empty records are allowed
No empty names are allowed. At least a short description should be assigned to each pair of
bands.
No repeating of names
Uplink and downlink’s names for the same band should coincide
The bands cannot overlap. In case of overlapping they should be combined in one record. For
example, if 2 bands 1700-1750 MHz and 1700-1770 MHz are used in your country, they should
be combined in one band 1700-1770 MHz.
The Begin and End fields are the edges of the band.
The Name field is obligatory and should be unique for each pair of bands, consisting of uplink and
downlink.
The Threshold is the level which, when exceeded by a signal, makes this signal ‘dangerous’ and
produces the alarm.
The main task of the system is monitoring the uplinks and shared bands since they are used by potential
bugging devices for transmitting. Therefore the threshold for the ‘uplinks’ and ‘shared’ should be
typically lower than for the ‘downlinks’ to provide a higher sensitivity. The parameter can be adjusted
later in the working modes.
The High Priority parameter should be set for the uplink bands of the standards which have short
transmission time or timeslots. These are GSM, 3G, 4G, DECT and Wi-Fi. When fetching the spectrum
trace, the Delta X system measures the priority bands longer in order to capture the short bursts.
The Tracker Detection parameter should be set for the uplinks of the mobile networks so they are
scanned in the Car Tracker Detector mode.
Known signals
The Known signals table contains the signals of FM and TV broadcasting, as well as the other
continuously existing signals in your area: VHF/UHF channels, police/fire/municipal, trunking, etc.
Advantages of using the Known signals table:
Fewer false detections
Higher general detection sensitivity
More information for the operator
17
Page 19
Delta X. User’s Manual
Representation
mode
Add
record
Delete
record
Apply
changes
Discard
changes
The software decreases the danger level of the known signals so they do not create unwanted alarms.
As a result, weaker but potentially dangerous signals can be detected easier. Additionally, the known
signals are automatically marked, so that the operator can distinguish between the known ‘friendly’
signals and unknown, potentially dangerous, signals.
Therefore it is strongly recommended to fill the Known signals table before starting work.
The Known Signals table is opened automatically after the software starts if it is empty.
Spectrogram
The video and audio channels of TV broadcasting do not change across the country. Therefore they can
be easily imported from the supplied external files. There are some formats of video signal. For each
format there is a separate data file. The data file’s name describes what countries it is suitable for.
When importing, select the file which corresponds to your country. If during further work you observe
the captured TV signals not marked as ‘known’ (without a name), this can mean use of the incorrect
data file, not suiting your country.
To import the external data file:
1. Press the Import/Export button, Press the ‘File’ button, select the path to the flash drive and select
the file.
2. Press the << button to import all the signals:
18
Page 20

Delta X. User’s Manual
3. Close the data file by pressing the Import/Export again.
Each TV signal consists of 2 carriers – video and audio, as it is shown on the illustration of PAL signal’s
spectrum below:
Therefore the external data file contains a pair of signals for each of the TV channels.
The external data file contains all the TV channels, while there are countries where some of TV channels
are reassigned to other tasks, for example, for FM broadcasting, Digital Television or mobile
communications. If a known TV signal’s edges coincide or overlap with a band from the Bands table, it
means that in your country this TV channel was reassigned for mobile communications. In this case or
when within the edges of known TV signal you observe other types of signals, the known TV signal
should be deleted from the Known signals table.
Unlike the video and audio channels of TV broadcasting (which can be imported from the file quickly),
the FM broadcasting stations and VHF/UHF channels will vary depending on the city and area, therefore
it is recommended to capture them using the Wide-Range Analyzer manual mode, then to study and
add to the Known Signals table in the Signal Analyzer mode. It is also possible to add and edit the known
signals right in the Known Signals table using the navigation buttons: Add record, Delete, Apply Discard
and Copy.
19
Page 21

Delta X. User’s Manual
Rules for editing the known signals:
No repeated names
No empty names
The starting frequency F1 should be less than the ending frequency F2
The bandwidth cannot be 0
The known signals can be exported for the subsequent use. If the Delta X is periodically used in different
locations, a set of external files will help to quickly re-adjust the system each time the location is
changed.
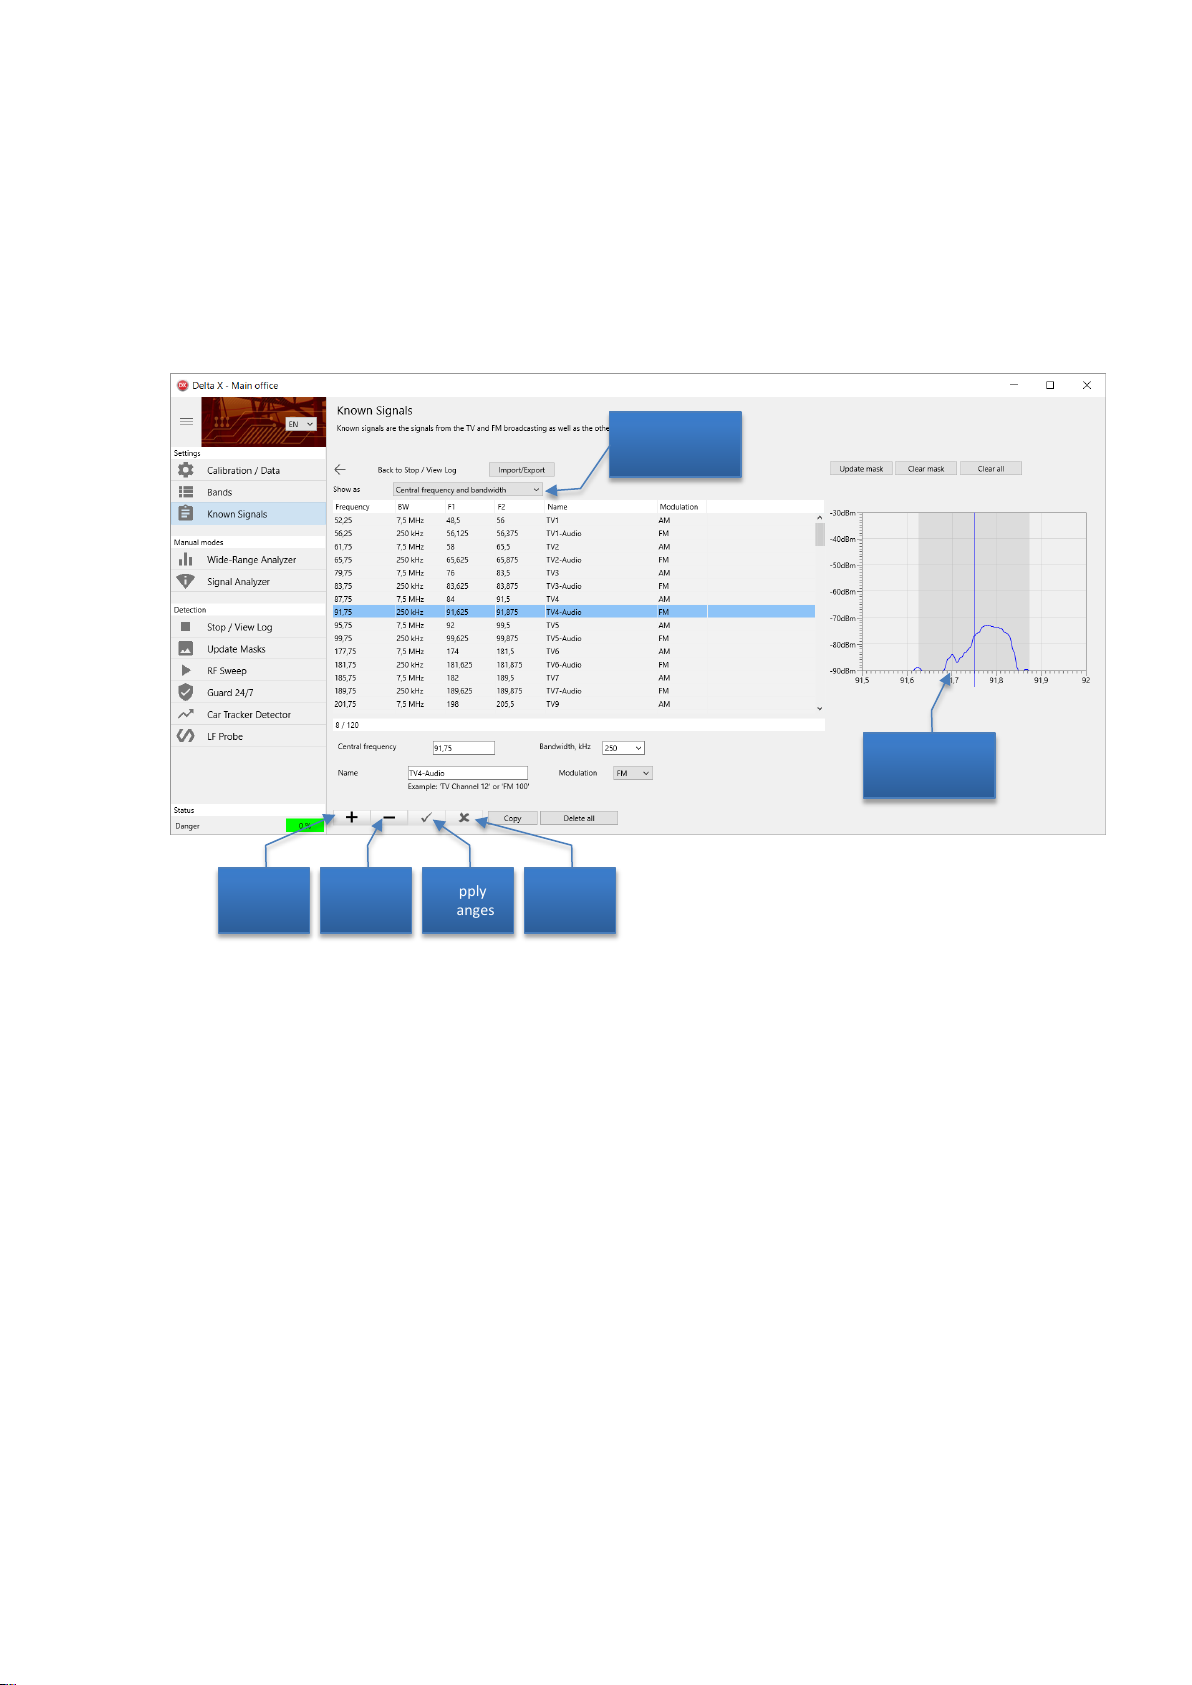
The Show As defines the representation of signals in the table. In the ‘Central frequency and bandwidth’
mode it is convenient to work with the signals having a symmetric spectrum, i.e. FM stations, VHF/UHF
stations, audio signals of TV broadcasting, etc. In the ‘Start and finish frequency’ mode it is convenient
to work with the TV video signals since their carrier frequency is positioned not in the center of the
bandwidth.
When not in the import/export mode the right side will contain the Spectrogram. It will show:
Green and orange - the Live and Max traces
Blue - the mask of a known signal
The spectrogram will display the updating Live and Max traces if the software is not in the Stop / View
log mode.
The buttons above the spectrogram allow the operator to work with the masks: Update, Clear and Clear
All. The masks are updated from the spectrum’s maximums, displayed by the color orange.
Please read the Update Mask section for more details.
20
Page 22

Delta X. User’s Manual
Menu
Maximize/minimize menu
Signals
Detector
Spectrum
Controls and elements
Menu
The menu on the left side allows the operator to select the working mode. The menu can be minimized
and maximized with the help of the button in the top left corner.
The current working mode stays active when the software is in the Settings so some changes can be
made without interruption of the current operation.
The bottom ‘Status’ area shows the general danger level, status of logging data, errors and warnings.
Signals
The Signals table contains the detected signals. They are selected from the spectrum traces and inserted
into the table automatically when the software is in the following modes: RF Sweep, Guard 24/7, Car
Tracker Detector and Wide-Range Analyzer.
There are two sections in the table: Common signals and Bands.
When the system detects activities within a mobile/wireless band, they are inserted into the Signals as a
band. Other activities appearing outside the bands are inserted as common signals.
Each signal consists of the following fields:
Frequency – central frequency (not displayed for bands)
Name – is displayed if a common signal is present in the Known signals table or Band name –
name of a band
21
Page 23

Delta X. User’s Manual
Sorting ‘danger
to the top’
Signal filtering
Toolbar for
Common signals
Click on a field’s
header to sort
Popup menu
Toolbar for Bands
Click to show and
Current Danger
level
Peak Danger level
Current dBm level
Peak dBm level
Current record / total
quantity of records
BW – bandwidth of a common signal or band
dBm – current dBm level (light green bargraph) and Peak dBm level (green bargraph). The level
is measured in the range of -90 dBm (low) … -10 dBm (high)
Danger – the current danger level (light red bargraph) and the peak danger level (red bargraph).
The danger level appears when a signal exceeds the threshold and is measured between 0% and
100%. The danger reflects the strength and the bandwidth of a signal simultaneously.
Double-click a signal to see its
spectrum with the displayed
span readjusted
Click to scroll without
hide the toolbar
changing the displayed span
Double-click (or press Enter) on a signal (common or band) to see its spectrum. The displayed frequency
span of the spectrum graphs (Spectrogram and Waterfall) will be changed to show the signal’s
bandwidth fully. If the Detector is in the Signal mode, it will be assigned to the signal.
A Click on a signal shows it in the spectrum graphs without changing the displayed span, i.e. just scrolls
to the signal. If the Detector is in the Signal mode, it will be assigned to the signal.
The signal filtering button allows the user to quickly select the desired signals:
All – all signals are shown
Unknown – the signals absent in the Known Signals table are shown only
Dangerous – the signals with a Peak Danger of more than 0% are selected
The Danger top button quickly adjusts sorting of the most dangerous signals to the top.
22
Page 24

Delta X. User’s Manual
The Hold Max Danger function automatically tunes in the most dangerous signals during the detecting
so that the spectrum graphs and the Detector start showing the signal. Since the Detector allows the
operator to make the locating procedure, the function is convenient for simultaneous detecting and
locating. The system is moved during the detecting (RF Sweep mode). As soon as a signal is found the
Detector will instantly show the danger level changing depending on the distance.
The Hold Max Danger function should be deactivated when it is necessary to scroll to and review other
signals from the Signals table or other frequency ranges on the spectrum graphs. Otherwise the function
will forcibly tune into the most dangerous signal again while readjusting the spectrum graphs
correspondingly.
The popup menu contains the following controls:
Clear Signals – deletes all the signals from the Signals table. This function is accessible in the
Wide-Range analyzer, Signal analyzer and in the Stop / View log mode.
As standard, when you work with a log, each new launch of detection continues updating
signals collected during the previous sessions. If the Clear Signals is pressed in the Stop /
View Log mode the next detection will start from the empty table. If the Clear Signals is
called from a manual mode (Wide-Range Analyzer or Signal Analyzer), the signals will be
deleted from the memory temporarily and loaded again in the Stop / View log mode or
when starting a detecting mode.
Report On Signal allows the operator to generate a report on the currently selected signal
and save it into a .bmp or .jpg file. Before calling this function select the desired signal and
adjust the spectrum graphs if necessary (set span, density and representation mode). The
report will include the textual and graphic information. Below is the example of report on
the Wi-Fi signal:
23
Page 25

Delta X. User’s Manual
Show values turns on the showing of extra columns in the Signals table with the text values
of dbm and danger level
The field’s headers are used for sorting the signals. The subsequent clicks on a field’s header sort the
signals in an ascending and descending order. The subsequent clicks on the dBm and Danger firstly sort
by the current level (darker color) and then by the peak level (lighter color).
The common signals and bands are sorted simultaneously not depending on which header was clicked.
The toolbar for the common signals is shown and hidden when the section’s header is clicked. It
contains the following controls:
Labels with the central frequency and name
Delete – erases the current common signal
Add to known – adds the current common signal to the Known Signals table. Please make sure
that the signal which you are adding is safe. Signs of safety are: 1) the signal is present in
different parts of city or areas; 2) the level does not rise sharply in a certain part of the
premises; 3) the demodulation explains what information is being transmitted; 4) is in the list of
frequencies used by police, fire or emergency service; 5) is in the list of FM stations for the area.
Update mask – re-updates the mask of the selected known signal (please read below).
The toolbar for the bands is shown and hidden when the section’s header is clicked. It contains the
following controls:
The Name of the selected band
The current dBm level of the selected band
The threshold for the selected band (please read the ‘Test detection and adjustment of
thresholds‘ on page 31)
Updating masks of separate known signals
What is masking?
When a signal exceeds the threshold it becomes dangerous. The threshold for the masked signal lays
higher than the signal and therefore is not exceeded. As a result the masked signals do not produce
danger events. The Delta X uses masking to avoid alarms from broadcasting and other safe signals.
Some known signals may become dangerous despite the fact they are masked. This can happen in areas
with a good reception of broadcasting - on the upper floors, in buildings facing TV towers, etc. Reupdating of a separate signal’s mask changes the threshold so the signal stops being dangerous.
The re-updating of the mask can be done in the following modes: Wide-Range Analyzer, Signal Analyzer, RF Sweep and Guard 24/7. If the operation is made in the target area, firstly make sure the
known signal has no signs of another signal hidden within it. Inspect the known signal in the
Spectrogram and Waterfall. Use the Persistence rendering mode. If the spectrum changes its form
significantly, do not update the mask.
Detector
The Detector is created for informing the operator about the detected danger events and locating the
transmitter. It shows the current level of danger on the bargraph and notifies the operator with the
24
Page 26

Delta X. User’s Manual
The period of the detection
green color
Click to see on the Waterfall
Current danger level
Peak danger level
audio alarm. In addition the Detector displays the history of the danger events on the Alarms graph.
The physical locating of the transmitter is performed by finding the place with the highest danger level.
The audio alarm function produces proportional sound when activated.
process is shown by the light
The Detector can work in 2 modes: Wide-Range and Signal.
In the Wide-Range mode the Detector monitors all the signals simultaneously. The operator can keep an
eye on the general RF situation existing in the area by watching the bargraph and listening to the audio
alarm. When a new dangerous signal appears, the Detector will warn immediately.
In the Signal mode the Detector displays the danger level of a particular signal which is currently
selected in the Signals table (whether common signal or band).
When the Audio alarm is on and a danger event is detected, the Detector will produce the warning
clicking sound. The intensity of clicks is proportional to the level of danger. The function is used for the
physical locating of the transmitter.
The Alarm threshold allows the operator to adjust the level at which the Audio alarm starts producing
sound. The alarm threshold helps to avoid false alarms occurring from the insignificant changes of safe
signals’ spectrums and is convenient during the physical locating (localizing) procedure. The default
value is set to 25% in all the detection modes, except the Car Tracker Detector, where it is 10%.
The increase of the alarm threshold is helpful during physical locating since it decreases the area around
the transmitter where the alarm audio appears. Increase the threshold step-by-step in order to outline
the location of the transmitter.
25
Page 27

Delta X. User’s Manual
Displayed
frequency span
Frequency scroll
Time scroll
Color scale
Point of
yellow
Band label
Click on header to show/hide toolbar
Click to tune in
signal
Marker
Selection
Toolbar for
Spectrogram
Toolbar for
Waterfall
Dynamic range
The Zero button allows the operator to quickly set the audio threshold equal to the current level of
danger and as such reject all weaker values. It can be also useful during the physical locating procedure.
The Alarms graph displays the history of the danger events:
The Time Span adjustment allows the operator to select the displayed time span
The Auto button automatically adjusts the time span so that all the logged danger events are
displayed
The Scroll to Present button scrolls to present time
The scrollbar allows the operator to scroll in time in order to see the events at the desired
moment
Clicking on the Alarms graph scrolls the Waterfall to the corresponding time (Spectrum).
Spectrum
The Spectrum page displays the graphs responsible for visual representation of spectrum:
The Spectrogram in the upper part renders the frequency on the horizontal axis and the dBm
level on the vertical axis.
The Waterfall in the bottom part shows how the spectrum is changing in time. Its horizontal
axis is the frequency, the vertical is the time and the color of pixel reflects the dBm level.
26
Page 28

Delta X. User’s Manual
Spectrogram
The Spectrogram can display the following data:
Persistence - a way of rendering the traces with the color depending on the continuity
(persistency) of the signal. Please see the description below.
Live – the current trace, obtained during the last update. Shown by green color.
Max – the maximums accumulated during the current operation. Shown by orange color
Threshold – the reference trace used by the detection algorithm for the selection of signals from
the trace and estimating their level of danger. Is shown by red color
A click on the Spectrogram when in the Signal Analyzer mode allows the operator to tune in the desired
frequency. The marker (vertical line) will show the selected frequency. When the graph is scrolled to
another range and the marker is not visible, the Scroll to marker button goes back to it.
The Spectrogram allows the user to make a selection with the help of the left mouse button. It is
possible to zoom into the selection with the help of the Zoom in selection button. Thus, a desired
frequency range can be quickly viewed. Please note, that when the signal is double clicked in the Signals
table the selection of its bandwidth in the Spectrogram is made automatically.
The displayed frequency span can be selected with the help of the corresponding control. It is possible
to select the convenient value of between 0.5 MHz and 6000MHz. The span of the spectrogram and
waterfall is selected simultaneously.
The frequency scroll allows the selection the desired frequency range.
In some cases the displayed span and scroll will be selected automatically:
When a signal is double clicked in the Signals table
When the Hold Max Danger function is activated and a more dangerous signal is detected
The band labels display the edges of the mobile and wireless bands which exist in the Bands table and
get into the displayed frequency range.
The toolbar for the Spectrogram can be shown and hidden by a click on the Spectrogram’s header. It
contains the following controls:
Setting of the Persistence, Live, Max and Threshold
The Max clear button is available in the manual modes
The Dynamic range selector. The higher selection -90…-10 dBm allows the user to observe
strong signals better, the moderate -90…-30 dBm suitable for most tasks, while the lowest -90…50 dBm is suitable for viewing the weakest signals.
The Color scale displays how the color in the Waterfall depends on the dBm level and the color
in the Persistence depends on the activity of signal. The Color scale changes as the Point of
Yellow is adjusted.
The Point of Yellow sets the dBm level to be displayed by yellow in the Waterfall and the level
of activity to be displayed by yellow in the Persistence
27
Page 29

Delta X. User’s Manual
Wi-Fi
Wi-Fi
Bluetooth bug
Max
Persistence
The Persistence is the way of rendering the spectrum with color depending on the activity of the signal,
i.e. how frequently it exists. As such the operator can distinguish between the permanent and
intermittent signals. The rare intermittent signals are drawn in blue or green color, whereas more
permanent signals are shown in yellow or red.
A great advantage of the Persistence is that it allows the operator to recognize signals hidden under
other signals.
Below is an example of finding a Bluetooth bugging device hidden under the Wi-Fi signal:
The Max trace contains the maximums accumulated from the intermittent signals during the long period
of time and therefore cannot be used for visual recognition of a hidden signal with a lower level. At the
same time the Persistence clearly shows in red the 2429 MHz signal with more frequent existence than a
yellow Wi-Fi signal ‘behind’ it.
The Persistence uses the multiple spectrum traces taken from the Waterfall; therefore the Waterfall’s
view and settings influence the Persistence.
The Point of Yellow controls the colors in the Persistence.
As a standard, the green Live trace is displayed filled. When the Persistence is activated, the filling of the
Live goes off and the trace is displayed just by the stroke.
Waterfall
The Waterfall displays the multiple traces obtained during a specified span of time and is extremely
valuable for detection of intermittent signals.
28
Page 30

Delta X. User’s Manual
During the detection the Waterfall displays the information accumulated in the log and scrolls as the
new measurement is performed. In the Stop / View Log mode the waterfall displays the information
stored in the log. In the manual modes (Wide-Range Analyzer and Signal Analyzer) the Waterfall
temporarily accumulates the data for the displayed frequency span.
The density regulates the time span displayed by the Waterfall. The density may vary between ‘one
trace per 10 pixel lines’ and up to ’10 traces per one pixel line’.
When the data is loaded from the log in the detection modes or in the Stop / View Log mode the higher
density setting may cause significant disk reading and a large processing of data. The fetching may take
longer, particularly when a wide displayed span is selected. Try to avoid the maximal density with the
simultaneous wide span to achieve the optimal performance. After using a high density return the low
value.
When in the Stop / View Log mode a click on the waterfall allows the user to upload and view the
corresponding trace in the Live.
The time scroll allows the operator to select the desired time shown by the waterfall. It is also possible
to select the time by clicking on the Alarms graph in the Detector. Please note that when the Waterfall
is scrolled to an older span of time, it does not update with a new trace received from the spectrum
analyzer. Scroll to the current time in order to restore the updating.
The color scale near the Spectrogram allows the operator to see how the color of the Waterfall’s pixels
depends on the dBm level. The point of yellow can be shifted up in order to hide weaker signals or
background noise in the Waterfall. The further increase of the yellow point will hide the signals of the
average level. Shifting the yellow point down will show the weaker signals.
29
Page 31

Delta X. User’s Manual
Delta X 2000/6 Real-Time
Delta X 100/12 or 100/4
1.5-3 second
1-2 minutes
Manual modes
Wide-Range Analyzer
This mode can be used for:
Capturing the signals existing in the area in order to store them in the Known Signals table
Test detection and adjustment of thresholds
In the Wide-Range Analyzer mode the software analyzes the entire RF spectrum, recognizes the signals
and inserts them into the Signals table. The signals can be further analyzed in the Signal Analyzer mode
and, when necessary, stored in the Known signals table.
The fetch time of a spectrum trace depends on the used version of the system:
Antenna connection: connect the antenna directly to the spectrum analyzer’s INPUT 50 Ohm.
Capturing known signals
Both the known and unknown signals are masked during the detection thanks to the Update Mask
procedure. Despite this the filling of the Known Signals table has certain advantages:
Separate known signals can be re-masked manually during the detection to reduce false alarms.
The unknown signals cannot be re-masked during the detection process
The known signals can be hidden using filtering so more attention is paid to the unknown
suspicious signals
The operator can visually distinguish between known and unknown signals
When the system is constantly used in the same area, filling of the Known Signals table is strongly
recommended.
After the first starting of the software, the Known Signals table is empty. While the TV channels can be
imported from the data file, the FM, VHF/UHF and other frequencies constantly existing in the area
should be captured and entered to the Known Signals table manually.
Typically the sequence of actions is as follows:
Import of TV channels to the empty Known Signals table
Capturing signals in Wide-Range Analyzer
Adjustment of the dBm threshold for bands
Studying the captured signals in the Signal Analyzer mode and adding them to the Known
Signals table
When the Delta X system is moved to another location (city, state or country), the Known Signals table
should be re-filled for that new area. Typically the algorithm is as follows:
Export of the existing known signals to an external file for future use
30
Page 32

Delta X. User’s Manual
Clearing the table (‘Delete All’ button)
Import of the TV channels to the empty Known Signals table
Capturing signals in Wide-Range Analyzer
Adjustment of the dBm threshold for bands
Studying the captured signals in the Signal Analyzer mode and adding them to the Known
Signals table
In the Wide-Range Analyzer the antenna should be placed so that the best reception of broadcasting is
achieved. This could be done in, or near a window. Higher floors are advisable.
Stay in the Wide-Range Analyzer for a while and change the position of the antenna in order to
accumulate the maximums trace. If the real-time spectrum analyzer is used (the 2000/6 model) the
capturing of signals is done within few seconds, while the slower versions will need a few minutes.
To be sure that there is no potential bugging devices among the captured signals, it is recommended to
collect the known signals in a place other than of the pending sweeping.
The information is not stored in the log in this mode; therefore after capturing signals go straight to the
Signal Analyzer mode to handle the results.
Test detection and adjustment of thresholds
The Wide-Range Analyzer works similarly to the RF Sweep mode. Therefore it can be used for testing the
RF environment, updating masks of known signals and adjusting the band’s thresholds before the
detection.
Press the Danger Top button in order to view the most dangerous signals in the top.
The masks for the known signals which produce danger can be updated as described in the ‘Updating
masks of separate known signals’ on page 24.
It is also possible to use the Wide-Range Analyzer to adjust the mobile and wireless bands’ thresholds
before starting detection. The default values can be left without change although more precise tuning
will allow achieving better sensitivity and fewer false alarms.
Make sure the ‘Hold max danger’ function is inactive. Open the Band’s toolbar by clicking on the ‘Bands’
header, select the desired band and adjust the threshold using the track bar:
31
Page 33

Delta X. User’s Manual
Standard
Recommended threshold level
High sensitivity (longer
detection distance)
Low sensitivity
(Shorter detection
distance)
GSM
-60 dBm
-40 dBm
CDMA, 3G, 4G/LTE
-85 dBm
-75 dBm
Wi-Fi/Bluetooth/Zigbee
-70 dBm
-40 dBm
DECT
-70 dBm
-40 dBm
Selected band
Band’s dBm level
Band’s threshold
Band’s current danger
level
The downlink bands should not normally produce alarms and therefore the threshold for them should
be above the dBm level. Do not set the value too high to avoid losing of sensitivity.
The uplink and ‘shared’ bands (without the ‘uplink’ or ‘downlink’ label) should be sensitive enough to
detect the signals; therefore their threshold level should be lower. Do not set it too low ‘on the floor’ as
the band will constantly produce alarm events and create interferences for the detection process.
While the GSM standard needs the threshold to be higher in order to limit the detection of remote
devices, the CDMA, 3G and 4G/LTE should have lower threshold as they have lower dBm level.
A decrease of sensitivity may be needed when there are Wi-Fi, cellular or DECT signals coming from the
uncontrolled neighboring premises. The higher the threshold is, the lower the sensitivity will be.
Please note that the adjustment of the thresholds for the bands can be made in any mode.
Signal Analyzer
This mode was created for studying the spectrum of separate signals or bands, demodulation, adding
safe signals to the Known signals table and physical locating of any bugging devices. This mode does not
capture new signals, but works with the records already stored in the Signals table.
32
Page 34

Delta X. User’s Manual
Antenna connection: connect the antenna directly to the spectrum analyzer’s INPUT 50 Ohm.
In the upper part there is a toolbar containing some controls specific for this mode:
The Watch mode defines what information is taken from the spectrum analyzer – spectrum or the
demodulated sound. With the Spectrum selected the spectrum graphs will update continually. With the
Demodulate the system allows the operator to listen to the signal and select the demodulation mode
and bandwidth (BW).
Spectrum
Unlike the Wide-Range Analyzer, RF Sweep and Guard 24/7 where the entire RF spectrum is updated
continually, the Signal Analyzer updates the partial spectrum only. Thanks to that a higher update rate is
achieved so that the location procedure can be performed faster.
The Update Span defines the updated frequency range. When the Auto is selected, the item displayed
in the spectrum graphs (Spectrogram, Waterfall) span will be updated. When the user changes the
displayed span or scrolls to another frequency in the spectrum graphs, this new range becomes
updated. Please note that the system updates the span around the marker. Therefore after scrolling to a
new position the marker should be set inside the new visible area by clicking on the Spectrogram. When
a signal is double-clicked or clicked in the Signals table, the marker is set automatically.
The Number of readings defines how many times the trace is fetched from the spectrum analyzer.
Thanks to the accumulation of maximums the increased number allows the operator to track any
intermittent signals with a short time of existence. For example, a Wi-Fi signal’s bursts last 5-100
microseconds only so the increased number will improve the probability of capturing. Increase the
number of readings for Wi-Fi, 4G/LTE, and all other non-constantly existing signals in order not to pass
the activity during the locating procedure.
Please note that this setting is valid in the Signal Analyzer mode only, while the other modes fetch the
traces in accordance with their own algorithms.
The Frequency shows the tuned frequency. The marker on the Spectrogram will be positioned
correspondingly. There are 3 ways to change the tuned frequency:
Double-clicking or clicking the signal in the Signals table
A click on the Spectrogram
Editing the value directly using the Frequency control
Demodulation
When the watch mode is set to Demodulate the Delta X produces demodulated sound on the currently
tuned frequency.
The toolbar in the Demodulate mode:
33
Page 35

Delta X. User’s Manual
There are 5 demodulation modes: FM (frequency modulation), AM (amplitude modulation), USB (upper
sideband modulation), LSB (lower sideband modulation) and CW (continuous wave modulation).
Please note that in our modern environment there are a huge number of digital signals which cannot be
listened to with the help of the analogue demodulator. Mobile communications, wireless devices and
encrypted VHF/UHF communication cannot be demodulated. Despite this the Delta X warns the
operator about the existence of such signals, by detecting their spectrum. The subsequent locating
procedure makes it possible to pinpoint the transmitter in the premises not depending on the ability to
demodulate.
Analogue bugging transmitters typically use the FM modulation, although some devices sending audio
through the wires can use the AM or other modes. Radio broadcasting uses both the FM and AM,
depending on the band. TV signals can be sent in the FM or AM, depending on the country.
The demodulation bandwidth (BW) can be selected in order to achieve the best quality of reception. For
example 240000 Hz suits for the demodulation of some analogue bugging devices, FM stations and
audio channels of TV stations. 15000 Hz suits for the reception of some analogue bugging devices and
VHF/UHF communications.
It is recommended to apply different demodulations and BWs when inspecting any unknown signals.
To tune in a signal double-click or click it in the Signals table. By default the signal’s central frequency is
tuned in. Since the currier of some signals is not positioned in the center (for example TV/video signals),
it is recommended to change the tuned frequency within the edges of signal’s spectrum in order to
study the unknown signal and find possible signs of modulation and audio.
Please note the absence of audio is not a sign of a signal’s safety. The more important indication is the
absence of a high danger level in different parts of premises. Therefore it is recommended to move the
Delta X system or its antenna in order to inspect and locate any suspicious signals.
Physical locating of the transmitter
The procedure should be accomplished in the watch mode set to Spectrum.
The Detector will indicate the danger level on the bargraph. The current value will be shown by red, the
peak value - by light red color. The operator will be warned by the proportional sound if the Audio alarm
function is activated. The signal’s danger will increase as the Delta X or its antenna is closer to the
transmitter and will drop at longer distances. The Audio Alarm function will produce a clicking sound
with changing intensity depending on the danger level.
By finding the place with the highest danger level the operator can locate the transmitter.
The signal’s danger level can be between 0 and 100% and is calculated from the above-threshold level
and bandwidth. While the threshold for the common signal is generated automatically, for the bands it
is set by the operator.
Algorithm of the locating procedure:
34
Page 36

Delta X. User’s Manual
Signal’s peak danger level
1. Start the Signal analyzer
2. Set watch mode to Spectrum
3. Open the Detector and select its mode as Signal
4. Double-click or click the desired common signal or band in the Signals table
5. Turn on the Audio alarm in the Detector
6. Move the Delta X system or its antenna in order to find the place with the strongest danger
level.
The bargraph will show the changing level while the Audio alarm will produce sound of
corresponding intensity. The level and intensity of the sound will grow as the antenna is moved
toward the transmitter.
7. The Alarm threshold allows the operator to mute the audio for weaker levels. By increasing the
alarm threshold progressively it is possible to find the area with the strongest signal and, as
such, pinpoint the potential transmitter. The Zero button quickly sets the alarm threshold to the
current level.
Signal’s danger level
changes as the antenna
is moved closer or
further
Some safe signals from broadcasting or communications might produce increased danger levels or ‘false
alarms’. False alarms have the following signs:
The danger level changes insignificantly in different parts of checked premises
The danger level rises near windows and outside the premises
There is no sharp increase of danger in a certain part of a room
The same signal exists in other logs obtained in other areas
At the same time, really dangerous signals have the following signs:
A sharp increase of danger level in a certain place
A high danger level
35
Page 37

Delta X. User’s Manual
Please note that the mobile networks of the higher generations (3G, 4G/LTE) may use the older
networks GSM/CDMA temporarily. A mobile device may change the network and frequency right during
the communication session. At this moment the signal may disappear from the Signal Analyzer tuned in
the initial band. Testing other bands or returning to the detection will be necessary to find the new
active band and to continue with the location.
Directed microwave antenna MWA-6
The supplied microwave antenna MWA-6 can help in locating the transmitters working on frequencies
above 800 MHz. In addition to the increased sensitivity it can show the direction to the transmitter
which simplifies the locating procedure significantly.
To avoid losses in the cable and antenna switcher, connect the microwave antenna directly to
the spectrum analyzer.
Rotate the antenna in different directions to find the strongest danger level and go in that
direction. The Delta X system should be carried.
After approaching the potential location repeat finding the direction. As such, step-by-step, a
precise position of the transmitter can be found.
Proceed to the physical inspection
The following transmitters can be found with the help of the MWA-6 microwave antenna:
CDMA, GSM
3G
3G/LTE
Wi-Fi, Wi-Max, Bluetooth, ZigBee, wireless cameras
All other signals above 800 MHz
Adding signals to the Known Signals table
After a signal is identified in the Signal Analyzer mode as safe, it can be added to the Known Signals
table. To do that the operator should stay on the signal and press the ‘Add to known’ button in the
Common signals’s toolbar. The software will open the Known Signals table with the new record added.
It is necessary to enter the name of the new signal, specify its modulation mode and correct the central
frequency and bandwidth.
Since the signal’s central frequency and bandwidth are detected automatically, it may be necessary to
set more precise ‘rounded’ values before the new signal is saved.
For example, for an FM radio signal the central frequency should be rounded to the nearest 100 kHz,
while the bandwidth should be set as 250 kHz. The detected signal 99.98 MHz with bandwidth 126 kHz
should be stored in the Known signals table with the central frequency 100.0 MHz, bandwidth 250 kHz,
name ‘100 FM’ and FM modulation.
Press the Apply button to store the changes.
The Mask for the added signal will be updated automatically.
Press the ‘Back to Signal analyzer’ button on the top toolbar of the Known Signals.
36
Page 38

Delta X. User’s Manual
Log selection button
Available dates for the
selected log
List of logs
Currently opened log
Currently reviewed date
Selected log
Detecting modes
Stop / View Log
A log is a database which stores data collected during the detection process. In the Stop / View Log
mode the operator reviews the results of detection without performing new measurements.
Selecting log and date
The Stop / View Log can be pressed anytime during the detection so that the current log for the present
date can be reviewed. At the same time, it is possible to select any other log or date later, using the log
selection button.
The upper part of the log selection window contains the list of logs, whereas the bottom part displays
the list of dates available for the selected log.
The information in the logs is split into dates. When the detection is started on another day, a new date
is created. If the detection is performed continually, the Delta X system creates a set of dates. A new
date is created at midnight.
Press the log selection button, select the log, date and press OK to open. It is also possible to open the
log by double-clicking it or the desired date.
The File Size reflects the occupied disk space (by the date).
It is possible to delete a separate date with the help of the Delete date button. The entire log and all its
dates can be erased at once by the Delete button in the upper toolbar. A currently open log and date
cannot be deleted.
37
Page 39

Viewing signals and alarms
Delta X. User’s Manual
The Stop / View Log mode gives information about the detected signals to the operator. The task of the
operator is to study the dangerous signals, alarms and to go to the Signal Analyzer for locating or saving
the signal to the Known Signals table.
The Signals table shows the list of detected signals. All the standard operations with the signals are
available in this mode: filtering, sorting, etc.
The Danger field represents the maximal danger level of the signals (light red) measured during the last
detection. Use the Dangerous filter and the Danger top button to quickly select the most dangerous
signals.
Double-clicking the signal (whether common or band) allows the operator to review it in the spectrum
graphs and Detector.
When the mode of the Detector is Wide-Range, the Danger level bargraph shows the maximum alarm
from all the signals, while the Alarms graph shows the distribution of alarms in time.
When the mode of the Detector is Signal, the Danger level bargraph represents the maximal alarm from
the selected signal, while the Alarms graph shows the distribution of alarms in time for the signal.
The Alarms graph can be clicked in order to select the corresponding time in the Waterfall.
38
Page 40

Delta X. User’s Manual
Selected signal
Selected signal’s danger level
Alarms: danger level is more
than 0%
Below is an example of the intermittent signal 433,9256 MHz. The bargraph is showing the 43% danger
level, while the Alarms graph displays the moments of activity.
When the Auto button in the bottom toolbar is in the pressed position, the Alarms graph automatically
changes the displayed time span to show all the available alarms.
39
Page 41

Delta X. User’s Manual
Selected signal
Persistence
Max
Activities of selected signal
The Spectrum page allows the operator to see the spectral information. Below is an example of the
same 433,9256 MHz signal:
The Persistence rendering (shown on the above example) draws the spectrum by a changing color
depending on the activity of signal. Depending on your needs, the Persistence or Live can be activated.
The orange Max shows the maximums accumulated during the detection. The maximums are
convenient for learning intermittent signals as they keep the information even if the signal is not active
at the moment of reviewing the results.
The Waterfall allows the operator to see the changes of signals in time. While the Alarms graph shows
the danger level, the Waterfall displays the dBm level by color. By clicking on the Waterfall it is possible
to view the spectrum trace taken at the moment corresponding to the position of the click on the
vertical time scale. The Live will show the clicked trace.
Adjustment of the Waterfall’s density will help to set the displayed period, while scrolling it vertically
sets the starting moment. It is also possible to scroll the Waterfall by clicking the needed time in the
Alarms graph (Detector page). The Waterfall data defines what is shown in the Persistence.
To inspect the signal’s history during other days, open the needed date in the log selection window.
To study a signal’s spectrum in the present time, demodulate and locate the transmitter use the Signal
Analyzer mode.
Update Masks
In this mode the Delta X can be adapted to the current radio-frequency environment before any
detection. This procedure significantly reduces false alarms and increases the general detection
sensitivity since it stores spectrums of safe signals existing in the area. Both the known and unknown
signals are masked.
40
Page 42

Delta X. User’s Manual
Perform the Update Masks procedure each time you are going to use the Delta X in a new location.
Antenna connection: connect the antenna directly to the spectrum analyzer’s INPUT 50 Ohm.
Start the Delta X system and run the Update Masks mode before entering the target zone. This can be
done in a car, outdoors or in another building. Higher floors are recommended since they provide better
reception of broadcasting signals. Place the antenna near a window if possible. Move it in different
directions and angles in order to accumulate the highest levels.
Make sure the procedure is performed at a minimum distance of 50-100 meters to the target area. It
will prevent the system from masking a real danger (bugging signal). Longer distances are also
possible.
If it is completely impossible to update masks at the specified distance, perform the procedure as far
from the target room as possible. Select a remote room or another floor and update masks there. In
case of updating in close proximity the detection distance might decrease slightly.
Select the time of update in minutes. With a longer time the system will have more chances to capture
non-constant signals like remote controls, VHF/UHF transceivers, etc. and as such to mask them. The
default value is 5 minutes.
Press Update to start the process. The progress bar will show the status.
Please note that the Delta X versions 100/12 and 100/4 use a slower spectrum analyzer and therefore
will perform the procedure longer than shown on the progress bar.
Additional mask updates may reduce false alarms even more. Use Add another point to perform more
measurements. Please note that the Update button clears the old masks, while the Add another point
adds new data to the existing ones.
Below is the example of placement for the Update Mask in a modern city. The red spot is the target
zone. The circle of 50-100 m radius is the non-recommended zone. The suggested places for updating
masks are drawn by the green spots.
41
Page 43

Delta X. User’s Manual
Target zone
Places suitable for the
Update Masks procedure
The results of the Update Mask are saved automatically.
RF Sweep
This is the main detection mode, in which the Delta X detects signals, evaluates their danger level and
warns the operator about any high danger. The signals, alarm events and spectrum traces are saved in
the log.
The RF Sweep mode provides extremely high sensitivity thanks to the ability to omit the safe
broadcasting and communication signals existing in the area and detect all other signals.
This mode is suitable for the following tasks:
Checking premises for the presence of RF bugging (sweeping procedure)
Checking vehicles for the presence of GPS trackers and RF bugs
Securing conference rooms during negotiations
Preparations
The following preparations should be made before starting the RF Sweep:
Mobile networks and wireless bands should be specified in the Bands table
Known signals imported or collected using the Wide-Range Analyzer and Signal Analyzer
Personal Wi-Fi, cellular and DECT devices deactivated
The mobile/wireless thresholds adjusted
The Update Masks procedure performed
Sound in the checked room should be created to activate any potential bugging devices. In
addition to the voice activation function present in some analogue bugs, cellular devices and
bugs using the GSM, 3G, 4G/LTE increase their transmitting power and intensity when there is a
sound. The laptop with the Delta X can produce music or a language tuition course for example
Antenna connection: connect the antenna directly to the spectrum analyzer’s INPUT 50 Ohm.
42
Page 44

Delta X. User’s Manual
Initial parameters
After selecting the RF Sweep mode the operator is asked to set the initial parameters.
Mask signals defines what signals to mask during the detection. This function will work if the Update
Masks procedure was executed in advance. The masked signals do not produce any alarms so the false
alarm rate decreases. Known and unknown will mask both types of signals, minimizing false alarms and
increasing the general sensitivity. Known only will mask the known signals only. More alarms are
usually produced in this variant.
Sensitivity to common signals defines how strong a signal should be to be detected. The position of the
threshold is connected with this selection. High sensitivity will provide the detection of the weakest
signals, but with more false alarms. Low minimizes false detections. Moderate is set by default.
Log selects to what log (database) the data will be written. Press the selection button if necessary. The
log selection window will pop-up. Please see the ‘Stop / View Log’ section for details.
When the 100/12 version of the Delta X is being used, the user is offered to select the frequency range.
There are two options: partial 100 kHz – 6000 MHz or full 100 kHz – 13000 MHz. Selection of the partial
range helps to speed up the detection process by scanning the most probable bugging frequencies.
To start the detecting press the Start button.
The Delta X will enter its working state and the Signals table, Detector and Spectrum will be shown.
Within a few seconds, after initialization of the USB connection, detection will start.
Detection process
43
Page 45

Delta X. User’s Manual
Delta X 2000/6 Real-Time
Delta X 100/12 or 100/4
1.5-3 seconds
1-2 minutes
General danger status
Logging status
The most
dangerous signal
Change of danger level in time (all
signals)
Current danger
Peak danger
Wide-Range mode: danger
simultaneously
level of all signals is shown
In the RF Sweep mode the software automatically recognizes the signals in the spectrum traces, adds
them to the Signals table and updates the dBm and danger levels. The trace’s fetch time depends on the
used version of the system:
The Signals are divided into Common signals and Bands. The Bands contains the activities registered in
the mobile and wireless ranges while the rest of the signals are placed into the Common signals
category.
The excess of the threshold may mean that the signal has a local origin. The aim of the Delta X is to
discover all local transmitters therefore such signals are assigned a higher danger level. The level is
calculated on the above-threshold basis and takes into consideration the dBm level and the bandwidth
of the signal.
The Danger level is drawn by red and reflects the current level of danger. The Peak Danger is drawn by
light red. It keeps the maximal danger level and allows the operator to observe any non-constant
signals.
The ‘Dangerous’ filtering can be applied to select the signals with a Peak Danger above 0%
The Detector and its Audio alarm function warns the operator about the detected danger visually and
with sound. The intensity of the sound changes depending on the signal’s power, which makes it
possible to locate the transmitter instantly. The Detector can work in the Wide-range mode, informing
the operator about all the signals simultaneously or in the Signal mode, where the particular signal is
displayed.
44
Page 46

Delta X. User’s Manual
Type of signal
Detection distance
TV, FM broadcasting
5-10 km
VHF/UHF communications
0.2-2 km
VHF/UHF bug
5-50 meters
GSM bug
5-20 meters
CDMA, 3G, 4G/LTE bug
2-4 meters
DECT
5-10 meters
Wi-Fi
5-10 meters
Bluetooth, ZigBee
2-10 meters
Wireless video camera
5-20 meters
Delta X 2000/6 Real-Time
Delta X 100/12 or 100/4
The default value of the Alarm threshold is 25% in the RF Sweep mode. Such a value allows the operator
to pass most of the false alarms while keeping the ability to capture any real danger.
The left bottom corner of the Delta X software displays the danger status. The color of the rectangle
changes depending on the danger level and is green for low values, yellow for a moderate danger level
and becomes red as the level becomes higher.
When entering the RF Sweep mode the Hold max danger function is activated by default. The function
places the dangerous signals on the top of the Signal table and tunes in the signal with the highest
danger level.
When it is necessary to review other signals or change the displayed frequency span or scroll in the
spectrum graphs, the Hold max danger must be turned off.
Detection distance
The detection distance depends on the transmitter and is connected with its transmission distance.
A typical bugging device sends signals over 20-200 meters and can be easily detected by the Delta X at a
distance of 5-50 meters. At the same time, the 3G and 4G standards, due to the specific type of
modulation can be detected at a shorter distance of 2-4 meters.
Most bugging devices can be found without the necessity of moving the system or its antenna within the
room in order to scan the area. Nevertheless, to obtain the most reliable results and find all types of
bugging, including the 3G/4G and the low-power devices like Bluetooth, the antenna should approach
them at least 2 meters. Therefore moving the system/antenna and scanning the area is recommended.
Scanning the area
The advantages of moving the system or the antenna are:
Low-power transmitters and some hard-to-detect cellular signals can be detected at a closer
distance
The operator may need to decrease the sensitivity on some bands in order to avoid false alarms
from neighboring Wi-Fi and cellular devices. The loss of detection sensitivity can be
compensated at a closer distance
The location of the transmitter can be discovered during the detection
The scanning procedure depends on the used version:
45
Page 47

Delta X. User’s Manual
Scan all areas in the room by moving the system
or its antenna smoothly with the speed of 50 cm
per second taking into consideration the
detection distance of 2 m
Relocate the system or its antenna by 2
meters every 5 minutes until the entire room
is scanned
False alarms
Since the RF environment changes in different places, some known signals may produce alarms in the RF
Sweep mode despite the Update Masks procedure being performed before the detection. This may
happen on higher floors, near the windows or in any premises facing broadcasting towers.
The influence of the false alarms can be lowered by the increased Alarm threshold, but a more
recommended measure is to re-update the individual masks for known signals which produce danger.
The procedure can be done without stopping the detection process:
Place the system or antenna where a good reception of broadcasting can be achieved (near a
window)
Deactivate the Hold max danger function
Open the Spectrum page
Open the Common signal’s toolbar by clicking the header
Tune in a known signal producing the danger by double clicking it in the Signals table. The
known signals can be recognized as their Name field is not empty. The mask for unknown signals
cannot be re-updated.
Inspect the spectrum of the known signal. Make sure the spectrum has no signs of the presence
of another signal hidden within – no sharp increases of spectrum, no other signals within the
signal’s edges are seen in the Persistence view.
Press the Update Mask button in the toolbar to mask the signal. After the next fetch of the trace
the threshold within the signal’s edges will increase and the signal’s danger level will drop.
Repeat the same procedure a number of times for all other known signals showing danger.
Some signals may need repeated updates.
False alarms may also appear on the mobile/wireless bands if their thresholds are not adjusted properly.
To adjust the band’s threshold open the toolbar by clicking the Bands’ header.
The downlink bands should not normally produce any alarms. If this happens, firstly check the spectrum
and behavior of the danger level. Since the downlink signals are coming from the base stations situated
outside, the danger level may grow near windows. In this case and when there is no concentration of
the high danger level the band’s threshold can be increased to prevent alarming.
With the uplink and shared bands a lower threshold will provide a higher detection distance. At the
same time it may be necessary to set it to certain level to reject any Wi-Fi, DECT and cellular devices
creating interference from an adjacent (neighboring) premises.
After the known signal’s masks are updated and the thresholds for bands are adjusted, the Alarm
threshold can be minimized and the maximum sensitivity achieved.
46
Page 48

Delta X. User’s Manual
Bugging device
Replacement
VHF/UHF radio microphone
Body-worn ‘bodypack’ radio microphone used on TV
GSM bug
Mobile phone in GSM mode (with 3G off) in the
conversation state. A call from a landline telephone can be
made, the phone picked up and left off hook
3G bug
3G mobile phone in the conversation or data exchange
state. To initiate continuous data exchange Skype or Viber
software can be used or a long Youtube video watched
Wi-Fi transmitter (client)
A Wi-Fi connected mobile phone in the state of data
exchange (Skype/Viber/Youtube)
Wi-Fi transmitter (server)
Wi-Fi router
Hidden wireless camera
Video baby monitor
DECT radio microphone
DECT phone in the conversation state
Bluetooth bug
Bluetooth headset or wireless mouse in the active state
Results of detection
The results can be reviewed during the detection. Double-clicking or clicking the signal shows it on the
spectrum graphs. When the Detector is in Signal mode, it will show the alarm events of the clicked signal
on the Alarms graph.
Clicking the event on the Alarms graph will scroll the Waterfall to the corresponding time.
The RF Sweep mode presumes the detection and locating simultaneously, but due to the processing of
the entire frequency range the movement speed is limited. The Signal Analyzer mode can be used
temporarily in order to study a suspicious signal and locate it physically. Then the RF Sweep can be
continued again.
Press the Stop / View Log after the detection is completed. The information can be reviewed in this
mode (page 37).
Training
Before starting the actual detection a ‘test’ detection with bugging devices of different types can be
performed.
Some home appliances and cellular devices work similarly to real bugging devices; therefore they can be
used for training in the absence of real bugs.
Cellular devices can decrease the power or intensity of exchange when there is no conversation (no
sound). When performing the test training detection, make sure there is a sound near the cellular
device.
When testing the Delta X take into consideration the reaction time of the used version in the RF Sweep
mode. The ‘2000/6 Real Time’ has the fastest speed so the signal does not need to exist so long to be
detected (up to 3 seconds). The slower versions 100/12 and 100/4 need the signal to exist for at least 2
minutes to detect it. At the same time, in the Signal Analyzer mode both versions have a quick reaction
time.
When testing the system with a car’s remote control take into consideration that the sent signal may
last less than the reaction time of the system. The detection of such signals may take time up to 10
seconds.
47
Page 49

Delta X. User’s Manual
Guard 24/7
There are a number of hidden bugging devices transmitting signals non-constantly:
Radio microphones or video cameras activated remotely
GSM/3G/4G/LTE bugs activated by an external request
Bugging devices with accumulation and periodical uploading of information
Such types of bugs transmit radio signals just periodically - during important meeting, negotiations or
whenever necessary. An audio accumulating bug can store conversations during days and then upload
the data within a few minutes at a pre-programmed time or under an external request.
The Guard 24/7 mode was created for the day-and-night guarding of the target zone in order to detect
all types of signals including non-constant ones and provide the highest level of security.
There are some differences comparing to the RF Sweep mode:
The system has a lower alarm rate thanks to the rejection of short transmissions
The reaction time depends on the signal’s power and bandwidth
The operator can use 2 antennas simultaneously to decrease any false alarms
Gaining experience in the RF Sweep mode can be recommended before using the Guard 24/7.
Reaction time
Since the short signals from remote controls, wireless alarm sensors and VHF/UHF communications are
considered to be safe, the Guard 24/7 rejects them. In this mode a signal should exist and exceed the
threshold during a certain time in order to become dangerous.
The reaction time depends on the signal’s power and bandwidth. The stronger signals with a wider
bandwidth produce an alarm faster, usually within 3-5 seconds. The weaker narrowband signals should
exist for at least 5-10 seconds to produce the alarm.
Please note that the pulsing timeslot signals like DECT, Wi-Fi, GSM, 4G/LTE, etc. are detected in the
Guard 24/7 mode.
Initial parameters
The parameters page appears when the Guard 24/7 mode is selected. All the options are similar to the
RF Sweep mode, except the Algorithm selector:
When the 1 antenna algorithm is selected the Delta X works the same way as in the RF Sweep mode.
The system/antenna can be moved or remain fixed. The only exception is the reaction time. Please read
about the ‘RF Sweep’ on page 42.
48
Page 50

Delta X. User’s Manual
Main antenna
Remote antenna
Target room
The 2 antenna algorithm was created for static use. The Delta X can guard the target zone for a long
time and adapt to the RF environment by updating the masks automatically. The antennas are placed
inside the target room and in a remote area.
Usage of 2 antennas
The main antenna should be put within the target zone (in the checked room)
The remote antenna should be as far from the target zone as possible (not closer than 15-20
meters)
The remote antenna should be able to receive the broadcasting and other external signals with
high sensitivity. The optimal placement is near a window.
Both antennas should be used with the extension cables to equalize the attenuation, not
depending on the position of the system.
The system can be placed in any convenient place, within the target zone or in an adjacent room
In case of organizing a permanent control post and running through its own cables, use the following 50
Ohm low-attenuation cables: LMR-240, 5D-FB (6-7 mm), RG-8, RG-213, LMR-400 (10 mm), LMR-600 (14
mm).
The RG-58 and other high loss cables cannot be used.
Do not exceed 30-50 meters length. Use the same cable length for the main and remote antenna.
If possible, the remote antenna can be placed in the roof area or at least in a window to provide the
best reception of broadcasting.
Example of antenna placement:
49
Page 51

Delta X. User’s Manual
Antenna connections
When 1 antenna is used, it should be connected directly to the spectrum analyzer’s INPUT 50 Ohm.
When the 2-anttena algorithm is applied, the antenna switcher is used. Before pressing Start make all
the necessary connections:
The antenna switcher’s output marked as RECEIVER should be connected to the INPUT 50 Ohm
with the supplied cable
The main antenna with the extension cable – to ANT 1
The remote antenna with the extension cable – to ANT 2
When it is necessary to make a location procedure or study a suspicious signal, stop the detection
temporarily and enter the Signal Analyzer mode. Move the main antenna to make the physical location.
Detection process
When the Guard 24/7 is started with the 2-antenna algorithm selected, the system works under the
following algorithm:
After the start, the ‘Update Masks’ procedure is performed automatically on the remote
antenna during 1 minute
The main antenna is selected and the spectrum traces are fetched
If dangerous signals are detected on the main antenna, the mask updating procedure on a
remote antenna is repeated with a frequency of once per 30 seconds
Some external ‘false’ signals can be eliminated in this mode thanks to the quick mask updating
Car Tracker Detector
GPS trackers
A GPS tracking unit is a device, normally carried by a moving vehicle or person, that uses the Global
Positioning System to determine and track its precise location, and hence that of its carrier, at intervals.
The recorded location data can be stored within the tracking unit, or it may be transmitted to a central
location data base, or Internet-connected computer, using a cellular (SMS or internet packets), radio,
or satellite modem embedded in the unit.
Usually, a GPS tracker will fall into one of these three categories:
Data logger. Logs the position of the device at regular intervals in its internal memory.
Data pusher (most common type, also known as a GPS beacon). This kind of device sends the
position of the device at regular intervals, to a determined server, which can store and instantly
analyze the data.
Data puller (also known as GPS transponders). Sends the position under external request only.
This technology is not in widespread use and can be used in the case where the location of the
tracker will only need to be known occasionally e.g. placed in property that may be stolen, or
that does not have constant source of energy to send data on a regular basis, like freights or
containers.
The data pusher, sending the coordinates periodically and using the cellular networks is the most
popular type of GPS tracker used nowadays. The data is sent via the GSM, 3G or 4G/LTE networks.
50
Page 52

Delta X. User’s Manual
The Delta X can detect the data pushing GPS trackers by detecting their periodical exchange with the
mobile network.
Algorithm of detecting the periodical exchange
Unlike the RF Sweep mode which detects all types of signals, the Car Tracker Detector mode is
concentrated on measuring activities on the cellular bands only. The other frequency ranges are not
scanned. Since the spectrum analyzer does not scan other frequencies, the update rate and the
probability of detection are higher and the reaction is quicker.
The bands to be monitored in the Car tracker detector are selected in the Settings – Bands. The ‘Tracker
detection’ check box allows the user to include the desired bands. It is recommended to include all the
cellular uplinks and exclude the downlinks and the wireless bands like Wi-Fi and DECT. The 4G/LTE
bands of a ‘Shared’ type should be included as well.
The Delta X system must be placed inside the checked vehicles. The detection algorithm is as follows:
All personal mobile phones and other carried cellular devices must be switched off or placed
into flight mode
All the known cellular devices built in the car (alarm systems, traffic statistics senders, etc.)
should be deactivated (switched off). If necessary, contact a car service for turning them off
temporarily
Go to a secondary road in the country to avoid external interferences. Start the Car tracker
detector mode. Like the other detection modes, the Car tracker detector allows the user to
select the log. Press the Start button to begin.
Typically trackers have a movement sensor; therefore the vehicle should move in order for the
tracker to be detected. Drive along secondary roads omitting cities, high traffic areas or
crowded places in order to avoid interferences from other external cellular devices
Since the frequency of the coordinate’s upload is unknown, driving and simultaneous
measurement during at least 1-2 hours is recommended.
Note: A car’s power point can be used to power the Delta X’s laptop
The periodical activity in the GSM, 3G or 4G/LTE bands with a moderate to high level may be a
sign of a GPS tracker. Watch the Alarms graph. The frequency of exchange may be every 10
seconds or 30 seconds or 5 minutes, for example.
In case of a large-sized vehicle repeat the test with the Delta X or its antenna placed in another
part of the car. Keep watching the danger level and the Alarms graph
The dBm threshold for the bands can be adjusted to achieve the best balance between the
sensitivity and any false detections. Typically for GSM it is not necessary to set a very high
sensitivity so the threshold can be between -60...-30 dBm in order to reject any external signals.
3G or 4G/LTE will demand the setting of a higher sensitivity with the threshold’s level at -85…-70
dBm.
The Alarm threshold can be adjusted when necessary
It is also possible to analyze the results later by reviewing the log.
Below is an example of a GPS tracker sending signals on the DSC-1800 band :
51
Page 53

Location change algorithm
Delta X. User’s Manual
There is another approach to detecting data pusher and data puller types of GPS trackers.
In addition to the periodical exchange (data pushing), the GPS tracking devices communicate with the
network when they change an area. The mobile network’s base stations are combined into areas with a
unique code. When a cellular device enters the area with another code it issues a location update
request, thereby informing the mobile provider of its new position. This allows the provider to locate
the cellular device in case of an incoming call.
If the GPS tracker does not perform periodical exchanges, the presence of a strong signal when the
vehicle is crossing the coded area’s border may discover the tracker.
The size and the borders of the coded area are unknown, but it can be supposed that if a vehicle moves
20-50 km in one direction the probability of changing the coded area and appearing of the data
exchange will be high. If there is an activity in certain place, the test may be repeated in the reverse
direction in order to check if the activity occurs again.
A high danger level may last 3-5 seconds in case of the presence of a ‘hidden in the vehicle’ cellular
device. Presence of a cellular device may be a sign of a GPS tracker.
While the Car Tracker Detector discovers the most popular GPS trackers on the move, the RF Sweep
mode can find the hidden devices of other types: beacons sending data by other means (Satellite/WiFi/VHF/UHF), bugs/radio-microphones, wireless cameras, etc. Additional usage of the RF Sweep mode is
recommended for a full check of the vehicle.
LF Probe
The transmission of information through wires is supposed to be more covert since there are no easy-todetect radio waves produced. Practically any wire lying within or crossing the target room and further
going outside the area can be used for listening. A bugging device of this type will consist of 2 units: a
transmitter located within the target area and connected to the wire and a receiver outside the target
52
Page 54

Delta X. User’s Manual
Wire
Input
Probe
AC wire
AC
AC Line
Landline telephone wires
TEL
Telephone probe with modular adapter
Ethernet cables
TEL
Telephone probe with modular adapter
Alarm cables
TEL
Telephone probe with modular adapter
Other low-voltage cables
TEL
Telephone probe with modular adapter
Infrared transmitter
IR
IR Line
Input selecting buttons
Selected input
Double click or click to
Click to tune in the
frequency
area connected to the same wire. The transmitter picks up the audio within the room, converts it up to a
higher frequency and sends the signal via the wire. The receiver picks up the signal from the wire,
converts it down and passes the audio to the voice recorder or monitoring post. The signal can be sent
via any type of wire while leaving it operable.
The following wires/channels can be inspected by the Delta X when it is in the LF Probe mode:
The Delta X checks the 30kHz – 10 MHz frequency range.
Elements and controls
The Delta X software has the following view in the LF Probe mode:
tune in signal
The Signals table shows the Common signals section and hides the Bands. The Spectrogram’s and
Waterfall’s span is initially set to display the entire LF range, although it is possible to adjust the span
and scroll to any frequency.
The first toolbar’s line contains the same controls which are present in the Signal Analyzer mode: Watch
Mode selection (Spectrum or Demodulate), Update Span selection, Number of readings and Frequency.
The second toolbar’s line contains controls specific to the LF Probe mode. The input selecting buttons
allow the operator to choose the desired input. The selection should be made after the probe is inserted
into the socket of the switcher-converter but before it is connected to the wire, AC outlet or directed to
the target zone in case it is the IR Line.
53
Page 55

Delta X. User’s Manual
Unlike the other detecting modes the LF Probe mode does not store the signals in the Signals table after
work is completed. The Signals table and the Waterfall are cleared each time the new input is selected.
The Zero function rejects the background RF emissions received by the probe. The rejection is
performed by storing the current spectrum trace for its subsequent extraction. The Zero function is
called automatically each time the input is changed. Do not call the Zero button when the probe is
connected to the wire/AC outlet or when the IR Line’s sensor is directed to the target zone. When
necessary, disconnect the probe from the wire/outlet or close the IR Line’s sensor and then press the
Zero button.
The Signals table and the Waterfall are cleared each time the Zero button is pressed.
The Full LF Range adjusts the span of the spectrum graphs to display the entire LF range.
Like in all other modes double clicking on a signal in the Signals table performs tuning in it. The
spectrum graphs adjust automatically to show the clicked signal fully. If the Detector is in the Signal
mode it will be assigned to the clicked signal. A single click tunes in a signal without adjusting the
spectrum graphs.
Clicking on the Spectrogram allows tuning in the desired frequency.
The Persistence view of the Spectrogram, when activated, allows the user to distinguish between the
continuous and non-constant signals.
AC wires
Warning: NEVER USE THE LOW-VOLTAGE PROBE WITH ALLIGATOR CONNECTORS FOR PROBING AC
WIRES.
Algorithm:
1. Create a source of sound in the room to activate the potential bugging devices and recognize
them during demodulation
2. Select the LF Probe mode in the Delta X software
3. Connect the AC Line probe to the AC socket on the front panel of the switcher-converter. If
necessary, connect the supplied extension cable between the probe and the switcher-converter
in order to reach remote AC outlets
4. Press the High voltage wire (AC) button in the software
5. Connect the probe to the AC outlet
6. All the signals excessing the threshold will be automatically inserted into the Signals table within
a second. Turn off the Audio alarm function if necessary or adjust the Alarm threshold.
7. Observe and learn the results of detection:
- Double-click or click the signals in order to review them in the spectrum graphs
- Select the Demodulate in the Watch Mode
- Click on all peaks within the Spectrogram in order to tune in precisely and listen to the
signal. Try to recognize signs of modulation. Change the demodulation mode and bandwidth
if necessary. Change the frequency slightly.
Please note that since the AC wire is an antenna itself, it receives a lot of RF emissions
present in our modern environment. Detection of interference signals is a normal situation.
54
Page 56

Delta X. User’s Manual
A ‘clean’ AC outlet. Just the interference signals are present
repeating in a number of outlets
Interference signals
Bugging signal
Bugging signal is seen. Measurement is made in the AC outlet at
Strong bugging signal and its harmonics are seen. Distance to
The task of the operator is to study all the signals in the Signals table and the spectral peaks
in the Spectrogram, analyze the levels, demodulate and make a decision about their safety.
- In case of finding a modulated signal with the audio of room, or a signal with an untypically
strong level, start a physical inspection along the suspicious wire.
8. Repeat the test on other AC outlets present in the target room and in the adjacent rooms.
- The interference signals might have approximately the same spectrum and strength on all
outlets connected to the same wire, while the bugging signal will rise as the measurement is
made closer to the point of bugging
- If a bugging signal is transmitted via the AC wire in a digital representation, it cannot be
demodulated. At the same time, a strong signal in a certain place and an untypical form of
spectrum might point to danger.
Below is an example of detecting a listening device on the AC wire:
the distance of 5 meters to the bug
the bugging device is 30 cm
55
Page 57

Delta X. User’s Manual
Wire
Connection type
Needed accessory
Terminals
Landline phone
RJ-11
(6 positions, 4
conductors)
Low-voltage spring probe,
modular adapter, cable 8-to-6,
adapter 8-to-6
1…4
Landline system
phone
RJ-12
(6 positions, 6
conductors)
Low-voltage spring probe,
modular adapter, cable 8-to-6,
adapter 8-to-6
1…6
Ethernet cable
RJ-45
(8 positions, 8
conductors)
Low-voltage spring probe,
modular adapter, cable 8-to-8,
adapter 8-to-8
1…8
Alarm cables
Direct
(alligator
connector)
Low-voltage spring probe
Other low-voltage
cables
Direct
(alligator
connector)
Low-voltage spring probe
Low-voltage wires - Telephone, Ethernet and alarm
The Delta X is supplied with the following accessories allowing the operator to test low-voltage wires:
Low-voltage spring probe with ‘alligator’ connectors
In-line modular adapter
Adapter ‘8 pin male to 6 pin female’
Adapter ‘8 pin male to 4 pin female’
Connection cable ‘8 pin to 8 pin’
Connection cable ‘8 pin to 6 pin’
Connection cable ‘8 pin to 4 pin’
For each type of wire a specific adapter should be used:
1. Create a source of sound in the room to activate any potential bugging devices and recognize
them during the demodulation
2. Select the LF Probe mode in the Delta X software
3. Connect the low-voltage spring probe to the TEL socket on the front panel of the switcher-
converter.
4. Press the Low voltage wire (TEL) button in the software
5. Connect the probe to the wire using the low-voltage probe, modular adapter and other
accessories:
Landline phone
The connection to the telephone can be made either at the phone set side or near the wall
socket, depending on the accessibility. Insert the male-to-female adapter into the modular
adapter tightly to provide the proper connection. Make sure the telephone stays operable after
the modular adapter is connected in-line. Below is an example of probing the phone line near
the phone set.
56
Page 58

Delta X. User’s Manual
Cable 8-to-6
Adapter 8-to-6
Telephone cable
Modular adapter
Low voltage probe
Low voltage probe
Modular adapter
Ethernet cable
Cable 8-to-8
Ethernet
The connection to the Ethernet can be made near the computer, wall socket or near the
network equipment (switch/router). Insert the male-to-female adapter into the modular
adapter tightly to provide the proper connection. Make sure the network stays operable after
the modular adapter is connected in-line. Below is an example of probing the Ethernet at the
computer:
Alarm and other low-voltage wires
Connection to other low-voltage lines, including alarm systems should be made with the help of
the low-voltage probe and its alligator connectors.
57
Page 59

Delta X. User’s Manual
The alarm’s movement detector should be disassembled in order to reach the terminals. The
procedure can be made on the control panel as well.
Please note, that alarm detectors, fire detectors and control panels are mostly tamperproof, i.e.
they alert the alarm monitoring center about disassembly. The procedure should be agreed with
the central monitoring station and performed with the presence of a technician.
6. Connect the alligator connectors to the terminals on the modular adapter in accordance with the
quantity of used conductors. The telephone lines may use 2, 4 or 6 conductors, while the Ethernet
employs 4 conductors from the 8 present in the twisted pair cable.
The modular adapter uses the following numeration of the terminals:
Since it is often unclear what particular conductors are used, all the combinations of the alligators
can be used for checking the line: 1 and 2, 2 and 3, 3 and 4, 1 and 3, 1 and 4, etc. The spectrum may
coinside in some pairs.
7. After connecting the alligators the measurement will start. The signals excessing the threshold
will be automatically inserted into the Signals table. Turn off the Audio alarm function if
necessary or adjust the Alarm threshold.
8. Observe and learn the results of detection:
- Double-click or click the signals in order to review them in the spectrum graphs
- Select the Demodulate in the Watch Mode
- Click on all peaks within the Spectrogram in order to tune in precisely and listen to the
signal. Try to recognize signs of modulation. Change the demodulation mode and bandwidth
if necessary. Change the frequency slightly.
Please note that since the wire is an antenna itself it receives a lot of RF emissions present in
our modern environment. Detection of interference signals is a normal situation. The task of
the operator is to study all the signals in the Signals table and the spectral peaks in the
Spectrogram, analyze the levels, demodulate and make a decision about their safety.
- In case of finding a modulated signal with the audio of room or a signal with an untypically
strong level start a physical inspection of the suspicious wire.
58
Page 60

Delta X. User’s Manual
9. If you are checking the phone line, perform the test off-hook and hung up
10. Repeat the test for all the combinations of pairs on the modular adapter, reconnecting the
alligators as necessary
11. Repeat the test for other telephone lines/Ethernet sockets present in the target room and in the
adjacent rooms.
- The interference signals might have approximately the same spectrum and strength on all
lines, while the bugged line will have different spectrum view and signal strength
- If a bugging signal is transmitted in a digital representation, it cannot be demodulated. At
the same time, a strong signal and an untypical form of spectrum might point to danger.
Infrared
Infrared rays are invisible and distribute relatively long distances; therefore they can be used for covert
transmission of information (bugging).
Since infrared rays have a directed nature, the potential IR bug will be directed to the place of the
signal’s reception i.e. outside the window. The detection should be performed in the windows’ area,
with the IR Line probe placed outside the window and pointed to the interior of the room, frames and
area near the frames. Keep the probe in the hand or use the action camera’s monopod and extension
cable if necessary (the monopod is not supplied with the Delta X).
The detection distance of the IR Line probe is 2-5 meters with the condition of being pointed to the
source.
Algorithm
1. Create a source of sound in the room to activate any potential bugging devices
2. Select the LF Probe mode in the Delta X software
3. Connect the IR Line probe to the IR socket on the front panel of the switcher-converter. If
necessary, connect the supplied extension cable between the probe and the switcher-converter
4. Press the Infrared (IR) button in the software
5. Cover (close) the probe’s sensor and press the Zero button. Keep the sensor covered for few
seconds
6. Point the IR Line probe to the place of possible bugging (from outside the window to the interior
and frames)
7. If an infrared signal is detected, it will be automatically inserted into the Signals table.
8. In case of finding a signal, rotate the probe in different directions in order to find the strongest
level, which will mean that the probe is directed to the transmitter. Move the probe closer to
the supposed source while observing the change of level. Try to find the place with the highest
danger level. The Audio alarm function will change the intensity of sound correspondingly. In
the place where the strongest level is found start a physical inspection. If the entire area
produces a low to average level of danger, and there is no one place with a strong signal, it may
mean just the presence of interference.
9. Repeat the test near other windows
59
Page 61

Delta X. User’s Manual
Very low frequency
The MLP Line probe allows the operator to find signs of hidden working electronics by detecting radiofrequency emissions. The detection distance is up to 30 cm; therefore the objects and surfaces must be
probed carefully.
1. Create a source of sound in the room to activate any potential bugging devices
2. Select the LF Probe mode in the Delta X software
3. Connect the MLP Line probe to the MLP socket on the front panel of the switcher-converter. If
necessary, connect the supplied extension cable between the probe and the switcher-converter
4. Keep the probe far from the electronics and objects to be inspected and press the Very low
frequency (MLP) button in the software
5. Start scanning the area (objects, surfaces, constructions, etc.) while observing the change of the
danger level. The Audio alarm function will produce sound of changing intensity, depending on
the level.
6. All the signals (parts of spectrum exceeding the threshold) will be inserted into the Signals table
automatically. Their dBm and Danger levels will be updated during the search
7. Try to find the source of the highest signal by moving the probe in different directions. It is
normal that metallic objects and construction re-emit the RF fields, producing a high danger
level. Working electronics will create a high level with a specific spectrum form.
8. Use the demodulation when it is necessary to inspect a suspicious signal. The probe should stay
near the source during this operation.
60
 Loading...