

Kingst LA1016, LA2016, LA1002, LA1010, LA5016 User Manual

Kingst Virtual Instruments User Guide
www.qdkingst.com
2016-8-20
1
Virtual Instruments
User Guide
Qingdao Kingst Electronics Co., Ltd.
Web:www.qdkingst.com
Email:service@qdkingst.com

Kingst Virtual Instruments User Guide
www.qdkingst.com
2016-8-20
2
Contents
I. Overview ............................................................................................................. 4
1、 Basic knowledge ................................................................................................................. 4
2、 Product series ...................................................................................................................... 4
3、 Technical specification ....................................................................................................... 5
II. Brief introduction to Kingst VIS .................................................................... 7
1、 How to install software ....................................................................................................... 7
2、 Brief introduction to GUI ................................................................................................... 7
3、 Language switch ................................................................................................................. 8
4、 Brief introduction to the demo function.............................................................................. 8
III. Connect the device ....................................................................................... 10
1、 Connect the device to PC .................................................................................................. 10
2、 Connect the device to system under test ........................................................................... 10
3、 Multipoint grounding to increase accuracy ....................................................................... 11
IV. Details of operations ...................................................................................... 12
1、 Sampling depth and sampling rate settings ....................................................................... 12
2、 Trigger condition settings ................................................................................................. 12
3、 Get the waveform ............................................................................................................. 13
4、 Waveform check and operations ....................................................................................... 14
5、 Waveform measurement ................................................................................................... 15
6、 Analyzers .......................................................................................................................... 16
7、 Channels settings .............................................................................................................. 18
8、 Save the settings and data ................................................................................................. 20
9、 Export the data .................................................................................................................. 20
10、 PWM generator ............................................................................................................... 21
V. Settings for standard protocols ..................................................................... 23
1、 UART/RS232/485 ............................................................................................................ 23
2、 I2C .................................................................................................................................... 24
3、 SPI .................................................................................................................................... 24
4、 CAN .................................................................................................................................. 25
5、 Simple Parallel .................................................................................................................. 26
6、 1-Wire ............................................................................................................................... 27

Kingst Virtual Instruments User Guide
www.qdkingst.com
2016-8-20
3
7、 DMX-512 ......................................................................................................................... 27
8、 UNI/O ............................................................................................................................... 27
9、 User-defined protocol analyzer ......................................................................................... 27
VI. FAQs .............................................................................................................. 29
1、 Driver installation fail with the device connected to computer ........................................ 29
2、 Identification fail or work unstably with the device connected to the computer .............. 29
3、 Signal glitches appear on individual channels .................................................................. 29
4、 The actual sample time is less than expected when the depth is set to a large value ........ 29
5、 Auto update of the software fails ...................................................................................... 30
VII. Contact us ................................................................................................... 31
Kingst Virtual Instruments User Guide
www.qdkingst.com
2016-8-20
4
I. Overview
1、 Basic knowledge
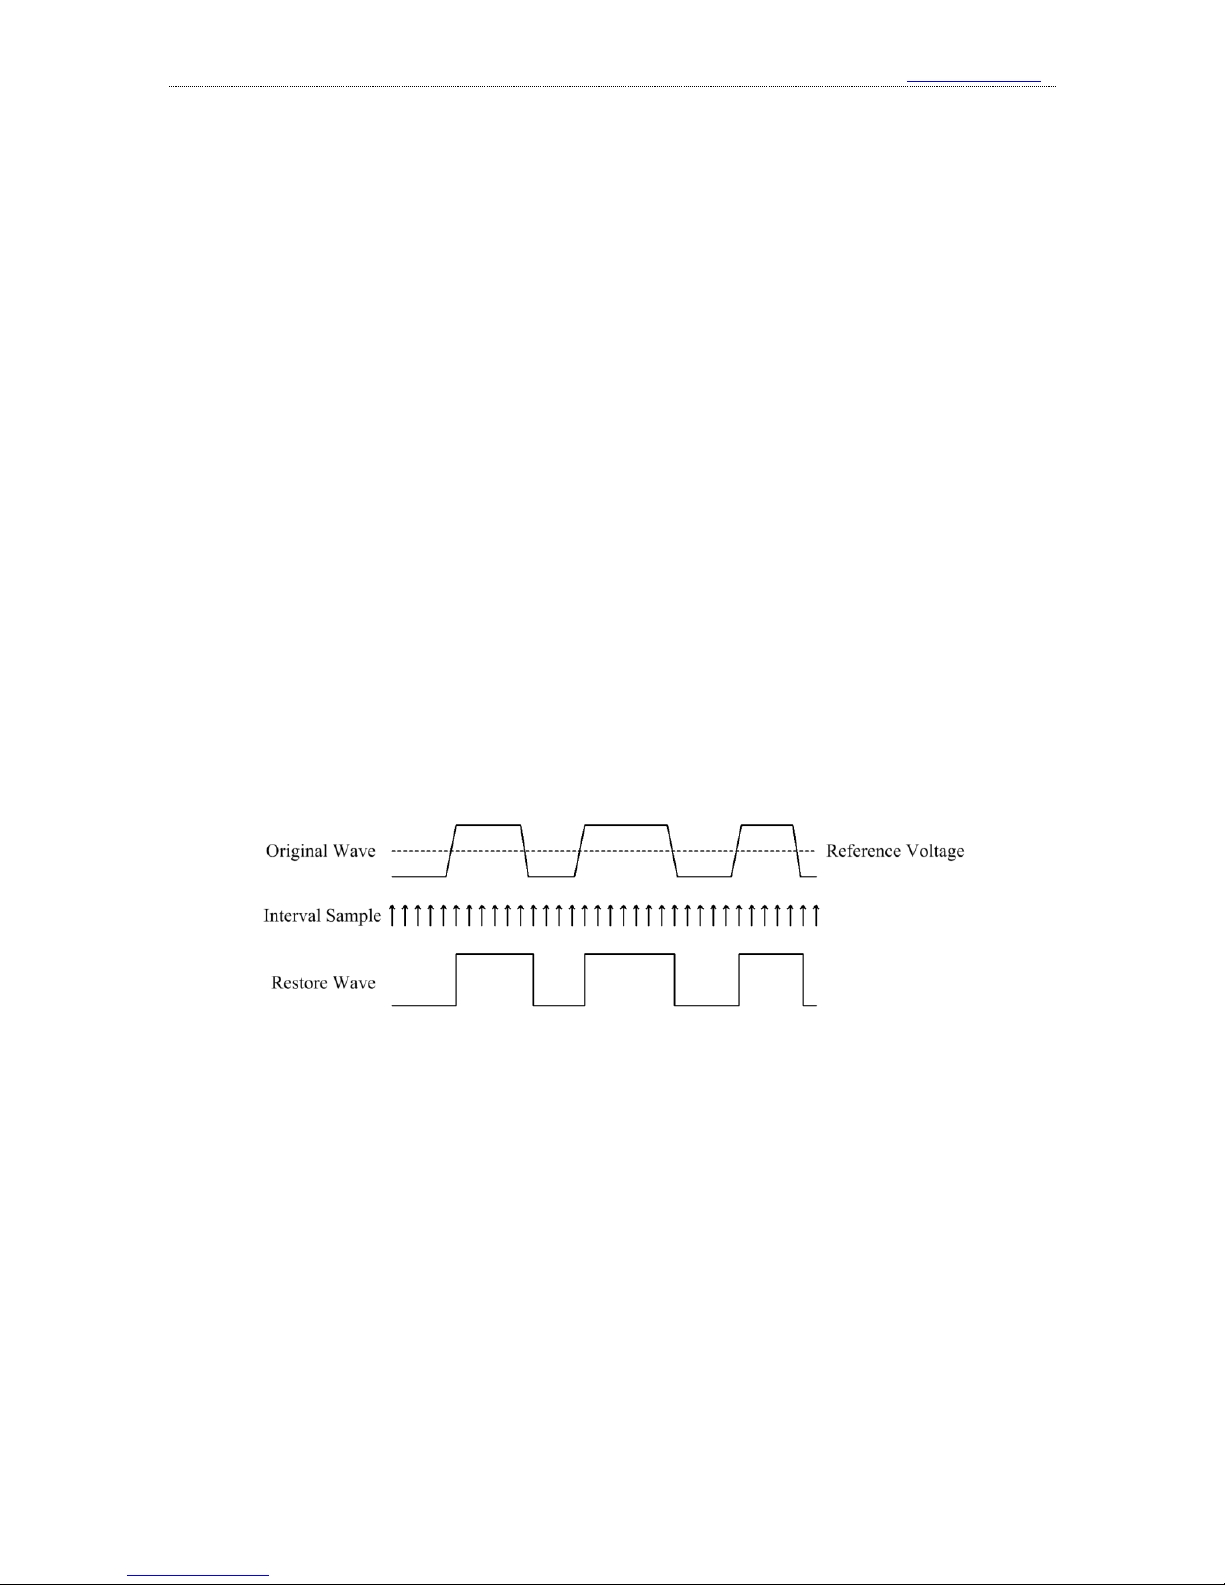
Logic analyzer is the instrument that collects and displays the digital signal from the devices
under test. It is mainly used for timing judgement an analysis. Unlike the oscilloscope with many
voltage grades, It has only two grades(Logic one and Logic zero). .After the reference voltage is set,
the logic analyzer could decide from the test signal that the signal above the reference voltage is
logic one, and the signal below is logic zero. The digital waveform is formed with 1 and 0.
Compared with the oscilloscope, when testing and measuring the digital systems like MCU, ARM,
FPGA and DSP, the logic analyzer could provide better accuracy, much more data and more
complicated measuring methods.
For example, if you are sampling a signal with the logic analyzer, the sample rate of which is
1Mhz, and the reference voltage(Threshold voltage) is set to 1.5V, the logic analyzer would
compare the current voltage with 1.5V. The signal above 1.5V would be high level(logic 1), and the
signal below 1.5V would be low level(logic 0). Thus we get a sample point, and then we could link
all these points(logic 1 and logic 0) to get a waveform, in which the user could see and analyze the
timing of the signal, logic errors and the relation between each other.
The figure below shows how the logic analyzer samples the signal:
2、 Product series
Kingst logic analyzer product family consists of two series: the LAx016 series with sampling
memory and LA1000 series without sampling memory.
LAx016 series is integrated with large-capacity memories. The sampled data would be saved
in the internal memory while the device is sampling the signal. After the sampling process the data
would be sent to the computer, and it would be restored back to original waveform and analyzed.
As the sampling memory could offer the sampling bandwidth that is extremely high, so the device
could sample all the channels in high sampling rate. This series consists of LA5016 with the
highest sampling rate of 500M, LA2016 with the sampling rate of 200M and LA1016, the sampling
rate of which is 100M.
Sampling memory doesn’t exist in LA1000 series. When the device is sampling the signals,

Kingst Virtual Instruments User Guide
www.qdkingst.com
2016-8-20
5
the data will be sent to the computer at the same time. The PC software compresses and the data
and saves them in PC memories, and then it would restore the waveform and analyze it. As the data
needs to be sent to the computer and saved in real time, so the bandwidth is limited to the USB2.0
speed, that is, 480Mbps. As a result, when the device works with high sampling rate, only some of
the channels could be used. If you want to use all the channels, you have to reduce the sampling
rate. This series consists of LA1010 with with the highest sampling rate of 100M and LA1002, the
sampling rate of which is 24M.
3、 Technical specification
LAx016 Series:
Product type
LA1016
LA2016
LA5016
Input
Number of channels
16
16
16
Max sampling rate
100MHz
200MHz
500MHz
Measurement bandwidth
20MHz
40MHz
80MHz
Min detectable pulse width
20ns
12.5ns
6.25ns
Hardware storage size
1Gbits
1Gbits
1Gbits
Hardware sampling depth
50M/channel
50M/channel
50M/channel
Max compression depth
10G/channel
10G/channel
10G/channel
Input voltage range
-50V~+50V
-50V~+50V
-50V~+50V
Input impedance
220KΩ,12pF
220KΩ,12pF
220KΩ,12pF
Threshold voltage
Adjustable: -4~+4V
Min step: 0.01V
Adjustable: -4~+4V
Min step: 0.01V l
Adjustable: -4~+4V
Min step: 0.01V
PWM
Output
Number of channels
2 2 2
Output frequency range
0.1~20MHz
0.1~20MHz
0.1~20MHz
Min step of period
10ns
10ns
10ns
Min step of pulse width
5ns
5ns
5ns
Output voltage
+3.3V
+3.3V
+3.3V
Output impedance
50Ω
50Ω
50Ω
Power
supply
Power supply port
USB2.0/3.0
USB2.0/3.0
USB2.0/3.0
Standby current
130mA
150mA
200mA
Max active current
260mA
300mA
400mA
PC
software
Supported protocols
UART/RS-232/485, I2C, SPI, CAN, DMX512, HDMI CEC,
I2S/PCM, JTAG, LIN, Manchester, Midi, Modbus, 1-Wire, UNI/O,
SDIO, SMBus, SWD, USB1.1, PS/2, NEC Infrared, Parallel, etc.
Supported OS
Windows XP、Vista、Windows 7/8/10(32bit/64bit)

Kingst Virtual Instruments User Guide
www.qdkingst.com
2016-8-20
6
LA1000 Series:
Product type
LA1002
LA1010
Input
Number of channels
8
16
Max sampling rate
24M@8CH
100M@3CH, 50M@6CH
32M@9CH, 16M@16CH
Measurement bandwidth
5MHz
20MHz
Min detectable pulse width
80ns
20ns
Max sampling depth
10G/channel
10G/channel
Input voltage range
0V~+5V
-50V~+50V
Input impedance
220KΩ,12pF
220KΩ,12pF
Threshold voltage
≤1.0V Low level
≥2.0V High level
Adjustable: -4~+4V
Min step: 0.01V
PWM
Output
Number of channels
--
2
Output frequency range
--
0.1~10MHz
Min step of period
--
10ns
Min step of pulse width
--
10ns
Output voltage
--
+3.3V
Output impedance
--
50Ω
Power
supply
Power supply port
USB2.0/3.0
USB2.0/3.0
Standby current
50mA
100mA
Max operating current
80mA
150mA
PC
software
Supported protocols
UART/RS-232/485, I2C, SPI, CAN, DMX512, HDMI CEC,
I2S/PCM, JTAG, LIN, Manchester, Midi, Modbus, 1-Wire, UNI/O,
SDIO, SMBus, SWD, USB1.1, PS/2, NEC Infrared, Parallel, etc.
Supported OS
Windows XP, Vista, Windows 7/8/10(32bit/64bit)
Kingst Virtual Instruments User Guide
www.qdkingst.com
2016-8-20
7
II. Brief introduction to Kingst VIS
1、 How to install software
Kingst virtual instruments software Kingst VIS could be found in the attached CD, or
downloaded from the web page: http://www.qdkingst.com/en/download. And the software package
is something like KingstVIS_Setup_v2.0.0.exe (v2.0.0 represents the version).
Double click the package file to execute the installation program. The procedure is similar
with the common software in windows, and there are instructions that you could follow in every
step. In the last step, you should install the driver program of hardware device, and you will see the
dialog as the figure below(there could be differences between different OSs). Please select
“Install” to complete the procedure.
After the install procedure is complete, a shortcut like would be created in the start menu
and desktop, and then the Kingst VIS software could be accessed with this shortcut.
2、 Brief introduction to GUI
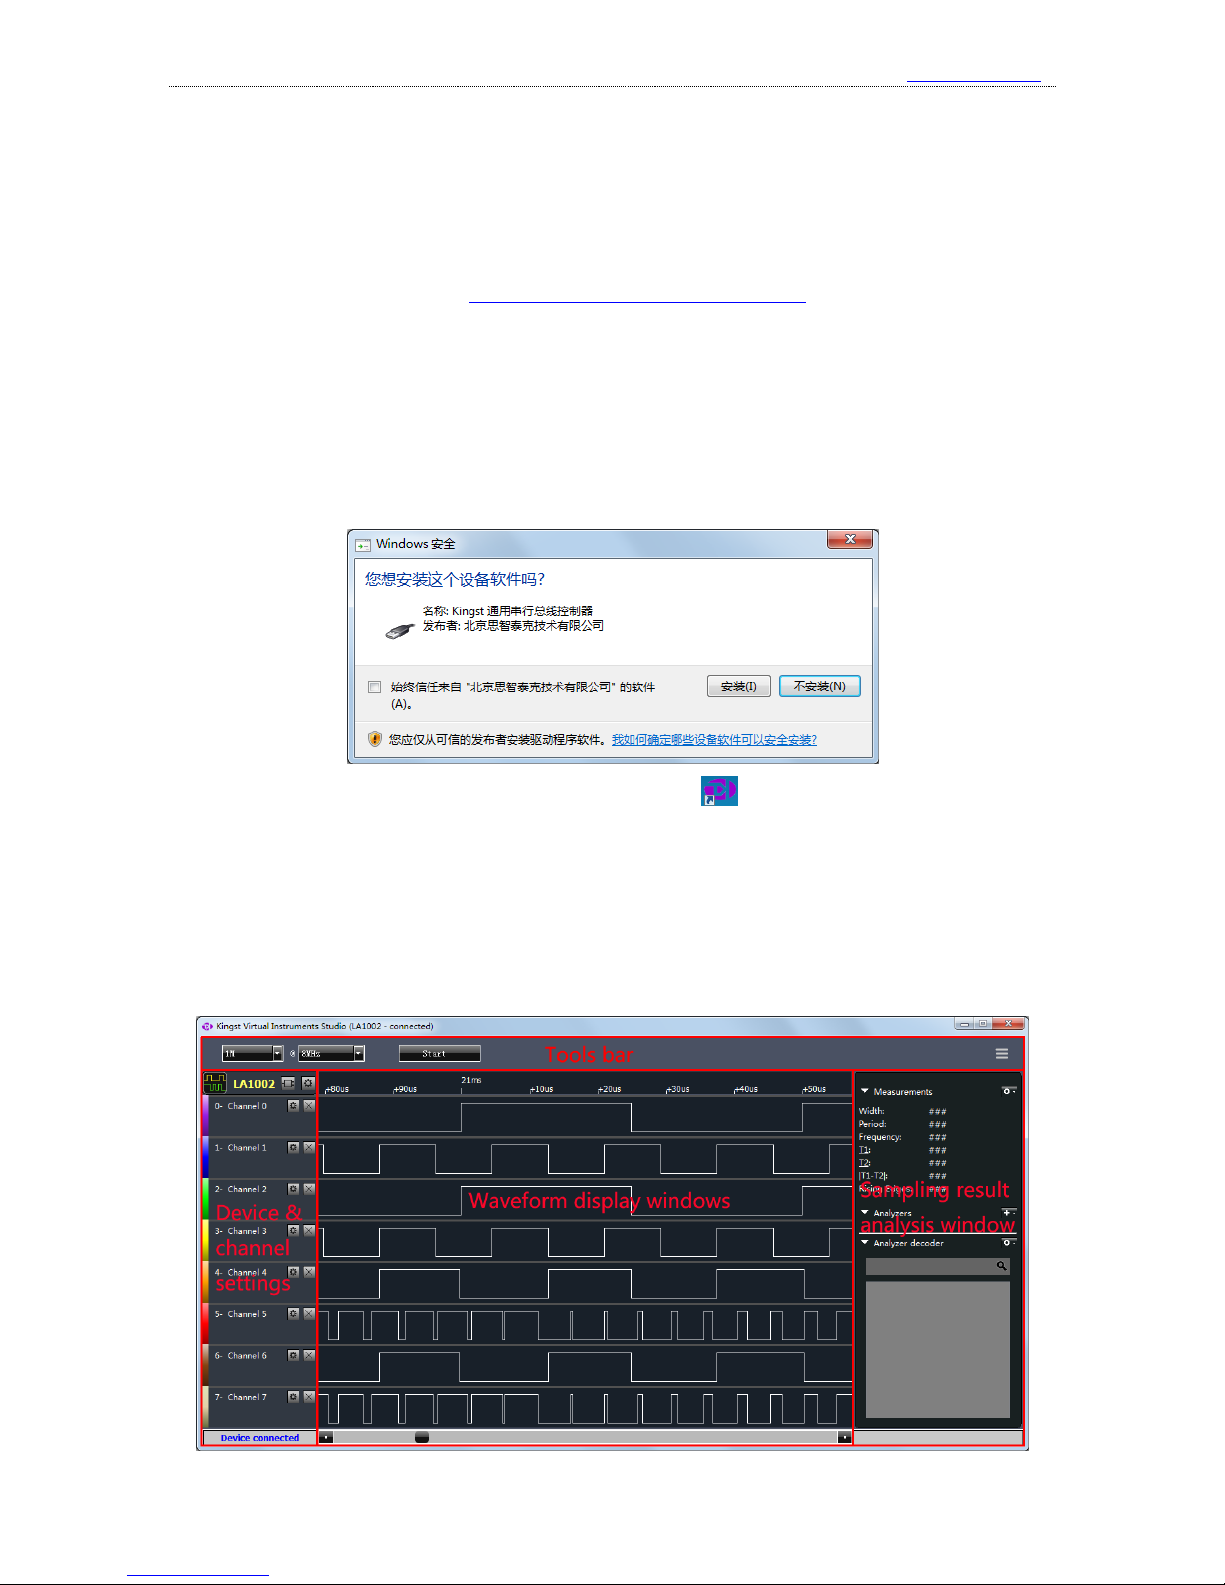
When the software is started through start menu or desktop shortcut, you will get a screen
similar to the figure below. The detailed information of the software would be introduced in
Chapter 4, and here is only a brief introduction.

Kingst Virtual Instruments User Guide
www.qdkingst.com
2016-8-20
8
As shown in the figure above, the software interface could be divided in several parts:
①. Tools bar:top of GUI, including common settings of the current device and the main menu
button of the top right corner.
②. Device and channel settings: left side of GUI, shows selected or connected device type,
and next is the number and name of current measurement channels.
③. Waveform display window: middle of GUI, the topmost is the timeline. The sampled
waveform displays in the middle and a scroll bar is below it.
④. Sampling result analysis window: right side of GUI, the top half shows measurement
results that are frequently used, and you can add analyzer decoder and see the results on the
bottom half.
3、 Language switch
The Kingst VIS software could display in “English/简体中文”. If you want to change the
language, please press the “Options” button in the top right corner, move the mouse to the menu
item “Language”, and select the language. The selection would become effective after the software
is restarted.
4、 Brief introduction to the demo function
The software could provide demo function. You can simulate the functions without the actual
hardware, and you could get a good experience of the software through this function.
All Kingst virtual instruments share the same Kingst VIS
software. As shown in the right figure, there is a device control
bar on the left side of the software. The icon of left side represents that logic analyzer is the current
device, and the text in the middle means the
selected device is LA1002. If you press the
first button on the right side, as the right figure
shows, you could see all the devices supported.
You could select any device that you want.
After you press “OK”, you could evaluate and
Kingst Virtual Instruments User Guide
www.qdkingst.com
2016-8-20
9
experience the device that you selected.
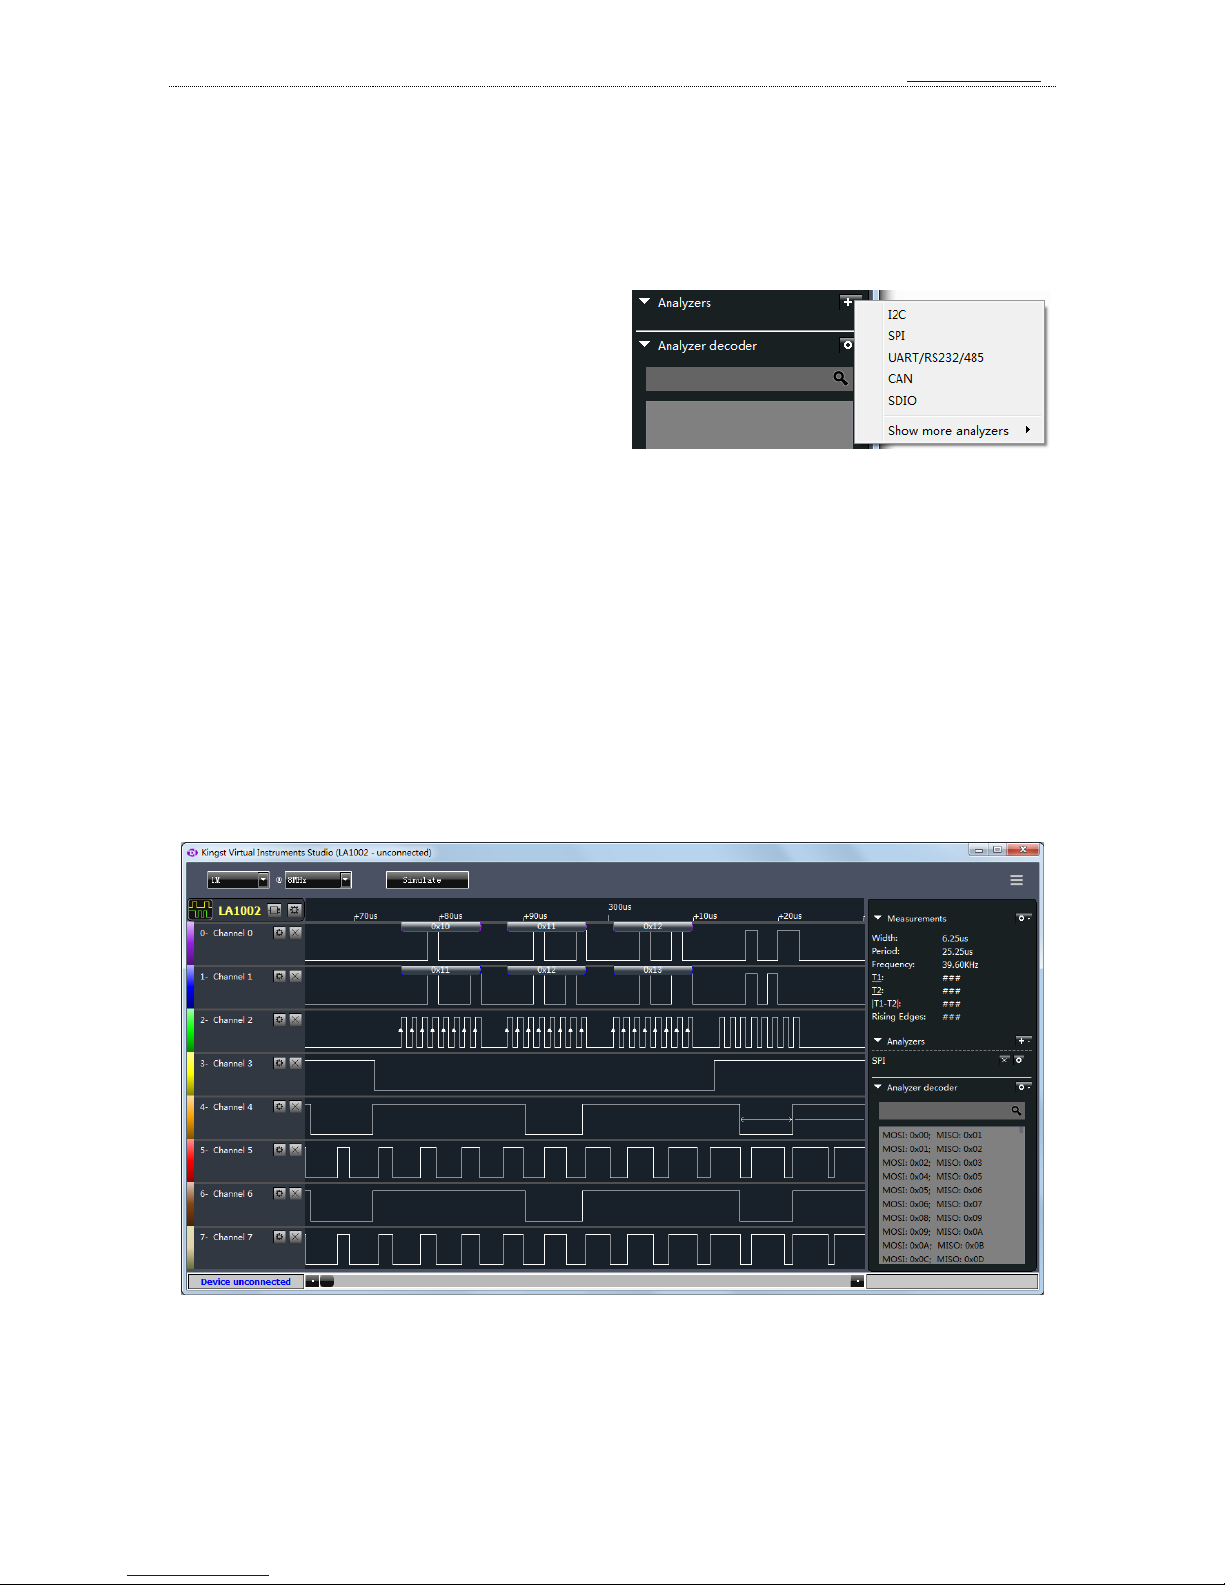
After the “Simulate” button on the toolbar is pressed, the software would simulate the work
process as the actual device exists. And the software would eventually display some square wave or
pulse signals.
One of the key functions of the logic
analyzer is that, it could analyze the signal that
complies with some standard protocol. Here we
take SPI as an example, to give a brief
introduction. Find the “Analyzers” on the right
side of GUI, press the “+” button, and select “SPI” from the popped menu. We will get a analyzer
settings dialog, the settings on which are default. Next we can press the “Simulate” menu on the
toolbar, and we will get the SPI signal waveform on the channels 0-3, with the analyzer result. And
other channels still show random square wave or pulse signal(as the figure below shows).
One of the key functions of the logic analyzer is that, it could analyze the signal that complies
with some standard protocol. Here we take SPI as an example, to give a brief introduction. Find the
“Analyzers” on the right side of GUI, press the “+” button, and select “SPI” from the popped menu.
We will get a analyzer settings dialog, the settings on which are default. Next we can press the
“Simulate” menu on the toolbar, and we will get the SPI signal waveform on the channels 0-3, with
the analyzer result. And other channels still show random square wave or pulse signal(as the figure
below shows).
If you click the left button without releasing, you could drag the waveform. More details are
covered in following chapters.

Kingst Virtual Instruments User Guide
www.qdkingst.com
2016-8-20
10
III. Connect the device
1、 Connect the device to PC
When the installation process is completed, the logic analyzer can be connected to PC through
the attached USB cable (In case of desktop computer, use the USB port behind the tower box).
Then the computer would report that new hardware has been found. In Windows XP, there would
appear a driver installation dialog, and just select to install automatically. In Windows 7/8/10, a
dialog would appear in the top right corner of the screen. Then the install process would start
automatically, and we just need to wait for a while. After the installation process is completed, a
new device called “Kingst Instrument-Logic Analyzer” would appear in “Device
Manager->Universal Serial Bus”.
After the device is connected to PC and the driver has been
installed, the device would be connected automatically when we
open the software. When the connection is complete, as shown in the right figure, the device bar on
the top left side of GUI would display current device type. The icon on the left side means that the
current device is a logic analyzer. And through the two buttons on the right side, you could select
other devices or change the settings of current device. The detailed information would be
introduced in chapter 4.
Besides, the status bar of the bottom left side shows the connection status of current device.
“Device connected” means the device hardware has been connected to PC successfully and ready
to work, while “Device unconnected” means the device hardware is not connected to the USB port
of PC, or because there is something wrong, the device could not work normally.
2、 Connect the device to system under test
Please note that the logic analyzer and the computer share the same ground, so the voltage
between the GND of system under test and the GND of the computer should be zero. Especially
when the system is connected to the force electricity, please make sure the isolation is made. If
devices with force electricity like frequency transformer are not isolated through the isolation
transformer, the system would be connected to the force electricity. And if you connect the logic
analyzer to such a system, the logic analyzer even the computer would be broken. And the damage
could be beyond repair, so the isolation should be made in advance.
When the logic analyzer is connected with the system under test, you should first connect the
GND channel to the system under test, and then connect the signal channels. There are 16 channels
in the logic analyzer. It means that up to 16 digital signals could be tested simultaneously. If the
number of existing signal is less than 16, the channels could be selected at will. The channel
numbers of the software correspond to that of the hardware device.
In addition, when measuring the signal with high speed, the measuring lines of logic analyzer
 Loading...