

Page 1

Keysight Technologies B1505A
Power Device Analyzer/Curve Tracer
Step by Step Measurement
Handbook for Power BJT
Page 2

Page 3

Introduction
Agilent B1505A Power Device Analyzer/Curve Tracer is a powerful tool for measuring and characterizing power devices.
This power bipolar junction transistor (BJT) measurement handbook covers how to
measure the typical power BJT parameters found in power BJT specifications or
data sheet as shown in table 1. Each test is covered with step by step instructions of
cable connection to the power BJT and the parameter setting of the test, and you
can easily setup the test and execute it by just following the guide.
The step by step measurement handbook covers;
●
A cable connection from the instrument to the device terminal,
●
A test setup of the measurement parameters and the data extraction scheme,
●
A test execution and analysis on EasyEXPERT software which is resident in
B1505A and provides all the control of the B1505A.
A customized Application Test Library is created for testing the specifications introduced in this measurement handbook. They can be downloaded from the Agilent
web site and you can use them by importing to your B1505A. They include the Application Test library and the test definitions, and you can start measurements right
away.
Measuring power devices sometimes requires special knowledge of both the device
and the measuring instruments.
For example, the high voltage breakdown test sometimes requires a series resistor
connected between the High voltage SMU (HVSMU) and the collector of power BJT
to measure the breakdown characteristics or to protect from a damage of the device
from an unusual device breakdown.
The connection between SMU and the power BJT requires a different technique
than the power MOSFET because the base current of the power BJT is relatively
higher, and the voltage drop by the connection cable and the contact cannot be ignored.
You can perform accurate measurement by following the steps of setup and the
measurement instructions of this measurement handbook.
3
Page 4
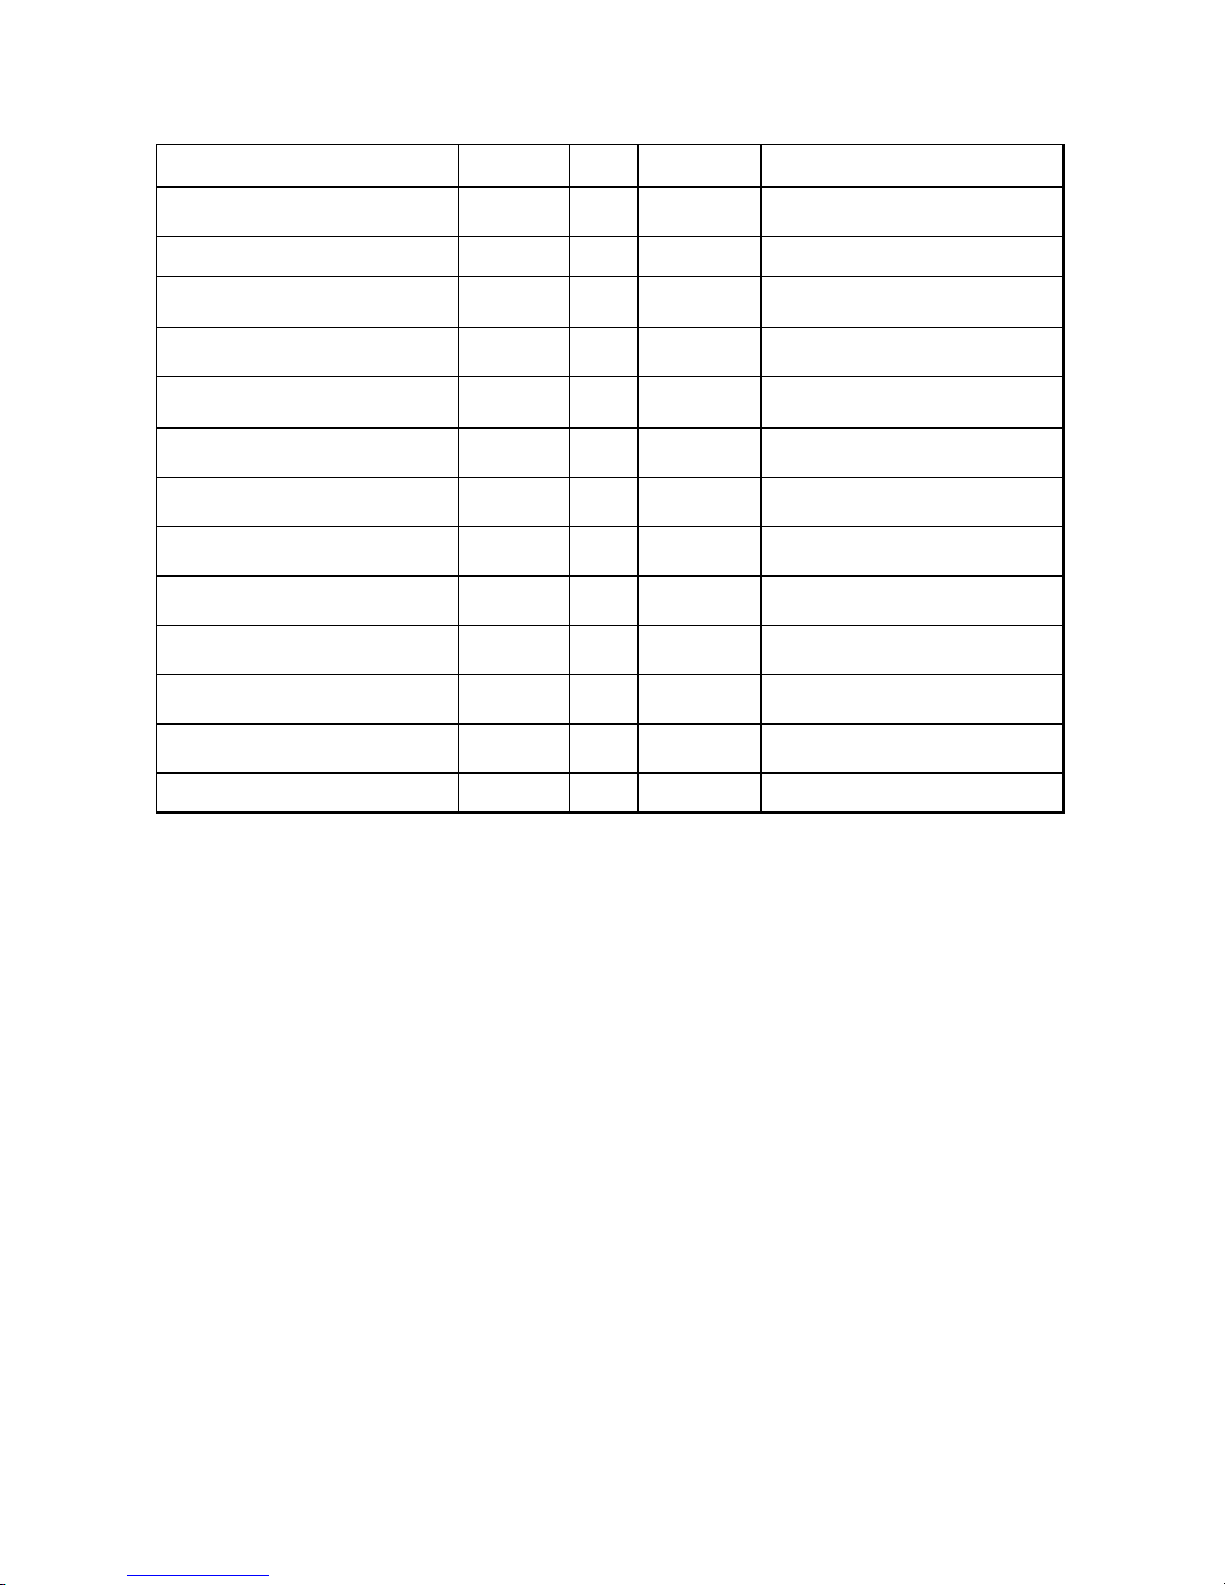
Table 1. Typical DC and Capacitance parameters of power BJT and the compatibility of the B1505A.
Typical power BJT Parameter Symbol Unit Measurement*1Typical Measurable Range of B1505A
Collector Current Ic A Ic-Vce
DC Current gain h
Collector Emitter Sustaining Voltage V
Collector Emitter Breakdown Voltage V
Collector-Emitter Cut-off Current I
Collector-Base Voltage V
Collector-Base Cut-off Current I
Emitter-Base Voltage V
Emitter Cut-off Current I
Collector-Emitter Saturation Voltage V
Base-Emitter Saturation Voltage V
Base Emitter ON Voltage V
Collector-Emitter Voltage (Base-Emitter
short)
FE
CE(SUS)
(BR)CEO
CEO
CBO
CBO
EBO
EBO
CE(sat)
BE(sat)
BE(on)
CES
V
Ic-Ib 1 ~ 10000 *
V Ic-Vceo
A Ic-Vceo
V Ic-Vcbo
A Ic-Vcbo
V Ie-Vebo
A Ie-Vebo
V Vce(sat)-Ic
V Vce(sat)-Ic
V Ic-Vbe
V Ic-Vces
(Minimum 200 µV resolution) *
(Minimum 200 µV resolution) *
(Minimum 200 µV resolution) *
-40 A to 40 A
(Minimum 10 fA resolution) *
3
-3,000 V to 3,000 V
-8 mA to 8 mA
(Minimum 10 fA resolution) *
-3,000 V to 3,000 V
-8 mA to 8 mA
(Minimum 10 fA resolution) *
-20 V to 20 V
(Minimum 2 µV resolution) *
-1 A to 1 A
(Minimum 10 fA resolution) *
-20 V to 20 V
(Minimum 2 µV resolution) *
-20 V to 20 V
(Minimum 2 µV resolution) *
-20 V to 20 V
(Minimum 2 µV resolution) *
-3,000 V to 3,000 V
Output Capacitance Cob pF C-V Better than 1% at C<10 nF *
2
4
4
5
4
6
7
6
6
6
5
8
Note: *1: Measurement used for extracting the parameter.
*2: With two HCSMUs and requires Dual HCSMU Combination Adapter.
*3: Rule of thumb (Example (Ic/Ib): 20 A/20 A ~ 1 A/100 µA)
*4: HVSMU. Maximum 4 mA at 3 kV, 8 mA at 1,500 V.
*5: HVSMU
*6: HPSMU and HCSMU. 2 µV resolution at 2 V range.
*7: HPSMU at 20 V range
*8: Max. 3,000 V DC bias with High-voltage Bias T adapter.
4
Page 5

Table of Contents
Chapter 1. Basic Knowledge of the B1505A
1-1. Agilent B1505A Power Device Analyzer/Curve Tracer
1-2. Agilent N1259A Power Device Fixture
1-3. EasyEXPERT Software
●
Application Test
●
Classic Test
●
Tracer Test
Chapter 2. Preparation for the Measurements
2-1. Before using the B1505A
2-2. Instruments and Accessories used in the measurement examples
2-3. Devices used in the measurement examples
2-4. Cable Connection between the B1505A and the N1259A Test Fixture
2-5. Starting the B1505A
Chapter 3. Measurements of Data Sheet Specifications of Power BJTs
3-1. Application Test Example
3-1-1. Ic - Vce measurement
3-1-2. hFE and Vbe(on) versus Ic measurement
3-1-3. Vce(sat) and Vbe(sat) versus Ic measurement
3-1-4. Vce(sus) or V(BR)ceo, and Iceo-Vce measurement
A. Without 100 kΩ collector series resistor
B. With 100 kΩ collector series resistor
3-1-5. BVcbo and Icbo-Vcb measurement
3-1-6. BVebo and Iebo-Veb measurement
3-1-7. BVces and Ic-Vces measurement
3-1-8. Cob-Vc measurement
3-2. Classic Test and Tracer Test Example
3-2-1. Ic-Vce Tracer Test
3-2-2. Vce(sat) and Vbe(sat) versus Ic Classic Test
3-2-3. 100 kΩ resistor precision measurement for Vce(sus) Application Test
5
Page 6

Appendix
Appendix 1. Supplemental Information for Preparation
A1-1. Download the example file-set from the Agilent web site
A1-2. How to return to Workspace management page
Appendix 2. Preparation for the Measurements using the Module Selector
A2-1. Instruments and Accessories used in the measurement examples
A2-2. Cable Connection between the B1505A and the N1259A Test Fixture
A2-3. Connection inside the N1259A Test Fixture
Appendix 3. Configuration for 40 A output
A3-1. Instruments and Accessories used for 40 A configuration
A3-2. Cable Connection between the B1505A and the N1259A Test Fixture
A3-3. EasyEXPERT configuration before starting a measurement
Appendix 4. Before returning the demo-B1505A
A4-1. Saving the measured data
A4-2. Deleting the workspace and measured data
6
Page 7
Chapter 1. Basic Knowledge of the B1505A
This chapter provides basic B1505A related information that is better to know before you proceed this
material.
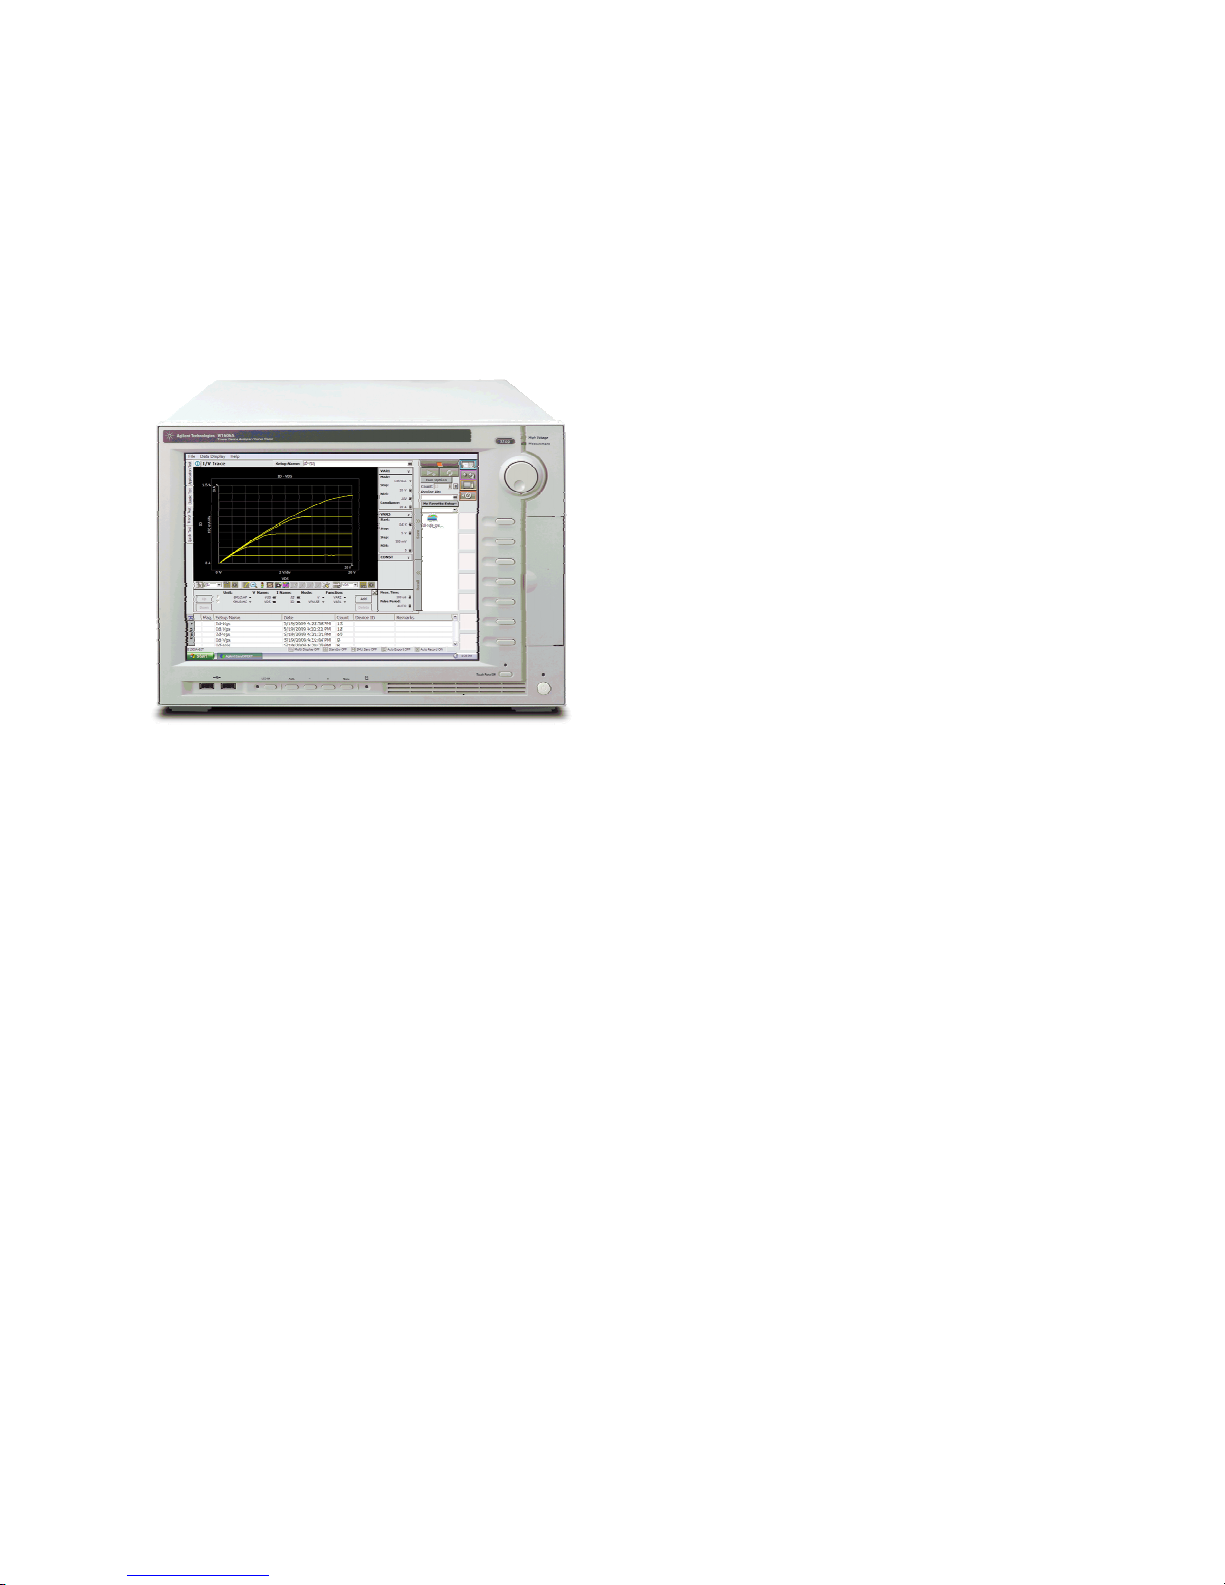
1-1. Agilent B1505A Power Device Analyzer/Curve Tracer
Agilent B1505A Power Device Analyzer / Curve
Tracer is designed for measuring present power devices. B1505A uses the EasyEXPERT software, a
specially-designed Microsoft Windows® application
program.
The B1505A can measure wide range of power devices from 10 fA to 40 A and 2 µV to 3,000 V with
3,000 V CV measurement features.
The EasyEXPERT software, which is resident on the
B1505A, provides an intuitive and flexible data management and analysis environment.
B1505A has 10 module slots, which support the following modules
B1510A High Power SMU (HPSMU) 10 fA~1 A/2 µV~200 V
B1512A High Current SMU (HCSMU) 10 pA~1 A/200 nV~40V (DC) or 10 pA~20
A/200 nV~20 V (Pulse)
B1513A High Voltage SMU (HVSMU) 10 fA~4 mA/200 µV~3000 V or 10 fA~8
mA/200 µV~1500 V
B1520A Multi Frequency CMU (MFCMU) 1 fF~10 nF @ 1 MHz for power BJT pa-
rameters with 0~3000 V DC bias by using High Voltage Bias-Tee adapter.
Output and measurement range of each module are visually shown in figure 1-1.
7
Page 8

Output and measurement range of each module are visually shown in figure 1-1.
(A) HPSMU Output and Measurement range
Current
1A
500mA
125mA
-200V
-100V
100V
Voltage
200V
-1A
(B) HCSMU Output and Measurement range
Current
20A
40V
20V
Pulse
10A
1A
-20V 20V
-1A
-10A
-20A
DC
Voltage
40V-40V
Figures 1-1. Output and measurement range.
(C ) HVSMU Output and Measurement range
Current
8mA
4mA
-3000V
-1500V
- 4mA
- 8mA
1500V
Voltage
3000V
1500V Range
3000V Range
8
Page 9

1-2. Agilent N1259A Power Device Fixture
Figures 1-2. Agilent N1259A Test Fixture
Opt 022
Opt 033
Agilent N1259A Power Device Fixture shown in figure 1-2 is used for measuring packaged power devices, It can basically covers the B1505A`s maximum
output range; 40 A and 3 kV.
We use N1259A option 020 High Voltage Bias-Tee
and option 022 100 kΩ resistor (optional) shown in
figure 1-3.
The module selector option 300 is handled in the
appendix section.
We do not use options 033 1 kΩ resistor in BJT application.
Option 020 High Voltage Bias-Tee is required if you
perform a CV measurement with more than 25 V DC
bias, and it expands the DC bias range up to 3 kV
with HVSMU. You can perform the CV measurement
without Option 020 if the requirement of maximum
bias voltage is less than 25 V which can be output
from MFCMU-self.
Opt 020
Opt 300
(Output)
Figure 1-3. N1259A Opt 020, 022, 033 and 300
Protective resistor
1 00kΩΩΩΩ
R
HVSMU
Option 022 100 kΩ resistor is basically used by inserting a 100 kΩ resistor in series between the
HVSMU and the collector of the power BJT as
shown in Figure 1-4.
GNDU
Figure 1-4. Option 022 Series R inserted between the collector and the collector HVSMU.
9
Page 10

Figure 1-5. Simplified connection diagram using
N1259A Option 300 Module Selector
Note:
We are not using Option 300 Module Selector which
is convenient for automatically switching the measurement resources between the HVSMU, HCSMU and
HPSMU without manually re-connecting the cables
between the power BJT and each SMU. Figure 1-5
shows a simplified image of Module Selector connected to the collector of the power BJT.
We can simplify the test setup in the example by not
using Option 300 and it becomes more versatile for
many users. If you have option 300 installed in the
N1259A, then you can simply use this option by properly interpreting the step by step instruction for the
collector connection.
However the instructions for using the module selector are covered in the appendix section.
10
Page 11
1-3. EasyEXPERT Software
The Easy EXPEERT software as a graphical user interface (GUI) of the B1505A has
three types of TEST mode, Application Test, Classic Test and Tracer Test. Each TEST
mode has its unique features and using an appropriate TEST mode that fits to your
test requirement is important for getting a better result sooner. Following describes
briefly about the B1505A`s TEST mode.
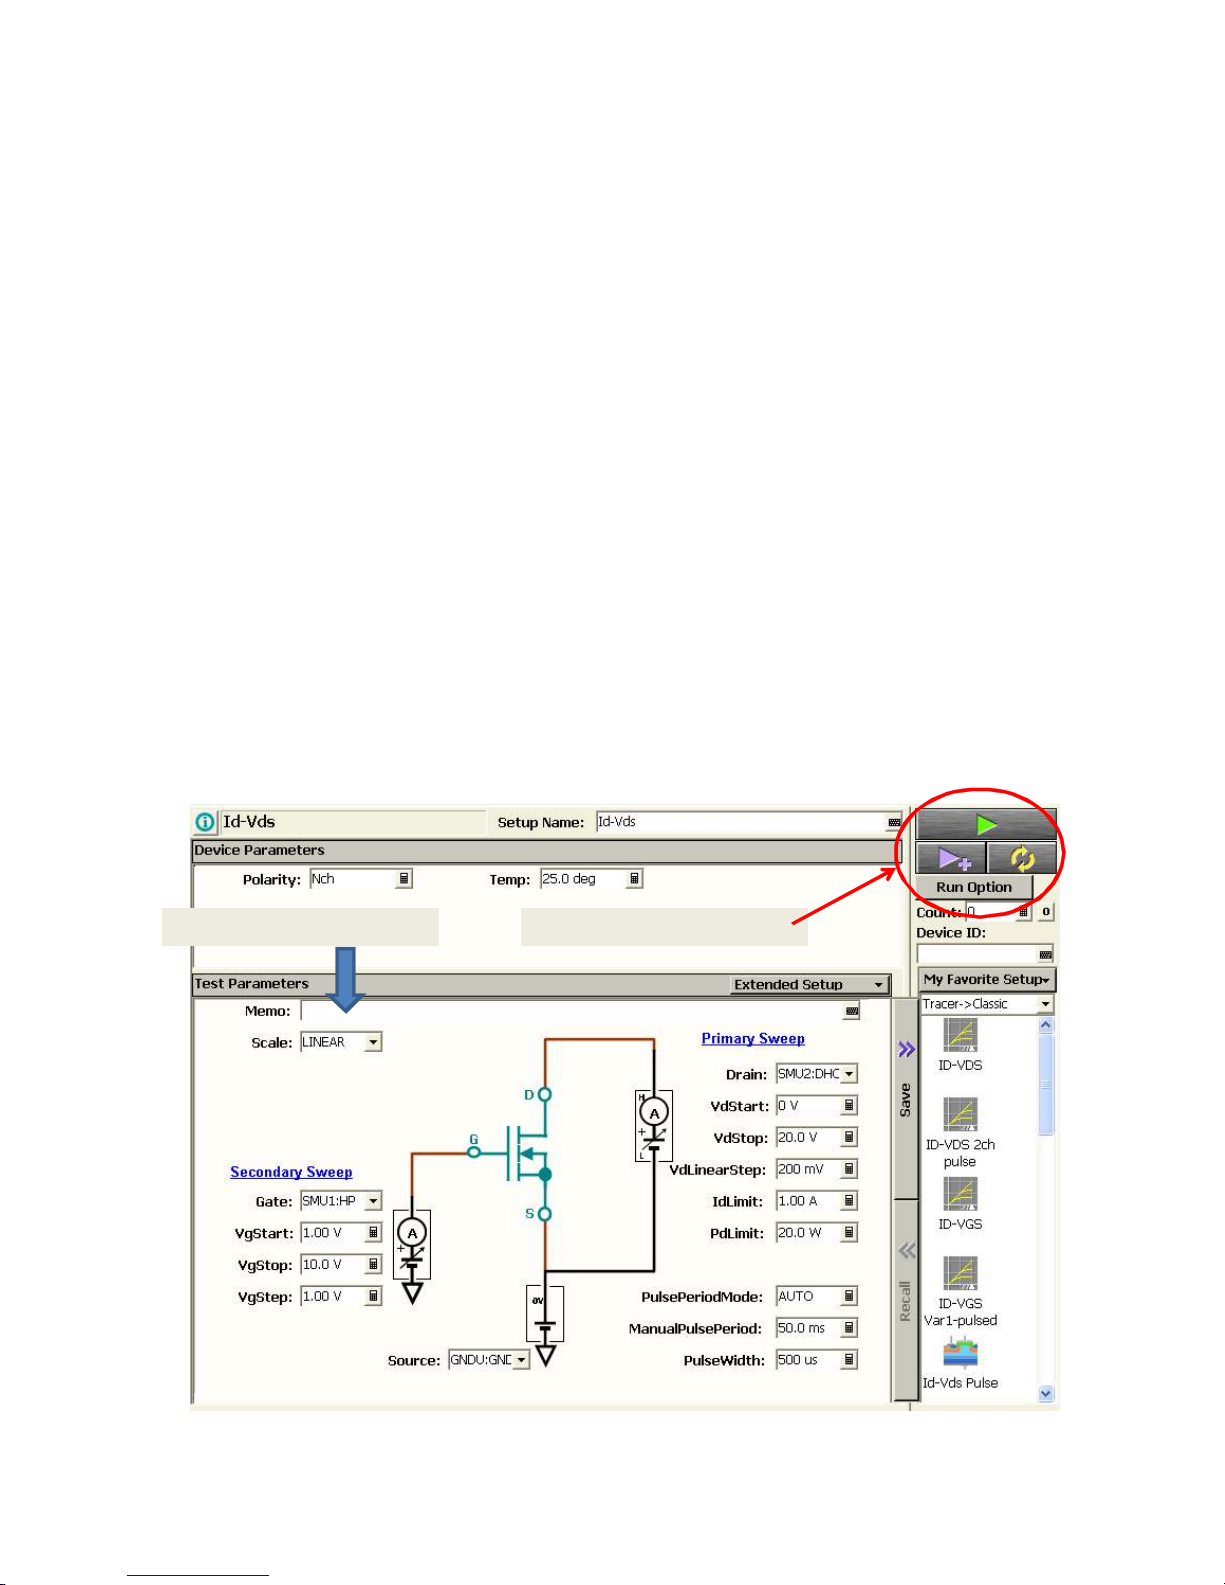
Application Test mode
The Application Test mode shown in figure 1-6 is a pre-defined test library coming
with the B1505A and it includes a basic and frequently used test, for example, Id-Vd
measurements. The user can start measurements by just typing in the measurement
parameters and the test results with a proper data which is automatically extracted
by the measurement is coming out by just pressing the Measure button.
We use improved Application Test definitions which are slightly modified version
from the original version included in the B1505A. You can find the instruction for
installing these files used in the handbook in the next section
It is simple and very easy for adding modifications like the example. You can refer to
the application note B1500A-4 “Customizing Agilent B1500A EasyEXPERT Applica-
tion Tests”, Agilent P/N: 5989-5167EN.
As a conclusion, Application Test is the best choice if it satisfies your requirement.
If not, there are two choices; one is to modify the existing Application Test definition, and the other is going to Classic Test mode.
1. Enter the Test Parameters 2. Press the Measure Button
Figure 1-6. Application Test GUI
11
Page 12

1.
Classic Test mode
Classic Test is used inside of the Application Test definition as a main measurement
engine for defining and executing a test. Classic Test can be used itself as a standalone test engine and it can define a unique test. The user interface of the Classic
Test mode adopts the same concept of the Agilent Semiconductor Parameter Analyzers and anyone can get used to handle this interface easily. Any application that
is not covered in the Application Test library can be covered by using the Classic
Test mode.
Figure 1-7 shows an example Classic test setup window where 1. Channel Setup
page, 2. Measurement Setup page and 3. optional SMU parameter setup sub-panels
and 4. Display setup page that is minimum pages you have to fill in before starting
measurements.
2.
3.
4.
Figure 1-7. Example Classic Test measurement parameter setup panels.
12
Page 13

Setting up a new Classic Test definition requires more knowledge as like the connection between the device and SMUs of the B1505A and the function setup of the
SMUs as shown in figure 1-8 compared to the pre-defined Application Test. Generally speaking, the user can interact more directly to the SMU control in the case of
Classic Test compared to the Application Test which is somewhat black box to the
user until knowing the inside setup by sneaking in the Application Test definitions.
After you create a new Classic Test definition, you may have two choices; one is
continuously using that Classic Test definition or the other is converting the Classic
Test definition to a new Application Test definition. Creating a new Application Test
is effective if the new test definition is used by many people for relatively long period because you can add more information to the user or operator through the Application Test GUI and it can be considered as a simple record of the test definition.
Note: The Classic Test example setups used in the example application Test definitions are included in the same example file set of the Application Test.
You can modify the measurement details such as user function, auto-analysis and
display items by using the example setups.
Tracer Test mode
Tracer Test mode shown as an example in figure 1-9 provides a real time feedback
in controlling the measurements like a curve tracer and it is useful as a debugging
tool for characterizing or quick check of a new or unknown devices. In the Tracer
Test mode, you can change the measurement parameters while the test is repeatedly executed, for example, the collector voltage of the Id-Vd sweep can be manually changed by rotating a knob of the B1505A like rotating a voltage dial of the
curve tracer.
Figure 1-8 shows an example of Tracer Test measurement example.
Figure 1-8. Example Tracer Test mode GUI.
13
Page 14

There are other ways for using the Tracer Test mode.
Since the Tracer Test setup can be easily converted to a Classic Test setup, You can
use Tracer Test mode as an easy test setup and test debugging tool.
The example test setup features will automatically set complicated test setup, and
the interactive measurement control features help for debugging the new test setup.
Then, you can convert the completed setup to a Classic test for repeated use with a
fixed measurement parameters or adding extra display traces and analysis functionalities such as automatic markers or lines.
This handbook introduces measurement examples of power BJT specification
mainly by using Application Test setups. However, a few examples are shown in
section 3-2 for Classic Test mode and Tracer Test mode.
14
Page 15

Chapter 2. Preparation for the Measurements
2-1. Before using B1505A
WARNING
There are potentially hazardous voltages (3000 V for HVSMU, and 200 V
for HPSMU) present at the Force, Sense, and Guard terminals of Agilent
B1505A. To prevent electrical shock, the following safety precautions
must be observed during the use of B1505A.
●
Use a three-conductor AC power cable to connect the cabinet (if
used) and B1505A to an electrical ground (safety ground).
●
You must connect an interlock cable between B1505A and the test
fixture.
●
Confirm periodically that the interlock function is functional.
●
Do not modify the interlock circuit.
●
Do not use extension cables for connecting the DUT the outside of
the test fixture.
●
Before touching the connections on the Force, Guard, and Sense ter-
minals, turn the B1505A off and discharge any capacitors. If you do
not wish to turn the B1505A off, complete all of the following items,
regardless of the B1505A settings.
- Press the Stop key to turn the module output off.
- Confirm that the High Voltage indicator is not lit.
- Open the shielding box access door.
- Discharge any capacitors connected to an SMU.
15
Page 16
2-2. Instruments and Accessories used in the measurement examples
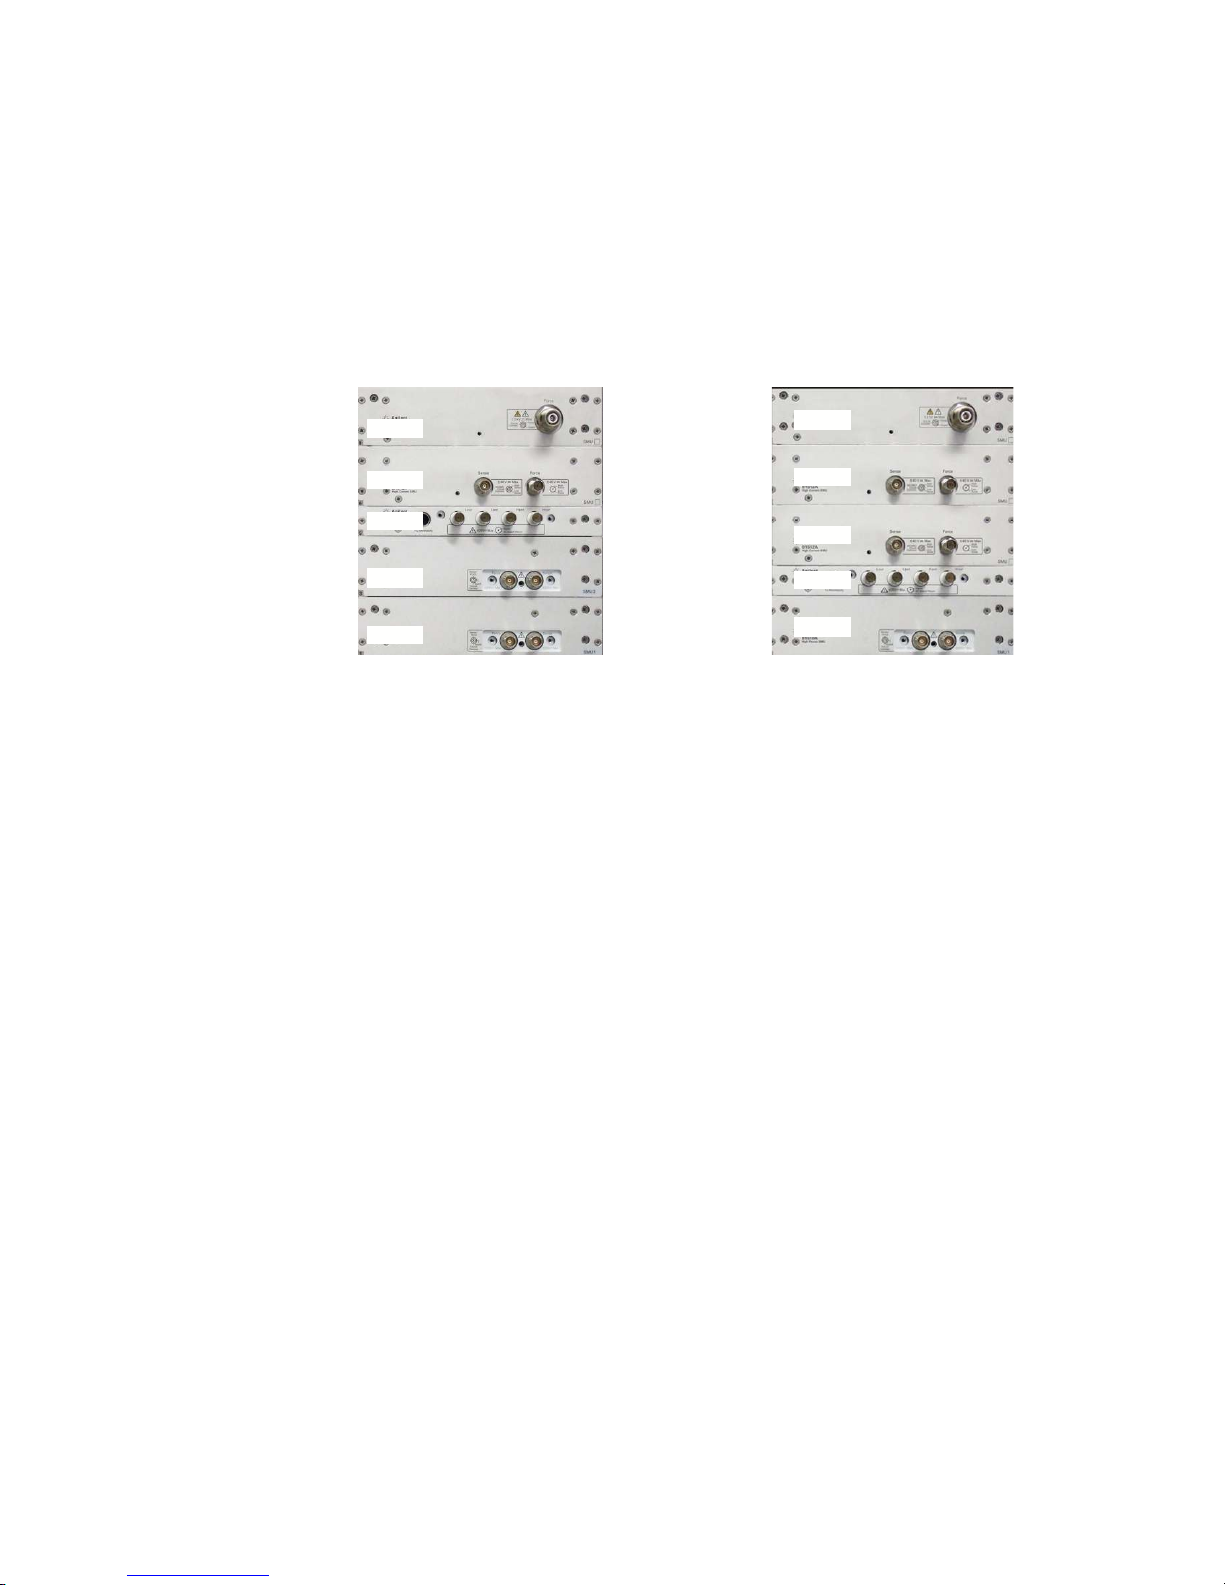
We use the following two B1505A configurations in the measurement example,
Both configurations are used for 20 A collector output. The difference is the maximum base current is limited to 1 A in the configuration of figure 2-1(A) that uses
two HPSMUs and one HCSMU, but the other configuration that uses one HPSMU
and two HCSMUs (figure 2-1(B)) can drive more than 1A by using one of HCSMUs.
You can use the same example files by just replacing the corresponding SMU
names.
HVSMU
HVSMU
HCSMU
MFCMU
HPSMU
HPSMU
(A) Two HPSMU and one
HCSMU configuration.
(B) Two HCSMU and one
HPSMU configuration.
Figure 2-1. B1505A configuration used in the example.
Agilent B1505A Power Device Analyzer/Curve Tracer
2 x HPSMU and 1 x HCSMU configuration:
●
1 X HVSMU (B1513A) High Voltage SMU
●
1 X HCSMU (B1512A) High Current SMU
●
2 X HPSMU (B1510A) High Power SMU (Note: only one HPSMU is used in
the example)
HCSMU
HCSMU
MFCMU
HPSMU
●
1 x HPSMU and 2 x HCSMU configuration:
●
●
●
●
16
1 X MFCMU (B1520A) Multi-Frequency CMU
1 X HVSMU (B1513A) High Voltage SMU
2 X HCSMU (B1512A) High Current SMU
1 X HPSMU (B1510A) High Power SMU
1 X MFCMU (B1520A) Multi-Frequency CMU
Page 17
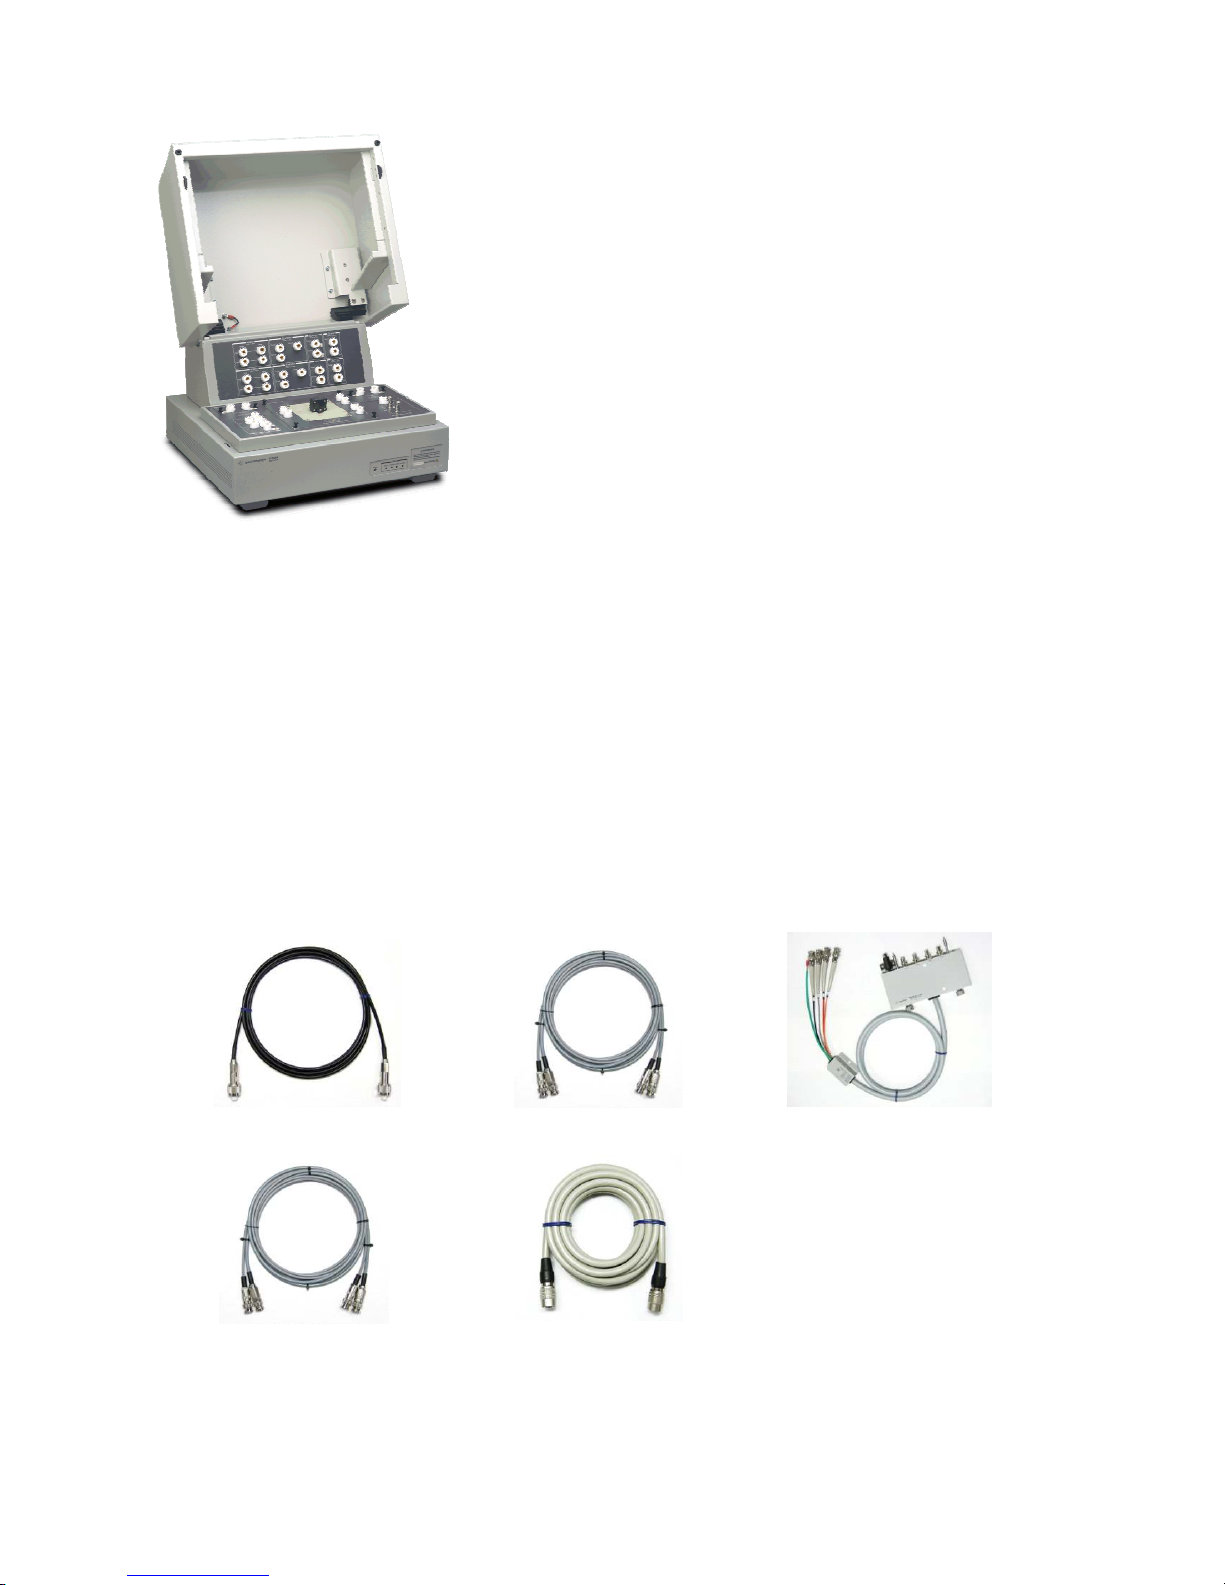
Following shows the N1259A test fixture configuration and cables
used for connecting between B1505A and the N1259A.
Agilent N1259A High Power Test Fixture
●
Opt 020 High Voltage Bias Tee
●
Opt 300 Module Selector (Optional: Check appendix section for
using the Module Selector)
●
Opt 010 Inline package socket module (3 pin)
●
Opt 022 100 kΩ R-Box (Optional)
●
Opt 033 1 kΩ R-Box (Not used in BJT applications)
●
(10 X Test leads, 2 X SHV cables and SHV-Banana adapters are in-
cluding in the N1259A)
Figures 2-2. Agilent N1259A Test
Fixture
16493T HV Triax
Cables
(2x HCSMU configuration is noted in parenthesis for each items)
●
1 X 16493S HCSMU Cable (2 X for 2x HCSMU config.)
●
1 X 16493T HV Triax Cable
●
4 X 16494A Triax Cable (2 X for 2x HCSMU A config.)
●
1 X 16493L GNDU Cable
●
1 X N1300A CMU Cable
●
1 X 16493J Interlock Cable
16494A Triax Cable N1300A CMU Cable
Figure 2-3. Cables used for connecting between the B1505A and the N1259A
16493J Interlock Cable16493T HCSMU Cable
17
Page 18
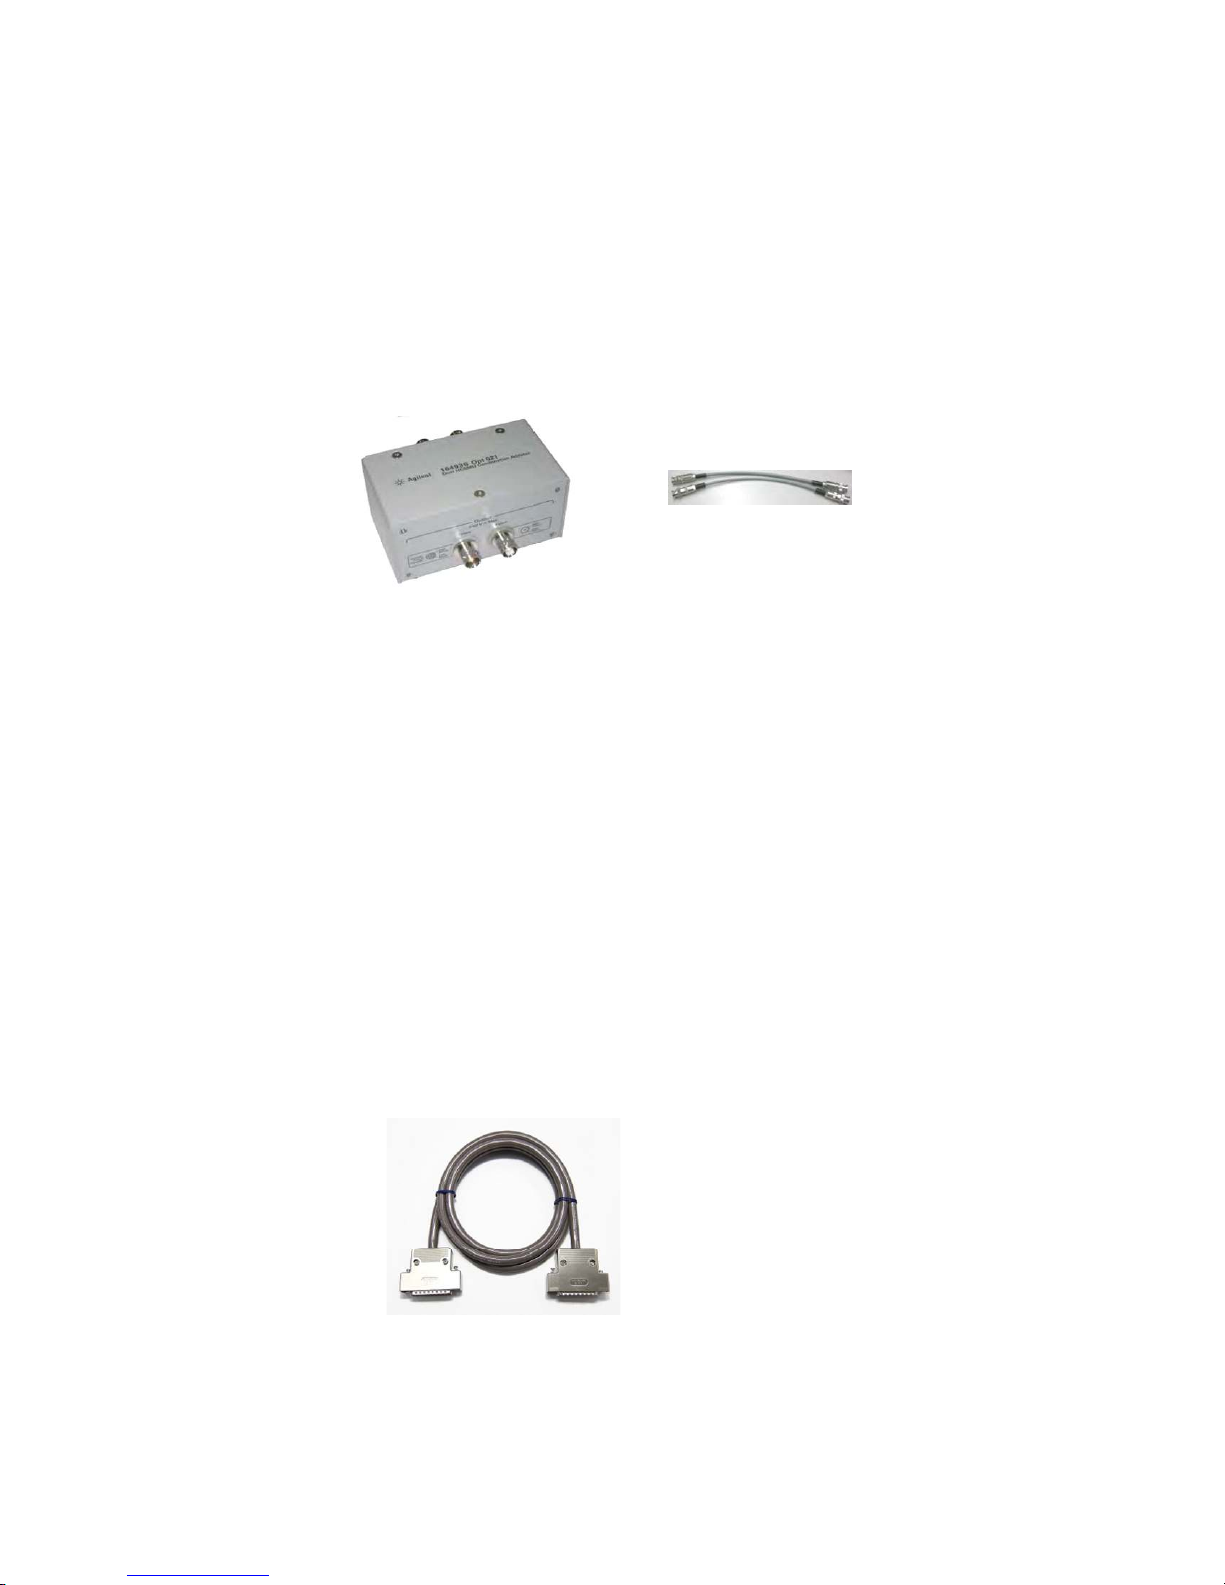
Optional Items:
The following adapter and the cable are required for configuring the 40 A solution by
using two HCSMU modules. The configuration for 40A solution is introduced in the
appendix section.
Optional accessories (for 40A configuration only)
●
1 X 16493S Opt 021 Dual HCSMU Combination Adapter
●
1 X 16493S Opt 021 cable
16493S Opt 021
(40 A option)
16493S Opt 021 Cable
(40 A option)
Figures 2-4. Cables used for 40 A configuration
Note:
Digital I/O cable shown in figure 2-5 is used for controlling the N1259A Option 300
Module Selector.
Since the Module Selector is not used in this section, there is no need for connecting this cable at the moment.
However Module Selector is handled in the appendix section where the N1259A
Option 300 Module Selector is used for automatically switching between HCSMU
and HVSMU.
16493G Digital I/O Cable
(Optional for N1259A Opt 300)
Figure 2-5. Digital I/O Cable
18
Page 19

2-3. Devices used in the measurement examples
The following device is used in the measurement examples of this handbook.
MJL4281AG is a high-power BJT for audio application, and this transistor is used in
both the high current and high voltage measurement examples. This power BJT
used in the examples in the next chapter is suitable for showing the full capabilities
of the B1505A`s performance in a wide range of applications.
Even in case a different power BJT is used, the example test setup of this handbook
is not being affected by which power BJT is used, and the user can just enter appropriate parameters depending on the specification of the power BJT used.
Power BJT specifications
MJL4281AG (NPN) – High-power audio applications
●
Bce(sus), V(BR)ceo: > 350 V (Ic=50 mA, Ib=0 A)
●
Iceo: < 100 µΑ (Vce=200 V, Ib=0 A)
●
Vcbo: > 350 V (Absolute Maximum)
●
Icbo: < 50 µΑ (Vcb=350 V, Ie=0 A)
●
Vebo: > 5 V (Absolute Maximum)
●
MJL4281AG
Iebo: < 5 µΑ (Veb=5 V, Ic=0 A)
●
Ic < 30 A (Pw < 5 ms, Duty <10 %)
●
PD 230 W (Tc=25 degC)
●
hFE 80 - 250 (Vce=5 V, Ic=0.1 ~ 5 A)
>50 (Vce=5 V, Ic=8 A)
>10 (Vce=5 V, Ic=15 A)
●
Vbe(on) < 1.5 V (Vce=5 V, Ic=5 A)
●
Vce(sat) < 1 V (Ic=8 A, Ib=0.8 A)
●
Vbe(sat) < 1.4 V (Ic=8 A, Ib=0.8 A)
●
Cob: < 600 pF (Vcb=10 V, Ie=0 A, f=1 MHz)
19
Page 20
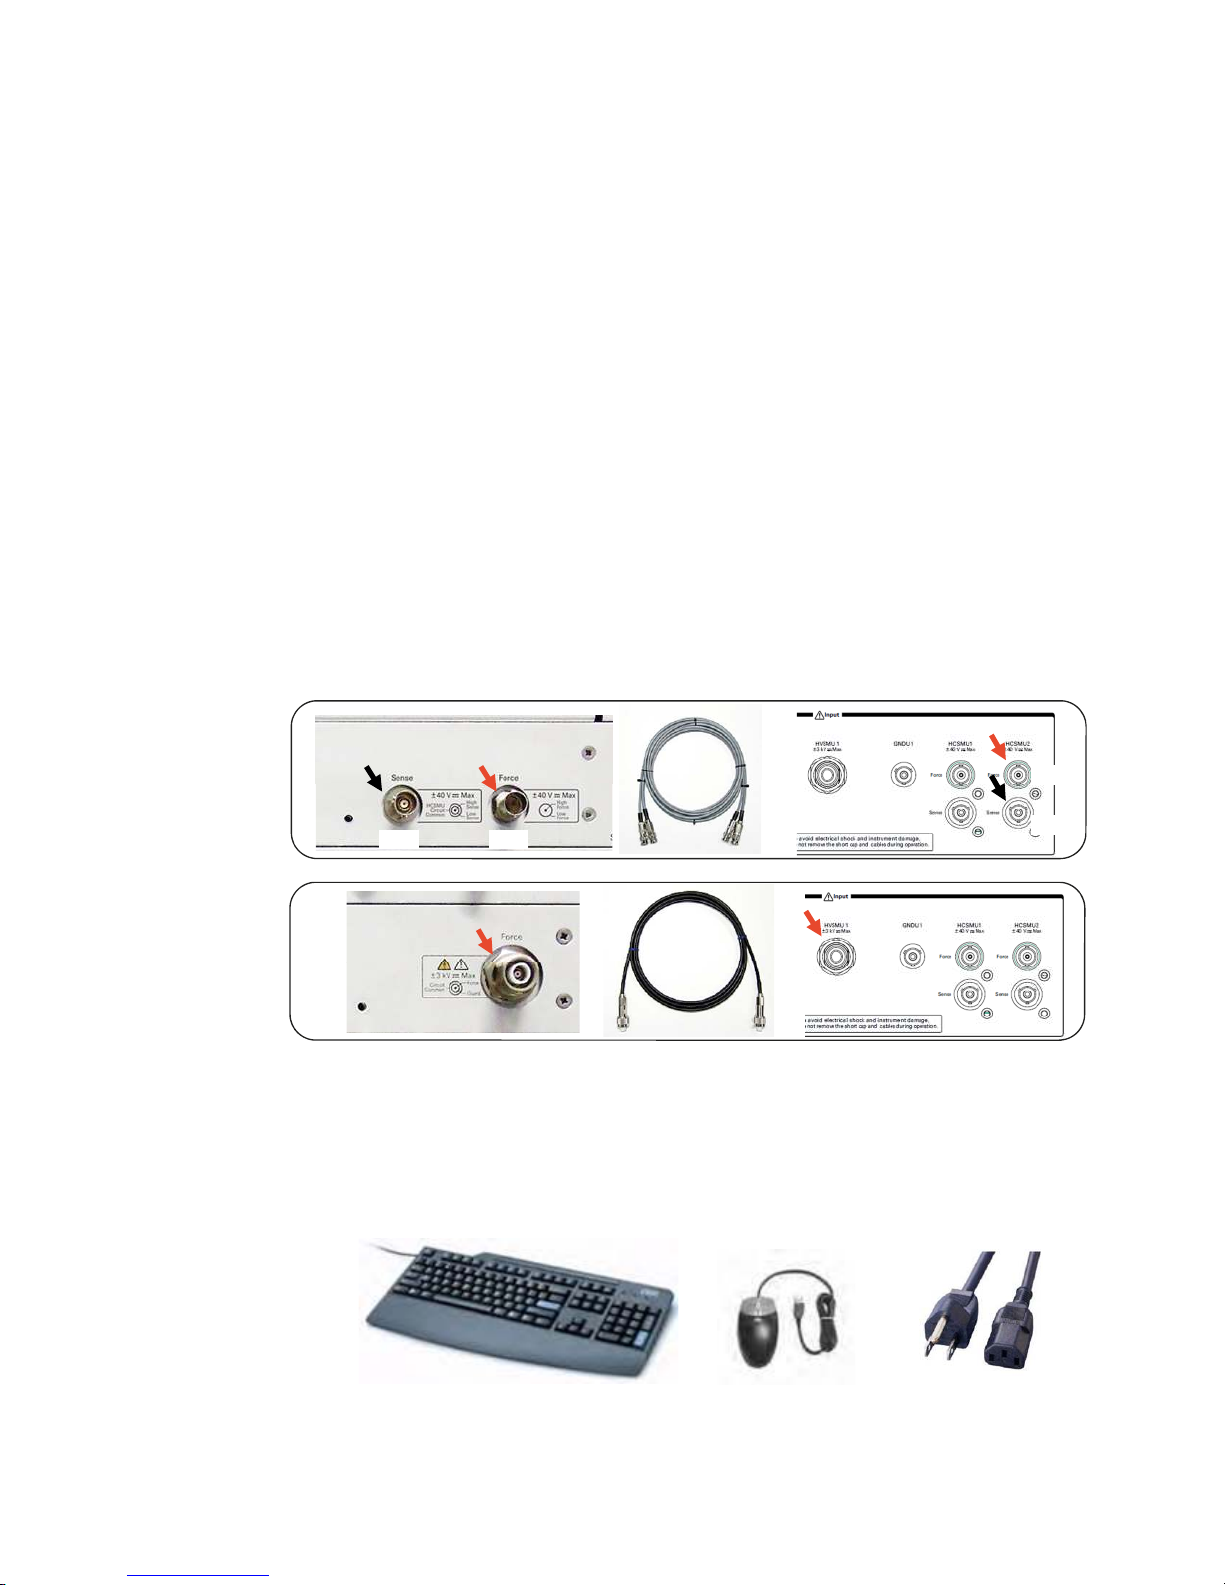
2-4. Cable Connection between the B1505A and the N1259A Test Fixture
Before starting the measurements, connect the cables between the B1505A and the
N1259A depending on your B1505A configurations. These connections are used for
all the measurement examples, and there is no need for changing this configuration
later.
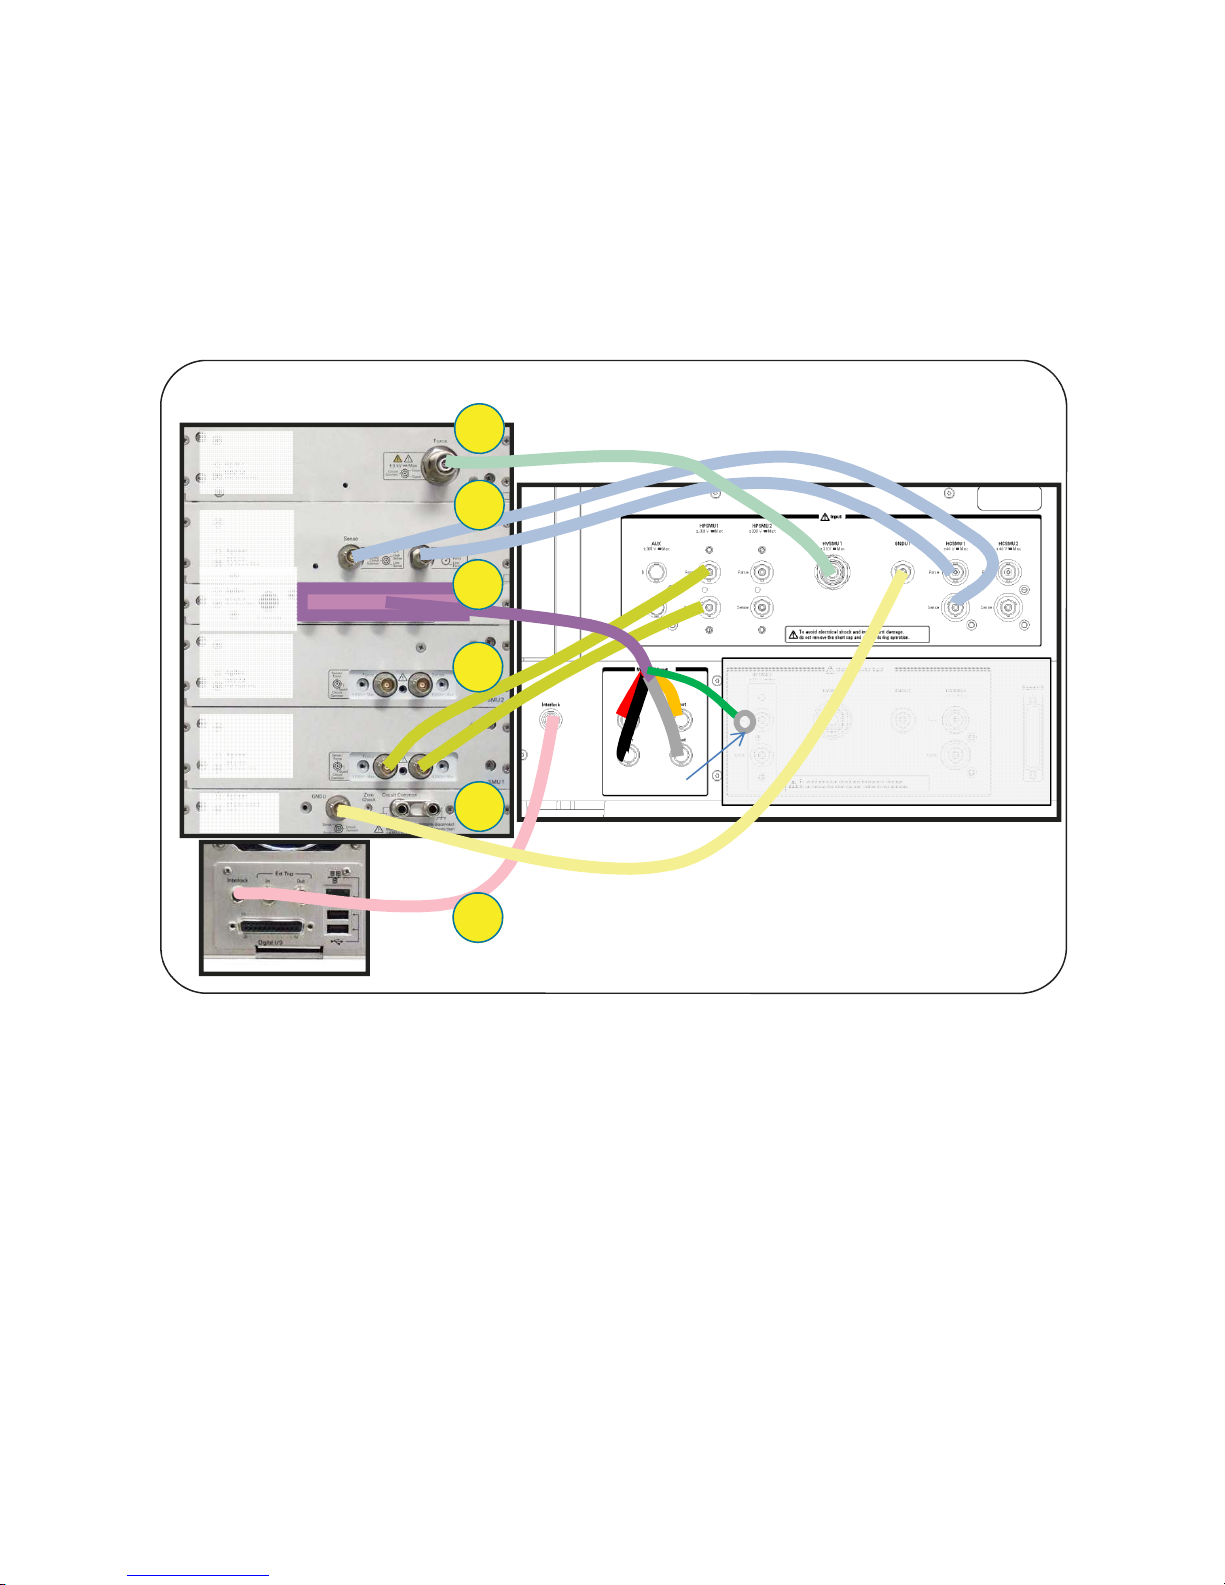
2-4-1. 2 x HPSMU and 1 x HCSMU configuration
Back side of the B1505A
6
B1513A
HVSMU
Back side of the N1259A
5
B1512A
HCSMU
B1520A
MFCMU
CoaxTriax
4
Coax
Triax
B1510A
HPSMU
B1510A
HPSMU
GNDU
3
Leave it open
2
1
Figure 2-6. Connections for 2x HPSMU and 1x HCSMU Configuration.
This configuration is used when only one HCSMU is installed in the B1505A.
Connect the cables between the B1505A and the N1259A as shown in figure 2-6 by
following the step number 1 to 6.
The breakdown of each steps with cable figures and the connector locations are
shown in figure 2-7.
Step number 1:
Using a 16493J Interlock Cable, connect the Interlock on the B1505A and the
Interlock on the N1259A
Tips:
20
For connecting the interlock cable, hold the black plastic part and then turn
the connector by pressing toward the interlock connector in the instrument
side as shown in figure 2-8.
Page 21
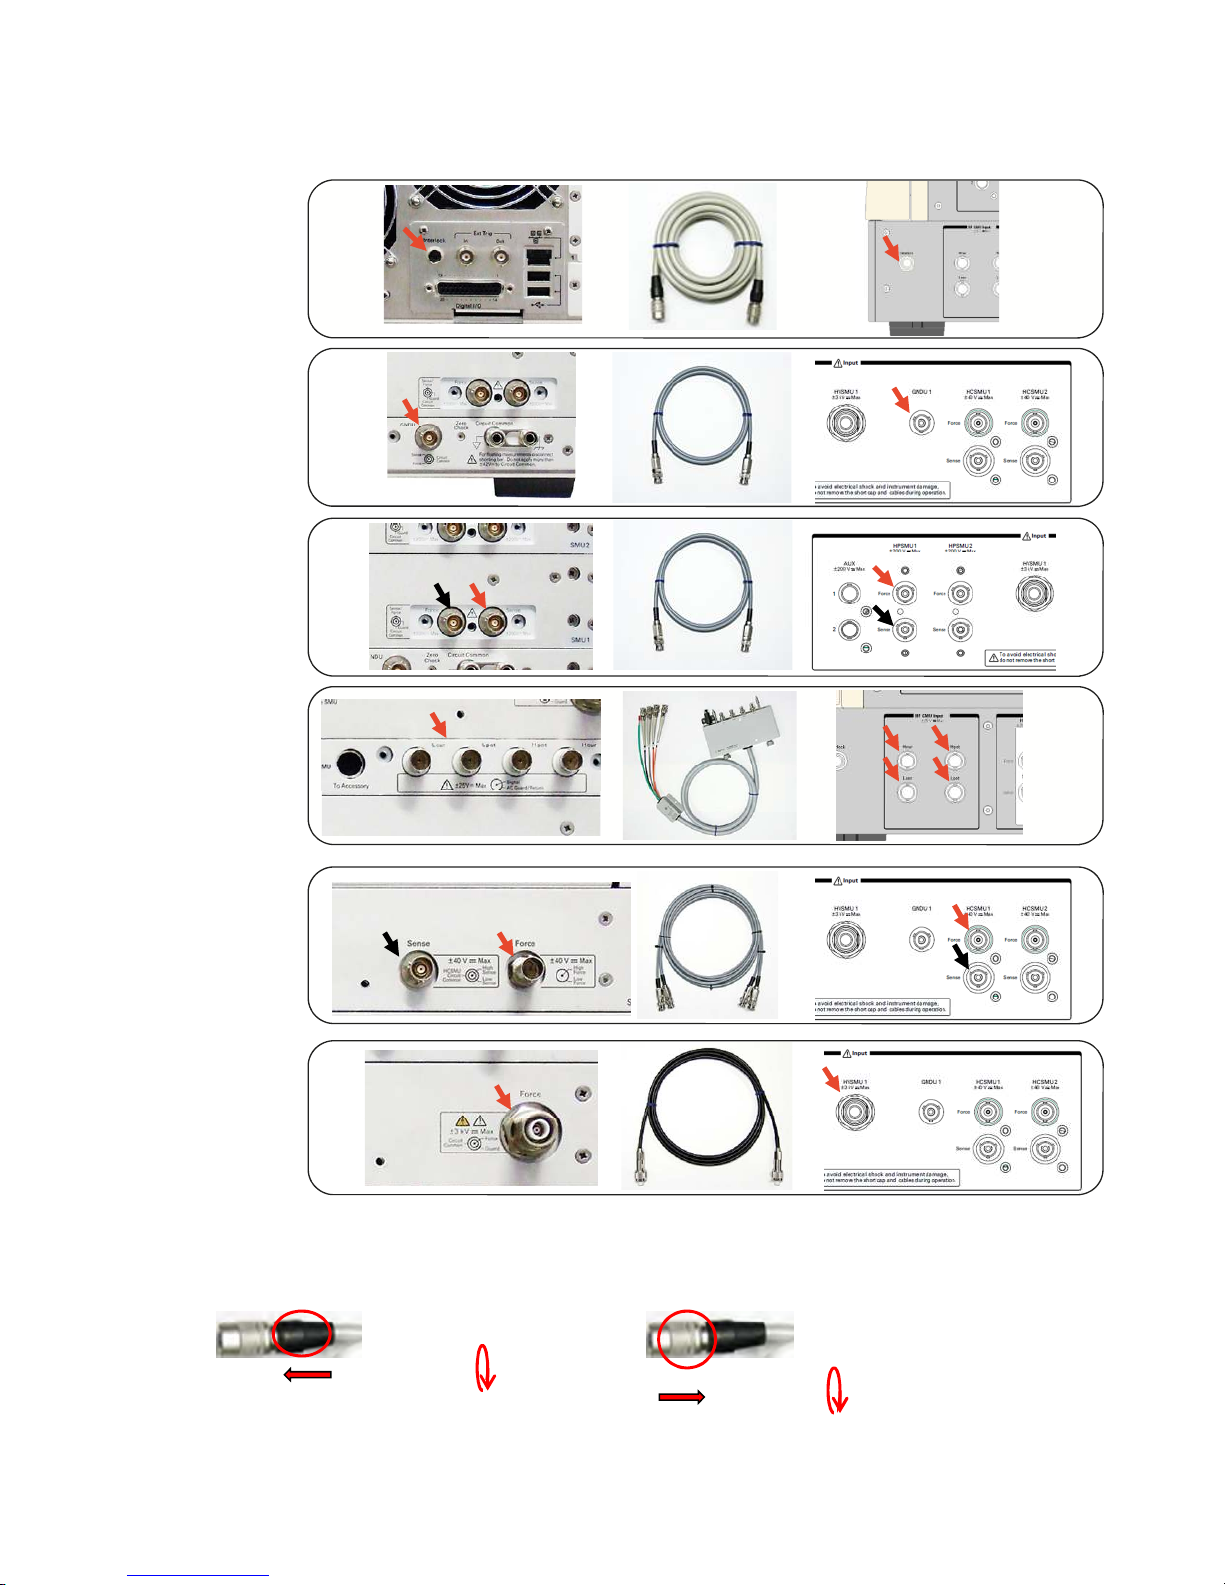
Step 1
Step 2
Step 3
For disconnecting the interlock cable, hold the metal part and then pull the
connector by turning it.
Step 4
Step 5
Step 6
Figure 2-7. Breakdown of the cable connection for 20 A configuration.
For connecting: For disconnecting:
Pressing and turn
Figure 2-8. Interlock connection.
Pulling and turn
21
Page 22

Step number 2:
Using a 16493L GNDU Cable, connect the GNDU on the B1505A to the GNDU1
Input on the N1259A.
Step number 3:
Using a 16494A Triax Cable, connect the Force and Sense connectors on the
lower B1510A HPSMU (SMU1) to the respective connectors on the HPSMU1
input of the N1259A.
Note: HPSMU uses a pair of two triax cables. HCSMU cables look similar as
HPSMU cables, but HCSMU cables are a pair of a coax cable and a triax
cable. It is a good practice for distinguishing these two cables.
Step number 4:
Using a N1300A CMU Cable, connect the B1520A CMU to the respective connectors of MF CMU Input (Hcur, Hpot, Lcur, Lpot) on the N1259A.
Note: Leave the green cable with a round terminal as it is.
Step number 5:
Using a 16493S HCSMU Cable, connect the Force and Sense connectors on the
B1512A HCSMU to the respective connectors of HCSMU1 Input on the N1259A.
Note: HCSMU cables are a pair of a coax cable and a triax cable. In case of
HPSMU, it uses a pair of two triax cables. It is a good practice for distinguishing these two cables.
Step number 6:
Using a 16493T HV Triax Cable, connect the Force connector on the B1513A
HVSMU to the HVSMU1 input of the N1259A
Tips:
Make sure to screw in the connector firmly by hand to the end point where
you feel some resistance.
22
Page 23

2-4-2. 1 x HPSMU and 2 x HCSMU 20 A configuration
B1513A
HVSMU
B1512A
HCSMU
Triax
B1512A
HCSMU
B1520A
MFCMU
B1510A
HPSMU
GNDU
Coax
Back side of the B1505A
7
6
5
4
3
Leave it open
2
Back side of the N1259A
1
Figure 2-9. Connections for 1x HPSMU and 2x HCSMU 20 A Configuration.
This configuration allows one HCSMU to connect to the base terminal of the power
BJT instead of HPSMU and allows to drive the base with more than 1 A. This configuration is useful for using less than 500 µs pulse to the base, which is limited to
minimum 500 µs in the case of HPSMU, though the minimum 50 µs pulse is effective in a collector even with the HPSMU connected to the base.
This configuration is also effective where the hFE of the power BJT is less than 10
at Ic=20 A. In this case, the base HCSMU can drive more than 1 A base current
which is necessary to drive the collector to the maximum 20 A limit of one HCSMU
connected to the collector.
The 40 A configuration by connecting two HCSMU in parallel is introduced in the
appendix A3 section, and HPSMU has to be used to drive the base in this configuration. This configuration is most effective for the power BJT, the hFE of which is larger than 40 at Ic=40 A, because the base HPSMU, the maximum output current of
which is 1 A, can drive the base sufficiently to fully swing the collector of the power
BJT.
Connect the cables between the B1505A and the N1259A as shown in figure 2-9 by
following the step number 1 to 7.
The breakdown of each steps with cable figures and the connector locations are
shown in figure 2-10.
23
Page 24
Step number 1 to 5:
The step number from 1 to 5 is the same as the 2 x HPSMU and 1 x HCSMU configuration, and follow the steps of figure 2-7.
Step number 6: (See figure 2-10)
Using a 16493S HCSMU Cable, connect the Force and Sense connectors on the
B1512A HCSMU to the respective connectors of HCSMU2 Input on the N1259A.
Note:
HCSMU cables are a pair of a coax cable and a triax cable. In case of HPSMU,
it uses a pair of two triax cables. It is a good practice for distinguishing these
two cables.
Step number 7:
Using a 16493T HV Triax Cable, connect the Force connector on the B1513A
HVSMU to the HVSMU1 input of the N1259A.
Tips:
Make sure to screw in the connector firmly by hand to the end point where
you feel some resistance.
Step 1 to 5: Same as the 2 x HPSMU and 1 x HCSMU configuration
Step 6
Step 7
Figure 2-10. Breakdown of the cable connection for 1 x HPSMU and 2 x HCSMU 20 A configuration.
2-4-3. Power cable, Keyboard and mouse
Be sure connecting power cable, keyboard and a mouse before starting the B1505A.
Coax
CoaxTriax
Triax
Figure 2-11. Key Board, Mouse and Power Cable.
24
Power CableKey Board Mouse
Page 25

2-5 Starting the B1505A
2-5-1 Starting the B1505A
After connecting the cables, power on the B1505A.
After Windows® starts up, click "Start EasyEXPERT" icon
and then start the EasyEXPERT software by pressing the "Start EasyEXPERT" button.
Then Workspace management page, "Agilent EasyEXPERT Software" page opens as shown in figure 2-12.
Figure 2-12. Workspace management page.
Figure 2-13. EasyEXPERT workspace.
2-5-1-1 Creating a new workspace
Creating a new workspace is recommended for practicing the new Application Test
Libraries created for this measurement handbook.
This measurement handbook includes many Application Library Test setups, Classic
Test definitions, Tracer Test definitions and sample measurement data example.
In the later section, the procedure for installing these setups and data files in to
your B1505A is coming on.
If your B1505A directly opens one of your EasyEXPERT
workspaces as shown in figure 2-13, then follow the
steps shown in "How to return to Workspace Management page." in the appendix section.
If you have any other problems, please refer to the
manuals (B1505A User's Guide, EasyEXPERT Software
User’s Guide, EasyEXPERT Application Library Reference, etc.) for more details on the EasyEXPERT software.
25
Page 26

Tips:
By creating a new workspace, you can manage your EasyEXPERT easily.
For example, if this is Agilent demo system, you can delete the new workspace
when you return the system, and all of your trace including a measurement data
can be deleted by a single operation.
If this operation is on your B1505A, you can practice without contaminating your
existing workspace by adding unnecessary measurement setup and data.
Instruction for creating a new Workspace:
Follow the next steps for creating a new workspace:
Step 1. Open the Workspace management window as shown in the figure 2-14.
Step 2. Check “Create a new Workspace”
Step 3. Enter appropriate Workspace name. Say “P-BJT_Handbook”.
Step 4. Pressing “Continue” opens a new Workspace.
Step 5. New Workspace name appears in the lower-left corner of the current
EasyEXPERT workspace.
1. Open “Workspace management page”
2. Check “Create a new
Workspace”
3. Enter appropriate Workspace
name. Say “P-BJT_Handbook”.
4. Press “Continue”
opens a new Workspace.
5. New Workspace name appears
in the lower-left corner of the
current EasyEXPERT workspace.
figure 2-14. Creating a new workspace
26
Page 27
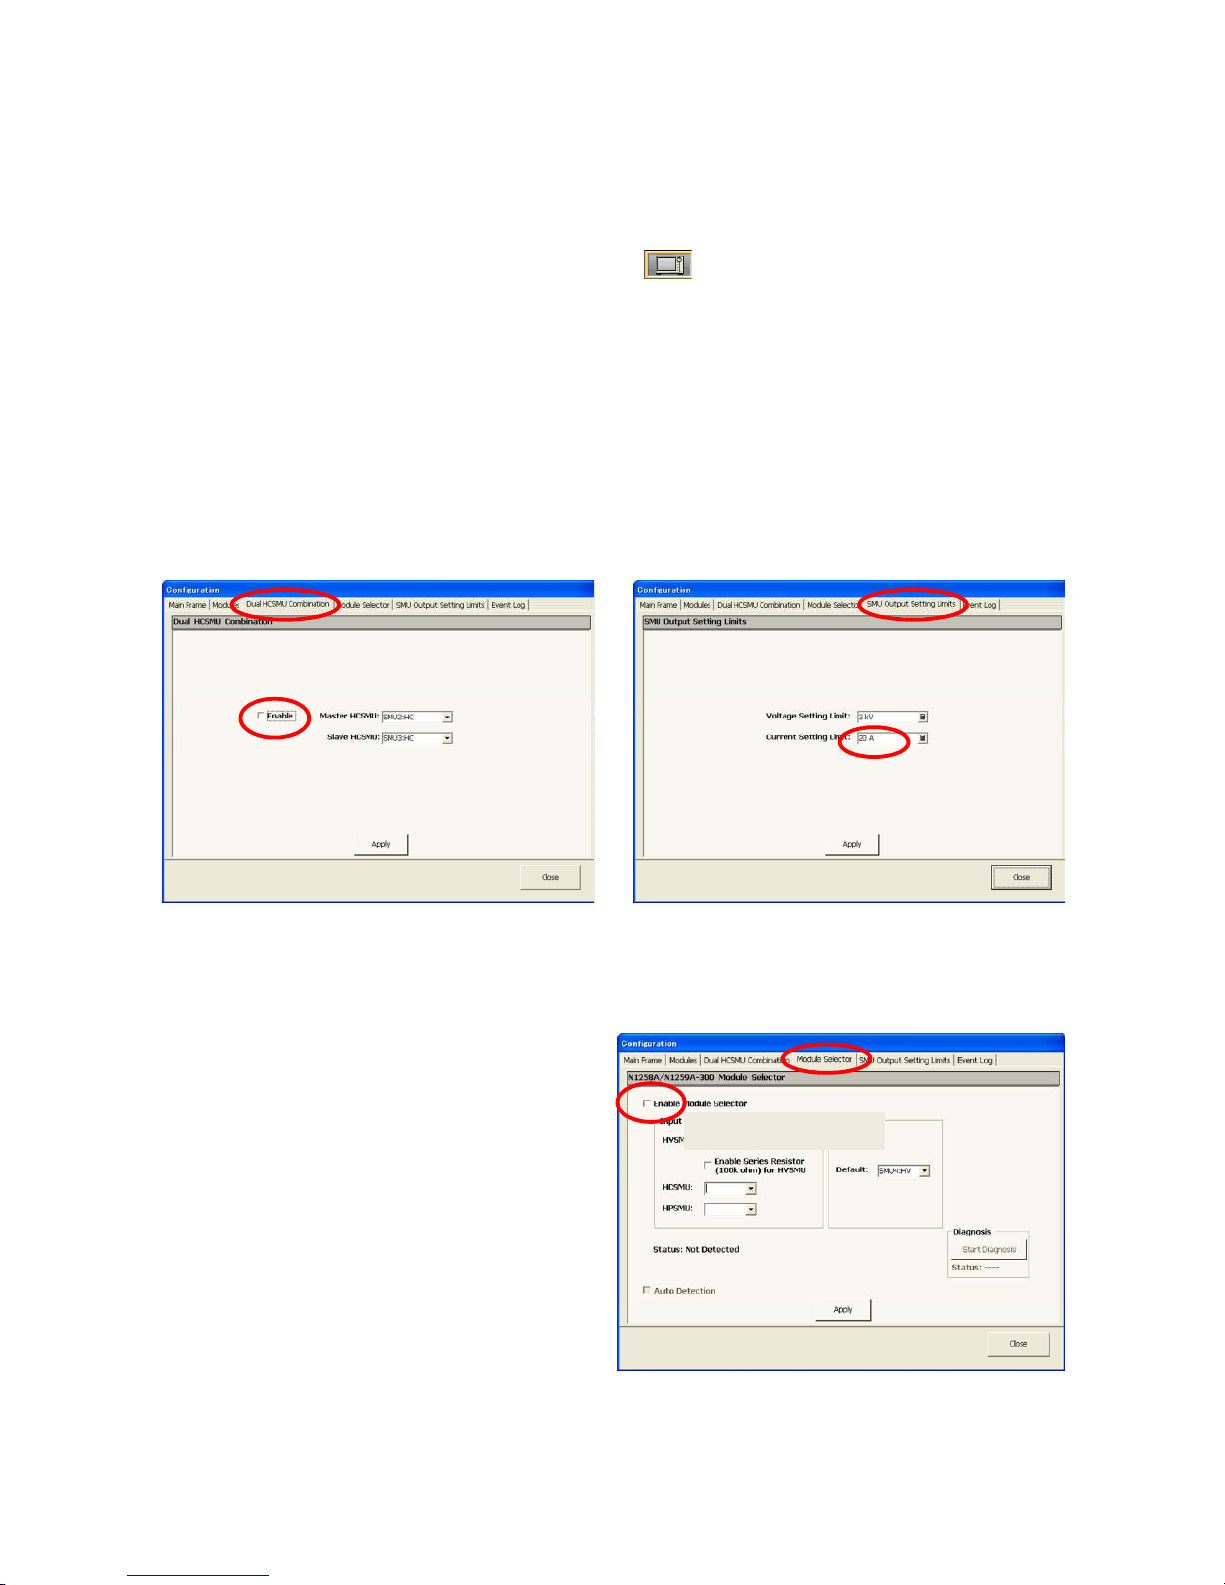
2-5-1-2 EasyEXPERT configuration before starting a measurement
IMPORTANT
1. Uncheck “Enable”
Before starting a measurement, check the configuration for HCSMU and the module
selector. You can view and change the configuration as follows.
1. Click the configuration button on the right side of the screen.
2. Select the “Dual HCSMU Combination” tab.
Make sure the checkbox is unchecked as shown in figure 2-15(A).
3. Select the “SMU Output Limit Setting” tab.
Make sure the Current Setting Limit is 20 A as shown in figure 2-15(B).
4. Select the “Module selector” tab.
Make sure that Module selector is disabled as shown in figure 2-16.
2. Set to 20 A
(A) “Dual HCSMU Combination” tab (B) “SMU Output Limit Setting” tab
Figure 2-15. 20 A Configuration setting
1. Uncheck “Enable”
Figure 2-16. Module Selector setting.
27
Page 28

2-5-2 Setup of the example file-set to the EasyEXPERT software
Before starting the specific measurements, we are installing an example application
test library, test setups and the example measurement data used in this measurement handbook.
Please follow the instruction below in order.
2-5-2-1 Download the example file-set from the Agilent web site
To get the example file set to the B1505AI, please visit the Agilent web site and
download the example file-set.
Please refer to Appendix 1 about the instructions for downloading the example fileset.
After the download, you can copy the file via CD or USB memory.
Copying the example file-set to Windows®
- Copy the downloaded "B1505A_P-BJT_HB_Library.zip" file to a proper folder of
the B1505A`s Windows® folder, say D:/tmp or desktop.
2-5-2-2 Extracting from zip compressed file
The downloaded "B1505A_P-BJT_HB_Library.zip" file has to be extracted to the
regular Windows® file format for reading from EasyEXPERT.
Follow the steps shown in figure 2-18 for extracting files from the downloaded zip
file.
Step 1: Right click the B1505A_P-BJT_HB_Library.zip file.
Step 2: Select "Extract All ..." menu from the pop up window.
Step 3:Extraction Window opens, and click "Next".
Step 4: Select a proper existing folder for extracting from the downloaded zip file.
Then click "Next".
All the file is extracted under the "B1505A_P-BJT_HB_Library" parent folder.
Please remember this folder name for the later use for importing files to EasyEXPERT software.
28
Page 29

1. Right click zip file
2. Select “Extract All” 3. Press “Next”
4. Select the folder to
extract files
5. Zip file is extracted
Figure 2-17. Extracting the downloaded zip file.
29
Page 30

Extracting the compressed file produces the following three types of file set.
1. New Application Test definitions
●
Vce(sat)-Ic 2.xtd : Vce and Vbe saturation voltage versus Ic measurement
●
hFE_Vbe-Ic.xtd :hFE and Vbe(on) measurement versus Ic current
●
Ic-Vcbo 2.xtd: Icbo and Vcbo measurement where Vcb sweep stops at
the detection of Vcbo
●
Ic-Vceo_R.xtd: Ic versus Vce measurement using a collector series
resistor to observe breakdown characteristics
●
Ie-Vebo 2.xtd: Iebo and Vebo measurement where Veb sweep stops at
the detection of Vebo
●
Ic-Vces 2.xtd: Ices and Vces measurement where Vce sweep stops at
the detection of Vces
●
Cob.xtd: Cob or Ccb measurement
These new test definitions added to the existing library are all customized for properly measuring the data sheet specifications of power BJTs.
The new application definitions with “2” (second) extension are added the parameter extraction features and sweep abort setting on detection of breakdown.
Ic-Vceo_R application test supports collector resistor and the voltage drop compensation by the resistance and the collector current.
The other type of new application test definitions are new for measuring the power
BJT device specifications which were not included in the B1505A.
2. Application Test, Classic Test and Tracer Test setup files
●
Example_AT.xpg
The Application Test setups used in this handbook are included in this
file, and they can be imported in your EasyEXPERT as a Preset Group.
●
Example_CT.xpg
The Classic Test or Tracer Test setups used in this handbook are included
in this file, and they can be imported in your EasyEXPERT as a Preset
Group.
All the test setups introduced as the measurement samples in this measurement
handbook can be accessed from the preset group of My Favorite Setup , and you can
work on these files by just changing the measurement parameters or adding necessary modifications to the EasyEXPERT measurement functions,
3. EasyEXPERT example data files
●
EE-PBJT_example.ztr
This file is in a format of compressed test result and it includes the sample measurement data used in the test example.
30
Page 31

2-5-2-3 Importing the example files to the EasyEXPERT software
There is an installing order for the imported files to EasyEXPERT. Please import the
example application test library at first before importing the test setup or example
measurement data.
1. Importing the example application test library
The example test library is installed in the existing PowerBJT application category.
After the installation of the example application test library, the following seven application tests appear in the Library section.
●
Vce(sat)-Ic 2
●
hFE_Vbe-Ic
●
Ic-Vcbo 2
●
Ic-Vceo_R
●
Ie-Vebo 2
●
Ic-Vceo 2
●
Cob.
[PROCEDURE] - See figure 2-18
Step 1: Press “Library” bar of EasyEXPERT.
Library menu opens
Step 2: Select “Import Test Definition” from the Library menu.
Windows® Explorer opens.
Step 3: Find the folder where you extract the example file set.
Step 4: Select all the Application Test definitions as shown in Step 4 in the figure.
Step 5: Press “Open” of the Windows® Explorer button.
All the Application Test definitions are imported in to the EasyEXPERT Library,
and they are included to the “PowerBJT” category
Step 6: Check “PowerBJT” in the Category window.
Step 7: The new Application Test definitions appear in the Library window.
Check if all the Application Test definition exist by scrolling the menu bar
31
Page 32
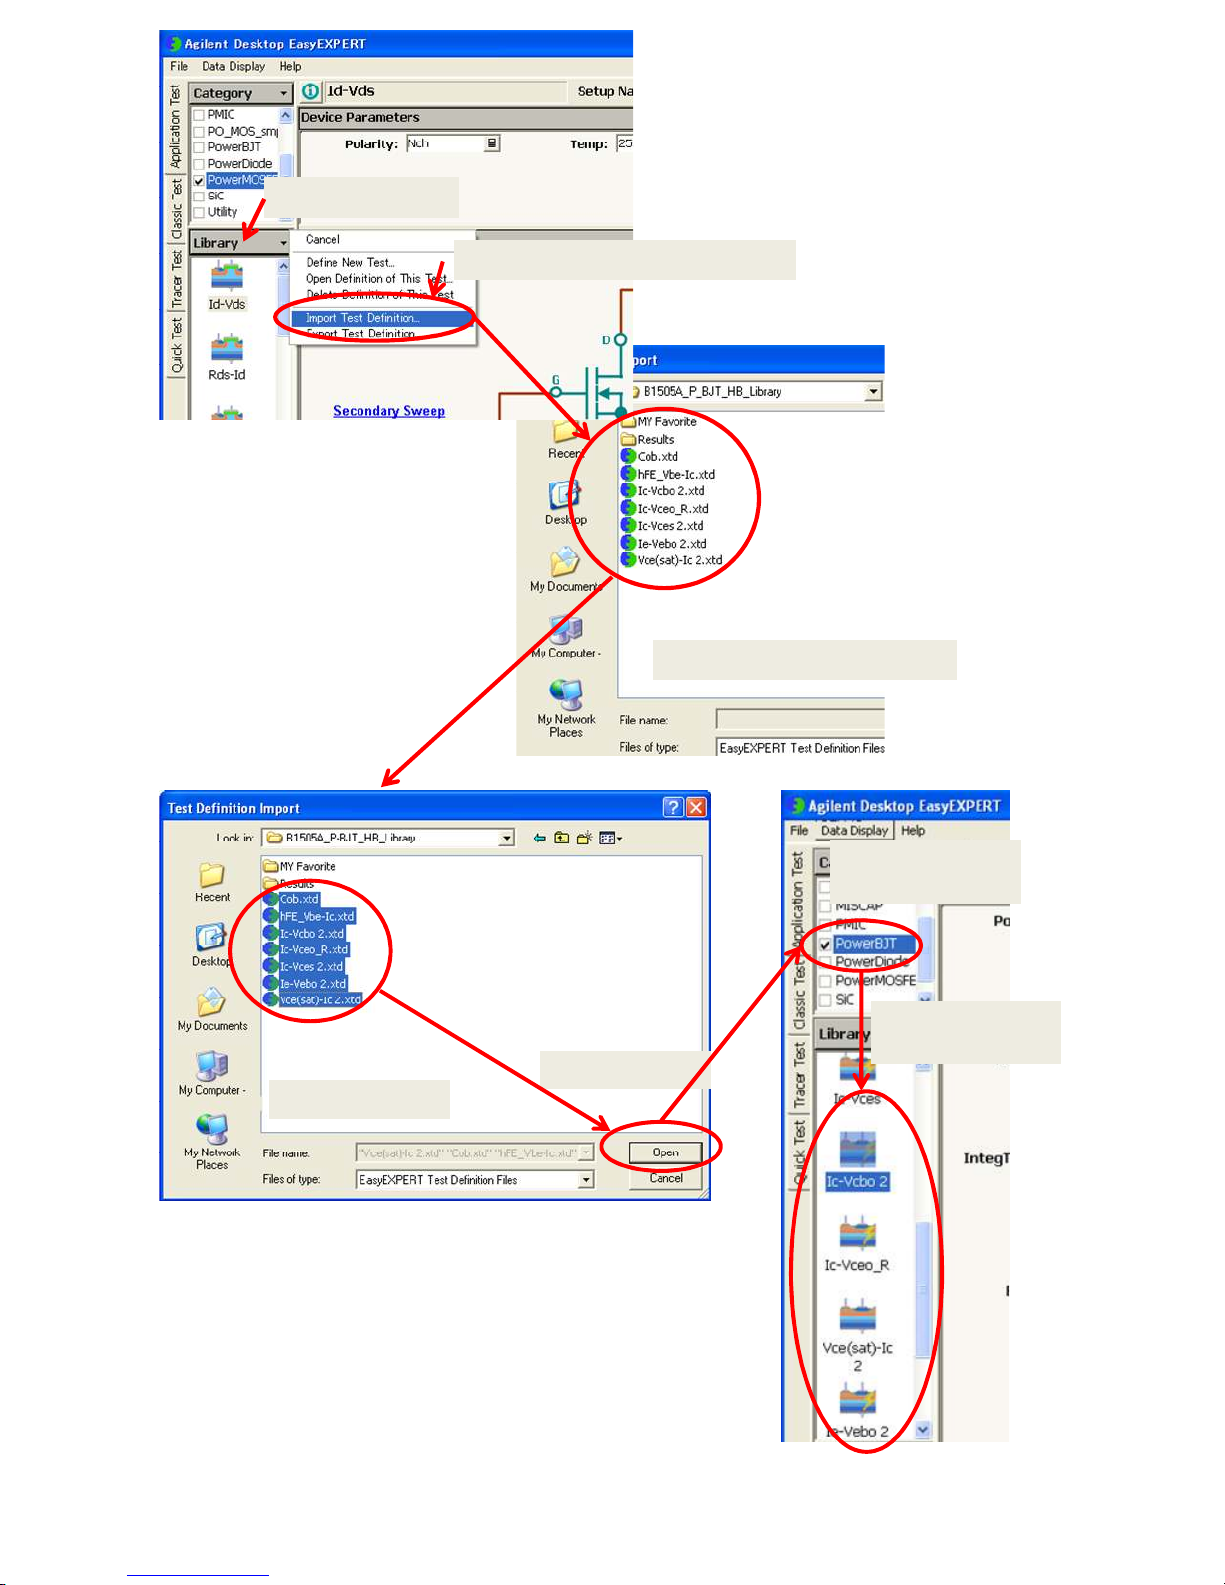
1. Press “Library”
2. Select “Import Test Definition”
3. Find the imported library set
5. Press “Open”
4. Select all files
Figure 2-18. Importing the Application Test definitions.
6. Check
“PowerBJT”
7. New Application
Test Definitions
32
Page 33

2-5-2-4 Importing example test setup files
The example file set includes the test setups used in the example and the test setup
files are imported to a preset group of My Favorite Setup.
Example test setup files include two types of setup data.
One is test setup of the Application Test definitions for each corresponding data
sheet specifications used in the example. They are imported to “Example-AT” i.e.
example-application test, preset group.
The other test setups are the Classic Test mode and Tracer Test mode definitions.
These test definitions are provided as a sample base for showing a few typical test
setup examples.
They are imported to “Example-CT” i.e. example-classic test, preset group.
[PROCEDURE] – See figure 2-20
Step 1: 1. Press “My Favorite Setup”
“My Favorite Setup menu” opens
Step 2. Select “Preset Group” from the menu list
“Preset Group menu” opens
Step 3. Press “Import Preset Group” from the menu list
Windows® Explorer opens.
Step 4. Find the imported setup files using the Explorer
./My_Favorite/Example_AT or ./My_Favorite/Example_CT
Step 5. Select one file at once and press “Open” button
“Example_AT” and ” Example_CT” preset groups and the associated
setup files are imported in each group
33
Page 34
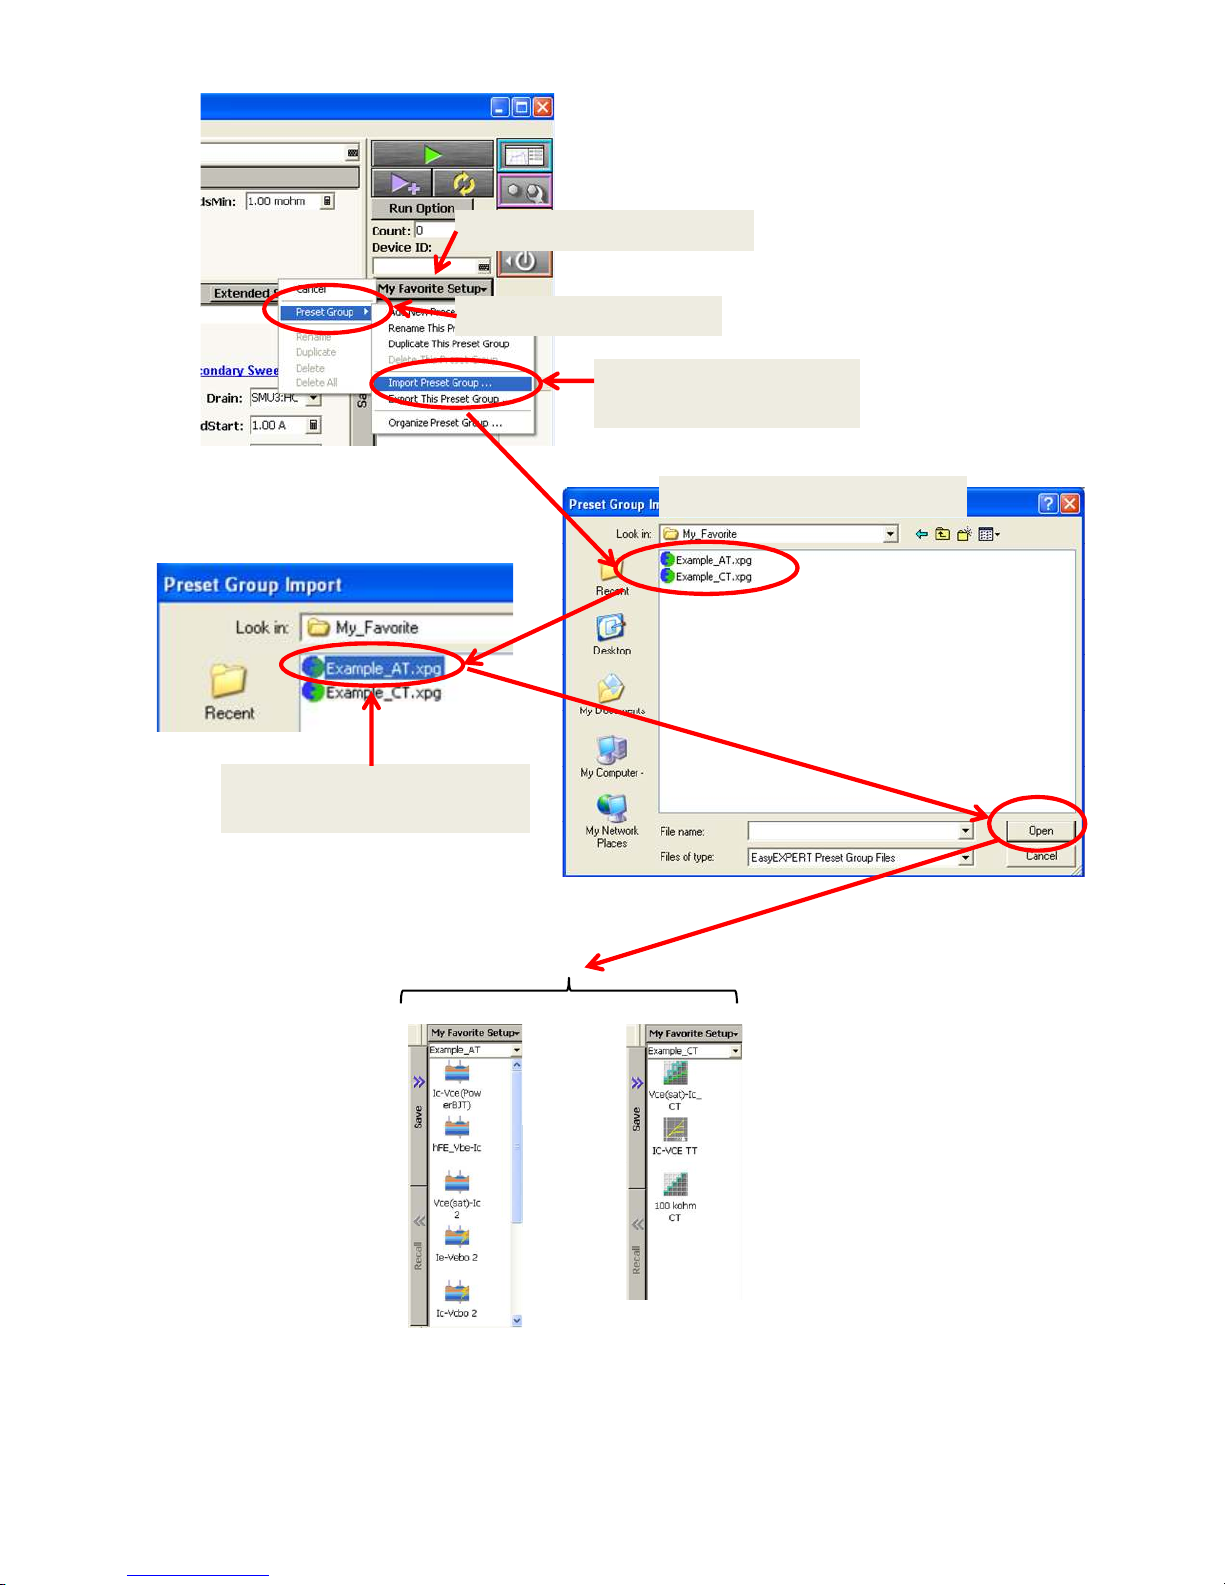
1. Press “My Favorite Setup”
2. Select “Preset Group”
5. Select one file at once and
press “Open” button
3. Press “Import Preset
Group”
4. Find the imported setup files
“Example-AT” and ” Example-CT” preset groups and
the associated setup files are imported in each group
Figure 2-20. Importing the My Favorite Setup files.
34
“Example-AT” and ” Example
-CT” preset groups and
the associated setup files are
imported in each group
Page 35
2-5-2-5 Importing example measurement data
Measurement data used in the examples in the handbook are included in the example file set.
If you import the data to the Results windows of EasyEXPERT, you can easily explore the EasyEXPERT functionality with a real measurement data.
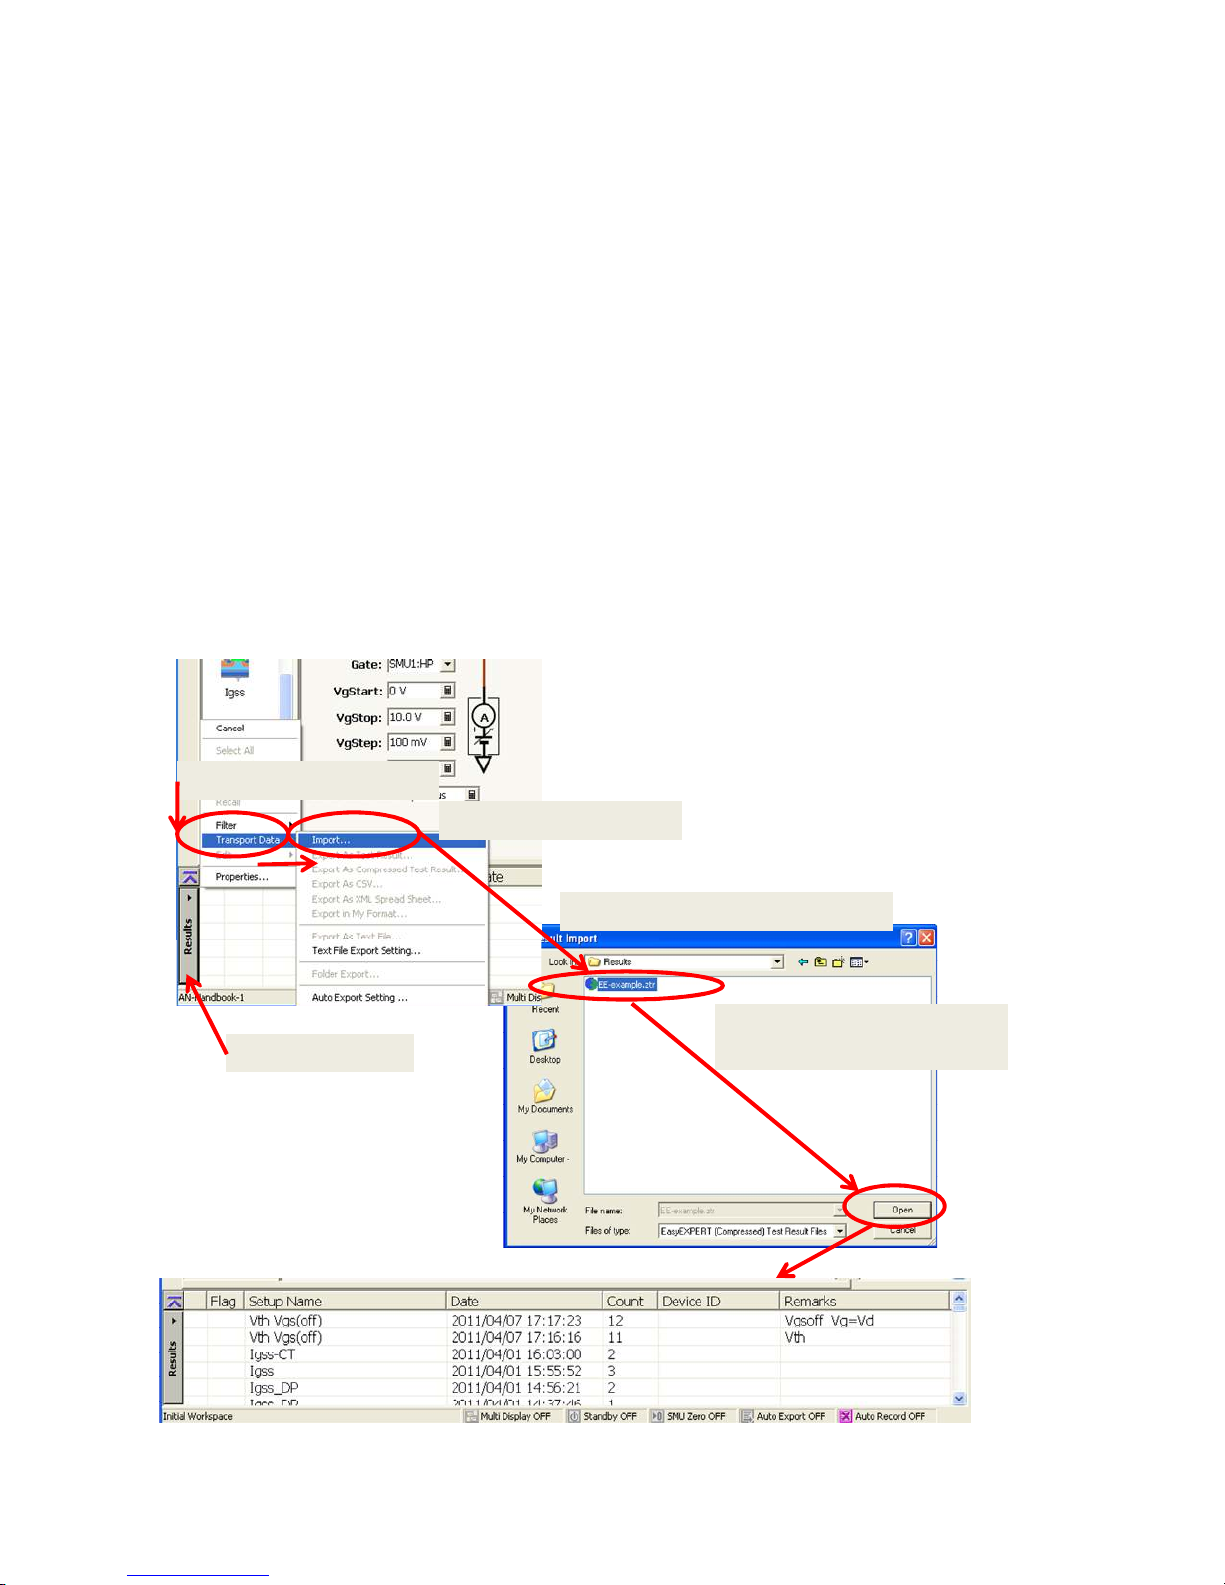
[PROCEDURE] – See figure 2-21
Step 1. Press “Results”.
“Results” menu opens.
Step 2. Select “Transport Data”.
“Transport Data” menu opens.
Step 3. Press “Import . . .”
Windows® Explorer opens.
Step 4. Find the imported Test result file by using the Explorer.
./Results/EE-example.ztr
Step 5. Select the imported file and press “Open” button.
Example data set are imported to the result area.
2. Select “Transport Data”
1. Press “Results”
3. Press “Import . . .”
4. Find the imported Test result file
5. Select “EE-example.ztr” file
and press “Open” button.
Figure 2-21. Importing the example Results data files.
35
Page 36

Chapter 3. Measurements of Data Sheet Specifications of Power BJTs
This chapter demonstrates how the B1505A measures the power BJT parameters in
the data sheet specifications.
The test parameters included in this measurement handbook are listed next categorized in four measurement groups.
Each measurement group uses basically the same hardware setup and the device
connection. This measurement handbook introduces the measurement example by
following this order in the group and the list.
1. Application Test example
●
Ic - Vce measurement
●
hFE and Vbe(on) versus Ic measurement
●
Vce(sat) and Vbe(sat) versus Ic measurement
●
Vce(sus) or V(BR)ceo, and Iceo versus Vce measurement
A. Without 100 kΩ collector series resistor
B. With 100 kΩ collector series resistor
●
BVcbo and Icbo-Vcb measurement
●
BVebo and Iebo-Veb measurement
●
BVces and Ices-Vce measurement
●
Cob-Vc measurement
2. Classic Test and Tracer Test example
●
Ic - Vce Tracer Test
●
Vce(sat) and Vbe(sat) versus Ic Classic Test
●
100 kΩ resistor precision measurement for Vce(sus) Application Test
36
Page 37

General Idea of measurement using the EasyEXPERT software
Figure 3-1 shows the general idea of measurement using the EasyEXPERT Application Test Library.
The idea is straight forward and easy to use;
Step 1. Choose device type or application category from the Category field.
Or, just from step 1` where your unique setup has been saved in My Favorite
Setup field, and you can just start from here by just selecting a setup icon
and skip step 2 and go to step 3 Measure.
Step 2. Select Application Test definition from the Library field.
Step 3. Measurement buttons for Single measure, Append measure and Repeat
measure.
Then measurement data pops up, and the data can be saved in Results area
automatically.
Chapter 3 uses the full features of these easy to use EasyEXPERT test environments.
EasyEXPERT has many default applications for basic measurements. You can measure the device easily, by simply selecting the desired application. With an illustrative
user interface, you can intuitively modify the parameters to suit your DUT.
1
Choose device or
Application Category
2
Select Application
Test
Displays meas. data in real time
and shows parameters at the same
time
Figure 3-1. General Idea of measurement using the EasyEXPERT software.
3
Press Measure button
and Meas. starts
1`
Or, select from
My Favorite setup
37
Page 38

3-1. Measurement using Application Test mode
This chapter demonstrates the following measurements using the Application Test
mode library.
●
Ic-Vce(PowerBJT): Ic versus Vce measurement
●
hFE_Vbe-Ic hFE and Vbe versus Ic measurement.
Extracts hFE and Vbe_On.
●
Vce(sat)-Ic 2 Vce and Vbe versus Ic measurement.
Extracts Vce-Sat and Vbe_sat.
●
Ic-Vceo_R Ic versus Vce measurement using a collector series resistor
to observe the breakdown characteristics.
Extracts Iceo and BVceo.
●
Ic-Vcbo 2 Icbo versus Vcbo measurement. Extracts Icbo and BVcbo.
●
Ie-Vebo 2 Ie versus Veb measurement. Extracts Iebo and Vebo.
Extracts Iebo and BVebo.
●
Ic-Vces 2 Ic versus Vces measurement with zero volt base bias.
Extracts Vces.
●
Cob Cob or Ccb versus Vc measurement.
Extracts Cob at the specified Vc.
Connection inside the N1259A Test Fixture
Connection inside the N1259A test fixture for each application test is different except for the first three test setups in the above list. Therefore, the connection setup
for the first three common tests is explained here, and the other unique connection
setups for the other application tests are shown in each corresponding application
section.
Since the first three tests use high current, two types of Base connection methods
are shown; one is A. HPSMU connected to the base and the other is B. HCSMU connected to the base terminal.
NOTE: If measurement is made with Opt.300 Module Selector, use the procedure
shown in Appendix 2.
38
Page 39
A. Common cable configuration for Ic-Vce, hFE_Vbe-Ic and Vce(sat)-Ic 2 with
HPSMU (base) and HCSMU (collector) connection:
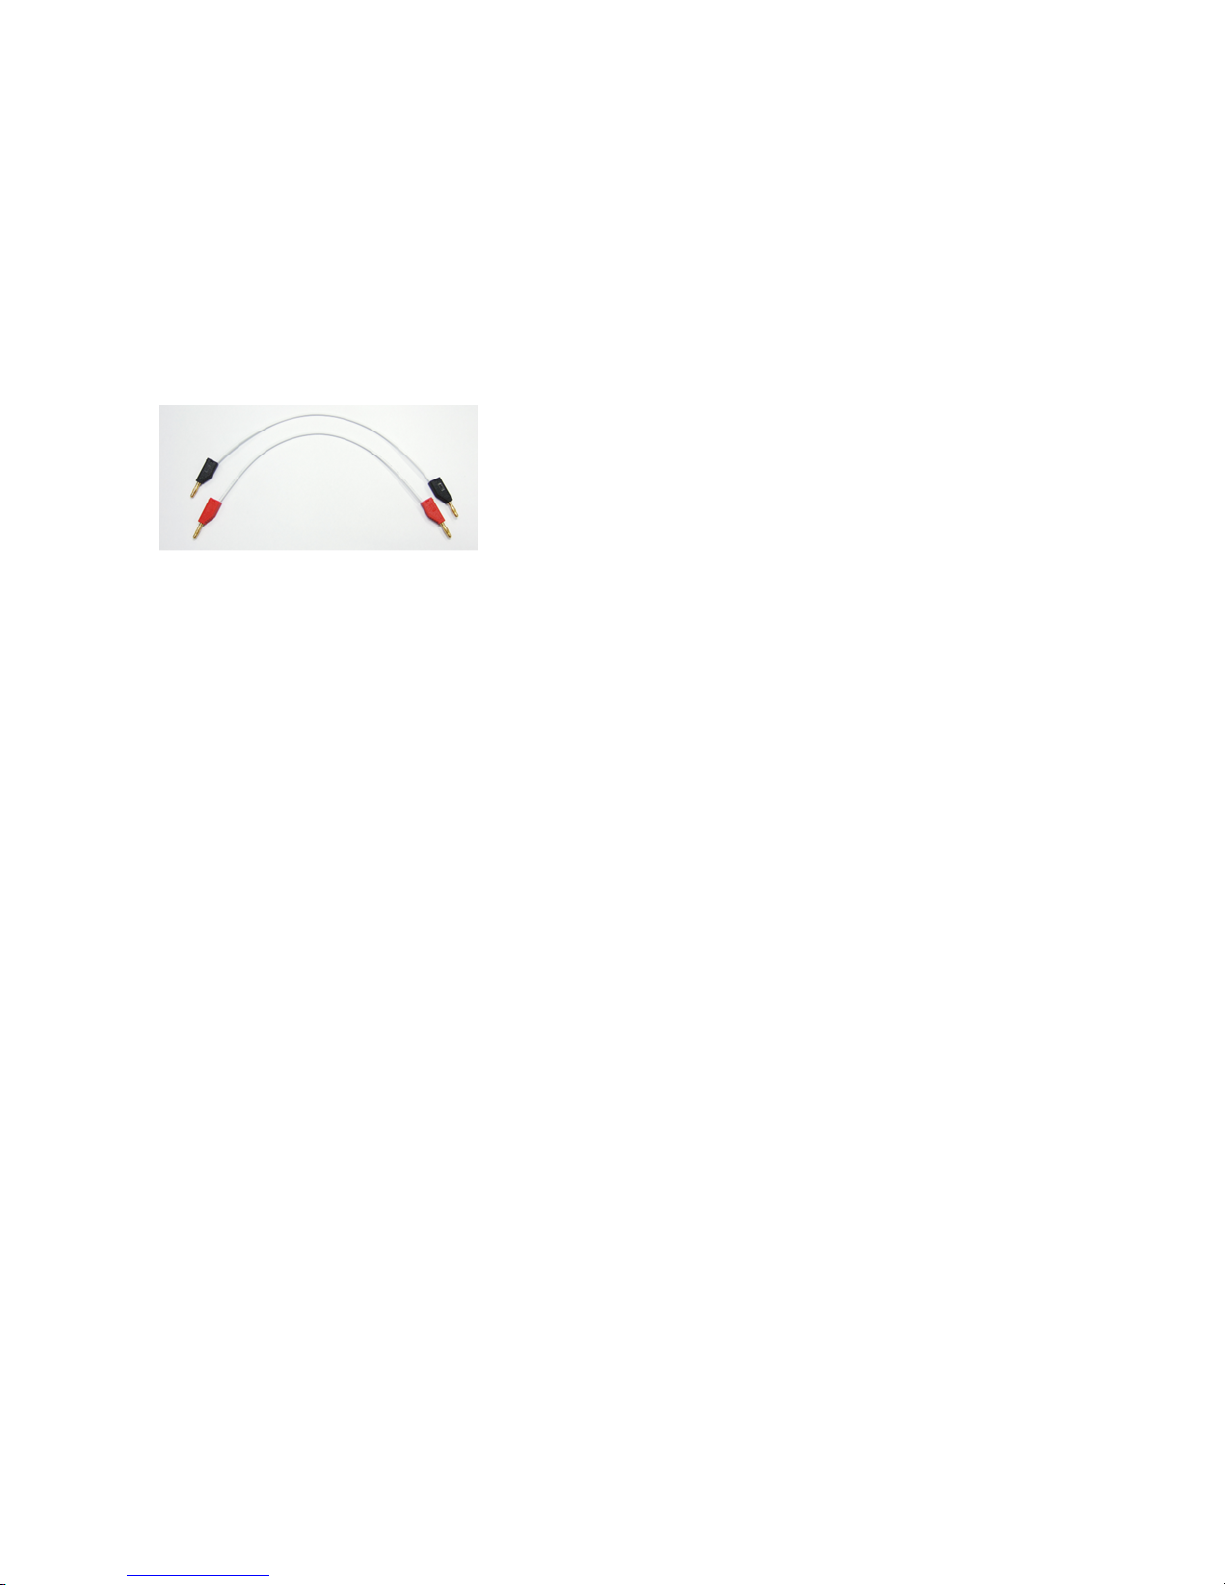
Open the N1259A test fixture cover, and connect the test leads shown in figure 3-2
by following the step numbers as shown in figure 3-3 and the following procedure
steps.
Note: The available colors of the leads are black and red only. The lead color
used in figure 3-3 is for reference only.
The numbers of the procedure steps correspond to the numbers on
the drawing for connecting the test leads.
Figure 3-2. Test Lead for the N1259A Test Fixture
[PROCEDURE]
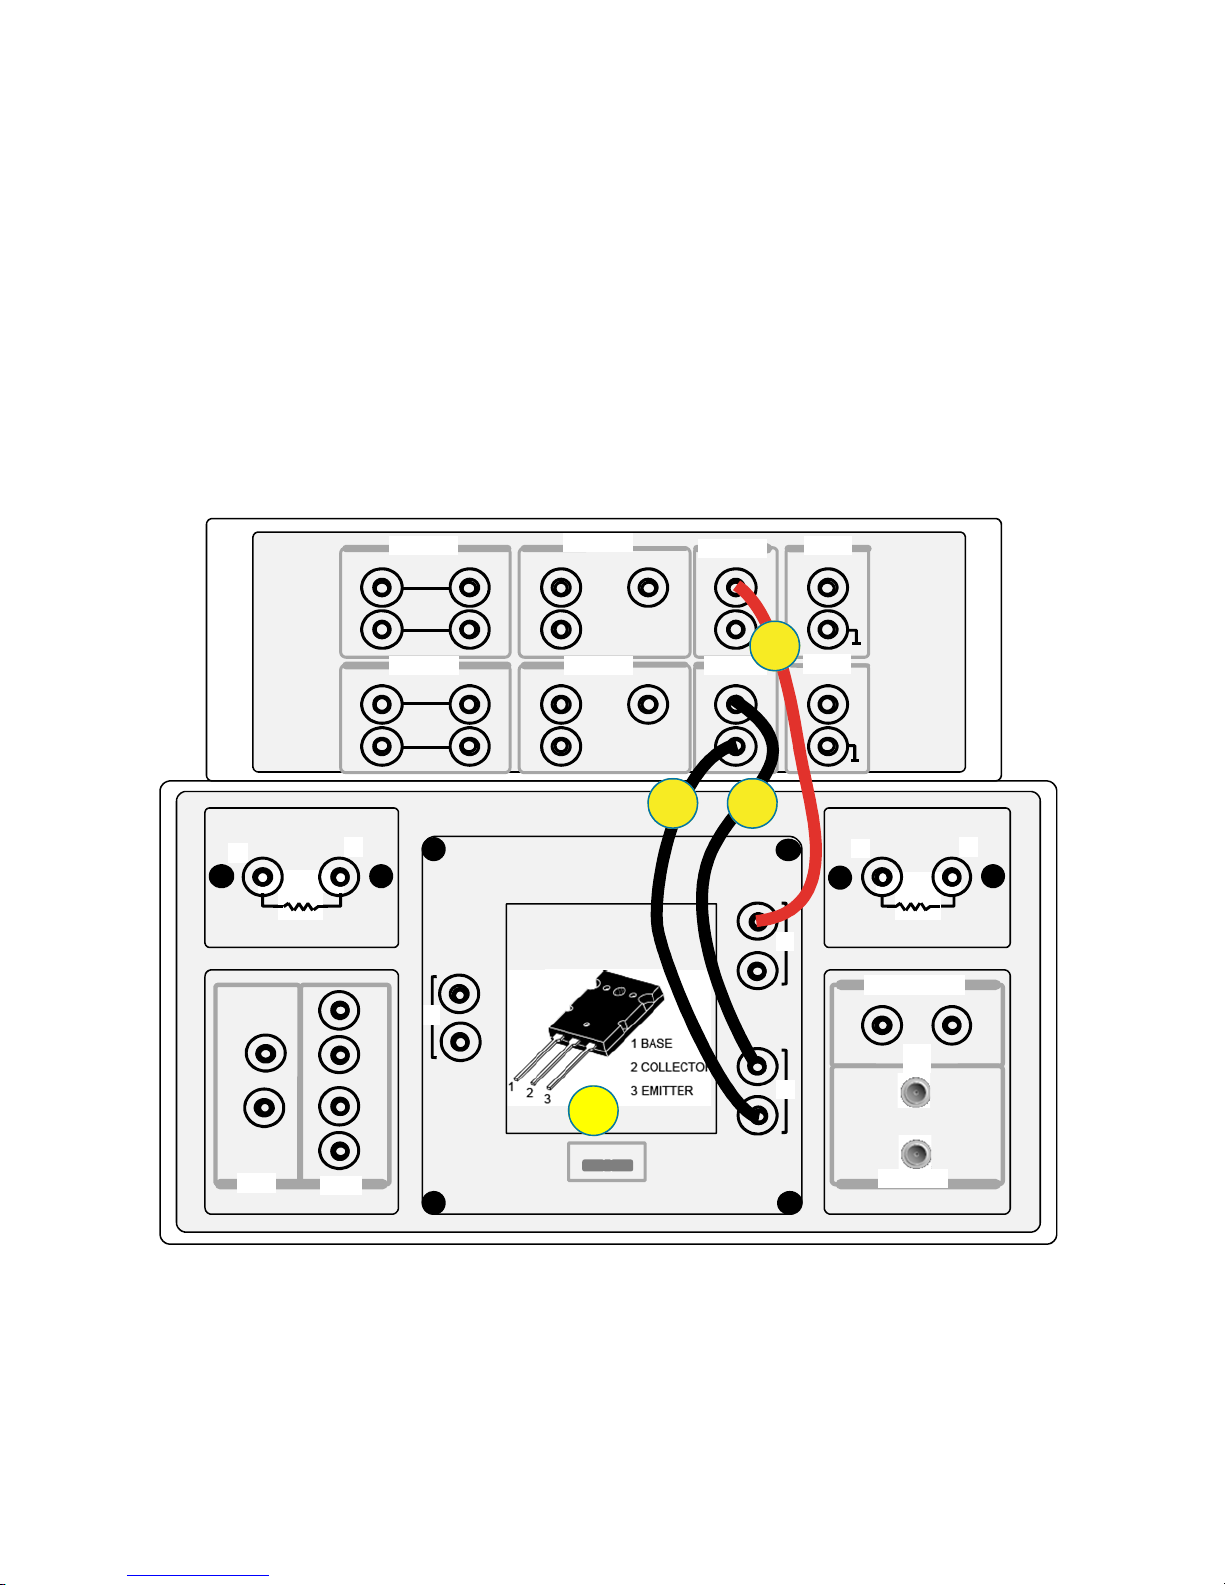
Step 1. Insert the power BJT (example: MJL4281AG) into the socket on the N1259A.
Make sure the device pin name matches to the socket numbers shown in
figure 3-3.
Step 2. Connect the High-Force of the HCSMU1 to the terminal 2 Force (Collector)
on the Inline Package Socket.
Step 3. Connect the High-Sense of the HCSMU1 to the terminal 2 Sense (Collector)
on the Inline Package Socket.
Step 4. Connect the Low-Force of the HCSMU1 to the terminal 3 Force (Emitter) on
the Inline Package Socket.
Step 5. Connect the Low-Sense of the HCSMU1 to the terminal 3 Sense (
on the Inline Package Socket.
Step 6. Connect the HPSMU1 Force to the terminal 1 Force (Base) on the Inline
Package Socket.
Step 7. Connect the HPSMU1 Sense to the terminal 1Sense (Base) on the Inline
Package Socket.
Step 8. Connect the GNDU1 Force to the terminal 3 Force (Emitter) on the Inline
Package Socket.
Emitter
)
Step 9. Connect the GNDU1 Sense to the terminal 3 Sense (Emitter) on the Inline
Close the N1259A fixture cover.
Package Socket.
39
Page 40

1 x HPSMU and 1 x HCSMU configuration
High
Low
High
Low
1
Force
Sense
Low
Module Selector Output
2
1 kΩ
High
HCSMU1
Force
HCSMU2 HPSMU2
Force
Agilent N1259A opt 010
Guard
Force
Sense
Guard
1
Force
6 7
Sense
Guard
Sense
Force
Guard
Force
Sense
HPSMU1
Sense
2
Sense
4 5
1
1 2 3
HVSMU1
Force
Guard
3
GNDU1111
Force
Sense
Force
Sense
Force
Sense
8
Signal
Signal
2
3
AUX1
AUX2
Agilent N1259A opt 022Agilent N1259A opt 033
1
DC Bias Input
Guard
9
MF CMU
High Voltage Bias-Tee
2
100 kΩ
Force
High
Low
Figure 3-3. Common connection for Ic-Vce, hFE_Vbe-Ic and Vce(sat)-Ic 2 for 1xHPSMU and 1xHPSMU
40
Page 41

B. Common configuration for Ic-Vce, hFE_Vbe-Ic and Vce(sat)-Ic 2 with 2 x
HCSMUs for the base and the collector connection:
Open the N1259A test fixture cover, and connect the test leads shown in figure 3-2
by following the step numbers as shown in figure 3-4 and the following procedure
steps.
Note: The available colors of the leads are black and red only. The lead color used in
figure 3-3 is for reference only.
The numbers of the procedure steps correspond to the numbers on the drawing for
connecting the test leads.
[PROCEDURE]
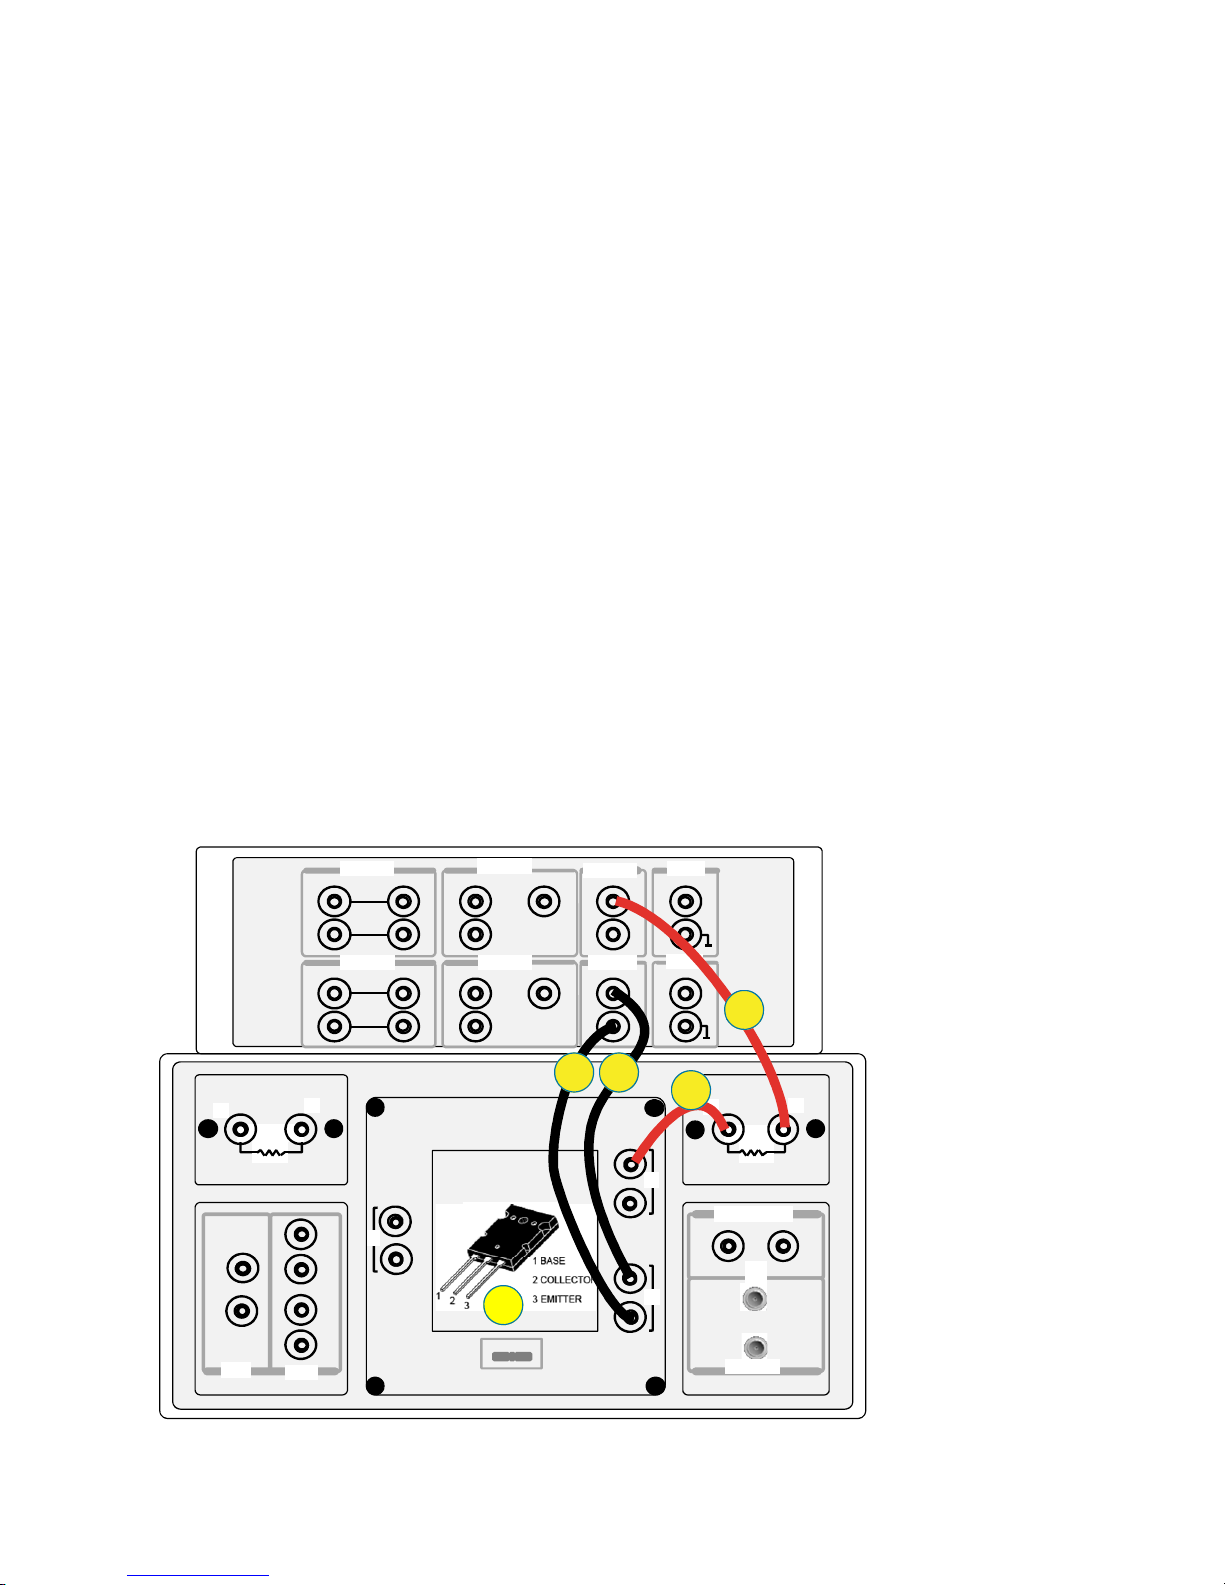
Step 1. Insert the power BJT (example: MJL4281AG) into the socket on the N1259A.
Make sure the device pin name matches to the socket numbers shown in
figure 3-4.
Step 2. Connect the High-Force of the HCSMU1 to the terminal 2 Force (Collector)
on the Inline Package Socket.
Step 3. Connect the High-Sense of the HCSMU1 to the terminal 2 Sense (Collector)
on the Inline Package Socket.
Step 4. Connect the Low-Force of the HCSMU1 to the terminal 3 Force (Emitter) on
the Inline Package Socket.
Step 5. Connect the Low-Sense of the HCSMU1 to the terminal 3 Sense (
on the Inline Package Socket.
Step 6. Connect the High-Force of the HCSMU2 to the terminal 1 Force (base) on the
Inline Package Socket.
Step 7. Connect the High-Sense of the HCSMU2 to the terminal 1 Sense (base) on
the Inline Package Socket.
Step 8. Connect the Low-Force of the HCSMU2 to the terminal 3 Force (Emitter) on
the Inline Package Socket.
Step 9. Connect the Low-Sense of the HCSMU2 to the terminal 3 Sense (
on the Inline Package Socket.
Step 10. Connect the GNDU1 Force to the terminal 3 Force (Emitter) on the Inline
Package Socket.
Step 11. Connect the GNDU1 Sense to the terminal 3 Sense (Emitter) on the Inline
Package Socket.
Close the N1259A fixture cover.
Emitter
Emitter
)
)
41
Page 42

2 x HCSMU configuration
High
Low
High
6 7
Low
1
Force
Sense
Low
Module Selector Output
2
1 kΩ
High
HCSMU1
Force
2
Sense
Force
3
Guard
4
HCSMU2 HPSMU2
Force
5
Sense
Force
Guard
Agilent N1259A opt 010
8 9
Force
Guard
Force
Sense
Guard
1
Sense
HPSMU1
Sense
Sense
1
1 2 3
HVSMU1
Force
Guard
GNDU1111
Force
Sense
Force
Sense
Force
Sense
10
Signal
Signal
2
3
AUX1
AUX2
Agilent N1259A opt 022Agilent N1259A opt 033
1
DC Bias Input
Guard
11
High Voltage Bias-Tee
2
100 kΩ
Force
High
Low
MF CMU
Figure 3-4. Common connection for Ic-Vce, hFE_Vbe-Ic and Vce(sat)-Ic 2 for 2xHCSMU configuration.
42
Page 43
3-1-1. Ic - Vce measurement
Measurement Parameters: General Ic-Vce characteristics
Application Test name: Ic-Vce(PowerBJT) (Ic-Vce characteristics)
Application Test setup name (My Favorite Setup -> Example_AT): Ic-Vce
(PowerBJT)
Device used in the example: MJL4281AG
Connection inside the N1259A Test Fixture: Use figure 3-3 or 3-4
Application description:
Measures Ic-Vce characteristics. SMU pulse is used for both the Collector-Emitter
voltage output and the base current drive.
Ic-Vce measurement of this application test does not extract any specification data
of power BJT, but it provides a generic idea of the transistor behavior such as hFE
dependence of the collector current and the voltage.
Typical power BJT data or specification sheet starts from the general Ic-Vce characteristics or hFE-Ic characteristics in graphical data section.
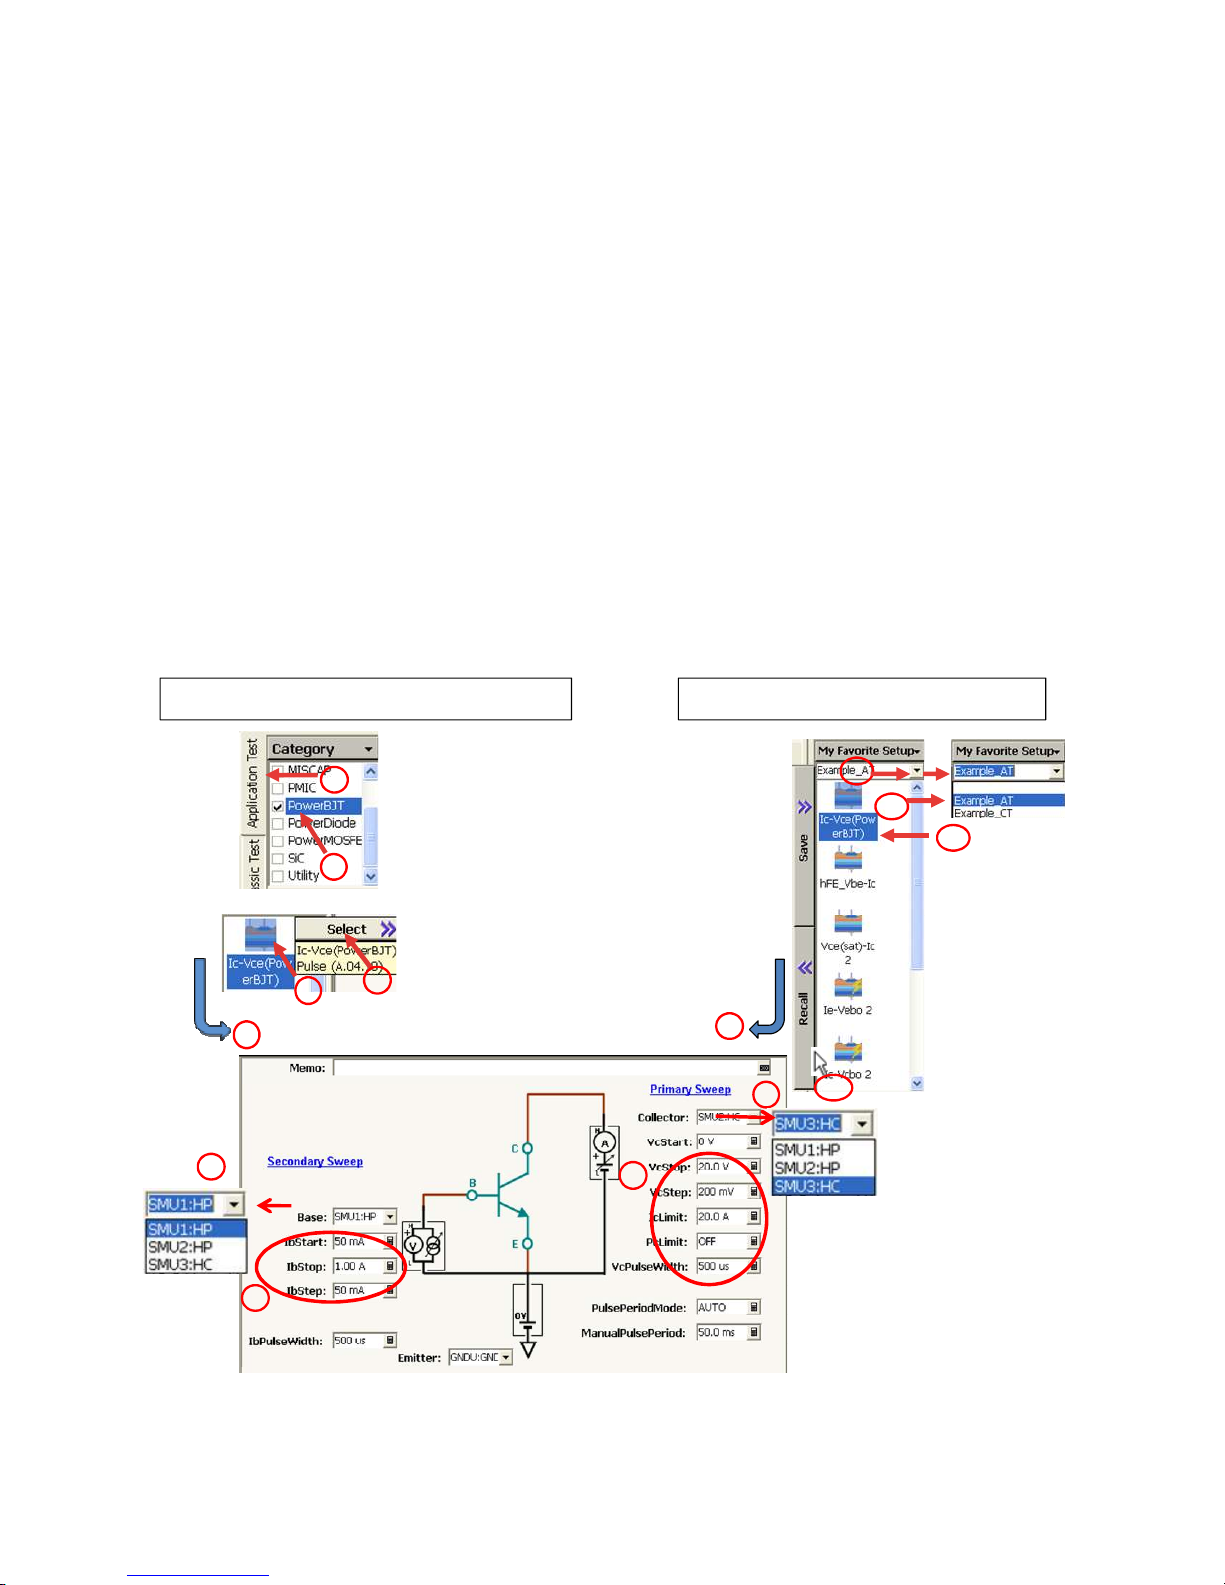
1. Starting from Application Test Library 1`. Starting from My Favorite Setup
1
1`
2`
3`
2
3
5
a
4
Go to
5
4`
c
d
b
Figure 3-5. Ic-Vce application test setup.
43
Page 44

A. Measurement Procedure: Ic-Vce(Power BJT) Application Test,
- Starting from Application Test Library
This test approach starts measurements by using an Application Test Library, which
starts from the default setup parameters, and you have to customize the measurement parameters depending on your requirements.
Setup and execute the test by following the next steps. The same instruction steps
are illustrated by the numbers on the "1. Starting from Application Test Library" side
of figure 3-5.
Step 1. Click the Application Test tab.
Step 2. Check the PowerBJT category.
Step 3,4. Select Ic-Vce(PowerBJT) (Click the Ic-Vce(PowerBJT) then click Select
)
Step 5. Set the test parameters shown in figure 3-5 to an appropriate one depending
on your B1505A configuration and your test device.
The important check points are;
a. Base SMU setup
b. Set Ib sweep parameters
c. Collector SMU setup
d. Set Vc test conditions
Step 6.Make sure the device is properly selected as shown in the "Device used in
the example" part or your selection.
Close the lid of N1259A test fixture.
Start the measurement. (Click the Single button )
Step 7. The graph window pops up, and the measurement starts.
Step 8. You can see the Ic-Vce curve in figure 3-6.
Figure 3-6 plots the collector current Icollector in Y axis versus the collector voltage
Vcollector in X axis.
44
Page 45

76 8
Marker readings
Marker On/Off
Marker
Figure 3-6. Ic-Vce application test display.
Review:
After the measurement, the marker is manually lmoved to the maximum collector
current position.
The marker function can be activated by pressing the marker on/off icon shown in
the graph. The marker appears on the first measurement point, and you can move
the measurement point by rotating the rotary knob in the primary sweep direction.
Pressing the rotary knob steps to the secondary sweep direction.
The measurement is limited at 20 A in the example which is the maximum current of
HCSMU connected to the collector, but it is also very close to the limit of HPSMU
connected to the base terminal.
The maximum collector current of the B1505A can be expanded to 40 A by connecting two HCSMUs in parallel, but the maximum 1 A base current of HPSMU limits the
maximum collector current around 20 A even if you use 40A configuration that is
shown in appendix section if you use this example powerBJT.
45
Page 46

A`. Measurement Procedure: Ic-Vce(Power BJT) Application Test,
- Starting from pre-defined test setup of My favorite Setup
This test approach starts measurements by using a pre-defined test setup saved in
My favorite Setup instead of starting from a scratch by using an Application Test
Library.
Setup and execute the test by following the next steps. The same instruction steps
are illustrated by the numbers on the "1`. Starting from Application Test Library"
side of figure 3-5.
Step 1. Click the Preset group of My Favorite Setup.
Step 2. Select Example_AT preset group.
Step 3. Select Ic-Vce(PowerBJT) (Click the Ic-Vce(PowerBJT)).
Step 4. Click "Recall" button.
Next step: Go to step 5 of "Starting from Application Test Library" above, and con-
tinue by following the test step numbers.
46
Page 47

3-1-2. hFE and Vbe(on) versus Ic measurement
Measurement Parameters: hFE, Vbe(on) DC current gain, Base-Emitter on volt-
age
Application Test name: hFE_Vbe-Ic
Application Test setup name (My Favorite Setup -> Example_AT): hFE_Vbe-Ic
Device used in the example: MJL4281AG
Connection inside the N1259A Test Fixture: Use figure 3-3 or 3-4
Application description:
Measures hFE-Ic and Vbe(on)-Ic characteristics. SMU pulse is used for Collector
current output and Base current output.
This measurement sweeps the base current, but the measurement output displays
the collector current in X axis as the dependent sweep parameter. Because the collector current is the dependent parameter of the base current, the start and stop
parameters of the base current (Ibstart and Ibstop) have to be decided by considering the hFE of the measurement device to properly display the measurement result
in the graphics.
A. Measurement Procedure: hFE_Vbe-Ic Application Test,
-Starting from Application Test Library
This test approach starts measurements by using an Application Test Library, which
starts from the default setup parameters, and you have to customize the measurement parameters depending on your requirements.
Setup and execute the test by following the next steps. The same instruction steps
are illustrated by the numbers on the "1. Starting from Application Test Library" side
of figure 3-7
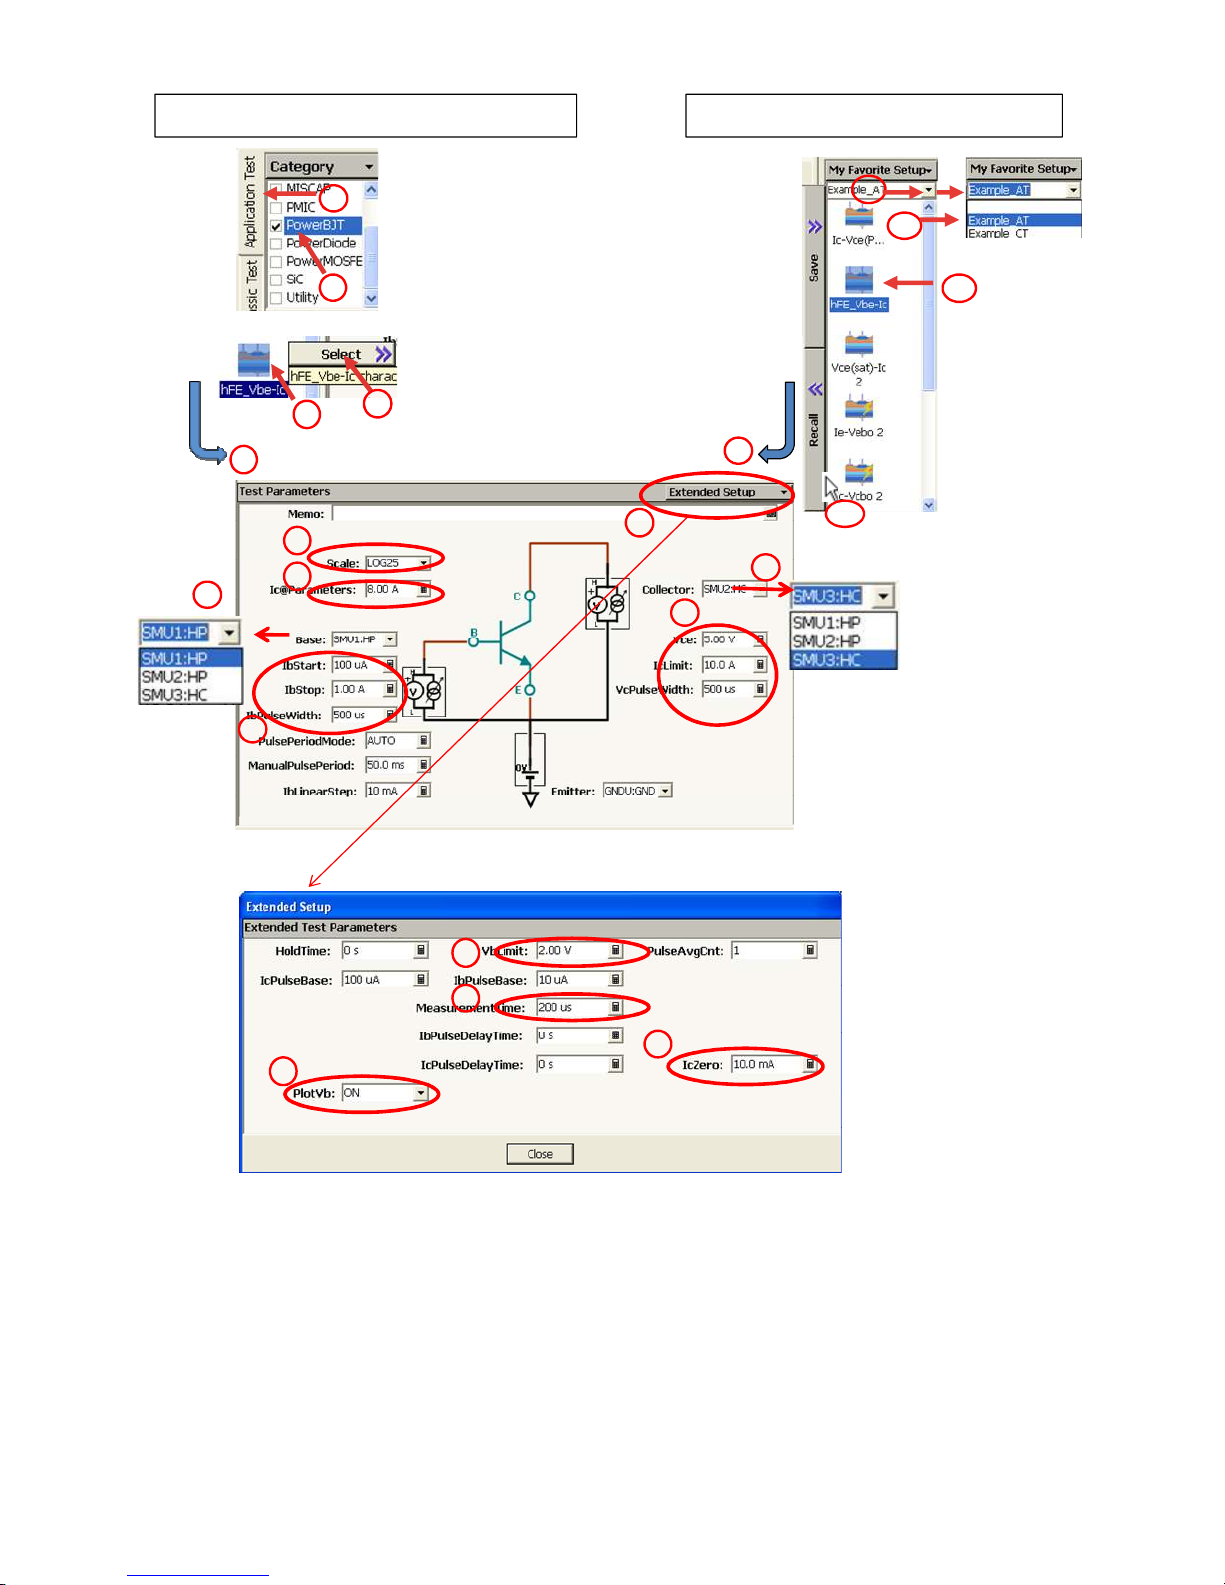
Step 1. Click the Application Test tab.
Step 2. Check the PowerBJT category.
Step 3,4. Select hFE_Vbe-Ic (Click the hFE_Vbe-Ic then click Select )
Step 5. Set the test parameters shown in figure 3-7 to an appropriate one depending
on your B1505A configuration and your test device.
The important check points are;
a. Base SMU setup
b. Ib sweep parameters
Note: Ib start and Ib stop parameters are roughly determined by the following formula; "target Ic start/hFE at low current" and "target Ic stop/
hFE at large current".
47
Page 48
1. Starting from Application Test Library 1`. Starting from My Favorite Setup
1
1`
2`
2
3
5
4
Go to
6
5
4`
3`
c
f
d
a
e
b
g
h
j
Figure 3-7. hFE_Vbe-Ic application test setup.
48
i
Page 49

c. Scale parameter:
You can choose "Linear" or "LOG" sweep selection. The hFE measurement is typically made in a few decades of wide measurement range in
the collector current, and LOG10 or LOPG25 which measures 25 points in
a decade of Ib sweep span would be a reasonable choice.
d. Collector SMU setup
e. Collector SMU measurement parameters
f. Parameter extraction Ic parameter setup. The hFE and Vbe(on) are ex-
tracted at this collector condition.
Step 6. Click Extended Setup.
Extended Setup window opens.
g. Base voltage limit (compliance voltage) is set
h. Measurement time is set
i. IcZero is the minimum x-axis collector current vale to display the output
graph.
j. PlotVb (ON/OFF): You have a choice for measuring Vbe or not.
Step 7. Make sure the device is properly selected as shown in the "Device used in
the example" part or your selection.
Close the lid of N1259A test fixture.
Start the measurement. (Click the Single button )
Step 8. The graph window pops up, and the measurement starts.
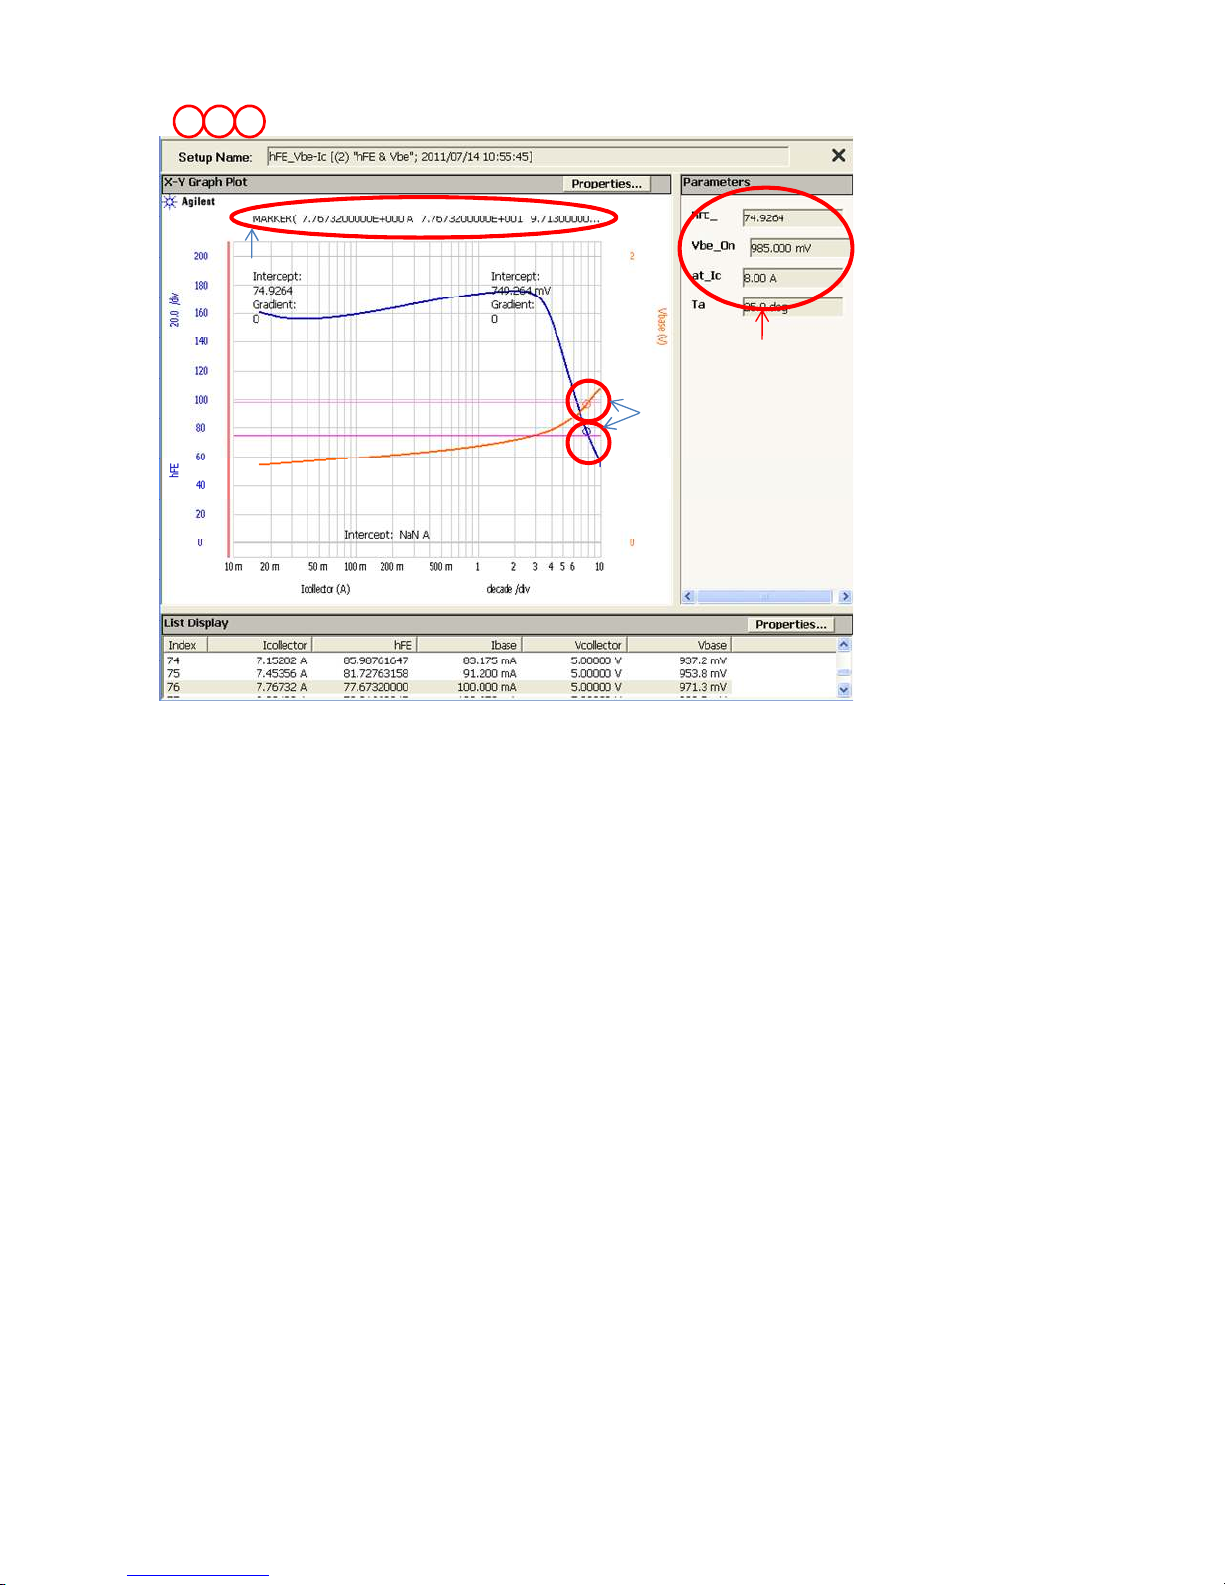
Step 9. You can see the hFE-Ic curve (Y1 axis) and Vbe-Ic (Y2 axis) curve as shown
in figure 3-8.
The hFE and the Vbe_On parameters at the specified collector current
(Ic@Parameters) are automatically extracted by using the line function and displayed
in the Parameters field of the output display. The markers are located near the
specified Ic @Parameters point.
49
Page 50
7 98
Marker readings
Extracted parameters
Marker for hFE and Vbe
Figure 3-8. hFE_Vbe-Ic application test data example
Review:
The hFE specification of MJL4281AG used in the example is minimum 50 at 8 A and
5 V collector measurement condition. The extracted hFE is 74.9 and it exceeds the
minimum specification limit. The extracted Vbe(on) parameter at the same condition
is 985 mV and it is cleared maximum 1.5 V specification limit.
A`. Measurement Procedure: hFE_Vbe-Ic Application Test,
- Starting from pre-defined test setup of My favorite Setup
This test approach starts measurements by using a pre-defined test setup saved in
My favorite Setup instead of starting from a scratch by using an Application Test
Library.
Setup and execute the test by following the next steps. The same instruction steps
are illustrated by the numbers on the "1`. Starting from Application Test Library"
side of figure 3-7.
Step 1. Click the Preset group of My Favorite Setup.
Step 2. Select Example_AT preset group.
Step 3. Select "hFE_Vbe-Ic" (Click the hFE_Vbe-Ic).
Step 4. Click "Recall" button.
Then go to step 5 of "Starting from Application Test Library" above, and continue by
following the test step numbers.
50
Page 51

3-1-3. Vce(sat) and Vbe(sat) versus Ic measurement
Measurement Parameters: Vce(sat), Vbe(sat) Collector-Emitter saturation volt-
age, Baser-Emitter saturation voltage
Application Test name: Vce(sat)-Ic 2
Application Test setup name (My Favorite Setup -> Example_AT): Vce(sat)-Ic 2
Device used in the example: MJL4281AG
Connection inside the N1259A Test Fixture: Use figure 3-3 or 3-4
Application description:
Measures Vce(sat)-Ic and Vbe(sat)-Ic characteristics and extracts Vce(sat) and Vbe
(sat) parameters at the specified Ib and Ic. SMU pulse is used for Collector current
output and Base current output.
A. Measurement Procedure: Vce(sat)-Ic 2 Application Test
-Starting from Application Test Library
This test approach starts measurements by using an Application Test Library, which
starts from the default setup parameters, and you have to customize the measurement parameters depending on your requirements.
Setup and execute the test by following the next steps. The same instruction steps
are illustrated by the numbers on the "1. Starting from Application Test Library" side
of figure 3-9.
Step 1. Click the Application Test tab.
Step 2. Check the PowerBJT category.
Step 3,4. Select Vce(sat)-Ic 2 (Click the Vce(sat)-Ic 2 then click Select )
Step 5. Set the test parameters shown in figure 3-9 to an appropriate one depending
on your B1505A configuration and your test device.
The important check points are;
a. Scale parameter:
You can choose "Linear" or "LOG" sweep selection for the collector and
the base current sweep. The measurement is typically made in a few decades of wide measurement range in the collector and the base current,
and LOG10 or LOPG25 which measures 25 points in a decade of sweep
span would be a reasonable choice.
b. Collector SMU setup
c. IbIcRatio parameter: Set the Ib sweep parameter with the following for-
mula: Ib=Ic/IbIcRatio
d. Set Ic and Vc test condition:
e. Set the collector current to extract Vce(sat) extraction: Ic@VceSat
f. Base SMU setup
g. Set the base current to extract Vbe(sat) extraction: Ib@VbeSat and set
base pulse width
51
Page 52
1. Starting from Application Test Library 1`. Starting from My Favorite Setup
1
1`
2`
2
3`
3
5
4
Go to
a
5
4`
b
c
f
d
g
e
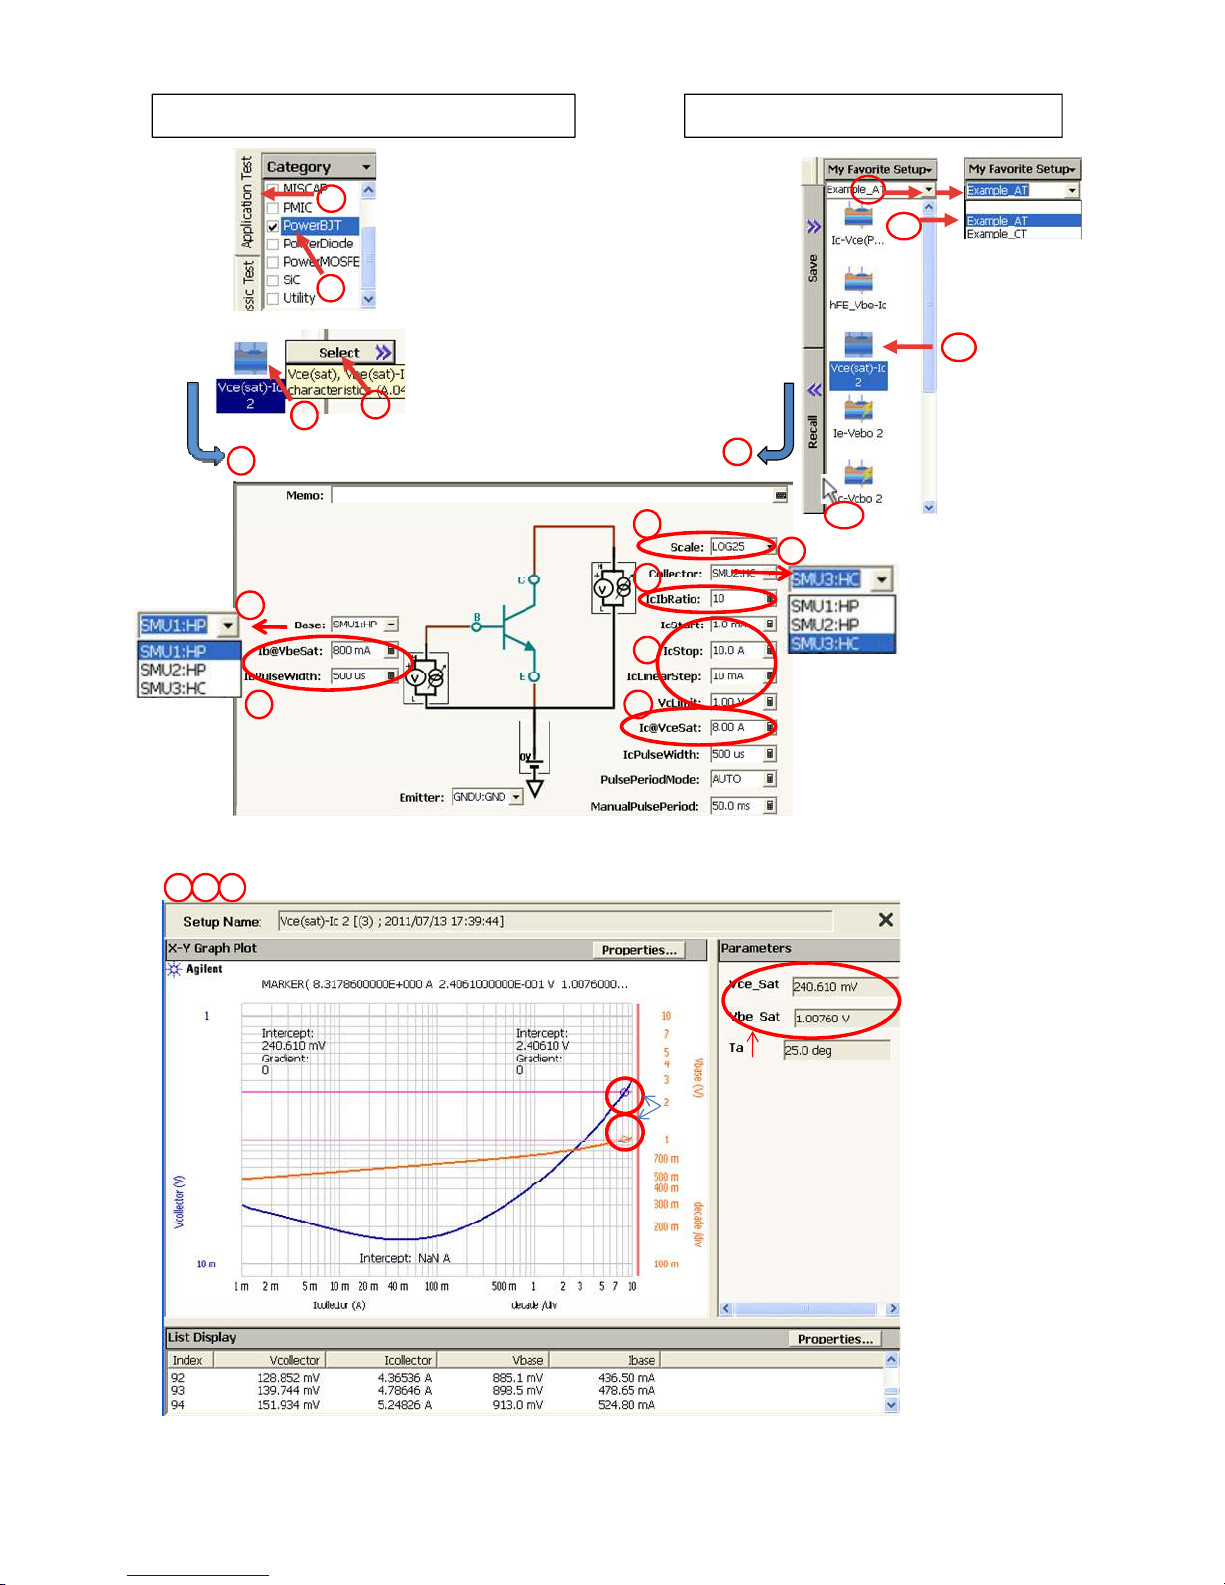
Figure 3-9. “Vce(sat)-Ic 2 “ application test setup.
76 8
Extracted parameters
Marker for Vce(sat) and Vbe(sat)
Figure 3-10. “Vce(sat)-Ic 2 “ application test results.
52
Page 53

Step 6. Make sure the device is properly selected as shown in the "Device used in
the example" part or your selection.
Close the lid of N1259A test fixture.
Start the measurement. (Click the Single button )
Step 7. The graph window pops up, and the measurement starts.
Step 8. You can see the Rds-Vgs_DP graph in figure 3-10.
Figure 3-10 plots Collector-Emitter saturation voltage in Y1 axis and Emitter-Base
saturation voltage in Y2 axis versus the collector current in X axis. Vce_Sat and
Vbe_Sat parameters are automatically extracted using the line function at the specified conditions and shown in the Parameters display. The markers for Vce(sat) and
Vbe(sat) marked by circles on the figure are automatically located by using the
marker function of the Auto Analysis capability.
Review:
Measured Vce_sat is 240 mV at Ic= 8 A and Ib=0.8 A test condition. The specification of MJL4281AG is maximum 1.0 V.
Measured Vbe_sat is 1.01 V at the same test condition. The specification of
MJL4281AG is maximum 1.4 V.
The measured parameters are much lower than the specification limits and agree to
the data sheet specification.
A`. Measurement Procedure: Vce(sat)-Ic 2 Application Test
- Starting from pre-defined test setup of My favorite Setup
This test approach starts measurements by using a pre-defined test setup saved in
My favorite Setup instead of starting from a scratch by using an Application Test
Library.
Setup and execute the test by following the next steps. The same instruction steps
are illustrated by the numbers on the "1`. Starting from Application Test Library"
side of figure 3-9.
Step 1. Click the Preset group of My Favorite Setup.
Step 2. Select Example_AT preset group.
Step 3. Select Vce(sat)-Ic 2 (Click the Vce(sat)-Ic 2).
Step 4. Click "Recall" button.
Then go to step 5 of "Starting from Application Test Library" above, and continue by
following the test step numbers.
53
Page 54

3-1-4. Vce(sus) or V(BR)ceo, and Iceo-Vce measurement
Measurement Parameters: Vce(sus) or V(BR)ceo Collector-Emitter sustaining
voltage or Collector-Emitter breakdown voltage
Iceo Collector-Emitter Cut-off current
Application Test name: Ic-Vceo_R
Application Test setup name: (My Favorite Setup -> Example_AT): Ic-Vceo_R or Ic-
Vceo_R(+R value)
Device used in the example: MJL4281AG
Connection inside the N1259A Test Fixture: Use the figure shown in this section
Application description:
Measures Collector current vs. Collector-Emitter voltage and extracts CollectorEmitter breakdown voltage (BVceo) and cut-off current (Iceo) at open base condition. The voltage drop by a resistor(0, 1k, 100 kΩ) inserted between the collector
terminal and the collector SMU can be compensated. A reminder message for assuring the resister value is popped up just before starting the measurement.
Measurement is aborted just after the detection of the drain breakdown.
Connection inside the N1259A Test Fixture
For Vce(sus) or V(BR)ceo test, we have an option for inserting a 100 kΩ resistor
between the collector and the collector SMU as shown in figure 3-13. Two configurations are shown as an example for no resistor (0 Ω selection) case and 100kΩ
resistor case.
NOTE: If measurement is made with Opt.300 Module Selector, use the procedure
shown in Appendix 2.
Α.
Α. Connection inside the N1259A Test Fixture: 0 ΩΩΩΩ
Α.Α.
Use the following connection inside the N1259A test fixture
Open the N1259A test fixture cover, and connect the test leads shown in figure 3-2
by following the step numbers as shown in figure 3-11 and the following procedure
steps.
Note: The available colors of the leads are black and red only. The lead color used in
figure 3-11 is for reference only.
The numbers of the procedure steps correspond to the numbers on the drawing for
connecting the test leads.
54
Page 55
[PROCEDURE]
Step 1. Insert the power BJT (example: MJL4281AG) into the socket on the N1259A.
Make sure the device pin name matches to the socket numbers shown in
figure 3-11.
Step 2. Connect the Force of the HVSMU1 to the terminal 2 Force (Collector) on the
Inline Package Socket.
Step 3. Connect the GNDU1 Force to the terminal 3 Force (Emitter) on the Inline
Package Socket.
Step 4. Connect the GNDU1 Sense to the terminal 3 Sense (Emitter) on the Inline
Package Socket.
Close the N1259A fixture cover.
High
Low
High
Low
1
Force
Sense
Low
2
1 kΩ
High
Module Selector Output
HCSMU1
Force
HCSMU2 HPSMU2
Force
Sense
Sense
Force
Guard
Force
Guard
Agilent N1259A opt 010
Force
Guard
Force
Sense
Guard
1
Sense
HPSMU1
Sense
Sense
1
1 2 3
HVSMU1
Force
Guard
GNDU1111
Force
Sense
Force
Sense
Force
Sense
AUX1
Signal
2
AUX2
Signal
34
Agilent N1259A opt 022Agilent N1259A opt 033
1
100 kΩ
2
2
DC Bias Input
Guard
3
Force
High
Low
MF CMU
High Voltage Bias-Tee
Figure 3-11. Ic–Vceo connection with no resistor between SMU and the collector terminal.
55
Page 56
B. Connection inside the N1259A Test Fixture: 100 kΩΩΩΩ
Use the following connection inside the N1259A test fixture
Open the N1259A test fixture cover, and connect the test leads shown in figure 3-3
by following the step numbers as shown in figure 3-12 and the following procedure
steps.
Note: The available colors of the leads are black and red only. The lead color used in
figure 3-12 is for reference only.
The numbers of the procedure steps correspond to the numbers on the drawing for
connecting the test leads.
[PROCEDURE]
Step 1. Insert the power BJT (example: MJL4281AG) into the socket on the N1259A.
Make sure the device pin name matches to the socket numbers shown in
figure 3-12.
Step 2. Connect the Force of the HVSMU1 to the terminal 2 of the N1259A Opt.022
(100 kΩ).
Step 3. Connect from the terminal 1 of the N1259A Opt.022 (100 kΩ) to terminal 2
Force (Collector) on the Inline Package Socket.
Step 4. Connect the GNDU1 Force to the terminal 3 Force (Emitter) on the Inline
Package Socket.
Step 5. Connect the GNDU1 Sense to the terminal 3 Sense (Emitter) on the Inline
Package Socket.
Close the N1259A fixture cover.
High
Low
High
Low
1
Force
Sense
Low
Module Selector Output
2
1 kΩ
High
HCSMU1
Force
HCSMU2 HPSMU2
Force
Guard
1
Force
Sense
Guard
Force
Sense
Guard
Sense
Force
Guard
Agilen t N1259A opt 010
Force
Sense
HPSMU1
Sense
Sense
1
1 2 3
Guard
Force
Sense
5
HVSMU1
Force
GNDU1111
Force
Sense
Force
Sense
AUX1
Signal
AUX2
Signal
2
4
Agilent N1259A opt 022Agilent N1259A opt 033
3
2
Guard
3
1
DC Bias Input
MF CMU
High Voltage Bias-Tee
2
100 kΩ
Force
High
Low
Figure 3-12. Ic–Vceo connection with 100 kΩΩΩΩ between SMU and the collector terminal.
56
Page 57

3-1-4-A. Measurement Procedure: Ic-Vceo_R Application Test without series collector resistor
Use figure 3-11 connection inside the N1259A Test Fixture.
A. Starting from Application Test Library
This test approach starts measurements by using an Application Test Library, which
starts from the default setup parameters, and you have to customize the measurement parameters depending on your requirements.
Setup and execute the test by following the next steps. The same instruction steps
are illustrated by the numbers on the "1. Starting from Application Test Library" side
of figure 3-13.
Step 1. Click the Application Test tab.
Step 2. Check the PowerBJT category.
Step 3,4. Select Ic-Vceo_R (Click the Ic-Vceo_R then click Select )
1. Starting from Application Test Library 1`. Starting from My Favorite Setup
1
1`
2`
2
3
5
4
Go to
5
f
3`
4`
d
e
a
b
c
Figure 3-13. Ic-Vceo_R Application Test setup without a series collector resistor.
57
Page 58

Step 5. Set the test parameters shown in figure 3-13 to an appropriate one depend-
ing on your B1505A configuration and your test device.
The important check points are;
a. Collector SMU setup
b. Set Vc sweep parameters
c. Set the collector voltage to extract Iceo: Vc@Iceo,
Set the collector current to detect and measure BVceo: Ic@BVceo
Note: The maximum current of HVSMU is 8 mA in 1500V range, and it is
less than the 50 mA specification current to test Bce(sus) or
BVceo.
d. Set collector resister. Set "0 Ω" in the first trial.
Note: If 100 kΩ is used, we need to change the cable connection inside
the n1259A Test Fixture and Extended Setup parameters, too.
e. Set Integration time: IntegTime.
Note: For measuring breakdown voltage Vce(sus) or BVceo, short integra-
tion would be better for finishing measurement faster on breakdown condition, but longer integration time would be better for
measuring the leakage current Iceo in precise. The example uses
MEDEUM Integration time.
f. Set Hold and Delay Time:
Proper Hold Time and Delay Time in Extended Setup is effective for leakage current test especially if the collector start voltage is close to the
Vc@Iceo value as the case like the example setup.
Step 6. Make sure the device is properly selected as shown in the "Device used in
the example" part or your selection.
Close the lid of N1259A test fixture.
Start the measurement. (Click the Single button )
Note:
"Collector R is zero ohm!" message window pops up. Make sure the
HVSMU output is directly connected to the collector terminal, and press
the OK button to continue the test.
Note: In case a 100 kΩ resistor is inserted between the HVSMU and the col-
lector terminal:
There is no hazard at this moment because the measurement is not yet
started, but make sure the red High Voltage light on the B1505A front
panel and the Shock Hazard warning light of the N1259A Test Fixture is
not lit.
After assuring no high voltage is output from the B1505A, then reconnect
the cable and close the N1259A fixture cover. Press the OK button to continue the test.
Step 7. The graph window pops up, and the measurement starts.
Step 8. You can see the Ic-Vceo_R graph in figure 3-14.
58
Page 59
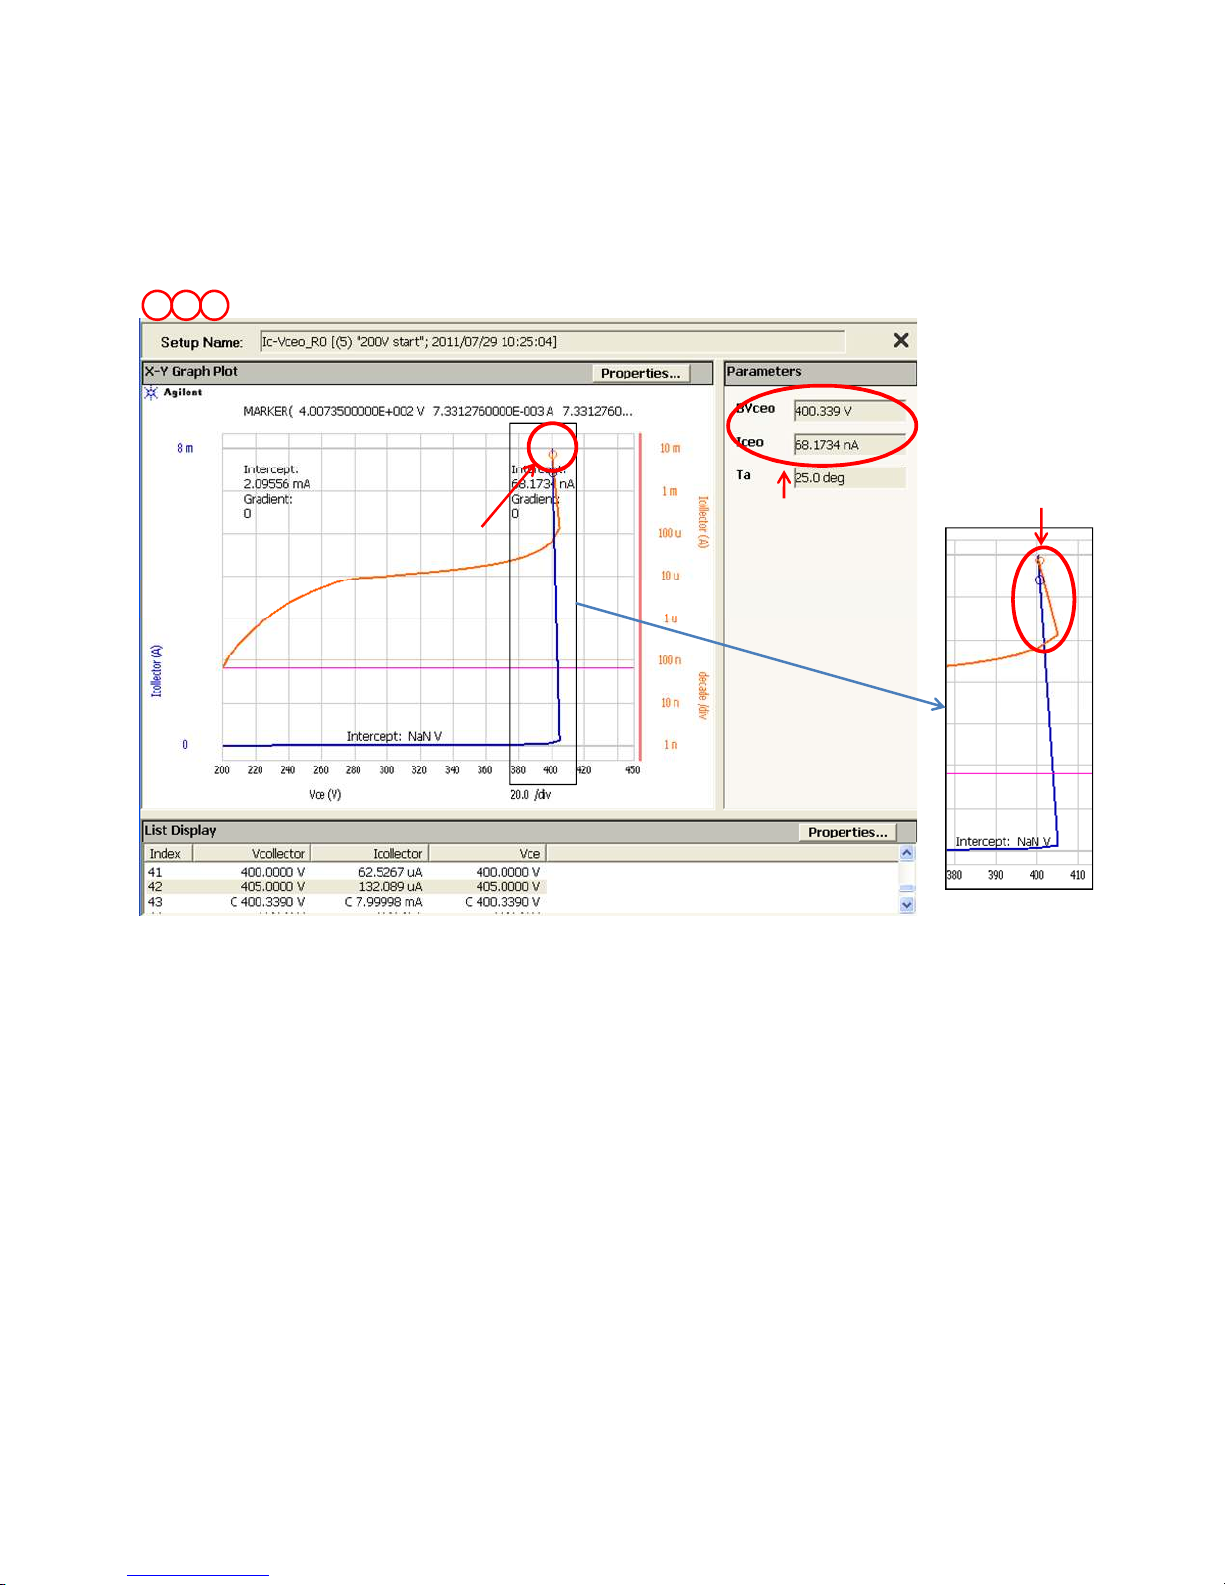
76 8
Figure 3-14 plots Icollector versus Vce. The VBceo and Iceo are automatically extracted at the specified condition, and the parameters are shown in the Parameters
display field.
Marker at breakdown
Note:
Trace is jumped.
Extracted BVceo and Iceo
Magnified view
Figure 3-14. Ic-Vceo_R test results setup without a series collector resistor.
Review:
The measured VBceo is 400.4 V and Iceo at 200 V is about 68 nA. The specification
of the VBceo is minimum 350 V at 50 mA collector current condition. The actual
data is at 8 mA collector current, but it looks the VBceo is okay. The Iceo specification is maximum 100 µA and the actual 68 nA performance is much lower than the
specification limit.
When measuring VBceo, it typically shows negative resistance characteristics, and
the measurement data show a jump from the breakdown start point to the final
point as shown in the magnified view of figure 3-14. For observing the breakdown
characteristics, a series resistor inserted between the collector terminal and the
collector SMU is effective.
The effect and result inserting a 100 kΩ resister are shown in the next section.
59
Page 60

A`. Measurement Procedure: Ic-Vceo_R Application Test without series collector
resistor.
- Starting from pre-defined test setup of My favorite Setup
This test approach starts measurements by using a pre-defined test setup saved in
My favorite Setup instead of starting from a scratch by using an Application Test
Library.
Setup and execute the test by following the next steps. The same instruction steps
are illustrated by the numbers on the "1`. Starting from Application Test Library"
side of figure 3-13.
Step 1. Click the Preset group of My Favorite Setup.
Step 2. Select Example_AT preset group.
Step 3. Select Ic-Vceo_R0 (Click the Ic-Vceo_R0).
Step 4. Click "Recall" button.
Then go to step 5 of "Starting from Application Test Library" above, and continue by
following the test step numbers.
60
Page 61

3-1-4-B. Measurement Procedure: Ic-Vceo_R Application Test with 100 kΩΩΩΩ series collector resistor
Use figure 3-12 connection inside the N1259A Test Fixture.
B. Starting from Application Test Library
This test approach starts measurements by using an Application Test Library, which
starts from the default setup parameters, and you have to customize the measurement parameters depending on your requirements.
Setup and execute the test by following the next steps. The same instruction steps
are illustrated by the numbers on the "1. Starting from Application Test Library" side
of figure 3-15.
Step 1. Click the Application Test tab.
Step 2. Check the PowerBJT category.
Step 3,4. Select Ic-Vceo_R (Click the Ic-Vceo_R then click Select )
Step 5. Set the test parameters shown in figure 3-15 to an appropriate one depend-
ing on your B1505A configuration and your test device.
The important check points are;
a. Collector SMU setup
b. Set Vc sweep parameters:
The VcStart voltage is set to 350 V to observe the breakdown characteristics more precisely. The 350 V start voltage is higher than the Vc@Iceo,
and extracted Iceo is not accurate because it is measured at the first 350V
start voltage instead of the 200 V specified voltage.
For VcStop parameter setting:
When 100 kΩ resister is inserted to the collector, the voltage drop by the
resister must be added to the maximum sweep voltage of the collector
SMU.
Calculate the maximum sweep voltage required to the collector SMU by
the following formula:
XVceMax_R100k = VcStop + 100 k * IcLimit.
For example, in case VcStop=450 V and IcLimit = 8 mA, then
XVceMax_R100k = 450 + 100 k * 8 m = 1,250 V
c. Set the collector voltage to extract Iceo: Vc@Iceo,
Set the collector current to detect and measure BVceo: Ic@BVceo
Note: The maximum current of HVSMU is 8 mA in 1500V range, and it is
less than the 50 mA specification current to test Bce(sus) or BVceo.
d. Set the collector resister: Set "100 kΩ" in the second trial.
Note: If 0 kΩ is used, we need to change the cable connection inside the
N1259A Test Fixture.
e. Set Integration time: IntegTime.
61
Page 62

Note: For measuring breakdown voltage Vce(sus) or BVceo, short integra-
tion would be better for finishing measurement faster on breakdown
condition, but longer integration time would be better for measuring
the leakage current Iceo in precise. The example uses MEDEUM Integration time.
Step 6. Set Extended parameters:
f. Set "XVceMax_R100k" parameter: This parameter set X-axis maximum
scale of the output graph that is used only when the 100 kΩ series resistor is selected. This is because the VcStop parameter cannot be used for
X-axis max. scale.
g. Set " R100k_Cal" parameter:
This is a field to set the real calibrated 100 kΩ value for compensating
the voltage drop by the series resistor.
You can expect a voltage compensation error of less than 0.1% if you
calibrate the 100 kΩ resistor by using the example Classic Test definition
introduced in the later section.
Step 7. Make sure the device is properly selected as shown in the "Device used in
the example" part or your selection.
Close the lid of N1259A test fixture.
Start the measurement. (Click the Single button )
Note:
"Insert 100 kohm between the collector SMU and the collector!" message window pops up. Make sure a 100 kΩ resistor is connected between the HVSMU output and the collector terminal, and press the OK
button to continue the test.
Note: In case no 100 kΩ resistor is inserted between the HVSMU and the
collector terminal:
There is no hazard at this moment because the measurement is not yet
started, but make sure the red High Voltage light on the B1505A front
panel and the Shock Hazard warning light of the N1259A Test Fixture is
not lit.
After assuring no high voltage is output from the B1505A, then reconnect the cable as shown in figure 3-12 and close the N1259A fixture
cover. Press the OK button to continue the test.
Step 8. The graph window pops up, and the measurement starts.
Step 9. You can see the Ic-Vceo_R graph in figure 3-16.
Figure 3-16 plots Icollector versus Vce. The VBceo and Iceo are automatically extracted at the specified condition, and the parameters are shown in the Parameters
display field.
62
Page 63

1. Starting from Application Test Library 1`. Starting from My Favorite Setup
1
1`
2`
2
3
5
4
Go to
6
5
4`
3`
d
e
a
b
c
g
Figure 3-15. Ic-Vceo_R Application Test setup with 100 kΩΩΩΩ series collector resistor.
f
63
Page 64
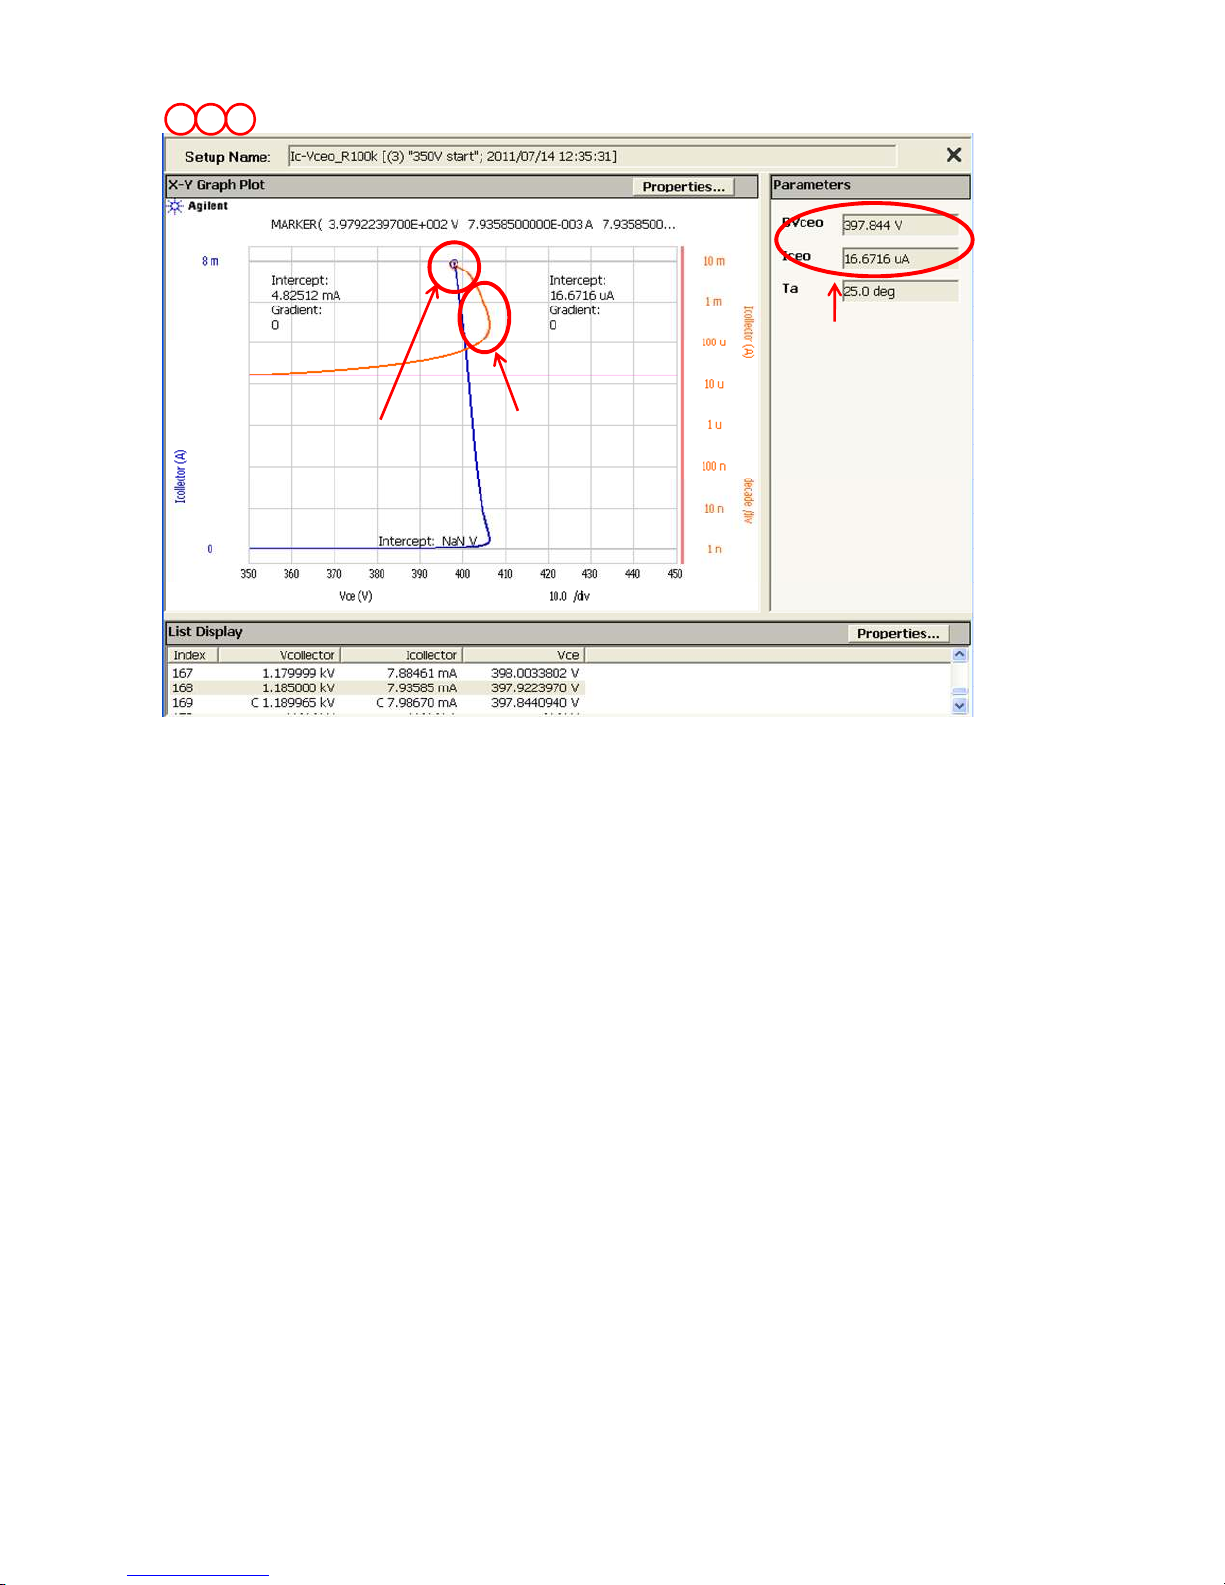
7 98
Extracted BVceo and Iceo
Marker at breakdown
Figure 3-16. Ic-Vceo_R test results with 100 kΩΩΩΩ series collector resistor.
Review:
The measured VBceo is 397.8 V and this is very close to the previous A section`s
results. The Iceo at 350V is about 17 µA and it is still lower than the specification
limit at 200 V.
When measuring VBceo, it typically shows negative resistance as discussed in previous A section.
The 100 kΩ resistor inserted in series between the collector terminal and the collector SMU cancels the negative resistance component when seeing from the SMU,
and the breakdown characteristics are measured very well as the breakdown curve
is showing continuous trace from the beginning of breakdown to the final measurement point as shown in figure 3-16.
Note: Trace is continuous.
64
Page 65

B`. Measurement Procedure: Ic-Vceo_R Application Test
- Starting from pre-defined test setup of My favorite Setup
This test approach starts measurements by using a pre-defined test setup saved in
My favorite Setup instead of starting from a scratch by using an Application Test
Library.
Setup and execute the test by following the next steps. The same instruction steps
are illustrated by the numbers on the "1`. Starting from Application Test Library"
side of figure 3-15.
Step 1. Click the Preset group of My Favorite Setup.
Step 2. Select Example_AT preset group.
Step 3. Select Ic-Vceo_R100k (Click the Ic-Vceo_R100k).
Step 4. Click "Recall" button.
Then go to step 5 of "Starting from Application Test Library" above, and continue by
following the test step numbers.
Note: 100 k
There is roughly 5% maximum error in the 100 kΩ resistor used in the N1259A Test
Fixture. The calibrated 100 kΩ value of this parameter is used in the compensation
routine of this application test, and more accurate Vce value can be obtained by
using the calibrated resistor value.
The Vce calculation when using the 100 kΩ resistor is made by the following for-
mula:
Vce = Vsmu - Ic * 100 kΩ value
where, Vsmu is SMU output voltage and Ic is the output current from the SMU, and
they are
The resistor can be compensated within 0.1 % by using the calibration routine: “100
kohm CT” Classic Test example routine introduced in Section 3-2-3.
The following shows two examples of BVceo error when using a resistor with 5%
and 0.1% accuracy for measuring the MJL4281AG example.
As can be seen from the calculation, using the 0.1% calibrated resistor results in
within 0.2% BVceo error, but non-calibrated 5% error resistor shows about 10% error.
It is important using the calibrated resistor when using this application test example
with 100 kΩ resistor..
ΩΩΩΩ
resistor error and the calibration:
within
about 0.03% error in the range of application voltage and current.
0.1% resistor error example:
Vce = 1,189.97V - 7.98569 mA * 100 k (1 +- 0.001)
= 391.4 +- 0.8 V
= 390.6 V ~ 392.2 V
5% resistor error example:
Vce = 1,189.97V - 7.98569 mA * 100 k (1 +- 0.05)
= 391.4 +- 39.9 V
= 351.5 V ~ 431.4 V
(-0.2% ~ +0.2%)
(-10% ~ +10%)
65
Page 66

3-1-5. BVcbo and Icbo-Vcb measurement
Measurement Parameters: BVcbo, Icbo Collector- Base voltage, Collector- Base
Application Test name: Ic-Vcbo 2
Application Test setup name: (My Favorite Setup -> Example_AT): Ic-Vcbo 2
Device used in the example: MJL4281AG
Connection inside the N1259A Test Fixture: Use the figure shown in this section
Application description:
Measures Collector current vs. Collector-Base voltage characteristics and extracts
Collector-Base breakdown voltage BVcbo and Collector Cut-off Current (Icbo) at
open emitter condition.
Measurement is aborted just after the detection of the drain breakdown.
Connection inside the N1259A Test Fixture
Use the following connection inside the N1259A test fixture
Open the N1259A test fixture cover, and connect the test leads shown in figure 3-2
by following the step numbers as shown in figure 3-17 and the following procedure
steps.
Note: The available colors of the leads are black and red only. The lead color used in
figure 3-17 is for reference only.
Cut-off Current
The numbers of the procedure steps correspond to the numbers on the drawing for
connecting the test leads.
NOTE: If measurement is made with Opt.300 Module Selector, use the procedure
shown in Appendix 2.
[PROCEDURE]
Step 1. Insert the power BJT (example: MJL4281AG) into the socket on the N1259A.
Make sure the device pin name matches to the socket numbers shown in
figure 3-17.
Step 2. Connect the Force of the HVSMU1 to the terminal 2 Force (Collector) on the
Inline Package Socket.
Step 3. Connect the GNDU1 Force to the terminal 1 Force (Base) on the Inline Pack-
age Socket.
Step 4. Connect the GNDU1 Sense to the terminal 1 Sense (Base) on the Inline
Package Socket.
Close the N1259A fixture cover.
66
Page 67
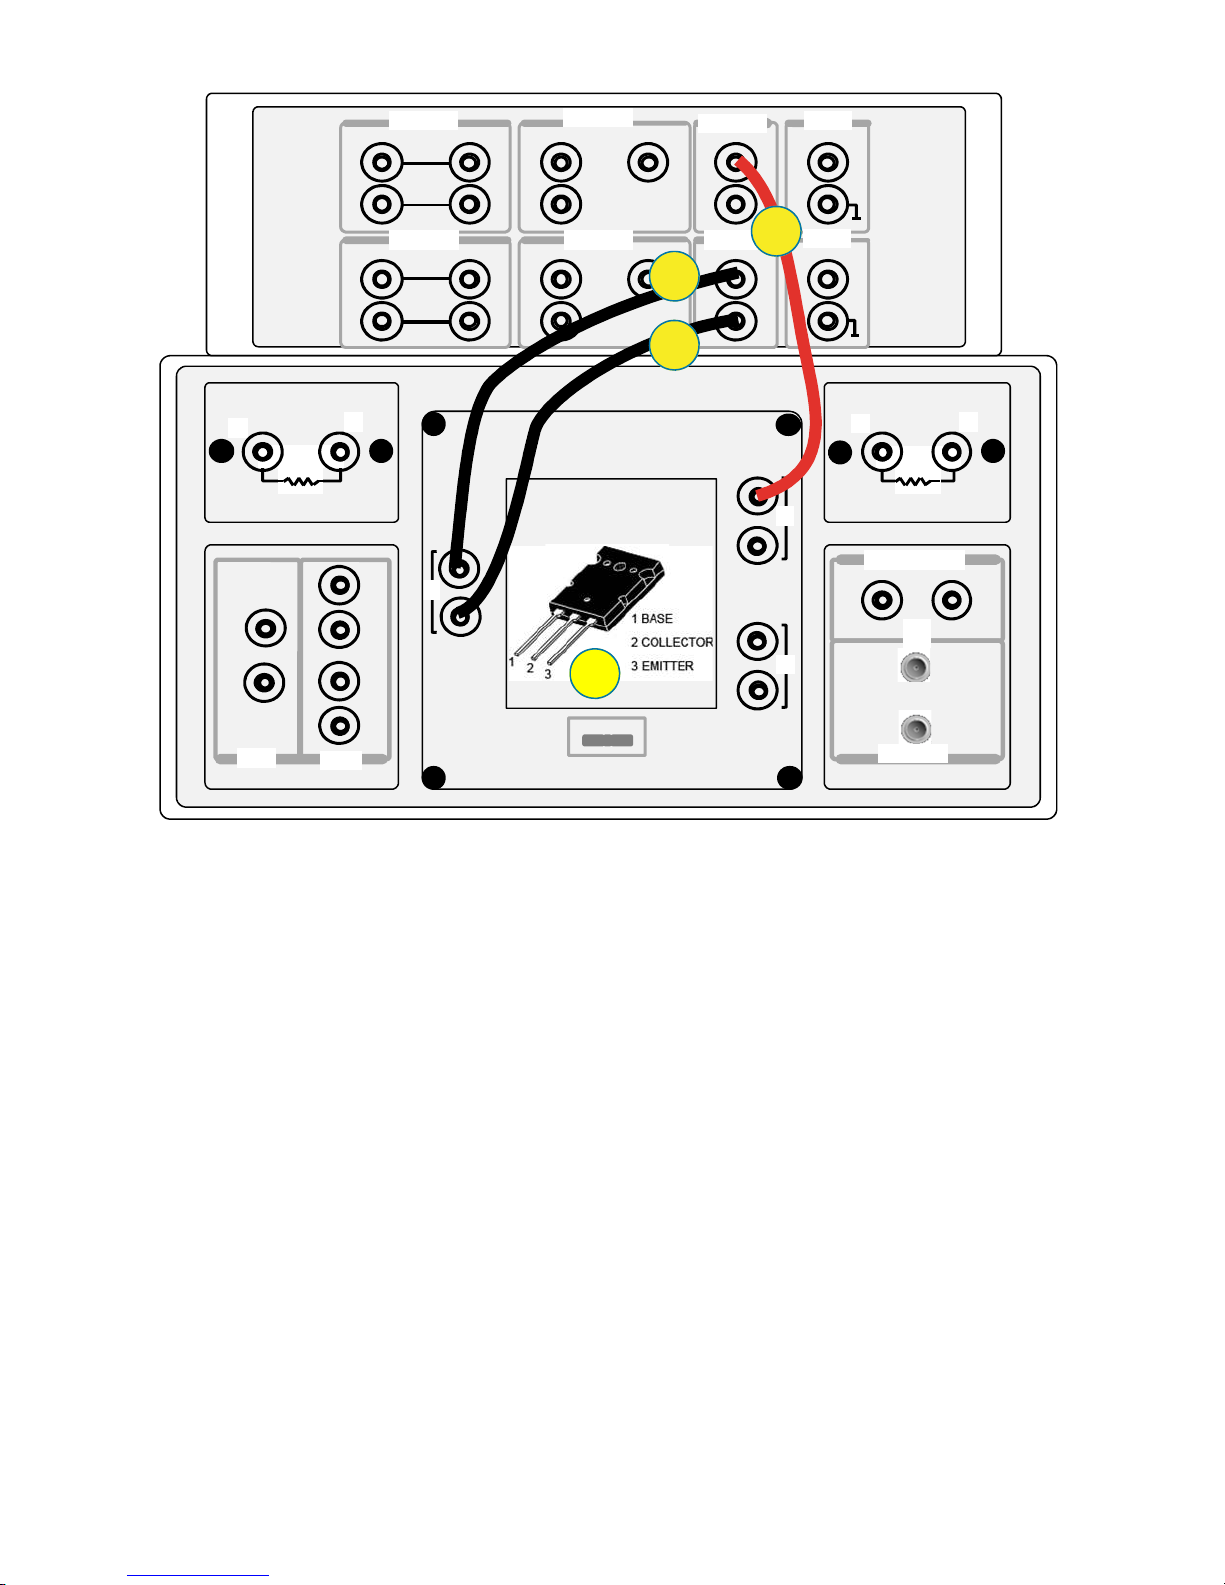
High
HCSMU1
Force
Sense
Force
HPSMU1
Sense
HVSMU1
Force
AUX1
Signal
Low
High
Low
1
Force
Sense
Low
2
1 kΩ
High
Module Selector Output
Guard
HCSMU2 HPSMU2
Force
Sense
Force
Guard
Agilent N1259A opt 010
Force
Guard
Force
Sense
Guard
1
Sense
Sense
1
1 2 3
Guard
2
GNDU1111
Force
3
Sense
Signal
AUX2
4
Agilent N1259A opt 022Agilent N1259A opt 033
2
Force
High
Low
Force
Sense
Force
Sense
1
100 kΩ
2
DC Bias Input
Guard
3
MF CMU
High Voltage Bias-Tee
Figure 3-17. Ic–Vcbo connection between SMUs and the power BJT fixture.
67
Page 68

A. Measurement Procedure: Ic-Vcbo 2 Application Test
-Starting from Application Test Library
This test approach starts measurements by using an Application Test Library, which
starts from the default setup parameters, and you have to customize the measurement parameters depending on your requirements.
Setup and execute the test by following the next steps. The same instruction steps
are illustrated by the numbers on the "1. Starting from Application Test Library" side
of figure 3-18.
Step 1. Click the Application Test tab.
Step 2. Check the PowerBJT category.
Step 3,4. Select Ic-Vcbo 2 (Click the Ic-Vcbo 2 then click Select )
Step 5. Set the test parameters shown in figure 3-18 to an appropriate one depend-
ing on your B1505A configuration and your test device.
The important check points are;
a. Collector SMU setup
b. Set Vc sweep parameters
This test is acquiring collector to base Cutoff current Icbo at the specified
collector voltage Vc@Icbo, and the start voltage can be set closer to the
Vc@Icbo for speeding the test.
c. Set the parameter extraction conditions:
Ic@VBcbo: Collector- Base current to detect BVcbo.
Vc@Icbo: Collector voltage to measure Icbo
d. Set Integration time: IntegTime.
Note: For measuring Collector-Base Cutoff current (Icbo), longer integra-
tion time would be better because the current is typically very
small. The example uses MEDEUM Integration time.
e. Set Hold and Delay Time:
Proper Hold Time and Delay Time in Extended Setup is effective for leakage current test especially if the collector start voltage is close to the
Vc@Icbo value as the case like the example setup.
Step 6. Make sure the device is properly selected as shown in the "Device used in
the example" part or your selection.
Close the lid of N1259A test fixture.
Start the measurement. (Click the Single button )
Step 7. The graph window pops up, and the measurement starts.
Step 8. You can see the Ic-Vcbo graph in figure 3-19.
Figure 3-19 plots Icb collector-to-base leakage current versus the collector voltage.
The marker is automatically located to the specified Ic@BVcbo point as shown by
circles marked on the figure. Extracted BVcbo and Icbo are shown in the Parameters display field.
68
Page 69

1. Starting from Application Test Library 1`. Starting from My Favorite Setup
1
1`
2`
2
3
5
4
Go to
5
3`
4`
e
d
a
b
c
Figure 3-18. “Ic-Vcbo 2” Application Test setup.
76 8
Extracted BVcbo and Icbo
Marker for BVcbo
Figure 3-19. “Ic-Vcbo 2” application test display.
69
Page 70

Review:
The collector to base cutoff current Icbo is typically very low even in power BJTs.
The specification of MJL4281AG is maximum 50 µΑ at Vcb=350 V. The measured
Icbo is 5.5 nA which is much lower compared to the specification, but it is natural.
We sweep the collector voltage with the 100 ms hold time for waiting the first
measurement with no additional delay time (means the default wait time determined
by the B1505A). Please note that the leakage current measurement is affected by
these wait time settings.
The measured collector to base breakdown voltage; BVcbo is about 567 V that is
much higher than the absolute maximum rating value Vcbo= 350 V. When measuring the breakdown characteristics by exceeding the maximum rating, such care as
to limit the collector current in safe level is very important.
Note: If the device shows secondary breakdown characteristics, inserting protective
resister between the collector SMU and the collector terminal is a good practice.
A`. Measurement Procedure: Ic-Vcbo 2 Application Test,
- Starting from pre-defined test setup of My favorite Setup
This test approach starts measurements by using a pre-defined test setup saved in
My favorite Setup instead of starting from a scratch by using an Application Test
Library.
Setup and execute the test by following the next steps. The same instruction steps
are illustrated by the numbers on the "1`. Starting from Application Test Library"
side of figure 3-18.
Step 1. Click the Preset group of My Favorite Setup.
Step 2. Select Example_AT preset group.
Step 3. Select Ic-Vcbo 2 (Click the Ic-Vcbo 2).
Step 4. Click "Recall" button.
Then go to step 5 of "Starting from Application Test Library" above, and continue by
following the test step numbers.
70
Page 71

3-1-6. BVebo and Iebo-Veb measurement
Measurement Parameters: BVebo, Iebo Emitter-base voltage, Emitter Cutoff
Application Test name: Ic-Vebo 2
Application Test setup name: (My Favorite Setup -> Example_AT): Ic-Vebo 2
Device used in the example: MJL4281AG
Connection inside the N1259A Test Fixture: Use the figure shown in this section
Application description:
Measures Emitter current vs. Emitter-Base voltage and extracts Emitter-Base breakdown voltage (BVebo) and Emitter Cut-off Current (Iebo) at open collector condition.
Connection inside the N1259A Test Fixture
Use the following connection inside the N1259A test fixture
Open the N1259A test fixture cover, and connect the test leads shown in figure 3-2
by following the step numbers as shown in figure 3-20 and the following procedure
steps.
Note: The available colors of the leads are black and red only. The lead color used in
figure 3-20 is for reference only.
current
The numbers of the procedure steps correspond to the numbers on the drawing for
connecting the test leads.
NOTE: If measurement is made with Opt.300 Module Selector, use the procedure
shown in Appendix 2.
[PROCEDURE]
Step 1. Insert the power BJT (example: MJL4281AG) into the socket on the N1259A.
Make sure the device pin name matches to the socket numbers shown in
figure 3-20.
Step 2. Connect the HPSMU1 Force to the terminal 3 Force (Emitter) on the Inline
Package Socket.
Step 3. Connect the HPSMU1 Sense to the terminal 3Sense (Emitter) on the Inline
Package Socket.
Step 4. Connect the GNDU1 Force to the terminal 1 Force (Base) on the Inline Pack-
age Socket.
Step 5. Connect the GNDU1 Sense to the terminal 1 Sense (Base) on the Inline
Package Socket.
Close the N1259A fixture cover.
71
Page 72
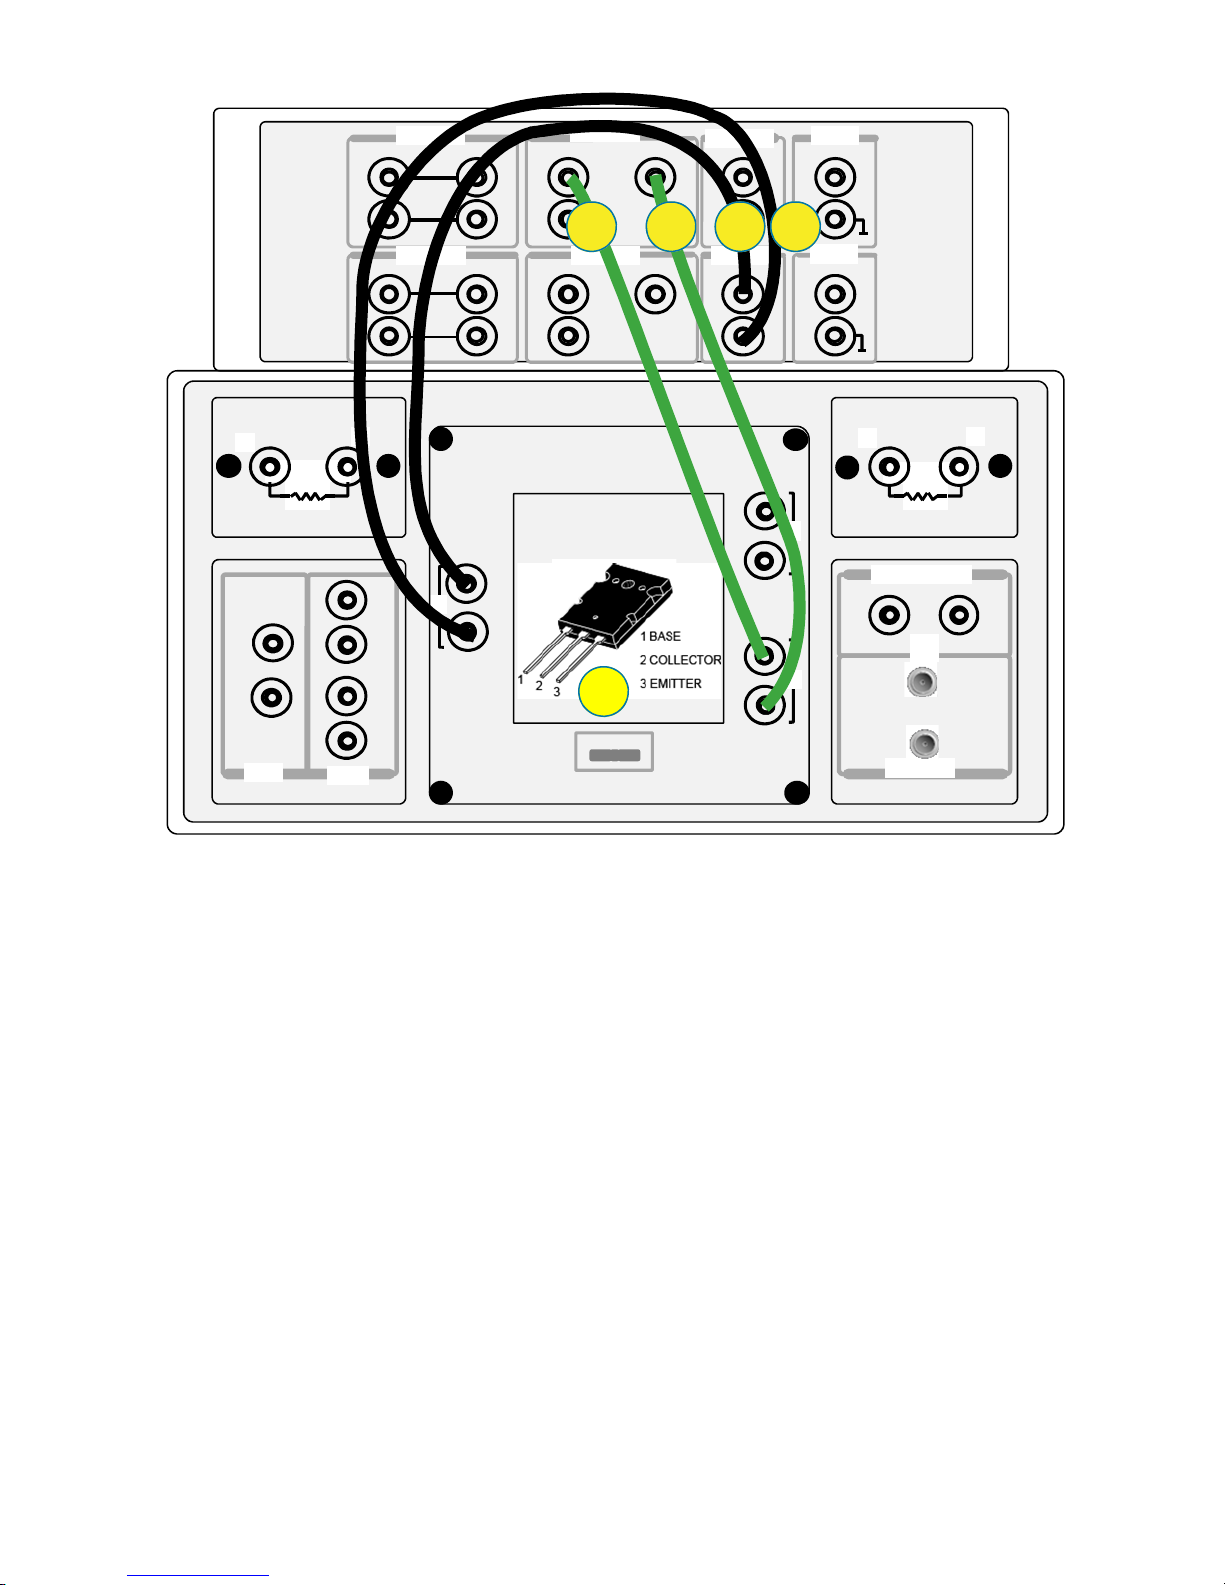
High
HCSMU1
Force
Sense
Force
HPSMU1
Sense
HVSMU1
Force
AUX1
Signal
Low
High
Low
1
Force
Sense
Low
2
1 kΩ
High
Module Selector Output
Guard
HCSMU2 HPSMU2
Force
Sense
Force
Guard
Agilent N1259A opt 010
Force
Guard
Force
Sense
Guard
1
Sense
Sense
1
1 2 3
Guard
GNDU1111
Force
Sense
Force
Sense
Force
Sense
4 532
AUX2
Signal
Agilent N1259A opt 022Agilent N1259A opt 033
1
100 kΩ
2
DC Bias Input
Guard
3
MF CMU
High Voltage Bias-Tee
2
Force
High
Low
Figure 3-20. Ie – Vebo connection between SMUs and the power BJT fixture.
72
Page 73

A. Measurement Procedure: Ic-Vebo 2 Application Test
-Starting from Application Test Library
This test approach starts measurements by using an Application Test Library, which
starts from the default setup parameters, and you have to customize the measurement parameters depending on your requirements.
Setup and execute the test by following the next steps. The same instruction steps
are illustrated by the numbers on the "1. Starting from Application Test Library" side
of figure 3-21.
Step 1. Click the Application Test tab.
Step 2. Check the PowerBJT category.
Step 3,4. Select Ic-Vebo 2 (Click the Ic-Vebo 2 then click Select )
Step 5. Set the test parameters shown in figure 3-21 to an appropriate one depend-
ing on your B1505A configuration and your test device.
The important check points are;
a. Emitter SMU setup
b. Set Ve sweep parameters
c. Set the parameter extraction conditions:
Ie@VBebo: Emitter- Base current to detect BVebo.
Ve@Iebo: Emitter voltage to measure Iebo
d. Set Integration time: IntegTime.
Note: For measuring Emitter Cutoff current (Iebo), longer integration time
would be better because the current is typically very small. The example uses MEDIUM Integration time.
Step 6. Make sure the device is properly selected as shown in the "Device used in
the example" part or your selection.
Close the lid of N1259A test fixture.
Start the measurement. (Click the Single button )
Step 7. The graph window pops up, and the measurement starts.
Step 8. You can see the Ic-Vebo graph in figure 3-22.
Figure 3-22 plots Ieb Emitter-to-Base leakage current versus Emitter voltage. The
marker is moved to the specified Ie@BVebo point as shown by circles marked on the
figure. Extracted BVebo and Iebo are shown in the Parameters display field.
73
Page 74

1. Starting from Application Test Library 1`. Starting from My Favorite Setup
1
1`
2`
2
3`
3
5
4
Go to
5
4`
d
a
b
c
Figure 3-21. “Ic-Vebo 2” Application Test setup.
76 8
Extracted BVebo and Iebo
Marker for BVebo
Figure 3-22. “Ic-Vebo 2” application test display.
74
Page 75

Review:
The Emitter cutoff current Iebo is typically very low even in power BJTs. The specification of MJL4281AG is maximum 5 µΑ at Veb=5 V. The measured Iebo is 157 pA
which is much lower compared to the specification, but it is natural. The measured
emitter to base breakdown voltage; BVebo is 10.65 V that is much higher than the
absolute maximum rating value Vebo= 5 V. When measuring the breakdown characteristics by exceeding the maximum rating, such care as to limit the emitter current
in safe level is important.
A`. Measurement Procedure: Ic-Vebo 2 Application Test.
- Starting from pre-defined test setup of My favorite Setup
This test approach starts measurements by using a pre-defined test setup saved in
My favorite Setup instead of starting from a scratch by using an Application Test
Library.
Setup and execute the test by following the next steps. The same instruction steps
are illustrated by the numbers on the "1`. Starting from Application Test Library"
side of figure 3-21.
Step 1. Click the Preset group of My Favorite Setup.
Step 2. Select Example_AT preset group.
Step 3. Select Ic-Vebo 2 (Click the Ic-Vebo 2).
Step 4. Click "Recall" button.
Then go to step 5 of "Starting from Application Test Library" above, and continue by
following the test step numbers.
75
Page 76

3-1-7. BVces and Ic-Vces measurement
Measurement Parameters: BVces, Ices Collector - Emitter voltage, Collector
Application Test name: Ic-Vces 2
Application Test setup name: (My Favorite Setup -> Example_AT): Ic-Vces 2
Device used in the example: MJL4281AG
Connection inside the N1259A Test Fixture: Use the figure shown in this section
Application description:
Measures Collector current vs Collector-Emitter voltage and extracts CollectorEmitter breakdown voltage. (Common Base)
Measurement is aborted just after the detection of the drain breakdown.
Connection inside the N1259A Test Fixture
Use the following connection inside the N1259A test fixture
Open the N1259A test fixture cover, and connect the test leads shown in figure 3-2
by following the step numbers as shown in figure 3-23 and the following procedure
steps.
breakdown voltage BVces
76
Note: The available colors of the leads are black and red only. The lead color used in
figure 3-23 is for reference only.
The numbers of the procedure steps correspond to the numbers on the drawing for
connecting the test leads.
NOTE: If measurement is made with Opt.300 Module Selector, use the procedure
shown in Appendix 2.
[PROCEDURE]
Step 1. Insert the power BJT (example: MJL4281AG) into the socket on the N1259A.
Make sure the device pin name matches to the socket numbers shown in
figure 3-23.
Step 2. Connect the Force of the HVSMU1 to the terminal 2 Force (Collector) on the
Inline Package Socket.
Step 3. Connect the GNDU1 Force to the terminal 3 Force (Emitter) on the Inline
Package Socket.
Step 4. Connect the GNDU1 Sense to the terminal 3 Sense (Emitter) on the Inline
Package Socket.
Step 5. Connect the HPSMU1 Force to the terminal 1 Force (Base) on the Inline
Package Socket.
Step 6. Connect the HPSMU1 Sense to the terminal 1Sense (Base) on the Inline
Package Socket.
Close the N1259A fixture cover.
Page 77

1 x HPSMU and 1 x HCSMU configuration
High
Low
High
Low
1
Force
Sense
Low
2
1 kΩ
High
Module Selector Output
HCSMU1
Force
HCSMU2 HPSMU2
Force
Force
Sense
Guard
5 6
Sense
Force
Guard
Agilent N1259A opt 010
Force
Guard
Force
Sense
Guard
1
Sense
HPSMU1
Sense
Sense
1
1 2 3
HVSMU1
Force
Guard
GNDU1111
Force
Sense
Force
Sense
Force
Sense
AUX1
Signal
AUX2
Signal
34
2
Agilent N1259A opt 022Agilent N1259A opt 033
1
100 kΩ
2
2
DC Bias Input
Guard
3
Force
High
Low
MF CMU
High Voltage Bias-Tee
Figure 3-23. Ic–Vces connection between SMUs and the power BJT fixture.
77
Page 78

A. Measurement Procedure: Ic-Vces 2 Application Test
-Starting from Application Test Library
This test approach starts measurements by using an Application Test Library, which
starts from the default setup parameters, and you have to customize the measurement parameters depending on your requirements.
Setup and execute the test by following the next steps. The same instruction steps
are illustrated by the numbers on the "1. Starting from Application Test Library" side
of figure 3-24.
Step 1. Click the Application Test tab.
Step 2. Check the PowerBJT category.
Step 3,4. Select Ic-Vces 2 (Click the Ic-Vces 2 then click Select )
Step 5. Set the test parameters shown in figure 3-24 to an appropriate one depend-
ing on your B1505A configuration and your test device.
The important check points are;
a. Collector SMU setup
b. Set Vc sweep parameters
Set an appropriate IdLimit parameter so as to limit the collector current on
breakdown and to protect your device.
c. Set the BVces extraction condition:
Ic@BVces: Collector current to detect BVces.
The value should be smaller then IdLimit.
d. Set Integration time: IntegTime.
Note: Short would be a reasonable choice for protecting your device on
breakdown, or Medium for accurate leakage current measurement.
e. Base SMU setup
f. Base voltage setup. Typically it is 0 V.
g. Press Extended Setup.
Extended Setup window opens.
h. IbMinRange setup.
Note:
It is important to set this range parameter larger than the base current that flows at breakdown condition. If this range is set smaller
than actual base current flowing from the collector on breakdown,
then the measured BVces will be not accurate.
Step 6. Make sure the device is properly selected as shown in the "Device used in
the example" part or your selection.
Close the lid of N1259A test fixture.
Step 7. The graph window pops up, and the measurement starts.
Step 8. You can see the Ic-Vebo graph in figure 3-25.
Figure 3-25 plots Ices collector current versus Collector - Emitter (Base) voltage. The
marker is automatically located to the specified Ic@BVces point as shown by circles
marked on the figure. Extracted BVces is shown in the Parameters display field.
78
Start the measurement. (Click the Single button )
Page 79

1. Starting from Application Test Library 1`. Starting from My Favorite Setup
1
1`
2`
2
3
5
4
Go to
5
3`
h
d
g
4`
a
e
b
f
c
Figure 3-24. “Ic-Vces 2” Application Test setup.
76 8
Extracted BVces
Marker for BVces
Figure 3-25. “Ic-Vces 2” application test display.
79
Page 80

Review:
The Collector breakdown voltage BVces shows typically very close to the Bvcbo.
There is no BVces specification for the MJL4281AG, but measured 543 V of BVces
shown in figure 3-25 is reasonable compared with the 566 V of BVcbo shown in figure 3-19 and the 397 V of BVceo shown in figure 3-16.
When measuring the breakdown characteristics by exceeding the maximum rating
as like this example, such care as to limit the collector current in safe level and to
finish the measurements in short period are important.
A`. Measurement Procedure: Ic-Vces 2 Application Test.
- Starting from pre-defined test setup of My favorite Setup
This test approach starts measurements by using a pre-defined test setup saved in
My favorite Setup instead of starting from a scratch by using an Application Test
Library.
Setup and execute the test by following the next steps. The same instruction steps
are illustrated by the numbers on the "1`. Starting from Application Test Library"
side of figure 3-24.
Step 1. Click the Preset group of My Favorite Setup.
Step 2. Select Example_AT preset group.
Step 3. Select Ic-Vces 2 (Click the Ic-Vces 2).
Step 4. Click "Recall" button.
Then go to step 5 of "Starting from Application Test Library" above, and continue by
following the test step numbers.
80
Page 81

3-1-8. Cob-Vc measurement
Measurement Parameters: Cob Output capacitance
Application Test name: Cob
Application Test setup name: (My Favorite Setup -> Example_AT): Cob
Device used in the example: MJL4281AG
Connection inside the N1259A Test Fixture: Use the figure shown in this section
Application description:
Measures Base-Collector capacitance (Cob), and plots Cob-Vc characteristics.
Extracts Cob at the specified collector voltage.
For more accurate measurement, perform correction data measurement at the
measurement frequency before starting the capacitance measurement.
Connection inside the N1259A Test Fixture
Use the following connection inside the N1259A test fixture
Open the N1259A test fixture cover, and connect the test leads, SHV cable and SHVBanana Adaptor shown in figure 3-26 by following the step numbers shown in figure
3-27. The numbers of the procedure steps correspond to the numbers on the drawing for connecting the test leads and SHV cables.
[PROCEDURE]
Step 1. Insert the power BJT (example: MJL4281AG) into the socket on the N1259A.
Make sure the device pin name matches the socket numbers shown in figure 3-27.
Step 2. Using test lead, connect the HVSMU1 Force to the DC Bias Input Force.
Step 3. Using test lead, connect the HVSMU1 Guard to the DC Bias Input Guard.
Step 4. Using a SHV cable and an adaptor, connect the MFCMU High output to the
terminal 2 Force (Collector) of the Inline Package Socket.
Step 5. Using a SHV cable and an adaptor, connect the MFCMU Low output to the
terminal 1 Force (Base) of the Inline Package Socket.
Close the N1259A fixture cover.
NOTE: If measurement is made with Opt.300 Module Selector, use the procedure
shown in Appendix 2.
81
Page 82

SHV cable and SHV
-
Banana Adaptor
Test Lead
Figure 3-26. Test Lead, SHV cable and SHV-Banana Adaptor for the N1259A Test Fixture.
1
Force
Sense
1 kΩ
HCSMU1
Force
High
Low
HCSMU2 HPSMU2
Force
High
Low
2
Guard
Force
Sense
Sense
Sense
Agilent N1259A opt 010
Force
1
Sense
Force
Guard
Force
Guard
HPSMU1
Sense
Sense
1
HVSMU1
Force
Guard
GNDU1111
Force
Sense
Force
Sense
Force
Sense
Signal
Signal
2
3
AUX1
AUX2
4
5
Agilent N1259A opt 022Agilent N1259A opt 033
1
Guard
23
2
100 kΩ
DC Bias Input
Force
High
Guard
Low
High
Module Selector Output
Figure 3-27. Cob application test connection between SMU and the power BJT fixture.
82
1 2 3
Low
MF CMU
High Voltage Bias-Tee
Page 83

A. Measurement Procedure: Cob Application Test
-Starting from Application Test Library
This test approach starts measurements by using an Application Test Library, which
starts from the default setup parameters, and you have to customize the measurement parameters depending on your requirements.
Setup and execute the test by following the next steps. The same instruction steps
are illustrated by the numbers on the "1. Starting from Application Test Library" side
of figure 3-28.
Step 1. Click the Application Test tab.
Step 2. Check the PowerBJT category.
Step 3,4. Select Cob (Click the Cob then click Select )
Step 5. Set the test parameters shown in figure 3-28 to an appropriate one depend-
ing on your B1505A configuration and your test device.
The important check points are;
a. Scale setup:
Select LINEAR or LOG. The example uses LOG10 scale that sweeps ten
logarithmic points per decade between VcStart and VcStop.
b. SMU setup for Collector DC bias
c. Set Vc sweep parameters
d. Set the parameter extraction conditions:
Vcb@Cbo: Collector voltage to measure Cob
e. Set MFCMU measurement parameters.
Step 6. Make sure the device is properly selected as shown in the "Device used in
the example" part or your selection.
Close the lid of N1259A test fixture.
Start the measurement. (Click the Single button )
Step 7. The graph window pops up, and the measurement starts.
Step 8. You can see the Cob-Vc graph in figure 3-29.
Figure 3-29 plots Cob in Y axis versus the collector voltage Vc in X axis. Cob is automatically extracted at the specified collector voltage, and it is shown in the Parameters display field.
83
Page 84

1. Starting from Application Test Library 1`. Starting from My Favorite Setup
1
1`
2`
2
3
5
4
Go to
5
3`
4`
f
a
b
e
c
Figure 3-28. Cob Application Test setup.
76 8
d
Extracted Cob
Marker for Cob
Figure 3-29. Cob application test display.
84
Page 85

Tips:
The marker can be used for reading each collector current and voltage by rotating
the rotary knob. You can read between the two measurement points by activating
the marker`s Interpolation mode to ON status.
Review:
The measured CV curve shows typical pn junction characteristics. The extracted Cob
is 240 pF at Vc=10 V and it is within the maximum specification of the Cob of
MJL4281AG; that is 600 pF at 10 V with 1 MHz measurement frequency.
A`. Measurement Procedure: Cob 2 Application Test.
- Starting from pre-defined test setup of My favorite Setup
This test approach starts measurements by using a pre-defined test setup saved in
My favorite Setup instead of starting from a scratch by using an Application Test
Library.
Setup and execute the test by following the next steps. The same instruction steps
are illustrated by the numbers on the "1`. Starting from Application Test Library"
side of figure 3-28.
Step 1. Click the Preset group of My Favorite Setup.
Step 2. Select Example_AT preset group.
Step 3. Select Cob (Click the Cob).
Step 4. Click "Recall" button.
Then go to step 5 of "Starting from Application Test Library" above, and continue by
following the test step numbers.
85
Page 86

3-2. Measurement using Classic Test and Tracer Test mode
This chapter demonstrates the following measurement examples using the Classic
Test mode and Tracer Test mode.
●
Ic-Vce TT Ic versus Vce measurement using Tracer Test mode
●
Vce(sat)-Ic_CT Vce(sat) and Vbe(sat) measurement using Classic Test
mode
●
100 kohm CT 100 kΩ resistor precision measurement for Vce(sus)
Application Test
86
Page 87

3-2-1. Ic - Vce Tracer Test
Measurement Parameters: Ic - Vce characteristics
Tracer Test setup name: (My Favorite Setup -> Example_CT): IC-VCE TT
Device used in the example: MJL4281AG
Connection inside the N1259A Test Fixture: Use figure 3-3 or 3-4
Application description:
Measures Ic-Vce characteristics. SMU pulse is used for both the Collector-Emitter
voltage output and the base current drive.
One of the features of Tracer Test mode is the interactive sweep control functionality using the rotary knob of the B1505A. It can control the sweep voltage or current
while the measurement is repeatedly performed by continuously changing the maximum sweep value by using the rotary knob.
A. Measurement Procedure: IC-VCE TT Tracer Test
Setup and execute the test by following the next steps. Step 1. Click Tracer Test
from the EasyEXPERT Test menu on the left-upper side of the display as shown figure 3-30.
Tips: To open the Tracer Test setups, you have to open the Tracer Test page
first.
Refer to figure 3-31 for the following Step 2 to Step 6.
1
Figure 3-30. To open the Tracer Test page.
87
Page 88

Step 2. Click the Preset group of My Favorite Setup.
Step 3. Select Example_CT preset group.
Step 4. Select IC-VCE TT (IC-VCE Tracer Test).
Step 5. Press Recall button.
Step 6. Pre-defined example IC-VCE TT Tracer Test setup opens.
Note:
Tracer Test uses one page concept for all the setups and the display of the
test results. The test setup functionalities are grouped in four separate areas of the display; Channel setup, Measurement setup, Display setup and
Tracer Test Menu as shown in the figure.
These functions are roughly introduced by following the test setup steps.
Display
Setup group
Measurement
6
Setup group
2
3
4
5
Channel Setup group
Figure 3-31. IC-VCE Tracer Test setup.
88
Tracer Test Menu
Page 89
Step 7. Set the test parameters shown in figure 3-32 to an appropriate one depend-
ing on your B1505A configuration and your test device.
The important check points are;
a. Base and Collector SMU setup
By clicking the target Unit area, Channel definition area is activated and
you can set the SMUs selection by clicking button. The voltage
and current name can be changed by just typing in to each field.
b. Set Vce primary sweep parameters in VAR1 field.
VAR1 parameter area can be expanded by clicking of the VAR1
field. Set the VAR1 parameters by referring to the figure.
You can scroll the menu bar by dragging the VAR1 area where no input
field is set. Input field is marked by on the right side of the
measurement parameters and you can drag any field by avoiding the lines
marked by these indicators.
c. Set Ib secondary sweep parameters in VAR2 field.
The VAR2 input parameter area can be expanded in the same way as
VAR1 by clicking of the VAR2 field. The position of the VAR2 input
field can be adjusted in the same way by dragging the menu bar where no
input field is set.
d. There is no CONST parameter set in the measurement function, and no
input field appears for CONST area.
e. Set the Y axis display parameter.
f. Set the X axis display parameter.
g,h,i,j: Set the Y and X axis maximum and minimum value. The pop-up window
opens by clicking each scales maximum or minimum number displayed on
the screen. Please carefully target the mouse pointer exactly on the number field, else the pop-up window won`t open.
k. Tips:
By clicking the icon, you can open the Tracer Test menu, and
start from a predefined setup. This is an easy way for creating a Tracer
Test setup. This is especially effective for creating a complicated test
setup such as like including a pulse source.
Later, you can convert this setting to a Classic Test mode setup where
no preset test definitions are available.
Step 8. Make sure the device is properly selected as shown in the "Device used in
the example" part or your selection.
Close the lid of N1259A test fixture.
Start the measurement. (Click the Single button )
Step 9. The measurement starts, and the graph appears as shown in figure 3-33.
Step 10. You can activate Marker to read specific data by clicking the mark
in the lower side bar of the graph display.
89
Page 90

b
Expands
VAR1 menu
7
g
h i j
f
e
a
SMU selection
Figure 3-32. IC-VCE Tracer Test parameter setup.
Menu bar can be scrolled
easily by dragging the no
mark filed (i.e. except .)
k
c
d
8
9 9
10
Figure 3-33. IC-VCE TT Tracer Test example.
90
Marker
Page 91
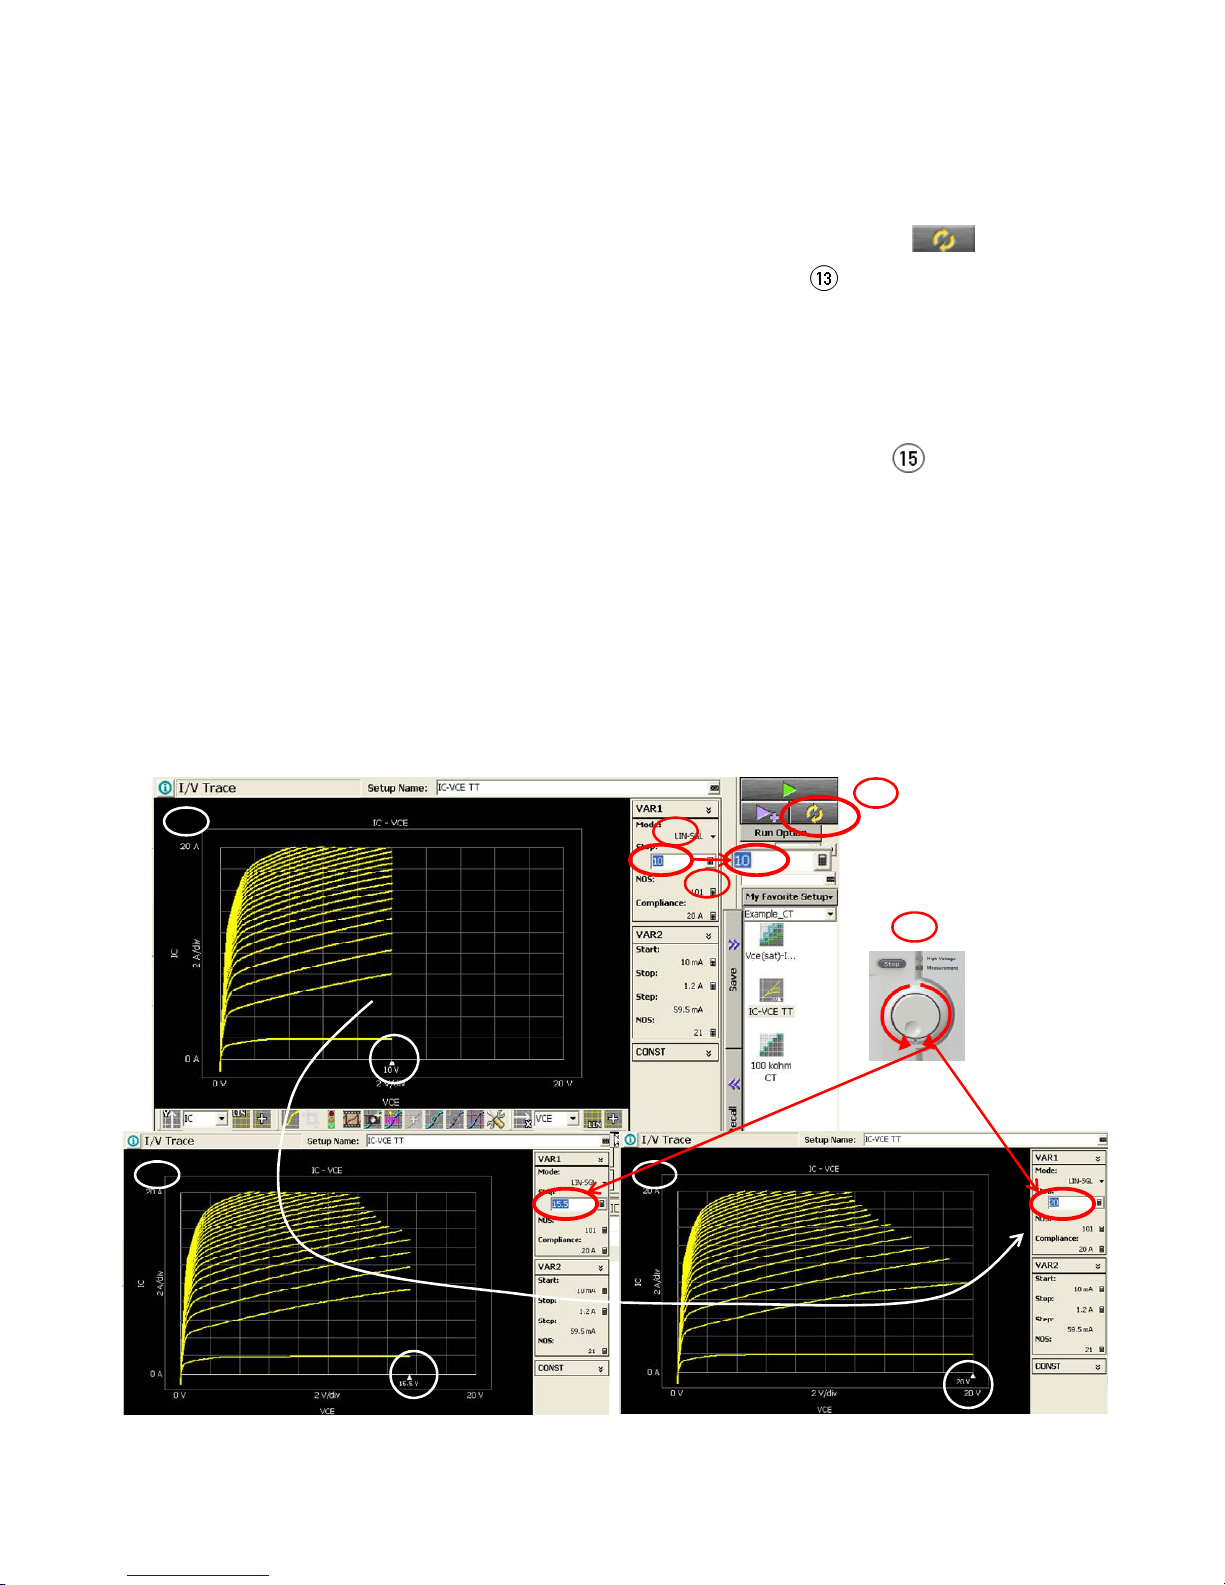
Interactive sweep control:
You can control the sweep by manually by following the next steps; (See figure 3-34)
Step 11. Activate Stop voltage of VAR1, and set the voltage to a lower safe voltage,
say 10 V.
Step 12. Start repeat measurement by pressing Repeat Measure button.
Step 13. The graph sweeps 0 V to +10 V marked by "step 13" in figure 3-34
(top left) is shown.
Step 14. Activate Stop voltage of VAR1 again.
Now, you can control the maximum sweep voltage by rotating a rotary
knob in real time manner.
Step 15. Rotate the knob clock wise.
The sweep end point increases as shown marked by "step
15" (bottom left) in the figure.
Step 16. Then the sweep finished at Vce=20 V in the example.
Tips:
It takes a while until all the traces are refreshed to the new sweep stop voltage in
the example setup, because there are 21 VAR2 Ib steps for each VAR1 Vce sweep.
You can reduce the VAR2 step number in the case where a faster response is required.
13 10 V sweep
11
14
15 @15.5 V sweep 16 @20 V sweep
12
15
Figure 3-34. IC-VCE TT Tracer Test: Interactive sweep control.
91
Page 92

3-2-2. Vce(sat) and Vbe(sat) Classic Test mode measurement
Measurement Parameters: Vce(sat), Vbe(sat) Collector-Emitter saturation volt-
age, Base-Emitter saturation voltage
Application Test name: Vce(sat)-Ic_CT
Application Test setup name (My Favorite Setup -> Example_CT): Vce(sat)-Ic_CT
Device used in the example: MJL4281AG
Connection inside the N1259A Test Fixture: Use figure 3-3 or 3-4
Application description:
Measures Vce(sat)-Ic and Vbe(sat)-Ic characteristics and extracts Vce(sat) and Vbe
(sat) parameters at the specified Ic and Ib. SMU pulse is used for Collector current
output and Base current output.
This measurement setup is an example of Classic Test mode for showing how the
classic test which is the measurement engine of the Application Test mode library is
constructed for executing a test and extracting parameters.
Note: This is the same measurement introduced in section 3-1-3.
A. Measurement Procedure: Vce(sat)-Ic_CT Classic Test
Refer to figure 3-35 for the following Step 1 to Step 23.
Step 1. Click the Preset group of My Favorite Setup.
Step 2. Select Example_CT preset group.
Step 3. Select Vce(sat)-Ic_CT (Vce(sat)-Ic_CT Classic Test).
Step 4. Press Recall button.
Step 5. Pre-defined example Vce(sat)-Ic_CT classic test setup – Channel Definition
page opens.
Channel Definition page sets up the SMUs and their measurement function.
The example uses "Multi Channel I/V Sweep" Classic Test mode for synchronously sweeping both the collector current and the base current in
pulsed mode.
Step 6. Set Unit field appropriately depending on your B1505A and connection set-
ups.
If your B1505A is one HCSMU configuration (Note: maximum two HCSMUs
are allowed in the configuration), set HCSMU to the collector supply as in
the case of the example setup.
92
Note that both the collector and the base SMUs are set current sweep
source as VAR1.
The connection between the SMU definitions and the power BJT pins must
be matched to each other.
Page 93

Step 7. Press Measurement Setup tab.
You can change measurement parameters in this page.
Step 8. Linear/Log sweep mode is set.
The parameter is set to "LOG25" which sweeps and measures 25 points per
decade between the Start and Stop value entered in the next step.
Step 9. VAR1 or primary sweep parameters are set: Both Ibase and Icollector are
set.
Please note that the ratio of Ic/Ib is specified in the data sheet specification
(typically it is 10), and the ratio of these sweep parameters is to be the same
as the specification condition. The ratio of the example is 10 as that is the
specification condition.
(Start: Ic/Ib=1 mA/100 µA, Stop: Ic/Ib=10 A/1 A)
Step 10. Pressing "Pulse" button opens "Pulse Setup" sub-window.
Step 11. Integration time in pulsed measurement can be set. Make sure the integra-
tion time is less than 1 ms considering the maximum pulse width for
HCSMU is 1 ms. We require more than 50 µs typically until the pulse is
settled in a higher current region, say more than a few amperes, and the
integration time is to be set less than the pulse width minus 50 µs.
Step 12. Pulse width can be set. Since the minimum pulse width of HPSMU is 500 µ
s and the maximum pulse width of HCSMU is 1 ms in 20 A range, the possible range for pulse width is between 500 µs to 1ms for HPSMU. HCSMU
can be set less than 500 µs, and it is effective for reducing the power dissipation of the power BJT.
Step 13. Press Auto Analysis Setup tab.
Step 14. Set Line 1 function to extract the first parameter as shown in the example.
a. Check "Enable" and "Fix" box.
b. Set the Line Type to Gradient, set Gradient value to "0" and select Data
condition to draw a horizontal line on the measurement curve in the specific point where is decided by the Condition formula.
The Y axis data of the line is read later to display as a power BJT parameter.
c. Set detection condition parameter as Icollector and the value to 8 (A).
Step 15. Set Line 2 function to extract the second parameter in the same way as
shown in the step 14.
Step 16. Enable marker function and set the detection condition which indicates the
marker to locate on the measurement curve.
Step 17. Press Function Setup tab.
Step 18. This step extracts parameters from the Line drawn in step 14 and 15.
The @L1Y1 function returns the Y1 axis intercept value (X=0) of Line 1.
The @L2Y2 function returns the Y2 axis intercept value (X=0) of Line 2.
Since the gradient of the line is zero (i.e. horizontal line), this function de-
93
Page 94

tects the Y axis value of the measurement curve at the specified X axis
point.
Step 19. Press Display Setup tab.
You can set the X-Y Graph, List Display and the Parameters of the meas-
urement results in this page.
Step 20. The X, Y1, Y2 and so on to maximum Y8 axis can be defined as X-Y graph
display.
Log or Linear scale and the Min. and the Max. scale parameters are set.
Step 21. List Display sets the measurement parameters that are shown in the List
area of Display Graph window.
Step 22. Parameters field sets the display of extracted parameters.
In the example setup, Vce_sat and Vbe_sat are defined in the Auto Analysis and Function Setup tabs. (Step 13 to step 18)
Step 23. Make sure the device is properly selected as shown in the "Device used in
the example" part or your selection.
Close the lid of N1259A test fixture.
Start the measurement. (Click the Single button )
Step 24. The graph window pops up, and the measurement starts.
Step 25. You can see the Vcollector-Icollector curve on Y1 axis and Vbase (Y2 axis)
graph in figure 3-36.
The marker is automatically moved to the Icollector value (X axis) specified
in the Marker function of Auto Analysis Setup, and the corresponding
Vce_sat and Vbe_sat are displayed on the Parameter field.
94
Page 95

5
5
6
1
2
3
4
7
8
9
10
11
12
Part of Figure 3-35. Vce(sat)-Ic Classic Test setups. Continue to next page.
95
Page 96

14
15
13
18
17
16
19
20
Figure 3-35. Vce(sat)-Ic Classic Test setups.
96
21
22
Page 97

23 24
25
Extracted parameters
Marker for Vce(sat) and Vbe(sat)
Figure 3-36. Vce(sat)-Ic classic test results.
Review:
The output data shown in figure 3-36 shows exactly the same results as the figure 3
-10. The difference is the Y axis is in linear scale in the case of figure 3-36, but figure
3-10 is drawn in Log scale. You can change the scale mode very easily in the Classic
Test mode, but Application Test mode requires several steps to modify the definition.
In case the requirement is just changing the output format on that moment, it can
be changed by using the View -> Display Setup menu bar function of the Display
data window.
Tips:
As we see, the Classic Test mode requires more setup steps compared to the Application Test mode, but the Classic Test mode allows more freedom in changing the
test setups such as the measurement functions, measurement parameters, display
parameters and format at the expense of being a little more complicated.
97
Page 98

3-2-3. 100 k
ΩΩΩΩ
resistor precision measurement for Vce(sus) Application Test
Measurement Parameters: Resistor value Measures 100 kΩ resistor value better
than 0.1 % error
Application Test name: 100 kohm CT
Application Test setup name (My Favorite Setup -> Example_CT): 100 kohm CT
Device used in the example: 100 kΩ resistor of the N1259A Opt.022
Connection inside the N1259A Test Fixture: Use the figure shown in this section
Application description:
Measures 100 kΩ resistor by using SMU by sweeping from 0 V to 100 V. The resistor value is extracted by using the regression fitting method.
Less than 0.1 % measurement accuracy can be expected.
The extracted resistor value is expected to be used in the Vce(sus) application test
as a calibrated resistor value.
Connection inside the N1259A Test Fixture
Use the following connection inside the N1259A test fixture
Open the N1259A test fixture cover, and connect the test leads shown in figure 3-2
by following the step numbers as shown in figure 3-37 and the following procedure
steps.
Note: The available colors of the leads are black and red only. The lead color used in
figure 3-37 is for reference only.
The numbers of the procedure steps correspond to the numbers on the drawing for
connecting the test leads.
[PROCEDURE]
Step 1. Using test lead, connect the Force of the HVSMU1 to the terminal 2 of the
N1259A Opt.022 (100 kΩ).
Step 2. Using test lead, connect the Force of the GNDU1 to the terminal 1 of the
N1259A Opt.022 (100 kΩ)..
Close the N1259A fixture cover.
98
Page 99

High
HCSMU1
Force
Sense
Force
HPSMU1
Sense
HVSMU1
Force
AUX1
Signal
Low
High
Low
1
Force
Sense
Low
2
1 kΩ
High
Module Selector Output
Guard
HCSMU2 HPSMU2
Force
Sense
Force
Guard
Agilent N1259A opt 010
Force
Guard
Force
Sense
Guard
1
Sense
Sense
1 2 3
Guard
GNDU1111
Force
Sense
Force
Sense
Force
Sense
Signal
2
2
3
AUX2
1
Agilent N1259A opt 022Agilent N1259A opt 033
1
DC Bias Input
Guard
MF CMU
High Voltage Bias-Tee
2
100 kΩ
Force
High
Low
Figure 3-37. Connection for 100 kΩΩΩΩ resistor measurement.
99
Page 100

A. Measurement Procedure: 100 kohm CT Classic Test
Refer to figure 3-38 for the following Step 1 to Step 23.
Step 1. Click the Preset group of My Favorite Setup.
Step 2. Select Example_CT preset group.
Step 3. Select 100 kohm CT (100 kohm CT Classic Test).
Step 4. Press Recall button.
Step 5. Pre-defined example 100 kohm CT classic test setup – Channel Definition
page opens.
Channel Definition page setups the SMUs and its measurement function.
Step 6. Make sure the Unit field is properly set.
Step 7. Press Measurement Setup tab.
Step 8. Make sure the Start, Stop and Step value is properly set.
Step 9. Pressing "ADC/Integ" button opens "A/D Converter & Integration Time
Setup" sub-window.
Step 10. Integration time can be set. Make sure the integration time uses PLC mode
for rejecting noise and performs accurate resistance measurement.
Close this sub-window.
Step 11. Make sure the cables are properly set as shown in the "Device used in the
example" part or your selection.
Close the lid of N1259A test fixture.
Start the measurement. (Click the Single button )
Step 12. The graph window pops up, and the measurement starts.
Step 13. You can see I-Rhi current versus V_Rhi graph in figure 3-39.
The regression line is automatically drawn, and the resistor value extracted
from the regression line parameter is displayed on the Parameter field.
100
 Loading...