


Agilent N9340B
Handheld
Spectrum Analyzer
Technical Overview
Put the speed
and performance of
Agilent spectrum analysis
in the hands of your engineers
in the field

02
Handheld
Spectrum Analyzer
N9340B
Know your spectrum
Regardless of whether you are handling
military communications, a Wireless
Service Provider (WSP), or involved
with spectrum management you need
to avoid impaired communication.
The N9340B provides you with a reliable,
accurate and detailed picture of your
communication spectrum.
When you test, you need fast data
capture to help locate and identify
elusive, transient interference signals.
That’s why every N9340B spectrum
analyzer has a truly fast sweep time.
It requires less time to measure across
the spectrum, to obtain more reliable
test results and to help you achieve
more for the same investment of time
and money.
Gain confidence in your test
results
Frequency range: 100 kHz to 3 GHz
–124 dBm
–144 dBm with preamp
Amplitude accuracy: ±1.5 dB
RBW: 30 Hz to 1 MHz in 1-3-10 sequence
VBW: 3 Hz to 1 MHz
Optimize your test time versus
accuracy
SSB Phase noise: < – 87 dBc/Hz at 30 kHz offset
DANL: (RBW=30Hz, 10 MHz < fc 1.5 GHz)
Sweep time
10 ms to 1000 s, span
1 kHz
< 120 ms at full span
Spurious signals and noise are of great
concern to all network users. A superior
combination of low displayed average
noise level (DANL) and single sideband
(SSB) phase noise coupled with a
narrow resolution bandwidth (RBW)
means your signal measurements are
more reliable and you will have more
confidence in your test results. The
N9340B’s low DANL and SSB phase
noise helps you detect very low-level
signals (spurs or noise) which are close
to the carrier. You will avoid missing
these difficult-to-identify signals, which
would otherwise lead to an insufficient
or even incorrect understanding of the
spectrum.
The N9340B’s RBW is the narrowest in its
class. The narrow 30 Hz bandwidth of the
analyzer ensures that it is even easier
to identify, resolve, and measure two
signals that are close together.
Additionally, with a resolution filter
shape-factor of less than 5, the N9340B
has the ability to resolve closely spaced
signals with unequal amplitudes.
Moreover, the narrow RBW means that
the spectrum analyzer introduces minimal
noise itself, helping to further reduce
DANL and improve sensitivity.
N9340B Superior Performance Ensures the Field Test Confidence
Superior sensitivity: lowest DANL in-the-class
Fastest sweep time
Narrowest resolution available
Superior sensitivity
With more wireless devices on the market
requiring greater bandwidth usage, the
ability to discriminate between different
signals becomes more challenging. It’s
under such demanding conditions that the
superior performance of an N9340B
analyzer proves its worth. The N9340B
has one of the best sensitivity and
selectivity specifications. The DANL is
–124 dBm, or –144 dBm with the
optional preamplifier (30 Hz RBW, 10
MHz < fc < 1.5 GHz).
–
The optional
preamplifier adds 20 dB gain for
improved analyzer sensitivity.
Speed at your fingertips
The RF spectrum is a finite resource,
therefore its usage requires management.
Most regulatory authorities responsible
for administering frequency allocation
require service suppliers and network
operators to perform routine
monitoring of signal power and
transmission frequency stability..
03
Handheld
Spectrum Analyzer
N9340B
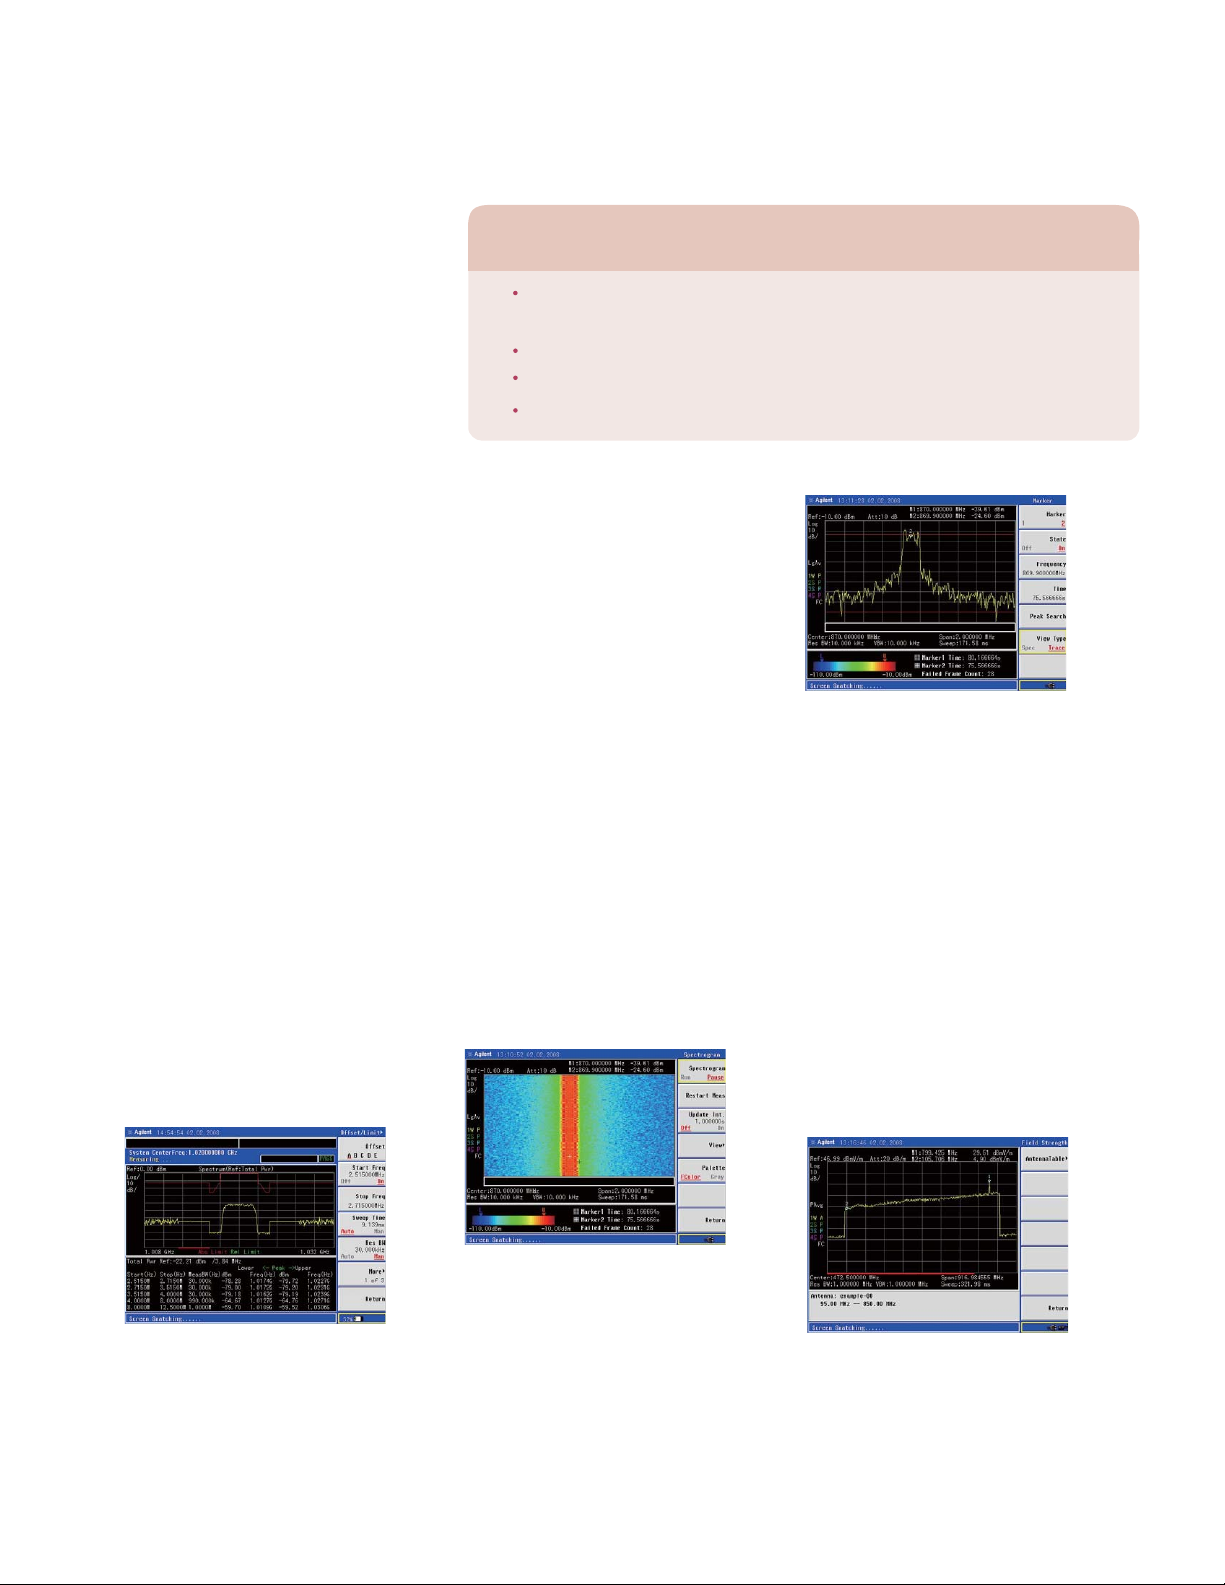
Spectrum emission mask
The new N9340B adds Spectrum Emission
Mask (SEM) as a standard feature. SEM is
a mask for out-of-channel emissions
measurement. The SEM is defined relative
to in-channel power.
The user can set the parameters of the main
channel, out-of-channel frequency bands,
and the limit lines. Included is Pass/Fail
testing for the overall spectrum emission
mask and each individual out-of-channel
frequency range. The N9340B will trigger
the failure indicator once any measurement
result violates the mask.
Also displayed are the main channel power
and the power level metrics relative to
in-channel power for each out-of-channel
frequency range. The user can save the
spectrum scan, the mask, the data or
screenshot for later analysis and reporting.
Spectrogram
Now you can take advantage of the
spectrogram display to view the behavior of
varying signal parameters over time. The
N9340B includes spectrogram as a standard
feature. The scrolling three-dimensional display
is noted for its ability to track the frequency and
power behavior over the time, particularly
intermittent signals. The user can use
spectrogram to analyze the stability of a signal
over the time, or to identify intermittent
interference signals in communications systems.
There are two markers for the user to identify
power versus frequency and time. Also the time
interval between two consecutive colored rows
can be adjusted. When a marker is put on the
spectrogram, the N9340B can display the trace
for the time of the selected marker.
The spectrogram data and screenshots can be
saved and recalled for later analysis or reporting.
N9340B is now equipped with powerful
features to address field applications
using a handheld spectrum analyzer.
An important application of spectrum
analysis is identifying interfering signals.
These often arise from illegal transmissions,
and may cause impairment of services
for authorized users, often resulting in
financial loss. These interfering signals
could possibly restrict critical
communications of civil aviation and
emergency services, which could
jeopardize public safety.
New
N9340B Applications for Field Test
Aerospace & Defence: radio and radar test, interference analysis,
on-site repair
Wireless Service Providers: interference analysis, on-site repair
TV & Broadcasting: interference analysis, channel power check
Spectrum Management Authority: spectrum monitoring
New
The trace display gives the view of the spectrogram
for the time of the selected marker.
Field strength measurement
New
Electric field strength measurements are frequently
required for field testing of transmitter and antenna
coverage. Field strength measurements are now a
standard function in the N9340B. Calibrated field
strength measurements are easy to make once the
antenna factors are loaded into the analyzer via the
provided PC software based antenna template.
Either field strength (in dBµV/ m, dBmV/ m, or V/
m) or power flux density (in dBm/ m or W/ m )
2
2
can be displayed. With the amplitude offset function,
the user can correct gain or loss. And finally together
with the user-definable multi-limit line function, the
N9340B offers the user quick and convenient field
strength measurements and analysis.
The spectrum emission mask shows the main
channel power and the power level vectors
relative to in-channel power for each out-of-channel
frequency range.
The spectrogram gives the three-dimensional
display of power, frequency and time.
The field strength measurement automatically
takes into the account of the antenna factor.
The antenna table is definable by the standard
N9340B PC software.
Handheld
Spectrum Analyzer
N9340B
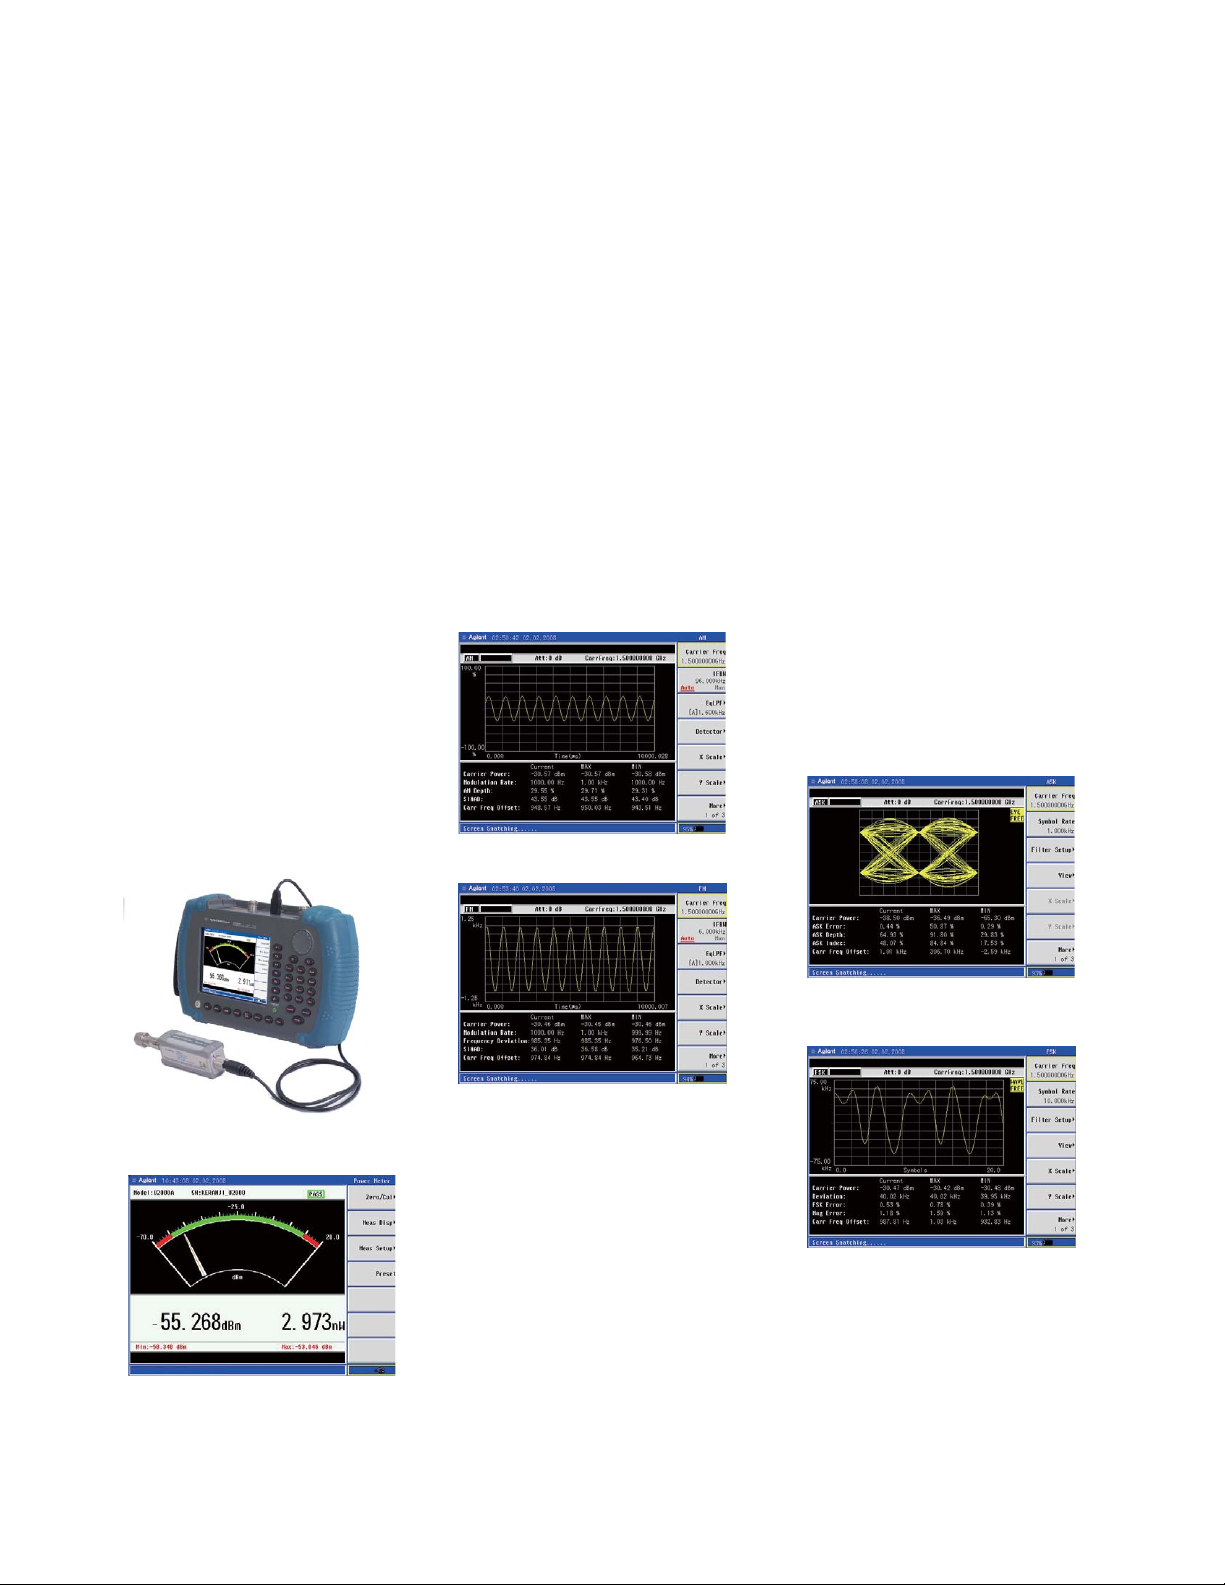
AM/FM modulation analysis
(Option AMA)
Optional AM/FM modulation analysis
shows the metrics you need, including
carrier power, modulation rate, AM
depth/FM deviation, SINAD and carrier
frequency offset. User definable limits
provide Pass/Fail indicators in 4 cases:
higher than carrier power, larger than
AM modulation index or FM deviation,
lower than AM modulation index or FM
deviation, or larger than carrier frequency
offset. The user can save the waveforms
with metrics for reporting as well as the
set-up parameters for future
measurements or analysis.
ASK/FSK modulation analysis
(Option DMA)
04
High accuracy power
measurement
The N9340B now supports high-accuracy,
USB plug-and-play power measurements
as standard when connected to an Agilent
U2000 series USB power sensor. Make
true average power measurements for all
signal types with wide dynamic range up
to 18 GHz with just the push of a button.
The Agilent U2000 USB sensors require
no external power supplies and with
internal zeroing eliminate the need for
external calibration. Without the need for
additional boxes, the user can easily set up,
calibrate and control the power meter/sensor
via the analyzer’s USB port. The N9340B
can collect, display and save the power
meter results.
The analyzer also provides Pass/Fail
testing with user set upper and lower
limits and a Pass/Fail indicator. Test
results are shown in dBm and W when
making absolute measurements and in
dB and percentage when measurements
are relative. Two display modes are
available: Meter or the Chart mode to log
power measurements over time.
New
The detailed metrics offer you the complete
understanding of the AM.
New
Optional ASK/FSK modulation analysis is now
available. Amplitude Shift Keying (ASK) is used
in RFID and optical systems. Frequency Shift
Keying (FSK) is used in many applications
including cordless phone, paging systems and
RFID.
N9340B w/option DMA supports 4 display
modes: Symbol, Waveform, ASK/FSK Error,
and Eye Diagram. Included is Pass/Fail testing
of higher than carrier power, higher than ASK
modulation depth/FSK frequency deviation,
lower than ASK modulation depth/FSK
frequency deviation and higher than FSK
frequency deviation. The metrics you need
are shown, including carrier power, ASK/FSK
error, ASK depth/FSK frequency deviation, and
ASK index etc. For reports and future
measurements the waveform with metrics and
setup parameters can be saved.
New
N9340B supports U2000 series USB power sensors
for high accuracy power measurement.
N9340B supports Meter and Chart mode to
display the results of power measurements.
The detailed metrics offer you the complete
understanding of the FM.
The Eye Diagram of ASK also shows the metrics
with detailed parameters.
The Waveform of FSK also shows the metrics
with detailed parameters.
 Loading...