


Agilent
E5061B Network Analyzer
5 Hz to 3 GHz
Data Sheet

Defi nitions
All specifications apply over a 23 °C ±5 °C range (unless otherwise stated) and
90 minutes after the instrument has been turned on.
Specifi cation (spec.):
Warranted performance. Specifications include guardbands to account for the
expected statistical performance distribution, measurement uncertainties, and
changes in performance due to environmental conditions.
Supplemental information is intended to provide information that is helpful for
using the instrument but that is not guaranteed by the product warranty.
Typical (typ.):
Describes performance that will be met by a minimum of 80% of all products. It
is not guaranteed by the product warranty.
Supplemental performance data (SPD):
Represents the value of a parameter that is most likely to occur; the expected
mean or average. It is not guaranteed by the product warranty.
General characteristics:
A general, descriptive term that does not imply a level of performance.
2

S-Parameter Measurement
Corrected system performance
The specifications in this section apply for measurements made with the Agilent
E5061B network analyzer with the following conditions:
• No averaging applied to data
• Environmental temperature of 23 °C ±5 °C, with less than 1 °C deviation from
the calibration temperature
• Response and isolation calibration not omitted
Table 1. System dynamic range
1,2
Description Specification SPD
System dynamic range
100 kHz to 1 MHz, IF bandwidth = 3 kHz 90 dB
1 MHz to 3 GHz, IF bandwidth = 3 kHz 95 dB
5 Hz to 100 Hz, IF bandwidth = 2 Hz 90 dB
100 Hz to 9 kHz, IF bandwidth = 10 Hz 100 dB
9 kHz to 100 kHz, IF bandwidth = 10 Hz 110 dB
100 kHz to 1 MHz, IF bandwidth = 10 Hz 115 dB
1 MHz to 3 GHz, IF bandwidth = 10 Hz 120 dB 130 dB
1. The test port dynamic range is calculated as the difference between the test port rms noise fl oor
and the source maximum output power. The effective dynamic range must take measurement
uncertainty and interfering signals into account.
2. The specifi cation might not be met at the frequencies 1.4 MHz, 4.0 MHz, 4.333 MHz, 6.333
MHz, 25MHz and 90 MHz.
3
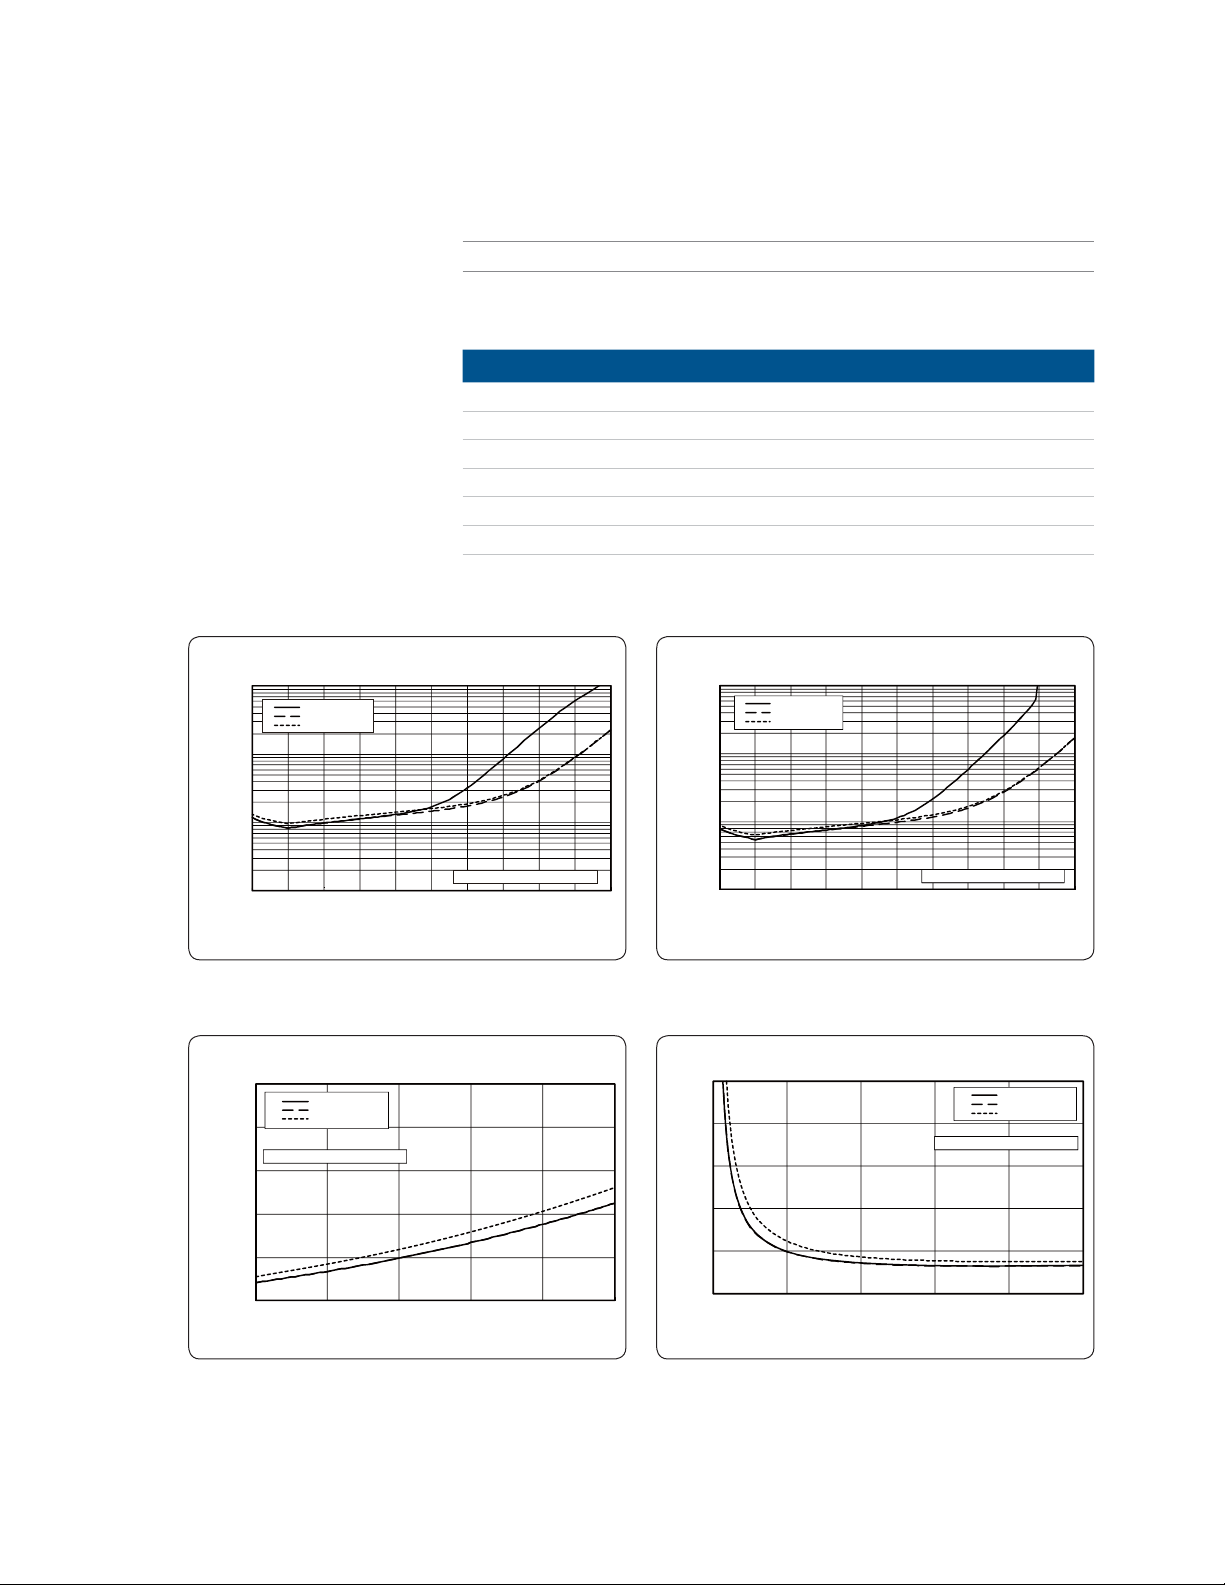
Table 2. Corrected system performance with Type-N 50 Ω connectors,
0.01
0.1
1
10
-90-80-70-60-50-40-30-20-10010
100 Hz to 100 kHz
100 kHz to 1 GHz
1 GHz to 3 GHz
S11 = S22 = 0 ; Source power = -10 dBm
Magnitude
Transmission C oefficient (dB)
Unc ertainty (d B)
0
0.01
0.02
0.03
0.04
0.05
0 0.2 0.4 0.6 0.8 1
100 Hz to 100 kHz
100 kHz to 1 GHz
1 GHz to 3 GHz
S21 = S12 = 0 ; Source power = -10 dBm
Reflection Coefficient (Linear)
Magnitude
Uncertainty (Linear)
0.1
1
10
100
100 Hz to 100 kHz
100 kHz to 1 GHz
1 GHz to 3 GHz
S11 = S22 = 0 ; Source power = -10 dBm
-90
-80-7 0-6 0-5 0-4 0-3 0-2 0-1 0010
Transmission Coefficient (dB)
Phase
Uncertainty (Degrees)
0
2
4
6
8
10
00.20.40.60.81
100 Hz to 100 kHz
100 kHz to 1 GHz
1 GHz to 3 GHz
S21 = S12 = 0 ; Source Power = -10 dBm
Reflection Coefficient (Linear)
Phase
Uncertainty (Degrees)
85032F calibration kit, full 2-port calibration
Network analyzer: E5061B, calibration kit: 85032F (Type-N, 50 Ω), calibration: full 2-port
IF bandwidth = 10 Hz, No averaging applied to data, environmental temperature
= 23 °C ±5 °C with < 1 °C deviation from calibration temperature, isolation calibration
not omitted
Description Specification (dB)
Directivity 49 49 46
Source match 41 41 40
Load match 49 49 46
Refl ection tracking 0.011 0.011 0.021
Transmission tracking 0.019 0.019 0.026
Figure 1. Transmission uncertainty (specifi cation)
100 Hz to 100 kHz 100 kHz to 1 GHz 1 GHz to 3 GHz
Figure 2. Refl ection uncertainty (specifi cation)
4
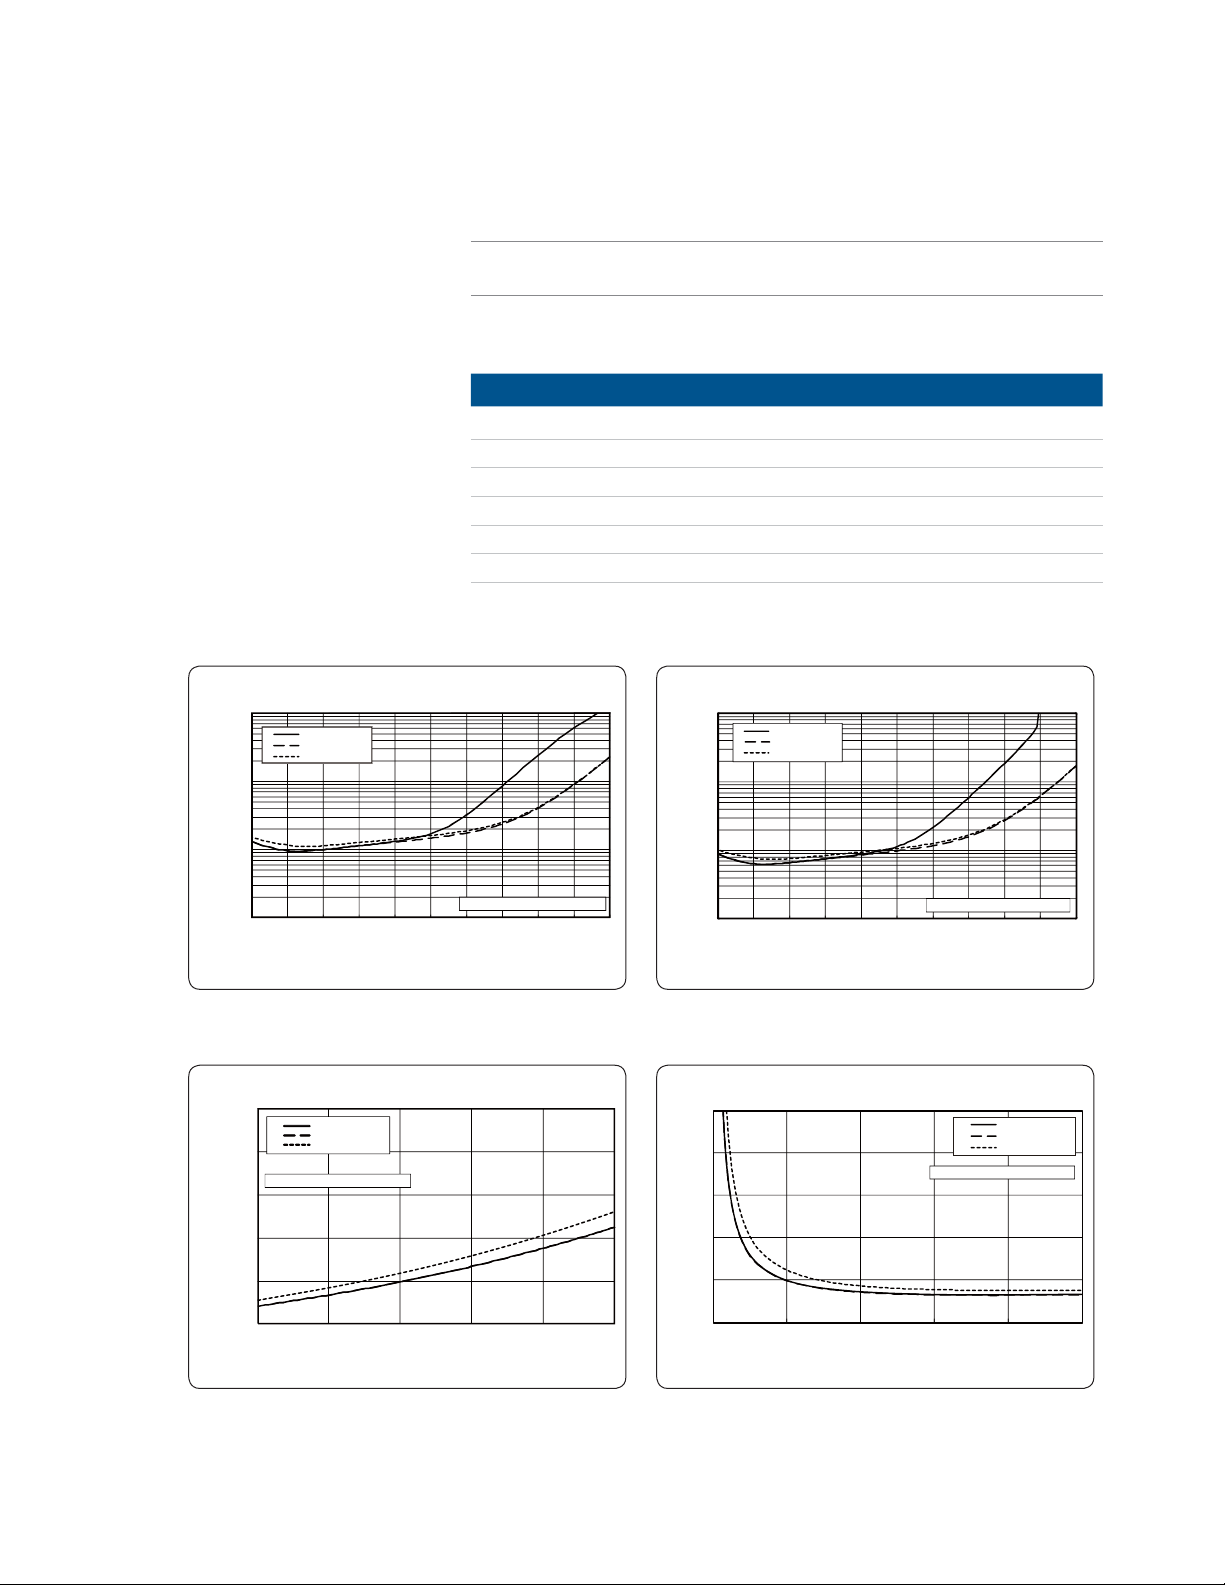
Table 3. Corrected system performance with Type-N 50 Ω connectors,
0.01
0.1
1
10
100 Hz to 100 kHz
100 kHz to 1GHz
1 GHz to 3 GHz
S11 = S22 = 0 ; Source power = -10 dBm
-90-8 0-70-60-5 0-40-3 0-20-1 0010
Transmission Coefficient (dB)
Magnitude
Uncertainty (dB)
0
0.01
0.02
0.03
0.04
0.05
0 0.2 0.4 0.6 0.8 1
100 Hz to 100 kHz
100 kHz to 1GHz
1 GHz to 3 GHz
S21 = S12 = 0 ; Source power = -10 dBm
Reflectio n C oefficient (Lin ear)
Magnitude
Uncertainty (Linear)
0.1
1
10
100
100 Hz to 100 kHz
100 kHz to 1GHz
1 GHz to 3 GHz
S11 = S22 = 0 ; Source power = -10 dBm
Transmission Coefficient (dB)
Phase
Uncertainty (Degrees)
-90-8 0-70-6 0-5 0-4 0-30-20-10010
0
2
4
6
8
10
0 0.2 0.4 0.6 0.8 1
100 Hz to 100 kHz
100 kHz to 1GHz
1 GHz to 3 GHz
S21 = S12 = 0 ; Source Power = -10 dBm
Reflection Coefficient (Linear)
Phase
Uncertainty (Degrees)
85032F calibration kit, enhanced response calibration
Network analyzer: E5061B, calibration kit: 85032F (Type-N, 50 Ω),
calibration: enhanced response
IF bandwidth = 10 Hz, No averaging applied to data, environmental temperature
= 23 °C ±5 °C with < 1 °C deviation from calibration temperature, isolation calibration
not omitted
Description Specification (dB)
Directivity 49 49 46
Source match 41 41 40
Load match 49 49 46
Refl ection tracking 0.011 0.011 0.021
Transmission tracking 0.019 0.019 0.033
Figure 3. Transmission uncertainty (specifi cation)
100 Hz to 100 kHz 100 kHz to 1 GHz 1 GHz to 3 GHz
Figure 4. Refl ection uncertainty (specifi cation)
5

Table 4. Corrected system performance with Type-N 50 Ω connectors,
Transmission Coefficient (dB)
Magnitude
Uncertainty (dB)
-90-80-70-60-50-40-30-20-10010
0.01
0.1
1
10
1 GHz to 3 GHz
100 kHz to 1 GHz
100 Hz to 100 kHz
S11 = S22 = 0; Source Power = -10 dBm
300 kHz to 10 MHz
10 MHz to 1 GHz
1 GHz to 3 GHz
0
0.01
0.02
0.03
0.04
0.05
S21 = S12 = 0; Source Power = -10 dBm
Reflection Coefficient (Linear)
Magnitude
Uncertainty (Linear)
0 0.2 0.4 0.6 0.8 1
300 kHz to 10 MHz
10 MHz to 1 GHz
1 GHz to 3 GHz
0.1
1
10
100
S11 = S22 = 0; Source Power = -10 dBm
Transmission Coefficient (dB)
Phase
Uncertainty (Degrees)
-90
-80-7 0-6 0-5 0-4 0-3 0-2 0-1 0010
300 kHz to 10 MHz
10 MHz to 1 GHz
1 GHz to 3 GHz
S21 = S12 = 0; Source Power = -10 dBm
0
2
4
6
8
10
0 0.2 0.4 0.6 0.8 1
Reflection Coefficient (Linear)
Phase
Uncertainty (Degrees)
85092C ECal Module, full 2-port calibration
Network analyzer: E5061B, calibration kit: 85092C (Type-N, 50 Ω), calibration: Full 2 port
IF bandwidth = 10 Hz, No averaging applied to data, environmental temperature = 23
°C ±5 °C with < 1 °C deviation from calibration temperature, isolation calibration not
omitted
Description Specification (dB)
Directivity 45 52 54
Source match 36 45 44
Load match 41 47 47
Refl ection tracking 0.100 0.040 0.040
Transmission tracking 0.056 0.039 0.040
Figure 5. Transmission uncertainty (specifi cation)
300 kHz to 10 MHz 10 MHz to 1 GHz 1 GHz to 3 GHz
Figure 6. Refl ection uncertainty (specifi cation)
6

Uncorrected system performance
Table 5.Uncorrected system performance (correction: off)
Description Specification Typical
Directivity 25 dB
Source match 25 dB
Load match 15 dB
(at 5 Hz to 2 GHz)
12 dB
(at 2 to 3 GHz)
Load match
(Source AC Couple
Mode)
Transmission tracking ±1.0 dB
(at 100 Hz to 3 GHz)
Refl ection tracking ±1.0 dB
(at 100 Hz to 3 GHz)
10 dB
(at 100 kHz to 300 kHz)
15 dB
(at 300 kHz to 2 GHz)
12 dB
(at 2 to 3 GHz)
±1.0 dB
(at 5 Hz to 100 Hz)
±1.0 dB
(at 5 Hz to 100 Hz)
7

Test port output (Source)
Table 6. Test port output frequency
Description Specification Typical
Range 5 Hz to 3 GHz
Resolution 1 mHz
Source stability ±5 ppm (5 to 40 °C)
CW accuracy ±5 ppm ±1 mHz
High stability option (Option 1E5)
CW accuracy ±1 ppm ±1 mHz
Stability ±0.05 ppm (5 to 40 °C)
±0.5 ppm per year
Table 7. Test port output power
Description Specification Typical
Level accuracy ±0.8 dB
(at 0 dBm, 50 MHz absolute)
±1.0 dB
(at 5 Hz to 1.5 GHz, 0 dBm, relative to 50 MHz)
±1.5 dB
(at 1.5 GHz to 3 GHz, 0 dBm, relative to 50 MHz)
Level linearity ±0.75 dB
(at –10 to 10 dBm, 0 dBm reference)
Range (standard) –45 dBm to 10 dBm
Sweep range –45 dBm to 10 dBm
Level resolution 0.05 dB
Table 8. Test port output signal purity
Description Specification Typical
Harmonics (2nd or 3rd) < –25 dBc (at 5 dBm)
Non-harmonic spurious < –25 dBc (at 5 dBm)
8

Test port input
Table 9. Test port input levels
Description Specification Typical
Maximum test port input level +10 dBm
Damage level +20 dBm, ±7 V DC
Absolute Amplitude Accuracy < ±3 dB
(at 0 dBm)
Crosstalk
Table 10. Test port input (trace noise)
1
Description Specification Typical
Trace noise magnitude
source power level = +10 dBm
-85 dB
(at 5 Hz to 100 Hz)
-100 dB
(at 100 Hz to 9 kHz)
-110 dB
(at 9 kHz to 100 kHz)
-115 dB
(at 100 kHz to 3 GHz)
5 mdB rms
100 Hz to 10 kHz
Automatic IF Bandwidth
5 mdB rms
5 Hz to 100 Hz
Automatic IF Bandwidth
5 mdB rms
10 kHz to 3 GHz
3 kHz Bandwidth
Trace noise phase
source power level = +10 dBm
0.03° rms
100 Hz to 10 kHz
Automatic IF Bandwidth
0.03° rms
10 kHz to 3 GHz
3 kHz Bandwidth
Table 11. Test port input (stability)
0.03° rms
5 Hz to 100 Hz
Automatic IF Bandwidth
Description Specification SPD
Stability magnitude
3 MHz to 3 GHz 0.01 dB/°C
Stability phase
3 MHz to 3 GHz 0.1°/°C
1. The specifi cation might not be met at the frequencies 25MHz and 90 MHz Line and Fan related
frequency.
9
 Loading...