

HEWLETT
PACKARD
OPERATING AND PROGRAMMING MANUAL
8566B
SPECTRUM ANALYZER
100 Hz - 2.5 GHz/2 - 22 GHz
SERIAL NUMBERS
This manual applies directly to Model 8566B RF
Sections with serial numbers prefixed 2410A and
Display Sections with serial numbers prefixed 2403A.
0
Copyright HEWLETT-PACKARD COMPANY 1984
1212 VALLEY HOUSE DRIVE, ROHNERT PARK, CALIFORNIA.94928. U.S.A.
IF-
MANUAL PART NO. 08566-90040
Microfiche Part No.
08566-90044
Printed: March 1984

CERTIFICATION
Hewlett-Packard Company certifies that
shipment
from
the factory. Hewlett-Packard further certifies that its calibration measurements are
traceable to the United States National Bureau
calibration facility, and to the calibration facilities
thb
product met its published specifications at the time
of
Standards, to the extent allowed by the Bureau’s
of
other International Standards Organization
of
members.
WARRANTY
This Hewlett-Packard instrument product is warranted against defects in material and workmanship
for a period of one year from date of shipment. During the warranty period, Hewlett-Packard
Company will, at its option, either repair or replace products which prove to be defective.
For warranty service or repair, this product must be returned to a service facility designated by HP
Buyer shah prepay shipping charges to HP and HP shall pay shipping charges to return the product
to Buyer. However, Buyer shall pay all shipping charges, duties, and taxes for products returned to
HP from another country.
HP warrants that its software and firmware designated by HP for use with an instrument will execute
its programming instructions when properly
installed
on that instrument. HP does not warrant that
the operation of the instrument, or software, or firmware will be uninterrupted or error free.
LIMITATION OF WARRANTY
The foregoing warranty shall not apply to defects resulting from improper or inadequate
maintenance by Buyer, Buyer-supplied software or interfacing, unauthorized modification or misuse,
operation outside of the environmental specifications for the product, or improper site preparation
or maintenance.
NO OTHER WARRANTY IS EXPRESSED OR IMPLIED. HP SPECIFICALLY DISCLAIMS
THE IMPLIED WARRANTIES OF MERCHANTABILITY AND FITNESS FOR A
PARTICULAR PURPOSE.
EXCL USI YE REMEDIES
THE REMEDIES PROVIDED HEREIN ARE BUYER’S SOLE AND EXCLUSIVE REMEDIES.
HP SHALL NOT BE LIABLE FOR ANY DIRECT, INDIRECT, SPECIAL, INCIDENTAL, OR
CONSEQUENTIAL DAMAGES, WHETHER BASED ON CONTRACT, TORT, OR ANY
OTHER LEGAL THEORY
ASSISTANCE
Product maintenance agreements and other customer assistance agreements are available for
Hewlett-Packard products.
For any assistance, contact your nearest Hewlett-Packard Sales and Service Office. Addresses are
provided at the back
of
this manual.

Section I
Manual Operation
Chapter 1 -GETTING STARTED
Chapter 2 - DATA
Chapter 3 - FUNCTION
Chapter 4 - CRT
Chapter 5 - TRACE
Chapter 6 - MARKER
Chapter 7 Chapter 8 - COUPLED FUNCTION
Chapter 9 Chapter 10 - INSTRUMENT STATE
Chapter 1 1 - SHIFT
Chapter 12 - USER
Chapter 13 - PLOTTER OUTPUT
SCALE
SWEEP
DISPLAY
AND
AND TRIGGER
KEY
DEFINED
REFERENCE LINE
FUNCTIONS
KEYS
GENERAL INFORMATION
GENERAL DESCRIPTION
GENERAL INFORMATION
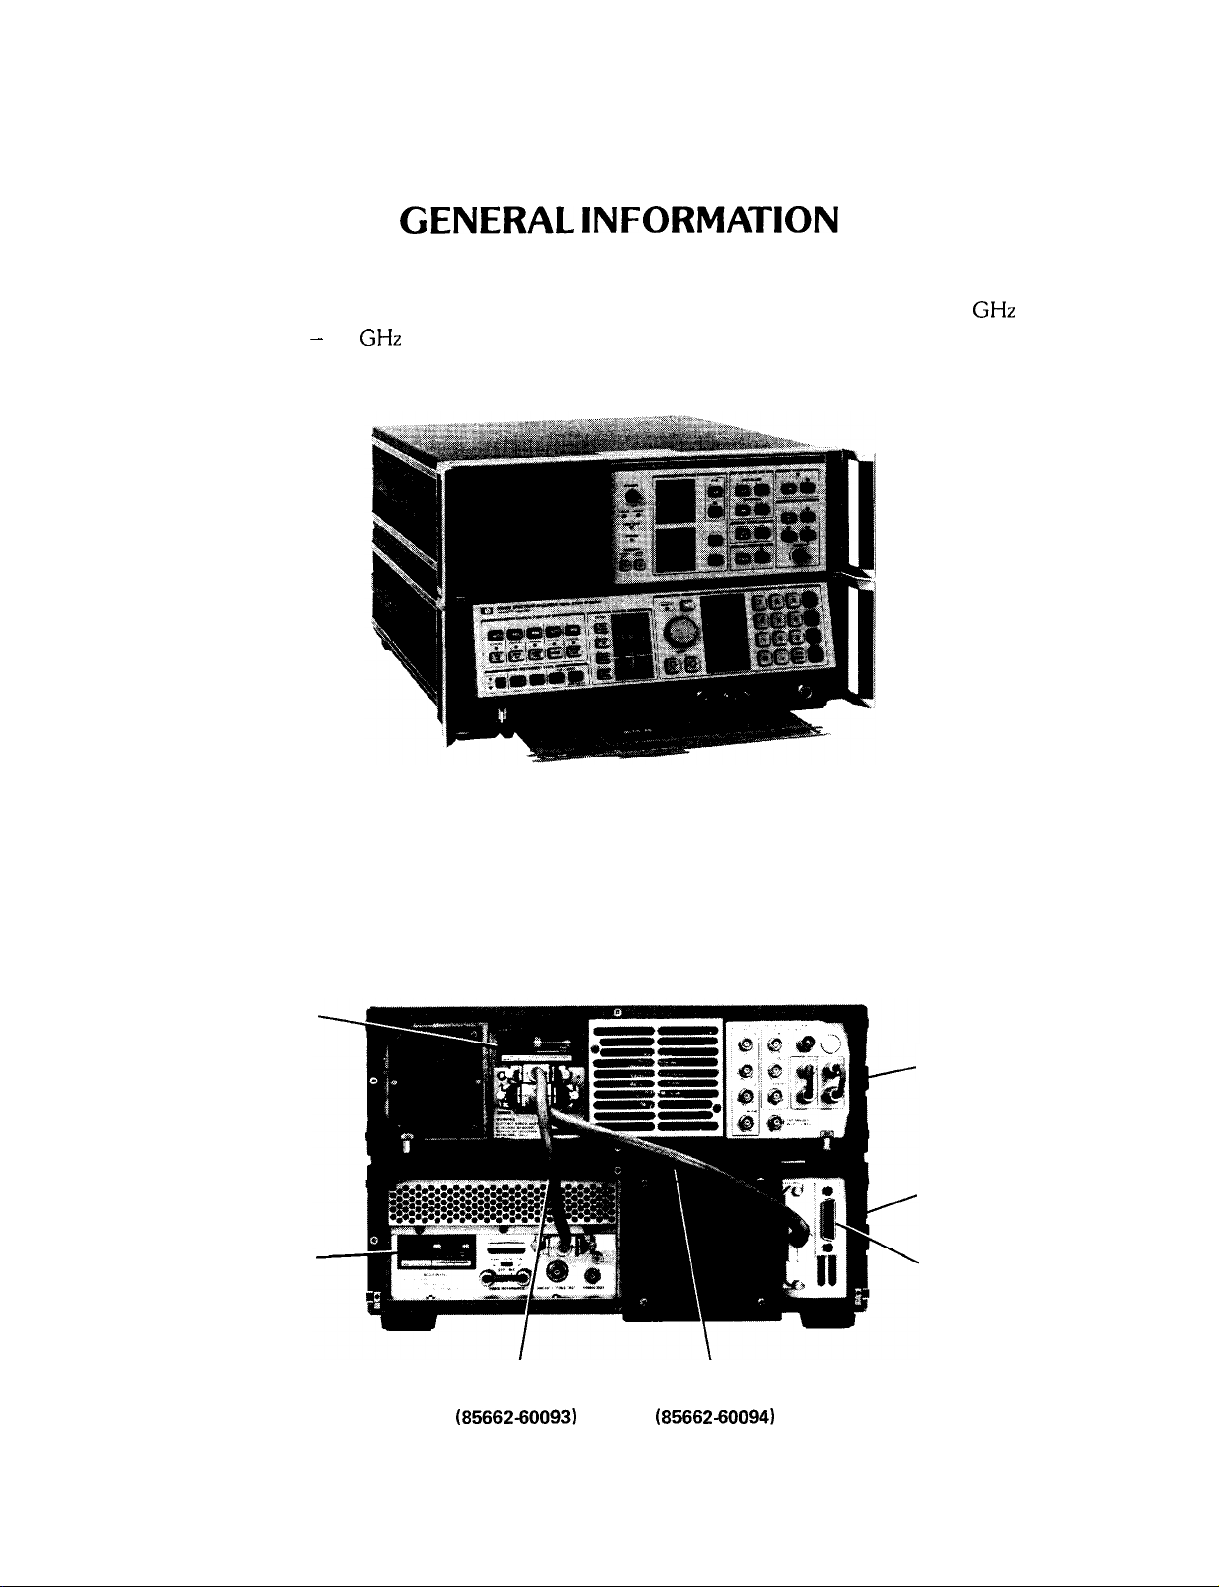
The HP 8566B is a high-performance spectrum analyzer which operates from 100 Hz to 2.5 GHz in the low
frequency band and 2 - 22
frequency tuning and an internal micro-computer to automate controls and provide useful operating features.
GHz
in the preselected microwave band. It uses a synthesized LO to provide accurate
HP 8566B SPECTRUM ANALYZER
The HP 8566B consists of an 85662A Display Section and an 85660B RF Section. Connect the two sections
along with the inter-connection cables as shown in the illustration below.
Connect interconnection cables as shown:
Line Module
85662A
Display Section
85660B
RF Section
Line Module.
Interconnect Cable Interconnect Cable
I
(85662-60093)
\
(85662-60094)
HP-IB
Connector
REAR PANEL CONNECTIONS
Manual Operation 1
INITIAL POWER ON
CAUTION
GENERAL INFORMATION
Before connecting the line power cords, make sure the appropriate line voltage and
line fuse have been selected for both the RF and Display sections of the analyzer. For
complete information on line voltage and fuse selection, refer to the HP 8566B Operator’s Handbook. For information on line power cords for a specific country, contact the
nearest Hewlett-Packard office.
INITIAL POWER ON
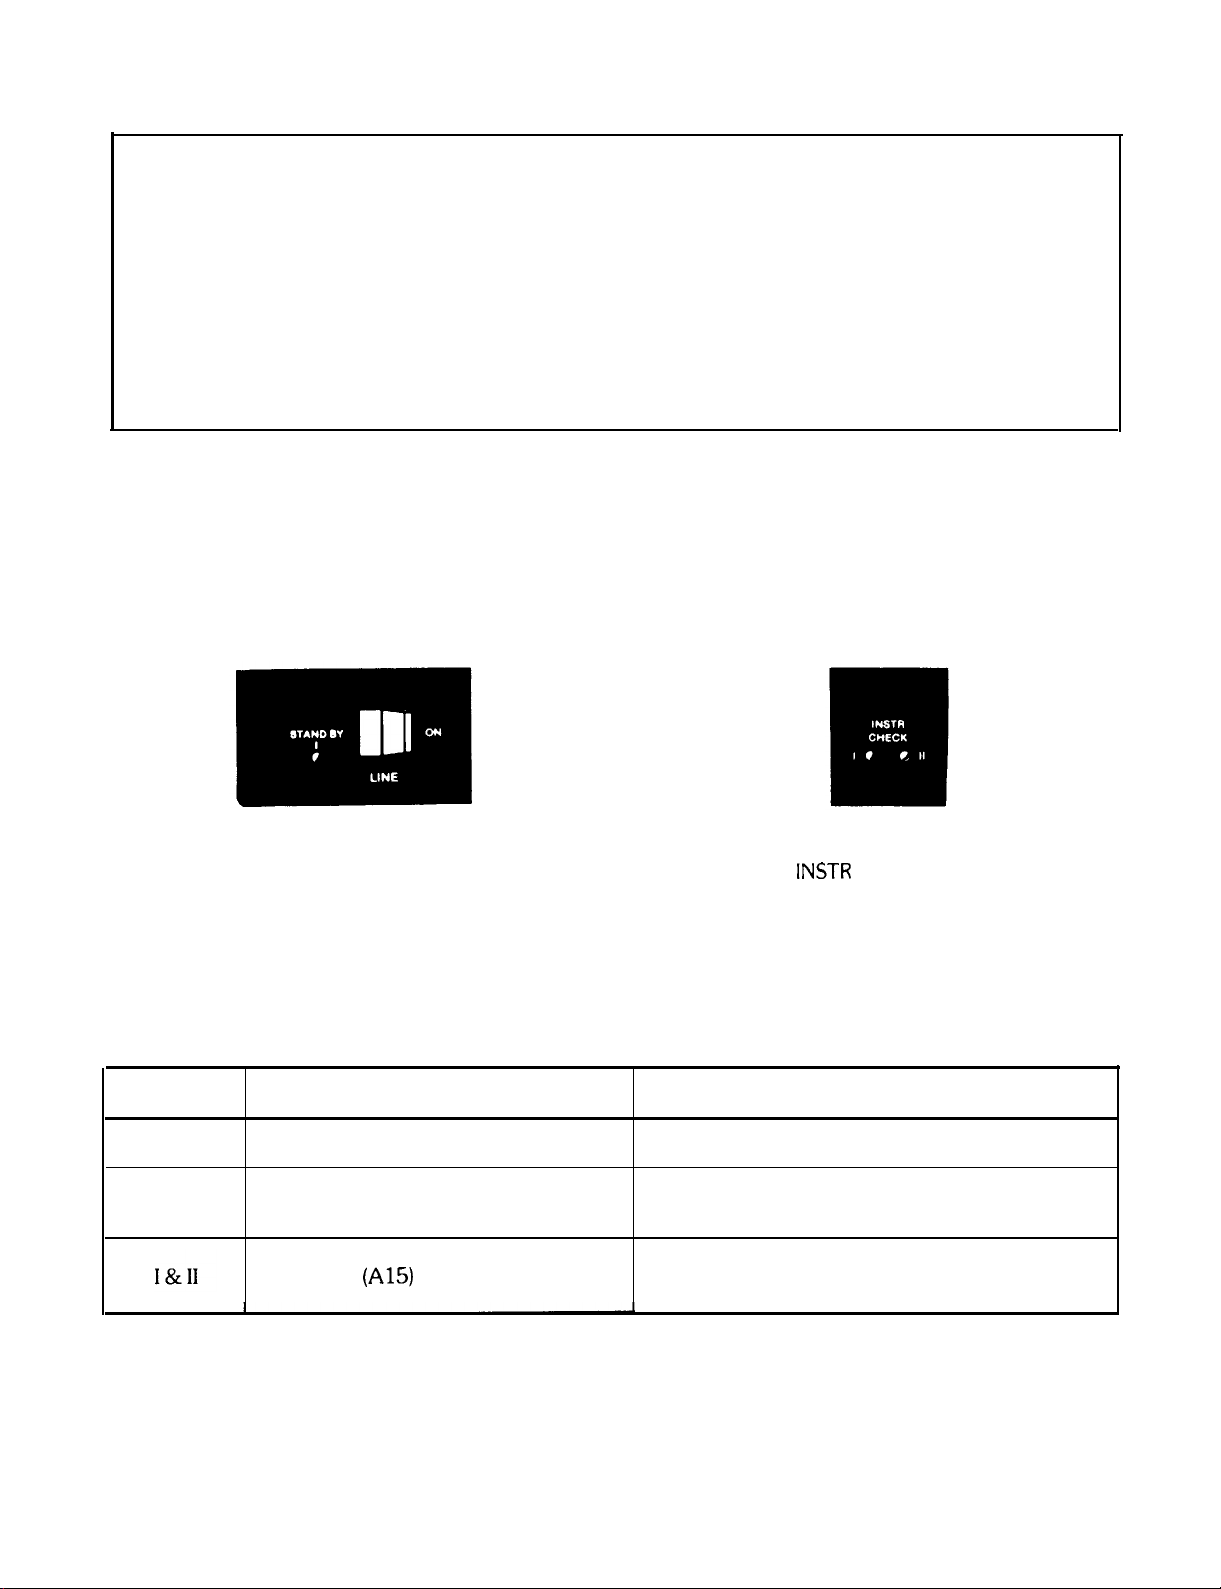
After making the AC power line connections, the STANDBY lights of both the RF and Display section should be
on. As long as the instrument is operating (LINE ON) or in STANDBY, the accuracy specifications of the internal
frequency standard will be met. After a cold start, such as on-receipt of instrument, the analyzer requires 24 hours
to stabilize prior to meeting specified performance.
INSTR
LINE ON AND STANDBY
CHECK LED
Upon LINE ON, the instrument will perform an automatic internal instrument check. If one or both of the red
instrument check lights (INST CHECK I and II) remain on after this brief check routine, refer to the chart below to
localize the problem.
LED On
I
II
Calibration
Problem
Digital Storage failure in 85662A
Interface Failure
Controller
(A15)
Check bus interconnect cable (85662-60094)
Check bus interconnect cable (85662-60094)
and check if Al2 board is connected tightly
Check if Al5 is connected tightly in 85660B
and that contacts are clean.
Solution
In order to meet specified frequency and amplitude accuracy, the analyzer’s calibration must be checked periodically to ensure the highest performance.
2 Manual Operation

GENERAL INFORMATION
RF INPUT
FREQZERO
0
c
Connect cable from CAL OUTPUT signal to RF input to perform initial calibration.
CAUTION
RF INPUT
Excessive signal input power will damage the input attenuator and the input mixer. The
spectrum analyzer total RF power must not exceed + 30 dBm (1 watt).
DC Precaution: The HP 8566B cannot accept DC voltages in 0 dB
dB or greater input attenuation, a maximum of
damage. A blocking capacitor is recommended at the input when DC is present with an
RF signal.
Manual Calibration Procedure
1.
After instrument has stabilized, press
2.
Press
@
8; this recalls the following stored control settings from the analyzer’s internal memory:
Center Frequency = 100 MHz
Frequency Span = 2 MHz
Reference Level = - 7 dBm
Res BW = 1 MHz
Scale = 1 dB/Div
Marker = Normal
3.
Adjust AMPTD CAL for a marker amplitude of - 10 dBm.
4. Press
[1Ic1LLl
9; this recalls the following:
Center Frequency = 100 MHz
Frequency Span = 0 Hz
Reference Level = - 7 dBm
Res BW = 30 Hz
Scale = 1 dB/Div
Sweep Time = 10 Sec.
m
ATTEN.
k7V
DC can be accepted without
*
With 10
l
If connection cable has significant loss, it must be accounted for separately.
Manual Operation 3
CRT DISPLAY
5.
Maximize amplitude response with FREQ ZERO adjustment.
Error Correction Routine
A 30 second internal error correction routine minimizes uncertainties due to control changes in the analyzer. To
start the routine, press
A “CORR’D” readout will appear on the left edge of the CRT upon completion of this routine. If the message
“Adjust AMPTD CAL” appears in the display, repeat the manual calibration before running the error correction
routine again.
(,,,,,
W
(%?I.
GENERAL INFORMATION
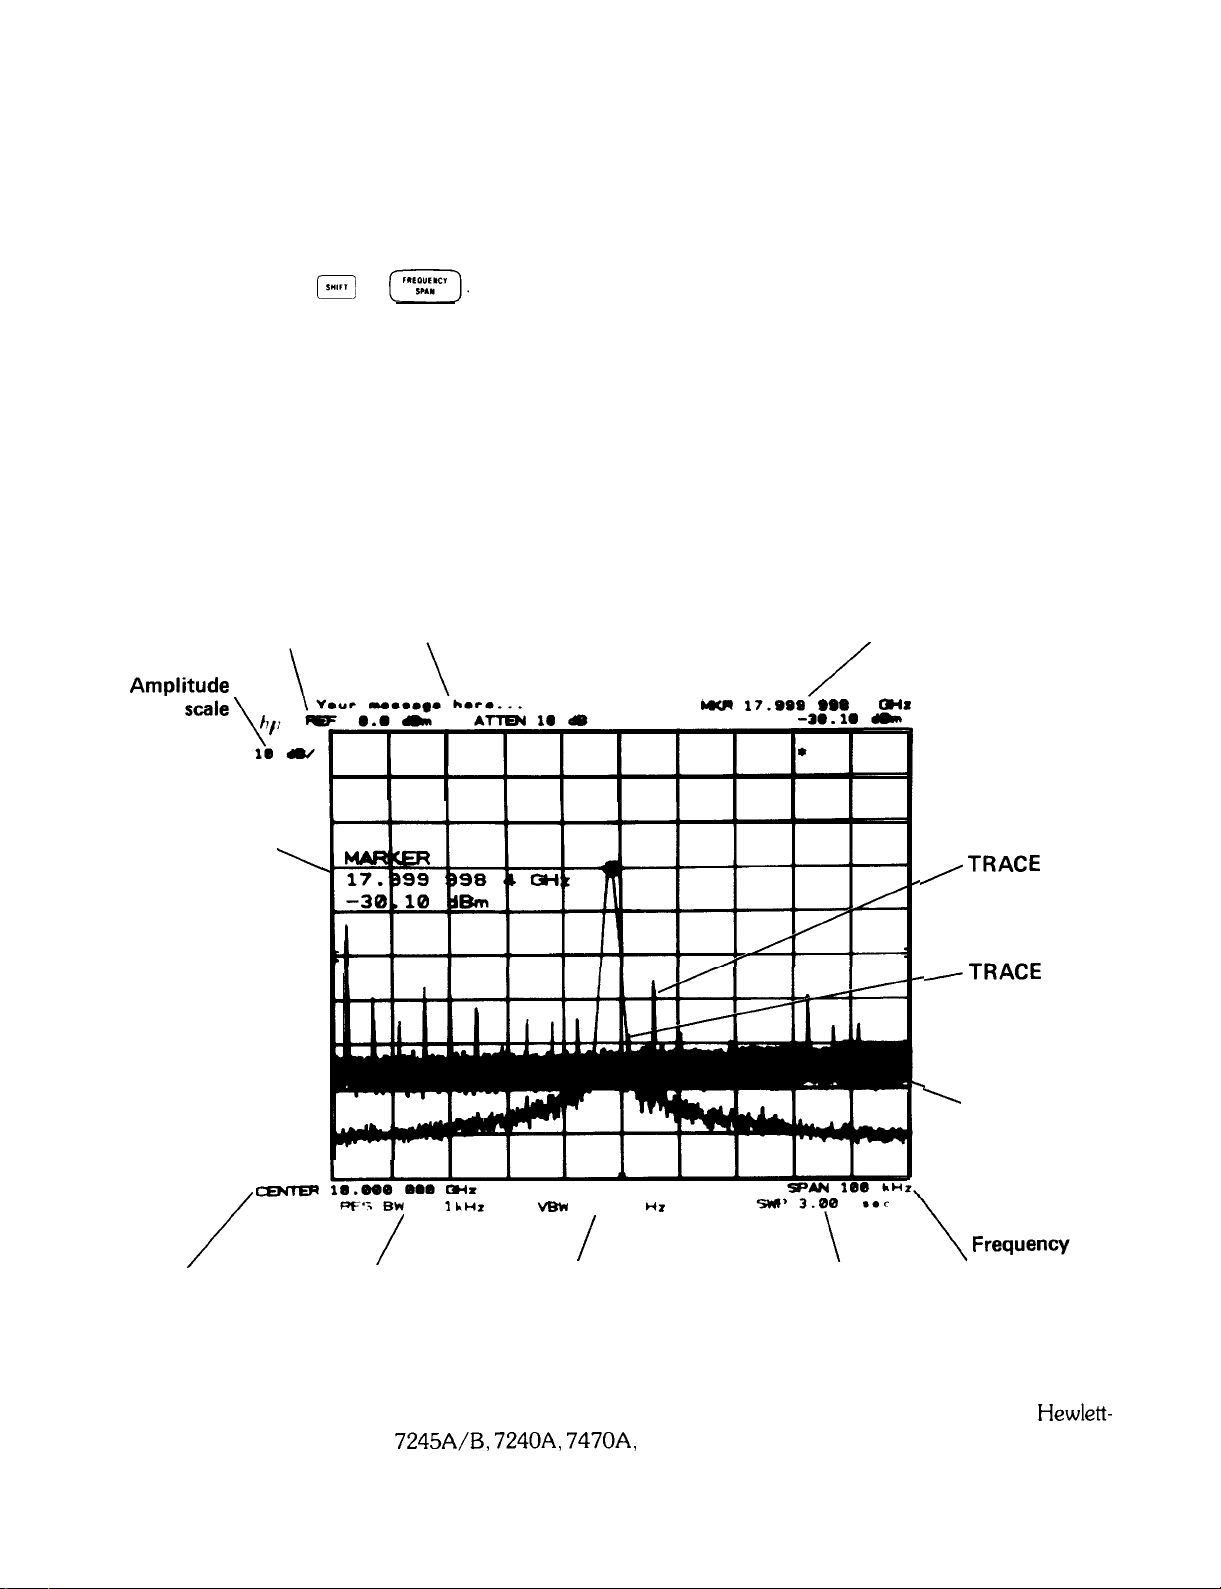
CRT DISPLAY
The analyzer’s CRT display presents the signal response trace and all pertinent measurement data. The active
function area names the function under DATA control and shows the function values as they are changed. All the
information necessary to scale and reference the graticule is provided.
MARKER
Reference User display
level
annotation amplitude
frequency
Active
function
readout
/
Center Resolution
frequency
’
-
11
PF’:
BW 1
L/
bandwidth
LHX
YBW
100
I
Video
bandwidth
bun
17.wa
ass
4
CIHX
,TRACE
/TRACE
Internally
’
generated
graticule
HZ
Sweep time
span
A
B
PLOTTER OUTPUT
The trace data, graticule, and annotation on the analyzer’s screen can be directly output via HP-IB to a
Packard plotter (such as the HP
front pane1 of the analyzer.
4 Manual Operation
7245A/B,
7240A, 7470A, or 9872C) by pressing the LOWER LEFT key on the
Hewlett-

GENERAL INFORMATION
FRONT PANEL OVERVIEW
FRONT PANEL
OVERVI
IEW
Control Groups
1
CRT DISPLAY:
2
TRACE:
3 REFERENCE LINE:
4 SCALE:
5 KEY FUNCTION:
6 SWEEP and TRIGGER:
7
RFINPUT:
8
DATA/FUNCTION:
9
CAL OUTPUT:
10
MARKER:
11
COUPLED FUNCTION:
12
INSTRUMENT STATE:
13 LINE ON &STANDBY:
14
REORDER/PLOTTER
FUNCTIONS:
Signal response and analyzer settings
Control of signal response display
Measurement and display aids
Selects logarithmic or linear amplitude scale
Access to special functions
Selects trace update trigger
100 Hz to 22 GHz ( + 30 dBm max. power)
Fundamental analyzer control
Calibration signal
Movable bright dot markers for direct frequency and amplitude readout
Maintenance of absolute amplitude and frequency calibration by automatically selecting certain analyzer control settings
Local
(1~1)
select key, SAVE and RECALL keys and FULL SPAN keys
Powers instrument and performs instrument check
Controls output to recorder or HP-IB controlled plotter
Manual Operation 5
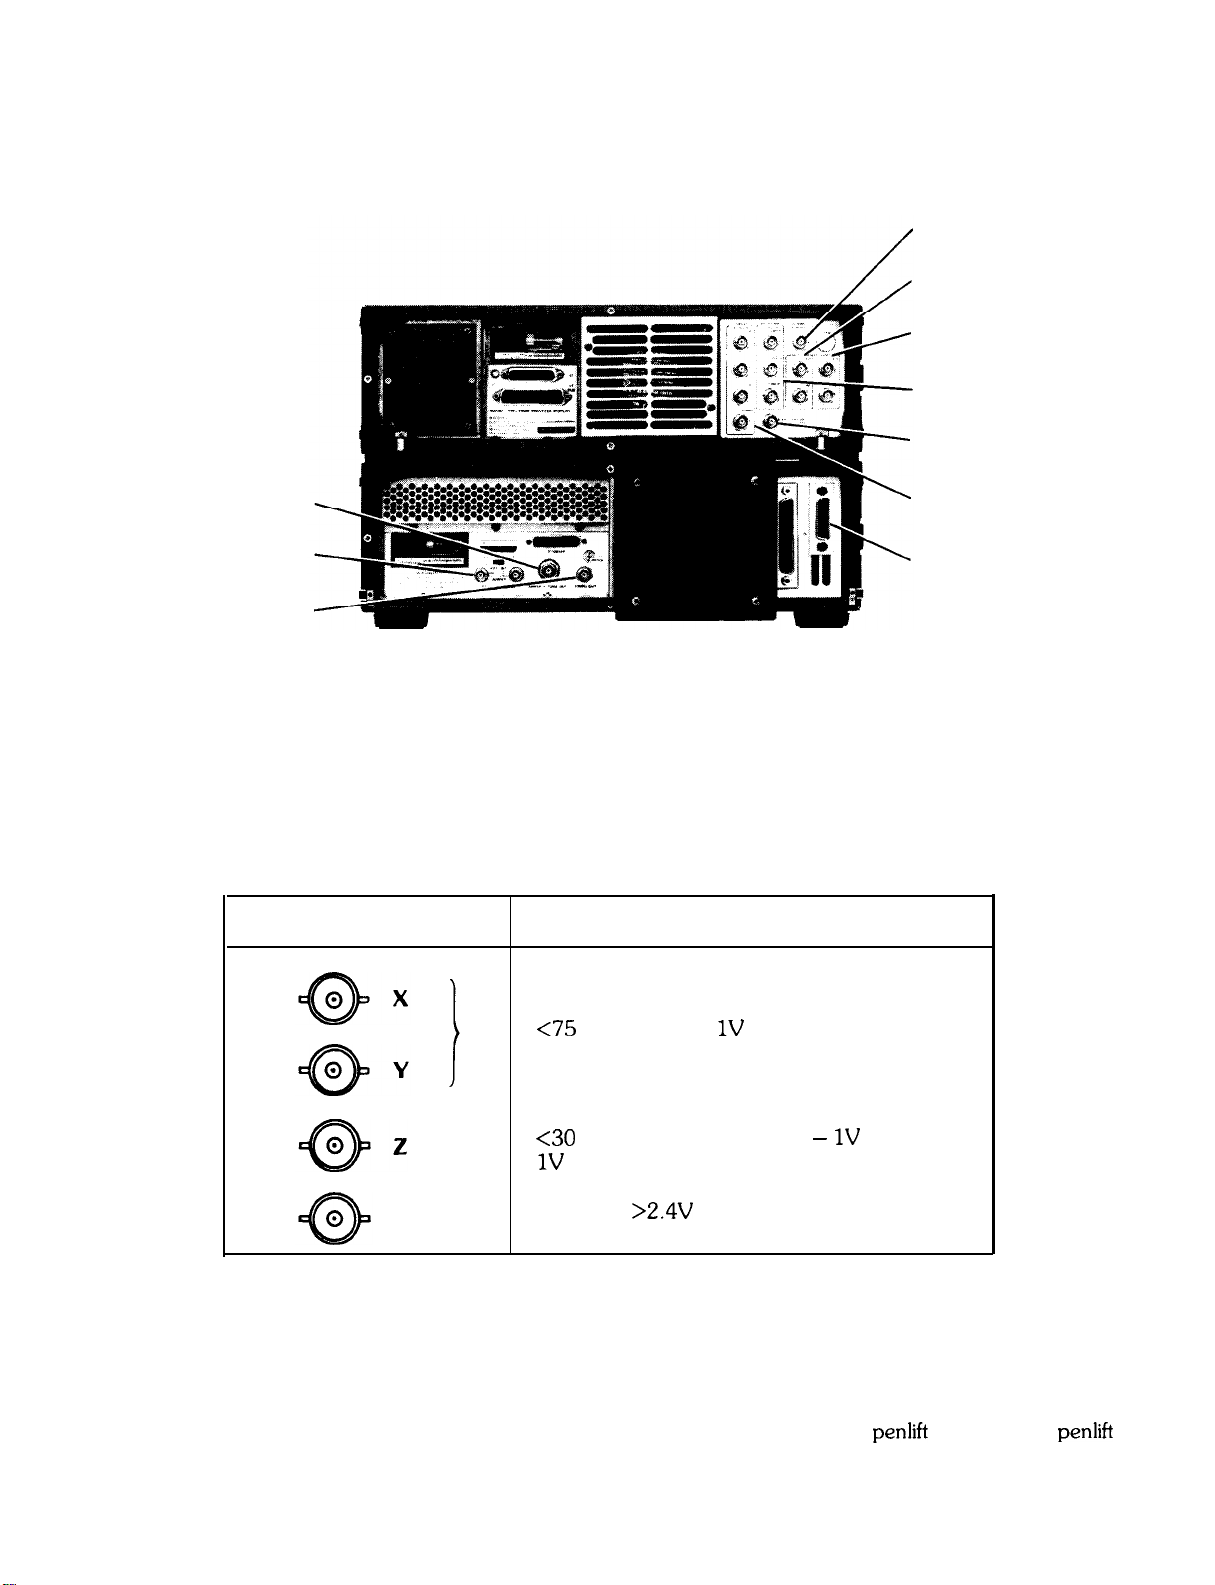
REAR PANEL OUTPUTS
REAR PANEL OUTPUTS
GENERAL INFORMATION
21.4 MHz IF Output
IF Input/Output
Video Input/Output
Recorder Outputs
External Trigger
Sweep and Tune Output
Frequency Reference
10 MHz Output
Display Outputs
HP-IB
Connector
Display Outputs
Display outputs allow all the CRT information to be displayed on an auxiliary CRT display such as the HP 1310A
Large Screen Display.
Display Outputs
<75
nsec rise times. 1V full deflection.
output
<30
nsec rise time. Intensity: - 1V blank, 0 to
1V
intensity modulation.
BLANK
TTL level
>2.4V
for blanking. Compatible with
most oscilloscopes.
Recorder Outputs
The recorder outputs allow the x-y plot of trace data with x-y plotters using positive
penlift
input. The front panel keys enable outputs for the calibration of x-y plotter reference points:
6 Manual Operation
coils or TTL
penlift
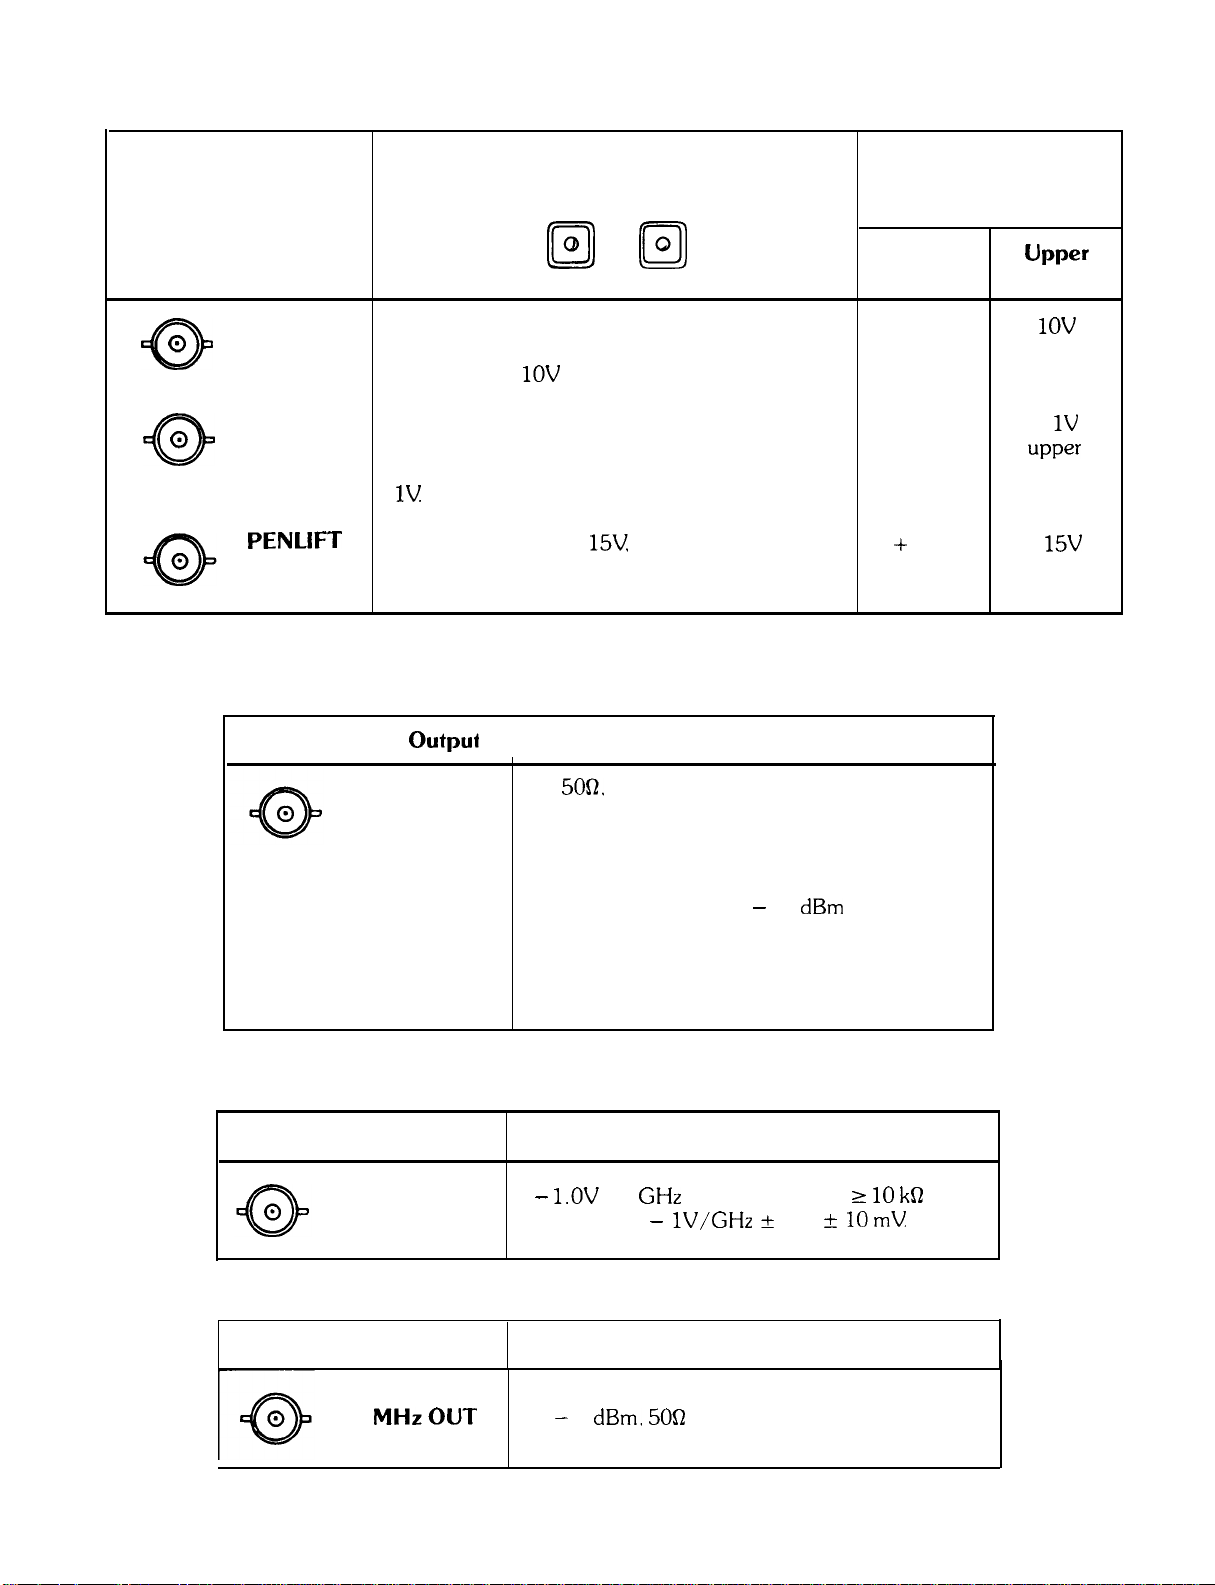
GENERAL INFORMATION
REAR PANEL OUTPUTS
Recorder
outputs
SWEEP
0
0
VIDEO
0
0
PENLIFT
21.4 MHz IF Output
RECORDER
LOWER UPPER
LEFT
@
RIGHT
a
A voltage proportional to the horizontal sweep of
the CRT trace that ranges from OV for the left
edge and to +
1OV
for the right edge.
Detected video output (before A-D conversion)
proportional to vertical deflection of the CRT
trace. Output increases 100 mV/div from 0 to
1V
A blanking output,
15V
occurs during CRT
retrace; otherwise output is low at OV (pen
down).
RECORDER Outputs
when keys or HP-IB
commands are enabled
Lower
Left
OV
left
ov
lower
+ 15v
Upper
Right
1ov
right
+
1v
upper
+
15v
Sweep Plus
Tune Output
Sweep Plus Tune Output
10 MHz Output
21.4 MHz IF
21.4 MHz
IF OUTPUT
SWEEP + TUNE
OUT
Output
output
A
5052,
21.4 MHz output related to the RF input
to the analyzer.
In log scales, the IF output is logarithmically
related to the RF input signal; in linear, the output is linearly related.
The output is nominally - 20 dBm for a signal at
the reference level.
The analyzer’s resolution bandwidth setting controls the bandwidth. The input attenuator and IF
step gain positions control the amplitude.
Output
l.OV per GHz of tune frequency,
-
Accuracy:
- lV/GHz
+ 2% -t
110 kQ
10mV
load.
10 MHz Output
10
MHzOUT
> - 5 dBm.
output
50R
output impedance
Manual Operation 7
REAR PANEL OUTPUTS
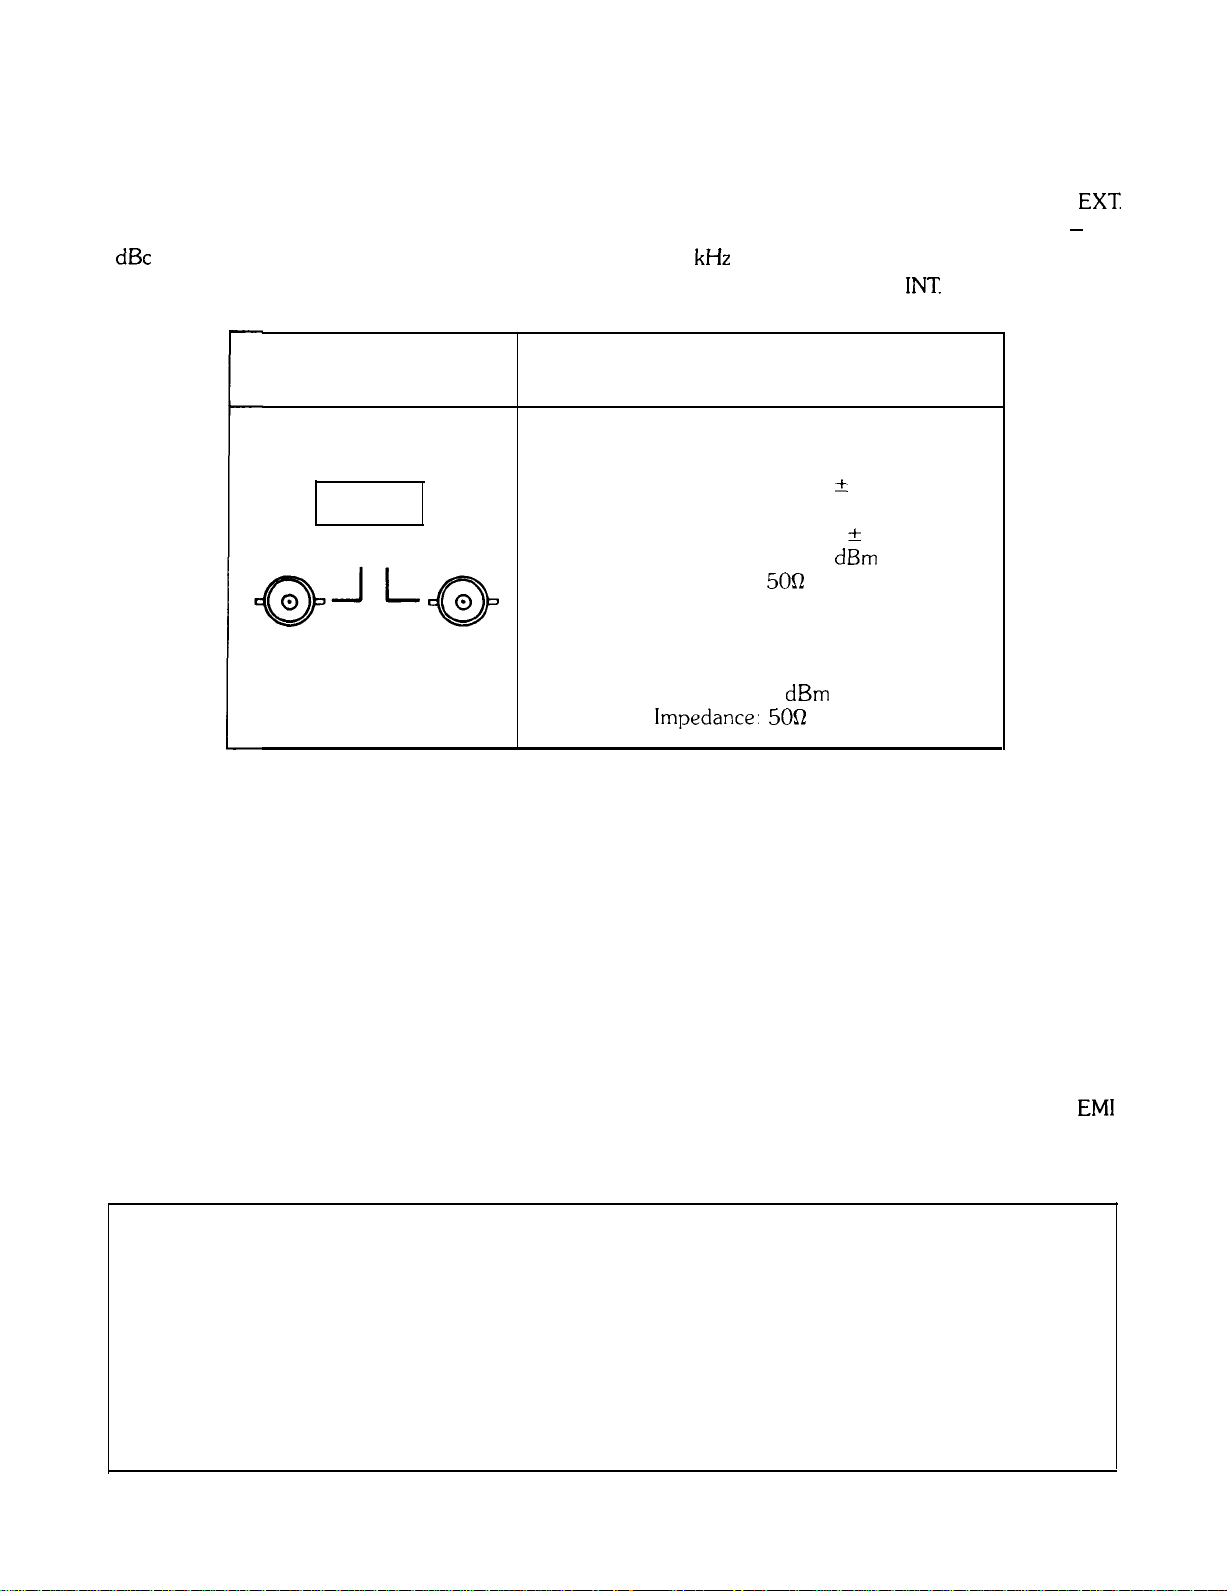
Frequency Reference Input/Output
GENERAL INFORMATION
To lock the spectrum analyzer to an external frequency reference, set the FREQ REFERENCE switch to
EXT.
Analyzer performance will be degraded unless frequency reference phase noise and spurious signals are < - 140
dBc single sideband (1 Hz) referred to 10 MHz at a 100 Hz to 10
the spectrum analyzer internal frequency reference, set the FREQ REFERENCE switch to
Frequency Reference
Input/Output
kHz
offset. To lock another spectrum analyzer to
INT
Input/Output
External Frequency Reference Requirements:
Frequency: 5 MHz & 50 Hz
or
EXT INT
Power: 0 to 10 dBm
Input Impedance:
10 MHz ? 100 Hz
5Of2
nominal
Internal Frequency Reference Characteristics.
Frequency: 10 MHz
Power: 0 dBm
Output
impedance: 5OQ
HP-IB Input Output Connector
The Hewlett-Packard Interface Bus allows remote operation of the analyzer as well as input and output of measurement data. See Section II of this manual.
IF and Video Connectors
The IF and Video connectors allow the 85650A Quasi-Peak Adapter to be used with the analyzer for
EM1
measurements
NOTE
When the Quasi-Peak Adapter is disconnected from the analyzer, make sure the IF INP
connector connects to the IF OUT connector with one short BNC cable, and VIDEO
INP connector connects to the VIDEO OUT connector with the other short BNC cable.
Failure to connect the BNC cables will result in a loss of signal.
8 Manual Operation
GENERAL INFORMATION
REAR PANEL OUTPUTS
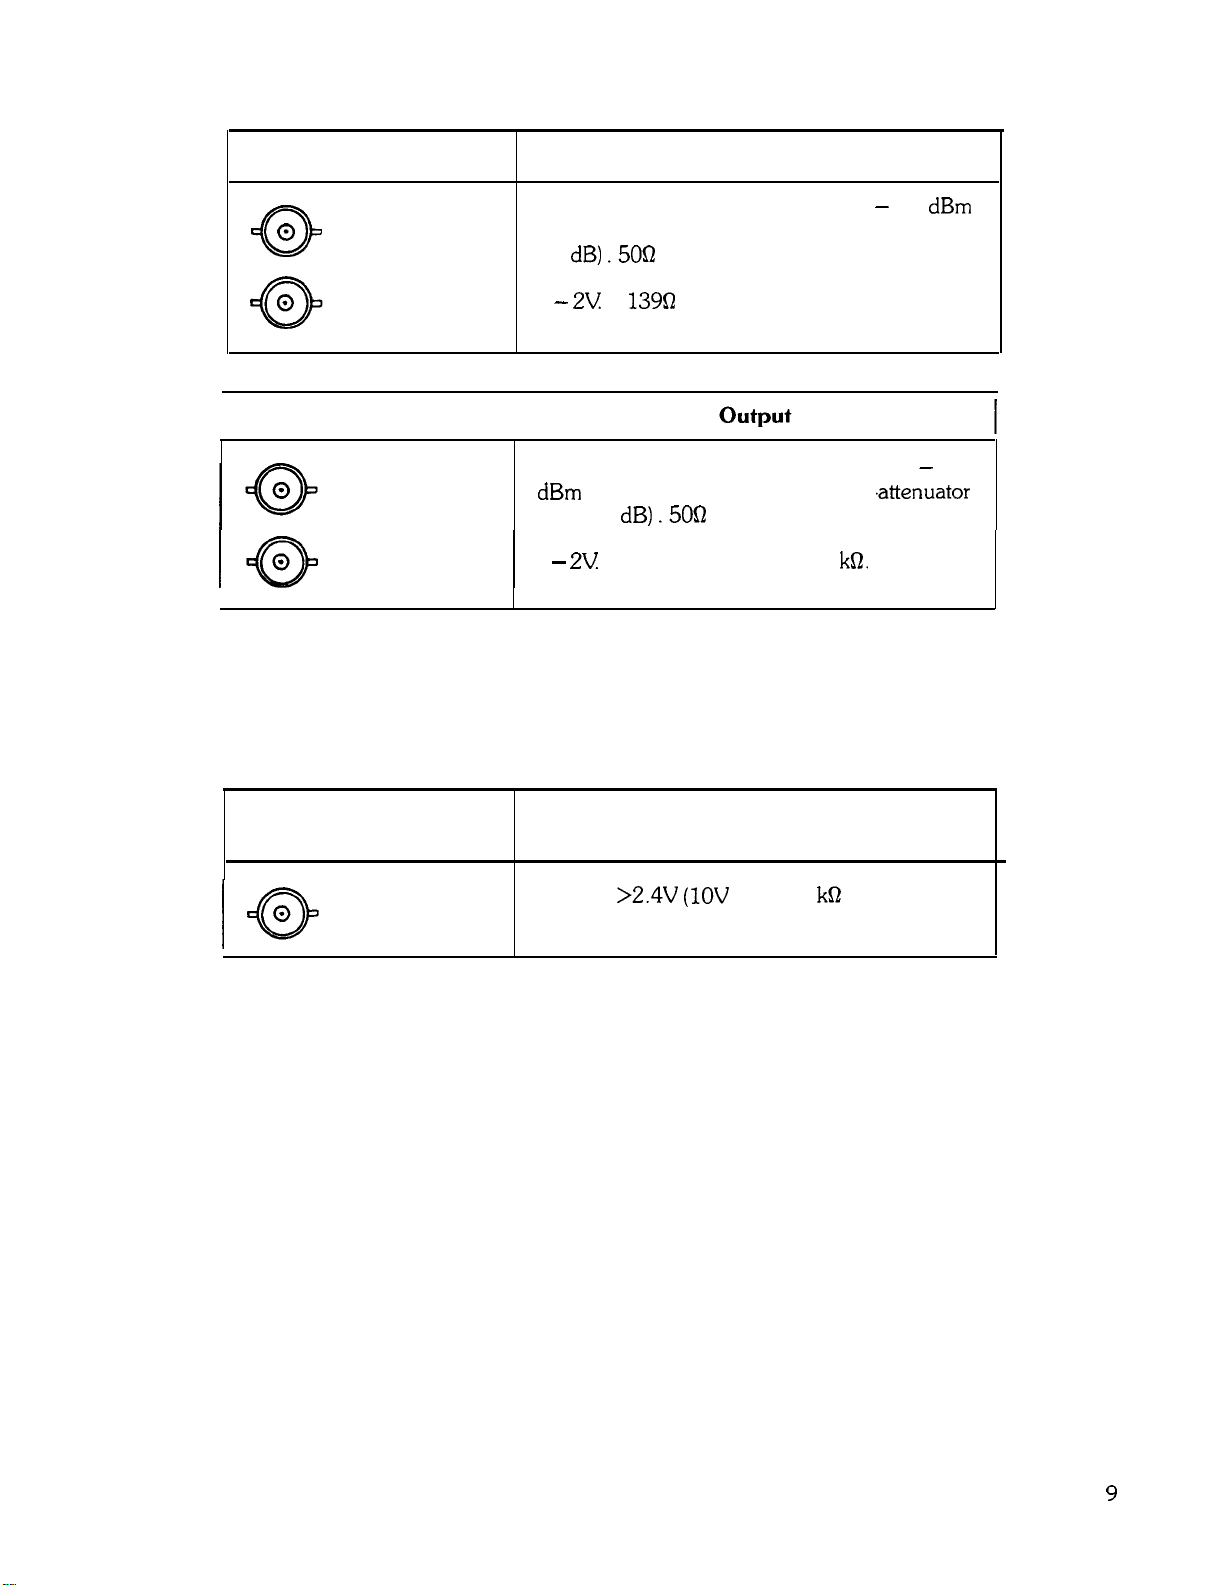
IF and Video Connectors
Input
21.4 MHz input. Input is nominally - 11 dBm
0
0
IF and Video Connectors
IF INP
VIDEO INP
(with spectrum analyzer input attenuator set to
10
dB) .5OQ
0 -
2V
input impedance.
139Q
input impedance.
21.4 MHz output. Output is nominally - 11
IF OUT
VIDEO OUT
dBm (with spectrum analyzer input .attenuator
set to 10
0 -
dB) .5OQ
output impedance.
2V Output impedance < 10
kQ.
External Sweep Trigger Input
The External Sweep Trigger input allows the analyzer’s internal sweep source to be triggered by an external
voltage.
External Sweep Trigger
Input
EXT TRIGGER
Must be
>2.4V (1OV
impedance.
Input
max) . 1 kQ nominal input
Manual Operation
9

GETTING STARTED
FRONT PANEL CONCEPT
Chapter 1
GETTING STARTED
GENERAL DESCRIPTION
This chapter is intended to provide you with a quick overview of the use and capability of the HP 8566B Spectrum
Analyzer. The chapters following provide the details on each aspect of operation.
FRONT PANEL CONCEPT
The basic controls on the HP 8566B front panel consist of FUNCTION keys and DATA control keys. Functions are
activated by pressing the appropriate key; its value is then changed via the DATA control knob, step keys or
numeric keyboard. The activated FUNCTION will appear on the CRT as well as its current value.
FUNCTION/DATA
Controls
ACTIVE FUNCTION
and DATA
VALUE
The front panel controls are grouped by function. The majority of measurements can be made with only the
FUNCTION/DATA group illustrated. The major FUNCTION controls are CENTER FREQUENCY FREQUENCY SPAN (or START/STOP FREQ),
and REFERENCE LEVEL. The value of the activated FUNCTION
can be changed continuously with the knob, incrementally with STEP KEYS or exactly with the numeric keyboard.
Knob
Step
Keys
Numeric
Keyboard
MAKING A MEASUREMENT
Two FULL SPAN keys allow you to select a wide
Manual Operation 1 1
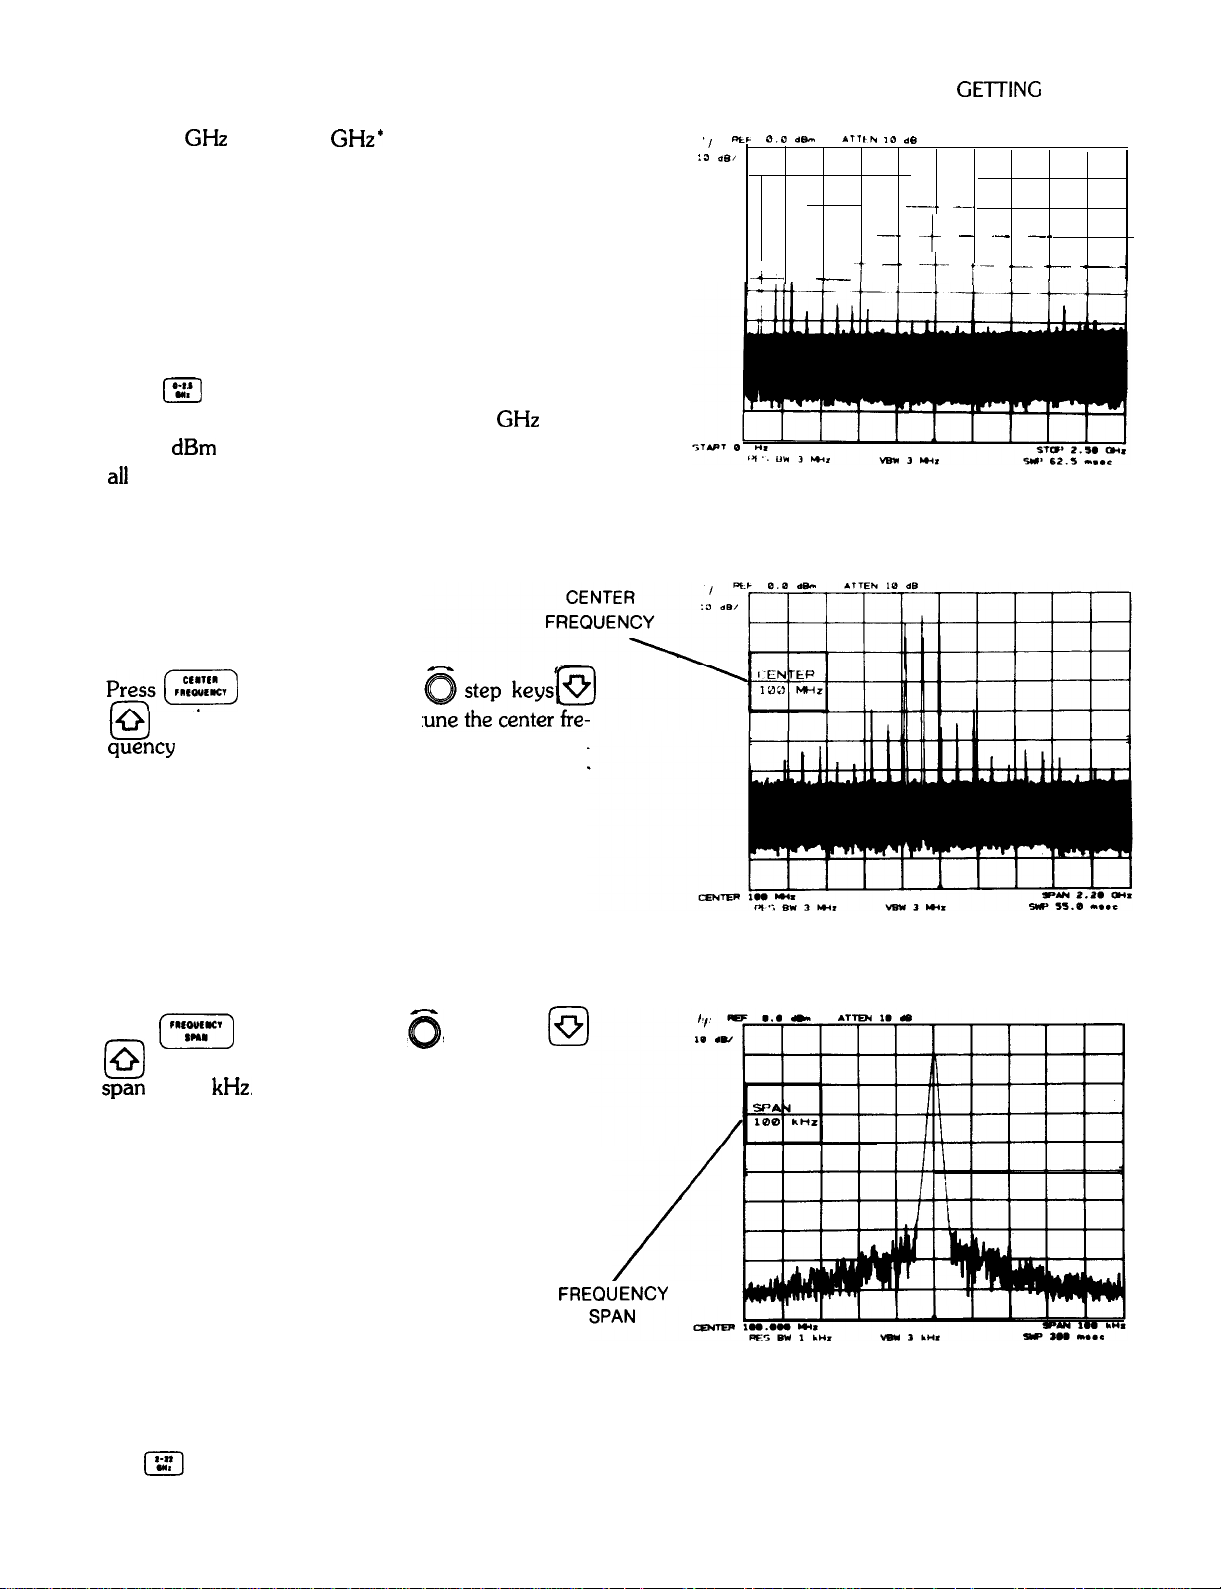
MAKING A MEASUREMENT
0- 2.5 GHz or 2 -22 GHz’ frequency span. Both
keys preset all the analyzer functions to automatically
maintain a calibrated display during the course of the
measurement.
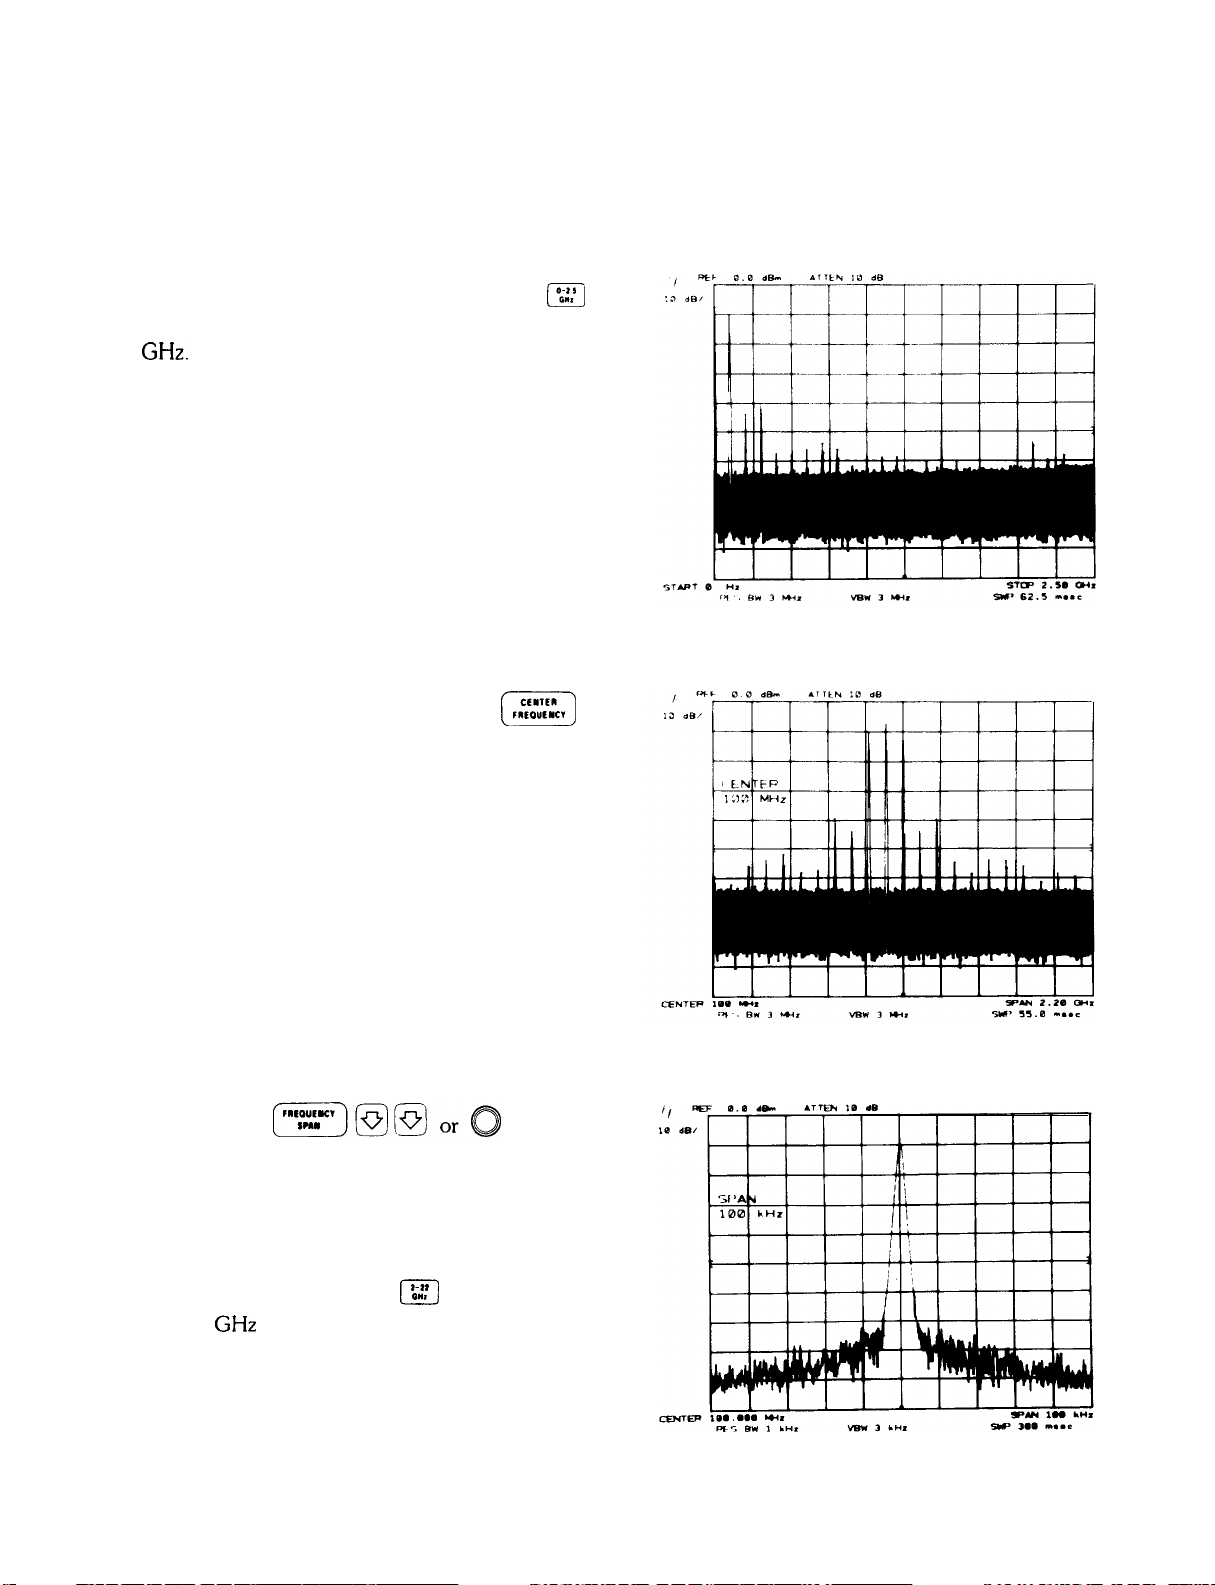
Example
Connect the CAL OUTPUT signal to RF INPUT
Press
l%J
This presets the analyzer to a full 0- 2.5 GHz span
with 0 dBm Reference level and automatically couples
al1
secondary receiver functions.
,,
e&c 0.0 d&n .Tllh
:3
&I
T
GE-l-l-ING
10
de
--_.
_
-.' t -- --' -.'
--
-.
t--
i-
STARTED
'--
--
---
and use the knob
or the numeric keyboard to t
quency
to 100 MHz. Note that the activated FUNCTION (CENTER FREQUENCY) appears on the CRT
graticule field.
Press
bl
$6
(91
or numeric keyboard to reduce the frequency
to 100
and use the knob
kHz.
, step keys
@
‘The
I’;:]
key is also activated with LINE ON.
12 Manual Operation
/
FREQUENCY
GETTING STARTED
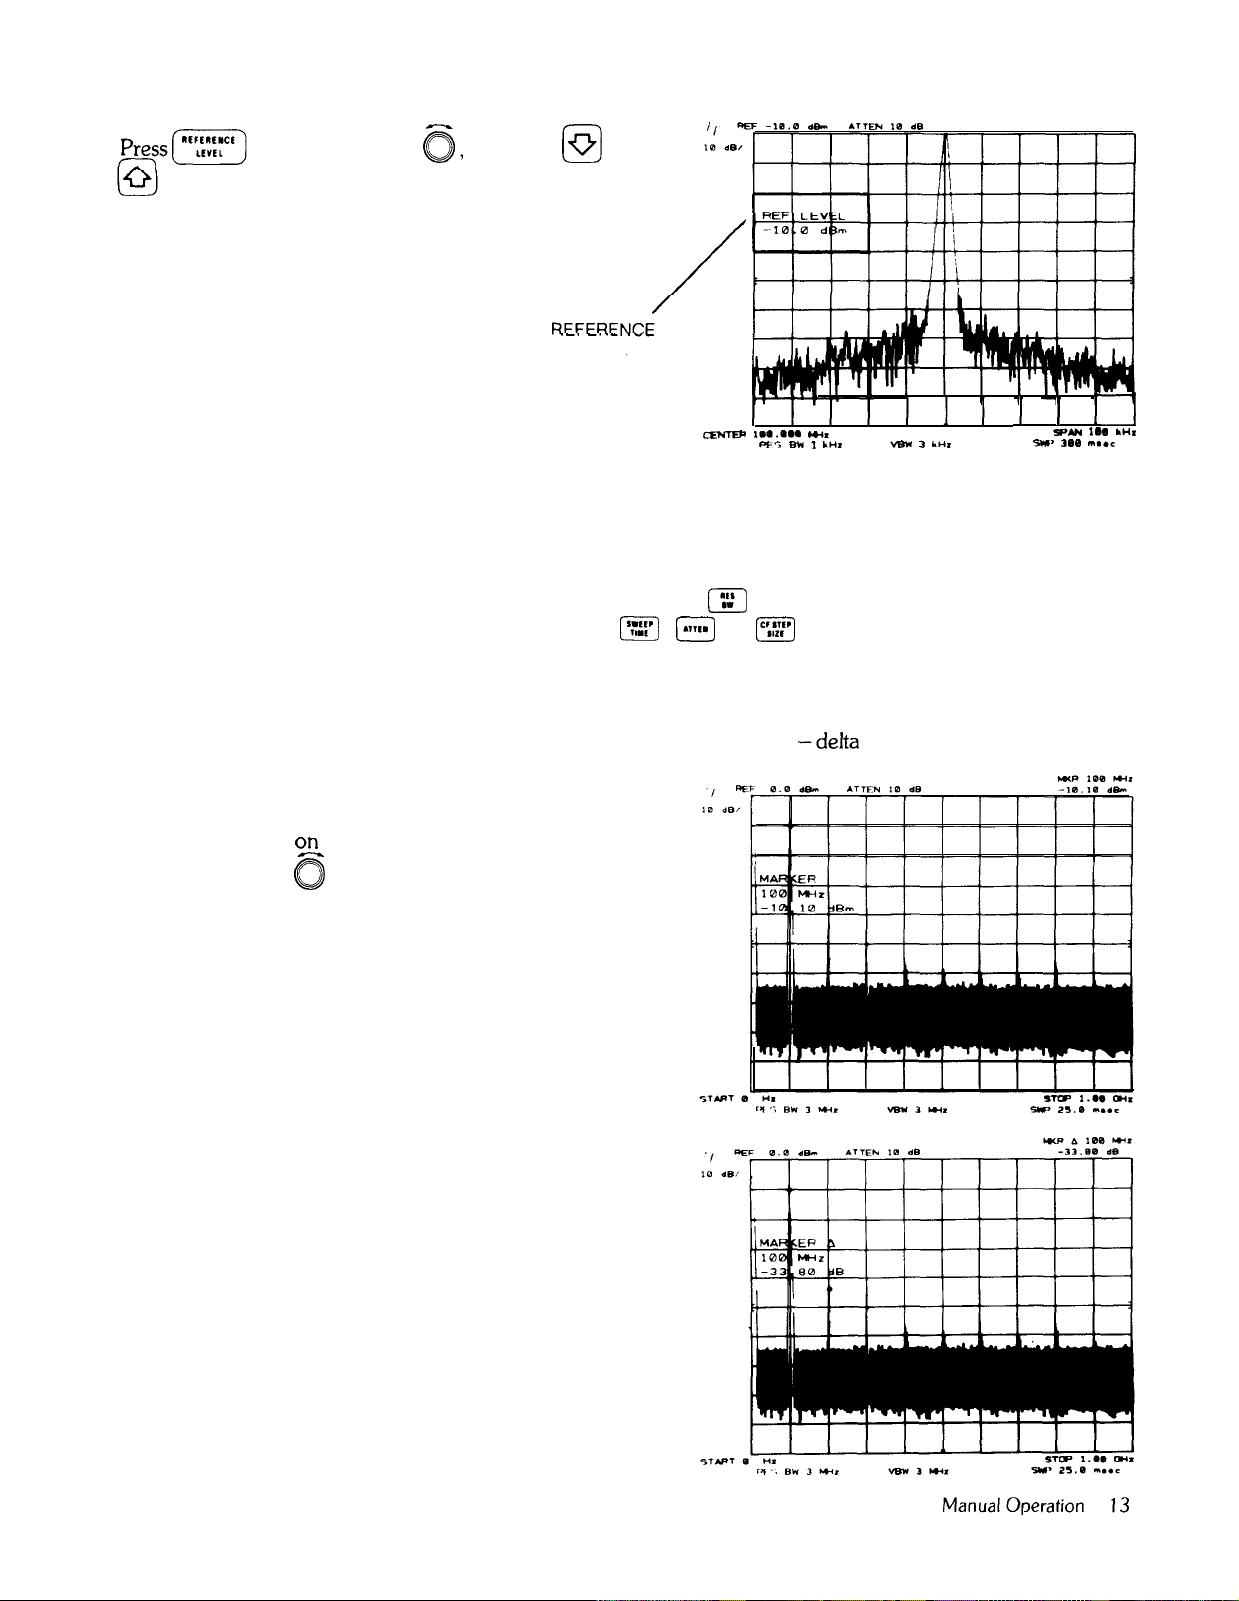
DIRECT FREQUENCY AND AMPLITUDE READOUT
and use the knob 0, step keys
or numeric keyboard to position the peak of the
signal on the top graticule line.
The frequency and amplitude of the signal are read out from the graticule border. All secondary analyzer functions
(resolution bandwidth, video bandwidth, sweep time, and attenuation) were automatically adjusted to maintain a
fully calibrated display. The coupled functions can also be uncoupled to allow manual operation.
For instance, to manually control the resolution bandwidth, press (::‘1 and change bandwidth with any combina-
tion of DATA control. The above also applies to I’:“:“) , @ ,
c)
0
.-. -.
LEVEL
.-
lzxrEu a...e.. m*
[,,,.)
, or
Pf5
ml 1
[‘::::‘1
I1 I I I
.“I
wn 3 L”,
SW’
I1
1..
5pbN
3ae
Il..=
DIRECT FREQUENCY AND AMPLITUDE READOUT
.“I
Markers can be used to quickly identify signal frequency and
measure signal separation or amplitude differences.
Activate a marker 02 the display with NORMAL.
Tune marker with 0 .
tude of the signal are read out with the marker.
To measure the harmonic(s) of the signal, press A and
tune the second marker to the signal’s harmonic. The
frequency separation and amplitude difference are
read out.
The frequency and ampli-
amplitudes
-delta
(A) markers are available to

SAVE/RECALL GETTING STARTED
SAVE/RECALL
The HP 8566B instrument control settings can be saved in an internal memory and later recalled to make a
measurement.
SHIFT KEYS
In addition to the front panel functions listed on the keys, another set of functions can be assigned to the same keys
by pressing the blue B key prior to activating a front panel key. These will be covered in more detail in Chapter
11.
[/
[I(c1111 m
to
0
6
provide access to the six internal storage registers.
AUTOMATIC MEASUREMENTS
The HP 8566B is fully programmable via the Hewlett-Packard Interface Bus (HP-IB) -HP’s implementation of
IEEE STD 488-1975. Internationally, HP-IB is in concert with the IEC main interface document.
A computing controller/calculator can be used with the HP 8566B to configure an automatic measurement
system. Just as the analyzer’s front panel is keyed manually to control functions and change values, simple
program codes are transmitted via the HP-IB with a controller to make measurements automatically These program codes are listed in the Remote Operation section of the instrument pull-cards.
Detailed information on remote operation is found in Section II of this manual.
14 Manual Operation

DATA
DATA CONTROLS
CHAPTER 2
DATA
GENERAL DESCRIPTION
DATA controls are used to change function values for functions such as center frequency, start frequency, resolu-
tion bandwidth, or marker position.
DATA CONTROLS
The DATA controls are clustered about the FUNCTION keys which “call up” or activate the most frequently used
spectrum analyzer control functions: center frequency, frequency span (or start/stop frequency), and reference
level. The other functions that accept DATA control are shown below:
FRONT PANEL FUNCTIONS USING DATA CONTROLS
To the left of the FUNCTION Keys are the Data knob 0 and the DATA STEP keys
to make incremental changes to the activated function. To the right of the FUNCTION keys is the DATA number/
units keyboard which allows changes to an exact value.
@ @
, which are used
Manual Operation 15
DATA ENTRY READOUT
The DATA controls will change the activated function in a manner prescribed by that function. For example, center
frequency can be changed continuously with the DATA knob 0 ,
with the DATA STEP keys @ a ,
width, which can be set only to discrete values, can still be changed with any of the DATA controls. The DATA
knob 0 and DATA STEP keys 13
from the number/units keyboard which may not coincide with an allowable bandwidth will select the nearest
bandwidth.
or set exactly with the DATA number/units keyboard. Resolution band-
61
increment the setting from one bandwidth to the next. An entry
or in steps proportional to the frequency span
DATA
DATA ENTRY READOUT
DATA entries are read from the CRT display as they are changed.
PREVENTING DATA ENTRY
A function can be deactivated by pressing m . The active function readout is blanked and the ENABLED light
goes out, indicating no DATA entry can be made. Pressing a function key re-enables the DATA controls.
DATA KNOB
The DATA knob 0 11a ows the continuous change of center frequency, frequency span (or start/stop frequencies), reference level, marker positions, display line, and threshold. It can also change the function values which
are only incremented.
Clockwise rotation of the DATA knob will increase the function value. For continuous changes, the knob’s sensitivity is determined by the measurement range and the speed at which the knob is turned. For example, when the
center frequency is activated,
one quarter turn.
increases the value of the center frequency one horizontal division of span per
0
DATA STEP KEYS
The DATA STEP keys allow rapid increase @ or decrease
dependent either upon the analyzer’s measurements range, on a preset amount,
fixed values, the next value in a sequence. Examples: Activate center frequency and
frequency value by an amount equal to one division of the frequency span (one tenth of the frequency span). If
the center frequency step size m has
amount. If frequency span were activated,
sequence. Activate resolution bandwidth
single step,
16 Manual Operation
hen
10)
and [&
preset,
would change the span to the next lower value in predetermined
~
will select the next widest bandwidth.
--I
2)
of the active function value. The step size is
r
or,
for those parameters with
will increase the center
6
0
will increase the center frequency by that preset
El
Each press results in a

DATA DATA NUMBER/UNITS KEYBOARD
DATA NUMBER/UNITS KEYBOARD
The DATA number/units keyboard (or DATA keyboard) allows exact value entries to center frequency, frequency
span (or start/stop frequency), reference level, log scale, marker positions, display line, threshold, and the COUPLED FUNCTIONS.
An activated parameter is changed by entering the number (with the CRT display providing a readout) then
selecting the appropriate units key. The value is not changed (entered) until the units key is pressed.
l
.
The number portion of the entry may include a decimal,
number. Corrections to number entries are made with
Example: With center frequency activated,
(TJ-Jp-JJQ[Z][Z]~@
0
0
:::,:
If not, the decimal is understood at the end of the
,
which erases the last digit for each press.
will set the center frequency to 1.250
If the units key were pressed without a number entry, 1 is entered (except in zero frequency span).
Negative DATA Entry
Negative entries from the number units keyboard can be made for power and frequency but not time and voltage.
Negative power entries can be made using -Z . The “ - dBm” key will enter - dBm, - dBmV or - dBpV For
example, in reference level, with the dBmV units, an entry of
Negative frequency entries can be made using
as a prefix to the frequency entry For example, to enter a negative start frequency, press
p-J(TJ(TJ@~
Not all functions will accept negative entries (the sign will be ignored).
This enters the frequency value as - 100 MHz.
GHz.
““I
0
will enter - 50 dBmV
m-m
z; (g-m
0
MULTIPLE DATA CHANGES
A function, once activated, may be changed as often as necessary without reactivating that function (see Chapter
3, FUNCTION). Any of the DATA controls can be used in any order. l
It is not always necessary to make a DATA entry. For example, start and stop frequency may be activated simply to
allow readout of the left and right display reference frequencies as start/stop frequencies.
l Exceptions are the SHIFT KEY FUNCTIONS which use only DATA number/units keyboard. See Chapter 11.
Manual Operation 17

FUNCTION GENERAL DESCRIPTION
CHAPTER 3
FUNCTION
GENERAL DESCRIPTION
This chapter describes the use of the major function block- CENTER FREQUENCY FREQUENCY SPAN (or
START/STOP FREQUENCY), and REFERENCE LEVEL.
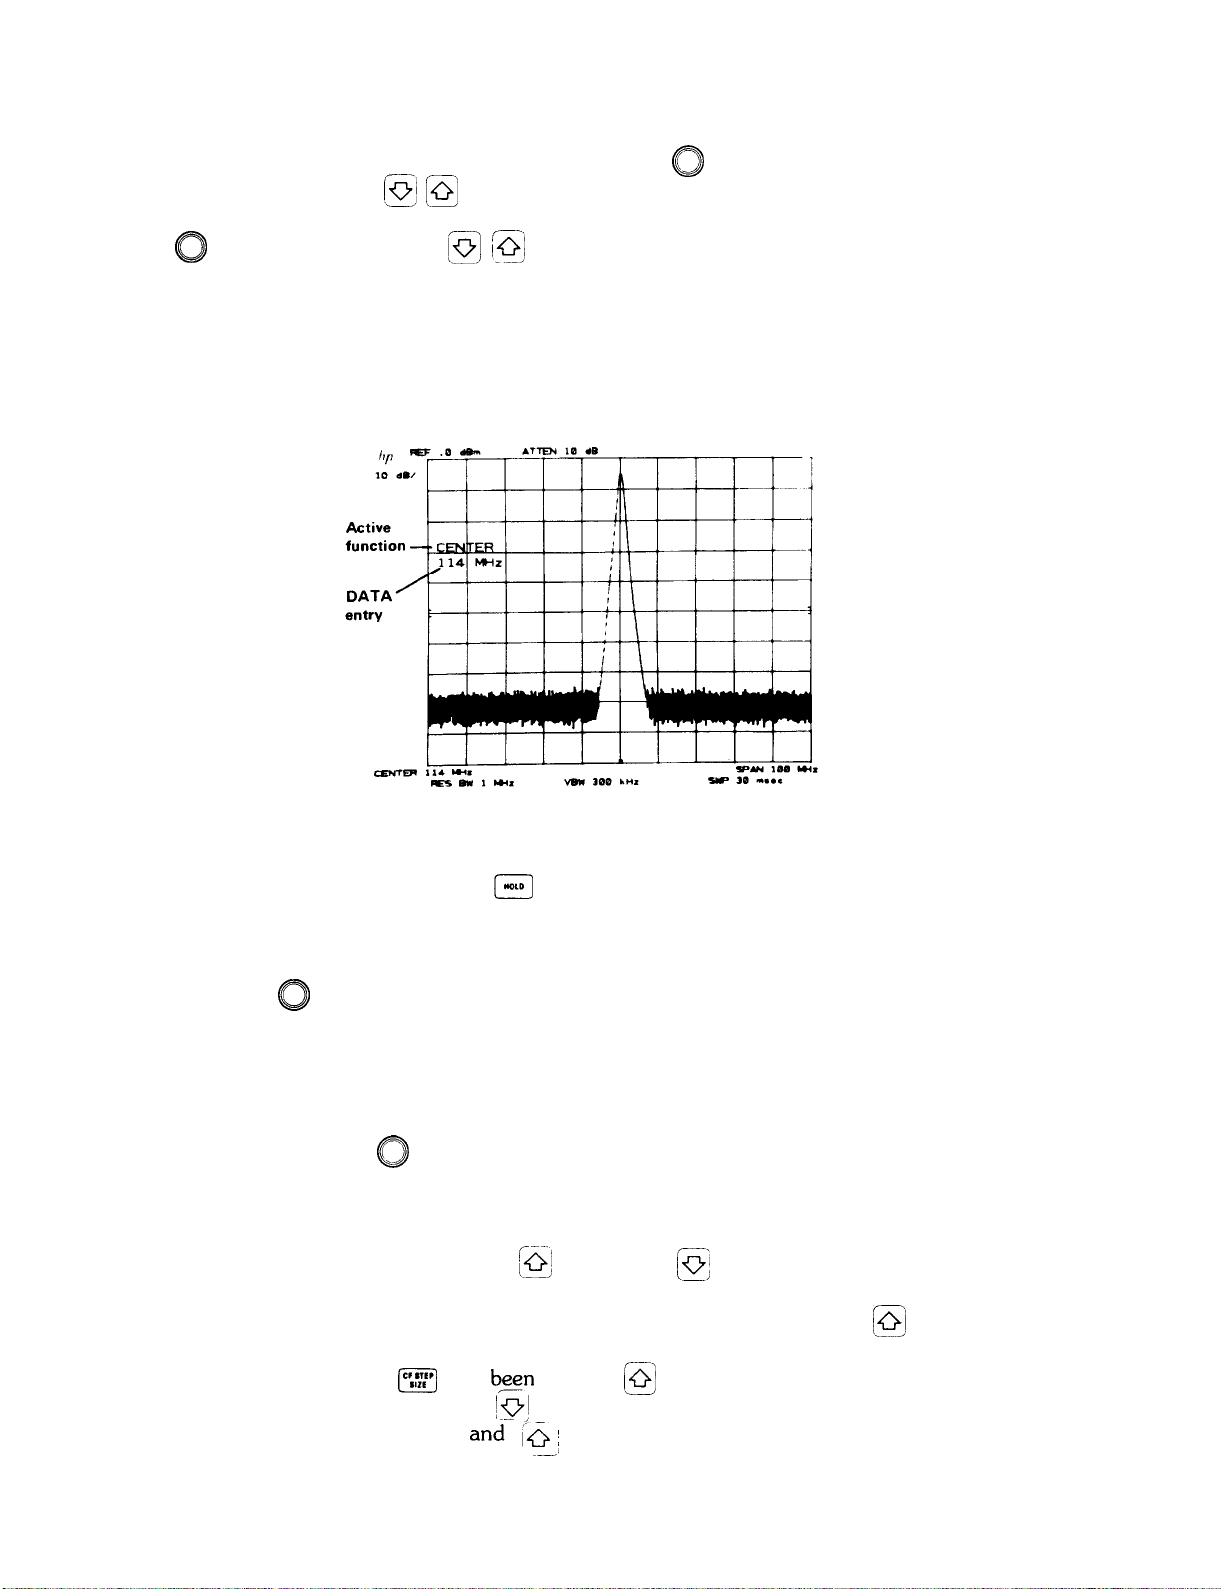
NCTION -
A FUNCTION is enabled by pressing the desired FUNCTION key Once enabled, the function, along with its
current data value, is displayed in the active graticule area of the CRT as well as outside the graticule border. To
change the value of the active function, use either the DATA knob, step keys, numeric keyboard, or a combination
of all three. The HOLD key above the DATA knob can be used to retain the present instrument state and prevent
any inadvertent entry of DATA. HOLD clears the active function area of the CRT as well as de-activates any
function.
Active
Function
Frequency
Span
Manual Operation
19
CENTER FREQUENCY
CENTER FREQUENCY
FUNCTION
The center frequency can be tuned continuously from 0 to 22
Additional band overlap enables the center frequency to tune up to 24 GHz and below to - 1
The center frequency can be set with 1 Hz resolution. Readout resolution is 1% of the frequency span, hence the
highest readout resolution is obtained with narrow frequency spans. Data entered, however, is always accurate to
1 Hz even though the center frequency readout may display less resolution.
During band crossings (from 0 - 2.5
or above 22
Appendix for detailed information.)
DATA Entry with CENTER FREQUENCY
[-iEz]
GHz),
(EC)
. . . .
#I
the frequency span may change to enable the desired center frequency to be set. (See
@@
GHz
low band to 2 - 22
Changes the center frequency by about one half the total frequency span
each full turn.
Changes the center frequency by one tenth of the frequency span, i.e., by
one division. COUPLED FUNCTION
size.
Allows direct center frequency entry. The analyzer will accept a center frequency entry with 1 Hz resolution. Even though the readout may show a
fewer number of digits (due to wide frequency span), as the span is narrowed the full entry will be read out. Abbreviated readouts are not rounded.
GHz
using any combination of DATA controls.
GHz.
GHz
microwave band) or at band edges (below 0 Hz
[‘::::‘I
can be used to change this step
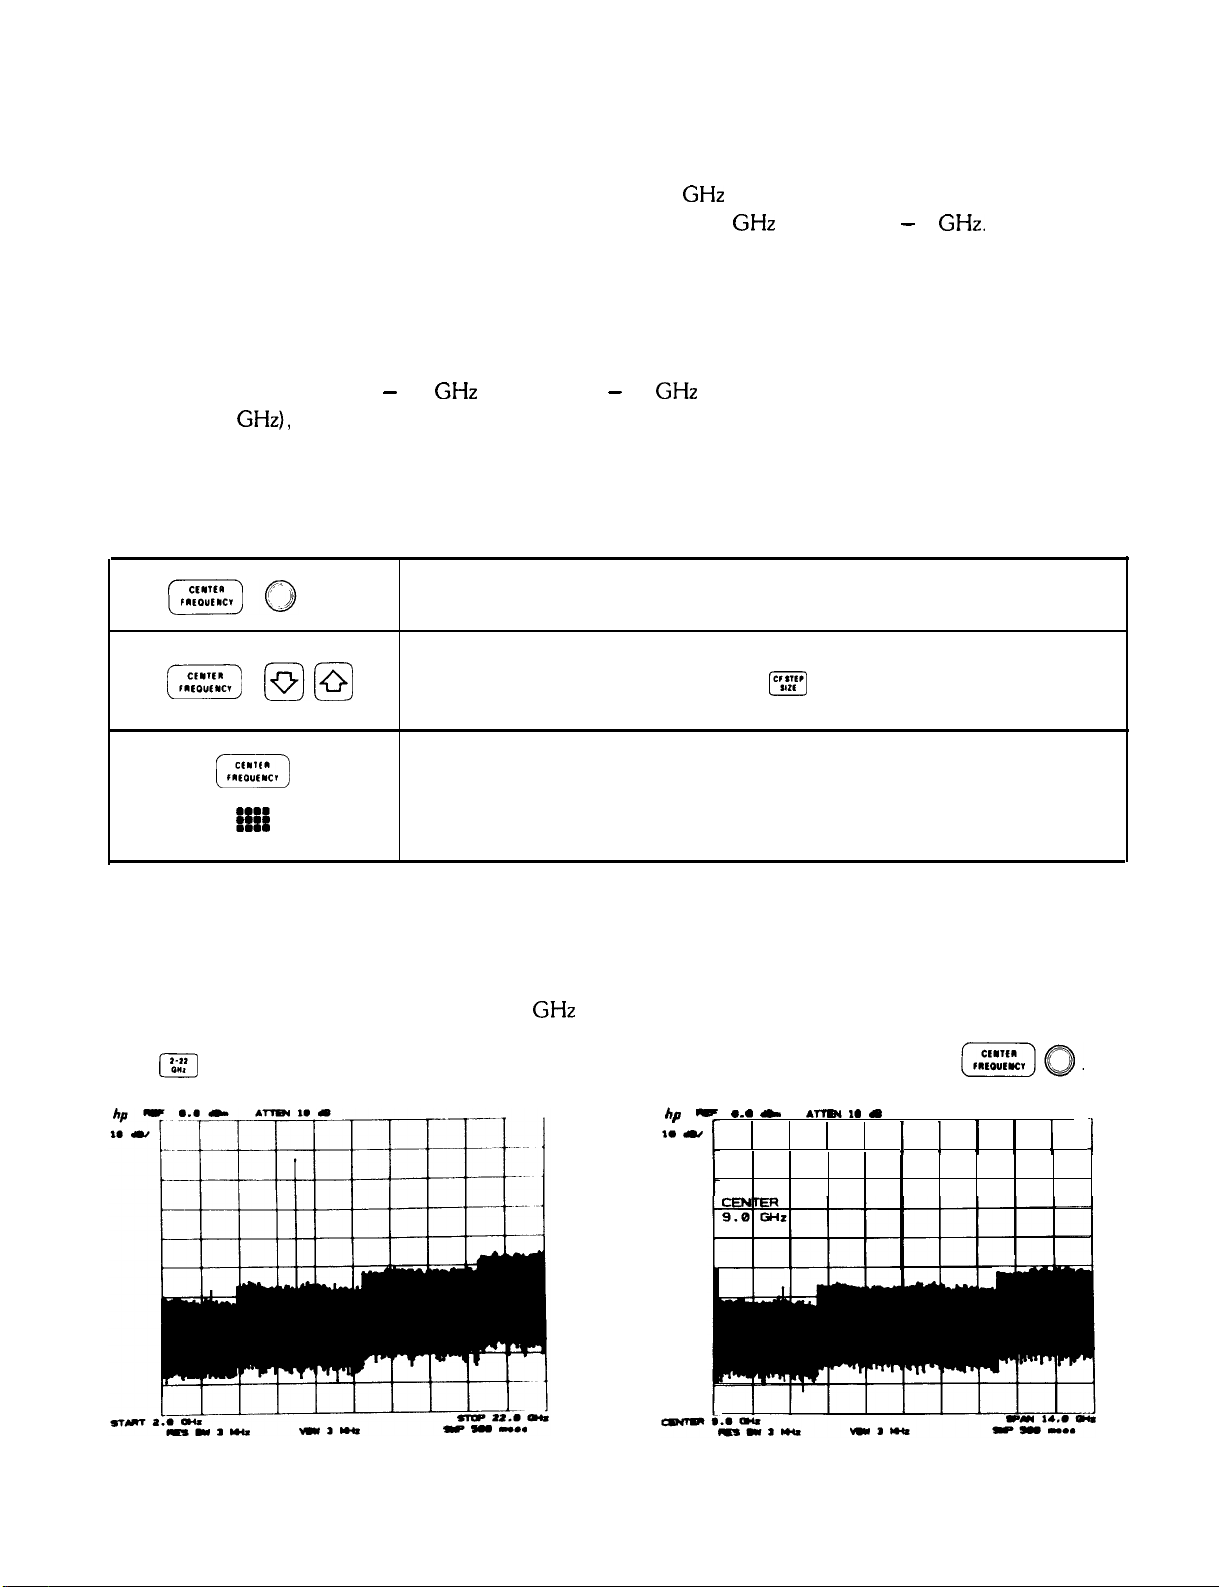
Example
Once a signal response is placed at the center of the display, the frequency of the signal can be read out from
CENTER FREQUENCY The input signal is a 9 GHz synthesized source.
Press
1’6::)
for a full span display.
20 Manual Operation
Tune signal to center of display with
. . .
L
b -
I. *
.-I.*
! ! ! ! ! 1
(-ZZ)~.

FUNCTION
Reducing the frequency span will increase the center
frequency readout resolution.
Press
then
[Fj
(x]
@
@
FREQUENCY SPAN
FREQUENCY SPAN
The frequency span changes the total display frequency range symmetrically about the center frequency. Note that
the frequency span readout refers to the total display frequency range; to determine frequency span per division,
divide by 10.
As the frequency span is changed, resolution bandwidth and video bandwidth automatically change to provide a
predetermined level of resolution and noise averaging, respectively. Sweep time also changes automatically to
maintain a calibrated display.
The analyzer can be adjusted to span a maximum of 2.5 GHz in the low band and 22 GHz (2 to 24
the microwave band. A minimum span of 100 Hz is allowed in both bands as well as 0 Hz (zero span) which
enables the analyzer to function as a fixed-tune receiver. In zero span, the analyzer can display modulation
waveforms in the time domain.
DATA Entry with FREQUENCY SPAN
Changes the frequency span continuously.
GHz
range) in
Changes the frequency span to the next value in a 1,
2,5,
10 sequence.
Enters an exact value up to three digits, depending on span. Additional
digits will be deleted without rounding.
Manual Operation 21
I
FREQUENCY SPAN FUNCTION
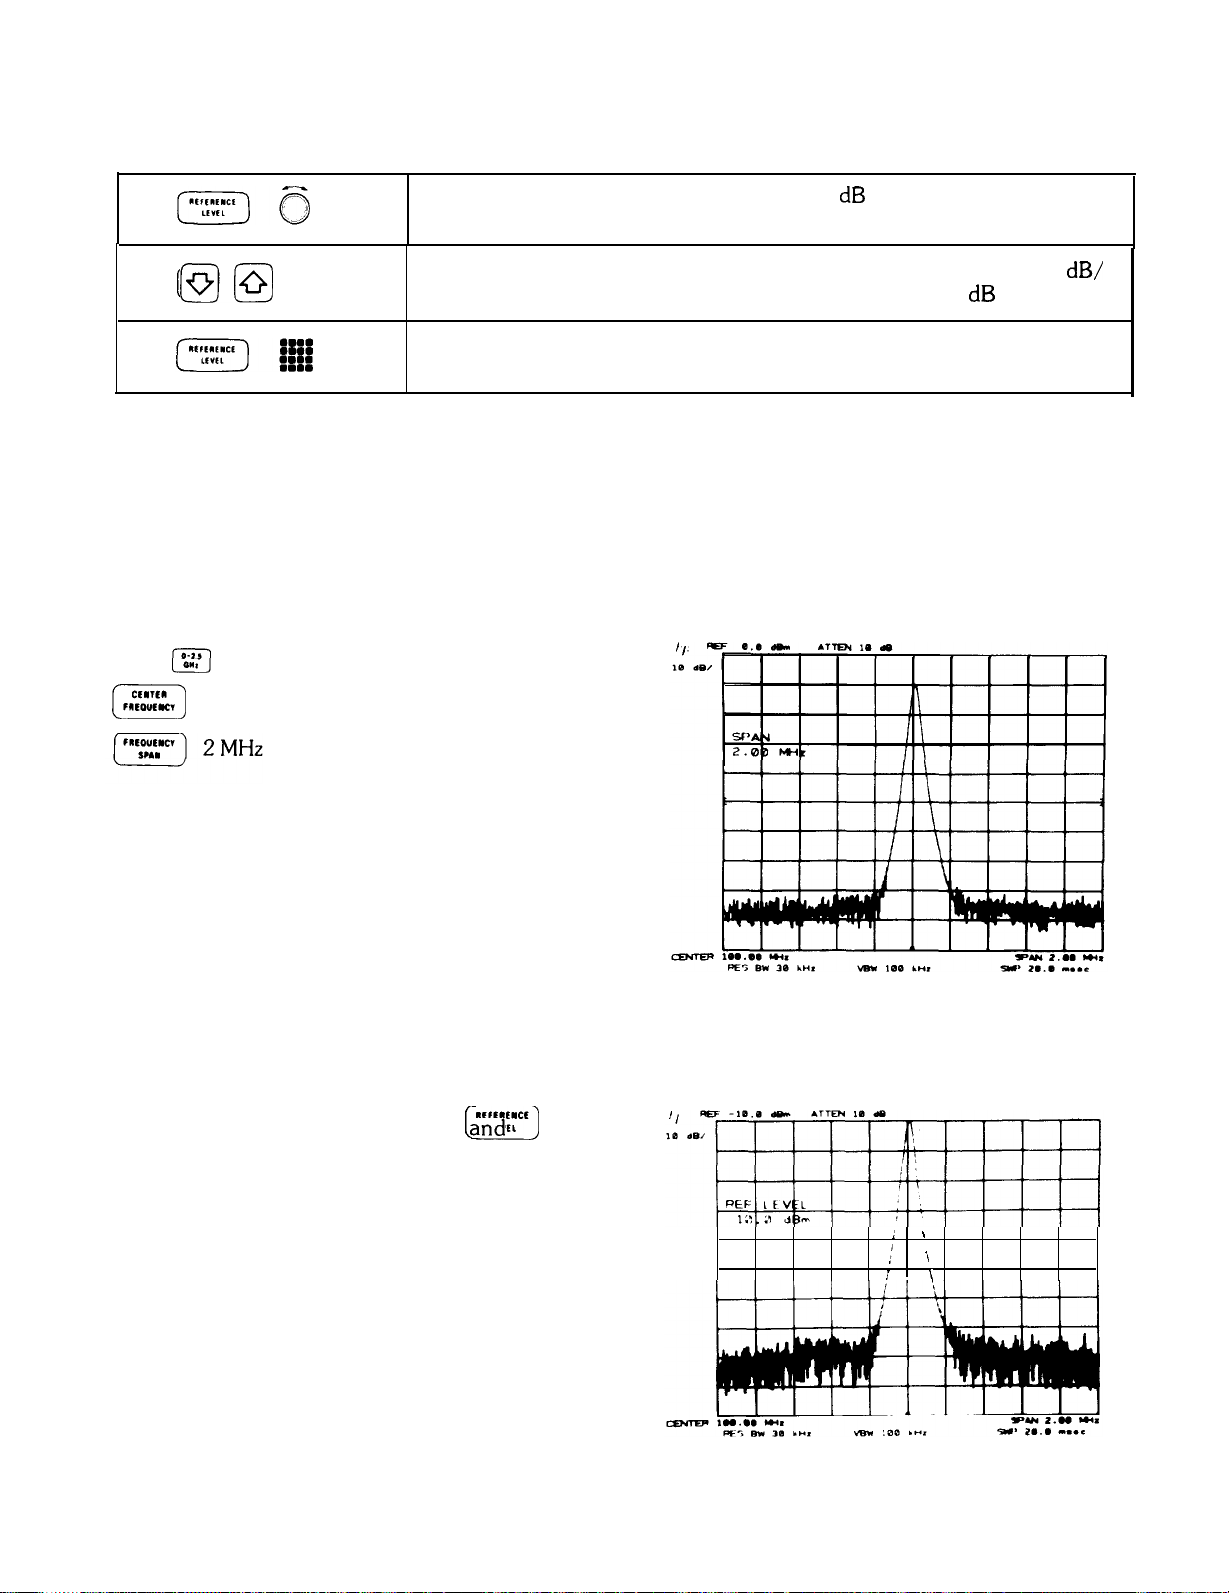
Example
Use FREQUENCY SPAN to zoom in on signals.
Connect CAL OUTPUT
This selects a convenient
2.5
GHz.
to RF INPUT press
full span display from 0 to
Tune center frequency to 100 MHz with:
100 MHz.
[06::1
[?%%-I
Reduce span with:
[F]@@or~
The desired span can also be selected with the
numeric keyboard. Note that narrow frequency spans
provide increased center frequency resolution.
In the microwave band, pressing
enables a 20
22 Manual Operation
GHz
full span.
m

FUNCTION
FREQUENCY SPAN
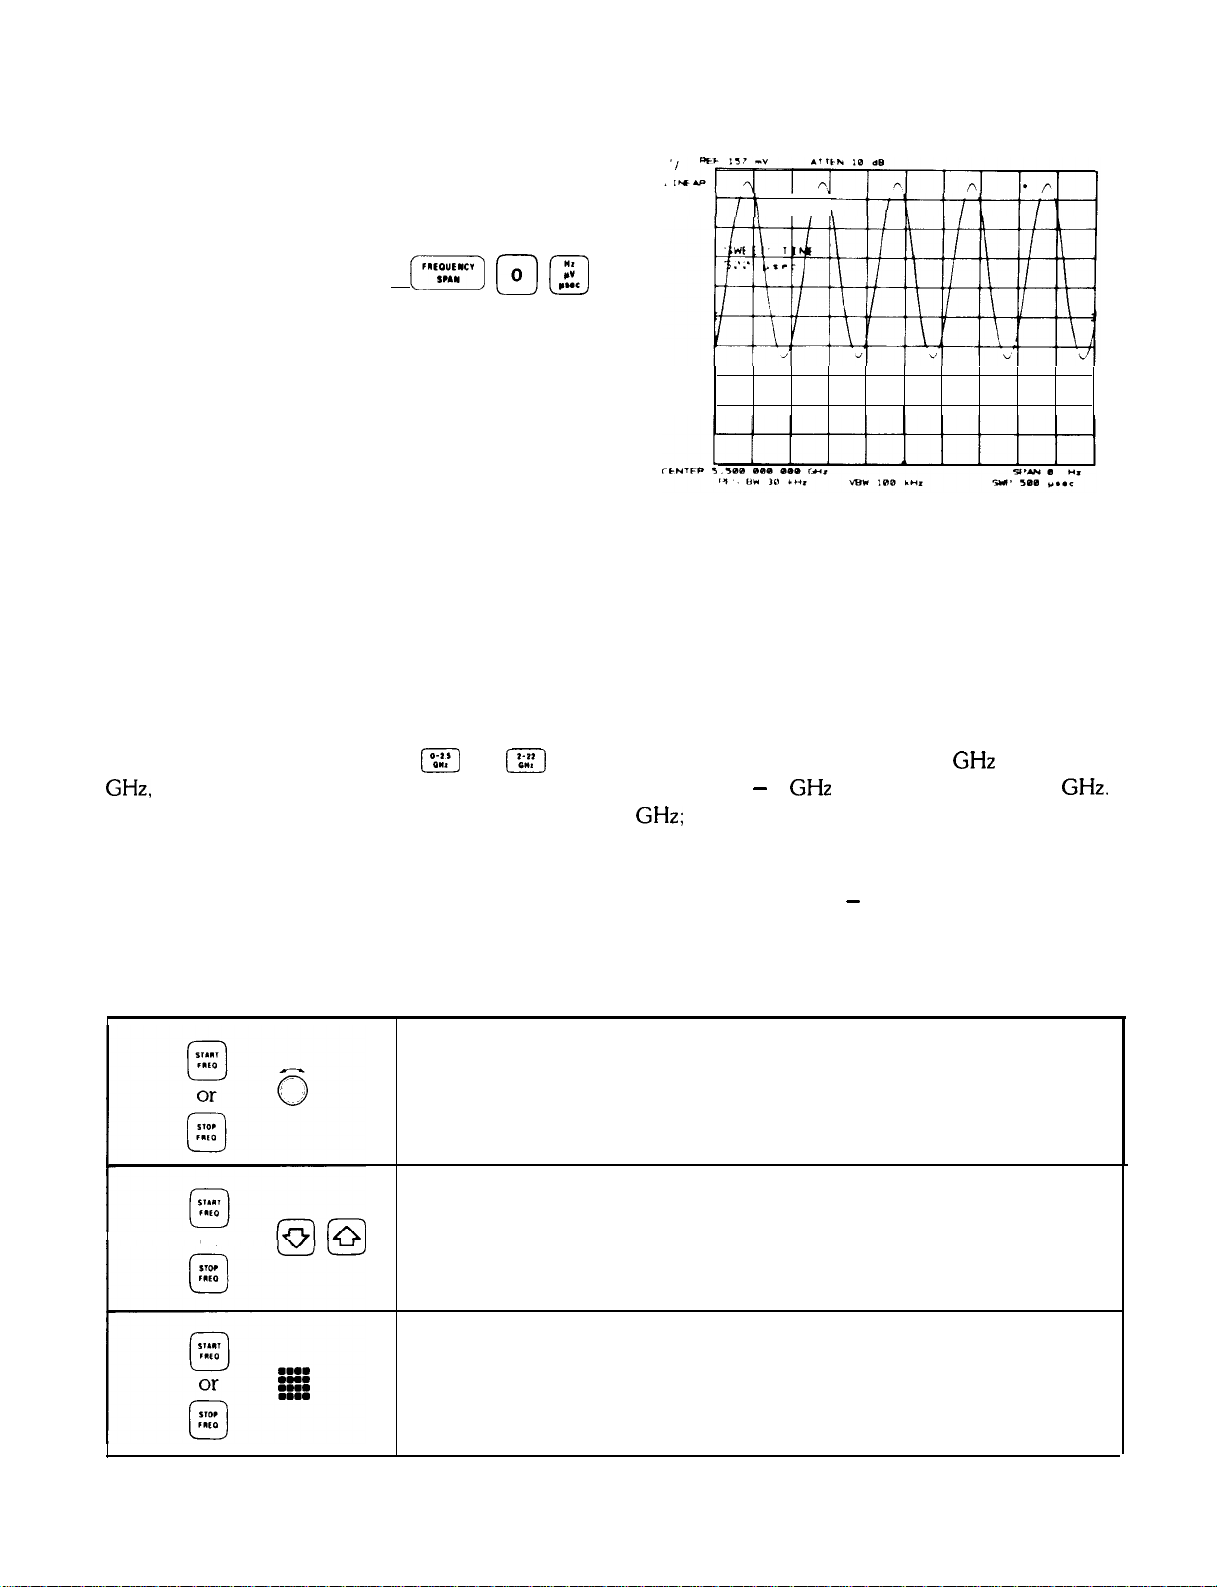
Example
Operating the spectrum analyzer in zero span. The modulation waveform of an AM signal can be displayed in the
time domain.
In the frequency domain, we can accurately determine the modulation frequency and level.
I
I
I
I I I I
I.1
I” I
To demodulate the AM, increase the resolution band-
width to include both sidebands with the IF passband.
L-E-@@
Position the signal at the reference level and select a
linear voltage display
(G&ii)gFJ
fi
SCALE.
Manual Operation
23
START/STOP FREQUENCY FUNCTION
I/h
iii
To select zero span, press
Video trigger can be used to trigger on the waveform.
The sweep time control can be adjusted to change the
horizontal scale.
[F)
m
a
START/STOP FREQUENCY
Another way to adjust the frequency range is by using START/STOP FREQUENCY instead of CENTER FREQUENCY and FREQUENCY SPAN. Activating START FREQ or STOP FREQ causes both to read out in place of
CENTER FREQUENCY and SPAN on the CRT START FREQ sets the left graticule frequency and STOP FREQ
sets the right graticule frequency; both are mutually exclusive with CENTER FREQUENCY and FREQUENCY
SPAN.
The INSTRUMENT STATE keys, w and m , select a start/stop frequency from 0 to 2.5 GHz and 2 to 22
GHz,
respectively. Additional over-range allows start frequency setting of - 1
The maximum start/stop frequency span allowable is 22
(START FREQ = STOP FREQ) .
GHz;
the minimum span is 100 Hz and zero span
GHz
and stop frequency of 24
GHz.
Start/Stop frequency readout resolution is 1% of the span (span = stop frequency - start frequency). Both start
or stop frequencies can be entered with 1 Hz resolution.
DATA Entry with START/STOP Frequency
Changes the start or stop frequency. The amount of change per turn is a
constant percentage of the frequency span.
or
Changes the frequency by one tenth of the total frequency span.
Exact start or stop frequencies can be entered. The number of digits read out
depends upon the frequency span.
24 Manual Operation
FUNCTION
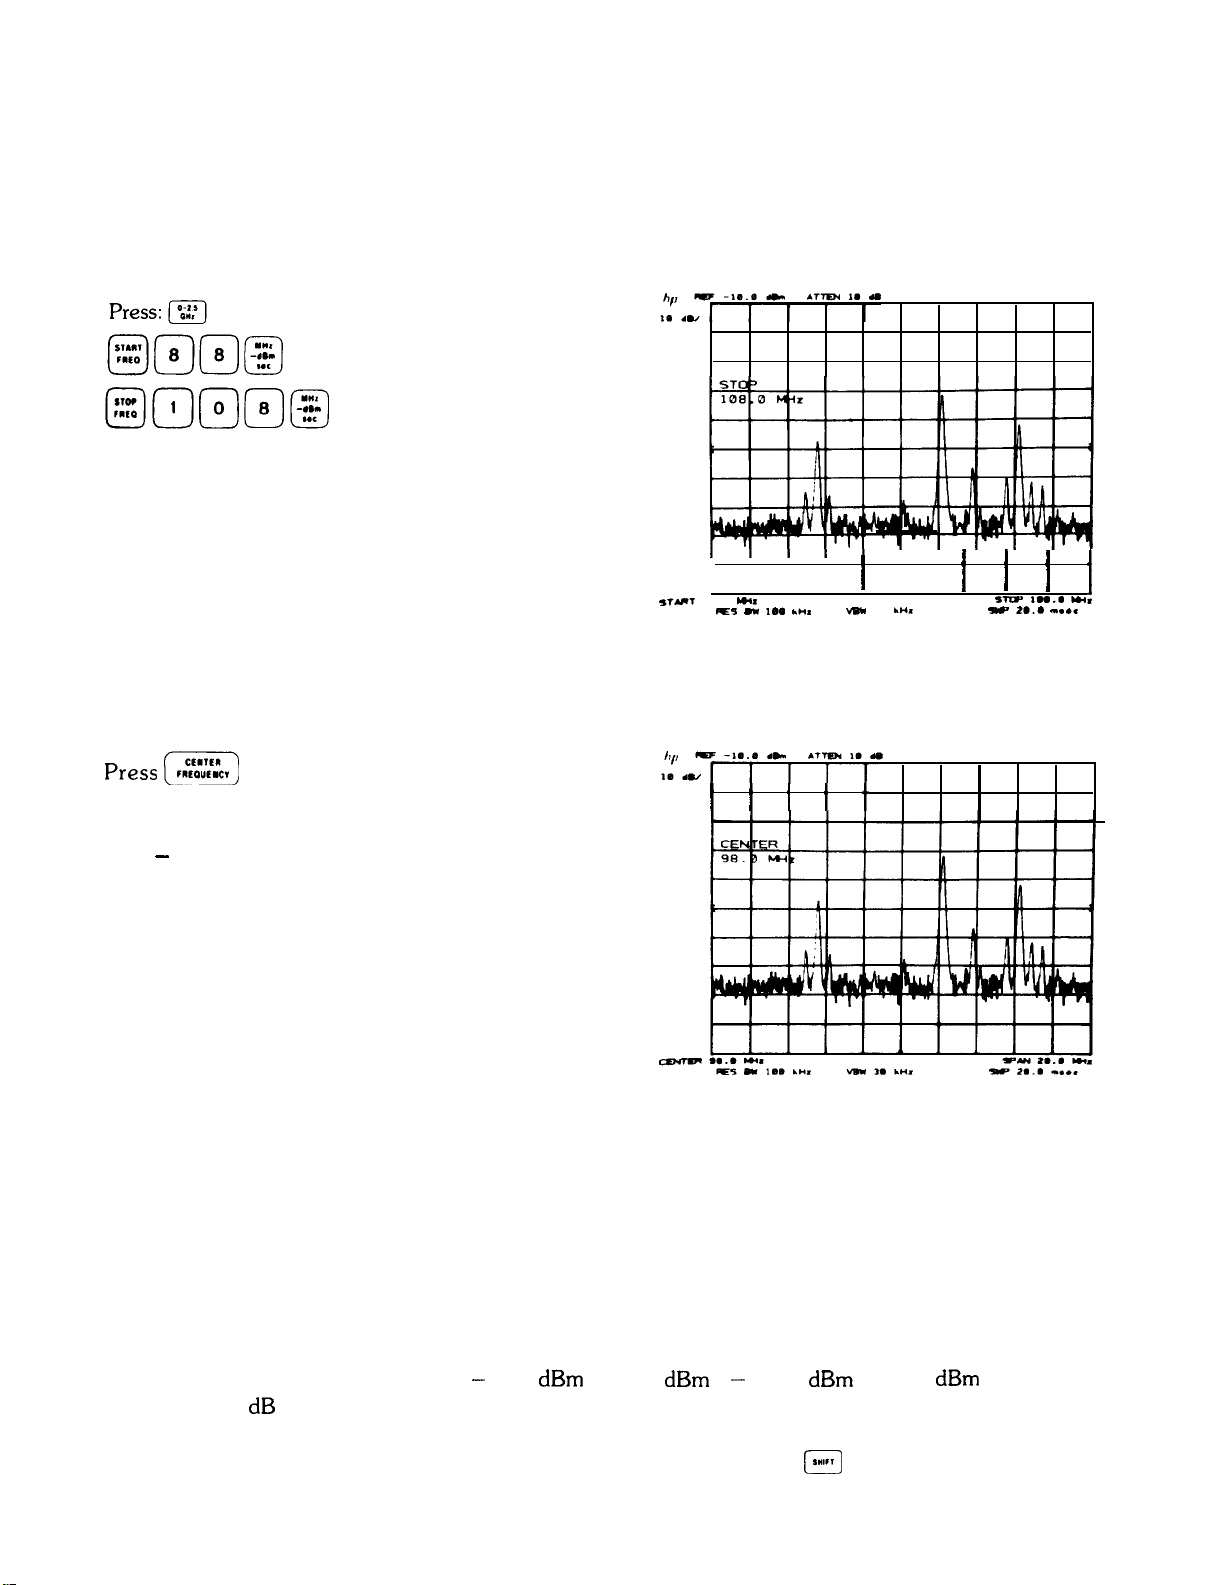
Example
Set start/stop frequency to monitor FM broadcast band
REFERENCE LEVEL
Press (?iiEiJ
unchanged, although the START/STOP frequency
readouts are replaced by center frequency and span
(108 - 88 = 20 MHz).
.
Note that horizontal scaling is
t i iii ii i i i
,fYT
. . . .
YI.
IF5 mu
Ia. *“a
I i i i t
vs*
3.
L”.
mu=
I”.. WI,
- 2... “...
I
REFERENCE LEVEL
The REFERENCE LEVEL function changes the absolute amplitude level of the top graticule line. The vertical
scale (amplitude units per division) is selected from the SCALE control group. To measure signal level, the peak of
the signal’s response is positioned on the top graticule line and its amplitude is read out from REF LEVEL.
The reference level can be adjusted from - 89.9 dBm to + 30 dBm ( - 139.9 dBm to + 60 dBm with extended
range) with 0.1 dB resolution. The input attenuator is automatically coupled with the reference level to prevent
gain compression; signals which are above the gain compression point will be displayed above the reference level
line. Different mixer input levels as well as amplitude units can be selected (see
(L*lrl
FUNCTIONS Chapter 11).
Manual Operation 25
REFERENCE LEVEL
DATA Entry with REFERENCE LEVEL
In logarithmic scale, the changes are in 0.1 dB steps: in linear scale, the
changes are made to the least significant digit.
FUNCTION
pi?-)
pJ@
In logarithmic scale, changes the reference level in steps according to
division scale. In linear scale, changes the reference level in 1 dB steps.
Allows entry of exact reference levels. Digits entered beyond the displayed
number of digits are deleted.
Example
Measure amplitude of calibration signal.
Press
@
(-E]
100 MHz
dB/
[ “%?)
To measure signal amplitude, press
and
position signal peak to top graticule line. Read amplitude from REF LEVEL.
26 Manual Operation
; ,
i
i
i
\
FUNCTION
FUNCTION/DATA SUMMARY
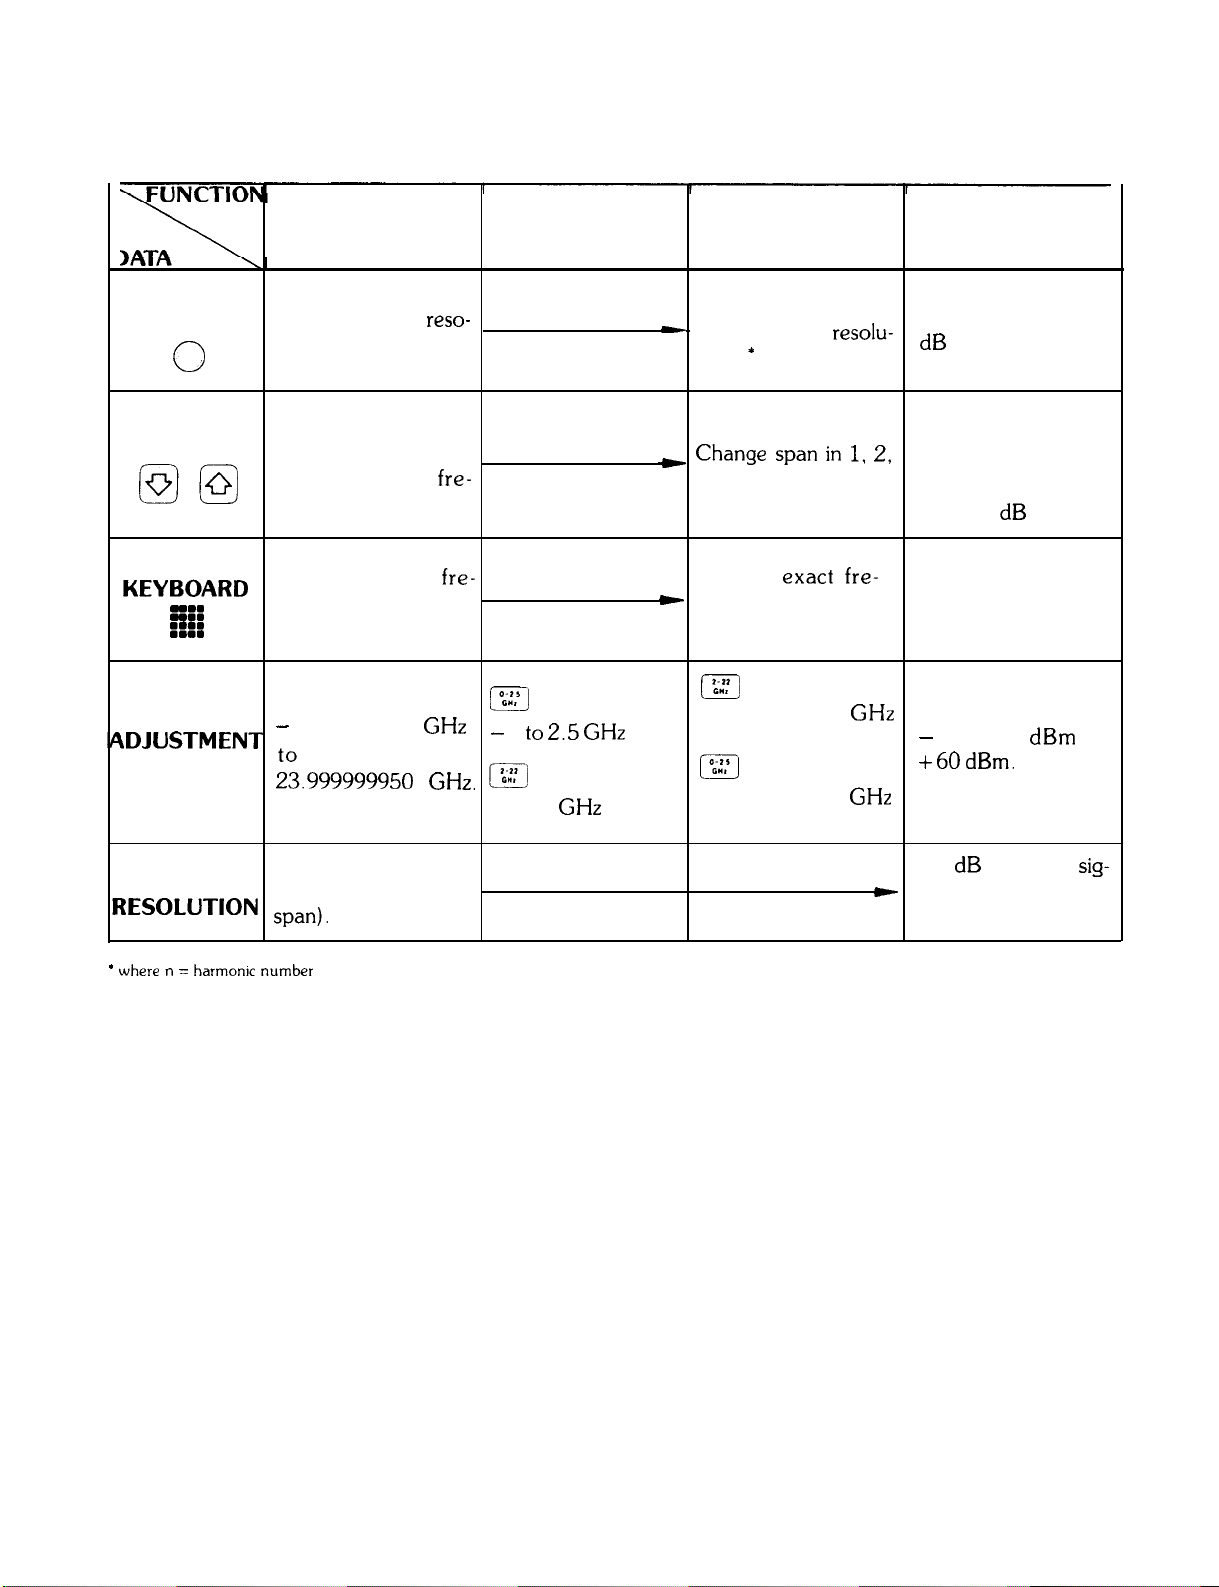
FUNCTION/DATA SUMMARY
CENTER
FREQUENCY
KNOB
Change continuously
with up to 1 Hz
reso-
lution in narrow
0
STEP KEYS
spans.
Change frequency in
one division steps
(i.e., 10% of fre- 5, 10 sequence.
@I@
NUMERIC
KEYBOARD Enter exact fre-
: t::
1:::
rDJUSTMENT
RANGE
quency span).
quency with up to 1
Hz resolution.
-
1.000000000
:03.999999950
GHz
GHz. a
FREQUENCY
SPAN
m
_
1 to
2.5 GHz
2 to 24
GHz
START/STOP
FREQUENCY
Change continuously
a
with n x 2 Hz resolu-
tion
*
- Change span in ” 2’
Enter
*
quency with n x 2 Hz
exact
fre- level. Digits entered
resolution *
m
100 Hz to 22 GHz
and zero span.
106::
100 Hz to 2.5 GHz
and zero span.
REFERENCE
LEVEL
Continuous with 0.1
dB tuning resolution.
Incremental change
in accordance with
log scale. In linear,
changes incrementally in 1 dB steps.
Enter exact reference
beyond last displayed
digit are deleted.
-
139.9
dBm
to
+60dBm.
READOUT
tESOLUTlON span),
* where n = harmomc number
1% of SPAN (Up to
1 Hz in narrow
0.1 dB in log; 4
c
nificant digits in lin-
ear.
sig-
Manual Operation 27
CRT DISPLAY
CHAPTER 4
CRT DISPLAY
GENERAL DESCRIPTION
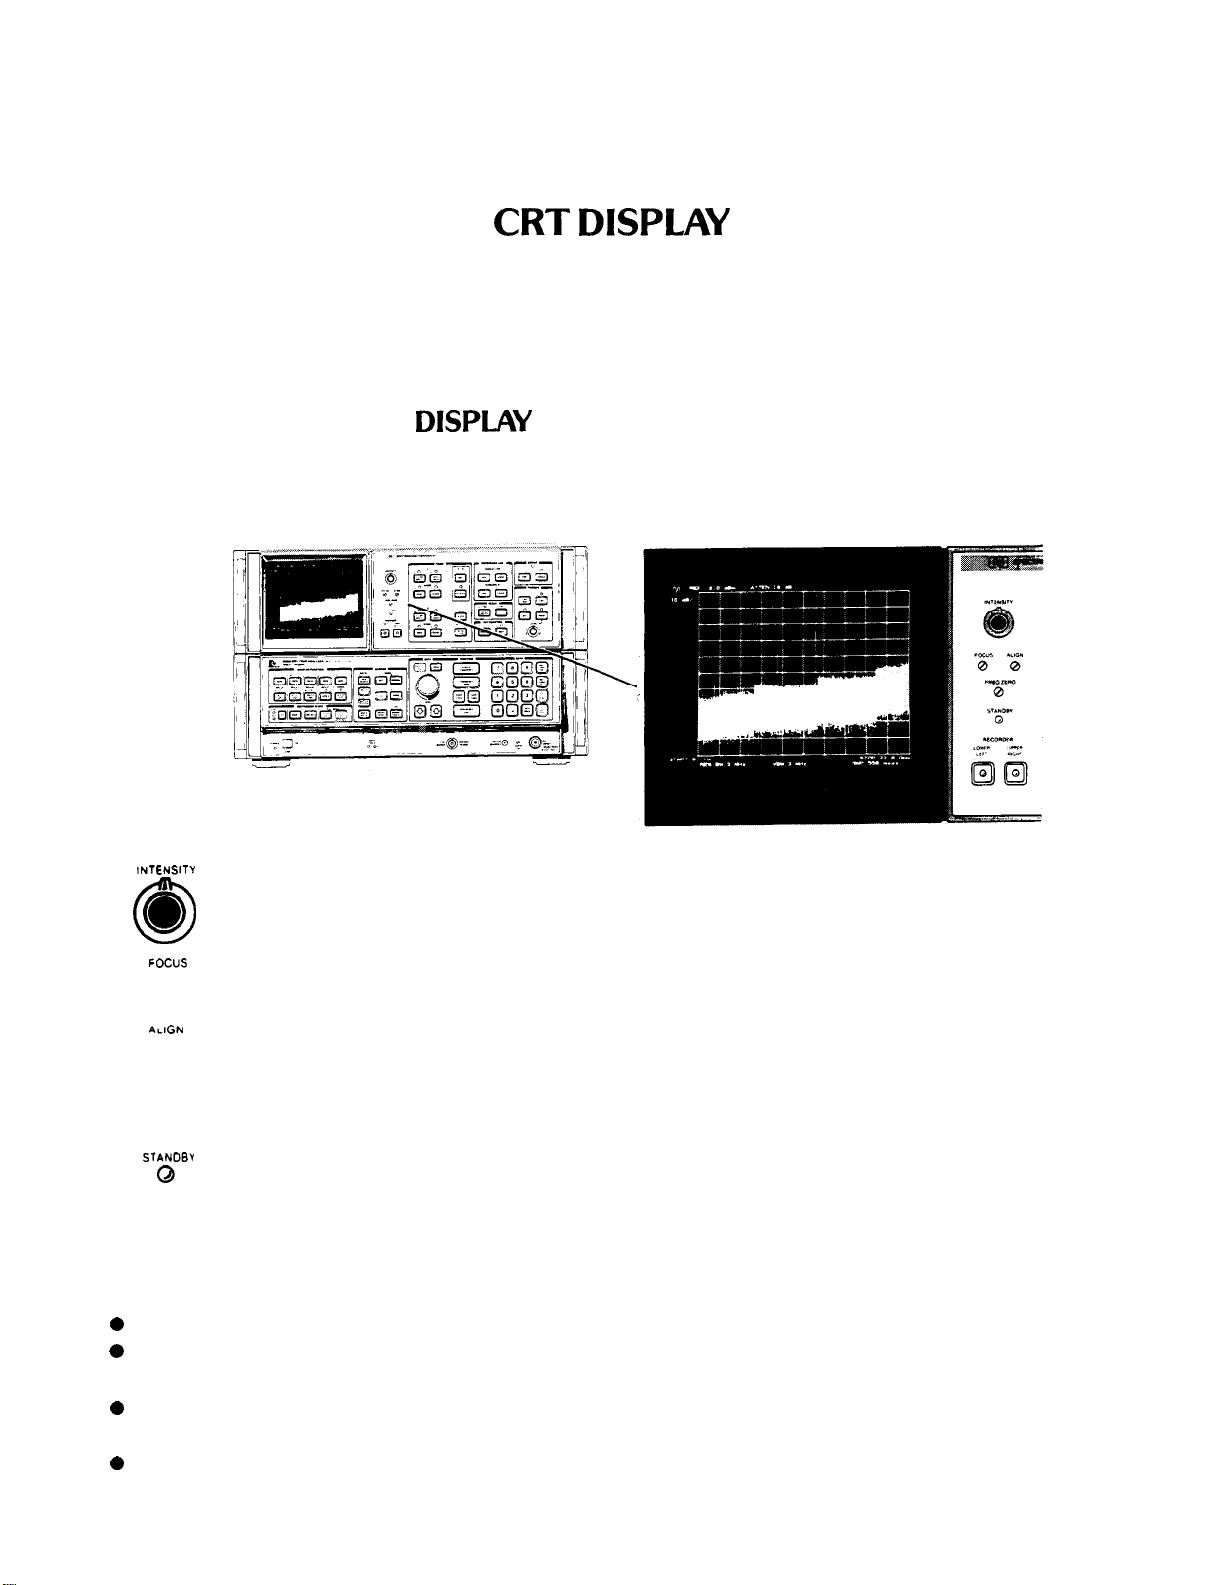
This chapter describes the CRT display adjustments, readouts, and graphics.
ADJUSTMENT OF THE DISPLAY
ADJUSTMENT OF THE
The adjustments for intensity, focus, and alignment simultaneously affect all the lines and characters on the display.
CRT Display and Adjustments
DISPLKY
lNTENSlTY
Controls intensity for all the CRT writing.
A screwdriver adjustment which focuses all the CRT writing. Focusing any one element on the CRT
focuses all the writing.
0
0
FOCUS
0
nLlGN
0
A screwdriver adjustment which tilts all the displayed CRT information.
DISPLAY SECTION LINE POWER
STANDBY
0
The light indicates power condition of the Spectrum Analyzer Display section as dictated by the LINE
power switch on the 85660B RF section.
CRT DISPLAY OVERVIEW
The cathode ray tube of the Spectrum Analyzer Display section displays:
active function name and value
0
0
graticule
l
traces of the signal response
values that calibrate the frequency, time, and amplitude axes
0
l
values for the spectrum analyzer receiver parameters -that is, COUPLED FUNCTIONS.
operator originated labels and graphics
0
Manual Operation 29
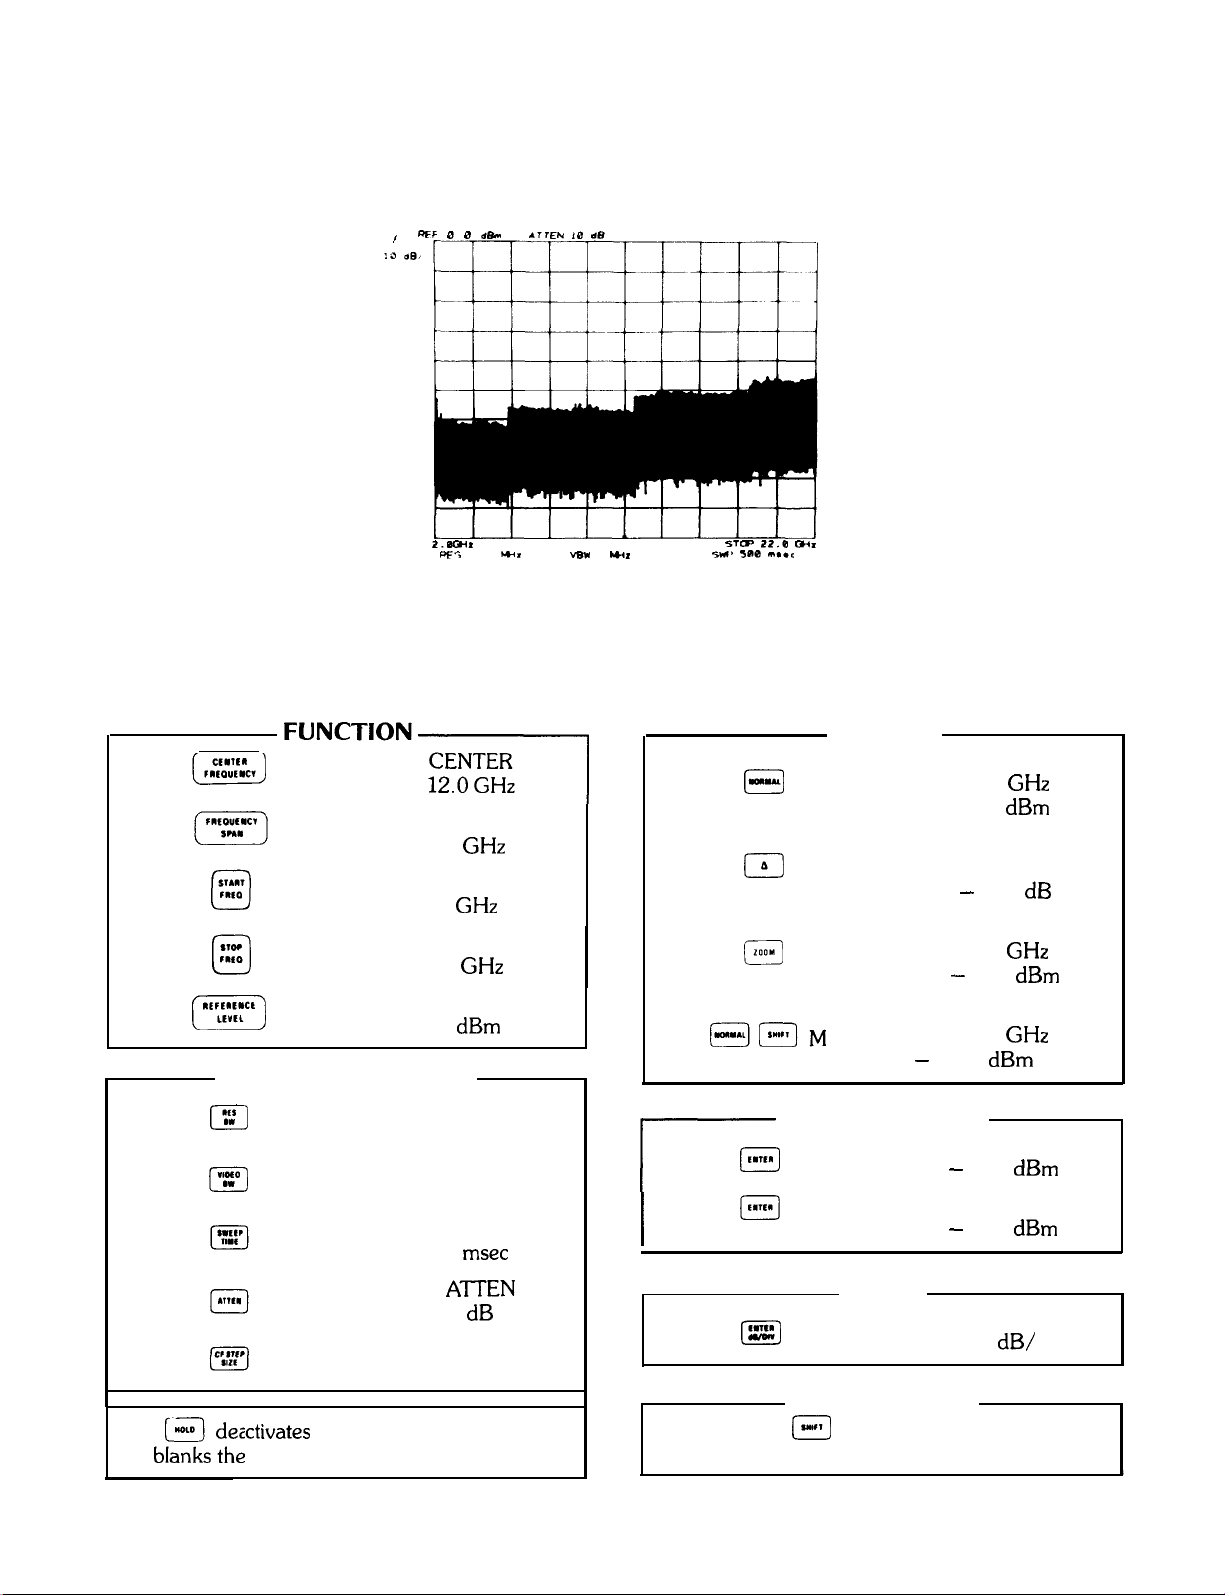
CRT DISPLAY OVERVIEW
Active Function
The function which has been activated for DATA entry is read out in the graticule area shown.
OFF 8 0 d&l .TTEN 18 dtl
I
!O do,
CRT DISPLAY
START
*.a c+I*
PFCI
BY 3
*Hz
Activating a function immediately writes its name in the active function area along with its present value. The
following summarizes the names and readout formats for the front panel designated active functions after an
INSTRUMENT PRESET
Function
FuNcT’oNc)
(,,,::c’)
COUPLED FUNCTION
I::‘1
pg)
Examples of Active
Function Readout
SPAN
20 GHz
START
2
GHz
STOP
22 GHz
REF LEVEL
.O
dBm
RES BW
3 MHz
VIDEO BW
3 MHz
SWEEPTIME
500 msec
vB*
3
WI
r-
5TB Z2.B M,
5111’ 5RB “...<
Function
I--)
(,,,.
(,.J(I*I(1lM
REFERENCE LINE
(,.,,,
Examples of Active
Function Readout
MARKER
-
MARKER
12.0 GHz
19.8 dBm
MARKER A
20.0 MHz
-
12.4 dB
MARKER ZOOM
12.0 GHz
-
32.8 dBm
MARKER
12.0 GHz
140.4 dBm (1 Hz)
DISPLAY LINE
-
45.0 dBm
THRESHOLD
-
90.0 dBm
eactivates the active function and
bk$!s the
30 Manual Operation
active readout.
RF ATTEN
10
dB
CF STEP
100 MHz
SCALE
El
KEY FUNCTION
(See
[,,,I
KEY FUNCTIONS,
Chapter 11.)
LOG
10
dB/
 Loading...