


Help Volume
© 1992-2001 Agilent Technologies. All rights reserved.
Agilent Technologies 16715A
Logic Analyzer
Agilent Technologies 16715A Logic Analyzer
The Agilent Technologies 16715A 167 MHz State/667 MHz Timing
Zoom logic analyzer offers 2M deep memory with up to 340 channels.
“Getting Started” on
page 11
“Task Guide ” on
page 31
• “Step 1. Connect the logic analyzer to the device under test” on page 13
• “Step 2. Choose the sampling mode” on page 14
• “Step 3. Format labels for the probed signals” on page 17
• “Step 4. Define the trigger condition” on page 20
• “Step 5. Run the measurement” on page 21
• “Step 6. Display the captured data” on page 22
•“Probing the Device Under Test” on page 33
•“Choosing the Sampling Mode” on page 36
•“Using the Timing Mode (Asynchronous Sampling)” on page 36
•“Using the State Mode (Synchronous Sampling)” on page 43
•“In Either Timing Mode or State Mode” on page 51
•“Formatting Labels for Logic Analyzer Probes” on page 54
•“Setting Up Triggers and Running Measurements” on page 61
•“Using Trigger Functions” on page 62
•“Using State Mode Trigger Features” on page 67
•“Editing the Trigger Sequence” on page 69
•“Editing Advanced Trigger Functions” on page 74
•“Saving/Recalling Trigger Setups” on page 81
•“Running Measurements” on page 82
2

Agilent Technologies 16715A Logic Analyzer
•“Displaying Captured Data” on page 85
•“Using Symbols” on page 92
•“Printing/Exporting Captured Data” on page 101
•“Solving Logic Analysis Problems” on page 105
•“Saving and Loading Logic Analyzer Configurations” on page 107
“Reference” on
•“The Sampling Tab” on page 111
page 109
•“The Format Tab” on page 115
•“The Trigger Tab” on page 140
•“The Symbols Tab” on page 153
•“Error Messages” on page 164
•“Specifications and Characteristics” on page 180
“Concepts” on
•“Understanding Logic Analyzer Triggering” on page 186
page 185
•“Understanding State Mode Sampling Positions” on page 202
See Also Main System Help (see the Agilent Technologies 16700A/B-Series Logic
Analysis System help volume)
Glossary (see page 205)
3

Agilent Technologies 16715A Logic Analyzer
4

Contents
Agilent Technologies 16715A Logic Analyzer
1 Getting Started
Step 1. Connect the logic analyzer to the device under test 13
Step 2. Choose the sampling mode 14
Step 3. Format labels for the probed signals 17
Step 4. Define the trigger condition 20
Step 5. Run the measurement 21
Step 6. Display the captured data 22
For More Information... 24
Example: Timing measurement on counter board 26
Example: State measurement on counter board 28
2Task Guide
Probing the Device Under Test 33
Choosing the Sampling Mode 36
Using the Timing Mode (Asynchronous Sampling) 36
5

Contents
To select transitional timing or store qualified 39
More on Store Qualification in Transitional Timing 40
More on Storing Transitions 40
Transitional Timing Considerations 41
Using the State Mode (Synchronous Sampling) 43
In Either Timing Mode or State Mode 51
Formatting Labels for Logic Analyzer Probes 54
To assign pods to one or two analyzers 54
To set pod threshold voltages 55
To assign probe channels to labels 56
To change the label polarity 58
To reorder bits in a label 58
To turn labels off or on 59
Setting Up Triggers and Running Measurements 61
Using Trigger Functions 62
Using State Mode Trigger Features 67
Editing the Trigger Sequence 69
Editing Advanced Trigger Functions 74
Saving/Recalling Trigger Setups 81
Running Measurements 82
Displaying Captured Data 85
To open Waveform or Listing displays 85
To use other display tools 86
If the captured data doesn’t look correct 88
If there are filtered data holes in display memory 89
To display symbols for data values 90
To cancel the display processing of captured data 91
6

Contents
Using Symbols 92
To load object file symbols 93
To adjust symbol values for relocated code 94
To create user-defined symbols 95
To enter symbolic label values 96
To create an ASCII symbol file 97
To create a readers.ini file 97
Printing/Exporting Captured Data 101
Cross-Triggering 103
To cross-trigger between two analyzers 103
To cross-trigger with another instrument 104
Solving Logic Analysis Problems 105
To test the logic analyzer hardware 105
Saving and Loading Logic Analyzer Configurations 107
3 Reference
The Sampling Tab 111
Timing Mode 111
State Mode 112
The Format Tab 115
7

Contents
Importing Netlist and ASCII Files 117
Exporting ASCII Files 119
Importing ASCII Files 119
Termination Adapter 121
E5346A High Density Adapter 122
Mapping Connector Names 123
Import the Net List File 123
Verify Net to Label Mapping 124
Select/Create Interface Labels 125
Pod Assignment Dialog 126
Sampling Positions Dialog 127
The Trigger Tab 140
Trigger Functions Subtab 141
Settings Subtab 148
Overview Subtab 149
Default Storing Subtab 150
Status Subtab 151
Save/Recall Subtab 151
The Symbols Tab 153
Symbols Selector Dialog 155
Symbol File Formats 157
General-Purpose ASCII (GPA) Symbol File Format 158
8

Contents
Error Messages 164
Must assign Pod 1 on the master card to specify actions for flags 165
Branch expression is too complex 165
Cannot specify range on label with clock bits that span pod pairs 170
Counter value checked as an event, but no increment action specified 171
Goto action specifies an undefined level 171
Maximum of 32 Channels Per Label 171
Hardware Initialization Failed 172
Must assign another pod pair to specify actions for flags 172
No more Edge/Glitch resources available for this pod pair 172
No more Pattern resources available for this pod pair 173
No Trigger action found in the trace specification 173
Slow or Missing Clock 174
Timer value checked as an event, but no start action specified 174
Trigger function initialization failure 175
Trigger inhibited during timing prestore 176
Trigger Specification is too complex 176
Waiting for Trigger 178
Analyzer armed from another module contains no "Arm In from IMB"
event 179
Specifications and Characteristics 180
Agilent 16715A Logic Analyzer Specifications 180
Agilent 16715A Logic Analyzer Characteristics 180
What is a Specification? 183
What is a Characteristic? 184
9

Contents
4 Concepts
Understanding Logic Analyzer Triggering 186
The Conveyor Belt Analogy 186
Summary of Triggering Capabilities 188
Sequence Levels 188
Boolean Expressions 191
Branches 192
Edges 192
Ranges 192
Flags 193
Occurrence Counters and Global Counters 193
Timers 194
Storage Qualification 195
Strategies for Setting Up Triggers 197
Conclusions 201
Understanding State Mode Sampling Positions 202
Glossary
Index
10

1
Getting Started
After you have connected the logic analyzer probes to your device
under test (see “Step 1. Connect the logic analyzer to the device under
test” on page 13), any measurement will have the following basic steps:
11

Chapter 1: Getting Started
•“Step 2. Choose the sampling mode” on page 14
•“Step 3. Format labels for the probed signals” on page 17
•“Step 4. Define the trigger condition” on page 20
•“Step 5. Run the measurement” on page 21
•“Step 6. Display the captured data” on page 22
If you have previously saved a logic analyzer setup to a configuration
file, or if configuration files are included with an analysis probe, you
can load the configuration file to set up the logic analyzer and define
the trigger condition.
Once you have made a logic analyzer measurement, the measurement
can be refined by repeating steps 4 - 6.
Next: “Step 1. Connect the logic analyzer to the device under test” on
page 13
12

Chapter 1: Getting Started
Step 1. Connect the logic analyzer to the device under test
Step 1. Connect the logic analyzer to the device
under test
Before you begin setting up the logic analyzer for a measurement, you
need to physically connect the logic analyzer to your device under test.
There are several ways to connect logic analyzer probes to the device
under test:
• Using the general-purpose probes, the standard flying lead set, and
grabbers to connect to pins and leads in the device under test.
• By designing connectors (headers) into the device under test so that logic
analyzer probe cables and termination adapters can plug in directly.
• By designing connectors (headers) and terminations into the device under
test so that logic analyzer probe cables can plug in directly.
• Using an analysis probe to connect to microprocessors and standard
buses.
When using an analysis probe, the Setup Assistant guides you through the
connection and setup process for your particular logic analyzer and
analysis probe.
When connecting logic analyzer probes to the device under test:
1. Attach the logic analyzer probes to the device under test in a way that
keeps logically-related channels together.
2. Be sure to ground each pod.
Next: “Step 2. Choose the sampling mode” on page 14
13
Chapter 1: Getting Started
Step 2. Choose the sampling mode
Step 2. Choose the sampling mode
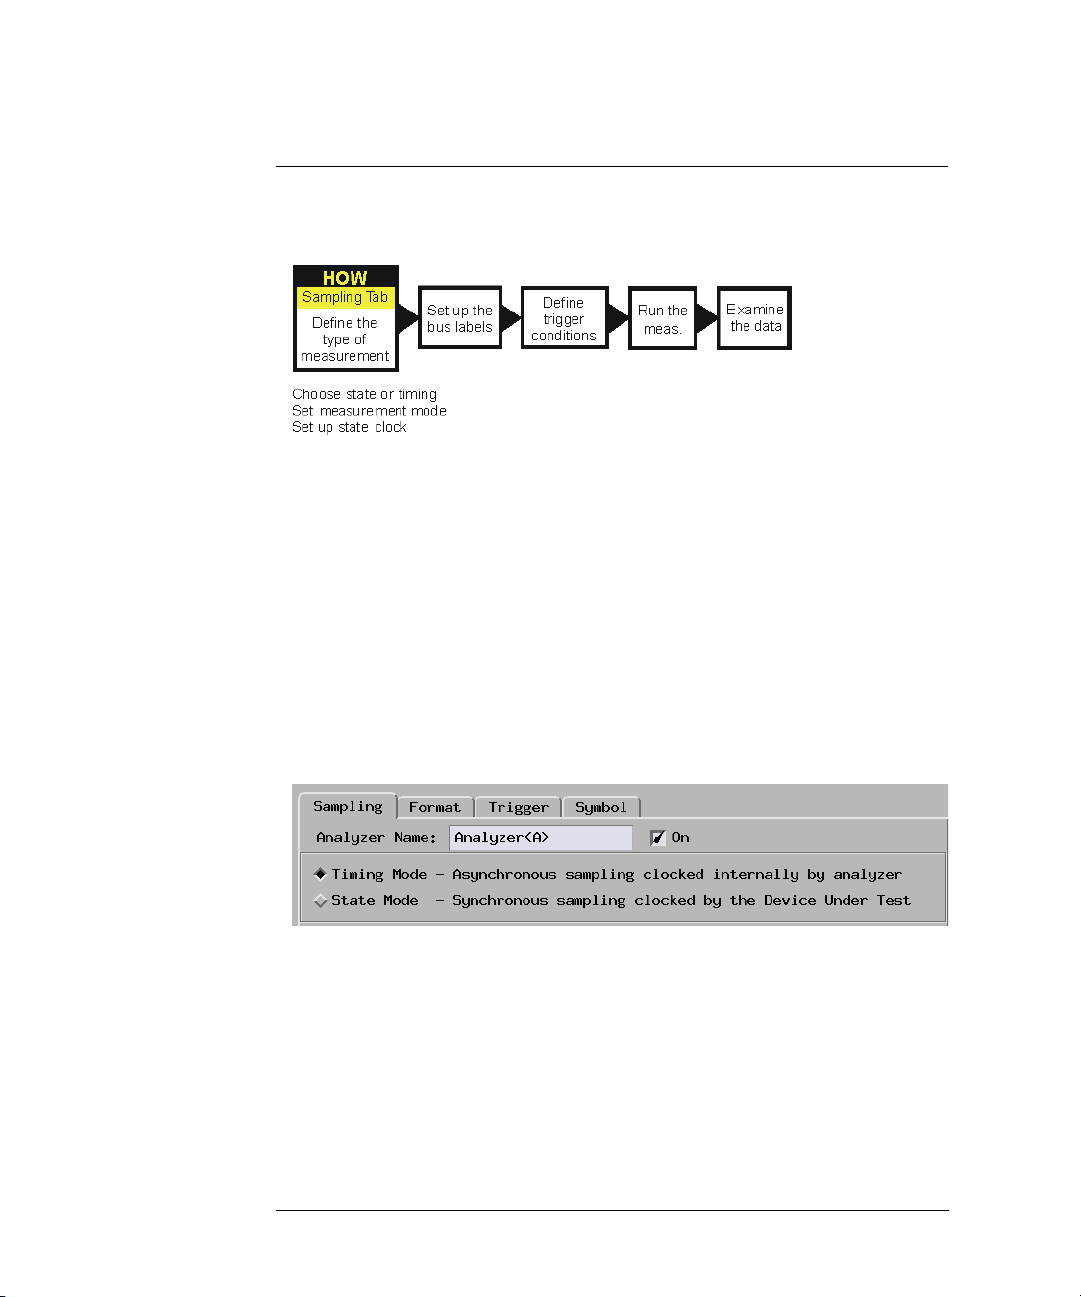
There are two logic analyzer sampling modes to choose from: timing
mode and state mode.
In timing mode, the logic analyzer samples asynchronously, based on
an internal sampling clock signal.
In state mode, the logic analyzer samples synchronously, based on a
sampling clock signal (or signals) from the device under test. Typically,
the signal used for sampling in state mode is a state machine or
microprocessor clock signal.
To choose the sampling mode
1. In the Sampling tab, choose Timing Mo de or State Mode.
14

Chapter 1: Getting Started
Step 2. Choose the sampling mode
If you chose Timing Mode
1. Select the timing analyzer full/half channel configuration.
Typically, you can choose a half-channel configuration with faster
sampling and greater memory depth, but with half of the channels.
2. Set the sample period.
To capture signal level changes reliably, the sample period should be less
than half (many engineers prefer one-fourth) of the period of the fastest
signal you want to measure.
If you chose State Mode
1. Select the state analyzer speed configuration (if there is a configuration
option).
2. In the Clock Setup, using the Master only mode, specify which clock signal
edges from the device under test will be used as the sampling clock.
15

Chapter 1: Getting Started
Step 2. Choose the sampling mode
You can also specify clock input signal levels (from the device under test)
that will enable (qualify) the sampling clock.
In either sampling mode
1. Specify the trigger position.
The trigger is the event in the device under test that you want to capture
data around.
Specify whether you want to look at data after the trigger (Start), before
and after the trigger (Center), before the trigger (End), or use a
percentage of the logic analyzer’s memory for data after the trigger (User
Defined).
2. Set the acquisition memory depth.
If you need less data and want measurements to run faster, you can limit
the amount of trace memory that is filled with samples.
Next: “Step 3. Format labels for the probed signals” on page 17
16
Chapter 1: Getting Started
Step 3. Format labels for the probed signals
Step 3. Format labels for the probed signals
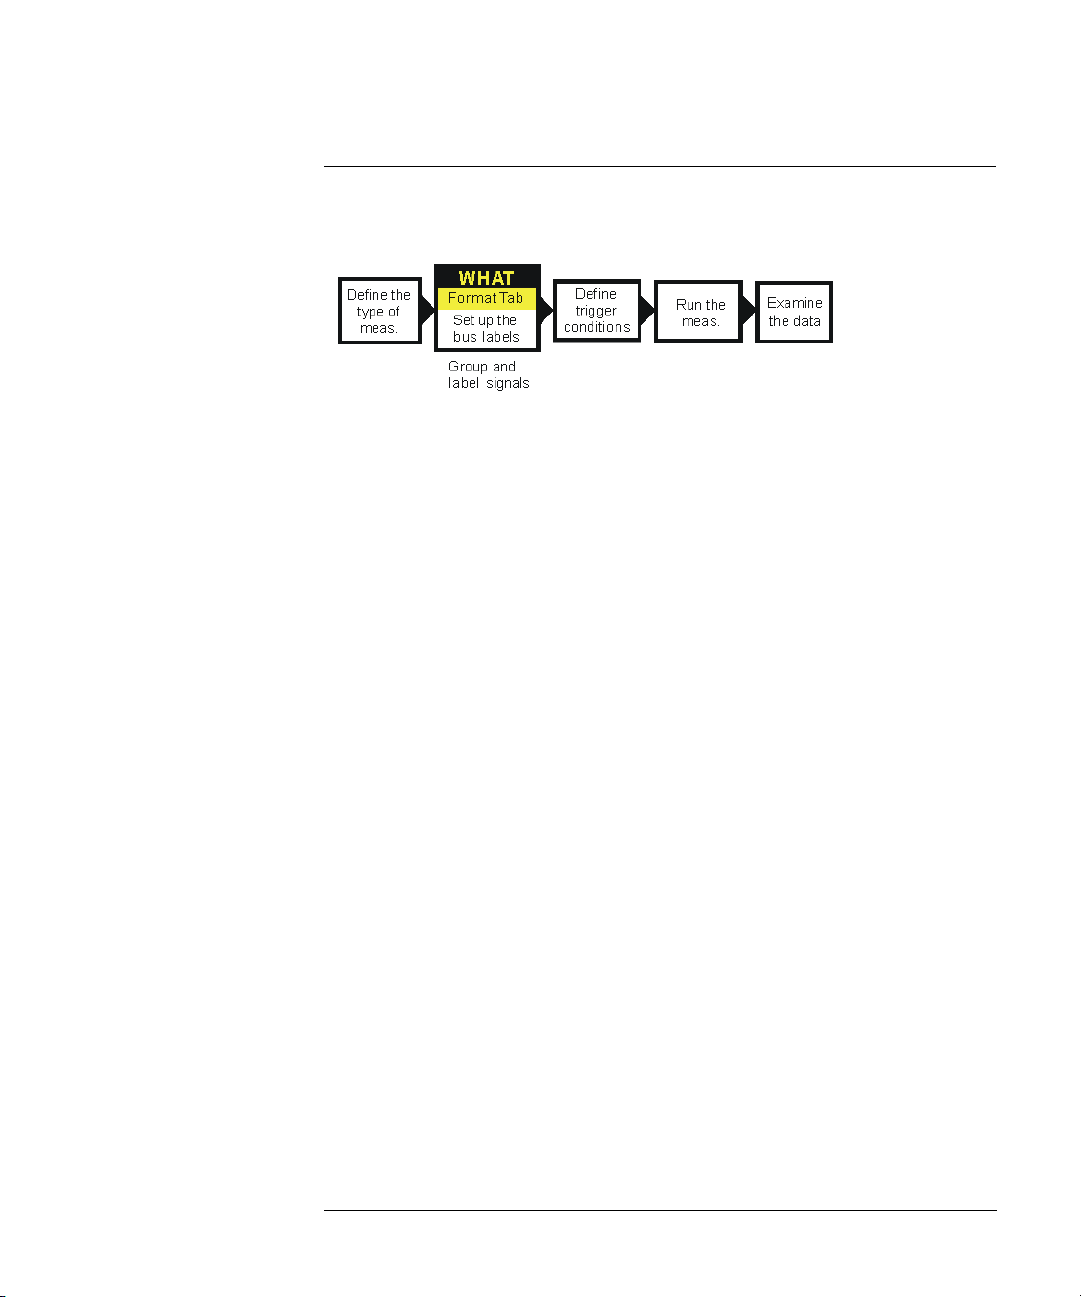
When a logic analyzer probes hundreds of signals in a device under
test, you need to be able to give those channels more meaningful
names than "pod 1, channel 1".
The Format tab is mainly for assigning bus and signal names (from the
device under test), to logic analyzer channels. These names are called
labels. Labels are used when setting up triggers and displaying
captured data.
The Format tab also lets you do things like assign pod pairs to one or
two logic analyzers and specify the logic analyzer threshold voltage.
The Format tab has activity indicators that show whether the signal a
channel is probing is above the threshold voltage (high), below the
threshold voltage (low), or transitioning.
17

Chapter 1: Getting Started
Step 3. Format labels for the probed signals
To assign pods to one or two logic analyzers
A logic analyzer’s pod pairs can be assigned to one or two separate
logic analyzers or they can be left unassigned.
1. In the Format tab, select the Pod Assignment button.
2. In the Pod Assignment dialog, drag a pod pair to the appropriate logic
analyzer.
3. Select the Close button.
To specify threshold voltages
The threshold voltage is the voltage level that a signal must cross
before the logic analyzer recognizes a change in logic levels.
1. In the Format tab, select the button under the pod name.
2. In the Pod threshold dialog, select the desired Standard or User Defined
threshold voltage.
3. Select the Close button.
18

Chapter 1: Getting Started
Step 3. Format labels for the probed signals
To assign names to logic analyzer channels
1. Select a label button, and either:
• Choose the Rename command, enter the label name, and select the OK
button.
• Or, choose the Insert before or Insert after command, enter the label
name, and select the OK button.
2. In the label row, select the button of the pod that contains the channels
you want to assign.
3. Either choose one of the standard label assignments--dots (.) mean the
channel is unassigned, asterisks (*) mean the channel is assigned--or
choose Individual.
If you chose Individual:
a. In the "label - pod" dialog, select the channels you want to assign/
unassign.
b. Select the OK button.
Next: “Step 4. Define the trigger condition” on page 20
19
Chapter 1: Getting Started
Step 4. Define the trigger condition
Step 4. Define the trigger condition
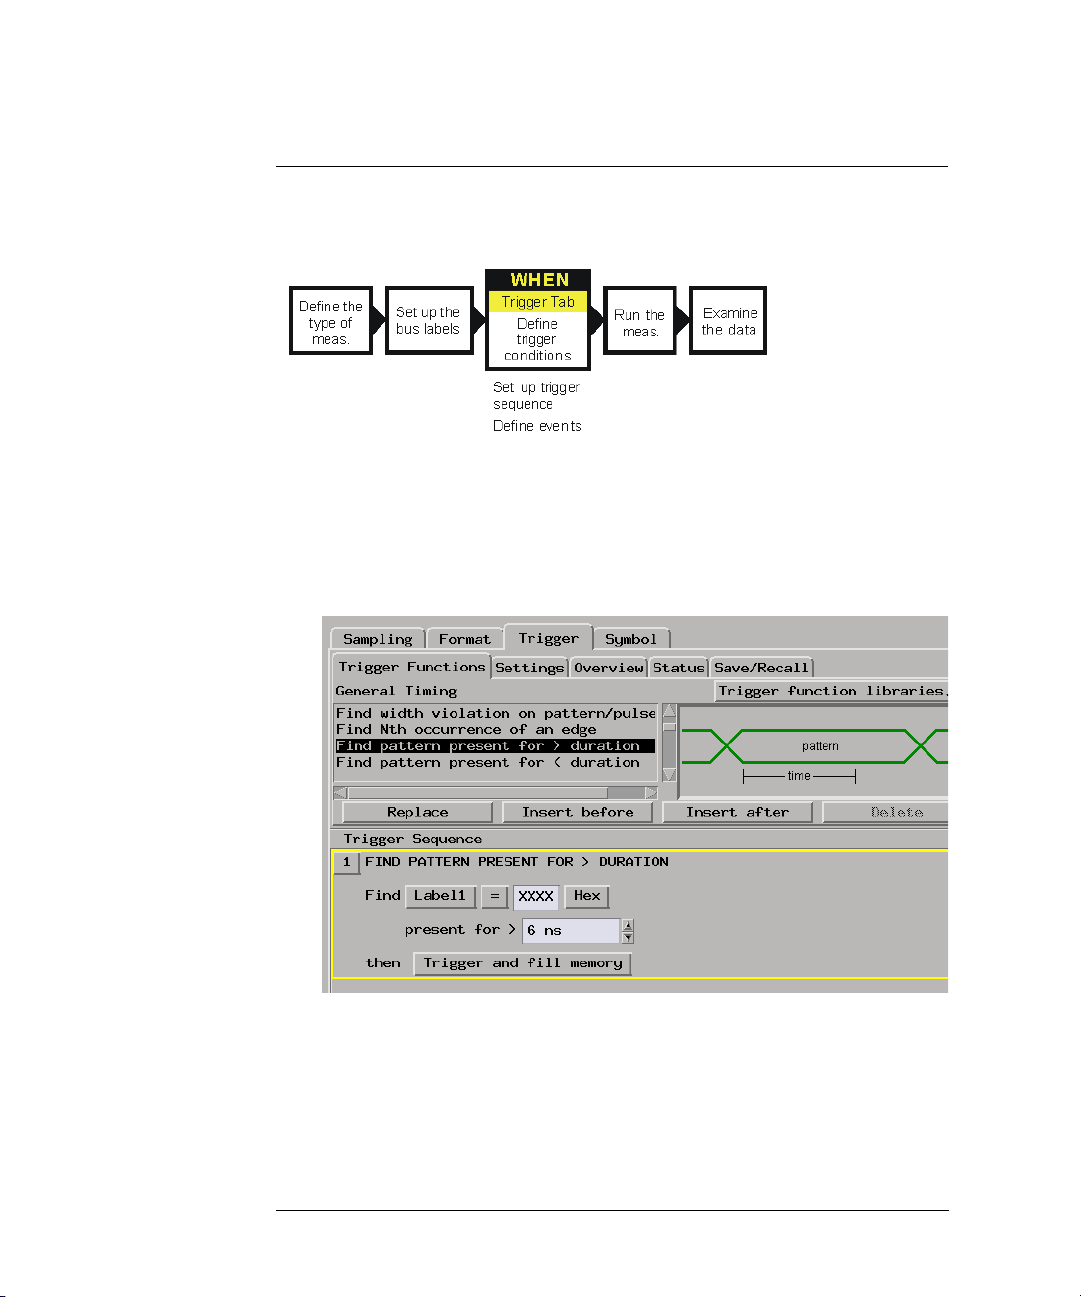
The trigger is the event in the device under test that you want to
capture data around.
1. In the Trigger tab, and in the Trigger Functions subtab, choose the type of
trigger you want to specify, and select the Replace button.
2. In the Trigger Sequence portion of the Trigger tab, select the buttons to
define the label values and/or other conditions you want to trigger on.
Next: “Step 5. Run the measurement” on page 21
20

Chapter 1: Getting Started
Step 5. Run the measurement
Step 5. Run the measurement
Once the trigger condition has been defined, you can run the
measurement.
1. Select the Run Single button .
When you run a measurement, the Stop button becomes available while
the logic analyzer looks for the trigger condition.
Logic analyzers with deep acquisition memory take a noticeable amount of
time to complete a run; however, messages like "Waiting in level 1" may
indicate you need to stop the measurement and refine the trigger
condition.
When the trigger condition is found, logic analyzer acquisition memory is
filled, the captured data is processed to the display tools, and the Run
Single button becomes available again.
Next: “Step 6. Display the captured data” on page 22
21

Chapter 1: Getting Started
Step 6. Display the captured data
Step 6. Display the captured data
Once you have run a measurement and filled the logic analyzer’s
acquisition memory with captured data, you can display it with one of
the display tools.
To open Waveform or Listing displays
Waveform displays are typically used when data is captured with the
timing sampling mode, and Listing displays are used when data is
captured with the state sampling mode.
1. From the Window menu, select your logic analyzer and choose the
Waveform or Listing command.
To add display tools via the Workspace window
1. Select the Workspace button (or from the Window menu, select System
and Workspace).
2. In the Workspace window, scroll down to the Display portion of the tool
icon list.
22

Chapter 1: Getting Started
Step 6. Display the captured data
3. Drag the display tool icon and drop it on the analyzer icon.
4. To open the display tool, select its icon and choose the Display command.
Next: “For More Information...” on page 24
23

Chapter 1: Getting Started
For More Information...
For More Information...
On making
measurements on the
demo counter board:
On connecting the
logic analyzer:
On choosing the
sampling mode:
On formatting labels
for probed signals:
On defining the
trigger condition:
•“Example: Timing measurement on counter board” on page 26
•“Example: State measurement on counter board” on page 28
• Making Basic Measurements for a self-paced tutorial
•“Probing the Device Under Test” on page 33
• Setup Assistant (see the Setup Assistant help volume) (when using
analysis probes).
• Logic Analysis System and Measurement Modules Installation Guide
for probe pinout and circuit diagrams.
•“Choosing the Sampling Mode” on page 36
•“The Sampling Tab” on page 111
•“Formatting Labels for Logic Analyzer Probes” on page 54
•“The Format Tab” on page 115
•“Understanding Logic Analyzer Triggering” on page 186
•“Setting Up Triggers and Running Measurements” on page 61
•“The Trig ger Tab” on page 140
On running
measurements:
On displaying
captured data:
•“Running Measurements” on page 82
•“Displaying Captured Data” on page 85
• Using the Waveform Display Tool (see the Waveform Display Tool help
volume)
• Using the Listing Display Tool (see the Listing Display Tool help volume)
• Working with Markers (see the Markers help volume)
• Using the Chart Display Tool (see the Chart Display Tool help volume)
• Using the Distribution Display Tool (see the Distribution Display Tool
24

Chapter 1: Getting Started
For More Information...
help volume)
• Using the Compare Analysis Tool (see the Compare Tool help volume)
25

Chapter 1: Getting Started
Example: Timing measurement on counter board
Example: Timing measurement on counter
board
This example uses the demo counter board that is supplied with the
Making Basic Measurements kit as the device under test. The kit is
supplied with every logic analysis system, or can be ordered from your
Agilent Technologies Sales Office.
To connect the logic analyzer to the device under test
1. Connect Pod 1 of the logic analyzer to J1 on the demo counter board.
The demo counter board has built-in terminations and header connectors.
To choose the sampling mode
1. In the Sampling tab, choose Timing Mo de.
2. Enter a sample period of 3.0 ns.
To format labels for the probed signals
1. In the Format tab, select the button under the pod 1.
2. In the Pod threshold dialog, select TTL; then, select the Close button.
3. Select a label button.
4. Choose the Rename command, enter the label name "TCOUNT", and
select the OK button.
5. In the label row, select the button under pod 1.
6. Choose the "........********" standard label assignment to assign the lower 8
bits of pod 1 to the "TCOUNT" label.
To define the trigger condition
1. In the Trigger tab, and in the Trigger Functions subtab, choose the "Find
edge" trigger function, and select the Replace button.
2. In the Trigger Sequence portion of the Trigger tab, select the Edge button
and use the Specify Glitch/Edge dialog to specify the rising edge of bit 7
(and all other bits as "don’t cares").
26

Example: Timing measurement on counter board
To run the measurement
1. Select the Run Single button.
To display the captured data
1. From the Window menu, select your logic analyzer and choose the
Waveform command.
See Also “For More Information...” on page 24
Chapter 1: Getting Started
27

Chapter 1: Getting Started
Example: State measurement on counter board
Example: State measurement on counter board
This example uses the demo counter board that is supplied with the
Making Basic Measurements kit as the device under test. The kit is
supplied with every logic analysis system, or can be ordered from your
Agilent Technologies Sales Office.
To connect the logic analyzer to the device under test
1. Connect Pod 1 of the logic analyzer to J1 on the demo counter board.
The demo counter board has built-in terminations and header connectors.
To choose the sampling mode
1. In the Sampling tab, choose State Mode.
2. In the Clock Setup, using the Master only mode, specify the rising edge of
the J clock as the sampling clock.
To format labels for the probed signals
1. In the Format tab, select the button under the pod 1.
2. In the Pod threshold dialog, select TTL; then, select the Close button.
3. Select a label button.
4. Choose the Rename command, enter the label name "SCOUNT", and
select the OK button.
5. In the label row, select the button under pod 1.
6. Choose the "........********" standard label assignment to assign the lower 8
bits of pod 1 to the "SCOUNT" label.
To define the trigger condition
1. In the Trigger tab, and in the Trigger Functions subtab, choose the "Find
pattern n times" trigger function, and select the Replace button.
2. In the Trigger Sequence portion of the Trigger tab, enter "15" in the
occurrence count field, and enter enter "FX" in the label value field.
28

Example: State measurement on counter board
To run the measurement
1. Select the Run Single button.
To display the captured data
1. From the Window menu, select your logic analyzer and choose the Listing
command.
See Also “For More Information...” on page 24
Chapter 1: Getting Started
29

Chapter 1: Getting Started
Example: State measurement on counter board
30
 Loading...