

Page 1
Keysight X-Series Signal Analyzers
This manual provides documentation for the following Analyzers:
PXA Signal Analyzer N9030A MXA Signal Analyzer N9020A
EXA Signal Analyzer N9010A CXA Signal Analyzer N9000A
MXE EMI Receiver N9038A
Notice: This document contains references to Agilent.
Please note that Agilent’s Test and Measurement business
has become Keysight Technologies. For more information,
go to www.keysight.com.
N9063A &
W9063A
Analog Demod
Measurement
Application
Measurement
Guide
Page 2

Notices
© Keysight Technologies, Inc.
2008-2014
No part of this manual may be
reproduced in any form or by any
means (including electronic storage
and retrieval or translation into a
foreign language) without prior
agreement and written consent from
Keysight Technologies, Inc. as
governed by United States and
international copyright laws.
Trademark Acknowledgements
Manual Part Number
N9063-90006
Print Date
August 2014
Supersedes: February 2012
Printed in USA
Keysight Technologies Inc.
1400 Fountaingrove Parkway
Santa Rosa, CA 95403
Warranty
THE MATERIAL CONTAINED IN THIS
DOCUMENT IS PROVIDED “AS IS,”
AND IS SUBJECT TO BEING
CHANGED, WITHOUT NOTICE, IN
FUTURE EDITIONS. FURTHER, TO THE
MAXIMUM EXTENT PERMITTED BY
APPLICABLE LAW, KEYSIGHT
DISCLAIMS ALL WARRANTIES,
EITHER EXPRESS OR IMPLIED WITH
REGARD TO THIS MANUAL AND ANY
INFORMATION CONTAINED HEREIN,
INCLUDING BUT NOT LIMITED TO THE
IMPLIED WARRANTIES OF
MERCHANTABILITY AND FITNESS
FOR A PARTICULAR PURPOSE.
KEYSIGHT SHALL NOT BE LIABLE FOR
ERRORS OR FOR INCIDENTAL OR
CONSEQUENTIAL DAMAGES IN
CONNECTION WITH THE
FURNISHING, USE, OR
PERFORMANCE OF THIS DOCUMENT
OR ANY INFORMATION CONTAINED
HEREIN. SHOULD KEYSIGHT AND THE
USER HAVE A SEPARATE WRITTEN
AGREEMENT WITH WARRANTY
TERMS COVERING THE MATERIAL IN
THIS DOCUMENT THAT CONFLICT
WITH THESE TERMS, THE
WARRANTY TERMS IN THE SEPARATE
AGREEMENT WILL CONTROL.
Technology Licenses
The hardware and/or software
described in this document are
furnished under a license and may be
used or copied only in accordance
with the terms of such license.
If software is for use in the
performance of a U.S. Government
prime contract or subcontract,
Software is delivered and licensed as
“Commercial computer software” as
defined in DFAR 252.227-7014 (June
1995), or as a “commercial item” as
defined in FAR 2.101(a) or as
“Restricted computer software” as
defined in FAR 52.227-19 (June 1987)
or any equivalent agency regulation or
contract clause. Use, duplication or
disclosure of Software is subject to
Keysight Technologies’ standard
commercial license terms, and
non-DOD Departments and Agencies
of the U.S. Government will receive no
greater than Restricted Rights as
defined in FAR 52.227-19(c)(1-2)
(June 1987). U.S. Government users
will receive no greater than Limited
Rights as defined in FAR 52.227-14
(June 1987) or DFAR 252.227-7015
(b)(2) (November 1995), as applicable
in any technical data.
Safety Notices
CAUTION
A CAUTION notice denotes a hazard. It
calls attention to an operating
procedure, practice, or the like that, if
not correctly performed or adhered to,
could result in damage to the product
or loss of important data. Do not
proceed beyond a CAUTION notice
until the indicated conditions are fully
understood and met.
WARNING
A WARNING notice denotes a hazard.
It calls attention to an operating
procedure, practice, or the like that, if
not correctly performed or adhered to,
could result in personal injury or
death. Do not proceed beyond a
WARNING notice until the indicated
conditions are fully understood and
met.
Restricted Rights Legend
Page 3

Where to Find the Latest Information
Documentation is updated periodically. For the latest information about these products, including instrument software
upgrades, application information, and product information, browse to one of the following URLs, according to the name of
your product:
http://www.keysight.com/find/pxa
http://www.keysight.com/find/mxa
http://www.keysight.com/find/exa
http://www.keysight.com/find/cxa
http://www.keysight.com/find/mxe
To receive the latest updates by email, subscribe to Keysight Email Updates at the following URL:
http://www.keysight.com/find/emailupdates
Information on preventing analyzer damage can be found at:
http://www.keysight.com/find/tips
Is your product software up-to-date?
Periodically, Keysight releases software updates to fix known defects and incorporate product enhancements. To search for
software updates for your product, go to the Keysight Technical Support website at:
http://www.keysight.com/find/techsupport
3
Page 4

4
Page 5

Table of Contents
1 Demodulating AM, FM, ΦM, FM Stereo/RDS Signals
Setting Up and Making a Measurement 8
Making the Initial Signal Connection 8
Using Analyzer Mode and Measurement Presets 8
The 3 Steps to Set Up and Make Measurements 9
Demodulating an AM Signal 11
Demodulating an FM Signal 12
Demodulating an FM Stereo/RDS Signal 13
Measuring L Only FM Stereo/RDS Signals 13
Measuring L=R FM Stereo/RDS Signals 19
Contents
2Concepts
AM Concepts 26
FM Concepts 28
FM Stereo/RDS Concepts 30
FM Stereo 30
RDS/RBDS 30
Demodulating an AM Signal Using the Analyzer as a Fixed Tuned Receiver
(Time-Domain) 32
Demodulating an FM Signal Using the Analyzer as a Fixed Tuned Receiver
(Time-Domain) 33
Demodulating an FM Stereo/RDS Signal Using the Analyzer as a Fixed Tuned
Receiver (Time-Domain) 34
Modulation Distortion Measurement Concepts 35
Purpose 35
Measurement Technique 35
Modulation SINAD Measurement Concepts 36
Purpose 36
Measurement Technique 36
5
Page 6

Contents
6
Page 7

Demodulating AM, FM, ΦM, FM Stereo/RDS Signals
1 Demodulating AM, FM, ΦM, FM Stereo/RDS
Signals
The Analog Demod measurement application provides the capability of
demodulating AM (amplitude modulated), FM (frequency modulated), ΦM (phase
modulated), and FM Stereo/RDS (Radio Data System) signals. These measurements
provide functionalities that can generally be categorized as follows:
• Demodulating a modulated carrier and playing the modulating signal over a
speaker (sometimes referred to as tune and listen)
• Displaying demodulated signals in both time and frequency domains
• Displaying modulation metrics
• Displaying the RDS information in FM Stereo/RDS signals
The following topics can be found in this section:
“Setting Up and Making a Measurement” on page 8
“Demodulating an AM Signal” on page 11
“Demodulating an FM Signal” on page 12
“Demodulating an FM Stereo/RDS Signal” on page 13
7
Page 8
Demodulating AM, FM, ΦM, FM Stereo/RDS Signals
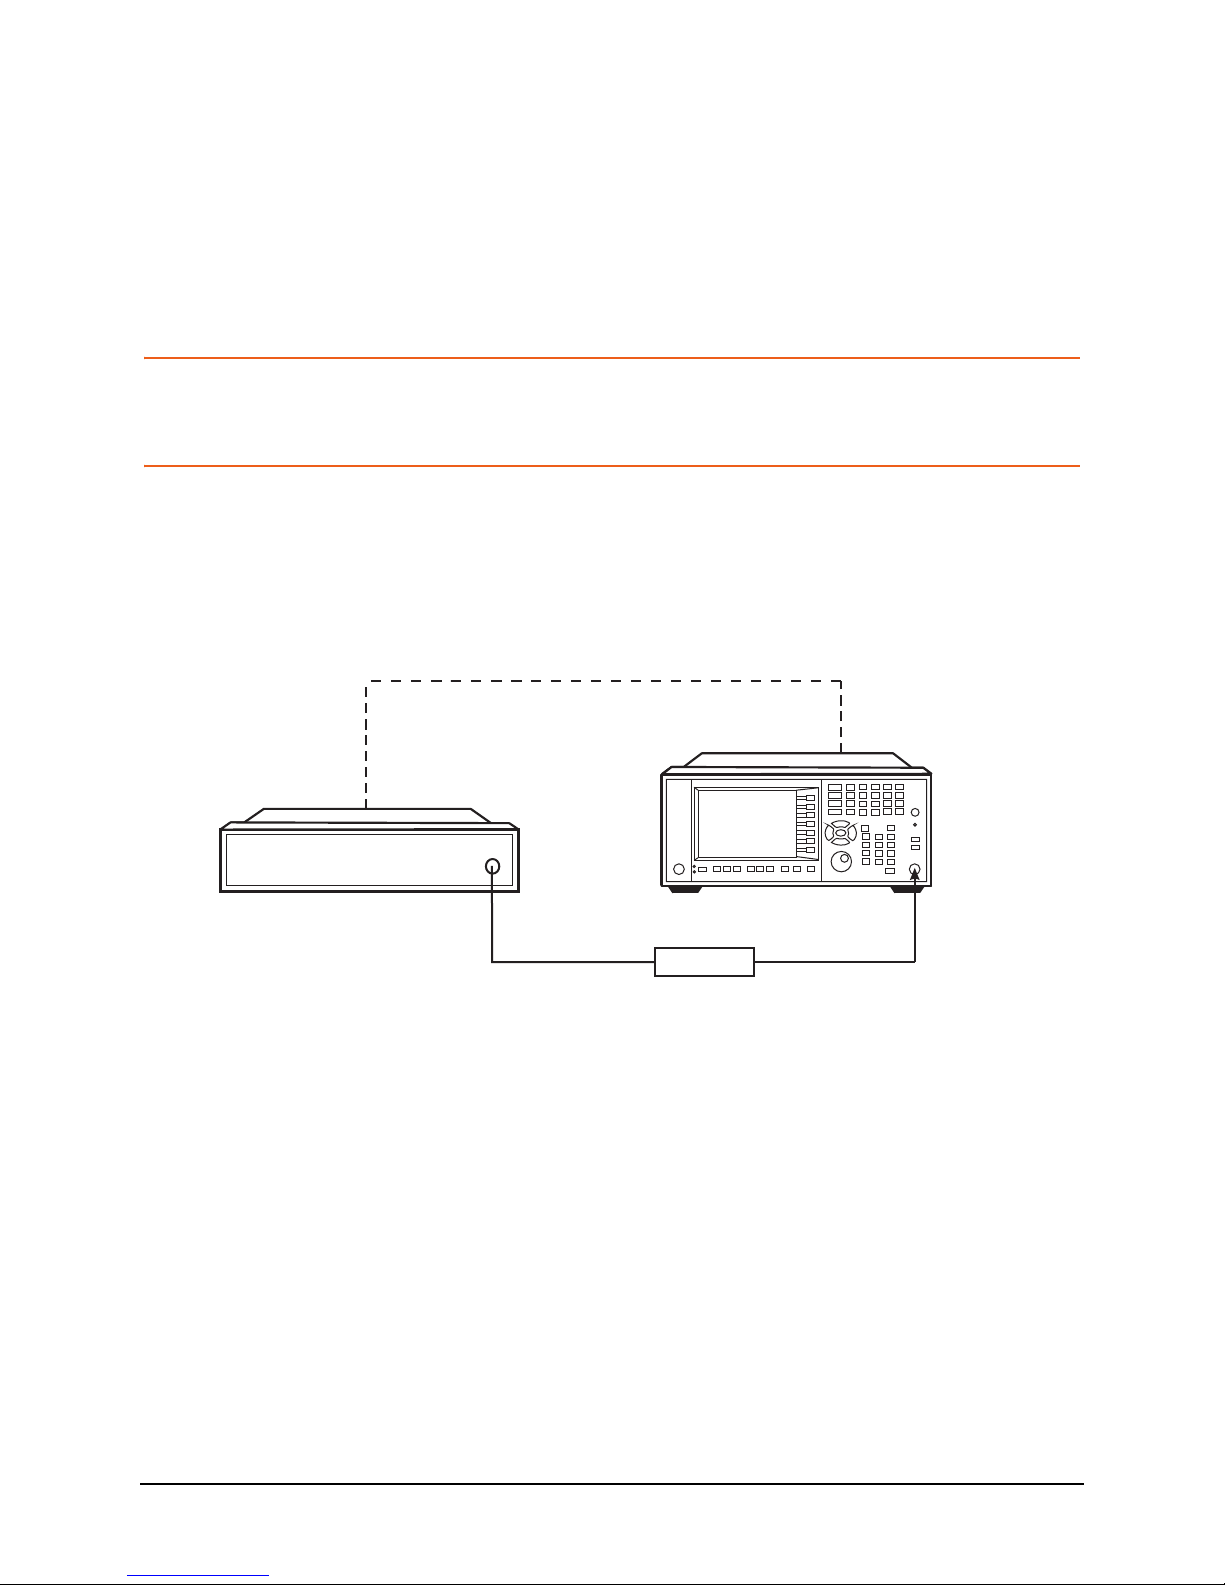
X-Series Signal Analyzer
EXT REF IN
Optional
RF OUTPUT
Attenuator
RF INPUT
AM, FM, M,
or FM Stereo/RDS Transmitter
Φ
EXT REF OUT
Setting Up and Making a Measurement
Setting Up and Making a Measurement
Making the Initial Signal Connection
Set the AM, FM, ΦM, or FM Stereo/RDS transmitter under test to transmit the RF
power. Connect the transmitting signal to the signal analyzer as below.
CAUTION Before connecting a signal to the analyzer, make sure the analyz er ca n sa fely ac c ep t
the signal level provided. The signal level limits are marked next to the RF Input
connector on the front panel.
1. Connect the output AM, FM, ΦM, or FM Stereo/RDS transmitter to the RF input
port of the signal analyzer using appropriate cables, attenuators, and adapters.
2. (Optional) If there is a frequency reference port on the transmitter, connect it to
the EXT REF IN port on the signal analyzer for frequency synchronization.
Figure 1-1 AM, FM,
After making the connection, see the Input/Output key menu for details on
selecting input ports and the AMPTD Y Scale menu for details on setting internal
attenuation to prevent overloading the analyzer.
Using Analyzer Mode and Measurement Presets
T o set your current measurement mode to a known factory default state, press Mode
Preset. This initializes the analyzer by returning the mode setup and all of the
measurement setups in the mode to the factory default parameters.
Φ
M, or FM Stereo/RDS Measurement System
To preset the parameters that are specific to an active, selected measurement, press
Meas Setup, Meas Preset. This returns all the measurement setup parameters to the
factory defaults, but only for the currently selected measurement.
8
Page 9

Demodulating AM, FM, ΦM, FM Stereo/RDS Signals
The 3 Steps to Set Up and Make Measurements
All measurements can be set up using the following three steps. The sequence starts
at the Mode level, is followed by the Measurement level, then finally, the result
displays may be adjusted.
Table 1-1 The 3 Steps to Set Up and Make a Measurement
Step Action Notes
Setting Up and Making a Measurement
1 Select and Set Up the
Mode
2 Select and Set Up the
Measurement
3 Select and Set Up a
View of the Results
a. Press Mode.
b. Press Analog Demod.
c. Press Mode Preset.
d. Press Mode Setup.
a. Press Meas.
b. Select the specific measurement
to be performed.
c. Press Meas Setup.
Press View/Display. Select a
display format for the current
measurement data.
All licensed, installed modes
available are shown under the Mode
key.
Using Mode Setup, make any
required adjustments to the mode
settings. These settings will apply to
all measurements in the mode.
The measurement begins as soon as
any required trigger conditions are
met. The resulting data is shown on
the display or is available for export.
Use Meas Setup to make any
required adjustment to the selected
measurement settings. The settings
only apply to this measurement.
Depending on the mode and
measurement selected, other
graphical and tabular data
presentations may be available.
X-Scale and Y-Scale adjustments
may also be made now.
NOTE A setting may be reset at any time, and will be in effect on the next measurement
cycle or view.
Table 1-2 Main Keys and Functions for Making Measurements
Step Primary Key Setup Keys Related Keys
1 Select and set up a mode. Mode Mode Setup,
2 Select and set up a
measurement.
System
FREQ Channel
Meas Meas Setup Sweep/Control,
Restart, Single, Cont
9
Page 10

Demodulating AM, FM, ΦM, FM Stereo/RDS Signals
Setting Up and Making a Measurement
Table 1-2 Main Keys and Functions for Making Measurements
Step Primary Key Setup Keys Related Keys
3 Select and set up a view of the
results.
View/Display SPAN X Scale ,
AMPTD Y Scale
Peak Search,
Quick Save, Save,
Recall, File, Print
NOTE If you encounter a problem, or get an error message, see the guide “Instrument
Messages”, which is provided on the Documentation CD ROM, and in the
instrument here:
C:\Program Files\Keysight\SignalAnalysis\Infrastructure\Help\bookfiles.
10
Page 11
Demodulating AM, FM, ΦM, FM Stereo/RDS Signals
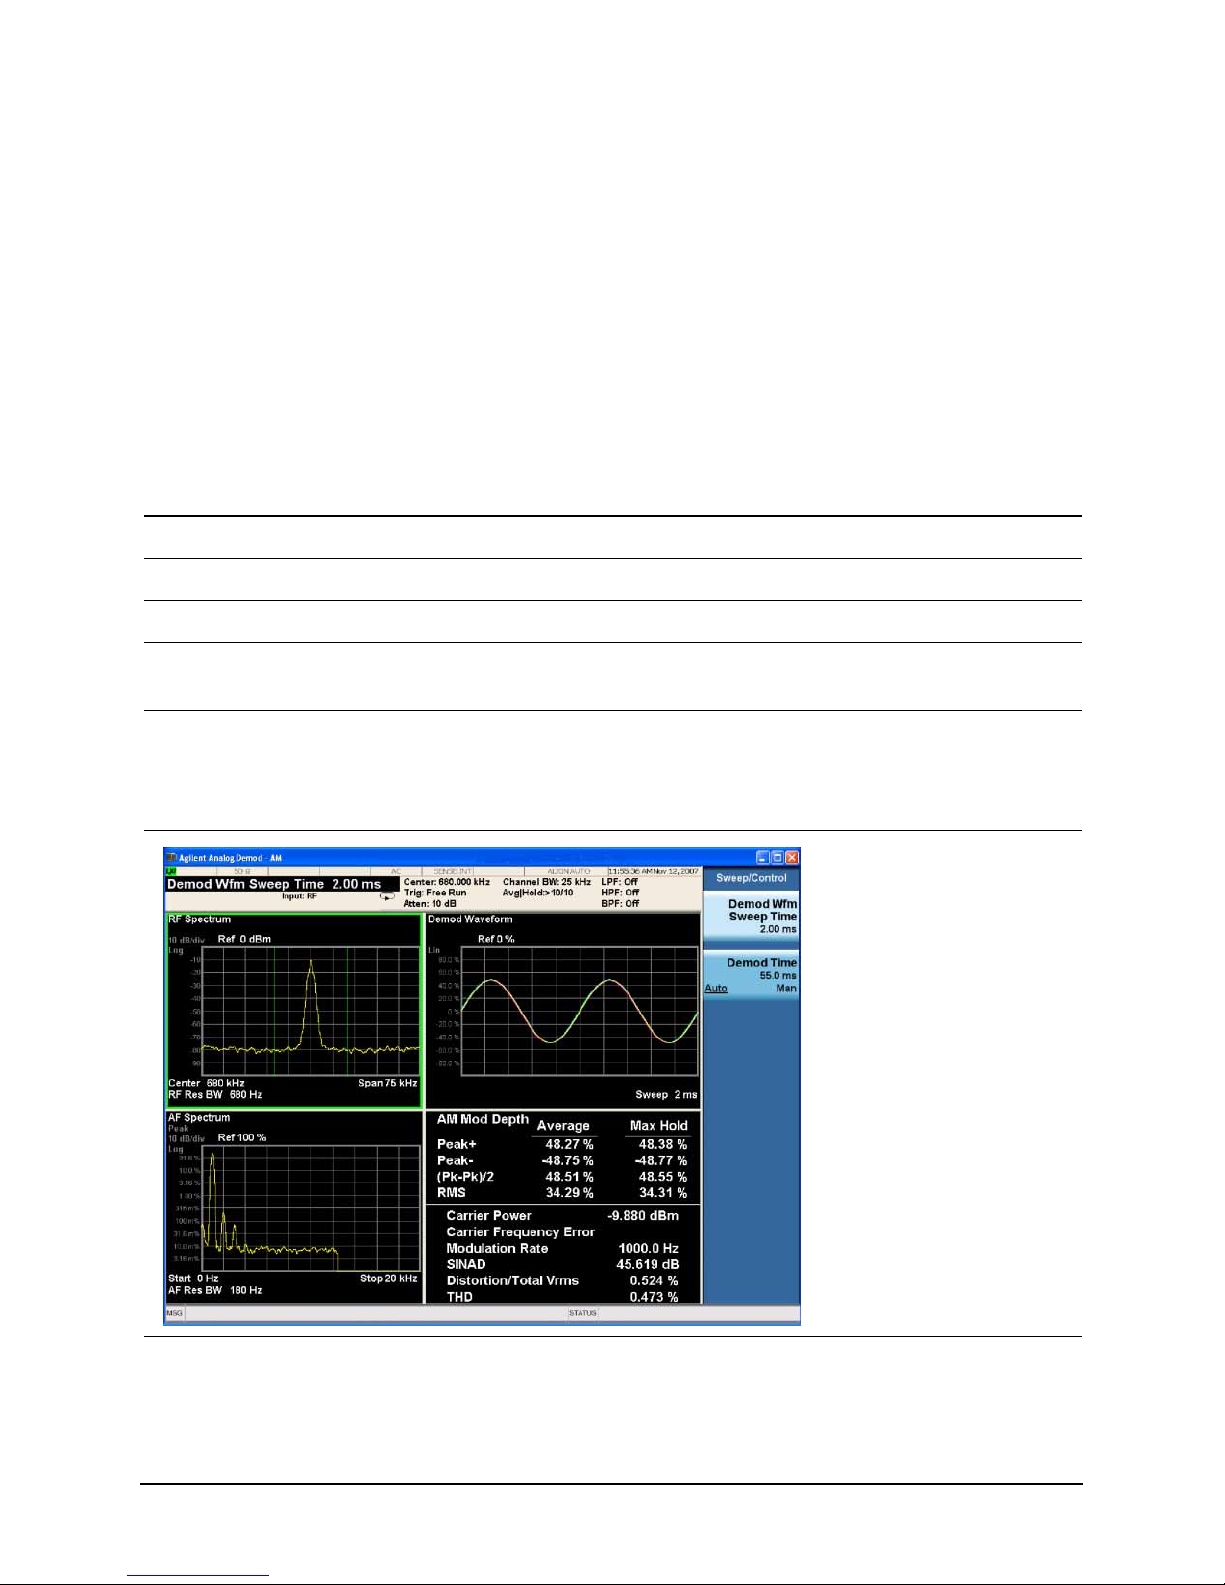
Demodulating an AM Signal
This section demonstrates how to demodulate and listen to an AM signal. You can
tune to an AM signal and view the results of the detector output displayed in the
quad-view window or in single-window format.
Alternatively, the demodulated signal is also available as an audio output (to the
speaker or headphone jack) and as video output (on the rear panel).
The signal under test is a 680 kHz signal with AM depth of 50% and AM rate of 1
kHz. Note that if you are using a broadcast AM signal in the United States, for
example, the AM channels are broadcasting between 550 kHz and 1650 kHz.
Step Action Notes
1 Select Analog Demod mode. Press Mode, Analog Demod.
2 Preset the mode. Press Mode Preset.
3 Select AM measurement. Press Meas, AM.
Demodulating an AM Signal
4 Set the center frequency of
the AM signal.
5 Adjust the sweep time and
view the measurement
results as in the figure
below.
Press FREQ Channel, Center
Freq, 680, kHz.
Press Sweep/Control, Demod
Wfm Sweep Time, 2, ms.
6 Listen to the demodulated
AM signal.
Press Meas Setup, Demod to
Speaker.
11
You may need to adjust the volume
as necessary.
Page 12

Demodulating AM, FM, ΦM, FM Stereo/RDS Signals
Demodulating an FM Signal
Demodulating an FM Signal
This section demonstrates how to demodulate and listen to an FM signal. You can
tune to an FM signal and view the results of the detector output displayed in the
quad-view window or single-window format.
Alternatively, the demodulated signal is also available as an audio output (to the
speaker or headphone jack) and as video output (on the rear panel).
The signal under test is a signal at 300 MHz with FM deviation of 10 kHz and FM
rate of 1 kHz. Note that if you are using a broadcast FM signal in the United States,
for example, the FM channels are broadcasting between 87.7 MHz and 107.7 MHz.
Step Action Notes
1 Select Analog Demod
Press Mode, Analog Demod.
mode.
2 Preset the mode. Press Mode Preset.
3 Select FM measurement. Press Meas, FM.
4 Set the center frequency to
the center of the FM signal.
5 Adjust the sweep time and
view the measurement
Press FREQ Channel, Center
Freq, 300, MHz.
Press Sweep, Demod Wfm
Sweep Time, 2, ms.
result as in the figure below .
6 Listen to the demodulated
FM signal.
Press Meas Setup, Demod to
Speaker.
12
You may need to adjust the
volume as necessary.
Page 13

Demodulating an FM Stereo/RDS Signal
This section demonstrates how to demodulate and listen to an FM Stereo signal and
view key messages carried in RDS (Radio Data System). You can tune to an FM
Stereo/RDS signal and view the measurement results of the multiplexed signal, the
mono signal, the stereo signal, the left and right channel of the stereo signal, and the
RDS messages in separate views.
Alternatively, the demodulated FM Stereo signal is also available as an audio output
(to the speaker or headphone jack).
Measurement procedures for two typical FM Stereo/RDS signals are introduced
here:
“Measuring L Only FM Stereo/RDS Signals” on page 13
“Measuring L=R FM Stereo/RDS Signals” on page 19
Measuring L Only FM Stereo/RDS Signals
The parameters of the signal under test are as below.
Demodulating AM, FM, ΦM, FM Stereo/RDS Signals
Demodulating an FM Stereo/RDS Signal
FM reference deviation: 75 kHz
Pilot deviation: 10%
Pilot frequency: 19 kHz
Stereo frequency: 38 kHz
Left only tone: 1.0 kHz
RDS deviation: 6%
RDS frequency: 57 kHz
Step Action Notes
1 Select Analog Demod
mode.
2 Preset the mode. Press Mode Preset.
3 Select FM Stereo/RDS
measurement.
4 Set the center frequency to
the center of the signal and
set the AF stop frequency.
Press Mode, Analog Demod.
Press Meas, FM Stereo/RDS.
Press FREQ Channel, Center
Freq, 98, MHz.
Press FREQ Channel, AF Stop
Freq, 65, kHz.
AF start frequency and AF stop
frequency settings determine the
span of the X axis in AF Spectrum
window in MPX, Mono, Stereo, Left,
and Right views.
5 Set the FM reference
deviation.
Press Meas Setup, Advanced,
Ref Deviation, 75, kHz.
13
Page 14

Demodulating AM, FM, ΦM, FM Stereo/RDS Signals
Demodulating an FM Stereo/RDS Signal
Step Action Notes
6 View the measurement
result of the multiplexed
signal.
Press View/Display, MPX. To display only the current trace in
the Demod Waveform window,
press Meas Setup and toggle
Avg/Hold Num to Off.
The figure below shows measurement results of the multiplexed signal, including mono part, stereo part,
RDS/RBDS, and pilots. There are four windows:
• RF Spectrum window (top left) displays the RF spectrum of the multiplexed signal.
• Demod Waveform window (top right) displays the baseband modulating signal in time domain. There are
four traces in this window: maximum trace (in cyan), minimum trace (in magenta), average trace (in green),
and current trace (in yellow).
• AF Spectrum window (bottom left) displays the modulating signal in frequency domain.
• Metric window (bottom right) displays the numeric measurement results.
7 View the mono part of the
multiplexed signal which
corresponds to L+R.
Press View/Display, Mono.
14
Page 15

Demodulating AM, FM, ΦM, FM Stereo/RDS Signals
Demodulating an FM Stereo/RDS Signal
Step Action Notes
8 View the stereo part of the
multiplexed signal which
corresponds to L-R.
Press View/Display, Stereo.
9 (Optional) Set the baseband
filters to improve the
measurement results.
Press Meas Setup, Filters. The highpass filter, lowpass filter,
and bandpass filter can be
combined as you like.
15
Page 16

Demodulating AM, FM, ΦM, FM Stereo/RDS Signals
Demodulating an FM Stereo/RDS Signal
Step Action Notes
10If pre-emphasis is used in
the signal under test, set to
use de-emphasis in the
signal analyzer.
11 View measurement results
of the left channel.
Press Meas Setup, Filters,
De-Emphasis and choose the
appropriate de-emphasis filter.
Press View/Display, Left.
12View measurement results
of the right channel.
Press View/Display, Right. The audio in the test signal is an
L-only tone, so in the results of the
right channel, the demod waveform
is almost zero.
16
Page 17

Demodulating AM, FM, ΦM, FM Stereo/RDS Signals
Demodulating an FM Stereo/RDS Signal
Step Action Notes
13View the RDS/RBDS
results.
Press View/Display,
RDS/RBDS.
The figure below displays the BLER result and the information bits in the upper part and key RDS messages
like basic tuning and switch information, rad io text, and so on in the lower part. For more information, refer to
“Basic Structure of RDS” on page 31 and “BLER” on page 31.
17
Page 18

Demodulating AM, FM, ΦM, FM Stereo/RDS Signals
Demodulating an FM Stereo/RDS Signal
Step Action Notes
14View a summary of the
numeric measurement
Press View/Display, Result
Metrics.
results.
NOTE In this view, the left to right separation result is displayed as "Left to Right" and the mono to stereo
crosstalk is displayed as "Mono to Stereo". Normally, left to right separation test is taken when the
audio signal under test is L only or R only; mono to stereo crosstalk test is taken when the audio
signal under test is L=R or L=-R.
15Listen to the demodulated
FM stereo signal.
Press Meas Setup, Demod to
Speaker.
18
You may need to adjust the volume
as necessary.
Page 19

Demodulating AM, FM, ΦM, FM Stereo/RDS Signals
Demodulating an FM Stereo/RDS Signal
Measuring L=R FM Stereo/RDS Signals
The parameters of the signal under test are as below.
FM reference deviation: 75 kHz
Pilot deviation: 10%
Pilot frequency: 19 kHz
Stereo frequency: 38 kHz
Left = Right tone: 1.0 kHz
RDS deviation: 6%
RDS frequency: 57 kHz
Step Action Notes
1 Select Analog Demod
Press Mode, Analog Demod.
mode.
2 Preset the mode. Press Mode Preset.
3 Select FM Stereo/RDS
Press Meas, FM Stereo/RDS.
measurement.
4 Set the center frequency to
the center of the signal and
set the AF stop frequency.
Press FREQ Channel, Center
Freq, 98, MHz.
Press FREQ Channel, AF Stop
Freq, 65, kHz.
5 Set the FM reference
deviation.
6 View the measurement
Press Meas Setup, Advanced,
Ref Deviation, 75, kHz.
Press View/Display, MPX. To display only the current trace in
result of the multiplexed
signal.
AF start frequency and AF stop
frequency settings determine the
span of the X axis in AF Spectrum
window in MPX, Mono, Stereo, Left,
and Right views.
the Demod Waveform window,
press Meas Setup and toggle
Avg/Hold Num to Off.
19
Page 20

Demodulating AM, FM, ΦM, FM Stereo/RDS Signals
Demodulating an FM Stereo/RDS Signal
Step Action Notes
The figure below shows measurement results of the multiplexed signal, including mono part, stereo part,
RDS/RBDS, and pilots. There are four windows:
• RF Spectrum window (top left) displays the RF spectrum of the multiplexed signal.
• Demod Waveform window (top right) displays the baseband modulating signal in time domain. There are
four traces in this window: maximum trace (in cyan), minimum trace (in magenta), average trace (in green),
and current trace (in yellow).
• AF Spectrum window (bottom left) displays the modulating signal in frequency domain.
• Metric window (bottom right) displays the numeric measurement results.
7 View the mono part of the
multiplexed signal which
corresponds to L+R.
Press View/Display, Mono.
20
Page 21

Demodulating AM, FM, ΦM, FM Stereo/RDS Signals
Demodulating an FM Stereo/RDS Signal
Step Action Notes
8 View the stereo part of the
multiplexed signal which
corresponds to L- R.
Press View/Display, Stereo.
9 (Optional) Set the baseband
filters to improve the
measurement results.
Press Meas Setup, Filters. The highpass filter, lowpass filter,
and bandpass filter can be
combined as you like.
21
Page 22

Demodulating AM, FM, ΦM, FM Stereo/RDS Signals
Demodulating an FM Stereo/RDS Signal
Step Action Notes
10If pre-emphasis is used in
the signal under test, set to
use de-emphasis in the
signal analyzer.
11 View the measurement
results of the left channel.
Press Meas Setup, Filters,
De-Emphasis and choose the
appropriate de-emphasis filter.
Press View/Display, Left. In this test case, the left channel
equals to the right channel.
12View the RDS/RBDS
results.
Press View/Display,
RDS/RBDS.
22
Page 23

Demodulating AM, FM, ΦM, FM Stereo/RDS Signals
Demodulating an FM Stereo/RDS Signal
Step Action Notes
The figure below displays the BLER result and the information bits in the upper part and key RDS messages
like basic tuning and switch information, rad io text, and so on in the lower part. For more information, refer to
“Basic Structure of RDS” on page 31 and “BLER” on page 31.
13View a summary of the
numeric measurement
results.
Press View/Display, Result
Metrics.
23
Page 24

Demodulating AM, FM, ΦM, FM Stereo/RDS Signals
Demodulating an FM Stereo/RDS Signal
Step Action Notes
NOTE In this view, the left to right separation result is displayed as "Left to Right" and the mono to stereo
crosstalk is displayed as "Mono to Stereo". Normally, left to right separation test is taken when the
audio signal under test is L only or R only; mono to stereo crosstalk test is taken when the audio
signal under test is L=R or L=-R.
14Listen to the demodulated
FM stereo signal.
Press Meas Setup, Demod to
Speaker.
You may need to adjust the volume
as necessary.
24
Page 25

2Concepts
The following topics can be found in this section:
AM Concepts on page 26
FM Concepts on page 28
FM Stereo/RDS Concepts on page 30
Demodulating an AM Signal Using the Analyzer as a Fixed Tuned Receiver
(Time-Domain) on page 32
Concepts
Demodulating an FM Signal Using the Analyzer as a Fixed Tuned Receiver
(Time-Domain) on page 33
“Demodulating an FM Stereo/RDS Signal Using the Analyzer as a Fixed
Tuned Receiver (Time-Domain)” on page 34
Modulation Distortion Measurement Concepts on page 35
Modulation SINAD Measurement Concepts on page 36
25
Page 26

Concepts
m =
E
maxEc
–
E
c
-----------------------
=
E
maxEmin
–
E
maxEmin
+
----------------------------
=
E
USB
E
LSB
+
E
c
-----------------------------
=
2E
SB
E
c
-----------
AM Concepts
AM Concepts
Figure 2-1 AM waveform
In AM (Amplitude Modulation), the instantaneous amplitude of the modulated
carrier signal changed in proportion to the instantaneous amplitude of the
information signal.
Figure 2-2 Calculation AM index in time and frequency domain
The modulation index "m" represents the amount of the modulation or the degree to
which the information signal modulates the carrier signal. The index for an AM
signal can be calculated from the amplitudes of the carrier and either of the
sidebands by the equation:
Equation 2-1
For 100% modulation, the modulation index is 1.0, and the amplitude of each
sideband will be one-half of the carrier amplitude expressed in voltage. On a decibel
power scale, each sideband will thus be 6 dB less than the carrier, or one-fourth the
power of the carrier. Since the carrier power does not change with amplitude
modulation, the total power in the 100% modulated wave is 50% higher than in the
unmodulated carrier. The rel ationship between m and the logarithmic display can be
expressed as:
26
Page 27

Equation 2-2
ESBEc⁄()dB + 6dB = 20 mlog
Concepts
AM Concepts
27
Page 28

Concepts
β = Δfpfm⁄ = Δφ
p
FM Concepts
FM Concepts
Figure 2-3 FM waveform
FM (Frequency Modulation) and PM (Phase Modulation) belong to angle
modulation. In FM, the instantaneous frequency deviation of the modulated carrier
signal changed in proportion to the instantaneous amplitude of the modulating
signal. And in PM, the instantaneous phase deviation of the modulated carrier with
respect to the phase of the unmodulated carrier is directly proportional to the
instantaneous amplitude of the modulating signal.
Equation 2-3
The modulation index for angle modulation, β, is expressed by this equation:
Where Δfp is the peak frequency deviation, fm is the frequency of the modulating
signal, and Δφp is the peak phase deviation.
This expression tells us that the angle modulation index is really a function of phase
deviation, even in the FM case. Also, the definitions for frequency and phase
modulation do not include the modulating frequency. In each case, the modulated
property of the carrier, frequency or phase, deviates in proportion to the
instantaneous amplitude of the modulating signal, regardless of the rate at which the
amplitude changes. However, the frequency of the modulating signal is important in
FM and is included in the expression for the modulating index because it is the ratio
of peak frequency deviation to modulation frequency that equates to peak phase.
Unlike the modulation index for AM, there is no specific limit to the value of β,
since there is no theoretical limit to the phase deviation; thus there is no equivalent of
100% AM. However, in real world systems there are practical limits.
Unlike AM, which is a linear process, angle modulation is nonlinear. This means that
a single sine wave modulating signal, instead of producing only two sidebands,
yields an infinite number of sidebands spaced by the modulating frequency.
28
Page 29

The Bessel function graph shows the amplitudes of the carrier and the sidebands as a
function of modulation index, β. The spectral components, including the carrier,
change their amplitudes as the modulation index varies.
Figure 2-4 Carrier and sideband amplitude for angle-modulated signals
Concepts
FM Concepts
In theory, for distortion-free detection of the modulating signal, all the sidebands
must be transmitted. However, in practice, the sideband amplitudes become
negligibly small beyond a certain frequency offset from the carrier, so the spectrum
of a real-world FM signal is not infinite.
29
Page 30

Concepts
Frequency (kHz)
Mono
signal
L+R
15
19
Pilot
38 57
RDS/RBDS
Stereo signal
L-R
Amplitude
FM Stereo/RDS Concepts
FM Stereo/RDS Concepts
FM stereo is an enhancement of FM by using stereo multiplexing. An FM stereo
signal carries stereophonic programmes in which different contents are transmitted
for L (left) and R (right) audio channels.
RDS (Radio Data System) is the text information such as traffic, weather, and radio
station information carried in FM signals. This information can be displayed on the
screen of the end-user’s device.
Figure 2-5 shows the baseband spectrum of the FM stereo signal including RDS
data.
Figure 2-5 Baseband spectrum of the FM Stereo/RDS signal
FM Stereo
The FM stereo multiplexed signal consists of a mono (L+R) signal, a stereo (L-R)
signal, and a pilot signal.
As shown in Figure 2-5, the mono (L+R) signal occupies the lower part of the
baseband spectrum (50 Hz ~ 15 kHz) to keep backward compatibility with the
previously monophonic FM systems. The (L-R) signal is amplitude modulated onto
a suppressed subcarrier at 38 kHz. A pilot signal is transmitted at 19 kHz and is used
by the receiver to identify a stereo transmission and reconstruct L and R audio
signals from the multiplexed signal.
In the receiver, the (L+R) signal is added to the (L-R) signal to get the L signal, and
subtracts the (L-R) signal to get the R signal.
RDS/RBDS
The standard documents for RDS and RBDS are as follows:
• IEC 62106: Specification of the radio data system (RDS) for VHF/FM sound
• EIA/NAB NRSC: United States RBDS standard - Specification of the radio
broadcasting in the frequency range from 87.5 to 108.0 MHz.
broadcast data system (RBDS).
30
Page 31

Concepts
1.0 kHz±
7.5 kHz±
Block 1
Block 2
Block 3 Block 4
Group = 4 blocks = 104 bits
Information word
Checkword + offset word
16 bits 10 bits
26 bits
FM Stereo/RDS Concepts
RBDS is the United States version of RDS. Both RDS and RBDS are intended for
application to VHF/FM sound broadcasts in the range 87.5 MHz to 108.0 MHz
which may carry either stereophonic or monophonic programmes.
The main objectives of RDS/RBDS:
• To enhance functionality for FM receivers;
• To make the receivers more user-friendly by using features such as PI
(programme identification), PS (programme service) name display, and if
applicable, automatic tuning for portable and car radios.
As shown in Figure 2-5, RDS/RBDS uses the 57 kHz subcarrier to carry the data at
1.1875 kbps bitrate. The 57 kHz is chosen to be the third harmonic of the pilot tone.
The deviation range of the FM carrier due to the unmodulated RDS/RBDS subcarrier
is from to .
Basic Structure of RDS
The basic structure of RDS is shown in Figure 2-6, in which the largest element is
called a group including 4 blocks of 26 bits each. Each block comprises an
information word (16 bits) and a checkword (10 bits).
The information word is used to transmit information to the end user. The 10-bit
checkword plus offset word are used to provide error protection and block and group
synchronization information.
Figure 2-6 Basic structure of RDS
BLER
BLER (block error rate) is the ratio of the number of un-correctable blocks to the
total number of blocks received. Normally, BLER should be less than 5%.
31
Page 32

Concepts
Demodulating an AM Signal Using the Analyzer as a Fixed Tuned Receiver (Time-Domain)
Demodulating an AM Signal Using the Analyzer as a Fixed Tuned
Receiver (Time-Domain)
The X-Series signal analyzer can be used to recover amplitude modulation on a
carrier signal.
The following functions establish a clear display of the waveform:
• Triggering stabilizes the waveform trace by triggering on the modulation
envelope. If the modulation of the signal is stable, video trigger synchronizes the
sweep with the demodulated waveform.
• Sweep time to view the rate of the AM signal.
• RBW and VBW are selected according to the signal bandwidth.
32
Page 33

Demodulating an FM Signal Using the Analyzer as a Fixed Tuned Receiver (Time-Domain)
Demodulating an FM Signal Using the Analyzer as a Fixed Tuned
Receiver (Time-Domain)
To recover the frequency modulated signal, an analyzer can be used as a manually
tuned receiver. However, in contrast to AM, the signal is not tuned into the passband
center, but to one slope of the filter curve as shown in Figure 2-7.
Figure 2-7 Determining FM Parameters using FM to AM Conversion
Concepts
Here the frequency variations of the FM signal are converted into amplitude
variations (FM to AM conversion). The reason we want to measure the AM
component is that the envelope detector responds only to AM variations. There are
no changes in amplitude if the frequency changes of the FM signal are limited to the
flat part of the RBW (IF filter). The resultant AM signal is then detected with the
envelope detector and displayed in the time domain.
33
Page 34

Concepts
Frequency (kHz)
Mono
signal
L+R
15
19
Pilot
38 57
RDS/RBDS
Stereo signal
L-R
Amplitude
Demodulating an FM Stereo/RDS Signal Using the Analyzer as a Fixed Tuned Receiver (Time-Domain)
Demodulating an FM Stereo/RDS Signal Using the Analyzer as a Fixed
Tuned Receiver (Time-Domain)
FM Stereo/RDS signal contains mono part, stereo part, RDS/RBDS, and pilots. The
process of demodulating FM Stereo/RDS signal is more compli cated than simple FM
signal and is described as below.
1. Perform the FM demodulation to obtain the baseband modulating signal. The
demodulating method is the same to Demodulating an FM Signal Using the
Analyzer as a Fixed Tuned Receiver (Time-Domain) on page 33.
The baseband modulating signal should look like Figure 2-8.
Figure 2-8 Baseband modulating signals of the FM Stereo/RDS signal
2. Recover the L (left channel) and R (right channel) of the audio signal.
a. Demodulate the L+R part.
b. Extract the 19 kHz pilot and multiply it to recover the 38 kHz subcarrier.
c. Perform the DSBSC (Double-Sideband Suppressed Carrier) AM
demodulation to get the L-R signal.
d. Get the L and R signals from (L-R) and (L+R).
3. Multiply the 19 kHz pilot to recover the 57 kHz subcarrier, demodulate the RDS
/RBDS bits, and then calculate the BLER.
4. Apply the de-emphasis or audio filters including highpass, lowpass, bandpass
(CCITT, A-Weighted) filters to the audio signal (L and R).
5. Calculate measurement parameters like SINAD, Distortion, THD and so on.
34
Page 35

Modulation Distortion Measurement Concepts
%
ModulationDistortion
P
totalPsignal
–
P
total
----------------------------------- 100%×=
Modulation Distortion Measurement Concepts
Purpose
This measurement is used to measure the amount of modulation distortion contained
in the modulated signal by determining the ratio of harmonic and noise power to
fundamental power. This measurement verifies the modulation quality of the signal
from the DUT.
Measurement Technique
Modulation Distortion is defined as:
Equation 2-4
Concepts
where: P
P
signal
- P
P
total
= the power of the total signal,
total
= the power of the wanted modulating signal, and
= total unwanted signal which includes harmonic distortion and
signal
noise.
First, the received signal is demodulated and filtered to remove DC. Then the filtered
signal is transformed by an FFT into frequency domain. Next, total power in the total
filter band is measured as P
as P
, the square root of the ratio of P
signal
, the peak power of the modulated signal is computed
total
total
- P
signal
to P
is calculated. The result
total
is the signal’s modulation distortion. It can be expressed as dB or %.
35
Page 36

Concepts
dB
ModulationSINAD
20
P
total
P
totalPsignal
–
-----------------------------------log×=
Modulation SINAD Measurement Concepts
Modulation SINAD Measurement Concepts
Purpose
Modulation SINAD (SIgnal to Noise And Distortion) measures the amount of
Modulation SINAD contained in the modulated signal by determining the ratio of
fundamental power to harmonic and noise power. Modulation SINAD is the
reciprocal of the modulation distortion provided by the Modulation Distortion
measurement. This is another way to quantify the quality of the modulation process.
Measurement Technique
Modulation SINAD is defined as:
Equation 2-5
where: P
P
signal
- P
P
total
= the power of the total signal,
total
= the power of the wanted modulating signal, and
= the total unwanted signals which include harmonic distortion and
signal
noise.
First, the received signal is demodulated and filtered to remove DC, then the filtered
signal is transformed by an FFT into frequency domain. Next, total power in the total
filter band is measured as P
as P
, the square root of the ratio of P
signal
, the peak power of the modulated signal is computed
total
total
to P
total
- P
is calculated. The result
signal
is the signal’s Modulation SINAD. It can be expressed as dB.
36
 Loading...