

Page 1
Keysight X-Series Signal Analyzers
This manual provides documentation for the following Analyzer:
N9010B EXA Signal Analyzer
EXA Specifications
Guide
(Comprehensive
Reference Data)
Page 2

Notices
© Keysight Technologies, Inc.
2016-2020
No part of this manual may be
reproduced in any form or by any
means (including electronic storage
and retrieval or translation into a
foreign language) without prior
agreement and written consent from
Keysight Technologies, Inc. as
governed by United States and
international copyright laws.
Trademark Acknowledgments
Manual Part Number
N9010-90071
Edition
Edition 1, December 2020
Supersedes: April 2020
Published by:
Keysight Technologies
1400 Fountaingrove Parkway
Santa Rosa, CA 95403
Warranty
THE MATERIAL CONTAINED IN THIS
DOCUMENT IS PROVIDED “AS IS,”
AND IS SUBJECT TO BEING
CHANGED, WITHOUT NOTICE, IN
FUTURE EDITIONS. FURTHER, TO
THE MAXIMUM EXTENT PERMITTED
BY APPLICABLE LAW, KEYSIGHT
DISCLAIMS ALL WARRANTIES,
EITHER EXPRESS OR IMPLIED WITH
REGARD TO THIS MANUAL AND
ANY INFORMATION CONTAINED
HEREIN, INCLUDING BUT NOT
LIMITED TO THE IMPLIED
WARRANTIES OF
MERCHANTABILITY AND FITNESS
FOR A PARTICULAR PURPOSE.
KEYSIGHT SHALL NOT BE LIABLE
FOR ERRORS OR FOR INCIDENTAL
OR CONSEQUENTIAL DAMAGES IN
CONNECTION WITH THE
FURNISHING, USE, OR
PERFORMANCE OF THIS
DOCUMENT OR ANY INFORMATION
CONTAINED HEREIN. SHOULD
KEYSIGHT AND THE USER HAVE A
SEPARATE WRITTEN AGREEMENT
WITH WARRANTY TERMS
COVERING THE MATERIAL IN THIS
DOCUMENT THAT CONFLICT WITH
THESE TERMS, THE WARRANTY
TERMS IN THE SEPARATE
AGREEMENT WILL CONTROL.
Technology Licenses
The hardware and/or software
described in this document are
furnished under a license and may be
used or copied only in accordance
with the terms of such license.
U.S. Government Rights
The Software is “commercial
computer software,” as defined
by Federal Acquisition Regulation
(“FAR”) 2.101. Pursuant to FAR
12.212 and 27.405-3 and
Department of Defense FAR
Supplement (“DFARS”) 227.7202,
the U.S. government acquires
commercial computer software
under the same terms by which
the software is customarily
provided to the public.
Accordingly, Keysight provides
the Software to U.S. government
customers under its standard
commercial license, which is
embodied in its End User License
Agreement (EULA), a copy of
which can be found at
http://www.keysight.com/find/sweula
The license set forth in the EULA
represents the exclusive authority
by which the U.S. government
may use, modify, distribute, or
disclose the Software. The EULA
and the license set forth therein,
does not require or permit,
among other things, that
Keysight: (1) Furnish technical
information related to
commercial computer software
or commercial computer
software documentation that is
not customarily provided to the
public; or (2) Relinquish to, or
otherwise provide, the
government rights in excess of
these rights customarily provided
to the public to use, modify,
reproduce, release, perform,
display, or disclose commercial
computer software or
commercial computer software
documentation. No additional
government requirements
beyond those set forth in the
EULA shall apply, except to the
extent that those terms, rights, or
licenses are explicitly required
from all providers of commercial
computer software pursuant to
the FAR and the DFARS and are
set forth specifically in writing
elsewhere in the EULA. Keysight
shall be under no obligation to
update, revise or otherwise
modify the Software. With
respect to any technical data as
defined by FAR 2.101, pursuant
to FAR 12.211 and 27.404.2 and
DFARS 227.7102, the U.S.
government acquires no greater
than Limited Rights as defined in
FAR 27.401 or DFAR 227.7103-5
(c), as applicable in any technical
data.
Safety Notices
A CAUTION notice denotes a hazard. It
calls attention to an operating
procedure, practice, or the like that,
if not correctly performed or adhered
to, could result in damage to the
product or loss of important data. Do
not proceed beyond a CAUTION
notice until the indicated conditions
are fully understood and met.
A WARNING notice denotes a hazard.
It calls attention to an operating
procedure, practice, or the like that,
if not correctly performed or adhered
to, could result in personal injury or
death. Do not proceed beyond a
WARNING notice until the indicated
conditions are fully understood and
met.
Page 3

Where to Find the Latest Information
Documentation is updated periodically. For the latest information about these products, including instrument software
upgrades, application information, and product information, browse to one of the following URLs, according to the name
of your product:
http://www.keysight.com/find/exa
To receive the latest updates by email, subscribe to Keysight Email Updates at the following URL:
http://www.keysight.com/find/MyKeysight
Information on preventing instrument damage can be found at:
www.keysight.com/find/PreventingInstrumentRepair
Is your product software up-to-date?
Periodically, Keysight releases software updates to fix known defects and incorporate product enhancements. To search
for software updates for your product, go to the Keysight Technical Support website at:
http://www.keysight.com/find/techsupport
3
Page 4

4
Page 5

Contents
1. EXA Signal Analyzer
Definitions and Requirements. . . . . . . . . . . . . . . . . . . . . . . . . . . . . . . . . . . . . . . . . . . . . . . . . . . . . . . 14
Definitions . . . . . . . . . . . . . . . . . . . . . . . . . . . . . . . . . . . . . . . . . . . . . . . . . . . . . . . . . . . . . . . . . . . . 14
Conditions Required to Meet Specifications. . . . . . . . . . . . . . . . . . . . . . . . . . . . . . . . . . . . . . . . . . 14
Certification . . . . . . . . . . . . . . . . . . . . . . . . . . . . . . . . . . . . . . . . . . . . . . . . . . . . . . . . . . . . . . . . . . . 15
Frequency and Time . . . . . . . . . . . . . . . . . . . . . . . . . . . . . . . . . . . . . . . . . . . . . . . . . . . . . . . . . . . . . . 16
Frequency Range. . . . . . . . . . . . . . . . . . . . . . . . . . . . . . . . . . . . . . . . . . . . . . . . . . . . . . . . . . . . . . . 16
Band. . . . . . . . . . . . . . . . . . . . . . . . . . . . . . . . . . . . . . . . . . . . . . . . . . . . . . . . . . . . . . . . . . . . . . . . . 16
Standard Frequency Reference . . . . . . . . . . . . . . . . . . . . . . . . . . . . . . . . . . . . . . . . . . . . . . . . . . . . 18
Precision Frequency Reference . . . . . . . . . . . . . . . . . . . . . . . . . . . . . . . . . . . . . . . . . . . . . . . . . . . . 19
Frequency Readout Accuracy . . . . . . . . . . . . . . . . . . . . . . . . . . . . . . . . . . . . . . . . . . . . . . . . . . . . . 20
Frequency Counter . . . . . . . . . . . . . . . . . . . . . . . . . . . . . . . . . . . . . . . . . . . . . . . . . . . . . . . . . . . . . 21
Frequency Span. . . . . . . . . . . . . . . . . . . . . . . . . . . . . . . . . . . . . . . . . . . . . . . . . . . . . . . . . . . . . . . . 21
Sweep Time and Trigger . . . . . . . . . . . . . . . . . . . . . . . . . . . . . . . . . . . . . . . . . . . . . . . . . . . . . . . . . 22
Triggers . . . . . . . . . . . . . . . . . . . . . . . . . . . . . . . . . . . . . . . . . . . . . . . . . . . . . . . . . . . . . . . . . . . . . . 23
Gated Sweep . . . . . . . . . . . . . . . . . . . . . . . . . . . . . . . . . . . . . . . . . . . . . . . . . . . . . . . . . . . . . . . . . . 24
Number of Frequency Sweep Points (buckets). . . . . . . . . . . . . . . . . . . . . . . . . . . . . . . . . . . . . . . . 24
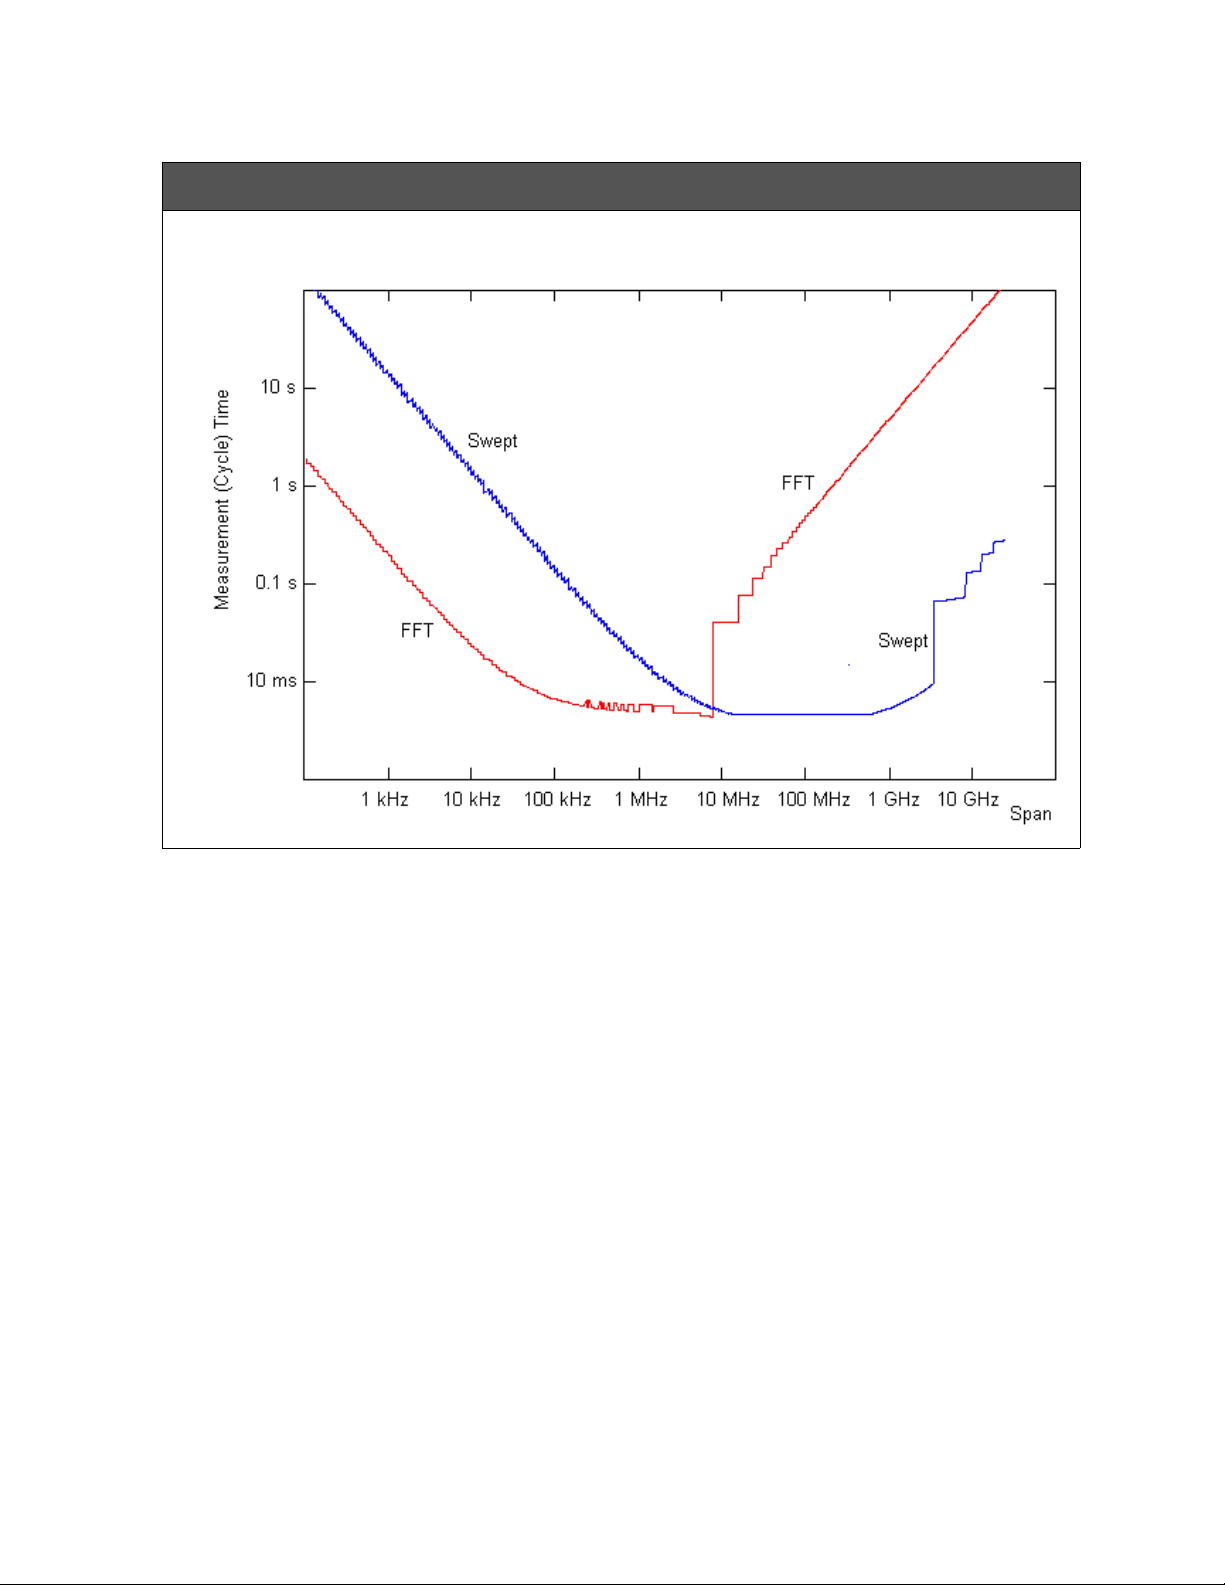
Nominal Measurement Time vs. Span [Plot]. . . . . . . . . . . . . . . . . . . . . . . . . . . . . . . . . . . . . . . . . . 25
Resolution Bandwidth (RBW) . . . . . . . . . . . . . . . . . . . . . . . . . . . . . . . . . . . . . . . . . . . . . . . . . . . . . 26
Analysis Bandwidth . . . . . . . . . . . . . . . . . . . . . . . . . . . . . . . . . . . . . . . . . . . . . . . . . . . . . . . . . . . . . 27
Preselector Bandwidth . . . . . . . . . . . . . . . . . . . . . . . . . . . . . . . . . . . . . . . . . . . . . . . . . . . . . . . . . . 27
Video Bandwidth (VBW) . . . . . . . . . . . . . . . . . . . . . . . . . . . . . . . . . . . . . . . . . . . . . . . . . . . . . . . . . 28
Amplitude Accuracy and Range . . . . . . . . . . . . . . . . . . . . . . . . . . . . . . . . . . . . . . . . . . . . . . . . . . . . . 29
Measurement Range . . . . . . . . . . . . . . . . . . . . . . . . . . . . . . . . . . . . . . . . . . . . . . . . . . . . . . . . . . . . 29
Maximum Safe Input Level . . . . . . . . . . . . . . . . . . . . . . . . . . . . . . . . . . . . . . . . . . . . . . . . . . . . . . . 29
Display Range . . . . . . . . . . . . . . . . . . . . . . . . . . . . . . . . . . . . . . . . . . . . . . . . . . . . . . . . . . . . . . . . . 29
Marker Readout . . . . . . . . . . . . . . . . . . . . . . . . . . . . . . . . . . . . . . . . . . . . . . . . . . . . . . . . . . . . . . . . 30
Frequency Response . . . . . . . . . . . . . . . . . . . . . . . . . . . . . . . . . . . . . . . . . . . . . . . . . . . . . . . . . . . . 31
IF Frequency Response . . . . . . . . . . . . . . . . . . . . . . . . . . . . . . . . . . . . . . . . . . . . . . . . . . . . . . . . . . 32
IF Phase Linearity . . . . . . . . . . . . . . . . . . . . . . . . . . . . . . . . . . . . . . . . . . . . . . . . . . . . . . . . . . . . . . 33
Absolute Amplitude Accuracy . . . . . . . . . . . . . . . . . . . . . . . . . . . . . . . . . . . . . . . . . . . . . . . . . . . . . 33
Input Attenuation Switching Uncertainty . . . . . . . . . . . . . . . . . . . . . . . . . . . . . . . . . . . . . . . . . . . . 35
RF Input VSWR . . . . . . . . . . . . . . . . . . . . . . . . . . . . . . . . . . . . . . . . . . . . . . . . . . . . . . . . . . . . . . . . 35
Resolution Bandwidth Switching Uncertainty . . . . . . . . . . . . . . . . . . . . . . . . . . . . . . . . . . . . . . . . 36
Reference Level . . . . . . . . . . . . . . . . . . . . . . . . . . . . . . . . . . . . . . . . . . . . . . . . . . . . . . . . . . . . . . . . 36
Display Scale Fidelity. . . . . . . . . . . . . . . . . . . . . . . . . . . . . . . . . . . . . . . . . . . . . . . . . . . . . . . . . . . . 37
Available Detectors . . . . . . . . . . . . . . . . . . . . . . . . . . . . . . . . . . . . . . . . . . . . . . . . . . . . . . . . . . . . . 38
Dynamic Range . . . . . . . . . . . . . . . . . . . . . . . . . . . . . . . . . . . . . . . . . . . . . . . . . . . . . . . . . . . . . . . . . . 39
Gain Compression . . . . . . . . . . . . . . . . . . . . . . . . . . . . . . . . . . . . . . . . . . . . . . . . . . . . . . . . . . . . . . 39
1 dB Gain Compression Point (Two-tone). . . . . . . . . . . . . . . . . . . . . . . . . . . . . . . . . . . . . . . . . . . . 39
Displayed Average Noise Level . . . . . . . . . . . . . . . . . . . . . . . . . . . . . . . . . . . . . . . . . . . . . . . . . . . . 41
Displayed Average Noise Level (DANL). . . . . . . . . . . . . . . . . . . . . . . . . . . . . . . . . . . . . . . . . . . . . . 41
Spurious Responses . . . . . . . . . . . . . . . . . . . . . . . . . . . . . . . . . . . . . . . . . . . . . . . . . . . . . . . . . . . . 43
Residual Responses. . . . . . . . . . . . . . . . . . . . . . . . . . . . . . . . . . . . . . . . . . . . . . . . . . . . . . . . . . . . . 43
Second Harmonic Distortion . . . . . . . . . . . . . . . . . . . . . . . . . . . . . . . . . . . . . . . . . . . . . . . . . . . . . . 44
Third Order Intermodulation . . . . . . . . . . . . . . . . . . . . . . . . . . . . . . . . . . . . . . . . . . . . . . . . . . . . . . 45
Nominal Dynamic Range vs. Offset Frequency vs. RBW for Freq Option ≤ 526 [Plot] . . . . . . . . . 46
Nominal Dynamic Range at 1 GHz for Freq Option ≤ 526 [Plot] . . . . . . . . . . . . . . . . . . . . . . . . . . 47
Nominal Dynamic Range Bands 1-4 for Freq Option ≤ 526 [Plot] . . . . . . . . . . . . . . . . . . . . . . . . . 47
5
Page 6

Contents
Phase Noise. . . . . . . . . . . . . . . . . . . . . . . . . . . . . . . . . . . . . . . . . . . . . . . . . . . . . . . . . . . . . . . . . . . . 48
Nominal Phase Noise of Different LO Optimizations [Plot] . . . . . . . . . . . . . . . . . . . . . . . . . . . . . . . 49
Nominal Phase Noise of Different Center Frequencies [Plot] . . . . . . . . . . . . . . . . . . . . . . . . . . . . . 50
Power Suite Measurements . . . . . . . . . . . . . . . . . . . . . . . . . . . . . . . . . . . . . . . . . . . . . . . . . . . . . . . . . 51
Channel Power . . . . . . . . . . . . . . . . . . . . . . . . . . . . . . . . . . . . . . . . . . . . . . . . . . . . . . . . . . . . . . . . . 51
Occupied Bandwidth. . . . . . . . . . . . . . . . . . . . . . . . . . . . . . . . . . . . . . . . . . . . . . . . . . . . . . . . . . . . . 51
Adjacent Channel Power (ACP) . . . . . . . . . . . . . . . . . . . . . . . . . . . . . . . . . . . . . . . . . . . . . . . . . . . . 52
Power Statistics CCDF . . . . . . . . . . . . . . . . . . . . . . . . . . . . . . . . . . . . . . . . . . . . . . . . . . . . . . . . . . . 54
Burst Power. . . . . . . . . . . . . . . . . . . . . . . . . . . . . . . . . . . . . . . . . . . . . . . . . . . . . . . . . . . . . . . . . . . . 55
TOI (Third Order Intermodulation) . . . . . . . . . . . . . . . . . . . . . . . . . . . . . . . . . . . . . . . . . . . . . . . . . . 55
Harmonic Distortion . . . . . . . . . . . . . . . . . . . . . . . . . . . . . . . . . . . . . . . . . . . . . . . . . . . . . . . . . . . . . 55
Spurious Emissions . . . . . . . . . . . . . . . . . . . . . . . . . . . . . . . . . . . . . . . . . . . . . . . . . . . . . . . . . . . . . . 56
Spectrum Emission Mask . . . . . . . . . . . . . . . . . . . . . . . . . . . . . . . . . . . . . . . . . . . . . . . . . . . . . . . . . 57
Options . . . . . . . . . . . . . . . . . . . . . . . . . . . . . . . . . . . . . . . . . . . . . . . . . . . . . . . . . . . . . . . . . . . . . . . . . 58
General . . . . . . . . . . . . . . . . . . . . . . . . . . . . . . . . . . . . . . . . . . . . . . . . . . . . . . . . . . . . . . . . . . . . . . . . . 60
Inputs/Outputs . . . . . . . . . . . . . . . . . . . . . . . . . . . . . . . . . . . . . . . . . . . . . . . . . . . . . . . . . . . . . . . . . . . 65
Front Panel . . . . . . . . . . . . . . . . . . . . . . . . . . . . . . . . . . . . . . . . . . . . . . . . . . . . . . . . . . . . . . . . . . . . 65
Rear Panel . . . . . . . . . . . . . . . . . . . . . . . . . . . . . . . . . . . . . . . . . . . . . . . . . . . . . . . . . . . . . . . . . . . . 66
Regulatory Information . . . . . . . . . . . . . . . . . . . . . . . . . . . . . . . . . . . . . . . . . . . . . . . . . . . . . . . . . . . . 69
2. I/Q Analyzer
Specifications Affected by I/Q Analyzer. . . . . . . . . . . . . . . . . . . . . . . . . . . . . . . . . . . . . . . . . . . . . . . . 74
Frequency . . . . . . . . . . . . . . . . . . . . . . . . . . . . . . . . . . . . . . . . . . . . . . . . . . . . . . . . . . . . . . . . . . . . . . .75
Clipping-to-Noise Dynamic Range . . . . . . . . . . . . . . . . . . . . . . . . . . . . . . . . . . . . . . . . . . . . . . . . . . . 76
Data Acquisition . . . . . . . . . . . . . . . . . . . . . . . . . . . . . . . . . . . . . . . . . . . . . . . . . . . . . . . . . . . . . . . . . . 77
Time Record Length (IQ pairs) . . . . . . . . . . . . . . . . . . . . . . . . . . . . . . . . . . . . . . . . . . . . . . . . . . . . . 77
ADC Resolution . . . . . . . . . . . . . . . . . . . . . . . . . . . . . . . . . . . . . . . . . . . . . . . . . . . . . . . . . . . . . . . . . 77
3. Option B25 - 25 MHz Analysis Bandwidth
Specifications Affected by Analysis Bandwidth . . . . . . . . . . . . . . . . . . . . . . . . . . . . . . . . . . . . . . . . . .80
Other Analysis Bandwidth Specifications . . . . . . . . . . . . . . . . . . . . . . . . . . . . . . . . . . . . . . . . . . . . . . 81
IF Spurious Response . . . . . . . . . . . . . . . . . . . . . . . . . . . . . . . . . . . . . . . . . . . . . . . . . . . . . . . . . . . . 81
IF Frequency Response. . . . . . . . . . . . . . . . . . . . . . . . . . . . . . . . . . . . . . . . . . . . . . . . . . . . . . . . . . . 82
IF Phase Linearity . . . . . . . . . . . . . . . . . . . . . . . . . . . . . . . . . . . . . . . . . . . . . . . . . . . . . . . . . . . . . . . 83
Data Acquisition . . . . . . . . . . . . . . . . . . . . . . . . . . . . . . . . . . . . . . . . . . . . . . . . . . . . . . . . . . . . . . . . . . 85
Time Record Length (IQ pairs) . . . . . . . . . . . . . . . . . . . . . . . . . . . . . . . . . . . . . . . . . . . . . . . . . . . . . 85
ADC Resolution . . . . . . . . . . . . . . . . . . . . . . . . . . . . . . . . . . . . . . . . . . . . . . . . . . . . . . . . . . . . . . . . . 85
4. Option B40 - 40 MHz Analysis Bandwidth
Specifications Affected by Analysis Bandwidth . . . . . . . . . . . . . . . . . . . . . . . . . . . . . . . . . . . . . . . . . .88
Other Analysis Bandwidth Specifications . . . . . . . . . . . . . . . . . . . . . . . . . . . . . . . . . . . . . . . . . . . . . . 89
IF Frequency Response. . . . . . . . . . . . . . . . . . . . . . . . . . . . . . . . . . . . . . . . . . . . . . . . . . . . . . . . . . . 90
IF Phase Linearity . . . . . . . . . . . . . . . . . . . . . . . . . . . . . . . . . . . . . . . . . . . . . . . . . . . . . . . . . . . . . . . 91
EVM . . . . . . . . . . . . . . . . . . . . . . . . . . . . . . . . . . . . . . . . . . . . . . . . . . . . . . . . . . . . . . . . . . . . . . . . . . 92
Data Acquisition . . . . . . . . . . . . . . . . . . . . . . . . . . . . . . . . . . . . . . . . . . . . . . . . . . . . . . . . . . . . . . . . . . 93
Time Record Length . . . . . . . . . . . . . . . . . . . . . . . . . . . . . . . . . . . . . . . . . . . . . . . . . . . . . . . . . . . . . 93
ADC Resolution . . . . . . . . . . . . . . . . . . . . . . . . . . . . . . . . . . . . . . . . . . . . . . . . . . . . . . . . . . . . . . . . . 93
Capture Time [Plot] . . . . . . . . . . . . . . . . . . . . . . . . . . . . . . . . . . . . . . . . . . . . . . . . . . . . . . . . . . . . . . 93
6
Page 7

Contents
5. Option CR3 - Connector Rear, 2nd IF Output
Specifications Affected by Connector Rear, 2nd IF Output. . . . . . . . . . . . . . . . . . . . . . . . . . . . . . . . 96
Other Connector Rear, 2nd IF Output Specifications . . . . . . . . . . . . . . . . . . . . . . . . . . . . . . . . . . . . 97
Aux IF Out Port. . . . . . . . . . . . . . . . . . . . . . . . . . . . . . . . . . . . . . . . . . . . . . . . . . . . . . . . . . . . . . . . . 97
Second IF Out . . . . . . . . . . . . . . . . . . . . . . . . . . . . . . . . . . . . . . . . . . . . . . . . . . . . . . . . . . . . . . . . . 97
6. Option CRP - Connector Rear, Arbitrary IF Output
Specifications Affected by Connector Rear, Arbitrary IF Output. . . . . . . . . . . . . . . . . . . . . . . . . . . 100
Other Connector Rear, Arbitrary IF Output Specifications . . . . . . . . . . . . . . . . . . . . . . . . . . . . . . . 101
Aux IF Out Port. . . . . . . . . . . . . . . . . . . . . . . . . . . . . . . . . . . . . . . . . . . . . . . . . . . . . . . . . . . . . . . . 101
Arbitrary IF Out . . . . . . . . . . . . . . . . . . . . . . . . . . . . . . . . . . . . . . . . . . . . . . . . . . . . . . . . . . . . . . . 101
7. Option EA3 - Electronic Attenuator, 3.6 GHz
Specifications Affected by Electronic Attenuator. . . . . . . . . . . . . . . . . . . . . . . . . . . . . . . . . . . . . . . 104
Other Electronic Attenuator Specifications . . . . . . . . . . . . . . . . . . . . . . . . . . . . . . . . . . . . . . . . . . . 105
Range (Frequency and Attenuation) . . . . . . . . . . . . . . . . . . . . . . . . . . . . . . . . . . . . . . . . . . . . . . . 105
Distortions and Noise . . . . . . . . . . . . . . . . . . . . . . . . . . . . . . . . . . . . . . . . . . . . . . . . . . . . . . . . . . 106
Frequency Response . . . . . . . . . . . . . . . . . . . . . . . . . . . . . . . . . . . . . . . . . . . . . . . . . . . . . . . . . . . 107
Absolute Amplitude Accuracy . . . . . . . . . . . . . . . . . . . . . . . . . . . . . . . . . . . . . . . . . . . . . . . . . . . . 107
Electronic Attenuator Switching Uncertainty . . . . . . . . . . . . . . . . . . . . . . . . . . . . . . . . . . . . . . . . 108
8. Option EMC - Precompliance EMI Features
Frequency . . . . . . . . . . . . . . . . . . . . . . . . . . . . . . . . . . . . . . . . . . . . . . . . . . . . . . . . . . . . . . . . . . . . . 110
Frequency Range. . . . . . . . . . . . . . . . . . . . . . . . . . . . . . . . . . . . . . . . . . . . . . . . . . . . . . . . . . . . . . 110
EMI Resolution Bandwidths . . . . . . . . . . . . . . . . . . . . . . . . . . . . . . . . . . . . . . . . . . . . . . . . . . . . . 110
Amplitude . . . . . . . . . . . . . . . . . . . . . . . . . . . . . . . . . . . . . . . . . . . . . . . . . . . . . . . . . . . . . . . . . . . . . 112
EMI Average Detector . . . . . . . . . . . . . . . . . . . . . . . . . . . . . . . . . . . . . . . . . . . . . . . . . . . . . . . . . . 112
Quasi-Peak Detector . . . . . . . . . . . . . . . . . . . . . . . . . . . . . . . . . . . . . . . . . . . . . . . . . . . . . . . . . . . 112
RMS Average Detector . . . . . . . . . . . . . . . . . . . . . . . . . . . . . . . . . . . . . . . . . . . . . . . . . . . . . . . . . 112
9. Option ESC - External Source Control
General Specifications . . . . . . . . . . . . . . . . . . . . . . . . . . . . . . . . . . . . . . . . . . . . . . . . . . . . . . . . . . . 114
Frequency Range. . . . . . . . . . . . . . . . . . . . . . . . . . . . . . . . . . . . . . . . . . . . . . . . . . . . . . . . . . . . . . 114
Dynamic Range . . . . . . . . . . . . . . . . . . . . . . . . . . . . . . . . . . . . . . . . . . . . . . . . . . . . . . . . . . . . . . . 116
Power Sweep Range . . . . . . . . . . . . . . . . . . . . . . . . . . . . . . . . . . . . . . . . . . . . . . . . . . . . . . . . . . . 116
Measurement Time . . . . . . . . . . . . . . . . . . . . . . . . . . . . . . . . . . . . . . . . . . . . . . . . . . . . . . . . . . . . 117
Supported External Sources . . . . . . . . . . . . . . . . . . . . . . . . . . . . . . . . . . . . . . . . . . . . . . . . . . . . . 118
10. Option EXM - External Mixing
Specifications Affected by External mixing . . . . . . . . . . . . . . . . . . . . . . . . . . . . . . . . . . . . . . . . . . . 120
Other External Mixing Specifications . . . . . . . . . . . . . . . . . . . . . . . . . . . . . . . . . . . . . . . . . . . . . . . . 121
Connection Port EXT MIXER . . . . . . . . . . . . . . . . . . . . . . . . . . . . . . . . . . . . . . . . . . . . . . . . . . . . . 121
Mixer Bias . . . . . . . . . . . . . . . . . . . . . . . . . . . . . . . . . . . . . . . . . . . . . . . . . . . . . . . . . . . . . . . . . . . 121
IF Input. . . . . . . . . . . . . . . . . . . . . . . . . . . . . . . . . . . . . . . . . . . . . . . . . . . . . . . . . . . . . . . . . . . . . . 122
LO Output . . . . . . . . . . . . . . . . . . . . . . . . . . . . . . . . . . . . . . . . . . . . . . . . . . . . . . . . . . . . . . . . . . . 123
11. Option MPB - Microwave Preselector Bypass
7
Page 8

Contents
Specifications Affected by Microwave Preselector Bypass . . . . . . . . . . . . . . . . . . . . . . . . . . . . . . . . 126
Other Microwave Preselector Bypass Specifications. . . . . . . . . . . . . . . . . . . . . . . . . . . . . . . . . . . . . 127
Additional Spurious Responses . . . . . . . . . . . . . . . . . . . . . . . . . . . . . . . . . . . . . . . . . . . . . . . . . . . 128
12. Option NF2 - Noise Floor Extension, Instrument Alignment
Specifications Affected by Noise Floor Extension . . . . . . . . . . . . . . . . . . . . . . . . . . . . . . . . . . . . . . . 130
Displayed Average Noise Level . . . . . . . . . . . . . . . . . . . . . . . . . . . . . . . . . . . . . . . . . . . . . . . . . . . . . 131
Displayed Average Noise Level with Noise Floor Extension Improvement . . . . . . . . . . . . . . . . . . 131
Displayed Average Noise Level with Noise Floor Extension . . . . . . . . . . . . . . . . . . . . . . . . . . . . . 133
13. Option P03, P07, P13, P26, P32 and P44 - Preamplifier
Specifications Affected by Preamp . . . . . . . . . . . . . . . . . . . . . . . . . . . . . . . . . . . . . . . . . . . . . . . . . . 136
Other Preamp Specifications . . . . . . . . . . . . . . . . . . . . . . . . . . . . . . . . . . . . . . . . . . . . . . . . . . . . . . . 137
Gain . . . . . . . . . . . . . . . . . . . . . . . . . . . . . . . . . . . . . . . . . . . . . . . . . . . . . . . . . . . . . . . . . . . . . . . . . 137
Noise figure . . . . . . . . . . . . . . . . . . . . . . . . . . . . . . . . . . . . . . . . . . . . . . . . . . . . . . . . . . . . . . . . . . . 137
1 dB Gain Compression Point . . . . . . . . . . . . . . . . . . . . . . . . . . . . . . . . . . . . . . . . . . . . . . . . . . . . . 138
Displayed Average Noise Level (DANL) Preamp On. . . . . . . . . . . . . . . . . . . . . . . . . . . . . . . . . . . . 139
Frequency Response − Preamp On. . . . . . . . . . . . . . . . . . . . . . . . . . . . . . . . . . . . . . . . . . . . . . . . . 141
RF Input VSWR . . . . . . . . . . . . . . . . . . . . . . . . . . . . . . . . . . . . . . . . . . . . . . . . . . . . . . . . . . . . . . . . 142
Nominal VSWR − Preamp On, Freq Option ≤ 526 [Plot] . . . . . . . . . . . . . . . . . . . . . . . . . . . . . . . . 143
Third Order Intermodulation Distortion . . . . . . . . . . . . . . . . . . . . . . . . . . . . . . . . . . . . . . . . . . . . . 144
Nominal Dynamic Range at 1 GHz, Preamp On, Freq Option ≤ 526 [Plot] . . . . . . . . . . . . . . . . . . 144
14. Option PFR - Precision Frequency Reference
Specifications Affected by Precision Frequency Reference. . . . . . . . . . . . . . . . . . . . . . . . . . . . . . . . 146
15. Option YAS - Y-Axis Screen Video Output
Specifications Affected by Y-Axis Screen Video Output . . . . . . . . . . . . . . . . . . . . . . . . . . . . . . . . . . 148
Other Y-Axis Screen Video Output Specifications. . . . . . . . . . . . . . . . . . . . . . . . . . . . . . . . . . . . . . . 149
General Port Specifications . . . . . . . . . . . . . . . . . . . . . . . . . . . . . . . . . . . . . . . . . . . . . . . . . . . . . . 149
Screen Video . . . . . . . . . . . . . . . . . . . . . . . . . . . . . . . . . . . . . . . . . . . . . . . . . . . . . . . . . . . . . . . . . . 149
Delay . . . . . . . . . . . . . . . . . . . . . . . . . . . . . . . . . . . . . . . . . . . . . . . . . . . . . . . . . . . . . . . . . . . . . . . . 150
Continuity and Compatibility . . . . . . . . . . . . . . . . . . . . . . . . . . . . . . . . . . . . . . . . . . . . . . . . . . . . . 151
16. Analog Demodulation Measurement Application
RF Carrier Frequency and Bandwidth . . . . . . . . . . . . . . . . . . . . . . . . . . . . . . . . . . . . . . . . . . . . . . . . 155
Carrier Frequency . . . . . . . . . . . . . . . . . . . . . . . . . . . . . . . . . . . . . . . . . . . . . . . . . . . . . . . . . . . . . . 155
Maximum Information
Bandwidth (Info BW) . . . . . . . . . . . . . . . . . . . . . . . . . . . . . . . . . . . . . . . . . . . . . . . . . . . . . . . . . . . . 155
Capture Memory . . . . . . . . . . . . . . . . . . . . . . . . . . . . . . . . . . . . . . . . . . . . . . . . . . . . . . . . . . . . . . .155
Post-Demodulation . . . . . . . . . . . . . . . . . . . . . . . . . . . . . . . . . . . . . . . . . . . . . . . . . . . . . . . . . . . . . . 156
Maximum Audio Frequency Span . . . . . . . . . . . . . . . . . . . . . . . . . . . . . . . . . . . . . . . . . . . . . . . . . . 156
Filters. . . . . . . . . . . . . . . . . . . . . . . . . . . . . . . . . . . . . . . . . . . . . . . . . . . . . . . . . . . . . . . . . . . . . . . . 156
Frequency Modulation . . . . . . . . . . . . . . . . . . . . . . . . . . . . . . . . . . . . . . . . . . . . . . . . . . . . . . . . . . . . 158
Conditions required to meet specification . . . . . . . . . . . . . . . . . . . . . . . . . . . . . . . . . . . . . . . . . . . 158
FM Deviation Accuracy . . . . . . . . . . . . . . . . . . . . . . . . . . . . . . . . . . . . . . . . . . . . . . . . . . . . . . . . . . 158
FM Rate Accuracy . . . . . . . . . . . . . . . . . . . . . . . . . . . . . . . . . . . . . . . . . . . . . . . . . . . . . . . . . . . . . . 158
Carrier Frequency Error. . . . . . . . . . . . . . . . . . . . . . . . . . . . . . . . . . . . . . . . . . . . . . . . . . . . . . . . . . 158
8
Page 9

Contents
Carrier Power . . . . . . . . . . . . . . . . . . . . . . . . . . . . . . . . . . . . . . . . . . . . . . . . . . . . . . . . . . . . . . . . . 158
Frequency Modulation . . . . . . . . . . . . . . . . . . . . . . . . . . . . . . . . . . . . . . . . . . . . . . . . . . . . . . . . . . . 159
Post-Demod Distortion Residual. . . . . . . . . . . . . . . . . . . . . . . . . . . . . . . . . . . . . . . . . . . . . . . . . . 159
Post-Demod Distortion Accuracy . . . . . . . . . . . . . . . . . . . . . . . . . . . . . . . . . . . . . . . . . . . . . . . . . 159
Distortion Measurement Range . . . . . . . . . . . . . . . . . . . . . . . . . . . . . . . . . . . . . . . . . . . . . . . . . . 159
AM Rejection . . . . . . . . . . . . . . . . . . . . . . . . . . . . . . . . . . . . . . . . . . . . . . . . . . . . . . . . . . . . . . . . . 159
Residual FM . . . . . . . . . . . . . . . . . . . . . . . . . . . . . . . . . . . . . . . . . . . . . . . . . . . . . . . . . . . . . . . . . . 159
Hum & Noise . . . . . . . . . . . . . . . . . . . . . . . . . . . . . . . . . . . . . . . . . . . . . . . . . . . . . . . . . . . . . . . . . 159
Amplitude Modulation . . . . . . . . . . . . . . . . . . . . . . . . . . . . . . . . . . . . . . . . . . . . . . . . . . . . . . . . . . . 160
Conditions required to meet specification . . . . . . . . . . . . . . . . . . . . . . . . . . . . . . . . . . . . . . . . . . 160
AM Depth Accuracy. . . . . . . . . . . . . . . . . . . . . . . . . . . . . . . . . . . . . . . . . . . . . . . . . . . . . . . . . . . . 160
AM Rate Accuracy . . . . . . . . . . . . . . . . . . . . . . . . . . . . . . . . . . . . . . . . . . . . . . . . . . . . . . . . . . . . . 160
Carrier Power . . . . . . . . . . . . . . . . . . . . . . . . . . . . . . . . . . . . . . . . . . . . . . . . . . . . . . . . . . . . . . . . . 160
Amplitude Modulation . . . . . . . . . . . . . . . . . . . . . . . . . . . . . . . . . . . . . . . . . . . . . . . . . . . . . . . . . . . 161
Post-Demod Distortion Residual. . . . . . . . . . . . . . . . . . . . . . . . . . . . . . . . . . . . . . . . . . . . . . . . . . 161
Post-Demod Distortion Accuracy . . . . . . . . . . . . . . . . . . . . . . . . . . . . . . . . . . . . . . . . . . . . . . . . . 161
Distortion Measurement Range . . . . . . . . . . . . . . . . . . . . . . . . . . . . . . . . . . . . . . . . . . . . . . . . . . 161
FM Rejection . . . . . . . . . . . . . . . . . . . . . . . . . . . . . . . . . . . . . . . . . . . . . . . . . . . . . . . . . . . . . . . . . 161
Residual AM. . . . . . . . . . . . . . . . . . . . . . . . . . . . . . . . . . . . . . . . . . . . . . . . . . . . . . . . . . . . . . . . . . 161
Phase Modulation . . . . . . . . . . . . . . . . . . . . . . . . . . . . . . . . . . . . . . . . . . . . . . . . . . . . . . . . . . . . . . . 162
Conditions required to meet specification . . . . . . . . . . . . . . . . . . . . . . . . . . . . . . . . . . . . . . . . . . 162
PM Deviation Accuracy . . . . . . . . . . . . . . . . . . . . . . . . . . . . . . . . . . . . . . . . . . . . . . . . . . . . . . . . . 162
PM Rate Accuracy . . . . . . . . . . . . . . . . . . . . . . . . . . . . . . . . . . . . . . . . . . . . . . . . . . . . . . . . . . . . . 162
Carrier Frequency Error . . . . . . . . . . . . . . . . . . . . . . . . . . . . . . . . . . . . . . . . . . . . . . . . . . . . . . . . . 162
Carrier Power . . . . . . . . . . . . . . . . . . . . . . . . . . . . . . . . . . . . . . . . . . . . . . . . . . . . . . . . . . . . . . . . . 162
Phase Modulation . . . . . . . . . . . . . . . . . . . . . . . . . . . . . . . . . . . . . . . . . . . . . . . . . . . . . . . . . . . . . . . 163
Post-Demod Distortion Residual. . . . . . . . . . . . . . . . . . . . . . . . . . . . . . . . . . . . . . . . . . . . . . . . . . 163
Post-Demod Distortion Accuracy . . . . . . . . . . . . . . . . . . . . . . . . . . . . . . . . . . . . . . . . . . . . . . . . . 163
Distortion Measurement Range . . . . . . . . . . . . . . . . . . . . . . . . . . . . . . . . . . . . . . . . . . . . . . . . . . 163
AM Rejection . . . . . . . . . . . . . . . . . . . . . . . . . . . . . . . . . . . . . . . . . . . . . . . . . . . . . . . . . . . . . . . . . 163
Analog Out . . . . . . . . . . . . . . . . . . . . . . . . . . . . . . . . . . . . . . . . . . . . . . . . . . . . . . . . . . . . . . . . . . . . 164
FM Stereo/Radio Data System (RDS) Measurements . . . . . . . . . . . . . . . . . . . . . . . . . . . . . . . . . . . 166
FM Stereo Modulation Analysis Measurements . . . . . . . . . . . . . . . . . . . . . . . . . . . . . . . . . . . . . . 166
17. Bluetooth Measurement Application
Basic Rate Measurements . . . . . . . . . . . . . . . . . . . . . . . . . . . . . . . . . . . . . . . . . . . . . . . . . . . . . . . . 170
Output Power. . . . . . . . . . . . . . . . . . . . . . . . . . . . . . . . . . . . . . . . . . . . . . . . . . . . . . . . . . . . . . . . . 170
Modulation Characteristics . . . . . . . . . . . . . . . . . . . . . . . . . . . . . . . . . . . . . . . . . . . . . . . . . . . . . . 171
Initial Carrier Frequency Tolerance . . . . . . . . . . . . . . . . . . . . . . . . . . . . . . . . . . . . . . . . . . . . . . . . 172
Carrier Frequency Drift . . . . . . . . . . . . . . . . . . . . . . . . . . . . . . . . . . . . . . . . . . . . . . . . . . . . . . . . . 173
Adjacent Channel Power . . . . . . . . . . . . . . . . . . . . . . . . . . . . . . . . . . . . . . . . . . . . . . . . . . . . . . . . 173
Low Energy Measurements. . . . . . . . . . . . . . . . . . . . . . . . . . . . . . . . . . . . . . . . . . . . . . . . . . . . . . . . 174
Output Power. . . . . . . . . . . . . . . . . . . . . . . . . . . . . . . . . . . . . . . . . . . . . . . . . . . . . . . . . . . . . . . . . 174
Modulation Characteristics . . . . . . . . . . . . . . . . . . . . . . . . . . . . . . . . . . . . . . . . . . . . . . . . . . . . . . 175
Initial Carrier Frequency Tolerance . . . . . . . . . . . . . . . . . . . . . . . . . . . . . . . . . . . . . . . . . . . . . . . . 176
Carrier Frequency Drift . . . . . . . . . . . . . . . . . . . . . . . . . . . . . . . . . . . . . . . . . . . . . . . . . . . . . . . . . 177
LE In-band Emission . . . . . . . . . . . . . . . . . . . . . . . . . . . . . . . . . . . . . . . . . . . . . . . . . . . . . . . . . . . 177
Enhanced Data Rate (EDR) Measurements . . . . . . . . . . . . . . . . . . . . . . . . . . . . . . . . . . . . . . . . . . . 178
EDR Relative Transmit Power . . . . . . . . . . . . . . . . . . . . . . . . . . . . . . . . . . . . . . . . . . . . . . . . . . . . 178
9
Page 10

Contents
EDR Modulation Accuracy . . . . . . . . . . . . . . . . . . . . . . . . . . . . . . . . . . . . . . . . . . . . . . . . . . . . . . . 179
EDR Carrier Frequency Stability . . . . . . . . . . . . . . . . . . . . . . . . . . . . . . . . . . . . . . . . . . . . . . . . . . . 180
EDR In-band Spurious Emissions . . . . . . . . . . . . . . . . . . . . . . . . . . . . . . . . . . . . . . . . . . . . . . . . . . 181
In-Band Frequency Range . . . . . . . . . . . . . . . . . . . . . . . . . . . . . . . . . . . . . . . . . . . . . . . . . . . . . . . . . 182
Bluetooth Basic Rate and Enhanced Data Rate (EDR) System . . . . . . . . . . . . . . . . . . . . . . . . . . . 182
Bluetooth Low Energy System . . . . . . . . . . . . . . . . . . . . . . . . . . . . . . . . . . . . . . . . . . . . . . . . . . . . 182
18. GSM/EDGE Measurement Application
Measurement . . . . . . . . . . . . . . . . . . . . . . . . . . . . . . . . . . . . . . . . . . . . . . . . . . . . . . . . . . . . . . . . . . . 184
EDGE Error Vector Magnitude (EVM) . . . . . . . . . . . . . . . . . . . . . . . . . . . . . . . . . . . . . . . . . . . . . . . 184
Power vs. Time . . . . . . . . . . . . . . . . . . . . . . . . . . . . . . . . . . . . . . . . . . . . . . . . . . . . . . . . . . . . . . . . 185
EDGE Power vs. Time . . . . . . . . . . . . . . . . . . . . . . . . . . . . . . . . . . . . . . . . . . . . . . . . . . . . . . . . . . . 185
Power Ramp Relative Accuracy . . . . . . . . . . . . . . . . . . . . . . . . . . . . . . . . . . . . . . . . . . . . . . . . . . . 185
Phase and Frequency Error. . . . . . . . . . . . . . . . . . . . . . . . . . . . . . . . . . . . . . . . . . . . . . . . . . . . . . . 186
Output RF Spectrum (ORFS) . . . . . . . . . . . . . . . . . . . . . . . . . . . . . . . . . . . . . . . . . . . . . . . . . . . . . 187
Frequency Ranges . . . . . . . . . . . . . . . . . . . . . . . . . . . . . . . . . . . . . . . . . . . . . . . . . . . . . . . . . . . . . . . 190
In-Band Frequency Ranges . . . . . . . . . . . . . . . . . . . . . . . . . . . . . . . . . . . . . . . . . . . . . . . . . . . . . . 190
19. LTE/LTE-A Measurement Application
Supported Air Interface Features. . . . . . . . . . . . . . . . . . . . . . . . . . . . . . . . . . . . . . . . . . . . . . . . . . . . 192
Measurements . . . . . . . . . . . . . . . . . . . . . . . . . . . . . . . . . . . . . . . . . . . . . . . . . . . . . . . . . . . . . . . . . . 193
Channel Power . . . . . . . . . . . . . . . . . . . . . . . . . . . . . . . . . . . . . . . . . . . . . . . . . . . . . . . . . . . . . . . . 193
Power Statistics CCDF . . . . . . . . . . . . . . . . . . . . . . . . . . . . . . . . . . . . . . . . . . . . . . . . . . . . . . . . . . 194
Transmit On/Off Power . . . . . . . . . . . . . . . . . . . . . . . . . . . . . . . . . . . . . . . . . . . . . . . . . . . . . . . . . . 195
Adjacent Channel Power. . . . . . . . . . . . . . . . . . . . . . . . . . . . . . . . . . . . . . . . . . . . . . . . . . . . . . . . . 196
Occupied Bandwidth. . . . . . . . . . . . . . . . . . . . . . . . . . . . . . . . . . . . . . . . . . . . . . . . . . . . . . . . . . . . 199
Spectrum Emission Mask . . . . . . . . . . . . . . . . . . . . . . . . . . . . . . . . . . . . . . . . . . . . . . . . . . . . . . . . 200
Spurious Emissions . . . . . . . . . . . . . . . . . . . . . . . . . . . . . . . . . . . . . . . . . . . . . . . . . . . . . . . . . . . . . 202
Modulation Analysis . . . . . . . . . . . . . . . . . . . . . . . . . . . . . . . . . . . . . . . . . . . . . . . . . . . . . . . . . . . . 203
NB-IoT Modulation Analysis . . . . . . . . . . . . . . . . . . . . . . . . . . . . . . . . . . . . . . . . . . . . . . . . . . . . . . 205
C-V2X Modulation Analysis . . . . . . . . . . . . . . . . . . . . . . . . . . . . . . . . . . . . . . . . . . . . . . . . . . . . . . 206
In-Band Frequency Range . . . . . . . . . . . . . . . . . . . . . . . . . . . . . . . . . . . . . . . . . . . . . . . . . . . . . . . . . 208
C-V2X Operating Band . . . . . . . . . . . . . . . . . . . . . . . . . . . . . . . . . . . . . . . . . . . . . . . . . . . . . . . . . . 208
NB-IoT Operating Band . . . . . . . . . . . . . . . . . . . . . . . . . . . . . . . . . . . . . . . . . . . . . . . . . . . . . . . . . 208
LTE FDD Operating Band . . . . . . . . . . . . . . . . . . . . . . . . . . . . . . . . . . . . . . . . . . . . . . . . . . . . . . . . 208
LTE TDD Operating Band . . . . . . . . . . . . . . . . . . . . . . . . . . . . . . . . . . . . . . . . . . . . . . . . . . . . . . . . 209
20. Multi-Standard Radio Measurement Application
Measurements . . . . . . . . . . . . . . . . . . . . . . . . . . . . . . . . . . . . . . . . . . . . . . . . . . . . . . . . . . . . . . . . . . 212
Channel Power . . . . . . . . . . . . . . . . . . . . . . . . . . . . . . . . . . . . . . . . . . . . . . . . . . . . . . . . . . . . . . . . 212
Power Statistics CCDF . . . . . . . . . . . . . . . . . . . . . . . . . . . . . . . . . . . . . . . . . . . . . . . . . . . . . . . . . . 212
Occupied Bandwidth. . . . . . . . . . . . . . . . . . . . . . . . . . . . . . . . . . . . . . . . . . . . . . . . . . . . . . . . . . . . 212
Spurious Emissions . . . . . . . . . . . . . . . . . . . . . . . . . . . . . . . . . . . . . . . . . . . . . . . . . . . . . . . . . . . . . 212
Conformance EVM . . . . . . . . . . . . . . . . . . . . . . . . . . . . . . . . . . . . . . . . . . . . . . . . . . . . . . . . . . . . . 213
In-Band Frequency Range . . . . . . . . . . . . . . . . . . . . . . . . . . . . . . . . . . . . . . . . . . . . . . . . . . . . . . . . . 214
21. Noise Figure Measurement Application
General Specifications . . . . . . . . . . . . . . . . . . . . . . . . . . . . . . . . . . . . . . . . . . . . . . . . . . . . . . . . . . . . 216
10
Page 11

Contents
Noise Figure. . . . . . . . . . . . . . . . . . . . . . . . . . . . . . . . . . . . . . . . . . . . . . . . . . . . . . . . . . . . . . . . . . 216
Gain . . . . . . . . . . . . . . . . . . . . . . . . . . . . . . . . . . . . . . . . . . . . . . . . . . . . . . . . . . . . . . . . . . . . . . . . 217
Noise Figure Uncertainty Calculator . . . . . . . . . . . . . . . . . . . . . . . . . . . . . . . . . . . . . . . . . . . . . . . 218
Uncertainty versus Calibration Options . . . . . . . . . . . . . . . . . . . . . . . . . . . . . . . . . . . . . . . . . . . . 219
Nominal Instrument Noise Figure, Freq Option ≤ 526 . . . . . . . . . . . . . . . . . . . . . . . . . . . . . . . . . 219
Nominal Instrument Input VSWR, DC Coupled, Freq Option ≤ 526. . . . . . . . . . . . . . . . . . . . . . . 220
22. Phase Noise Measurement Application
General Specifications . . . . . . . . . . . . . . . . . . . . . . . . . . . . . . . . . . . . . . . . . . . . . . . . . . . . . . . . . . . 222
Maximum Carrier Frequency . . . . . . . . . . . . . . . . . . . . . . . . . . . . . . . . . . . . . . . . . . . . . . . . . . . . . 222
Measurement Characteristics . . . . . . . . . . . . . . . . . . . . . . . . . . . . . . . . . . . . . . . . . . . . . . . . . . . . 222
Measurement Accuracy. . . . . . . . . . . . . . . . . . . . . . . . . . . . . . . . . . . . . . . . . . . . . . . . . . . . . . . . . 223
Offset Frequency . . . . . . . . . . . . . . . . . . . . . . . . . . . . . . . . . . . . . . . . . . . . . . . . . . . . . . . . . . . . . . 224
Amplitude Repeatability . . . . . . . . . . . . . . . . . . . . . . . . . . . . . . . . . . . . . . . . . . . . . . . . . . . . . . . . 224
Nominal Phase Noise at Different Center Frequencies . . . . . . . . . . . . . . . . . . . . . . . . . . . . . . . . 224
23. Short Range Communications Measurement Application
ZigBee (IEEE 802.15.4) Measurement Application. . . . . . . . . . . . . . . . . . . . . . . . . . . . . . . . . . . . . . 226
EVM (Modulation Accuracy) . . . . . . . . . . . . . . . . . . . . . . . . . . . . . . . . . . . . . . . . . . . . . . . . . . . . . 226
Frequency Error . . . . . . . . . . . . . . . . . . . . . . . . . . . . . . . . . . . . . . . . . . . . . . . . . . . . . . . . . . . . . . . 226
Z-Wave (ITU-T G.9959) Measurement Application . . . . . . . . . . . . . . . . . . . . . . . . . . . . . . . . . . . . . 227
FSK Error . . . . . . . . . . . . . . . . . . . . . . . . . . . . . . . . . . . . . . . . . . . . . . . . . . . . . . . . . . . . . . . . . . . . 227
Frequency Error . . . . . . . . . . . . . . . . . . . . . . . . . . . . . . . . . . . . . . . . . . . . . . . . . . . . . . . . . . . . . . . 227
24. W-CDMA Measurement Application
Measurements. . . . . . . . . . . . . . . . . . . . . . . . . . . . . . . . . . . . . . . . . . . . . . . . . . . . . . . . . . . . . . . . . . 230
Channel Power. . . . . . . . . . . . . . . . . . . . . . . . . . . . . . . . . . . . . . . . . . . . . . . . . . . . . . . . . . . . . . . . 230
Adjacent Channel Power . . . . . . . . . . . . . . . . . . . . . . . . . . . . . . . . . . . . . . . . . . . . . . . . . . . . . . . . 231
Power Statistics CCDF. . . . . . . . . . . . . . . . . . . . . . . . . . . . . . . . . . . . . . . . . . . . . . . . . . . . . . . . . . 233
Occupied Bandwidth . . . . . . . . . . . . . . . . . . . . . . . . . . . . . . . . . . . . . . . . . . . . . . . . . . . . . . . . . . . 233
Spectrum Emission Mask . . . . . . . . . . . . . . . . . . . . . . . . . . . . . . . . . . . . . . . . . . . . . . . . . . . . . . . 233
Spurious Emissions . . . . . . . . . . . . . . . . . . . . . . . . . . . . . . . . . . . . . . . . . . . . . . . . . . . . . . . . . . . . 234
Code Domain . . . . . . . . . . . . . . . . . . . . . . . . . . . . . . . . . . . . . . . . . . . . . . . . . . . . . . . . . . . . . . . . . 235
QPSK EVM . . . . . . . . . . . . . . . . . . . . . . . . . . . . . . . . . . . . . . . . . . . . . . . . . . . . . . . . . . . . . . . . . . . 236
Modulation Accuracy (Composite EVM) . . . . . . . . . . . . . . . . . . . . . . . . . . . . . . . . . . . . . . . . . . . . 237
Power Control . . . . . . . . . . . . . . . . . . . . . . . . . . . . . . . . . . . . . . . . . . . . . . . . . . . . . . . . . . . . . . . . 238
In-Band Frequency Range . . . . . . . . . . . . . . . . . . . . . . . . . . . . . . . . . . . . . . . . . . . . . . . . . . . . . . . . 239
25. WLAN Measurement Application
Measurements . . . . . . . . . . . . . . . . . . . . . . . . . . . . . . . . . . . . . . . . . . . . . . . . . . . . . . . . . . . . . . . . . 242
Channel Power. . . . . . . . . . . . . . . . . . . . . . . . . . . . . . . . . . . . . . . . . . . . . . . . . . . . . . . . . . . . . . . . 242
Power Statistics CCDF. . . . . . . . . . . . . . . . . . . . . . . . . . . . . . . . . . . . . . . . . . . . . . . . . . . . . . . . . . 246
Occupied Bandwidth . . . . . . . . . . . . . . . . . . . . . . . . . . . . . . . . . . . . . . . . . . . . . . . . . . . . . . . . . . . 247
Power vs. Time. . . . . . . . . . . . . . . . . . . . . . . . . . . . . . . . . . . . . . . . . . . . . . . . . . . . . . . . . . . . . . . . 248
Spectrum Emission Mask . . . . . . . . . . . . . . . . . . . . . . . . . . . . . . . . . . . . . . . . . . . . . . . . . . . . . . . 248
Spurious Emission . . . . . . . . . . . . . . . . . . . . . . . . . . . . . . . . . . . . . . . . . . . . . . . . . . . . . . . . . . . . 257
CCK 11Mbps . . . . . . . . . . . . . . . . . . . . . . . . . . . . . . . . . . . . . . . . . . . . . . . . . . . . . . . . . . . . . . . . . 263
List Sequence Measurements. . . . . . . . . . . . . . . . . . . . . . . . . . . . . . . . . . . . . . . . . . . . . . . . . . . . . . 264
. . . . . . . . . . . . . . . . . . . . . . . . . . . . . . . . . . . . . . . . . . . . . . . . . . . . . . . . . . . . . . . . . . . . . . . . . . . . 264
11
Page 12

Contents
Transmit Power . . . . . . . . . . . . . . . . . . . . . . . . . . . . . . . . . . . . . . . . . . . . . . . . . . . . . . . . . . . . . . . . 264
Transmit Output Spectrum . . . . . . . . . . . . . . . . . . . . . . . . . . . . . . . . . . . . . . . . . . . . . . . . . . . . . . 266
64QAM EVM . . . . . . . . . . . . . . . . . . . . . . . . . . . . . . . . . . . . . . . . . . . . . . . . . . . . . . . . . . . . . . . . . . 271
CCK 11Mbps . . . . . . . . . . . . . . . . . . . . . . . . . . . . . . . . . . . . . . . . . . . . . . . . . . . . . . . . . . . . . . . . . 275
In-Band Frequency Range for Warranted Specifications. . . . . . . . . . . . . . . . . . . . . . . . . . . . . . . . . 276
12
Page 13

Keysight X-Series Signal Analyzer
N9010B
Specification Guide
1 EXA Signal Analyzer
This chapter contains the specifications for the core signal analyzer. The
specifications and characteristics for the measurement applications and
options are covered in the chapters that follow.
13
Page 14

EXA Signal Analyzer
Definitions and Requirements
Definitions and Requirements
This book contains signal analyzer specifications and supplemental
information. The distinction among specifications, typical performance, and
nominal values are described as follows.
Definitions
— Specifications describe the performance of parameters covered by the
product warranty (temperature = 5 to 55°C also referred to as "Full
temperature range" or "Full range", unless otherwise noted).
— 95th percentile values indicate the breadth of the population (≈2σ) of
performance tolerances expected to be met in 95% of the cases with a 95%
confidence, for any ambient temperature in the range of 20 to 30°C. In
addition to the statistical observations of a sample of instruments, these
values include the effects of the uncertainties of external calibration
references. These values are not warranted. These values are updated
occasionally if a significant change in the statistically observed behavior of
production instruments is observed.
— Typical describes additional product performance information that is not
covered by the product warranty. It is performance beyond specification
that 80% of the units exhibit with a 95% confidence level over the
temperature range 20 to 30°C. Typical performance does not include
measurement uncertainty.
— Nominal values indicate expected performance, or describe product
performance that is useful in the application of the product, but is not
covered by the product warranty.
Conditions Required to Meet Specifications
The following conditions must be met for the analyzer to meet its
specifications.
— The analyzer is within its calibration cycle. See the General section of this
chapter.
— Under auto couple control, except that Auto Sweep Time Rules = Accy.
— For signal frequencies < 10 MHz, DC coupling applied.
— Any analyzer that has been stored at a temperature range inside the
allowed storage range but outside the allowed operating range must be
stored at an ambient temperature within the allowed operating range for at
least two hours before being turned on.
— The analyzer has been turned on at least 30 minutes with Auto Align set to
Normal, or if Auto Align is set to Off or Partial, alignments must have been
run recently enough to prevent an Alert message. If the Alert condition is
changed from “Time and Temperature” to one of the disabled duration
14
Page 15

EXA Signal Analyzer
Definitions and Requirements
choices, the analyzer may fail to meet specifications without informing the
user. If Auto Align is set to Light, performance is not warranted, and
nominal performance will degrade to become a factor of 1.4 wider for any
specification subject to alignment, such as amplitude tolerances.
Certification
Keysight Technologies certifies that this product met its published
specifications at the time of shipment from the factory. Keysight Technologies
further certifies that its calibration measurements are traceable to the
International System of Units (SI) via national metrology institutes
(www.keysight.com/find/NMI) that are signatories to the CIPM Mutual
Recognition Arrangement.
15
Page 16
EXA Signal Analyzer
Frequency and Time
Frequency and Time
Description Specifications Supplemental Information
Frequency Range
Maximum Frequency
Option 503 3.6 GHz
Option 507 7 GHz
Option 513 13.6 GHz
Option 526 26.5 GHz
Option 532 32 GHz
Option 544 44 GHz
Preamp Option P03 3.6 GHz
Preamp Option P07 7 GHz
Preamp Option P13 13.6 GHz
Preamp Option P26 26.5 GHz
Preamp Option P32 32 GHz
Preamp Option P44 44 GHz
Minimum Frequency
Preamp
Off 10 MHz 10 Hz
On 10 MHz 100 kHz
Band Harmonic
0 (10 Hz to 3.6 GHz) 1− 1 Options 503, 507, 513, 526, 532, 544
1 (3.5 GHz to 7 GHz) 1− 1 Option 507
1 (3.5 GHz to 8.4 GHz) 1− 1 Options 508, 513, 526
1 (3.5 GHz to 8.4 GHz) 1− 1 Options 513, 526, 532, 544
2 (8.3 GHz to 13.6 GHz) 1− 2 Options 513, 526, 532, 544
AC Coupled
Mixing Mode
a
DC Coupled
LO Multiple (N
b
) Band Overlaps
c
3 (13.5 to 17.1 GHz) 2− 2 Options 526, 532, 544
4 (17.0 to 26.5 GHz) 2− 4 Options 526, 532, 544
5 (26.4 GHz to 32 GHz) 2− 4 Option 532
5 (26.4 GHz to 34.5 GHz) 2− 4 Option 544
16
Page 17

EXA Signal Analyzer
Frequency and Time
Description Specifications Supplemental Information
6 (34.4 GHz to 44 GHz) 4− 8 Option 544
a. AC Coupled only applicable to Freq Options 503, 507, 513, and 526.
b. N is the LO multiplication factor. For negative mixing modes (as indicated by the “−” in the “Harmonic Mixing
Mode” column), the desired 1st LO harmonic is higher than the tuned frequency by the 1st IF (5.1225 GHz for
band 0, 322.5 MHz for all other bands).
c. In the band overlap regions, for example, 3.5 to 3.6 GHz, the analyzer may use either band for measurements, in
this example Band 0 or Band 1. The analyzer gives preference to the band with the better overall specifications
(which is the lower numbered band for all frequencies below 26 GHz), but will choose the other band if doing so
is necessary to achieve a sweep having minimum band crossings. For example, with CF = 3.58 GHz, with a span
of 40 MHz or less, the analyzer uses Band 0, because the stop frequency is 3.6 GHz or less, allowing a span
without band crossings in the preferred band. If the span is between 40 and 160 MHz, the analyzer uses Band 1,
because the start frequency is above 3.5 GHz, allowing the sweep to be done without a band crossing in Band 1,
though the stop frequency is above 3.6 GHz, preventing a Band 0 sweep without band crossing. With a span
greater than 160 MHz, a band crossing will be required: the analyzer sweeps up to 3.6 GHz in Band 0; then executes a band crossing and continues the sweep in Band 1.
Specifications are given separately for each band in the band overlap regions. One of these specifications is for
the preferred band, and one for the alternate band. Continuing with the example from the previous paragraph
(3.58 GHz), the preferred band is band 0 (indicated as frequencies under 3.6 GHz) and the alternate band is
band 1 (3.5 to 8.4 GHz). The specifications for the preferred band are warranted. The specifications for the alternate band are not warranted in the band overlap region, but performance is nominally the same as those warranted specifications in the rest of the band. Again, in this example, consider a signal at 3.58 GHz. If the sweep
has been configured so that the signal at 3.58 GHz is measured in Band 1, the analysis behavior is nominally as
stated in the Band 1 specification line (3.5 to 8.4 GHz) but is not warranted. If warranted performance is necessary for this signal, the sweep should be reconfigured so that analysis occurs in Band 0. Another way to express
this situation in this example Band 0/Band 1 crossing is this: The specifications given in the “Specifications” column which are described as “3.5 to 7.0 GHz” represent nominal performance from 3.5 to 3.6 GHz, and warranted performance from 3.6 to 7.0 GHz
17
Page 18

EXA Signal Analyzer
Frequency and Time
Description Specifications Supplemental
Information
Standard Frequency Reference
Accuracy ±[(time since last adjustment × aging
rate) + temperature stability +
calibration accuracy
a
]
Temperature Stability
−6
20 to 30°C
Full temperature range
Aging Rate
±2 × 10
±2 × 10
±1 × 10
−6
−6
/year
b
−8
−6
≤10 Hz × N
(nominal)
c
p-p in 20 ms
Achievable Initial Calibration Accuracy
Settability
Residual FM
(Center Frequency = 1 GHz
±1.4 × 10
±2 × 10
10 Hz RBW, 10 Hz VBW)
a. Calibration accuracy depends on how accurately the frequency standard was adjusted to 10 MHz. If the adjust-
ment procedure is followed, the calibration accuracy is given by the specification “Achievable Initial Calibration
Accuracy.”
b. For periods of one year or more.
c. N is the LO multiplication factor.
18
Page 19

EXA Signal Analyzer
Frequency and Time
Description Specifications Supplemental Information
Precision Frequency Reference
(Option PFR)
Accuracy ±[(time since last adjustment ×
aging rate) + temperature
stability + calibration accuracy
a]b
Temperature Stability
20 to 30°C
Full temperature range
Aging Rate
±1.5 × 10
±5 × 10
−8
−8
Nominally linear
−10
±5 × 10
Total Aging
−7
1 Year
2 Years
Settability
Warm-up and Retrace
d
300 s after turn on
900 s after turn on
Achievable Initial Calibration Accuracy
e
±1 × 10
±1.5 × 10
±2 × 10
±4 × 10
−9
−8
−7
Nominal
±1 × 10
±1 × 10
−7
of final frequency
−8
of final frequency
Standby power to reference oscillator Not supplied
Residual FM
(Center Frequency = 1 GHz
≤0.25 Hz × N
(nominal)
10 Hz RBW, 10 Hz VBW)
c
/day (nominal)
f
p-p in 20 ms
a. Calibration accuracy depends on how accurately the frequency standard was adjusted to 10 MHz. If the adjust-
ment procedure is followed, the calibration accuracy is given by the specification “Achievable Initial Calibration
Accuracy.”
b. The specification applies after the analyzer has been powered on for four hours.
c. Narrow temperature range performance is nominally linear with temperature. For example, for
25±3º C, the stability would be only three-fifths as large as the warranted 25±5º C, thus ±0.9 × 10
−8
.
d. Standby mode does not apply power to the oscillator. Therefore warm-up applies every time the power is
turned on. The warm-up reference is one hour after turning the power on. Retracing also occurs every time
warm-up occurs. The effect of retracing is included within the “Achievable Initial Calibration Accuracy” term of
the Accuracy equation.
19
Page 20

EXA Signal Analyzer
Frequency and Time
e. The achievable calibration accuracy at the beginning of the calibration cycle includes these effects:
1) Temperature difference between the calibration environment and the use environment
2) Orientation relative to the gravitation field changing between the calibration environment and the use envi-
ronment
3) Retrace effects in both the calibration environment and the use environment due to turning the instrument
power off.
4) Settability
f. N is the LO multiplication factor.
Description Specifications Supplemental Information
Frequency Readout Accuracy ±(marker freq × freq ref accy. + 0.25% ×
a
+ 2 Hz + 0.5 × horizontal
)
Example for EMC
span + 5% × RBW
resolution
d
b
Single detector only
±0.0032% (nominal)
a. The warranted performance is only the sum of all errors under autocoupled conditions. Under non-autocoupled
conditions, the frequency readout accuracy will nominally meet the specification equation, except for conditions
in which the RBW term dominates, as explained in examples below. The nominal RBW contribution to frequency
readout accuracy is 2% of RBW for RBWs from 1 Hz to 390 kHz, 4% of RBW from 430 kHz through 3 MHz (the
widest autocoupled RBW), and 30% of RBW for the (manually selected) 4, 5, 6 and 8 MHz RBWs.
First example: a 120 MHz span, with autocoupled RBW. The autocoupled ratio of span to RBW is 106:1, so
the RBW selected is 1.1 MHz. The 5% × RBW term contributes only 55 kHz to the total frequency readout accuracy, compared to 300 kHz for the 0.25% × span term, for a total of 355 kHz. In this example, if an instrument
had an unusually high RBW centering error of 7% of RBW (77 kHz) and a span error of 0.20% of span (240 kHz),
the total actual error (317 kHz) would still meet the computed specification (355 kHz).
Second example: a 20 MHz span, with a 4 MHz RBW. The specification equation does not apply because the
Span: RBW ratio is not autocoupled. If the equation did apply, it would allow 50 kHz of error (0.25%) due to the
span and 200 kHz error (5%) due to the RBW. For this non-autocoupled RBW, the RBW error is nominally 30%,
or 1200 kHz.
b. Horizontal resolution is due to the marker reading out one of the sweep points. The points are spaced by
span/(Npts –1), where Npts is the number of sweep points. For example, with the factory preset value of 1001
sweep points, the horizontal resolution is span/1000. However, there is an exception: When both the detector
mode is “normal” and the span > 0.25 × (Npts –1) × RBW, peaks can occur only in even-numbered points, so
the effective horizontal resolution becomes doubled, or span/500 for the factory preset case. When the RBW is
autocoupled and there are 1001 sweep points, that exception occurs only for spans > 750 MHz.
c. Specifications apply to traces in most cases, but there are exceptions. Specifications always apply to the peak
detector. Specifications apply when only one detector is in use and all active traces are set to Clear Write. Specifications also apply when only one detector is in use in all active traces and the "Restart" key has been pressed
since any change from the use of multiple detectors to a single detector. In other cases, such as when multiple
simultaneous detectors are in use, additional errors of 0.5, 1.0 or 1.5 sweep points will occur in some detectors,
depending on the combination of detectors in use.
d. In most cases, the frequency readout accuracy of the analyzer can be exceptionally good. As an example, Key-
sight has characterized the accuracy of a span commonly used for Electro-Magnetic Compatibility (EMC) testing
using a source frequency locked to the analyzer. Ideally, this sweep would include EMC bands C and D and thus
sweep from 30 to 1000 MHz. Ideally, the analysis bandwidth would be 120 kHz at −6 dB, and the spacing of the
points would be half of this (60 kHz). With a start frequency of 30 MHz and a stop frequency of 1000.2 MHz and
a total of 16168 points, the spacing of points is ideal. The detector used was the Peak detector. The accuracy of
frequency readout of all the points tested in this span was with ±0.0032% of the span. A perfect analyzer with
this many points would have an accuracy of ±0.0031% of span. Thus, even with this large number of display
points, the errors in excess of the bucket quantization limitation were negligible.
c
20
Page 21

EXA Signal Analyzer
Frequency and Time
Description Specifications Supplemental Information
Frequency Counter
a
See note
b
Count Accuracy ±(marker freq × freq ref accy. + 0.100 Hz)
Delta Count Accuracy ±(delta freq. × freq ref accy. + 0.141 Hz)
Resolution 0.001 Hz
a. Instrument conditions: RBW = 1 kHz, gate time = auto (100 ms), S/N ≥ 50 dB, frequency = 1 GHz
b. If the signal being measured is locked to the same frequency reference as the analyzer, the specified count
accuracy is ±0.100 Hz under the test conditions of footnote a. This error is a noisiness of the result. It will
increase with noisy sources, wider RBWs, lower S/N ratios, and source frequencies > 1 GHz.
Description Specifications Supplemental Information
Frequency Span
Range
Option 503 0 Hz, 10 Hz to 3.6 GHz
Option 507 0 Hz, 10 Hz to 7 GHz
Option 513 0 Hz, 10 Hz to 13.6 GHz
Option 526 0 Hz, 10 Hz to 26.5 GHz
Option 532 0 Hz, 10 Hz to 32 GHz
Option 544 0 Hz, 10 Hz to 44 GHz
Resolution 2 Hz
Span Accuracy
Swept
FFT
±(0.25% × span + horizontal resolution
±(0.1% × span + horizontal resolution
a
)
a
)
a. Horizontal resolution is due to the marker reading out one of the sweep points. The points are spaced by
span/(Npts − 1), where Npts is the number of sweep points. For example, with the factory preset value of 1001
sweep points, the horizontal resolution is span/1000. However, there is an exception: When both the detector
mode is “normal” and the span > 0.25 × (Npts − 1) × RBW, peaks can occur only in even-numbered points, so
the effective horizontal resolution becomes doubled, or span/500 for the factory preset case. When the RBW is
auto coupled and there are 1001 sweep points, that exception occurs only for spans > 750 MHz.
21
Page 22

EXA Signal Analyzer
Frequency and Time
Description Specifications Supplemental Information
Sweep Time and Trigger
Sweep Time Range
Span = 0 Hz
Span ≥ 10 Hz
1 μs to 6000 s
1 ms to 4000 s
Sweep Time Accuracy
Span ≥ 10 Hz, swept
Span ≥ 10 Hz, FFT
Span = 0 Hz
±0.01% (nominal)
±40% (nominal)
±0.01% (nominal)
Sweep Trigger Free Run, Line, Video, External 1,
External 2, RF Burst, Periodic Timer
Delayed Trigger
a
Range
Span ≥ 10 Hz −150 ms to 500 ms
Span = 0 Hz
−10 s to +500 ms
b
Resolution 0.1 μs
a. Delayed trigger is available with line, video, RF burst and external triggers.
b. Prior to A.19.28 software, zero span trigger delay was limited to -150 ms to 500 ms.
22
Page 23
EXA Signal Analyzer
Frequency and Time
Description Specifications Supplemental Information
Triggers Additional information on some of the triggers and
gate sources
Video Independent of Display Scaling and Reference Level
Minimum settable level −170 dBm Useful range limited by noise
Maximum usable level
Highest allowed mixer level
a
+ 2 dB (nominal)
Detector and Sweep Type relationships
Sweep Type = Swept
Detector = Normal, Peak, Sample or
Negative Peak
Triggers on the signal before detection, which is
similar to the displayed signal
Detector = Average Triggers on the signal before detection, but with a
single-pole filter added to give similar smoothing to
that of the average detector
Sweep Type = FFT Triggers on the signal envelope in a bandwidth
wider than the FFT width
RF Burst
Level Range
−40 to −10 dBm plus attenuation (nominal)
b
Level Accuracy ±2 dB + Absolute Amplitude Accuracy (nominal)
Bandwidth (−10 dB) 16 MHz (nominal)
Frequency Limitations If the start or center frequency is too close to zero,
LO feedthrough can degrade or prevent triggering.
How close is too close depends on the bandwidth
listed above.
External Triggers See “Trigger Inputs” on page 66
TV Triggers Triggers on the leading edge of the selected sync
pulse of standardized TV signals.
Amplitude Requirements –65 dBm minimum video carrier power at the input
mixer, nominal
Compatible Standards NTSC-M,
NTSC-Japan,
NTSC-4.43,
PAL-M, PAL-N, PAL-N
Combination,
PAL-B/-D/-G/-H/-I.
PAL-60, SECAM-L
Field Selection Entire Frame, Field
One, Field Two
23
Page 24
EXA Signal Analyzer
Frequency and Time
Description Specifications Supplemental Information
Line Selection 1 to 525, or 1 to 625,
standard dependent
a. The highest allowed mixer level depends on the IF Gain. It is nominally –10 dBm for Preamp Off and IF Gain =
Low.
b. Noise will limit trigger level range at high frequencies, such as above 15 GHz.
Description Specifications Supplemental Information
Gated Sweep
Gate Methods Gated LO
Gated Video
Gated FFT
Span Range Any span
Gate Delay Range 0 to 100.0 s
Gate Delay Settability 4 digits, ≥100 ns
Gate Delay Jitter 33.3 ns p-p (nominal)
Gate Length Range
(Except Method = FFT)
Gated Frequency and
Amplitude Errors
Gate Sources External 1
Description Specifications Supplemental Information
Number of Frequency Sweep Points
(buckets)
Factory preset 1001
Range 1 to 100,001 Zero and non-zero spans
100 ns to 5.0 s Gate length for the FFT method is fixed at
1.83/RBW, with nominally 2% tolerance.
Nominally no additional error for gated
measurements when the Gate Delay is greater
than the MIN FAST setting
Pos or neg edge triggered
External 2
Line
RF Burst
Periodic
24
Page 25
EXA Signal Analyzer
Frequency and Time
Nominal Measurement Time vs. Span [Plot]
25
Page 26

EXA Signal Analyzer
Frequency and Time
Description Specifications Supplemental Information
Resolution Bandwidth (RBW)
Range (−3.01 dB bandwidth) 1 Hz to 8 MHz
Bandwidths above 3 MHz are 4, 5, 6, and
8 MHz.
Bandwidths 1 Hz to 3 MHz are spaced at
10% spacing using the E24 series (24
per decade): 1.0, 1.1, 1.2, 1.3, 1.5, 1.6,
1.8, 2.0, 2.2, 2.4, 2.7, 3.0, 3.3, 3.6, 3.9,
4.3, 4.7, 5.1, 5.6, 6.2, 6.8, 7.5, 8.2, 9.1 in
each decade.
Power bandwidth accuracy
a
RBW Range CF Range
1 Hz to 750 kHz All ±1.0% (0.044 dB)
820 kHz to 1.2 MHz <3.6 GHz ±2.0% (0.088 dB)
1.3 to 2.0 MHz <3.6 GHz ±0.07 dB (nominal)
2.2 to 3 MHz <3.6 GHz 0 to −0.2 dB (nominal)
4 to 8 MHz <3.6 GHz 0 to −0.4 dB (nominal)
Noise BW to RBW ratio
Accuracy (−3.01 dB bandwidth)
b
c
1.056 ±2% (nominal)
1 Hz to 1.3 MHz RBW ±2% (nominal)
1.5 MHz to 3 MHz RBW
CF ≤ 3.6 GHz
CF > 3.6 GHz
4 MHz to 8 MHz RBW
CF ≤ 3.6 GHz
CF > 3.6 GHz
±7% (nominal)
±8% (nominal)
±15% (nominal)
±20% (nominal)
Selectivity (−60 dB/−3 dB) 4.1:1 (nominal)
a. The noise marker, band power marker, channel power and ACP all compute their results using the power band-
width of the RBW used for the measurement. Power bandwidth accuracy is the power uncertainty in the results
of these measurements due only to bandwidth-related errors. (The analyzer knows this power bandwidth for
each RBW with greater accuracy than the RBW width itself, and can therefore achieve lower errors.) The warranted specifications shown apply to the Gaussian RBW filters used in swept and zero span analysis. There are
four different kinds of filters used in the spectrum analyzer: Swept Gaussian, Swept Flattop, FFT Gaussian and
FFT Flattop. While the warranted performance only applies to the swept Gaussian filters, because only they are
kept under statistical process control, the other filters nominally have the same performance.
26
Page 27
EXA Signal Analyzer
Frequency and Time
b. The ratio of the noise bandwidth (also known as the power bandwidth) to the RBW has the nominal value and
tolerance shown. The RBW can also be annotated by its noise bandwidth instead of this 3 dB bandwidth. The
accuracy of this annotated value is similar to that shown in the power bandwidth
accuracy specification.
c. Resolution Bandwidth Accuracy can be observed at slower sweep times than auto-coupled conditions. Normal
sweep rates cause the shape of the RBW filter displayed on the analyzer screen to widen by nominally 6%. This
widening declines to 0.6% nominal when the Swp Time Rules key is set to Accuracy instead of Normal. The true
bandwidth, which determines the response to impulsive signals and noise-like signals, is not affected by the
sweep rate.
Description Specification Supplemental information
Analysis Bandwidth
a
Standard 25 MHz
With Option B40 40 MHz
a. Analysis bandwidth is the instantaneous bandwidth available about a center frequency over which the input sig-
nal can be digitized for further analysis or processing in the time, frequency, or modulation domain.
Description Specifications Supplemental Information
Preselector Bandwidth
Mean Bandwidth at CF
a
Freq option ≤526 Freq option >526
5 GHz 58 MHz 46 MHz
10 GHz 57 MHz 52 MHz
15 GHz 59 MHz 53 MHz
20 GHz 64 MHz 55 MHz
25 GHz 74 MHz 56 MHz
35 GHz 62 MHz
44 GHz 70 MHz
Standard Deviation 9% 7%
–3 dB Bandwidth –7.5% relative to –4 dB bandwidth, nominal
a. The preselector can have a significant passband ripple. To avoid ambiguous results, the –4 dB bandwidth is
characterized.
27
Page 28

EXA Signal Analyzer
Frequency and Time
Description Specifications Supplemental Information
Video Bandwidth (VBW)
Range Same as Resolution Bandwidth range
plus wide-open VBW (labeled 50 MHz)
Accuracy ±6% (nominal)
in swept mode and zero span
a. For FFT processing, the selected VBW is used to determine a number of averages for FFT results. That number is
chosen to give roughly equivalent display smoothing to VBW filtering in a swept measurement. For example, if
VBW = 0.1 × RBW, four FFTs are averaged to generate one result.
a
28
Page 29

EXA Signal Analyzer
Amplitude Accuracy and Range
Amplitude Accuracy and Range
Description Specifications Supplemental Information
Measurement Range
Preamp Off Displayed Average Noise Level to +30 dBm
Preamp On Displayed Average Noise Level to +30 dBm Option P03, P07, P13,
P26, P32, P44
Input Attenuation Range
Standard 0 to 60 dB, in 10 dB steps
With Option FSA 0 to 60 dB, in 2 dB steps
Description Specifications Supplemental Information
Maximum Safe Input Level Applies with or without preamp
(Option P03, P07, P13, P26, P32, P44)
Average Total Power +30 dBm (1 W)
Peak Pulse Power
(≤10 μs pulse width,
≤1% duty cycle,
input attenuation ≥ 30 dB)
DC voltage
DC Coupled ±0.2 Vdc
AC Coupled ±100 Vdc
Description Specifications Supplemental Information
Display Range
Log Scale Ten divisions displayed;
Linear Scale Ten divisions
+50 dBm (100 W)
0.1 to 1.0 dB/division in 0.1 dB steps, and
1 to 20 dB/division in 1 dB steps
29
Page 30
EXA Signal Analyzer
Amplitude Accuracy and Range
Description Specifications Supplemental Information
Marker Readout
Resolution
Log (decibel) units
Trace Averaging Off, on-screen 0.01 dB
Trace Averaging On or remote 0.001 dB
Linear units resolution ≤1% of signal level (nominal)
30
Page 31
EXA Signal Analyzer
Amplitude Accuracy and Range
Frequency Response
Description Specifications Supplemental Information
Frequency Response Refer to the footnote for
Maximum error relative to reference
(
condition (50 MHz)
Mechanical attenuator only
c
Swept operation
b
Attenuation 10 dB)
Option 532 or 544 (mmW)
Option 503, 507, 513, or 526 (RF/μW)
20 to 30°C Full range 95th Percentile (≈2σ)
9 kHz to 10 MHz x ±0.8 dB ±1.0 dB ±0.40 dB
Band Overlaps on
page 16.
Freq Option 526 only: Modes
above 18 GHz
a
9 kHz to 10 MHz
d
10 MHz
to 3.6 GHz
10 to 50 MHz
50 MHz to 3.6 GHz
3.5 to 7 GHz
ef
3.5 to 5.2 GHz
5.2 to 8.4 GHz
7 to 13.6 GHz
ef
ef
8.3 to 13.6 GHz
13.5 to 22 GHz
ef
13.5 to 17.1 GHz
17.0 to 22 GHz
ef
22.0 to 26.5 GHz
22.0 to 26.5 GHz
x ±0.6 dB ±0.8 dB ±0.28 dB
x
±0.6 dB ±0.65 dB ±0.21 dB
x ±0.45 dB ±0.57 dB ±0.21 dB
x ±0.45 dB ±0.70 dB ±0.20 dB
x ±2.0 dB ±3.0 dB ±0.69 dB
ef
x ±1.7 dB ±3.5 dB ±0.91 dB
x ±1.5 dB ±2.7 dB ±0.61 dB
x ±2.5 dB ±3.2 dB
ef
ef
x
±2.0 dB ±2.7 dB ±0.61 dB
x
±3.0 dB ±3.7 dB
x ±2.0 dB ±2.7 dB ±0.67 dB
±0.48 dB
±0.79 dB
x ±2.0 dB ±3.0 dB ±0.78 dB
ef
ef
x
±3.2 dB ±4.2 dB
x ±2.5 dB ±3.5 dB ±0.72 dB
±1.10 dB
26.4 to 34.5 GHz
34.4 to 44 GHz
ef
ef
x ±2.5 dB ±3.5 dB ±1.11 dB
x ±3.2 dB ±4.9 dB ±1.42 dB
a. Signal frequencies between 18 and 26.5 GHz are prone to additional response errors due to modes in the Type-N
conn
ector used with frequency Option 526. With the use of Type-N to APC 3.5 mm adapter part numbe
125
0-1744, there are nominally six such modes. The effect of these modes with this connector are included within
these specifications.
31
r
Page 32

EXA Signal Analyzer
Amplitude Accuracy and Range
b. See the Electronic Attenuator (Option EA3) chapter for Frequency Response using the electronic attenuator.
c. For Sweep Type = FFT, add the RF flatness errors of this table to the IF Frequency Response errors. An additional
error source, the error in switching between swept and FFT sweep types, is nominally ±0.01 dB and is included
within the “Absolute Amplitude Error” specifications.
d. Specifications apply with DC coupling at all frequencies. With AC coupling, specifications apply at frequencies of
50 MHz and higher. Statistical observations at 10 MHz show that most instruments meet the specifications, but a
few percent of instruments can be expected to have errors exceeding 0.5 dB at 10 MHz at the temperature
extreme. The effect at 20 to 50 MHz is negligible, but not warranted.
e. Specifications for frequencies > 3.5 GHz apply for sweep rates ≤100 MHz/ms.
f. Preselector centering applied.
Description Specifications Supplemental Information
IF Frequency Response
a
Modes above 18 GHz
b
(Demodulation and FFT
response relative to the
center frequency)
Center
Freq (GHz)
Span
(MHz)
c
Preselector
Max Errord
(Exception
e
)
Midwidth
(95th
Percentile)
Error
Slope (dB/MHz)
(95th
Percentile)
RMSf
(nominal)
<3.6 ≤10 ±0.40 dB ±0.12 dB ±0.10 0.04 dB
≥3.6, ≤26.5 ≤10 On 0.25 dB
g
≥3.6 ≤10
Off
±0.45 dB ±0.12 dB ±0.10 0.04 dB
>26.5 ≤10 On 0.35 dB
a. The IF frequency response includes effects due to RF circuits such as input filters, that are a function of RF fre-
quency, in addition to the IF passband effects.
b. Signal frequencies between 18 and 26.5 GHz are prone to additional response errors due to modes in the Type-N
connector used with frequency Option 526. With the use of Type-N to APC 3.5 mm adapter part number
1250-1744, there are nominally six such modes. These modes cause nominally up to −0.35 dB amplitude change,
with phase errors of nominally up to ±1.2°.
c. This column applies to the instantaneous analysis bandwidth in use. In the Spectrum Analyzer Mode, this would
be the FFT width.
d. The maximum error at an offset (f) from the center of the FFT width is given by the expression
± [Midwidth Error + (f × Slope)], but never exceeds ±Max Error. Here the Midwidth Error is the error at the center
frequency for a given FFT span. Usually, the span is no larger than the FFT width in which case the center of the
FFT width is the center frequency of the analyzer. When using the Spectrum Analyzer mode with an analyzer span
is wider than the FFT width, the span is made up of multiple concatenated FFT results, and thus has multiple centers of FFT widths; in this case the f in the equation is the offset from the nearest center. Performance is nominally
three times better at most center frequencies.
e. The specification does not apply for frequencies greater than 3.6 MHz from the center in FFT widths of 7.2 to 8
MHz.
f. The “rms” nominal performance is the standard deviation of the response relative to the center frequency, inte-
grated across the span. This performance measure was observed at a center frequency in each harmonic mixing
band, which is representative of all center frequencies; it is not the worst case frequency.
g. Option MPB is installed and enabled.
32
Page 33
EXA Signal Analyzer
Amplitude Accuracy and Range
Description Specifications Supplemental Information
IF Phase Linearity Deviation from mean phase linearity
Modes above 18 GHz
a
Center Freq (GHz) Span
(MHz)
Preselector Peak-to-peak
(nominal)
RMS (nominal)
≥0.02, <3.6 ≤10 n/a 0.4° 0.1°
c
≥3.6, ≤10
Off
0.4° 0.1°
≥3.6 (Option ≤526) ≤10 On 1.0° 0.2°
a. Signal frequencies between 18 and 26.5 GHz are prone to additional response errors due to modes in the
Type-N connector used with frequency Option 526. With the use Type-N to APC 3.5 mm adapter part number
1250-1744, there are nominally six such modes. These modes cause nominally up to −0.35 dB amplitude
change, with phase errors of nominally up to ±1.2°.
b. The listed performance is the standard deviation of the phase deviation relative to the mean phase deviation from
a linear phase condition, where the rms is computed across the span shown and over the range of center frequencies shown.
c. Option MPB is installed and enabled.
Description Specifications Supplemental Information
Absolute Amplitude Accuracy
At 50 MHz
a
20 to 30°C
Full temperature range
±0.40 dB
±0.43 dB
±0.15 dB (95th percentile)
b
At all frequencies
a
20 to 30°C
Full temperature range
95th Percentile Absolute
Amplitude Accuracy
b
±(0.40 dB + frequency response)
±(0.43 dB + frequency response)
±0.27 dB
(Wide range of signal levels,
RBWs, RLs, etc.,
0.01 to 3.6 GHz,
Atten = 10 dB)
Amplitude Reference Accuracy ±0.05 dB (nominal)
Preamp On
c
±(0.39 dB + frequency response)
(nominal)
33
Page 34

EXA Signal Analyzer
Amplitude Accuracy and Range
a. Absolute amplitude accuracy is the total of all amplitude measurement errors, and applies over the following
subset of settings and conditions: 1 Hz ≤ RBW ≤ 1 MHz; Input signal −10 to −50 dBm (details below); Input
attenuation 10 dB; span < 5 MHz (nominal additional error for span ≥ 5 MHz is 0.02 dB); all settings auto-coupled except Swp Time Rules = Accuracy; combinations of low signal level and wide RBW use VBW ≤ 30 kHz to
reduce noise. When using FFT sweeps, the signal must be at the center frequency.
This absolute amplitude accuracy specification includes the sum of the following individual specifications under
the conditions listed above: Scale Fidelity, Reference Level Accuracy, Display Scale Switching Uncertainty, Resolution Bandwidth Switching Uncertainty, 50 MHz Amplitude Reference Accuracy, and the accuracy with which
the instrument aligns its internal gains to the 50 MHz Amplitude Reference.
The only difference between signals within the range ending at –50 dBm and those signals below that level is
the scale fidelity. Our specifications show the possibility of increased errors below –80 dBm at the mixer, thus
–70 dBm at the input. Therefore, one reasonably conservative approach to estimating the Absolute Amplitude
Uncertainty below –70 dBm at the mixer would be to add an additional
±0.10 dB (the difference between the above –80 dBm at the mixer scale fidelity at the lower level scale
fidelity) to the Absolute Amplitude Uncertainty.
b. Absolute Amplitude Accuracy for a wide range of signal and measurement settings, covers the 95th percentile
proportion with 95% confidence. Here are the details of what is covered and how the computation is made:
The wide range of conditions of RBW, signal level, VBW, reference level and display scale are discussed in footnote a. There are 44 quasi-random combinations used, tested at a 50 MHz signal frequency. We compute the
95th percentile proportion with 95% confidence for this set observed over a statistically significant number of
instruments. Also, the frequency response relative to the 50 MHz response is characterized by varying the signal
across a large number of quasi-random verification frequencies that are chosen to not correspond with the frequency response adjustment frequencies. We again compute the 95th percentile proportion with 95% confidence for this set observed over a statistically significant number of instruments. We also compute the 95th
percentile accuracy of tracing the calibration of the 50 MHz absolute amplitude accuracy to a national standards organization. We also compute the 95th percentile accuracy of tracing the calibration of the relative frequency response to a national standards organization. We take the root-sum-square of these four independent
Gaussian parameters. To that rss we add the environmental effects of temperature variations across the 20 to
30°C range. These computations and measurements are made with the mechanical attenuator only in circuit,
set to the reference state of 10 dB.
A similar process is used for computing the result when using the electronic attenuator under a wide range of
settings: all even settings from 4 through 24 dB inclusive, with the mechanical attenuator set to 10 dB. Then the
worst of the two computed 95th percentile results (they ere very close) is shown.
c. Same settings as footnote a, except that the signal level at the preamp input is −40 to −80 dBm. Total power at
preamp (dBm) = total power at input (dBm) minus input attenuation (dB). This specification applies for signal
frequencies above 100 kHz.
34
Page 35
EXA Signal Analyzer
Amplitude Accuracy and Range
Description Specifications Supplemental Information
Input Attenuation Switching Uncertainty Refer to the footnote for
Band Overlaps on page 16
50 MHz (reference frequency) ±0.20 dB ±0.08 dB (typical)
Attenuation > 2 dB, preamp off
(Relative to 10 dB (reference setting))
9 kHz to 3.6 GHz ±0.3 dB (nominal)
3.5 to 7.0 GHz ±0.5 dB (nominal)
7.0 to 13.6 GHz ±0.7 dB (nominal)
13.5 to 26.5 GHz ±0.7 dB (nominal)
26.5 to 44 GHz ±1.0 dB (nominal)
Description Specifications Supplemental Information
RF Input VSWR
Nominal
a
at tuned frequency, DC Coupled
10 dB attenuation, 50 MHz 1.07:1
Input Attenuation
Frequency 0 dB ≥10 dB
Option ≤526
10 MHz to 3.6 GHz <2.2:1 <1.2:1
3.6 to 26.5 GHz <1.9:1
Option >526
10 MHz to 3.6 GHz <2.2:1 <1.2:1
3.6 to 26.5 GHz <1.5:1
26.5 to 44 GHz <1.8:1
RF calibrator (e.g. 50 MHz) is On Open input
Alignments running Open input for some, unless "All but RF" is selected
Preselector Centering Open input
a. The nominal SWR stated is at the worst case RF frequency in three representative instruments.
35
Page 36
EXA Signal Analyzer
Amplitude Accuracy and Range
Description Specifications Supplemental Information
Resolution Bandwidth Switching Uncertainty Relative to reference BW of 30 kHz,
1.0 Hz to 3 MHz RBW ±0.10 dB
verified in low band
a
Manually selected wide RBWs: 4, 5, 6, 8 MHz ±1.0 dB
a. RBW switching uncertainty is verified at 50 MHz. It is consistent for all measurements made without the prese-
lector, thus in Band 0 and also in higher bands with the Preselector Bypass option. In preselected bands, the
slope of the preselector passband can interact with the RBW shape to make an apparent additional RBW
switching uncertainty of nominally ±0.05 dB/MHz times the RBW.
Description Specifications Supplemental Information
Reference Level
Range
Log Units −170 to +23 dBm, in 0.01 dB steps
Linear Units Same as Log (707 pV to 3.16 V)
Accuracy
0 dB
a
a. Because reference level affects only the display, not the measurement, it causes no additional error in measure-
ment results from trace data or markers.
Description Specifications Supplemental Information
Display Scale Switching Uncertainty
Switching between Linear and Log
Log Scale Switching
0 dB
0 dB
a
a
a. Because Log/Lin and Log Scale Switching affect only the display, not the measurement, they cause no addi-
tional error in measurement results from trace data or markers.
36
Page 37

EXA Signal Analyzer
3
σ
320dB()110
SN⁄ 3dB+()20dB⁄()–
+log=
Amplitude Accuracy and Range
Description Specifications Supplemental Information
Display Scale Fidelity
ab
Absolute Log-Linear Fidelity
(Relative to the reference condition: −25 dBm
input through 10 dB attenuation, thus
−35 dBm at the input mixer)
Input mixer level
c
Linearity
−80 dBm ≤ ML ≤ −10 dBm ±0.15 dB
ML < −80 dBm ±0.25 dB
Relative Fidelity
d
Applies for mixer levelc range from −10 to
−80 dBm, mechanical attenuator only,
preamp off, and dither on.
Sum of the following terms: Nominal
high level term
instability term
slope term
prefilter term
Up to ±0.045 dB
Up to ±0.018 dB
From equation
Up to ±0.005 dB
e
f
g
a. Supplemental information: The amplitude detection linearity specification applies at all levels below −10 dBm at
the input mixer; however, noise will reduce the accuracy of low level measurements. The amplitude error due to
noise is determined by the signal-to-noise ratio, S/N. If the S/N is large (20 dB or better), the amplitude error
due to noise can be estimated from the equation below, given for the 3-sigma (three standard deviations) level.
The errors due to S/N ratio can be further reduced by averaging results. For large S/N (20 dB or better), the
3-sigma level can be reduced proportional to the square root of the number of averages taken.
b. The scale fidelity is warranted with ADC dither set to Medium. Dither increases the noise level by nominally only
0.1 dB for the most sensitive case (preamp Off, best DANL frequencies). With dither Off, scale fidelity for low
level signals, around −60 dBm or lower, will nominally degrade by 0.2 dB.
c. Mixer level = Input Level − Input Attenuation
d. The relative fidelity is the error in the measured difference between two signal levels. It is so small in many cases
that it cannot be verified without being dominated by measurement uncertainty of the verification. Because of
this verification difficulty, this specification gives nominal performance, based on numbers that are as conserva-
tively determined as those used in warranted specifications. We will consider one example of the use of the error
equation to compute the nominal performance.
Example: the accuracy of the relative level of a sideband around −60 dBm, with a carrier at −5 dBm, using atten-
uation = 10 dB, RBW = 3 kHz, evaluated with swept analysis. The high level term is evaluated with P1 =
−15 dBm and P2 = −70 dBm at the mixer. This gives a maximum error within ±0.025 dB. The instability term is
±0.018 dB. The slope term evaluates to ±0.050 dB. The prefilter term applies and evaluates to the limit of
±0.005 dB. The sum of all these terms is ±0.098 dB.
37
Page 38
EXA Signal Analyzer
Amplitude Accuracy and Range
e. Errors at high mixer levels will nominally be well within the range of ±0.045 dB × {exp[(P1 − Pref)/(8.69 dB)] −
x
exp[(P2 − Pref)/(8.69 dB)]} (exp is the natural exponent function, e
). In this expression, P1 and P2 are the powers of the two signals, in decibel units, whose relative power is being measured. Pref is −10 dBm (−10 dBm is
the highest power for which linearity is specified). All these levels are referred to the mixer level.
f. Slope error will nominally be well within the range of ±0.0009 × (P1 − P2). P1 and P2 are defined in footnote e.
g. A small additional error is possible. In FFT sweeps, this error is possible for spans under 4.01 kHz. For non-FFT
measurements, it is possible for RBWs of 3.9 kHz or less. The error is well within the range of ±0.0021 × (P1 P2) subject to a maximum of ±0.005 dB. (The maximum dominates for all but very small differences.) P1 and P2
are defined in footnote e.
Description Specifications Supplemental Information
Available Detectors Normal, Peak, Sample, Negative Peak,
Average
Average detector works on RMS,
Voltage and Logarithmic scales
38
Page 39

EXA Signal Analyzer
Dynamic Range
Dynamic Range
Gain Compression
Description Specifications Supplemental Information
1 dB Gain Compression Point (Two-tone)
20 MHz to 26.5 GHz (Option ≤526) +9 dBm (nominal)
20 MHz to 26.5 GHz (Option >526) +6 dBm (nominal)
26.5 to 44 GHz (Option >526) 0 dBm (nominal)
Clipping (ADC Over-range)
Any signal offset −10 dBm
Signal offset > 5 times IF prefilter bandwidth and IF
Gain set to Low
IF Prefilter Bandwidth
Zero Span or Sweep Type = FFT, –3 dB Bandwidth
f
Swept
, RBW =
≤3.9 kHz <4.01 kHz 8.9 kHz
FFT Width = (nominal)
abc
Maximum power at
d
mixer
(nominal)
Low frequency exceptions
+12 dBm (nominal)
e
4.3 to 27 kHz <28.81 kHz 79 kHz
30 to 160 kHz <167.4 kHz 303 kHz
180 to 390 kHz <411.9 kHz 966 kHz
430 kHz to 8 MHz <7.99 MHz 10.9 MHz
a. Large signals, even at frequencies not shown on the screen, can cause the analyzer to incorrectly measure
on-screen signals because of two-tone gain compression. This specification tells how large an interfering signal
must be in order to cause a 1 dB change in an on-screen signal.
b. Specified at 1 kHz RBW with 100 kHz tone spacing. The compression point will nominally equal the specification
for tone spacing greater than 5 times the prefilter bandwidth. At smaller spacings, ADC clipping may occur at a
level lower than the 1 dB compression point.
39
Page 40

EXA Signal Analyzer
Dynamic Range
c. Reference level and off-screen performance: The reference level (RL) behavior differs from some earlier analyz-
ers in a way that makes this analyzer more flexible. In other analyzers, the RL controlled how the measurement
was performed as well as how it was displayed. Because the logarithmic amplifier in these analyzers had both
range and resolution limitations, this behavior was necessary for optimum measurement accuracy. The logarithmic amplifier in this signal analyzer, however, is implemented digitally such that the range and resolution greatly
exceed other instrument limitations. Because of this, the analyzer can make measurements largely independent
of the setting of the RL without compromising accuracy. Because the RL becomes a display function, not a measurement function, a marker can read out results that are off-screen, either above or below, without any change
in accuracy. The only exception to the independence of RL and the way in which the measurement is performed
is in the input attenuation setting: When the input attenuation is set to auto, the rules for the determination of
the input attenuation include dependence on the reference level. Because the input attenuation setting controls
the tradeoff between large signal behaviors (third-order intermodulation, compression, and display scale fidelity) and small signal effects (noise), the measurement results can change with RL changes when the input atten-
uation is set to auto.
d. Mixer power level (dBm) = input power (dBm) − input attenuation (dB).
e. The ADC clipping level declines at low frequencies (below 50 MHz) when the LO feedthrough (the signal that
appears at 0 Hz) is within 5 times the prefilter bandwidth (see table) and must be handled by the ADC. For
example, with a 300 kHz RBW and prefilter bandwidth at 966 kHz, the clipping level reduces for signal frequen-
cies below 4.83 MHz. For signal frequencies below 2.5 times the prefilter bandwidth, there will be additional
reduction due to the presence of the image signal (the signal that appears at the negative of the input signal fre-
quency) at the ADC.
f. This table applies without Option FS1 or FS2, fast sweep, enabled. Option FS1 or FS2 is only enabled if the
license for FS1 or FS2 is present and one or more of the following options are also present:B40, MPB, or DP2.
With Option FS1 or FS2, this table applies for sweep rates that are manually chosen to be the same as or
slower than "traditional" sweep rates, instead of the much faster sweep rates, such as autocoupled sweep rates,
available with FS1. Sweep rate is defined to be span divided by sweep time. If the sweep rate is ≤1.1 times
RBW-squared, the table applies. Otherwise, compute an "effective RBW" = Span / (SweepTime × RBW). To
determine the IF Prefilter Bandwidth, look up this effective RBW in the table instead of the actual RBW. For
example, for RBW = 3 kHz, Span = 300 kHz, and Sweep time = 42 ms, we compute that Sweep Rate = 7.1
MHz/s, while RBW-squared is 9 MHz/s. So the Sweep Rate is <1.1 times RBW-squared and the table applies;
row 1 shows the IF Prefilter Bandwidth is nominally 8.9 kHz. If the sweep time is 1 ms, then the effective RBW
computes to 100 kHz. This would result in an IF Prefilter Bandwidth from the third row, nominally 303 kHz.
40
Page 41
EXA Signal Analyzer
Dynamic Range
Displayed Average Noise Level
Description Specifications Supplemental
Information
Displayed Average Noise Level
(DANL)
20 to 30°CFull range Typical
10 Hz x
20 Hz x
100 Hz x
1 kHz x
9 kHz to 1 MHz x –125 dBm (nominal)
a
mmW without Option B40, DP2, or MPB
mmW with Option B40, DP2, or MPB
RF/μW (Option 503, 507, 513, or 526)
9 kHz to 1 MHz
x x –90 dBm (nominal)
x x –100 dBm (nominal)
x x –110 dBm (nominal)
x x –120 dBm (nominal)
x x −130 dBm
Input terminated
Sample or Average detector
Averaging type = Log
0 dB input attenuation
IF Gain = High
1 Hz Resolution Bandwidth
Refer to the footnote for
Band Overlaps on
page 16.
1 to 10 MHz
1 MHz to 1.2 GHz
10 MHz to 2.1 GHz x −148 dBm −146 dBm −150 dBm
1.2 to 2.1 GHz
2.1 to 3.6 GHz x −147 dBm −145 dBm −149 dBm
2.1 to 3.6 GHz
3.5 to 7 GHz x −147 dBm −145 dBm −149 dBm
3.5 to 4.2 GHz
3.5 to 4.2 GHz
4.2 to 8.4 GHz
4.2 to 8.4 GHz
7 to 13.6 GHz x −143 dBm −141 dBm −147 dBm
8.3 to 13.6 GHz
8.3 to 13.6 GHz
b
x −147 dBm −145 dBm −149 dBm
x x −152 dBm −151 dBm −155 dBm
x x −151 dBm −150 dBm −154 dBm
x x −149 dBm −148 dBm −152 dBm
x −142 dBm −140 dBm −146 dBm
x −144 dBm −142 dBm −147 dBm
x −143 dBm −141 dBm −148 dBm
x −145 dBm −143 dBm −150 dBm
x −145 dBm −143 dBm −148 dBm
x −147 dBm −145 dBm −150 dBm
41
Page 42
EXA Signal Analyzer
Dynamic Range
Description Specifications Supplemental
Information
13.5 to 20 GHz x −137 dBm −134 dBm −142 dBm
13.5 to 20 GHz
13.5 to 20 GHz
x −142 dBm −140 dBm −146 dBm
x −145 dBm −143 dBm −148 dBm
20 to 26.5 GHz x −134 dBm −130 dBm −140 dBm
20 to 26.5 GHz
20 to 26.5 GHz
26.4 to 34 GHz
26.4 to 34 GHz
33.9 to 44 GHz
33.9 to 44 GHz
Additional DANL, IF Gain=Low
c
x −139 dBm −137 dBm −143 dBm
x −142 dBm −140 dBm −145 dBm
x −137 dBm −133 dBm −142 dBm
x −140 dBm −136 dBm −144 dBm
x −131 dBm −127 dBm −137 dBm
x −135 dBm −131 dBm −140 dBm
x x x −160.5 dBm (nominal)
a. DANL for zero span and swept is measured in a 1 kHz RBW and normalized to the narrowest available RBW,
because the noise figure does not depend on RBW and 1 kHz measurements are faster.
b. DANL below 10 MHz is affected by phase noise around the LO feedthrough signal. Specifications apply with the
best setting of the Phase Noise Optimization control, which is to choose the “Best Close-in φ Noise" for fre-
quencies below 25 kHz, and “Best Wide Offset φ Noise" for frequencies above 25 kHz.
c. Setting the IF Gain to Low is often desirable in order to allow higher power into the mixer without overload, bet-
ter compression and better third-order intermodulation. When the Swept IF Gain is set to Low, either by auto
coupling or manual coupling, there is noise added above that specified in this table for the IF Gain = High case.
That excess noise appears as an additional noise at the input mixer. This level has sub-decibel dependence on
center frequency. To find the total displayed average noise at the mixer for Swept IF Gain = Low, sum the pow-
ers of the DANL for IF Gain = High with this additional DANL. To do that summation, compute DANLtotal = 10 ×
log (10^(DANLhigh/10) + 10^(AdditionalDANL / 10)). In FFT sweeps, the same behavior occurs, except that FFT
IF Gain can be set to autorange, where it varies with the input signal level, in addition to forced High and Low
settings.
42
Page 43
EXA Signal Analyzer
Dynamic Range
Spurious Responses
Description Specifications Supplemental Information
Spurious Responses
Preamp Off
a
(see Band Overlaps on page 16)
Residual Responses
200 kHz to 8.4 GHz (swept)
Zero span or FFT or other frequencies
b
−100 dBm
−100 dBm (nominal)
Image Responses
Tuned Freq (f) Excitation Freq
Mixer Level
c
Response
10 MHz to 26.5 GHz f+45 MHz −10 dBm −75 dBc −99 dBc (typical)
10 MHz to 3.6 GHz f+10245 MHz −10 dBm −80 dBc −103 dBc (typical)
10 MHz to 3.6 GHz f+645 MHz −10 dBm −80 dBc −107 dBc (typical)
3.5 to 13.6 GHz f+645 MHz −10 dBm −75 dBc −87 dBc (typical)
13.5 to 17.1 GHz f+645 MHz −10 dBm −71 dBc −85 dBc (typical)
17.0 to 22 GHz f+645 MHz −10 dBm −68 dBc −82 dBc (typical)
22 to 26.5 GHz f+645 MHz −10 dBm −66 dBc −78 dBc (typical)
26.5 to 34.5 GHz f+645 MHz −30 dBm –70 dBc –94 dBc (typical)
34.4 to 44 GHz f+645 MHz −30 dBm –60 dBc –79 dBc (typical)
Other Spurious Responses
Carrier Frequency ≤26.5 GHz
First RF Order
d
(f ≥ 10 MHz from carrier)
Higher RF Order
f
(f ≥ 10 MHz from carrier)
Carrier Frequency >26.5 GHz
d
First RF Order
−10 dBm
−68 dBc + 20
e
× log(N
)
−40 dBm −80 dBc + 20
e
× log(N
)
−30 dBm
Includes IF feedthrough, LO
harmonic mixing responses
Includes higher order mixer
responses
–90 dBc (nominal)
(f ≥ 10 MHz from carrier)
Higher RF Order
f
−30 dBm –90 dBc (nominal)
(f ≥ 10 MHz from carrier)
LO-Related Spurious Responses
(f > 600 MHz from carrier
10 MHz to 3.6 GHz)
−10 dBm
−60 dBc
20 × log(N
g
−90 dBc + 20 × log(N)
+
(typical)
e
)
43
Page 44
EXA Signal Analyzer
Dynamic Range
Description Specifications Supplemental Information
Sidebands, offset from CW signal
≤200 Hz
200 Hz to 3 kHz
−70 dBc
−73 dBc
g
(nominal)
g
(nominal)
3 kHz to 30 kHz −73 dBc (nominal)
30 kHz to 10 MHz −80 dBc (nominal)
a. The spurious response specifications only apply with the preamp turned off. When the preamp is turned on, per-
formance is nominally the same as long as the mixer level is interpreted to be: Mixer Level = Input Level − Input
Attenuation + Preamp Gain
b. Input terminated, 0 dB input attenuation.
c. Mixer Level = Input Level − Input Attenuation.
d. With first RF order spurious products, the indicated frequency will change at the same rate as the input, with
higher order, the indicated frequency will change at a rate faster than the input.
e. N is the LO multiplication factor.
f. RBW=100 Hz. With higher RF order spurious responses, the observed frequency will change at a rate faster
than the input frequency.
g. Nominally −40 dBc under large magnetic (0.38 Gauss rms) or vibrational (0.21 g rms) environmental stimuli.
Second Harmonic Distortion
Description Specifications Supplemental Information
a
(nominal)
Second Harmonic Distortion
SHI
Option 532, or 544 (mmW)
Option 503, 507, 513, or 526 (RF/μW)
10 MHz to 1.8 GHz x
x +45 dBm
1.8 to 7 GHz x +65 dBm
1.8 to 6.5 GHz
x +65 dBm
7 to 11 GHz x +55 dBm
6.5 to 10 GHz
x +60 dBm
11 to 13.25 GHz x +50 dBm
10 to 13.25 GHz
13.25 to 22 GHz
x +55 dBm
x +50 dBm
a. SHI = second harmonic intercept. The SHI is given by the mixer power in dBm minus the second harmonic
distortion level relative to the mixer tone in dBc.
44
Page 45
EXA Signal Analyzer
Dynamic Range
Third Order Intermodulation
Description Specifications Supplemental Information
Third Order
Intermodulation
Refer to the footnote for
Band Overlaps on page 16.
(Tone separation > 5 times IF
Prefilter Bandwidth
Verification conditions
a
b
)
mmW Option 532, or 544
RF/μW Option ≤ 526
20 to 30°C
Intercept
c
Intercept
(typical)
10 to 100 MHz
x +12 dBm +17 dBm
100 to 400 MHz x +13 dBm +17 dBm
400 MHz to 3.6 GHz x +14 dBm +18 dBm
100 MHz to 3.95 GHz
x +15 dBm +19 dBm
3.6 to 13.6 GHz x +14 dBm +18 dBm
3.95 to 8.4 GHz
x +15 dBm +18 dBm
8.3 to 13.6 GHz x +15 dBm +18 dBm
13.6 to 26.5 GHz x +12 dBm +16 dBm
13.5 to 17.1 GHz
x +11 dBm +17 dBm
17.0 to 26.5 GHz x +10 dBm +17 dBm (nominal)
26.5 to 44 GHz
x +13 dBm (nominal)
Full temperature range
10 to 100 MHz
x +10 dBm
100 to 400 MHz x +10 dBm
400 MHz to 3.6 GHz x +12 dBm
100 MHz to 3.95 GHz
x +13 dBm
3.6 to 13.6 GHz x +12 dBm
3.95 to 8.4 GHz
x +13 dBm
8.3 to 13.6 GHz x +13 dBm
45
Page 46
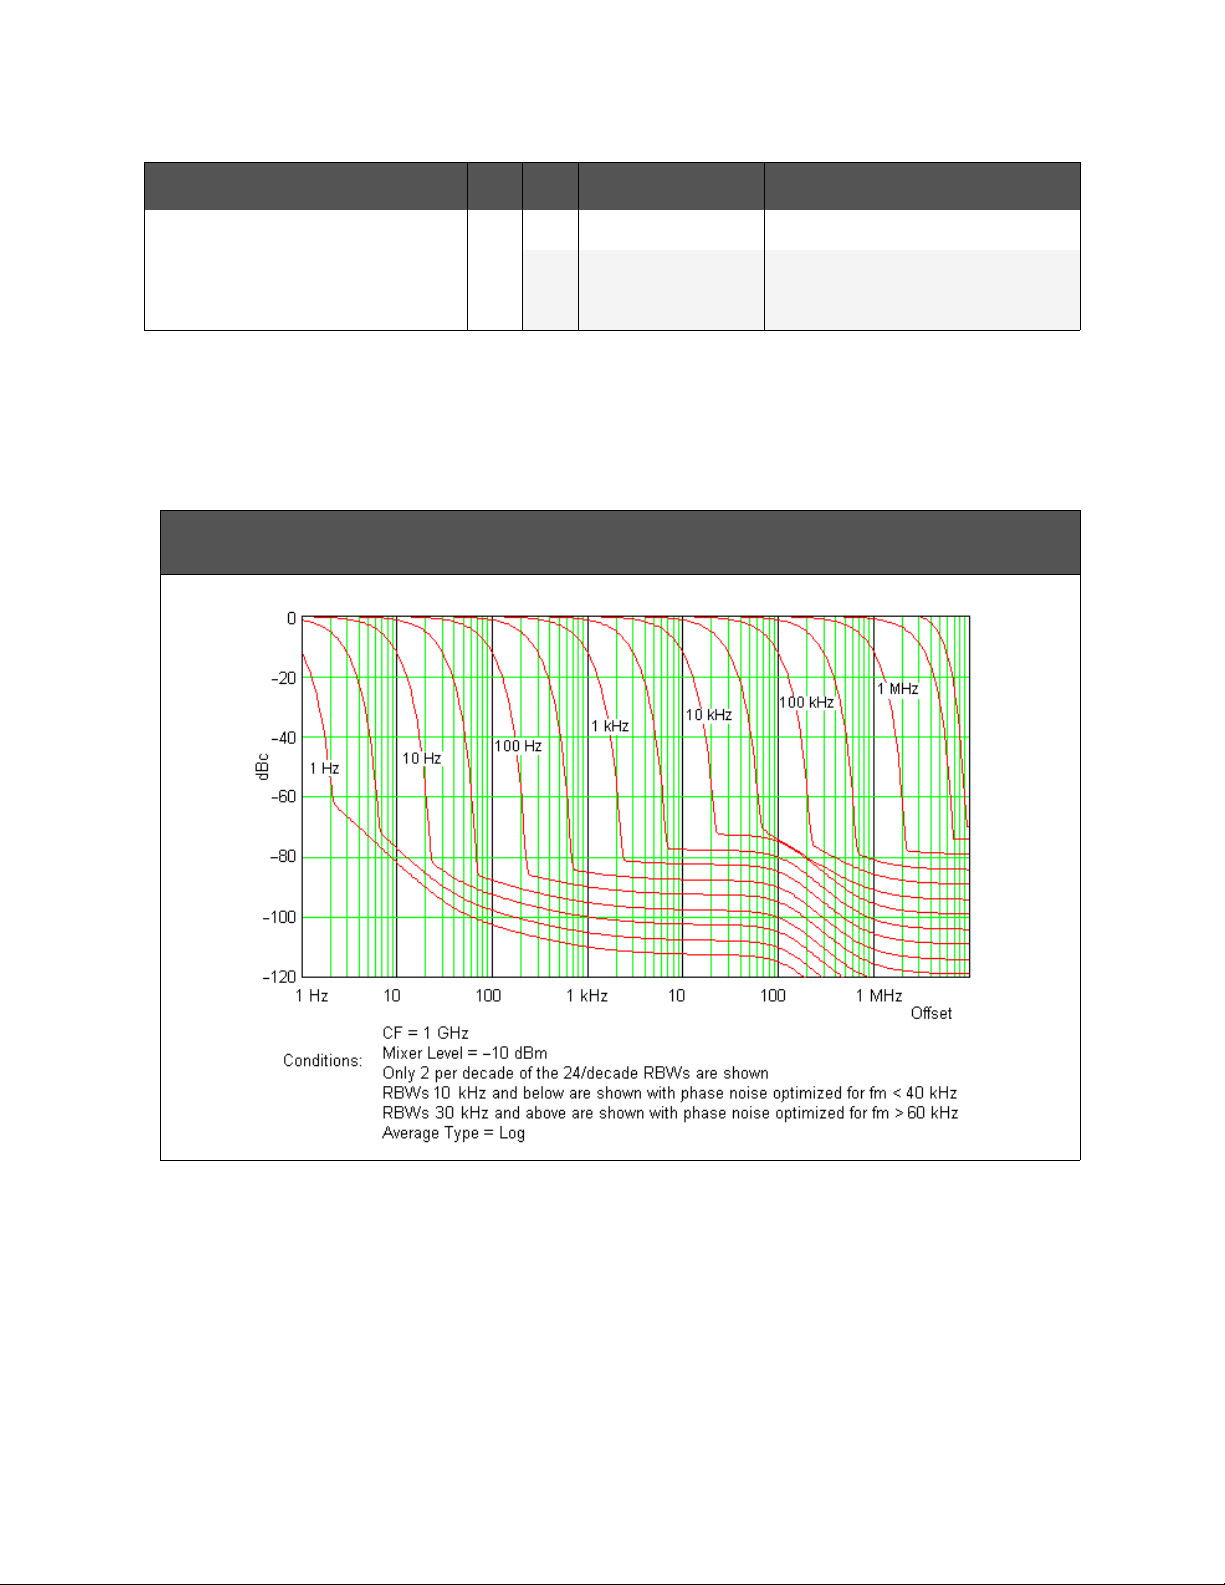
EXA Signal Analyzer
Dynamic Range
Description Specifications Supplemental Information
13.6 to 26.5 GHz x +10 dBm
13.5 to 17.1 GHz
17.0 to 26.5 GHz x +8 dBm
a. See the IF Prefilter Bandwidth table in the Gain Compression specifications on page 39. When the tone separa-
tion condition is met, the effect on TOI of the setting of IF Gain is negligible. TOI is verified with IF Gain set to its
best case condition, which is IF Gain = Low.
b. TOI is verified with two tones, each at −18 dBm at the mixer, spaced by 100 kHz.
c. Intercept = TOI = third order intercept. The TOI is given by the mixer tone level (in dBm) minus (distortion/2) where
distortion is the relative level of the distortion tones in dBc.
Nominal Dynamic Range vs. Offset Frequency vs. RBW for Freq Option ≤ 526 [Plot]
x +9 dBm
46
Page 47
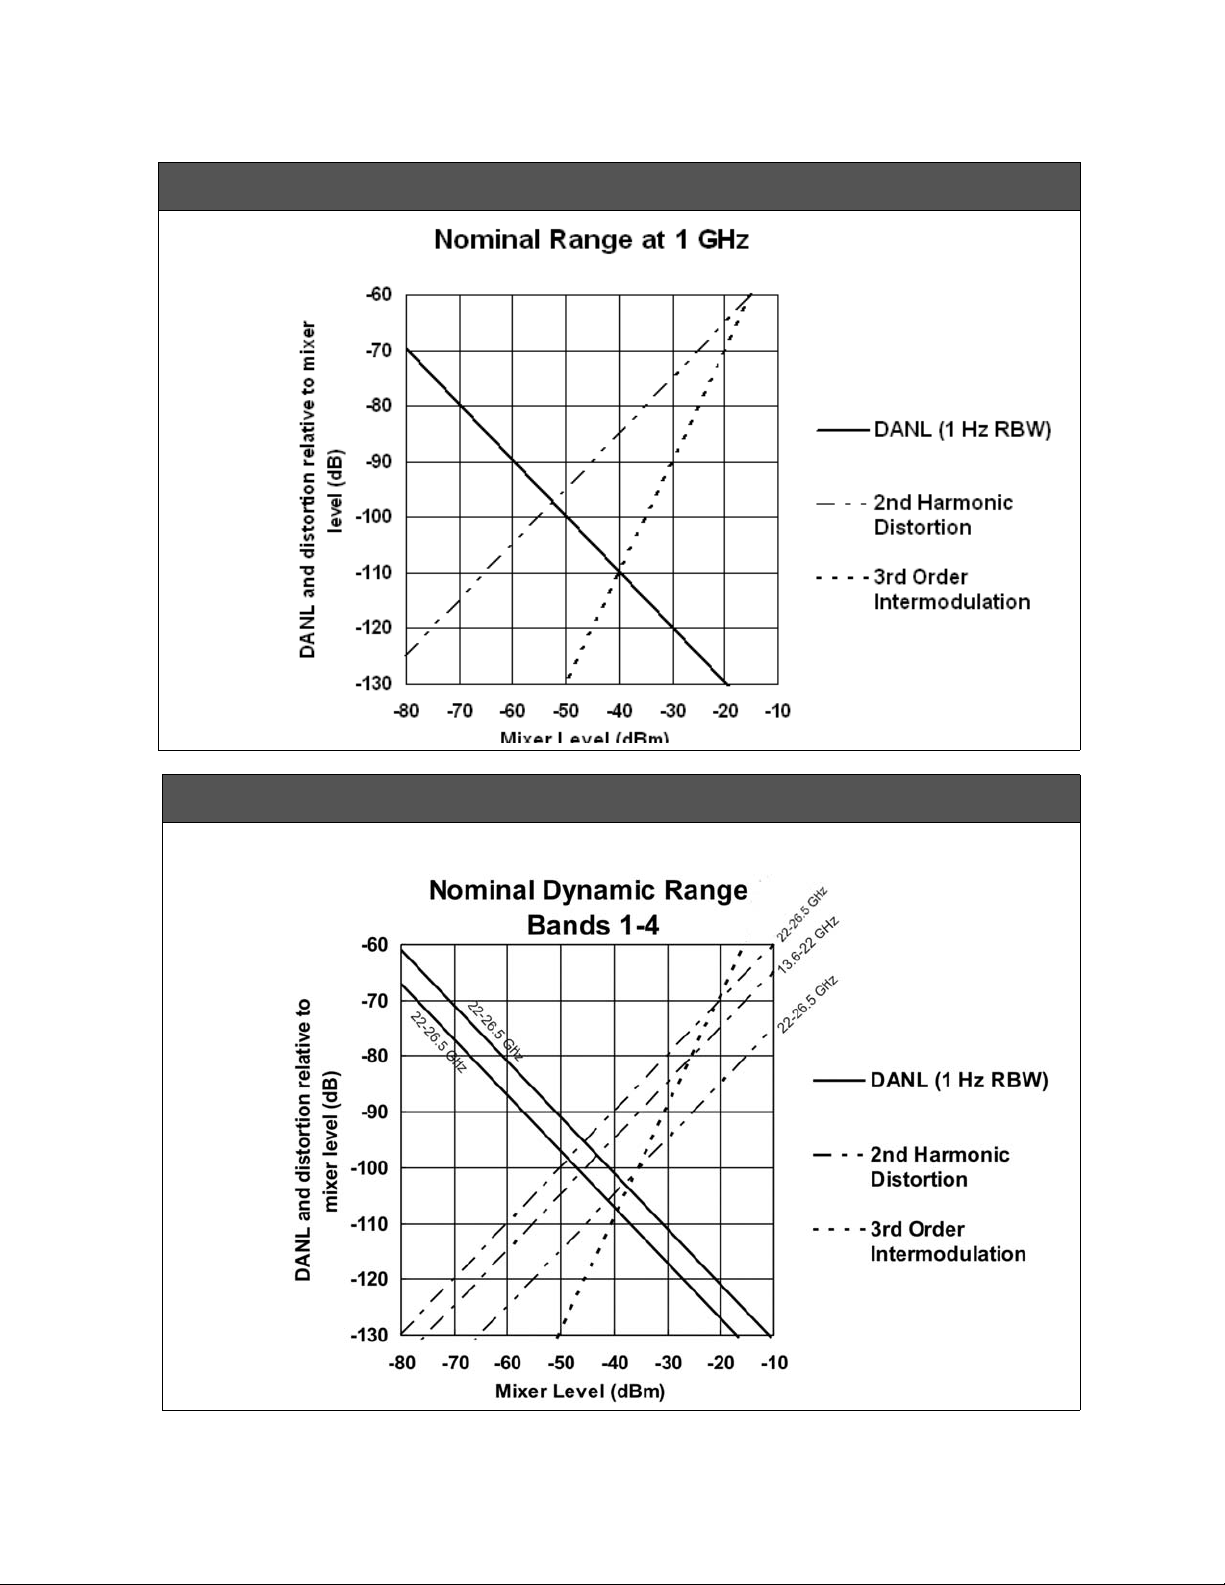
EXA Signal Analyzer
Dynamic Range
Nominal Dynamic Range at 1 GHz for Freq Option ≤ 526 [Plot]
Nominal Dynamic Range Bands 1-4 for Freq Option ≤ 526 [Plot]
47
Page 48
EXA Signal Analyzer
Dynamic Range
Phase Noise
Description Specifications Supplemental Information
Phase Noise Noise Sidebands
(Center Frequency = 1 GHz
Optimization
Internal Reference
b
,
c
a
, Best-case
)
Option 532, or 544 (mmW)
RF/μW Option ≤526
20 to 30°CFull range Typical
100 Hz x
x –87 dBc/Hz –86 dBc/Hz –102 dBc/Hz
1 kHz x –110 dBc/Hz (nominal)
1 kHz
x −110 dBc/Hz (nominal)
10 kHz x –107 dBc/Hz –106 dBc/Hz –109 dBc/Hz
10 kHz
x –107 dBc/Hz –106 dBc/Hz –109 dBc/Hz
100 kHz x –115 dBc/Hz –114 dBc/Hz –118 dBc/Hz
100 kHz
x –115 dBc/Hz –114 dBc/Hz –118 dBc/Hz
1 MHz x –134 dBc/Hz –134 dBc/Hz –136 dBc/Hz
1 MHz
x –134 dBc/Hz –134 dBc/Hz –136 dBc/Hz
10 MHz x –147 dBc/Hz (nominal)
10 MHz
x –148 dBc/Hz (nominal)
a. The nominal performance of the phase noise at center frequencies different than the one at which the specifica-
tions apply (1 GHz) depends on the center frequency, band and the offset. For low offset frequencies, offsets well
under 100 Hz, the phase noise increases by 20 × log[(f + 0.3225)/1.3225]. For mid-offset frequencies such as 10
kHz, band 0 phase noise increases as 20 × log[(f + 5.1225)/6.1225]. For mid-offset frequencies in other bands,
phase noise changes as 20 × log[(f + 0.3225)/6.1225] except f in this expression should never be lower than 5.8.
For wide offset frequencies, offsets above about 100 kHz, phase noise increases as 20 × log(N). N is the LO Multiple as shown on page 16; f is in GHz units in all these relationships; all increases are in units of decibels.
b. Noise sidebands for lower offset frequencies, for example, 10 kHz, apply with the phase noise optimization
(PhNoise Opt) set to Best Close-in φ Noise. Noise sidebands for higher offset frequencies, for example, 1 MHz, as
shown apply with the phase noise optimization set to Best Wide-offset φ Noise.
c. Specifications are given with the internal frequency reference. The phase noise at offsets below 100 Hz is
impacted or dominated by noise from the reference. Thus, performance with external references will not follow the
curves and specifications. The internal 10 MHz reference phase noise is about –120 dBc/Hz at 10 Hz offset; external references with poorer phase noise than this will cause poorer performance than shown.
48
Page 49
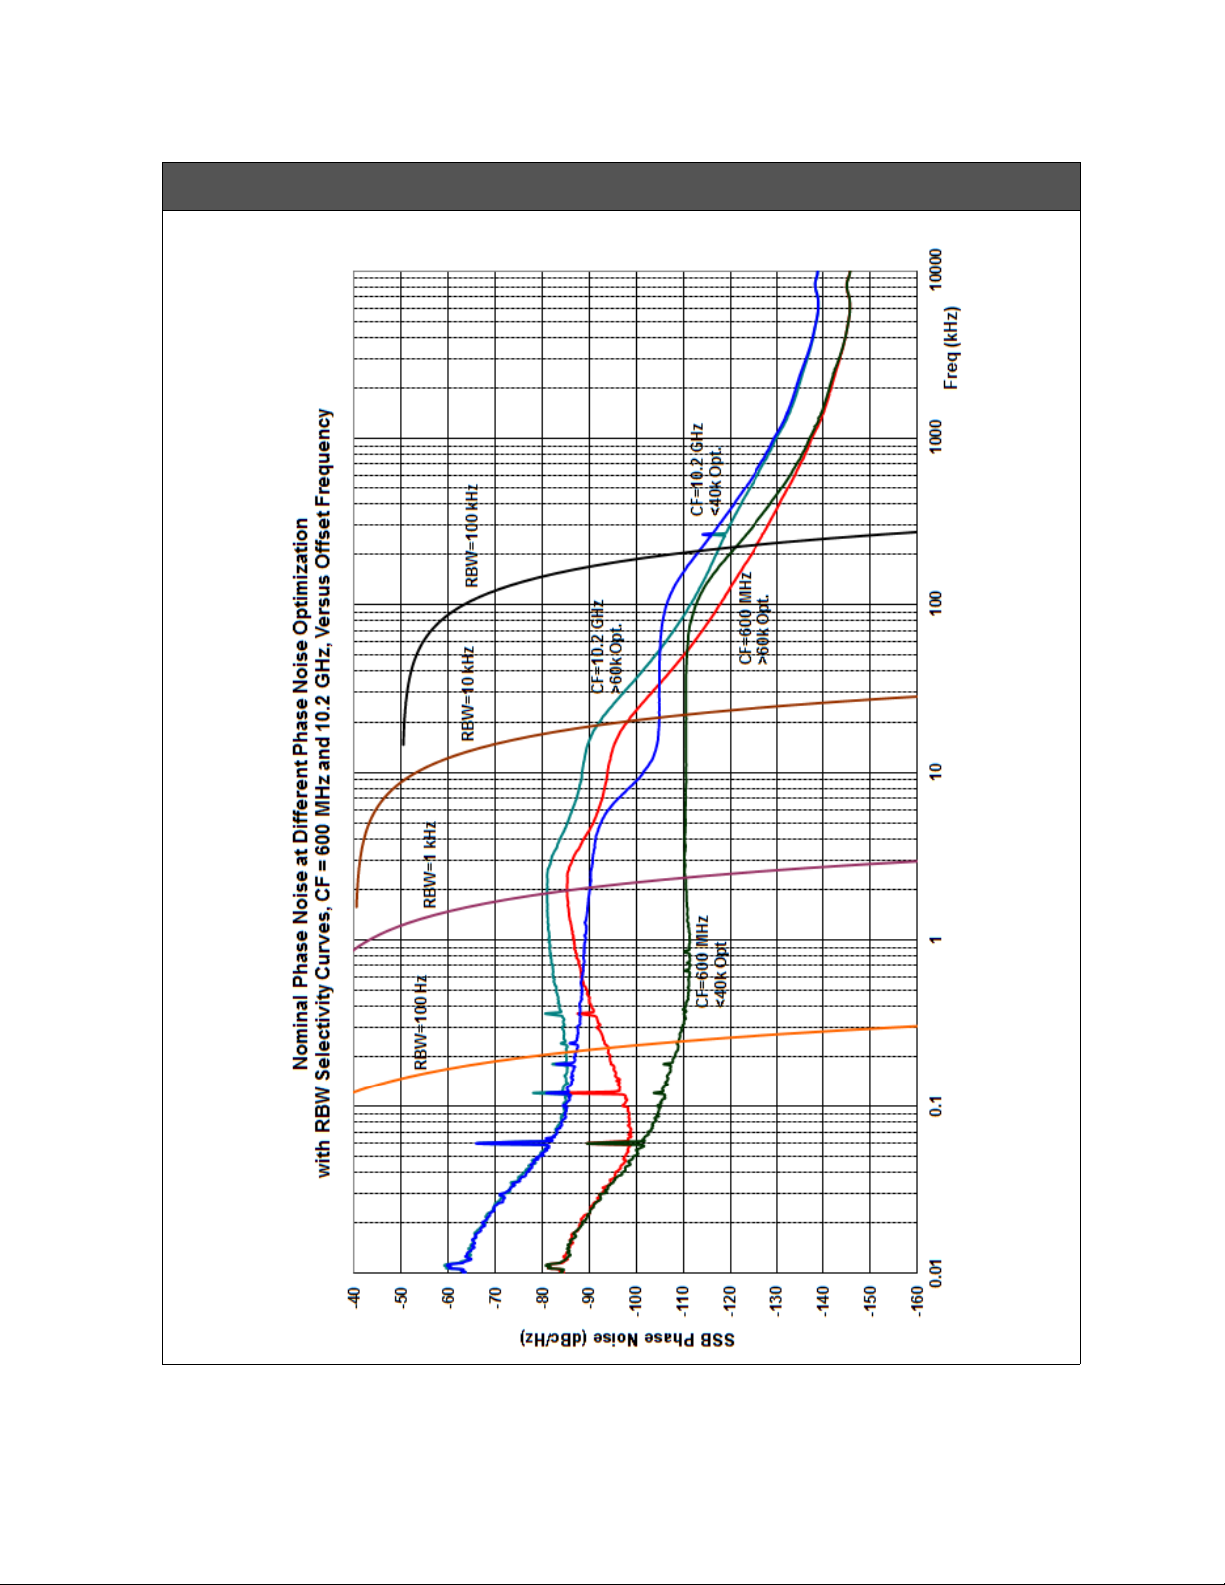
EXA Signal Analyzer
Dynamic Range
Nominal Phase Noise of Different LO Optimizations [Plot]
49
Page 50
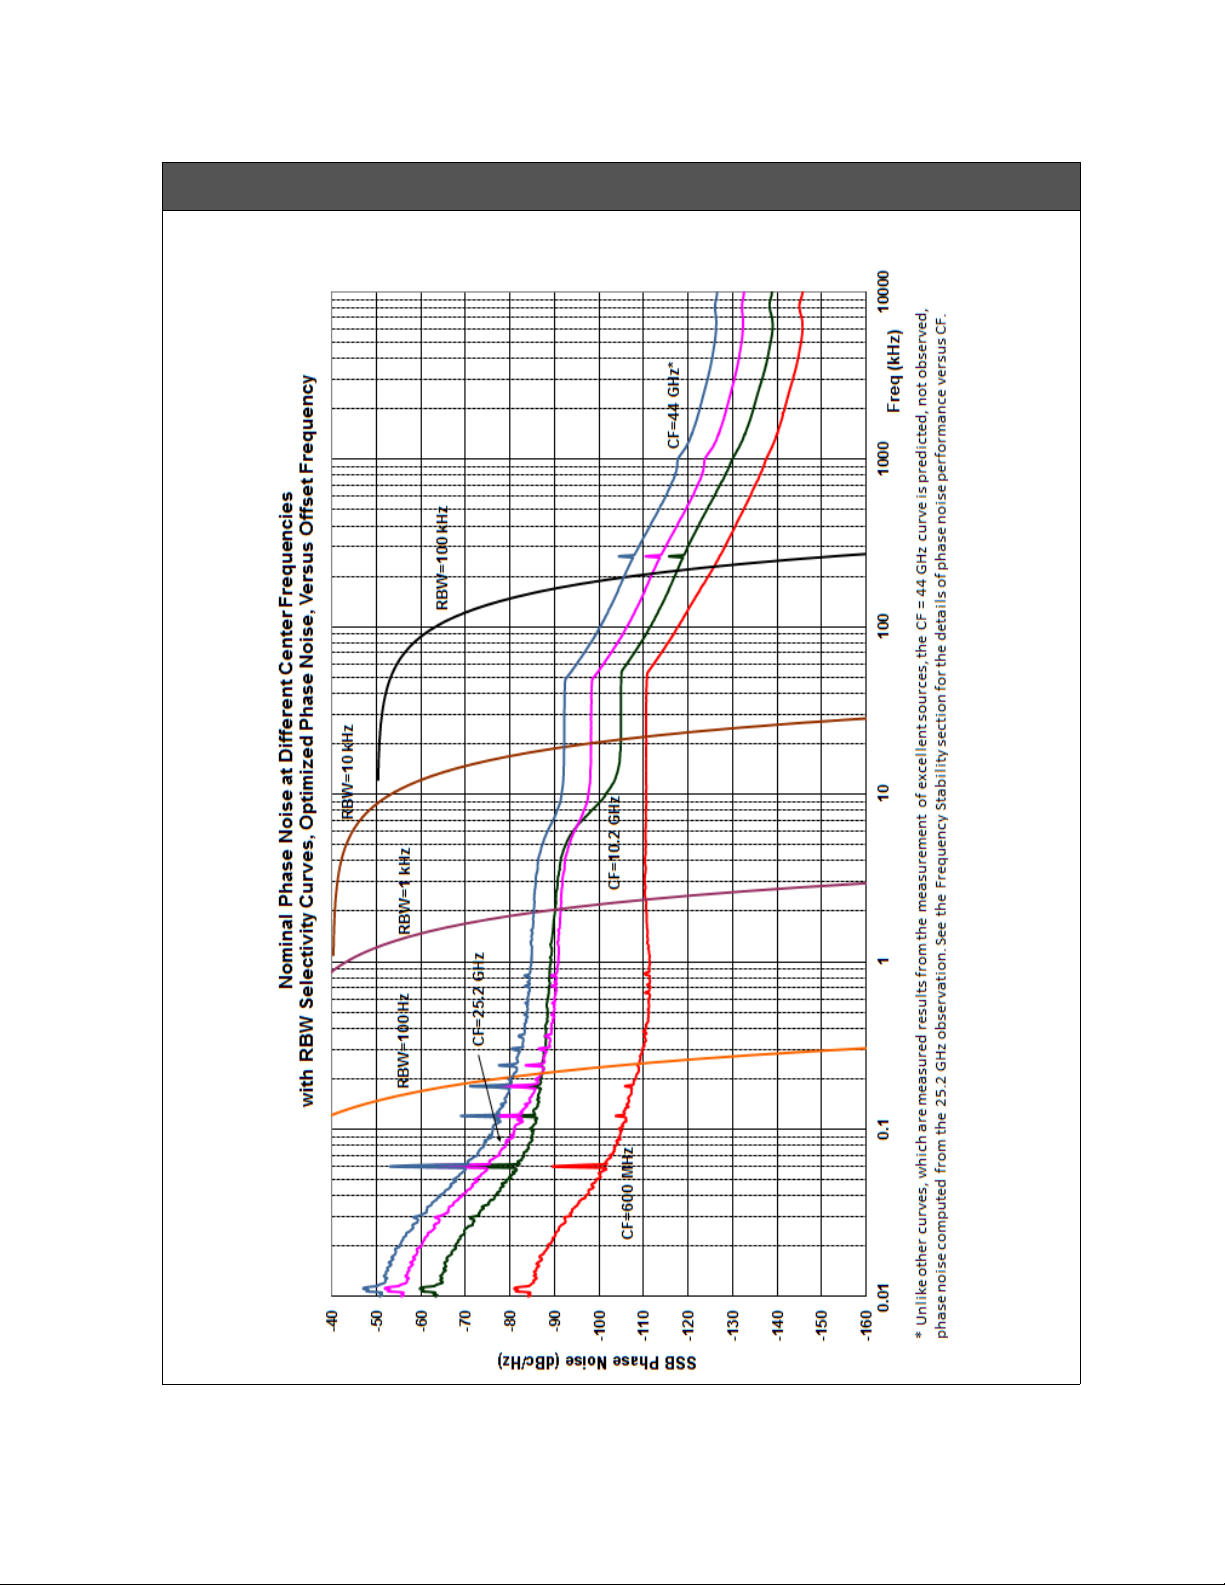
EXA Signal Analyzer
Dynamic Range
Nominal Phase Noise of Different Center Frequencies [Plot]
50
Page 51
EXA Signal Analyzer
Power Suite Measurements
Power Suite Measurements
The specifications for this section apply only to instruments with Frequency
Option 503, 507, 513, or 526. For instruments with higher frequency options,
the performance is nominal only and not subject to any warranted
specifications.
Description Specifications Supplemental Information
Channel Power
Amplitude Accuracy
Case: Radio Std = 3GPP W-CDMA, or IS-95
Absolute Power Accuracy
(20 to 30°C, Attenuation = 10 dB)
a. See “Absolute Amplitude Accuracy” on page 33.
b. See “Frequency and Time” on page 16.
c. Expressed in dB.
Description Specifications Supplemental Information
Occupied Bandwidth
Frequency Accuracy ±(Span/1000) (nominal)
±1.04 dB
Absolute Amplitude Accuracy
Power Bandwidth Accuracy
±0.27 dB (95th percentile)
a
+
bc
51
Page 52
EXA Signal Analyzer
Power Suite Measurements
Description Specifications Supplemental Information
Adjacent Channel Power (ACP)
Case: Radio Std = None
Accuracy of ACP Ratio (dBc)
Accuracy of ACP Absolute Power
(dBm or dBm/Hz)
Accuracy of Carrier Power (dBm), or
Carrier Power PSD (dBm/Hz)
Passband Width
e
Case: Radio Std = 3GPP W-CDMA
Display Scale Fidelity
Absolute Amplitude Accuracy
Power Bandwidth Accuracy
Absolute Amplitude Accuracy
Power Bandwidth Accuracy
−3 dB
(ACPR; ACLR)
a
b
+
cd
b
+
cd
f
Minimum power at RF Input −36 dBm (nominal)
ACPR Accuracy
g
RRC weighted, 3.84 MHz noise bandwidth,
method ≠ RBW
Radio Offset Freq
MS (UE) 5 MHz ±0.17 dB At ACPR range of −30 to −36 dBc with optimum
mixer level
h
MS (UE) 10 MHz ±0.22 dB At ACPR range of −40 to −46 dBc with optimum
mixer level
i
BTS 5 MHz ±0.70 dB At ACPR range of −42 to −48 dBc with optimum
mixer level
j
BTS 10 MHz ±0.57 dB At ACPR range of −47 to −53 dBc with optimum
i
k
BTS 5 MHz ±0.29 dB
mixer level
At −48 dBc non-coherent ACPR
Dynamic Range RRC weighted, 3.84 MHz noise
bandwidth
l
Noise
Correction
Offset
Freq
Method
ACLR (typical)
Optimum MLm
(Nominal)
Off 5 MHz Filtered IBW −68 dB −8 dBm
Off 5 MHz Fast −67 dB −9 dBm
Off 10 MHz Filtered IBW −74 dB −2 dBm
On 5 MHz Filtered IBW −73 dB −8 dBm
On 10 MHz Filtered IBW −76 dB −2 dBm
52
Page 53

EXA Signal Analyzer
Power Suite Measurements
Description Specifications Supplemental Information
RRC Weighting Accuracy
White noise in Adjacent Channel
TOI-induced spectrum
rms CW error
n
0.00 dB nominal
0.001 dB nominal
0.012 dB nominal
a. The effect of scale fidelity on the ratio of two powers is called the relative scale fidelity. The scale fidelity speci-
fied in the Amplitude section is an absolute scale fidelity with –35 dBm at the input mixer as the reference point.
The relative scale fidelity is nominally only 0.01 dB larger than the absolute scale fidelity.
b. See Amplitude Accuracy and Range section.
c. See Frequency and Time section.
d. Expressed in decibels.
e. An ACP measurement measures the power in adjacent channels. The shape of the response versus frequency of
those adjacent channels is occasionally critical. One parameter of the shape is its 3 dB bandwidth. When the
bandwidth (called the Ref BW) of the adjacent channel is set, it is the 3 dB bandwidth that is set. The passband
response is given by the convolution of two functions: a rectangle of width equal to Ref BW and the power
response versus frequency of the RBW filter used. Measurements and specifications of analog radio ACPs are
often based on defined bandwidths of measuring receivers, and these are defined by their −6 dB widths, not
their −3 dB widths. To achieve a passband whose −6 dB width is x, set the Ref BW to be x − 0.572 × RBW.
f. Most versions of adjacent channel power measurements use negative numbers, in units of dBc, to refer to the
power in an adjacent channel relative to the power in a main channel, in accordance with ITU standards. The
standards for W-CDMA analysis include ACLR, a positive number represented in dB units. In order to be consis-
tent with other kinds of ACP measurements, this measurement and its specifications will use negative dBc
results, and refer to them as ACPR, instead of positive dB results referred to as ACLR. The ACLR can be deter-
mined from the ACPR reported by merely reversing the sign.
g. The accuracy of the Adjacent Channel Power Ratio will depend on the mixer drive level and whether the distor-
tion products from the analyzer are coherent with those in the UUT. These specifications apply even in the worst
case condition of coherent analyzer and UUT distortion products. For ACPR levels other than those in this spec-
ifications table, the optimum mixer drive level for accuracy is approximately −37 dBm − (ACPR/3), where the
ACPR is given in (negative) decibels.
h. To meet this specified accuracy when measuring mobile station (MS) or user equipment (UE) within 3 dB of the
required −33 dBc ACPR, the mixer level (ML) must be optimized for accuracy. This optimum mixer level is
−22 dBm, so the input attenuation must be set as close as possible to the average input power − (−22 dBm).
For example, if the average input power is −6 dBm, set the attenuation to 16 dB. This specification applies for
the normal 3.5 dB peak-to-average ratio of a single code. Note that, if the mixer level is set to optimize dynamic
range instead of accuracy, accuracy errors are nominally doubled.
i. ACPR accuracy at 10 MHz offset is warranted when the input attenuator is set to give an average mixer level of
−14 dBm.
j. In order to meet this specified accuracy, the mixer level must be optimized for accuracy when measuring node B
Base Transmission Station (BTS) within 3 dB of the required −45 dBc ACPR. This optimum mixer level is −19
dBm, so the input attenuation must be set as close as possible to the average input power − (−19 dBm). For
example, if the average input power is −7 dBm, set the attenuation to 12 dB. This specification applies for the
normal 10 dB peak-to-average ratio (at 0.01% probability) for Test Model 1. Note that, if the mixer level is set to
optimize dynamic range instead of accuracy, accuracy errors are nominally doubled.
k. Accuracy can be excellent even at low ACPR levels assuming that the user sets the mixer level to optimize the
dynamic range, and assuming that the analyzer and UUT distortions are incoherent. When the errors from the
UUT and the analyzer are incoherent, optimizing dynamic range is equivalent to minimizing the contribution of
analyzer noise and distortion to accuracy, though the higher mixer level increases the display scale fidelity
errors. This incoherent addition case is commonly used in the industry and can be useful for comparison of
analysis equipment, but this incoherent addition model is rarely justified. This derived accuracy specification is
based on a mixer level of −14 dBm.
53
Page 54
EXA Signal Analyzer
Power Suite Measurements
l. Keysight measures 100% of the signal analyzers for dynamic range in the factory production process. This mea-
surement requires a near-ideal signal, which is impractical for field and customer use. Because field verification
is impractical, Keysight only gives a typical result. More than 80% of prototype instruments met this “typical”
specification; the factory test line limit is set commensurate with an on-going 80% yield to this typical.
The ACPR dynamic range is verified only at 2 GHz, where Keysight has the near-perfect signal available. The
dynamic range is specified for the optimum mixer drive level, which is different in different instruments and dif-
ferent conditions. The test signal is a 1 DPCH signal.
The ACPR dynamic range is the observed range. This typical specification includes no measurement uncertainty.
m. ML is Mixer Level, which is defined to be the input signal level minus attenuation.
n. 3GPP requires the use of a root-raised-cosine filter in evaluating the ACLR of a device. The accuracy of the
passband shape of the filter is not specified in standards, nor is any method of evaluating that accuracy. This
footnote discusses the performance of the filter in this instrument. The effect of the RRC filter and the effect of
the RBW used in the measurement interact. The analyzer compensates the shape of the RRC filter to accommo-
date the RBW filter. The effectiveness of this compensation is summarized in three ways:
− White noise in Adj Ch: The compensated RRC filter nominally has no errors if the adjacent channel has a
spectrum that is flat across its width.
− TOI−induced spectrum: If the spectrum is due to third−order intermodulation, it has a distinctive shape. The
computed errors of the compensated filter are −0.001 dB for the 100 kHz RBW used for UE testing with the
IBW method. It is 0.000 dB for the 27 kHz RBW filter used for BTS testing with the Filtered IBW method. The
worst error for RBWs between 27 and 390 kHz is 0.05 dB for a 330 kHz RBW filter.
− rms CW error: This error is a measure of the error in measuring a CW−like spurious component. It is evaluated
by computing the root of the mean of the square of the power error across all frequencies within the adjacent
channel. The computed rms error of the compensated filter is 0.012 dB for the 100 kHz RBW used for UE test-
ing with the IBW method. It is 0.000 dB for the 27 kHz RBW filter used for BTS testing. The worst error for
RBWs between 27 kHz and 470 kHz is 0.057 dB for a 430 kHz RBW filter.
Description Specifications Supplemental Information
Power Statistics CCDF
Histogram Resolution
a
0.01 dB
a. The Complementary Cumulative Distribution Function (CCDF) is a reformatting of a histogram of the power
envelope. The width of the amplitude bins used by the histogram is the histogram resolution. The resolution of
the CCDF will be the same as the width of those bins.
54
Page 55
EXA Signal Analyzer
Power Suite Measurements
Description Specifications Supplemental Information
Burst Power
Methods Power above threshold
Power within burst width
Results Output power, average
Output power, single burst
Maximum power
Minimum power within burst
Burst width
Description Specifications Supplemental Information
TOI (Third Order
Intermodulation)
Results Relative IM tone powers (dBc)
Absolute tone powers (dBm)
Intercept (dBm)
Description Specifications Supplemental Information
Harmonic Distortion
Maximum harmonic number 10th
Results Fundamental Power (dBm)
Relative harmonics power (dBc)
Total harmonic distortion (%, dBc)
Measures TOI of a signal with two
dominant tones
55
Page 56

EXA Signal Analyzer
Power Suite Measurements
Description Specifications Supplemental Information
Spurious Emissions Table-driven spurious signals;
search across regions
Case: Radio Std = 3GPP W-CDMA
Dynamic Range
a
, relative (RBW=1 MHz)
80.4 dB 82.9 dB (typical)
(1 to 3.6 GHz)
Sensitivity
b
, absolute (RBW=1 MHz)
−82.5 dBm −86.5 dBm (typical)
(1 to 3.6 GHz)
Accuracy Attenuation = 10 dB
9 kHz to 3.6 GHz ±0.38 dB (95th percentile)
3.5 to 8.4 GHz ±1.22 dB (95th percentile)
8.3 to 13.6 GHz ±1.59 dB (95th percentile)
a. The dynamic range is specified at 12.5 MHz offset from center frequency with mixer level of 1 dB compression
point, which will degrade accuracy 1 dB.
b. The sensitivity is specified at far offset from carrier, where phase noise does not contribute. You can derive the
dynamic range at far offset from 1 dB compression mixer level and sensitivity.
56
Page 57

EXA Signal Analyzer
Power Suite Measurements
Description Specifications Supplemental Information
Spectrum Emission Mask Table-driven spurious signals;
measurement near carriers
Case: Radio Std = cdma2000
Dynamic Range, relative
(750 kHz offset
ab
)
Sensitivity, absolute
(750 kHz offset
c
)
Accuracy
(750 kHz offset)
Relative
Absolute
d
e
(20 to 30°C)
Case: Radio Std = 3GPP W−CDMA
Dynamic Range, relative
ad
(2.515 MHz offset
)
Sensitivity, absolute
(2.515 MHz offset
c
)
Accuracy
(2.515 MHz offset)
Relative
d
76.2 dB 82.8 dB (typical)
−97.7 dBm −101.7 dBm (typical)
±0.12 dB
±1.15 dB ±0.31 dB (95th percentile ≈ 2σ)
79.3 dB 84.9 dB (typical)
−97.7 dBm −101.7 dBm (typical)
±0.15 dB
Absolute
e
±1.15 dB
±0.31 dB (95th percentile ≈ 2σ)
(20 to 30°C)
a. The dynamic range specification is the ratio of the channel power to the power in the offset specified. The
dynamic range depends on the measurement settings, such as peak power or integrated power. Dynamic range
specifications are based on default measurement settings, with detector set to average, and depend on the
mixer level. Default measurement settings include 30 kHz RBW.
b. This dynamic range specification applies for the optimum mixer level, which is about −18 dBm. Mixer level is
defined to be the average input power minus the input attenuation.
c. The sensitivity is specified with 0 dB input attenuation. It represents the noise limitations of the analyzer. It is
tested without an input signal. The sensitivity at this offset is specified in the default 30 kHz RBW, at a center
frequency of 2 GHz.
d. The relative accuracy is a measure of the ratio of the power at the offset to the main channel power. It applies for
spectrum emission levels in the offsets that are well above the dynamic range limitation.
e. The absolute accuracy of SEM measurement is the same as the absolute accuracy of the spectrum analyzer. See
“Absolute Amplitude Accuracy” on page 33 for more information. The numbers shown are for 0 to 3.6
GHz, with attenuation set to 10 dB.
57
Page 58

EXA Signal Analyzer
Options
Options
The following options and applications affect instrument specifications.
Option 503: Frequency range, 10 Hz to 3.6 GHz
Option 507: Frequency range, 10 Hz to 7 GHz
Option 513: Frequency range, 10 Hz to 13.6 GHz
Option 526: Frequency range, 10 Hz to 26.5 GHz
Option 532: Frequency range, 10 Hz to 32 GHz
Option 544: Frequency range, 10 Hz to 44 GHz
Option B25: Analysis bandwidth, 25 MHz
Option B40: Analysis bandwidth, 40 MHz
Option CR3: Connector Rear, second IF Out
Option CRP: Connector Rear, arbitrary IF Out
Option EA3: Electronic attenuator, 3.6 GHz
Option EMC: Precompliance EMC Features
Option ESC: External source control
Option EXM: External mixing
Option FSA: 2 dB fine step attenuator
Option MPB: Preselector bypass
Option NFE: Noise floor extension, instrument alignment
Option P03: Preamplifier, 3.6 GHz
Option P07: Preamplifier, 7 GHz
Option P13: Preamplifier, 13.6 GHz
Option P26: Preamplifier, 26.5 GHz
Option P32: Preamplifier, 32 GHz
Option P44: Preamplifier, 44 GHz
Option PC4: Upgrade to dual core processor with removable solid state drive
Option PFR: Precision frequency reference
Option YAS: Y-Axis Screen Video output
N9063EM0E: Analog Demodulation measurement application
N9067EM0E: Pulse measurement software
N9068EM0E: Phase Noise measurement application
58
Page 59

EXA Signal Analyzer
Options
N9069EM0E: Noise Figure measurement application
N9071EM0E: GSM/EDGE/EDGE Evolution measurement application
N9073EM0E: W-CDMA/HSPA/HSPA+ measurement application
N9080EM0E: LTE-Advanced FDD measurement application
N9081EM0E: Bluetooth measurement application
N9082EM0E: LTE-Advanced TDD measurement application
N9084EM0E: Short Range Communications measurement application
59
Page 60
EXA Signal Analyzer
General
General
Description Specifications Supplemental Information
Calibration Cycle 2 years
Description Specifications Supplemental Information
Environmental
Indoor use
Temperature Range
Operating
Altitude ≤ 2,300 m0 to 55°C
Altitude = 4,600 m 0 to 47°C
Derating
Storage
Altitude
Humidity
Relative humidity 95% to temperatures up to 40°C,
Description Specifications Supplemental Information
Environmental and Military
Specifications
a
−40 to +70°C
4,600 m (approx 15,000 feet)
decreasing linearly to 50% at 55°C
(non-condensing)
a. The maximum operating temperature derates linearly from altitude of 4,600 m to 2,300 m.
Samples of this product have been type tested in
accordance with the Keysight Environmental Test
Manual and verified to be robust against the
environmental stresses of Storage, Transportation
and End-use; those stresses include but are not
limited to temperature, humidity, shock, vibration,
altitude and power line conditions. Test Methods are
aligned with IEC 60068-2 and levels are similar to
MIL-PRF-28800F Class 3.
60
Page 61

EXA Signal Analyzer
General
Description Specification Supplemental Information
Acoustic Noise Values given are per ISO 7779 standard in the "Operator Sitting"
position
Ambient Temperature
< 40°C Nominally under 55 dBA Sound Pressure. 55 dBA is generally
considered suitable for use in quiet office environments.
≥ 40°C Nominally under 65 dBA Sound Pressure. 65 dBA is generally
considered suitable for use in noisy office environments. (The fan
speed, and thus the noise level, increases with increasing ambient
temperature.)
61
Page 62

EXA Signal Analyzer
General
Description Specification Supplemental Information
Power Requirements
a
Low Range
Voltage 100 \120 V
Frequency 50/60/400 Hz
High Range
Voltage 220 /240 V
Frequency 50/60 Hz
Power Consumption, On 350 W Maximum
Power Consumption, Standby 20 W Standby power is not supplied to
frequency reference oscillator.
Typical instrument configuration Power (nominal)
Base 3.6 GHz instrument (N9010B-503) 176 W
Base 8.4 GHz instrument (N9010B-508) 179 W
Base 13 GHz instrument (N9010B-513) 183 W
Base 26.5 GHz instrument (N9010B-526) 194 W
Base 32/44 GHz instrument (N9010B-532/544) 225 W
a. Mains supply voltage fluctuations are not to exceed 10 percent of the nominal supply voltage.
62
Page 63
EXA Signal Analyzer
General
Description Supplemental Information
Measurement Speed
a
Nominal
Standard w/ Option PC4
Local measurement and display update rate
Remote measurement and LAN transfer rate
bc
bc
11 ms (90/s) 4 ms (250/s)
6 ms (167/s) 5 ms (200/s)
Marker Peak Search 5 ms 1.5 ms
Center Frequency Tune and Transfer (RF) 22 ms 20 ms
Center Frequency Tune and Transfer (µW) 49 ms 47 ms
Measurement/Mode Switching 75 ms 39 ms
Measurement Time vs. Span See page 25
a. Sweep Points = 101.
b. Factory preset, fixed center frequency, RBW = 1 MHz, 10 MHz < span ≤ 600 MHz, stop frequency ≤ 3.6 GHz,
Auto Align Off.
c. Phase Noise Optimization set to Fast Tuning, Display Off, 32 bit integer format, markers Off, single sweep, mea-
sured with IBM compatible PC with 2.99 GHz Pentium® 4 with 2 GB RAM running Windows® XP, Keysight I/O
Libraries Suite Version 14.1, one meter GPIB cable, National Instruments PCI-GPIB Card and NI-488.2 DLL.
Description Specifications Supplemental Information
Display
a
Resolution 1280 × 800 Capacitive multi-touch screen
Size 269 mm (10.6 in) diagonal (nominal)
a. The LCD display is manufactured using high precision technology. However, if a static image is displayed for a
lengthy period of time (~2 hours) you might encounter "image sticking" that may last for approximately 2 seconds. This is normal and does not affect the measurement integrity of the product in any way.
63
Page 64
EXA Signal Analyzer
General
Description Specifications Supplemental Information
Data Storage
Standard
Internal Total Removable solid state drive (≥ 120 GB)
Internal User ≥ 9 GB available for user data
Description Specifications Supplemental Information
Weight Weight without options
Net 18 kg (40 lbs) (nominal)
Shipping 30 kg (66 lbs) (nominal)
Cabinet Dimensions Cabinet dimensions exclude front and rear
Height 177 mm (7.0 in)
protrusions.
Width 426 mm (16.8 in)
Length 368 mm (14.5 in)
64
Page 65
EXA Signal Analyzer
Inputs/Outputs
Inputs/Outputs
Front Panel
Description Specifications Supplemental Information
RF Input
Connector
Standard Type-N female Frequency Option 503, 507, 513, and 526
2.4 mm male Frequency Option 532 and 544
Impedance 50Ω (nominal)
Description Specifications Supplemental Information
Probe Power
Voltage/Current +15 Vdc, ±7% at 0 to 150 mA (nominal)
−12.6 Vdc, ±10% at 0 to 150 mA (nominal)
GND
Description Specifications Supplemental Information
USB Ports
Host (3 ports) Compliant with USB 2.0
Connector USB Type “A” female
Output Current
Port marked with
Lightning Bolt, if any
Port not marked with
Lightning Bolt
Description Specifications Supplemental Information
Headphone Jack
0.5 A
1.2 A (nominal)
Connector miniature stereo audio jack 3.5 mm (also known as "1/8 inch")
Output Power 90 mW per channel into 16Ω (nominal)
65
Page 66
EXA Signal Analyzer
Inputs/Outputs
Rear Panel
Description Specifications Supplemental Information
10 MHz Out
Connector BNC female
Impedance 50Ω (nominal)
Output Amplitude ≥0 dBm (nominal)
Output Configuration AC coupled, sinusoidal
Frequency 10 MHz ×
(1 + frequency reference accuracy)
Description Specifications Supplemental Information
Ext Ref In
Connector BNC female Note: Analyzer noise sidebands and spurious
response performance may be affected by the
quality of the external reference used. See
footnote
within the Dynamic Range section on page 48.
Impedance 50Ω (nominal)
Input Amplitude Range
sine wave
square wave
Input Frequency 10 MHz (nominal)
−6
Lock range
Description Specifications Supplemental Information
Sync Reserved for future use
Connector BNC female
Description Specifications Supplemental Information
±2 × 10
reference input frequency
of ideal external
−5 to +10 dBm (nominal)
0.2 to 1.5 V peak-to-peak (nominal)
c
in the Phase Noise specifications
Trigger Inputs
(Trigger 1 In, Trigger 2 In)
Connector BNC female
Impedance 10 kΩ (nominal)
Trigger Level Range −5 to +5 V 1.5 V (TTL) factory preset
Either trigger source may be selected
66
Page 67
EXA Signal Analyzer
Inputs/Outputs
Description Specifications Supplemental Information
Trigger Outputs
(Trigger 1 Out, Trigger 2 Out)
Connector BNC female
Impedance 50Ω (nominal)
Level 0 to 5 V (CMOS)
Description Specifications Supplemental Information
Monitor Output 1
VGA compatible
Connector 15-pin mini D-SUB
Format XGA (60 Hz vertical sync rates, non-interlaced)
Analog RGB
Monitor Output 2
Mini Display Port
Description Specifications Supplemental Information
Analog Out Refer to Chapter 15, “Option YAS - Y-Axis
Screen Video Output”, on page 147 for
more details.
Connector BNC female
Impedance 50Ω (nominal)
Description Specifications Supplemental Information
Noise Source Drive +28 V (Pulsed)
Connector BNC female
Output voltage on 28.0 ± 0.1 V 60 mA maximum current
Output voltage off < 1.0 V
Description Specs Supplemental Information
SNS Series Noise Source For use with Keysight/Agilent Technologies SNS Series noise sources
67
Page 68
EXA Signal Analyzer
Inputs/Outputs
Description Specifications Supplemental Information
Digital Bus This port is intended for use with the Agilent/Keysight N5105 and N5106
Connector MDR-80
Description Specifications Supplemental Information
USB Ports
Host, Super Speed 2 ports
Compatibility USB 3.0
Connector USB Type “A” (female)
Output Current 0.9 A
Host, stacked with LAN 1 port
Compatibility USB 2.0
products only. It is not available for general purpose use.
Connector USB Type “A” (female)
Output Current 0.5 A
Device 1 port
Compatibility USB 3.0
Connector USB Type “B” (female)
Description Specifications Supplemental Information
GPIB Interface
Connector IEEE-488 bus connector
GPIB Codes SH1, AH1, T6, SR1, RL1, PP0, DC1, C1, C2, C3 and
C28, DT1, L4, C0
Mode Controller or device
Description Specifications Supplemental Information
LAN TCP/IP Interface RJ45 Ethertwist 1000BaseT
68
Page 69
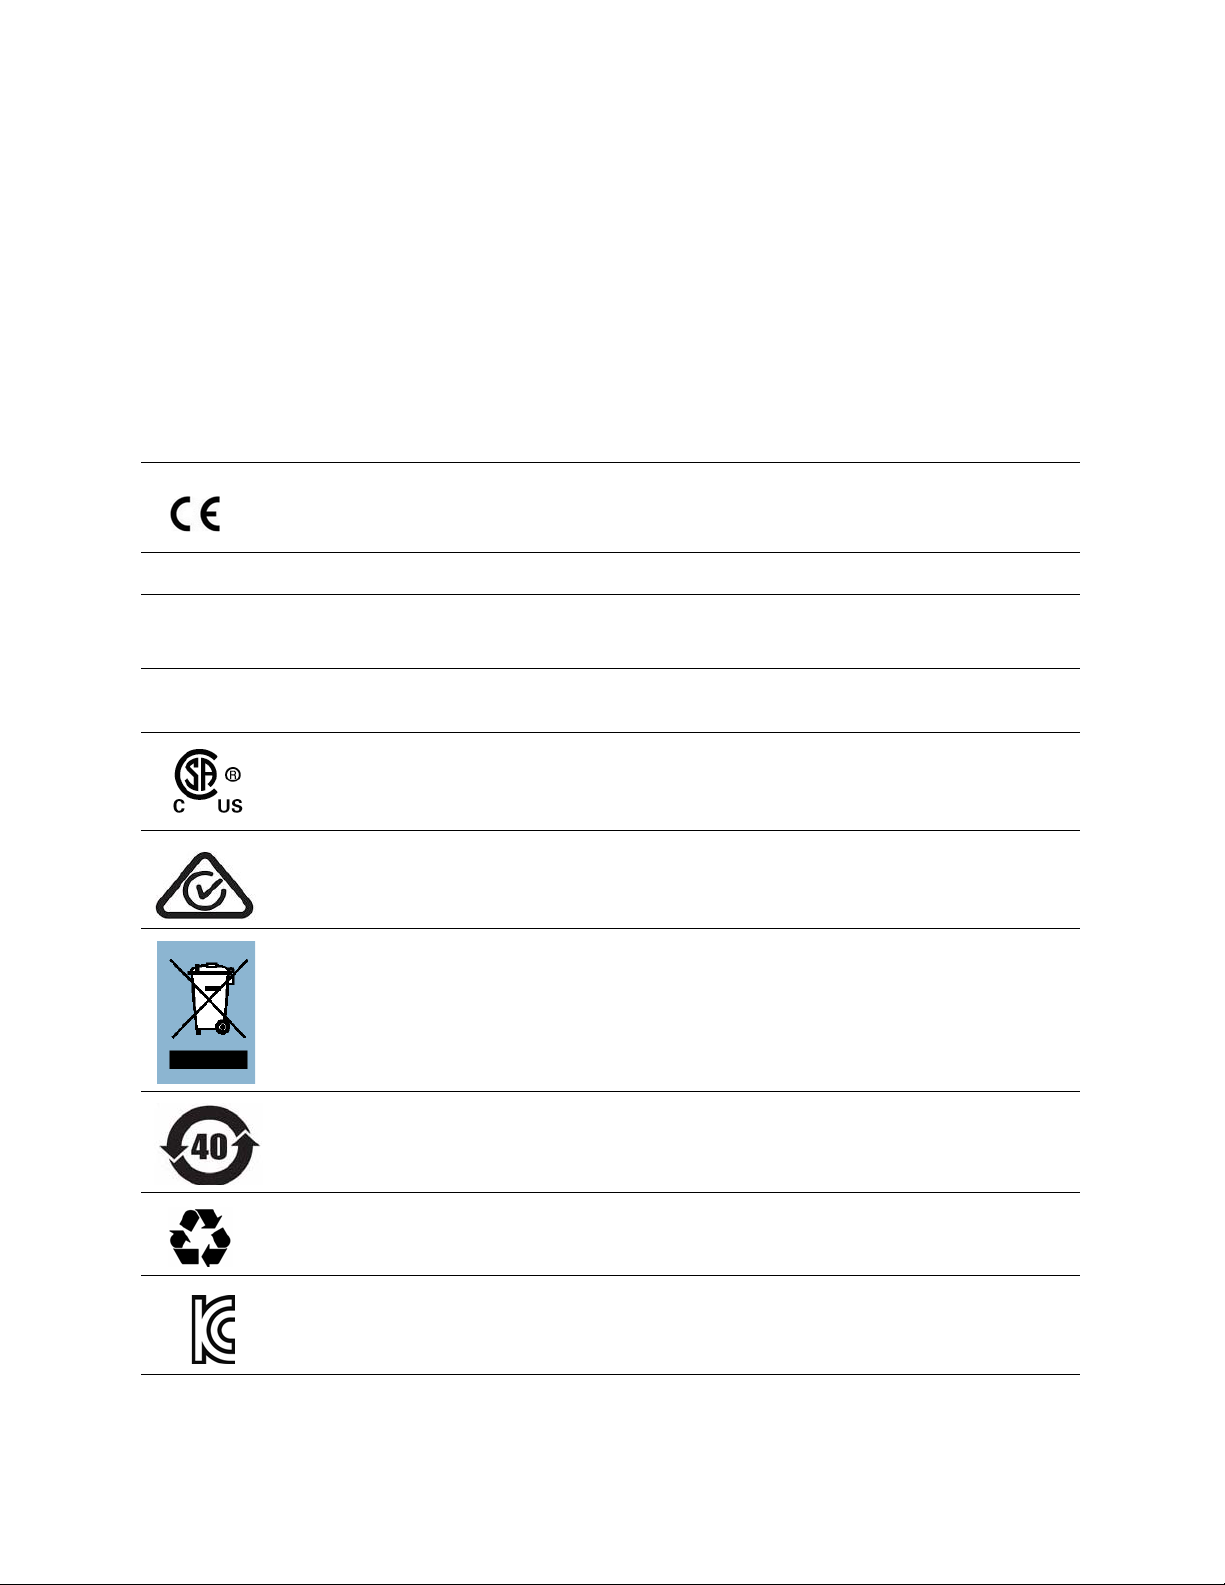
EXA Signal Analyzer
Regulatory Information
Regulatory Information
This product is designed for use in Installation Category II and Pollution Degree
2 per IEC 61010 3rd ed, and 664 respectively.
This product has been designed and tested in accordance with accepted
industry standards, and has been supplied in a safe condition. The instruction
documentation contains information and warnings which must be followed by
the user to ensure safe operation and to maintain the product in a safe
condition.
This product is intended for indoor use.
The CE mark is a registered trademark of the European Community (if accompanied
by a year, it is the year when the design was proven). This product complies with all
relevant directives.
ICES/NMB-001 “This ISM device complies with Canadian ICES-001.”
ISM 1-A (GRP.1 CLASS A) This is a symbol of an Industrial Scientific and Medical Group 1 Class A product.
The CSA mark is a registered trademark of the CSA International.
The Keysight email address is required by EU directives applicable to our product.
“Cet appareil ISM est conforme a la norme NMB du Canada.”
(CISPR 11, Clause 4)
The RCM mark is a registered trademark of the Australian Communications and
Media Authority.
This symbol indicates separate collection for electrical and electronic equipment
mandated under EU law as of August 13, 2005. All electric and electronic equipment
are required to be separated from normal waste for disposal (Reference WEEE
Directive 2002/96/EC).
China RoHS regulations include requirements related to packaging, and require
compliance to China standard GB18455-2001.
This symbol indicates compliance with the China RoHS regulations for
paper/fiberboard packaging.
South Korean Certification (KC) mark; includes the marking’s identifier code which
follows this format:
MSIP-REM-YYY-ZZZZZZZZZZZZZZ.
69
Page 70
EXA Signal Analyzer
Regulatory Information
EMC: Complies with the essential requirements of the European EMC Directive
as well as current editions of the following standards (dates and editions are
cited in the Declaration of Conformity):
— IEC/EN 61326-1
— CISPR 11, Group 1, Class A
— AS/NZS CISPR 11
— ICES/NMB-001
This ISM device complies with Canadian ICES-001.
Cet appareil ISM est conforme a la norme NMB-001 du Canada.
This is a sensitive measurement apparatus by design and may have some performance
loss (up to 25 dBm above the Spurious Responses, Residual specification of -100 dBm)
when exposed to ambient continuous electromagnetic phenomenon in the range of
80 MHz -2.7 GHz when tested per IEC 61000-4-3.
South Korean Class A EMC declaration:
This equipment has been conformity assessed for use in business
environments. In a residential environment this equipment may cause radio
interference.
This EMC statement applies to the equipment only for use in business
environment.
SAFETY: Complies with the essential requirements of the European Low
Voltage Directive as well as current editions of the following standards (dates
and editions are cited in the Declaration of Conformity):
— IEC/EN 61010-1
— Canada: CSA C22.2 No. 61010-1
— USA: UL std no. 61010-1
70
Page 71

EXA Signal Analyzer
Regulatory Information
Acoustic statement: (European Machinery Directive)
Acoustic noise emission
LpA <70 dB
Operator position
Normal operation mode per ISO 7779
To find a current Declaration of Conformity for a specific Keysight product, go
to: http://www.keysight.com/go/conformity
71
Page 72

EXA Signal Analyzer
Regulatory Information
72
Page 73

Keysight X-Series Signal Analyzer
N9010B
Specification Guide
2 I/Q Analyzer
This chapter contains specifications for the I/Q Analyzer measurement
application (Basic Mode).
73
Page 74

I/Q Analyzer
Specifications Affected by I/Q Analyzer
Specifications Affected by I/Q Analyzer
Specification Name Information
Number of Frequency Display Trace Points
(buckets)
Resolution Bandwidth See “Frequency” on page 75 in this chapter.
Video Bandwidth Not available.
Clipping-to-Noise Dynamic Range See “Clipping-to-Noise Dynamic Range” on page 76 in this
Resolution Bandwidth Switching Uncertainty Not specified because it is negligible.
Available Detectors Does not apply.
Spurious Responses The “Spurious Responses” on page 43 of core specifications still
IF Amplitude Flatness See “IF Frequency Response” on page 32 of the core
IF Phase Linearity See “IF Phase Linearity” on page 33 of the core specifications for
Does not apply.
chapter.
apply. Additional bandwidth-option-dependent spurious responses are
given in the Analysis Bandwidth chapter for any optional bandwidths in
use.
specifications for the 10 MHz bandwidth. Specifications for wider
bandwidths are given in the Analysis Bandwidth chapter for any
optional bandwidths in use.
the 10 MHz bandwidth. Specifications for wider bandwidths are given
in the Analysis Bandwidth chapter for any optional bandwidths in use.
Data Acquisition See “Data Acquisition” on page 77 in this chapter for the 10 MHz
bandwidth. Specifications for wider bandwidths are given in the
Analysis Bandwidth chapter for any optional bandwidths in use.
74
Page 75

I/Q Analyzer
Frequency
Frequency
Description Specifications Supplemental Information
Frequency Span
Standard 10 Hz to 25 MHz
Option B40 10 Hz to 40 MHz
Resolution Bandwidth
(Spectrum Measurement)
Range
Overall
Span = 1 MHz
Span = 10 kHz
Span = 100 Hz
Window Shapes Flat Top, Uniform, Hanning, Hamming,
Analysis Bandwidth (Span)
(Waveform Measurement)
Standard 10 Hz to 25 MHz
Option B40 10 Hz to 40 MHz
100 mHz to 3 MHz
50 Hz to 1 MHz
1 Hz to 10 kHz
100 mHz to 100 Hz
Gaussian, Blackman, Blackman-Harris, Kaiser
Bessel (K-B 70 dB, K-B 90 dB & K-B 110 dB)
75
Page 76

I/Q Analyzer
Clipping-to-Noise Dynamic Range
Clipping-to-Noise Dynamic Range
Description Specifications Supplemental Information
Clipping-to-Noise Dynamic Range
a
Excluding residuals and spurious
responses
Clipping Level at Mixer Center frequency ≥ 20 MHz
IF Gain = Low −10 dBm −8 dBm (nominal)
IF Gain = High −20 dBm −17.5 dBm (nominal)
Noise Density at Mixer
at center frequency
c
(DANL
+ IFGainEffectd) + 2.25
b
dB
e
Example
f
a. This specification is defined to be the ratio of the clipping level (also known as “ADC Over Range”) to the noise
density. In decibel units, it can be defined as clipping_level [dBm] − noise_density [dBm/Hz]; the result has units
of dBFS/Hz (fs is “full scale”).
b. The noise density depends on the input frequency. It is lowest for a broad range of input frequencies near the
center frequency, and these specifications apply there. The noise density can increase toward the edges of the
span. The effect is nominally well under 1 dB.
c. The primary determining element in the noise density is the “Displayed Average Noise Level (DANL)” on
page 41.
d. DANL is specified with the IF Gain set to High, which is the best case for DANL but not for Clipping-to-noise
dynamic range. The core specifications “Displayed Average Noise Level (DANL)” on page 41, gives a
line entry on the excess noise added by using IF Gain = Low, and a footnote explaining how to combine the IF
Gain noise with the DANL.
e. DANL is specified for log averaging, not power averaging, and thus is 2.51 dB lower than the true noise density.
It is also specified in the narrowest RBW, 1 Hz, which has a noise bandwidth slightly wider than 1 Hz. These two
effects together add up to 2.25 B.
f. As an example computation, consider this: For the case where DANL = −151 dBm in 1 Hz, IF Gain is set to low,
and the “Additional DANL” is −160 dBm, the total noise density computes to −148.2 dBm/Hz and the Clip-
ping-to-noise ratio for a −10 dBm clipping level is −138.2 dBFS/Hz.
76
Page 77

I/Q Analyzer
Data Acquisition
Data Acquisition
Description Specifications Supplemental Information
Time Record Length (IQ pairs)
IQ Analyzer 4,000,000 IQ sample pairs ≈335 ms at 10 MHz Span
Sample Rate
At ADC
Option DP2, B40, or MPB 100 MSa/s IF Path ≤25 MHz
Option B40 200 MSa/s IF Path = 40 MHz
None of the above 90 MSa/s
IQ Pairs Integer submultiple of 15 Mpairs/s
depending on the span for spans of
8 MHz or narrower.
ADC Resolution
Option DP2, B40, or MPB 16 bits IF Path ≤25 MHz
Option B40 12 bits IF Path = 40 MHz
None of the above 14 bits
77
Page 78

I/Q Analyzer
Data Acquisition
78
Page 79

Keysight X-Series Signal Analyzer
N9010B
Specification Guide
3 Option B25 - 25 MHz Analysis Bandwidth
This chapter contains specifications for the Option B25 25 MHz Analysis
Bandwidth, and are unique to this IF Path.
79
Page 80

Option B25 - 25 MHz Analysis Bandwidth
Specifications Affected by Analysis Bandwidth
Specifications Affected by Analysis Bandwidth
The specifications in this chapter apply when the 25 MHz path is in use. In IQ
Analyzer, this will occur when the IF Path is set to 25 MHz, whether by Auto
selection (depending on Span) or manually.
Specification Name Information
IF Frequency Response See specifications in this chapter.
IF Phase Linearity See specifications in this chapter.
Spurious and Residual Responses The “Spurious Responses” on page 43 still apply. Further,
bandwidth-option-dependent spurious responses are contained within
this chapter.
Displayed Average Noise Level, Third-Order
Intermodulation and Phase Noise
The performance of the analyzer will degrade by an unspecified extent
when using this bandwidth option. This extent is not substantial enough
to justify statistical process control.
80
Page 81

Option B25 - 25 MHz Analysis Bandwidth
Other Analysis Bandwidth Specifications
Other Analysis Bandwidth Specifications
Description Specifi-
cations
IF Spurious Response
a
Supplemental
Information
Preamp Off
b
IF Second Harmonic
Apparent Freq Excitation Freq
Mixer Level
c
IF Gain
Any on-screen f (f + fc + 22.5 MHz)/2 −15 dBm Low −54 dBc (nominal)
−25 dBm High −54 dBc (nominal)
IF Conversion Image
Apparent Freq Excitation Freq
Mixer Level
c
IF Gain
Any on-screen f 2 × fc − f + 45 MHz −10 dBm Low −70 dBc (nominal)
−20 dBm High −70 dBc (nominal)
a. The level of these spurs is not warranted. The relationship between the spurious response and its excitation is
described in order to make it easier for the user to distinguish whether a questionable response is due to these
mechanisms. f is the apparent frequency of the spurious signal, fc is the measurement center frequency.
b. The spurious response specifications only apply with the preamp turned off. When the preamp is turned on, per-
formance is nominally the same as long as the mixer level is interpreted to be Mixer Level = Input Level − Input
Attenuation − Preamp Gain.
c. Mixer Level = Input Level − Input Attenuation.
81
Page 82

Option B25 - 25 MHz Analysis Bandwidth
Other Analysis Bandwidth Specifications
Description Specifications Supplemental Information
IF Frequency Response
a
Modes above 18 GHz
b
(Demodulation and FFT
response relative to the
center frequency)
Center
Freq (GHz)
Span
(MHz)
c
Preselector
Max Errord (Exceptionse)
20 to 30°C Full range
Midwidth
Error
(95th
Percentile)
Slope
(dB/MHz)
(95th
Percentile)
f
RMS
(nominal)
≤3.6 10 to ≤25 n/a ±0.45 dB ±0.45 dB ±0.12 dB ±0.10 0.051 dB
>3.6 10 to
≤25
>3.6 10 to
≤25
g
h
On 0.45 dB
Off
h
±0.45 dB ±0.80 dB ±0.12 dB ±0.10 0.071 dB
a. The IF frequency response includes effects due to RF circuits such as input filters, that are a function of RF fre-
quency, in addition to the IF passband effects.
b. Signal frequencies between 18 and 26.5 GHz are prone to additional response errors due to modes in the Type-N
connector used with frequency Option 526. With the use of Type-N to APC 3.5 mm adapter part number
1250-1744, there are nominally six such modes. These modes cause nominally up to −0.35 dB amplitude change,
with phase errors of nominally up to ±1.2°.
c. This column applies to the instantaneous analysis bandwidth in use. In the Spectrum analyzer Mode, this would
be the FFT width. For Span <10 MHz. see “IF Frequency Response” on page 32.
d. The maximum error at an offset (f) from the center of the FFT width is given by the expression ± [Midwidth Error +
(f × Slope)], but never exceeds ±Max Error. Here the Midwidth Error is the error at the center frequency for the
given FFT span. Usually, the span is no larger than the FFT width in which case the center of the FFT width is the
center frequency of the analyzer. In the Spectrum Analyzer mode, when the analyzer span is wider than the FFT
width, the span is made up of multiple concatenated FFT results, and thus has multiple centers of FFT widths so
the f in the equation is the offset from the nearest center. These specifications include the effect of RF frequency
response as well as IF frequency response at the worst case center frequency. Performance is nominally three
times better at most center frequencies.
e. The specification does not apply for frequencies greater than 3.6 MHz from the center in FFT widths of 7.2 to 8
MHz.
f. The “RMS” nominal performance is the standard deviation of the response relative to the center frequency, inte-
grated across the span. This performance measure was observed at a center frequency in each harmonic mixing
band, which is representative of all center frequencies; it is not the worst case frequency.
g. For information on the preselector which affects the passband for frequencies above 3.6 GHz when Option MPB
is not in use, see “Preselector Bandwidth” on page 27.
h. Option MPB is installed and enabled.
82
Page 83

Option B25 - 25 MHz Analysis Bandwidth
Other Analysis Bandwidth Specifications
Description Specifications Supplemental Information
IF Phase Linearity Deviation from mean phase linearity
Modes above 18 GHz
a
Center Freq (GHz) Span
(MHz)
Preselector Peak-to-peak
(nominal)
RMS (nominal)
≥0.02, <3.6 ≤25 n/a 0.6° 0.14°
c
≥3.6 ≤25
Off
1.9° 0.42°
≥3.6(Option ≤526 )≤25 On 4.5° 1.2°
a. Signal frequencies between 18 and 26.5 GHz are prone to additional response errors due to modes in the Type-N
connector used with frequency Option 526. With the use of Type-N to APC 3.5 mm adapter part number
1250-1744, there are nominally six such modes. These modes cause nominally up to −0.35 dB amplitude change,
with phase errors of nominally up to ±1.2°.
b. The listed performance is the standard deviation of the phase deviation relative to the mean phase deviation from
a linear phase condition, where the RMS is computed across the span shown.
c. Option MPB is installed and enabled.
b
83
Page 84

Option B25 - 25 MHz Analysis Bandwidth
Other Analysis Bandwidth Specifications
Description Specification Supplemental Information
Full Scale (ADC Clipping)
a
Default settings, signal at CF
(IF Gain = Low)
Band 0
Band 1 through 4
−8 dBm mixer level
−7 dBm mixer level
b
(nominal)
b
(nominal)
High Gain setting, signal at CF
(IF Gain = High)
Band 0
Band 1 through 6
−18 dBm mixer level
subject to gain limitations
−17 dBm mixer level
subject to gain limitations
b
(nominal),
c
b
(nominal),
c
Effect of signal frequency ≠ CF up to ±3 dB (nominal)
a. This table is meant to help predict the full-scale level, defined as the signal level for which ADC overload (clip-
ping) occurs. The prediction is imperfect, but can serve as a starting point for finding that level experimentally.
A SCPI command is also available for that purpose.
b. Mixer level is signal level minus input attenuation.
c. The available gain to reach the predicted mixer level will vary with center frequency. Combinations of high gains
and high frequencies will not achieve the gain required, increasing the full scale level.
84
Page 85

Option B25 - 25 MHz Analysis Bandwidth
Data Acquisition
Data Acquisition
Description Specifications Supplemental
Information
Time Record Length (IQ pairs)
IQ Analyzer 4,000,000 IQ sample pairs ≈88.9 ms at 25 MHz span
89600 VSA software 32-bit Data Packing 64-bit Data Packing Memory
Option DP2, B40, or MPB
None of the above 4,000,000 Sa (independent of data packing)
Sample Rate
At ADC
Option DP2, B40, or MPB 100 MSa/s IF Path ≤ 25 MHz
Option B40 200 MSa/s IF Path = 40 MHz
None of the above 90 MSa/s
IQ Pairs Span dependent
ADC Resolution
Option DP2, B40, or MPB 16 bits IF Path ≤ 25 MHz
Option B40 12 bits IF Path = 40 MHz
None of the above 14 bits
536 MSa (2
29
Sa) 268 MSa (228 Sa)
2 GB
85
Page 86

Option B25 - 25 MHz Analysis Bandwidth
Data Acquisition
86
Page 87

Keysight X-Series Signal Analyzer
N9010B
Specification Guide
4 Option B40 - 40 MHz Analysis Bandwidth
This chapter contains specifications for the Option B40 40 MHz Analysis
Bandwidth, and are unique to this IF Path.
87
Page 88

Option B40 - 40 MHz Analysis Bandwidth
Specifications Affected by Analysis Bandwidth
Specifications Affected by Analysis Bandwidth
The specifications in this chapter apply when the 40 MHz path is in use. In IQ
Analyzer, this will occur when the IF Path is set to 40 MHz, whether by Auto
selection (depending on Span) or manually.
Specification Name Information
IF Frequency Response See specifications in this chapter.
IF Phase Linearity See specifications in this chapter.
Spurious Responses There are three effects of the use of Option B40 on spurious responses.
Most of the warranted elements of the “Spurious Responses” on
page 43 still apply without changes, but the revised-version of the table
on page 43, modified to reflect the effect of Option B40, is shown in its
place in this chapter. The image responses part of that table have the
same warranted limits, but apply at different frequencies as shown in the
table. The "higher order RF spurs" line is slightly degraded. Also,
spurious-free dynamic range specifications are given in this chapter, as
well as IF Residuals.
Phase Noise The performance of the analyzer will degrade by an unspecified extent
when using wideband analysis. This extent is not substantial enough to
justify statistical process control.
Absolute Amplitude Accuracy Nominally 0.5 dB degradation from base instrument absolute amplitude
accuracy. (Refer to Absolute Amplitude Accuracy on page 33.)
Frequency Range Over Which
Specifications Apply
Specifications on this bandwidth only apply with center frequencies of
30 MHz and higher.
88
Page 89
Option B40 - 40 MHz Analysis Bandwidth
Other Analysis Bandwidth Specifications
Other Analysis Bandwidth Specifications
Description Specifications Supplemental Information
a
Spurious Responses
(see Band Overlaps on page 16)
Preamp Offb
Residual Responses
Image Responses
c
d
−100 dBm (nominal)
Tuned Freq (f) Excitation Freq Response
10 MHz to 3.6 GHz f+10100 MHz –119 dBc (nominal)
10 MHz to 3.6 GHz f+500 MHz –121 dBc (nominal)
3.5 to 13.6 GHz f+500 MHz –89 dBc (nominal)
13.5 to 17.1 GHz f+500 MHz –83 dBc (nominal)
17.0 to 22 GHz f+500 MHz –82 dBc (nominal)
22 to 26.5 GHz f+500 MHz –79 dBc (nominal)
>26.5 GHz f+500 MHz –79 dBc (nominal)
Other Spurious Responses
Carrier Frequency ≤26.5 GHz
First RF Order
e
−10 dBm –112 dBc (nominal)
(f ≥ 10 MHz from carrier)
Higher RF Order
f
−40 dBm –100 dBc (nominal)
f ≥ 10 MHz from carrier
Carrier Frequency >26.5 GHz
First RF Order
e
–30 dBm
–100 dBc (nominal)
(f ≥ 10 MHz from carrier)
Higher RF Order
g
−30 dBm –100 dBc (nominal)
(f ≥ 10 MHz from carrier)
LO-Related Spurious Response
f > 600 MHz from carrier
−10 dBm −90 dBc + 20 × log(N)
(nominal)
10 MHz to 3.6 GHz
Sidebands, offset from CW signal
≤200 Hz
200 Hz to 3 kHz
3 kHz to 30 kHz
−70 dBc
−73 dBc
−73 dBc (nominal)
g
(nominal)
g
(nominal)
30 kHz to 10 MHz −80 dBc (nominal)
89
Page 90

Option B40 - 40 MHz Analysis Bandwidth
Other Analysis Bandwidth Specifications
a. Preselector enabled for frequencies >3.6 GHz.
b. The spurious response specifications only apply with the preamp turned off. When the preamp is turned on, per-
formance is nominally the same as long as the mixer level is interpreted to be: Mixer Level = Input Level − Input
Attenuation − Preamp Gain
c. Input terminated, 0 dB input attenuation.
d. Mixer Level is –10 dBm for all except >26.5 GHz, which is –30 dBm.
e. With first RF order spurious products, the indicated frequency will change at the same rate as the input, with
higher order, the indicated frequency will change at a rate faster than the input.
f. RBW=100 Hz. With higher RF order spurious responses, the observed frequency will change at a rate faster
than the input frequency.
g. Nominally −40 dBc under large magnetic (0.38 Gauss rms) or vibrational (0.21 g rms) environmental stimuli.
Description Specifications Supplemental Information
Span
(MHz)
a
Relative to center frequency
Modes above 18 GHz
Preselector Nominal
b
RMS (nominal)
IF Frequency Response
Center Freq
(GHz)
≥0.03, <3.6 ≤40 n/a ±0.3 dB 0.08 dB
d
>3.6, ≤26.5 ≤40
>26.5 ≤40
Off
Off
≥3.6 ≤40 On
d
±0.25 dB 0.08 dB
±0.25 dB 0.12 dB
See footnote
e
a. The IF frequency response includes effects due to RF circuits such as input filters, that are a function of RF fre-
quency, in addition to the IF passband effects.
b. Signal frequencies above 18 GHz are prone to additional response errors due to modes in the Type-N connector
used. With the use Type-N to APC 3.5 mm adapter part number 1250-1744, there are nominally six such modes.
These modes cause nominally up to −0.35 dB amplitude change, with phase errors of nominally up to ±1.2°.
c. The listed performance is the rms of the amplitude deviation from the mean amplitude response of a span/CF
combination. 50% of the combinations of prototype instruments, center frequencies and spans had performance
better than the listed values.
d. Option MPB is installed and enabled.
e. The passband shape will be greatly affected by the preselector. See “Preselector Bandwidth” on page 27.
c
90
Page 91
Option B40 - 40 MHz Analysis Bandwidth
Other Analysis Bandwidth Specifications
Description Specifications Supplemental Information
IF Phase Linearity Deviation from mean phase linearity
Modes above 18 GHz
a
Center Freq
(GHz)
Span
(MHz)
Preselector Peak-to-peak
(nominal)
RMS (nominal)
≥0.02, <3.6 40 n/a 0.2° 0.05°
≥3.6 40
Off
c
5° 1.4°
a. Signal frequencies above 18 GHz are prone to additional response errors due to modes in the Type-N connector
used. With the use Type-N to APC 3.5 mm adapter part number 1250-1744, there are nominally six such
modes. These modes cause nominally up to −0.35 dB amplitude change, with phase errors of nominally up to
±1.2°.
b. The listed performance is the standard deviation of the phase deviation relative to the mean phase deviation
from a linear phase condition, where the RMS is computed across the span shown.
c. Option MPB is installed and enabled.
Description Specification Supplemental Information
Full Scale (ADC Clipping)
a
Default settings, signal at CF
(IF Gain = Low; IF Gain Offset = 0 dB)
Band 0
Band 1 through 6
−8 dBm mixer level
−7 dBm mixer level
b
(nominal)
b
(nominal)
b
High Gain setting, signal at CF
(IF Gain = High; IF Gain Offset = 0 dB)
b
Band 0
Band 1 through 6
IF Gain Offset ≠ 0 dB, signal at CF
−18 dBm mixer level
subject to gain limitations
−17 dBm mixer level
subject to gain limitations
d
See formula
limitations
, subject to gain
c
(nominal),
c
b
(nominal),
c
Effect of signal frequency ≠ CF up to ±3 dB (nominal)
a. This table is meant to help predict the full-scale level, defined as the signal level for which ADC overload (clip-
ping) occurs. The prediction is imperfect, but can serve as a starting point for finding that level experimentally.
A SCPI command is also available for that purpose.
b. Mixer level is signal level minus input attenuation.
c. The available gain to reach the predicted mixer level will vary with center frequency. Combinations of high gains
and high frequencies will not achieve the gain required, increasing the full scale level.
91
Page 92
Option B40 - 40 MHz Analysis Bandwidth
Other Analysis Bandwidth Specifications
d. The mixer level for ADC clipping is nominally given by that for the default settings, minus IF Gain Offset, minus
10 dB if IF Gain is set to High.
Description Specification Supplemental Information
EVM
(EVM measurement floor for an 802.11g OFDM
signal, MCS7, using 89600 VSA software
equalization on channel estimation sequence
and data, pilot tracking on)
2.4 GHz 0.35% (nominal)
5.8 GHz with Option MPB 0.50% (nominal)
Description Specification Supplemental Information
Signal to Noise Ratio
Ratio of clipping level
a
to noise level
Example: 1.8 GHz 134 dBc/Hz, IF Gain = Low, IF Gain Offset = 0 dB
a. For the clipping level, see the table above, "Full Scale." Note that the clipping level is not a warranted specifica-
tion, and has particularly high uncertainty at high microwave frequencies.
92
Page 93
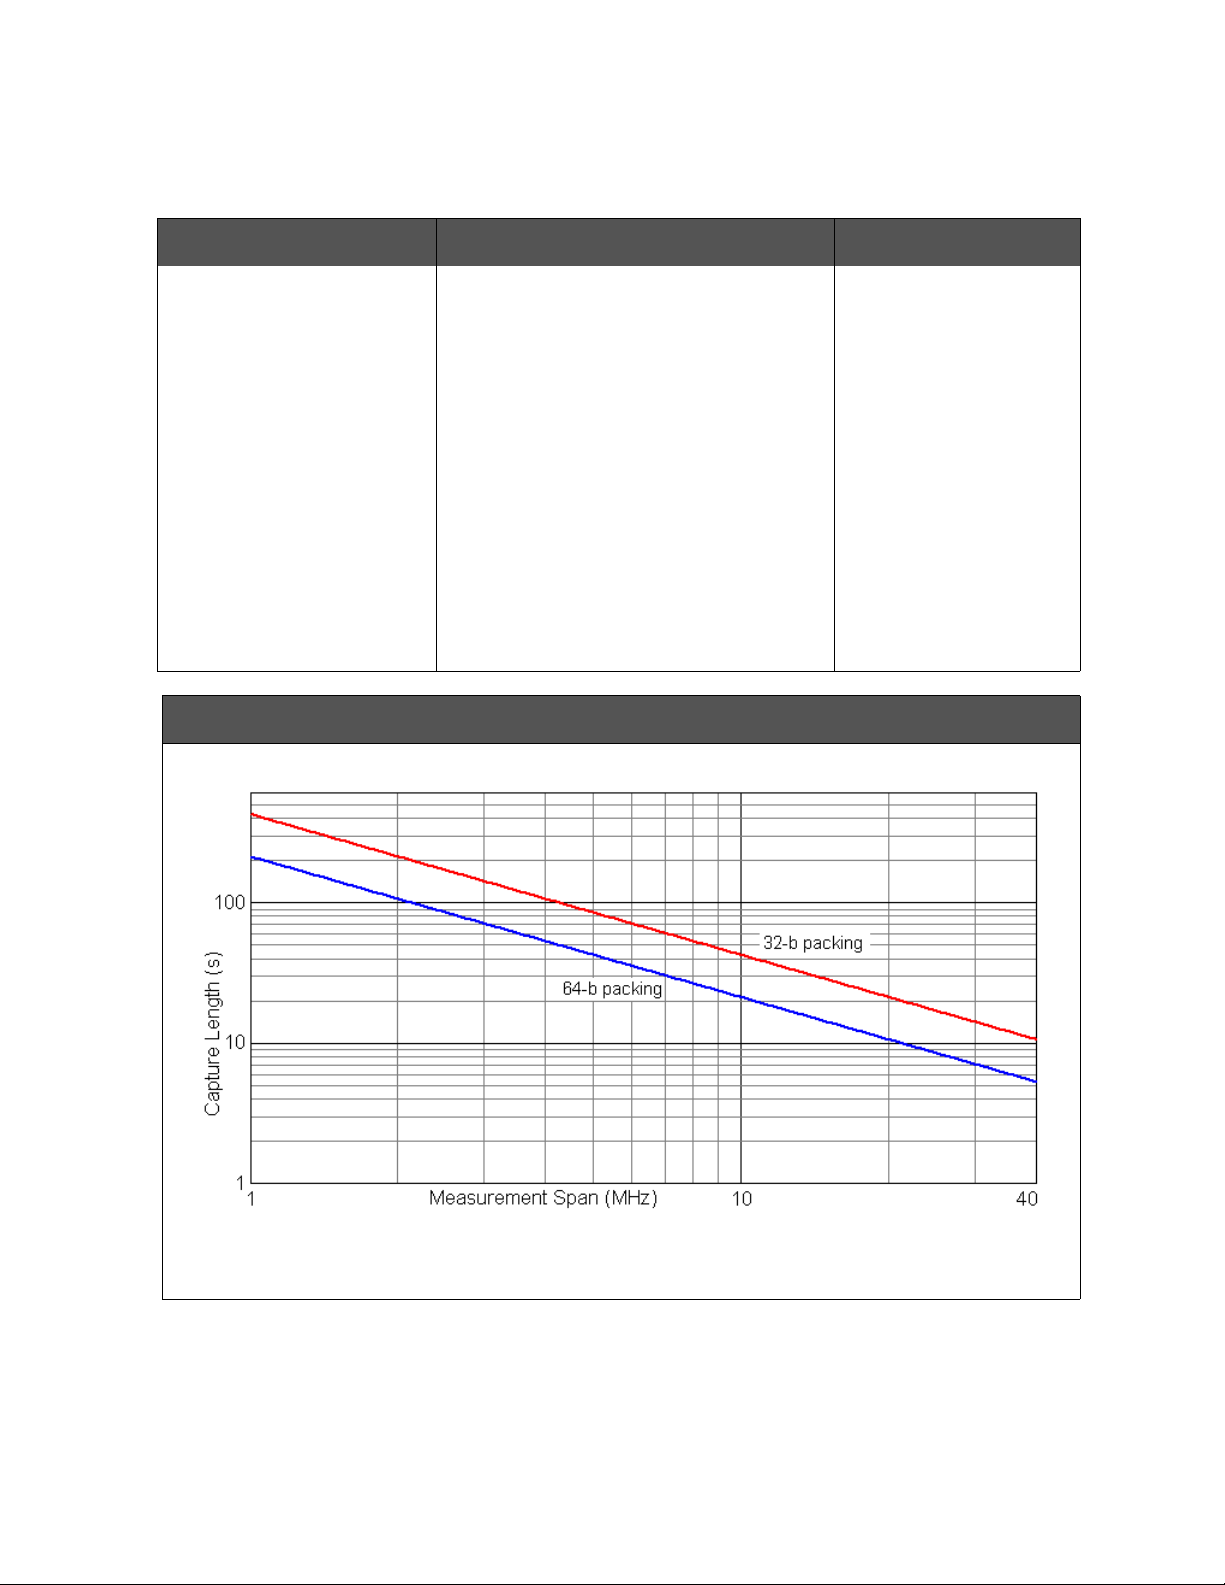
Option B40 - 40 MHz Analysis Bandwidth
Data Acquisition
Data Acquisition
Description Specifications Supplemental Information
Time Record Length
IQ Analyzer 4,000,000 IQ sample pairs
Advanced Tools Data Packing 89600 VSA software
32-bit 64-bit
Length (IQ sample pairs)
Length (time units) Samples/(Span × 1.28)
Sample Rate
At ADC 200 MSa/s
IQ Pairs Span dependent
ADC Resolution 12 bits
Capture Time [Plot]
536 MSa (2
29
Sa) 268 MSa (228 Sa)
2 GB total memory
NOTE This plot is based on the full access to the 2 GB deep capture memory, which requires
89600 VSA software.
93
Page 94

Option B40 - 40 MHz Analysis Bandwidth
Data Acquisition
94
Page 95

Keysight X-Series Signal Analyzer
N9010B
Specification Guide
5 Option CR3 - Connector Rear, 2nd IF Output
This chapter contains specifications for Option CR3, Connector Rear, 2nd IF
Output.
95
Page 96

Option CR3 - Connector Rear, 2nd IF Output
Specifications Affected by Connector Rear, 2nd IF Output
Specifications Affected by Connector Rear, 2nd IF Output
No other analyzer specifications are affected by the presence or use of this
option. New specifications are given in the following page.
96
Page 97
Option CR3 - Connector Rear, 2nd IF Output
Other Connector Rear, 2nd IF Output Specifications
Other Connector Rear, 2nd IF Output Specifications
Aux IF Out Port
Description Specifications Supplemental Information
Connector SMA female Shared with other options
Impedance 50Ω (nominal)
Second IF Out
Description Specifications Supplemental Information
Second IF Out
Output Center Frequency
SA Mode 322.5 MHz
I/Q Analyzer Mode
IF Path ≤ 25 MHz 322.5 MHz
IF Path 40 MHz 250 MHz
IF Path 160 MHz 300 MHz
Conversion Gain at 2nd IF output
center frequency
Bandwidth
Low band
High band
With preselector
Preselector bypassed (Option
MPB)
Residual Output Signals –94 dBm or lower (nominal)
a. “Conversion Gain” is defined from RF input to IF Output with 0 dB mechanical attenuation and the electronic
attenuator off. The nominal performance applies in zero span.
b. The passband width at –3 dB nominally extends from IF frequencies of 230 to 370 MHz. The passband width is
thus maximum and symmetric when using 300 MHz as the IF output center frequency. When the IF path in use
is centered at a frequency different from 300 MHz, the passband will be asymmetric.
c. The YIG-tuned preselector bandwidth nominally varies from 55 MHz for a center frequencies of 3.6 GHz
through 57 MHz at 15 GHz to 75 MHz at 26.5 GHz. The preselector effect will dominate the passband width.
d. The passband width at –6 dB nominally extends from 100 to 800 MHz. Thus, the maximum width is not cen-
tered around the IF output center frequency. Expandable to 900 MHz with Corrections.
–1 to +4 dB (nominal) plus RF frequency response
Up to 160 MHz (nominal)
Depends on RF center frequency
Up to 700 MHz nominal
b
c
d
a
97
Page 98

Option CR3 - Connector Rear, 2nd IF Output
Other Connector Rear, 2nd IF Output Specifications
98
Page 99

Keysight X-Series Signal Analyzer
N9010B
Specification Guide
6 Option CRP - Connector Rear, Arbitrary IF Output
This chapter contains specifications for Option CRP, Connector Rear, Arbitrary
IF Output.
99
Page 100

Option CRP - Connector Rear, Arbitrary IF Output
Specifications Affected by Connector Rear, Arbitrary IF Output
Specifications Affected by Connector Rear, Arbitrary IF Output
No other analyzer specifications are affected by the presence or use of this
option. New specifications are given in the following page.
100
 Loading...