

Page 1

Keysight 11970 Series
Harmonic Mixers
User’s Guide
Page 2

Notices
CAUTION
WARNING
Copyright Notice
© Keysight Technologies 2011 - 2019
No part of this manual may be reproduced in
any form or by any means (including electronic
storage and retrieval or translation into a foreign language) without prior agreement and
written consent from Keysight Technologies as
governed by United States and international
copyright laws.
Manual Part Number
11970-90040
Edition
Edition 3, October 31, 2019
Printed in:
Printed in Malaysia
Published by:
Keysight Technologies
Bayan Lepas Free Industrial Zone,
11900 Penang, Malaysia
Technology Licenses
The hard ware and/or software described in
this document are furnished under a license
and may be used or copied only in accordance
with the terms of such license.
Declaration of Conformity
Declarations of Conformity for this product
and for other Keysight products may be downloaded from the Web. Go to http://www.key-
sight.com/go/conformity. You can then search
by product number to find the latest Declaration of Conformity.
U.S. Government Rights
The Software is “commercial computer software,” as defined by Federal Acquisition Regulation (“FAR”) 2.101. Pursuant to FAR 12.212
and 27.405-3 and Department of Defense FAR
Supplement (“DFARS”) 227.7202, the U.S.
government acquires commercial computer
software under the same terms by which the
software is customarily provided to the public.
Accordingly, Keysight provides the Software to
U.S. government customers under its standard
commercial license, which is embodied in its
End User License Agreement (EULA), a copy of
which can be found at http://www.key-
sight.com/find/sweula. The license set forth in
the EULA represents the exclusive authority by
which the U.S. government may use, modify,
distribute, or disclose the Software. The EULA
and the license set forth therein, does not
require or permit, among other things, that
Keysight: (1) Furnish technical information
related to commercial computer software or
commercial computer software documentation that is not customarily provided to the
public; or (2) Relinquish to, or otherwise provide, the government rights in excess of these
rights customarily provided to the public to
use, modify, reproduce, release, perform, d isplay, or disclose commercial computer software or commercial computer software
documentation. No additional government
requirements beyond those set forth in the
EULA shall apply, except to the extent that
those terms, rights, or licenses are explicitly
required from all providers of commercial
computer software pursuant to the FAR and
the DFARS and are set forth specifically in
writing elsewhere in the EULA. Keysight shall
be under no obligation to update, revise or
otherwise modify the Software. With respect
to any technical data as defined by FAR 2.101,
pursuant to FAR 12.211 and 27.404.2 and
DFARS 227.7102, the U.S. government
acquires no greater than Limited Rights as
defined in FAR 27.401 or DFAR 227.7103-5 (c),
as applicable in any technical data.
Warranty
THE MATERIAL CONTAINED IN THIS DOCUMENT IS PROVIDED “AS IS,” AND IS SUBJECT
TO BEING CHANGED, WITHOUT NOTICE, IN
FUTURE EDITIONS. FURTHER, TO THE MAXIMUM EXTENT PERMITTED BY APPLICABLE
LAW, KEYSIGHT DISCLAIMS ALL WARRANTIES, EITHER EXPRESS OR IMPLIED, WITH
REGARD TO THIS MANUAL AND ANY INFORMATION CONTAINED HEREIN, INCLUDING
BUT NOT LIMITED TO THE IMPLIED WARRANTIES OF MERCHANTABILITY AND FITNESS
FOR A PARTICULAR PURPOSE. KEYSIGHT
SHALL NOT BE LIABLE FOR ERRORS OR FOR
INCIDENTAL OR CONSEQUENTIAL DAMAGES
IN CONNECTION WITH THE FURNISHING,
USE, OR PERFORMANCE OF THIS DOCUMENT OR OF ANY INFORMATION CONTAINED
HEREIN. SHOULD KEYSIGHT AND THE USER
HAVE A SEPARATE WRITTEN AGREEMENT
WITH WARRANTY TERMS COVERING THE
MATERIAL IN THIS DOCUMENT THAT CONFLICT WITH THESE TERMS, THE WARRANTY
TERMS IN THE SEPARATE AGREEMENT
SHALL CONTROL.
Safety Information
A CAUTION notice denotes a hazard. It calls
attention to an operating procedure, practice,
or the like that, if not correctly performed or
adhered to, could result in damage to the
product or loss of important data. Do not proceed beyond a CAUTION notice until the indicated conditions are fully understood and met.
A WARNING notice denotes a hazard. It calls
attention to an operating procedure, practice,
or the like that, if not correctly performed or
adhered to, could result in personal injury or
death. Do not proceed beyond a WARNING
notice until the indicated conditions are fully
understood and met.
2 Keysight 11970 Series User’s Guide
Page 3

Waste Electrical and Electronic Equipment (WEEE) Directive
This instrument complies with the WEEE Directive marking requirement. This affixed product label
indicates that you must not discard this electrical or electronic product in domestic household
waste.
Product category:
With reference to the equipment types in the WEEE directive Annex 1, this instrument is classified
as a “Monitoring and Control Instrument” product.
The affixed product label is as shown below.
Do not dispose in domestic household waste.
To return this unwanted instrument, contact your nearest Keysight Service Center, or visit http://
about.keysight.com/en/companyinfo/environment/takeback.shtml for more information.
Sales and Technical Support
To contact Keysight for sales and technical support, refer to the support links on the following
Keysight websites:
– www.keysight.com/find/mta
(product-specific information and support, software and documentation updates)
– www.keysight.com/find/assist
(worldwide contact information for repair and service)
Keysight 11970 Series User’s Guide 3
Page 4

THIS PAGE HAS BEEN INTENTIONALLY LEFT BLANK.
4 Keysight 11970 Series User’s Guide
Page 5

Table of Contents
Waste Electrical and Electronic Equipment (WEEE) Directive . . . . . . . . . . . . . . . . . . . . 3
Product category: . . . . . . . . . . . . . . . . . . . . . . . . . . . . . . . . . . . . . . . . . . . . . . . . . . . . 3
Sales and Technical Support . . . . . . . . . . . . . . . . . . . . . . . . . . . . . . . . . . . . . . . . . . . . . . 3
List of Figures . . . . . . . . . . . . . . . . . . . . . . . . . . . . . . . . . . . . . . . . . . . . . . . . . . . . . . . . . . 7
List of Tables . . . . . . . . . . . . . . . . . . . . . . . . . . . . . . . . . . . . . . . . . . . . . . . . . . . . . . . . . . . 9
1 General Information
Introduction . . . . . . . . . . . . . . . . . . . . . . . . . . . . . . . . . . . . . . . . . . . . . . . . . . . . . . . . . . 12
Equipment supplied . . . . . . . . . . . . . . . . . . . . . . . . . . . . . . . . . . . . . . . . . . . . . . . . . . 12
Mixers covered by manual . . . . . . . . . . . . . . . . . . . . . . . . . . . . . . . . . . . . . . . . . . . . . 12
11970 Series harmonic mixers . . . . . . . . . . . . . . . . . . . . . . . . . . . . . . . . . . . . . . . . . 13
Options . . . . . . . . . . . . . . . . . . . . . . . . . . . . . . . . . . . . . . . . . . . . . . . . . . . . . . . . . . . . 13
Spectrum analyzer retrofit requirements . . . . . . . . . . . . . . . . . . . . . . . . . . . . . . . . . 13
Specifications . . . . . . . . . . . . . . . . . . . . . . . . . . . . . . . . . . . . . . . . . . . . . . . . . . . . . . . . . 16
Environmental limitations . . . . . . . . . . . . . . . . . . . . . . . . . . . . . . . . . . . . . . . . . . . . . 16
2Operation
Introduction . . . . . . . . . . . . . . . . . . . . . . . . . . . . . . . . . . . . . . . . . . . . . . . . . . . . . . . . . . 26
Operating precautions . . . . . . . . . . . . . . . . . . . . . . . . . . . . . . . . . . . . . . . . . . . . . . . . 26
Getting Started . . . . . . . . . . . . . . . . . . . . . . . . . . . . . . . . . . . . . . . . . . . . . . . . . . . . . . . . 27
Mixer connections . . . . . . . . . . . . . . . . . . . . . . . . . . . . . . . . . . . . . . . . . . . . . . . . . . . 27
Using the Mixers with the E4407B Spectrum Analyzer (Option AYZ) . . . . . . . . . . . . . . 28
Set up the equipment . . . . . . . . . . . . . . . . . . . . . . . . . . . . . . . . . . . . . . . . . . . . . . . . 28
Using the Mixers with the E4440A, E4446A, or E4448A PSA Series Spectrum
Analyzer (Option AYZ) . . . . . . . . . . . . . . . . . . . . . . . . . . . . . . . . . . . . . . . . . . . . . . . . 32
Set up the equipment . . . . . . . . . . . . . . . . . . . . . . . . . . . . . . . . . . . . . . . . . . . . . . . . 32
Using the 11970A, Q, U, V, and W Mixers with the N9030A and N9010A
X-Series Signal Analyzers (Option EXM) . . . . . . . . . . . . . . . . . . . . . . . . . . . . . . . . . . 36
Set up the equipment . . . . . . . . . . . . . . . . . . . . . . . . . . . . . . . . . . . . . . . . . . . . . . . . 36
Amplitude calibration . . . . . . . . . . . . . . . . . . . . . . . . . . . . . . . . . . . . . . . . . . . . . . . . 37
Loading conversion loss data for the signal analyzer . . . . . . . . . . . . . . . . . . . . . . . . 37
Signal ID . . . . . . . . . . . . . . . . . . . . . . . . . . . . . . . . . . . . . . . . . . . . . . . . . . . . . . . . . . . 39
Image shift . . . . . . . . . . . . . . . . . . . . . . . . . . . . . . . . . . . . . . . . . . . . . . . . . . . . . . . . . 40
Using the 11970A, Q, U, V, and W Mixers with the N9040B X- Series Signal
Analyzer (Option EXM) . . . . . . . . . . . . . . . . . . . . . . . . . . . . . . . . . . . . . . . . . . . . . . . . 41
Set up the equipment . . . . . . . . . . . . . . . . . . . . . . . . . . . . . . . . . . . . . . . . . . . . . . . . 41
Amplitude calibration . . . . . . . . . . . . . . . . . . . . . . . . . . . . . . . . . . . . . . . . . . . . . . . . 43
Loading conversion loss data for the signal analyzer . . . . . . . . . . . . . . . . . . . . . . . . 44
Signal ID . . . . . . . . . . . . . . . . . . . . . . . . . . . . . . . . . . . . . . . . . . . . . . . . . . . . . . . . . . . 46
Image shift . . . . . . . . . . . . . . . . . . . . . . . . . . . . . . . . . . . . . . . . . . . . . . . . . . . . . . . . . 47
Using the Mixers with the 856X Series Spectrum Analyzers . . . . . . . . . . . . . . . . . . . . . 48
Keysight 11970 Series User’s Guide 5
Page 6

Set up the equipment . . . . . . . . . . . . . . . . . . . . . . . . . . . . . . . . . . . . . . . . . . . . . . . . 48
Select the frequency band . . . . . . . . . . . . . . . . . . . . . . . . . . . . . . . . . . . . . . . . . . . . 48
Save the average conversion-loss value . . . . . . . . . . . . . . . . . . . . . . . . . . . . . . . . . 50
Signal identification . . . . . . . . . . . . . . . . . . . . . . . . . . . . . . . . . . . . . . . . . . . . . . . . . . 51
Identify signals with the frequency-shift method . . . . . . . . . . . . . . . . . . . . . . . . . . . 52
Identify signals in wide frequency spans . . . . . . . . . . . . . . . . . . . . . . . . . . . . . . . . . 53
Using the Mixers with MMS Analyzers . . . . . . . . . . . . . . . . . . . . . . . . . . . . . . . . . . . . . 55
Preliminary operation . . . . . . . . . . . . . . . . . . . . . . . . . . . . . . . . . . . . . . . . . . . . . . . . 55
Operation . . . . . . . . . . . . . . . . . . . . . . . . . . . . . . . . . . . . . . . . . . . . . . . . . . . . . . . . . . 55
Conversion loss versus frequency correction . . . . . . . . . . . . . . . . . . . . . . . . . . . . . . 59
Using the Mixers with the 8566B Spectrum Analyzer . . . . . . . . . . . . . . . . . . . . . . . . . . 62
Set up the equipment . . . . . . . . . . . . . . . . . . . . . . . . . . . . . . . . . . . . . . . . . . . . . . . . 62
Amplitude calibration . . . . . . . . . . . . . . . . . . . . . . . . . . . . . . . . . . . . . . . . . . . . . . . . 63
Signal identification . . . . . . . . . . . . . . . . . . . . . . . . . . . . . . . . . . . . . . . . . . . . . . . . . . 64
3Service
Maintenance . . . . . . . . . . . . . . . . . . . . . . . . . . . . . . . . . . . . . . . . . . . . . . . . . . . . . . . . . . 68
Repairs . . . . . . . . . . . . . . . . . . . . . . . . . . . . . . . . . . . . . . . . . . . . . . . . . . . . . . . . . . . . 68
6 Keysight 11970 Series User’s Guide
Page 7

List of Figures
Figure 1-1 11970 Series harmonic mixers . . . . . . . . . . . . . . . . . . . . . . . . . . . . . . . 13
Figure 1-2 Mixer connection kit, Option 009 . . . . . . . . . . . . . . . . . . . . . . . . . . . . . 15
Figure 1-3 Dimensions . . . . . . . . . . . . . . . . . . . . . . . . . . . . . . . . . . . . . . . . . . . . . . 23
Figure 2-1 Harmonic mixer setup (E4407B) . . . . . . . . . . . . . . . . . . . . . . . . . . . . . 28
Figure 2-2 Multiple signal responses (E4407B) . . . . . . . . . . . . . . . . . . . . . . . . . . . 30
Figure 2-3 Valid signal responses (E4407B) . . . . . . . . . . . . . . . . . . . . . . . . . . . . . 31
Figure 2-4 Harmonic mixer setup (E4440A/ E4446A/ E4448A) . . . . . . . . . . . . . . 32
Figure 2-5 Multiple signal responses (E4440A/ E4446A/ E4448A) . . . . . . . . . . . 34
Figure 2-6 Valid signal responses (E4440A/ E4446A/ E4448A) . . . . . . . . . . . . . . 35
Figure 2-7 External mixer setup (N9030A/ N9010A) . . . . . . . . . . . . . . . . . . . . . . 36
Figure 2-8 External mixer setup (N9040B) . . . . . . . . . . . . . . . . . . . . . . . . . . . . . . 41
Figure 2-9 Multiple signal responses (N9040B) . . . . . . . . . . . . . . . . . . . . . . . . . . 42
Figure 2-10 Valid signal responses (N9040B) . . . . . . . . . . . . . . . . . . . . . . . . . . . . . 43
Figure 2-11 Loading the conversion loss files to the corrections array . . . . . . . . . 45
Figure 2-12 External mixed setup (856X) . . . . . . . . . . . . . . . . . . . . . . . . . . . . . . . . 48
Figure 2-13 Select the band of interest . . . . . . . . . . . . . . . . . . . . . . . . . . . . . . . . . . 50
Figure 2-14 Store and correct for conversion loss . . . . . . . . . . . . . . . . . . . . . . . . . 51
Figure 2-15 Signal responses produced by a 50 GHz signal in U band . . . . . . . . . 52
Figure 2-16 Response for invalid signals . . . . . . . . . . . . . . . . . . . . . . . . . . . . . . . . . 53
Figure 2-17 Response for valid signals . . . . . . . . . . . . . . . . . . . . . . . . . . . . . . . . . . 53
Figure 2-18 SIG ID AT MKR performed on an image signal . . . . . . . . . . . . . . . . . . 54
Figure 2-19 SIG ID AT MKR performed on a true signal . . . . . . . . . . . . . . . . . . . . . 54
Figure 2-20 Keysight 11970 connections to the Keysight 71000 series spectrum
Figure 2-21 External mixer connection . . . . . . . . . . . . . . . . . . . . . . . . . . . . . . . . . . 62
Figure 2-22 Typical milimeter signal display . . . . . . . . . . . . . . . . . . . . . . . . . . . . . . 63
Figure 2-23 Calibration sheet 1 . . . . . . . . . . . . . . . . . . . . . . . . . . . . . . . . . . . . . . . . 65
Figure 2-24 Calibration sheet 2 . . . . . . . . . . . . . . . . . . . . . . . . . . . . . . . . . . . . . . . . 66
analyzer . . . . . . . . . . . . . . . . . . . . . . . . . . . . . . . . . . . . . . . . . . . . . . 55
Keysight 11970 Series User’s Guide 7
Page 8

THIS PAGE HAS BEEN INTENTIONALLY LEFT BLANK.
8 Keysight 11970 Series User’s Guide
Page 9

List of Tables
Table 1-1 Option EXM on N9030A . . . . . . . . . . . . . . . . . . . . . . . . . . . . . . . . . . . . 13
Table 1-2 Option EXM on N9010A . . . . . . . . . . . . . . . . . . . . . . . . . . . . . . . . . . . . 14
Table 1-3 11970 Series specifications . . . . . . . . . . . . . . . . . . . . . . . . . . . . . . . . . 16
Table 1-4 11970K specifications . . . . . . . . . . . . . . . . . . . . . . . . . . . . . . . . . . . . . 17
Table 1-5 11970A specifications . . . . . . . . . . . . . . . . . . . . . . . . . . . . . . . . . . . . . 18
Table 1-6 11970Q specifications . . . . . . . . . . . . . . . . . . . . . . . . . . . . . . . . . . . . . 19
Table 1-7 11970U specifications . . . . . . . . . . . . . . . . . . . . . . . . . . . . . . . . . . . . . 20
Table 1-8 11970V specifications . . . . . . . . . . . . . . . . . . . . . . . . . . . . . . . . . . . . . 21
Table 1-9 11970W specifications . . . . . . . . . . . . . . . . . . . . . . . . . . . . . . . . . . . . . 22
Table 1-10 Physical characteristics . . . . . . . . . . . . . . . . . . . . . . . . . . . . . . . . . . . . 23
Table 2-1 External mixer frequency ranges . . . . . . . . . . . . . . . . . . . . . . . . . . . . . 49
Table 2-2 External mixing bands and associated mixing harmonics . . . . . . . . . . 57
Table 2-3 Frequency ranges and corresponding harmonic numbers . . . . . . . . . 59
Keysight 11970 Series User’s Guide 9
Page 10

THIS PAGE HAS BEEN INTENTIONALLY LEFT BLANK.
10 Keysight 11970 Series User’s Guide
Page 11

Keysight 11970 Series Harmonic Mixers
User’s Guide
1 General Information
Introduction 12
Specifications 16
This chapter covers equipment supplied, the mixers and options that are covered in this manual, as
well as specifications and environmental limitations regarding the mixer.
11
Page 12

1 General Information
Introduction
The Keysight Models 11970K, 11970A, 11970Q, 11970U, 11970V, and 11970W are
general-purpose harmonic mixers with very flat frequency response characteristics and low
conversion loss. Collectively, they cover the frequency range of 18 to 110 GHz. The 11970K covers
the 18 - 26.5 GHz range; the 11970A, the 26.5 - 40 GHz range; the 11970Q, the 33 - 50 GHz
range; the 11970U, the 40 - 60 GHz range; the 11970V, the 50 - 75 GHz range; and the 11970W,
the 75 - 110 GHz range.
The overall local oscillator (LO) frequency range of the 11970 Series Mixers is 3.0 to 6.1 GHz. Each
of the mixers employs a different LO harmonic, and as a result has a different optimum LO range
within the overall LO range of the series.
An 8 1/2 by 11 inch conversion loss table and chart is included with each mixer shipment. There is
also electronic media included that is used to download the conversion loss data into a few of the
Spectrum Analyzers documented in this user’s guide. This conversion loss data table must be
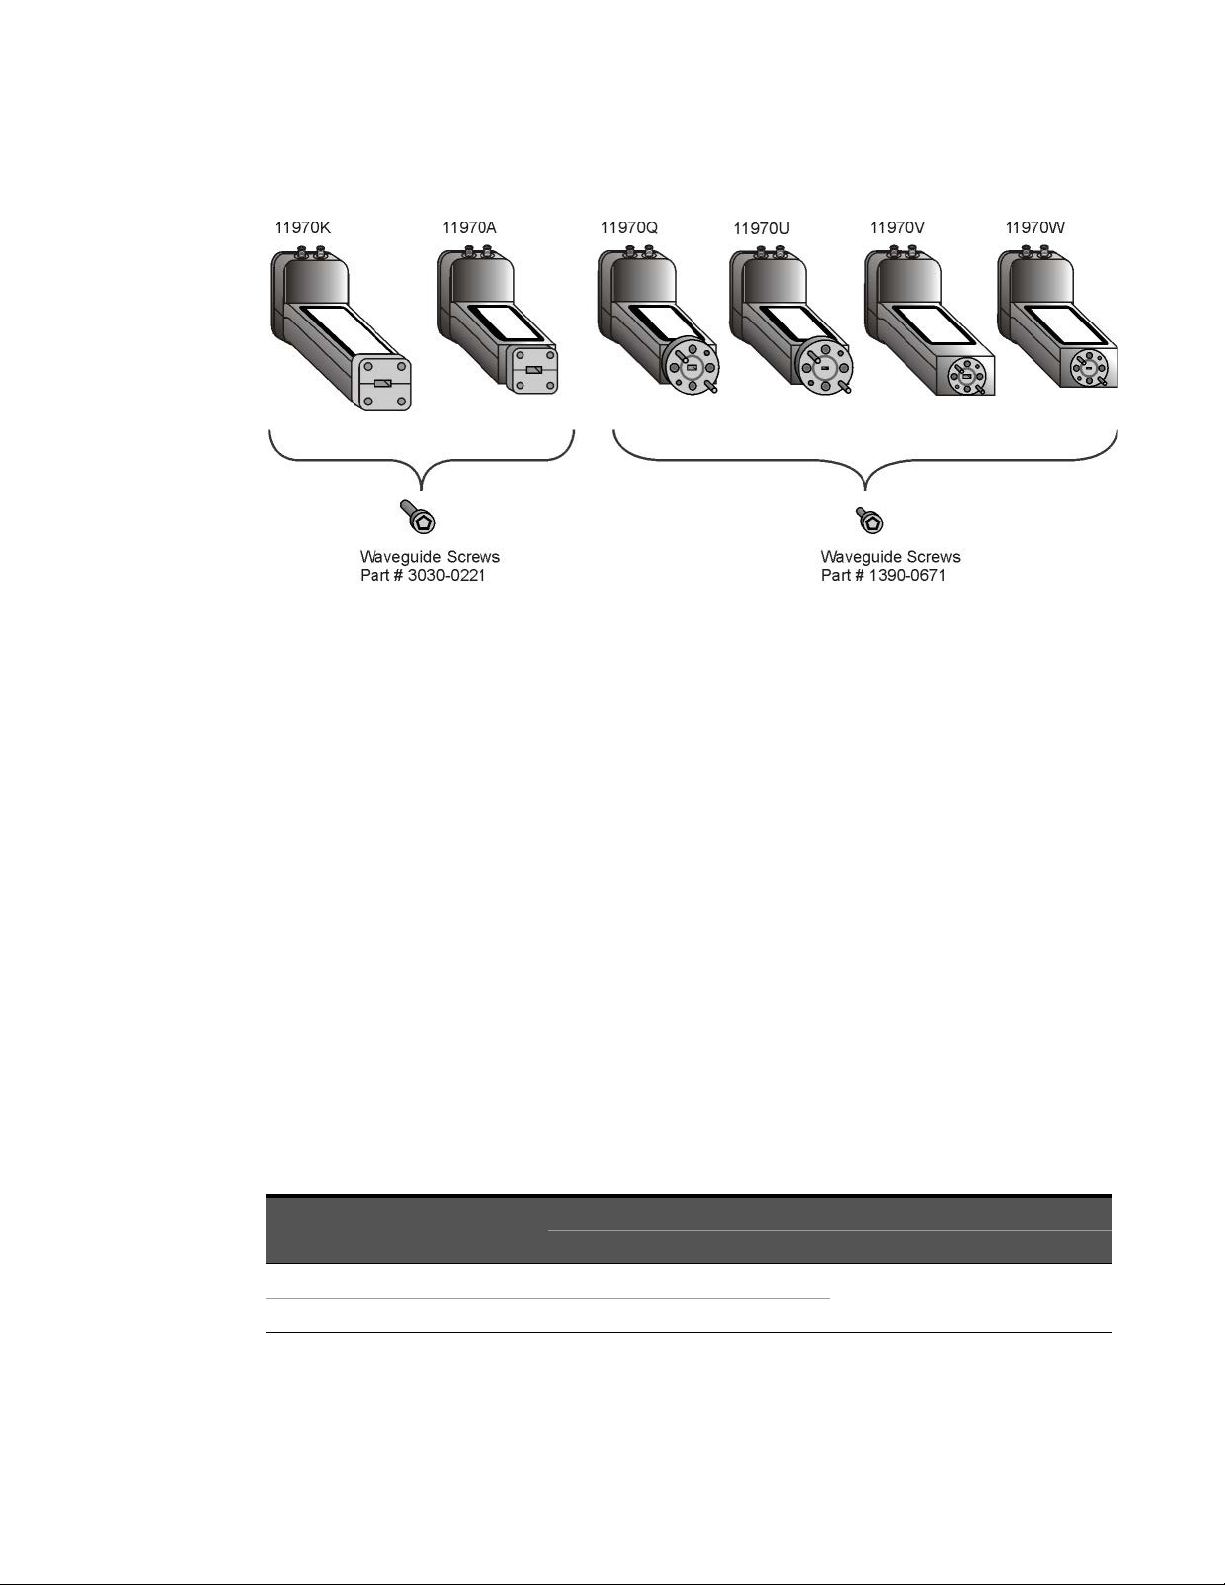
employed for absolute amplitude measurements. Also supplied with each mixer are five screws
(four required) for attaching the mixer RF input flange to the waveguide.
Equipment supplied
Waveguide connector screws
Five hex-head screws are supplied with each mixer. Four are required to make the
mixer-to-waveguide connection, one is a spare. Use ONLY the screws supplied to attach the mixer
to the waveguide. Because of slight differences in the way the mixers couple with the waveguide,
the square-flange mixers (11970K and 11970A) and the round-flange mixer (11970Q, 11970U,
11970V and 11970W) require different screws.
If your mixer has a square waveguide flange, use four hex-head screws with Part Number
3030-0221. If it has a round waveguide flange, use four hex-head captive screws with Part Number
1390-0671. The special balldriver hex screwdriver available in the Option 009 Mixer Connector Kit
simplifies installation of the waveguide connector screws.
Mixers covered by manual
Serial numbers
Attached to your mixer is a label, which shows both the mixer model number and its serial number
(two parts). The first four digits and the letter of the serial number are the serial number prefix; the
last five digits are the suffix.
12 Keysight 11970 Series User’s Guide
Page 13
11970 Series harmonic mixers
Figure 1-1 11970 Series harmonic mixers
General Information 1
Options
Option 009, shown in Figure 1-2, is a Mixer Connection Kit. It includes three low-loss SMA cables
(Part Number 11970-60013), one hex-head balldriver (Part Number 8710-0523) for tightening the
waveguide connector screws, and one 5/16-inch open-end wrench (Part Number 8710-0510) for
use on the SMA connectors.
Spectrum analyzer retrofit requirements
– N9010A, N9030A, or N9040B signal analyzers
– A diplexer is required since the N9030A has a single SMA external mixer port, and the 11970
Series mixers have separate LO and IF ports. The recommended diplexer can be purchased from
Keysight as p/n N9029AE13 or from OML Inc. as p/n DPL.313B.
– Requires Option EXM
– USB storage device (>2GB free memory)
– Does not support the 11970K (LO range limitation).
To retrofit Option EXM on N9030A:
Table 1-1 Option EXM on N9030A
N9030A frequency Option
550, 544, or 543 N9030AK-EXM
503, 508, 513, or 526 N9030AK-HL6
Serial number prefix
<MY/US/SG5138 <MY/US/SG5138
N9030AK-EXM
– Software revision must be A.08.01 or later
Keysight 11970 Series User’s Guide 13
Page 14

1 General Information
NOTE
To retrofit Option EXM on N9010A:
Tab le 1-2 Option EXM on N9010A
N9010A frequency Option Upgrade kit
532 or 544 N9010AK-EXM
503, 507, 513, or 526 N/A
– Software revision must be A.10.52 or later
All N9040B signal analyzers contain Option EXM.
Software revision must be A.15.05 or later.
– PSA Series E4440A, E4446A, and E4448A spectrum analyzers require Option AYZ (LO OUT and
IF IN connectors). The E4443A and E4445A do not support external mixing.
– 856x Series portable spectrum analyzers with Options 002 (tracking generator) and 327 (no IF
IN on front panel) do not have external mixing capability.
– 856x Series Portable Spectrum Analyzers require Option 008, or FW date code. 920528, for
signal identification functionality.
– Keysight E4407B spectrum analyzers require Option AYZ (LO Out and IF IN connections).
– MMS analyzers using 11970 Series mixers must have a front end model 70907A, 70907B,
70909A, or 70910A, as well as a 70900A/B with firmware new enough for those modules:
Model
70907A
70907B
70909A
70910A
FW date code (or newer)
– 860203
– 900314
– 910802
– 910802
– The 11970 Series Mixers are fully compatible with all 8566B Spectrum Analyzers.
14 Keysight 11970 Series User’s Guide
Page 15

General Information 1
LOW-LOSS SMA CABLE
PART NUMBER 11970-60013
5/16-INCH OPEN-END WRENCH
PART NUMBER 8710-0510
BALL DRIVER PART NUMBER
8710-0523
Figure 1-2 Mixer connection kit, Option 009
Keysight 11970 Series User’s Guide 15
Page 16

1 General Information
NOTE
NOTE
Specifications
Specifications for the 11970 Series mixers are listed in Table 1-3 on page 16 through Tab le 1-9 on
page 22.
Supplemental information is included only as additional information; they are not specifications.
Nominal values indicate expected performance or describe product performance that is not
covered by the product warranty.
Environmental limitations
The 11970 Series mixers meet or exceed the environmental requirements of MIL-T-28800C,
Type III, Class 3, Style C. Specific environmental qualifications for the mixers are as follows:
Temperature, non-operating: -40°C to 75°C
Temperature, operating: 0°C to 55°C
Relative humidity: 95 ± 5% (up to 30°C)
Altitude, non-operating: Less than 12,195 meters (40,000 ft.)
Altitude, operating: Less than 3,048 meters (10,000 ft.)
Maximum vibration levels: 2 G's at 5 to 2000 Hz
Maximum shock: 30 G's
Unless otherwise stated, all specifications apply for an IF range of 300 to 322.5 MHz as required
by the various spectrum analyzers covered in this user’s guide. Also, the specifications only apply
with RF input levels of less than -20 dBm.
Tab le 1-3 11970 Series specifications
Description Specifications Supplemental information
LO amplitude range 14 to 18 dBm
Bias requirements None
Maximum CW RF input level 20 dBm (100 mW)
Maximum peak pulse power
3 dB bandwid th DC to 1.3 GHz
Environmental Meets MIL-T-28800C, Type III, Class 3, Style C
IF/LO connectors SMA female
11970-60013 Cable Insertion Loss
24 dBm with <1msec pulse
(average power: +20 dBm)
Max. 1.5 dB at 2 to 6 GHz
Typical 0.23 dB at 322.5 or 321.4 MHz
16 Keysight 11970 Series User’s Guide
Page 17

General Information 1
Table 1-4 11970K specifications
Description Specifications Supplemental information
RF frequency range 18 to 26.5 GHz
LO harmonic number 6
Odd order mixing product suppression >20 dB (nominal)
LO input frequency range 2.95 to 4.36 GHz
Gain compression level (<1 dB) –3 dBm (nominal)
Maximum conversion loss 24 dB
Calibration accuracy
[a]
The 11970K is not supported by the N9030A
(PXA)
±2.0 dB with LO amplitude range of 14.5 to
16.0 dBm (nominal)
±3.0 dB with LO amplitude range of 16 to
18.0 dBm (nominal)
Spectrum analyzer absolute amplitude
accuracy (using conversion loss data
with 14.5 to 16.0 dBm LO)
Frequency response (with LO input
power 14.5 to 16.0 dBm)
Frequency response (with LO input
power 14.0 to 18.0 dBm)
±1.9 dB
±2.8 dB
±3.2 dB + frequency response of the mixer
(nominal)
Displayed average noise level
RBW = 1 kHz RBW
Sample detector
–105 dBm (nominal)
Conversion loss corrections on LO power
14.5 to 16 dBm
Input SWR <2.2:1 (nominal)
[a] Calibration accuracy is defined as the difference between the actual mixer conversion loss and the calibration values provided with the
mixer.
Keysight 11970 Series User’s Guide 17
Page 18

1 General Information
Tab le 1-5 11970A specifications
Description Specifications Supplemental information
RF frequency range 26.5 to 40 GHz
LO harmonic number 8
Odd order mixing product suppression >20 dB (nominal)
LO input frequency range
Gain compression level (<1 dB) -5 dBm (nominal)
Maximum conversion loss 26 dB
Calibration accuracy
[a]
3.27 to 4.96 GHz
±2.0 dB with LO amplitude range of 14.5 to
[b]
16.0 dBm (nominal)
±3.0 dB with LO amplitude range of 16 to
18.0 dBm (nominal)
Spectrum analyzer absolute amplitude
accuracy (using conversion loss data
with 14.5 to 16.0 dBm LO)
Frequency response (with LO input
power 14.5 to 16.0 dBm)
Frequency response (with LO input
power 14.0 to 18.0 dBm)
Displayed average noise level
RBW = 1 kHz RBW
Sample detector
Conversion loss corrections on LO power
14.5 to 16 dBm
±1.9 dB
±2.8 dB
±3.2 dB + frequency response of the mixer
(nominal)
-102 dBm (nominal)
For N9030A:
26.5 to 30.45 GHz: –110 dBm (nominal)
>30.45 to 40 GHz: –108 dBm (nominal)
Input SWR <2.2:1 (nominal)
[a] When used with the N9030A, harmonic 6 and harmonic 8 used are dependent on the start and stop frequencies. Harmonic 6 is used from
26.5 to 30.45 GHz and harmonic 8 is used above 30.45 GHz.
[b] Calibration accuracy is defined as the difference between the actual mixer conversion loss and the calibration values provided with the
mixer.
18 Keysight 11970 Series User’s Guide
Page 19

General Information 1
Table 1-6 11970Q specifications
Description Specifications Supplemental information
RF frequency range 33 to 50 GHz
LO harmonic number 10
Odd order mixing product suppression >20 dB (nominal)
LO input frequency range
[a]
Gain compression level (<1 dB) -7 dBm (nominal)
Maximum conversion loss 28 dB
Calibration accuracy
[b]
3.27 to 4.96 GHz
±2.0 dB with LO amplitude range of 14.5 to
16.0 dBm (nominal)
±3.0 dB with LO amplitude range of 16 to
18.0 dBm (nominal)
Spectrum analyzer absolute amplitude
accuracy (using conversion loss data
with 14.5 to 16.0 dBm LO)
Frequency response (with LO input
power 14.5 to 16.0 dBm)
Frequency response (with LO input
power 14.0 to 18.0 dBm)
Displayed average noise level
RBW = 1 kHz RBW
Sample detector
Conversion loss corrections on LO power
14.5 to 16 dBm
±1.9 dB
±2.8 dB
±3.2 dB + frequency response of the mixer
(nominal)
-101 dBm (nominal)
For N9030A:
33 to 40 GHz: –108 dBm (nominal)
>40 to 50 GHz: –106 dBm (nominal)
Input SWR <2.2:1 (nominal)
[a] When used with the N9030A, harmonic 8 and harmonic 10 used are dependent on the start and stop frequencies. Harmonic 8 is used from
33 to 40 GHz and harmonic 10 is used above 40 GHz.
[b] Calibration accuracy is defined as the difference between the actual mixer conversion loss and the calibration values provided with the
mixer.
Keysight 11970 Series User’s Guide 19
Page 20

1 General Information
Tab le 1-7 11970U specifications
Description Specifications Supplemental information
RF frequency range 40 to 60 GHz
LO harmonic number 10
Odd order mixing product suppression >20 dB (nominal)
LO input frequency range 3.97 to 5.97 GHz
Gain compression level (<1 dB) -7 dBm (nominal)
Maximum conversion loss 28 dB
Calibration accuracy
±2.0 dB with LO amplitude range of 14.5 to
[a]
16.0 dBm (nominal)
±3.0 dB with LO amplitude range of 16 to
18.0 dBm (nominal)
Spectrum analyzer absolute amplitude
accuracy (using conversion loss data
with 14.5 to 16.0 dBm LO)
Frequency response (with LO input
power 14.5 to 16.0 dBm)
Frequency response (with LO input
power 14.0 to 18.0 dBm)
±1.9 dB
±2.8 dB
±3.2 dB + frequency response of the mixer
(nominal)
Displayed average noise level
RBW = 1 kHz RBW
Sample detector
Conversion loss corrections on LO power
-101 dBm (nominal)
For N9030A:
40 to 60 GHz: –106 dBm (nominal)
14.5 to 16 dBm
Input SWR <2.2:1 (nominal)
[a] Calibration accuracy is defined as the difference between the actual mixer conversion loss and the calibration values provided with the
mixer.
20 Keysight 11970 Series User’s Guide
Page 21

General Information 1
Table 1-8 11970V specifications
Description Specifications Supplemental information
RF frequency range 50 to 75 GHz
LO harmonic number
[a]
Odd order mixing product suppression >15 dB (nominal)
LO input frequency range 3.55 to 5.33 GHz
Gain compression level (<1 dB) -3 dBm (nominal)
Maximum conversion loss 40 dB
Calibration accuracy
[b]
14
±2.2 dB with LO amplitude range of 14.5 to
16.0 dBm (nominal)
±3.2 dB with LO amplitude range of 16 to
18.0 dBm (nominal)
Spectrum analyzer absolute amplitude
accuracy (using conversion loss data
with 14.5 to 16.0 dBm LO)
Frequency response (with LO input
power 14.5 to 16.0 dBm)
Frequency response (with LO input
power 14.0 to 18.0 dBm)
Displayed noise level
RBW = 1 kHz RBW
Sample detector
Conversion loss corrections on LO power
14.5 to 16 dBm
±2.1 dB
±2.8 dB
±3.4 dB + frequency response of the mixer
(nominal)
–92 dBm (nominal)
For N9030A:
50 to 66 GHz: –96 dBm (nominal)
>66to 75 GHz: –94 dBm (nominal)
Input SWR <2.6:1 (nominal)
[a] When used with the N9030A, harmonic 12 and harmonic 14 used are dependent on the start and stop frequencies. Harmonic 12 is used
from 50 to 66 GHz and harmonic 14 is used above 66 GHz.
[b] Calibration accuracy is defined as the difference between the actual mixer conversion loss and the calibration values provided with the
mixer.
Keysight 11970 Series User’s Guide 21
Page 22

1 General Information
Tab le 1-9 11970W specifications
Description Specifications Supplemental information
RF frequency range 75 to 110 GHz
LO harmonic number 18
Odd order mixing product suppression >15 dB (nominal)
LO input frequency range 4.15 to 6.09 GHz
Gain compression level (<1 dB) -1 dBm (nominal)
Maximum conversion loss 46 dB
Calibration accuracy
±2.2 dB with LO amplitude range of 14.5 to
[a]
16.0 dBm (nominal)
±3.2 dB with LO amplitude range of 16 to
18.0 dBm (nominal)
Spectrum analyzer absolute amplitude
accuracy (using conversion loss data
with 14.5 to 16.0 dBm LO)
Frequency response (with LO input
power 14.5 to 16.0 dBm)
Frequency response (with LO input
power 14.0 to 18.0 dBm)
±3.0 dB
±4.0 dB
±3.4 dB + frequency response of the mixer
(nominal)
Displayed noise level
RBW = 1 kHz RBW
Sample detector
Conversion loss corrections on LO power
-85 dBm (nominal)
For N9030A:
75 to 110 GHz: -88 dBm (nominal)
14.5 to 16 dBm
Input SWR <2.6:1 (nominal)
[a] Calibration accuracy is defined as the difference between the actual mixer conversion loss and the calibration values provided with the
mixer.
22 Keysight 11970 Series User’s Guide
Page 23
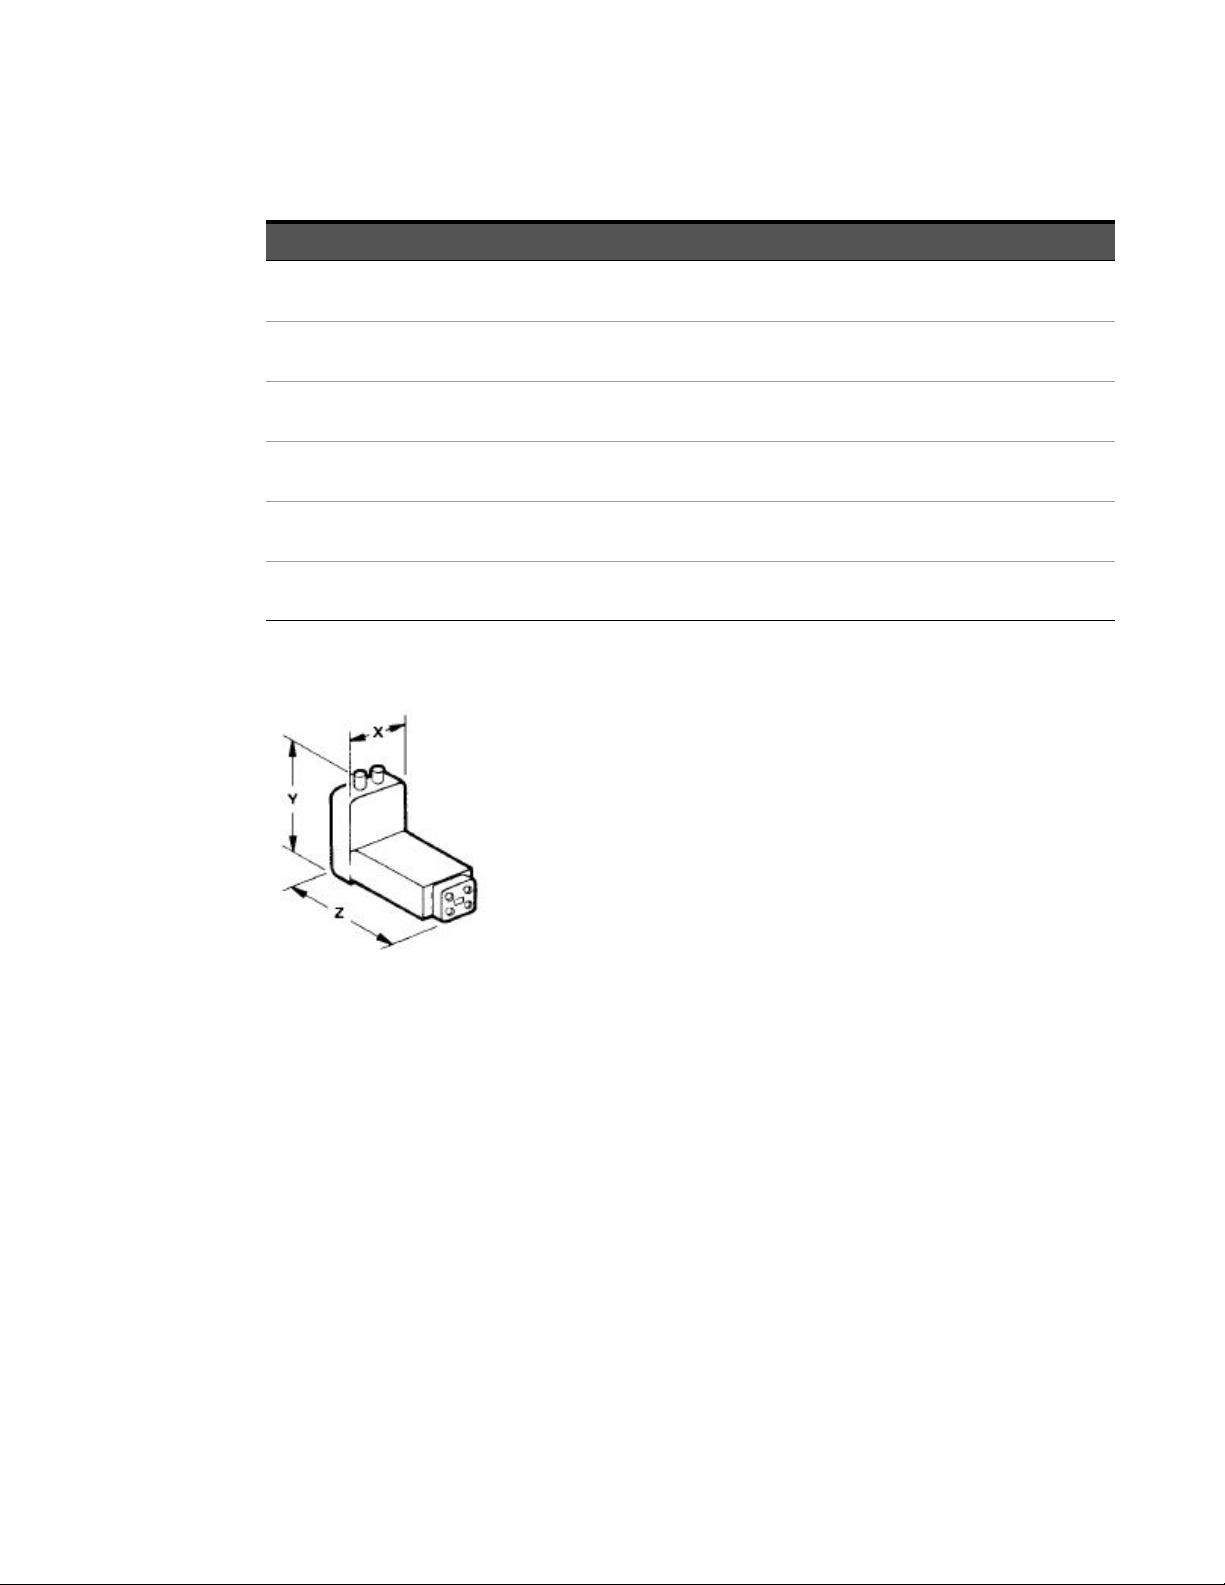
Table 1-10 Physical characteristics
General Information 1
Model
11970K
11970A
11970Q
11970U
11970V
11970W
[a] Waveguide attachment screws enter blind holes in the flanges of the mixers.
[a]
Flange
UG-595/U
WR-42
UG-599/U
WR-28
UG-383/U
WR-22
UG-383/U-M
WR-19
UG-385/U
WR-15
UG-387/U-M
WR-10
Weight X Y Z
0.17 kg
0.36 lb
0.14 kg
0.32 lb
0.14 kg
0.32 lb
0.14 kg
0.32 lb
0.14 kg
0.32 lb
0.14 kg
0.32 lb
36 mm
1.4 in
36 mm
1.4 in
36 mm
1.4 in
36 mm
1.4 in
36 mm
1.4 in
36 mm
1.4 in
51 mm
2.0 in
51 mm
2.0 in
51 mm
2.0 in
51 mm
2.0 in
51 mm
2.0 in
51 mm
2.0 in
90 mm
3.5 in
71 mm
2.8 in
76 mm
3.0 in
76 mm
3.0 in
76 mm
3.0 in
76 mm
3.0 in
Figure 1-3 Dimensions
Keysight 11970 Series User’s Guide 23
Page 24

1 General Information
THIS PAGE HAS BEEN INTENTIONALLY LEFT BLANK.
24 Keysight 11970 Series User’s Guide
Page 25

Keysight 11970 Series Harmonic Mixers
User’s Guide
2 Operation
Introduction 26
Getting Started 27
Using the Mixers with the E4407B Spectrum Analyzer (Option AYZ) 28
Using the Mixers with the E4440A, E4446A, or E4448A PSA Series Spectrum Analyzer (Option
AYZ) 32
Using the 11970A, Q, U, V, and W Mixers with the N9030A and N9010A X- Series Signal
Analyzers (Option EXM) 36
Using the 11970A, Q, U, V, and W Mixers with the N9040B X- Series Signal Analyzer (Option
EXM) 41
Using the Mixers with the 856X Series Spectrum Analyzers 48
Using the Mixers with MMS Analyzers 55
Using the Mixers with the 8566B Spectrum Analyzer 62
This chapter provides information on how to make effective use of the 11970 mixers.
25
Page 26

2Operation
WARNING
Introduction
This section provides information on how to make effective use of the 11970 mixers.
Operating precautions
Refer to the sections below for specific parameters to follow prior to mixer operation.
Do not exceed the maximum ratings listed below or permanent damage to the mixer will
result.
RF input power
Use the following parameters:
CW: No greater than 20 dBm. See Gain Compression values for each model number. Use an
appropriate waveguide attenuator if the output power of the unit under test exceeds the gain
compression value.
Pulse: No greater than 24 dBm at < 1 msec pulse width
Average: No greater than 20 dBm
LO input power
Make sure the LO input power is no greater than 20 dBm.
Electrostatic discharge
When installing the mixer, you must always connect the SMA cables to the spectrum analyzer
BEFORE connecting them to the mixer. This will minimize the danger of an electrostatic discharge
damaging the mixer diodes.
Waveguide protective foam
Do not remove, displace, or damage the white, non-conductive foam installed in the open end of
the waveguide. The foam keeps small objects from entering the waveguide.
Avoiding mechanical damage
Leave the waveguide flange cap on whenever the mixer is not connected to a device under test.
This protects the flange mating surface from scratches, which can degrade the mixer's
performance.
26 Keysight 11970 Series User’s Guide
Page 27

Getting Started
NOTE
The 11970 series of millimeter wave mixers have no bias or back-short adjustments. 11970 Mixers
require an LO power of 14 to 18 dBm at the LO input.
Mixer connections
This chapter contains connection and operation information listed by Spectrum Analyzer model
number.
If you are using an 11970Q, 11970U, 11970V or 11970W Mixer, and the shoulder of its waveguide
flange is not properly aligned with the flange of the device under test, amplitude measurement
errors can result. To ensure proper alignment, tighten each of the four flange screws in turn by
small amounts, moving clockwise around the flange.
11970K and 11970A mixers require flange screws that are different from those used with the
11970Q, 11970U, 11970V and 11970W; 11970K and 11970A use Part Number 3030-0221 (#4-40
hex head screw). 11970Q, 11970U, 11970V and 11970W use Part Number 1390-0671 (#4-40 hex
head captive screw).
Operation 2
Keysight 11970 Series User’s Guide 27
Page 28
2Operation
NOTE
Using the Mixers with the E4407B Spectrum Analyzer (Option AYZ)
The Keysight Technologies E4407B spectrum analyzer contains an extensive menu of functions
that help with millimeter measurements. The following examples explain how to connect external
mixers to the spectrum analyzer, choose the band of interest, store and activate conversion-loss
factors, and how to use the signal-identification functions.
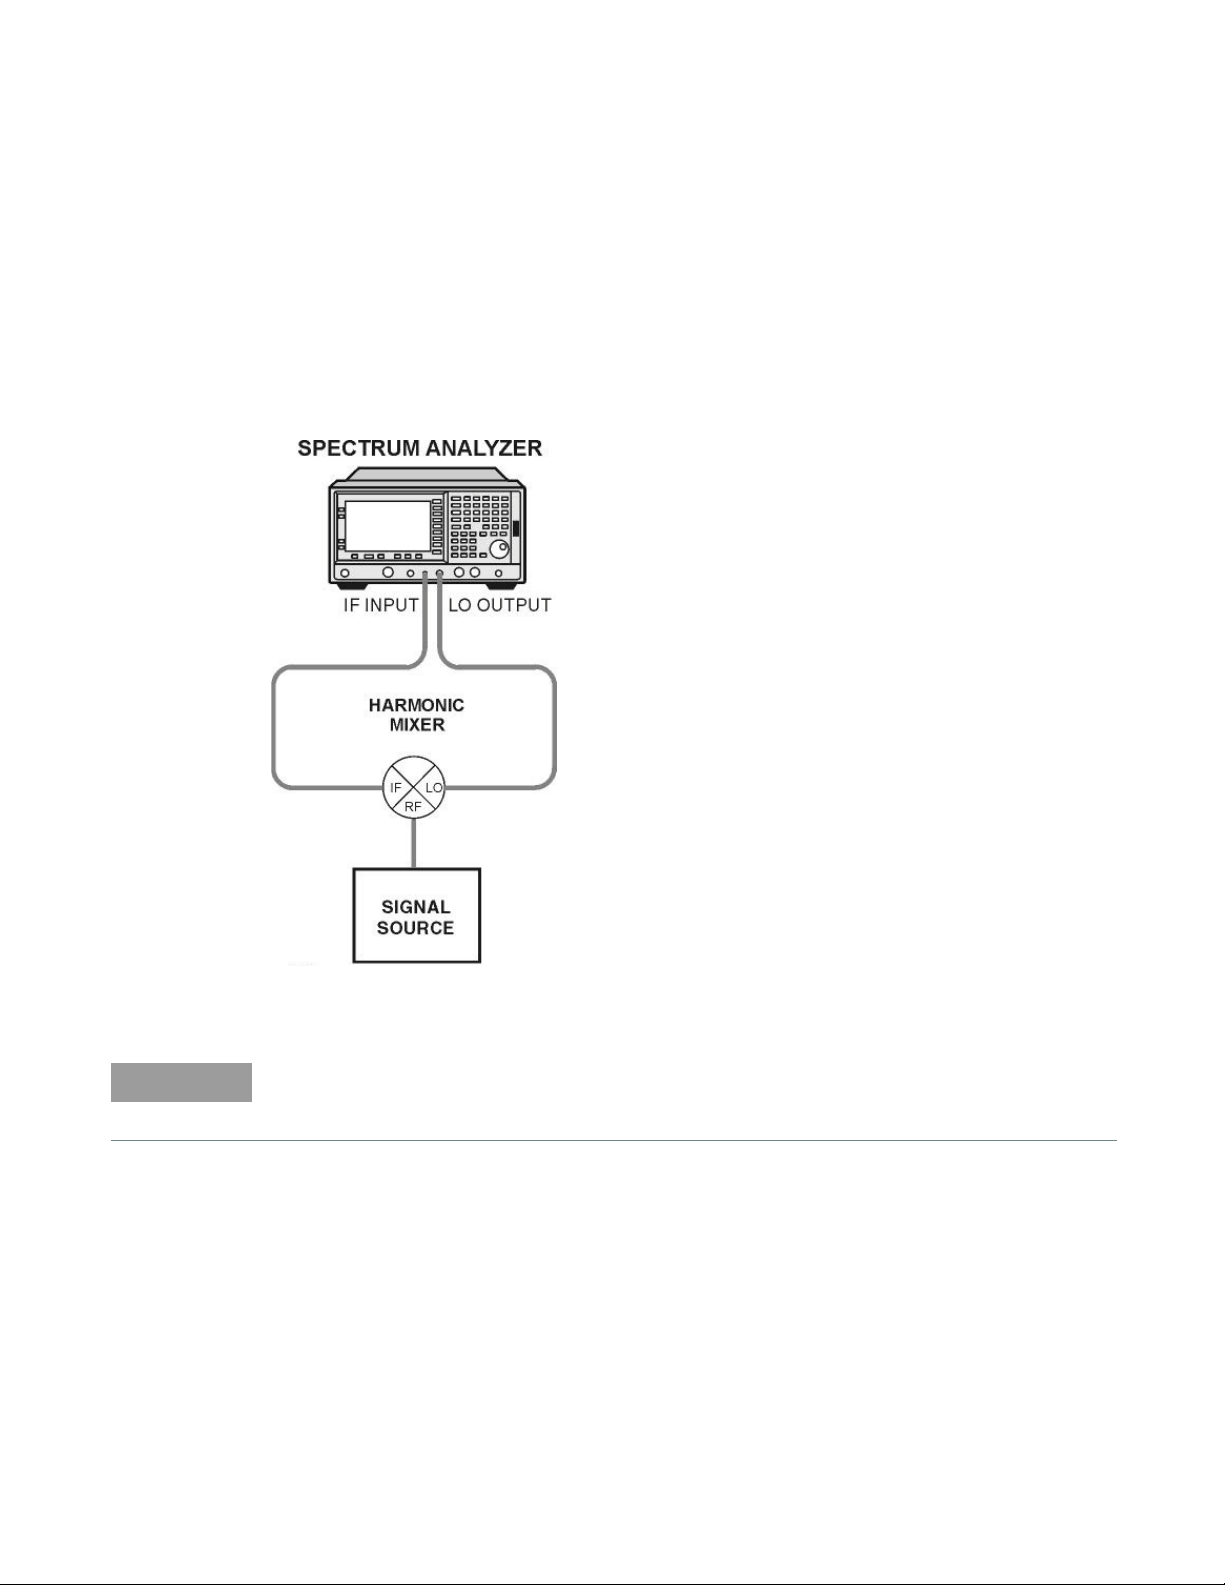
Set up the equipment
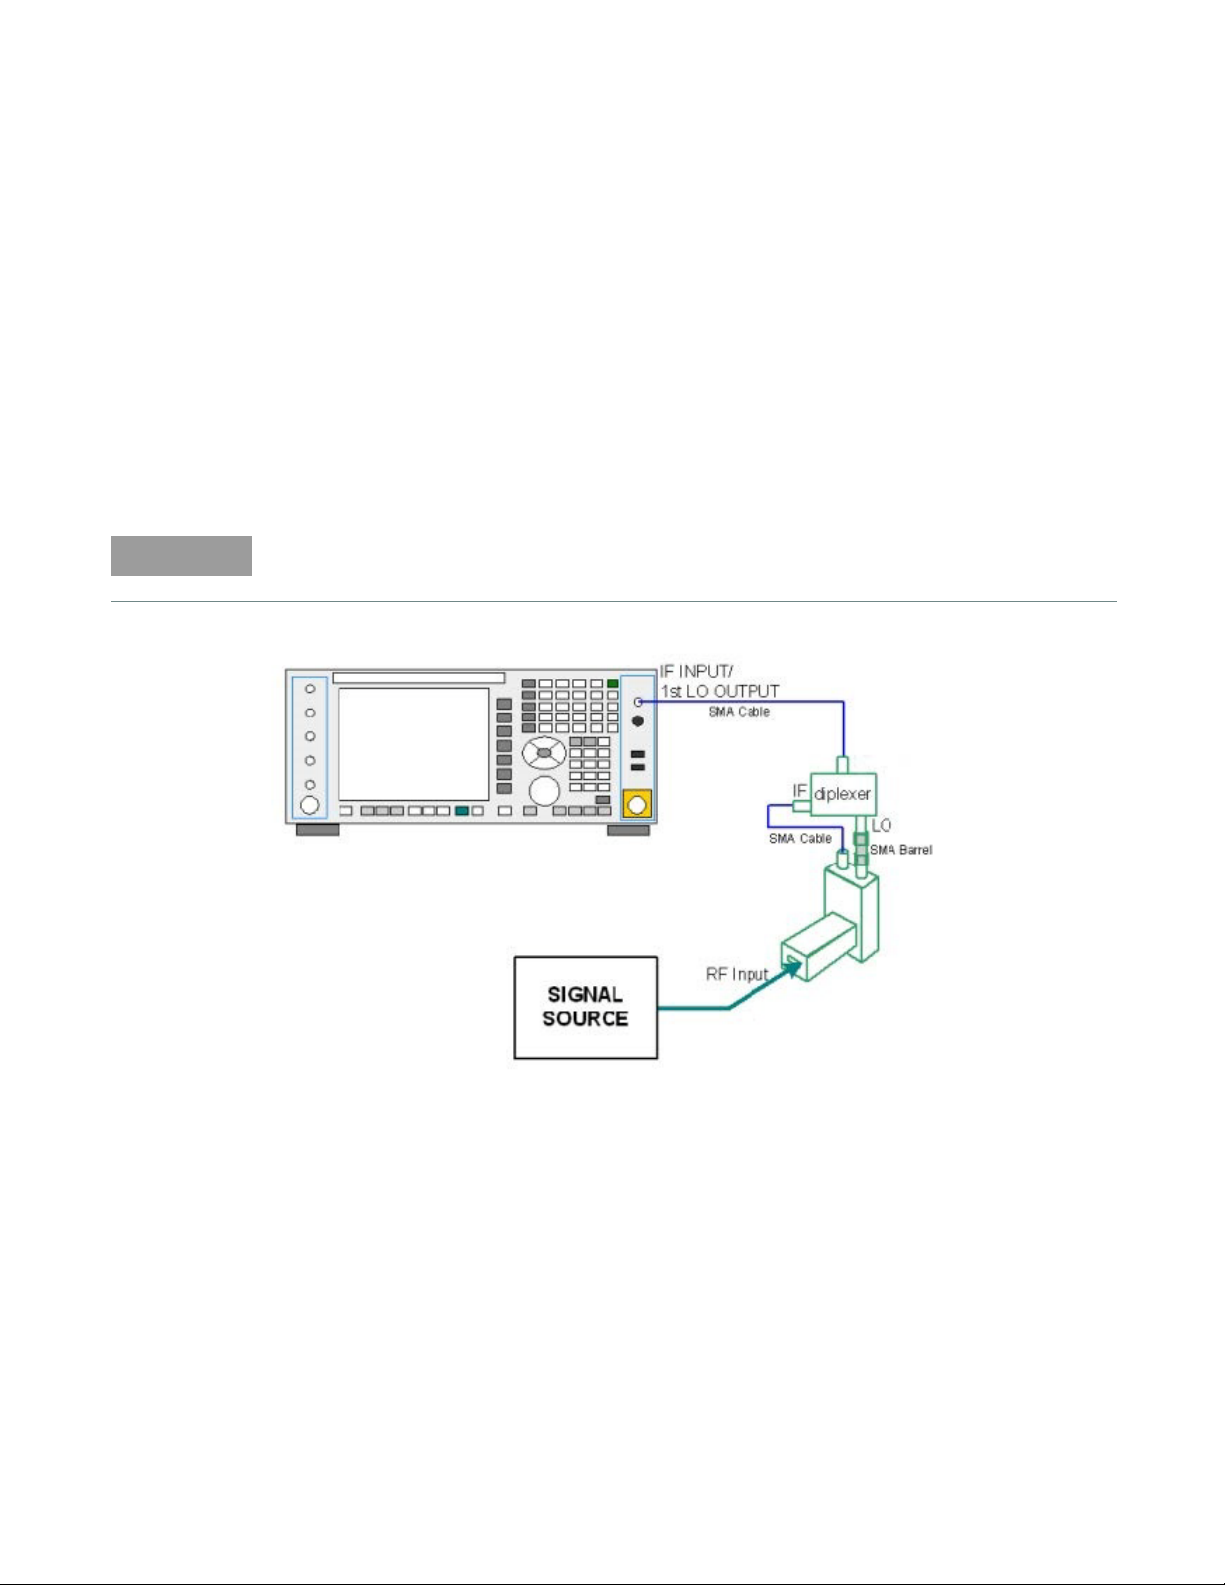
1 Connect the signal source and harmonic mixer to the analyzer, as shown in Figure 2-1.
Figure 2-1 Harmonic mixer setup (E4407B)
Keysight 11970-60013 SMA type cables should be used to connect the mixer IF and LO ports to
the analyzer. Do not over-tighten the cables. The maximum torque should not exceed 112 N-cm
(10 in-lb.)
2 On the analyzer, press Preset, Factory Preset, if present.
3 Select external mixing by pressing Input/Output, Input Mixer, Input Mixer (Ext).
4 The analyzer frequency band will be set to 26.5 - 40 GHz (A). To choose a different band, press
Ext Mix Band, then press the desired band frequency range/letter key. For this example, we will
use band A, which ranges from 36.5 GHz to 40 GHz.
28 Keysight 11970 Series User’s Guide
Page 29

Operation 2
NOTE
Amplitude calibration
The conversion loss versus frequency data can be entered on your analyzer from one of three
sources.
–From a Conversion Loss Data Disk, supplied with your mixer.
– Data from the calibration sheet supplied with your mixer. The 11970A, Q, and V band mixers
calibrated after May 2011 have two calibration sheets. Use the sheet that contains the text "Not
for use with the Keysight X-Series Signal Analyzers’. An example of the calibration sheet is
shown in Figure 2-24.
– From conversion-loss data located on the mixer body label.
Using a conversion-loss data disk
The conversion-loss data for your mixer can be quickly loaded in the memory of an ESA or PSA
series analyzer from a floppy disk. The following process works with the floppy disk provided by the
factory with your new mixer, or with one that you have stored the correction data. This process
eliminates the time consuming and sometimes error-prone process of manually entering the data
from a table.
Loading data
1 Insert the conversion-loss data disk (from the factory or your own) into the floppy drive of the
analyzer.
2 Press File, then Load.
3 Press Type, More, then select Corrections.
4 Press Directory Select, highlight drive -A-, then press Directory Select again.
5 Use the down arrow to select the file. The factory supplied disk has a file with the OTH
extension which places the data in the corrections set “other” location.
6 Press Load Now to load the conversion loss values into the correction table of the analyzer.
Viewing data
1 Press Amplitude, More, Corrections, Other (ON) and Edit to view the correction values.
2 Use the front-panel knob or up/down arrows to scroll through the list of correction values.
Manually entering conversion-loss data
1 The analyzer frequency band will be set to 26.5 – 40 GHz (A). To choose a different band, press
Ext Mix Band and then press the desired band frequency range/letter key. For this example, we
will use band A, which ranges from 26.5 GHz to 40 GHz.
To correct for the conversion-loss of the harmonic mixer in use, the analyzer amplitude correction
feature is used.
2 Press AMPLITUDE Y Scale, More, Corrections. Select a correction set for use with external
mixing. The recommended set to use is Other although any available set could be used.
3 Press Edit to enter the appropriate conversion loss data for the mixer in use. These values are
listed on the mixer, or a calibration sheet that is supplied with the mixer.
Keysight 11970 Series User’s Guide 29
Page 30

2Operation
NOTE
More correction points entered across the band in use will improve frequency response accuracy.
Up to 200 points may be defined for each set.
4 Once the desired correction points are entered, press Return, Correction (On) to activate
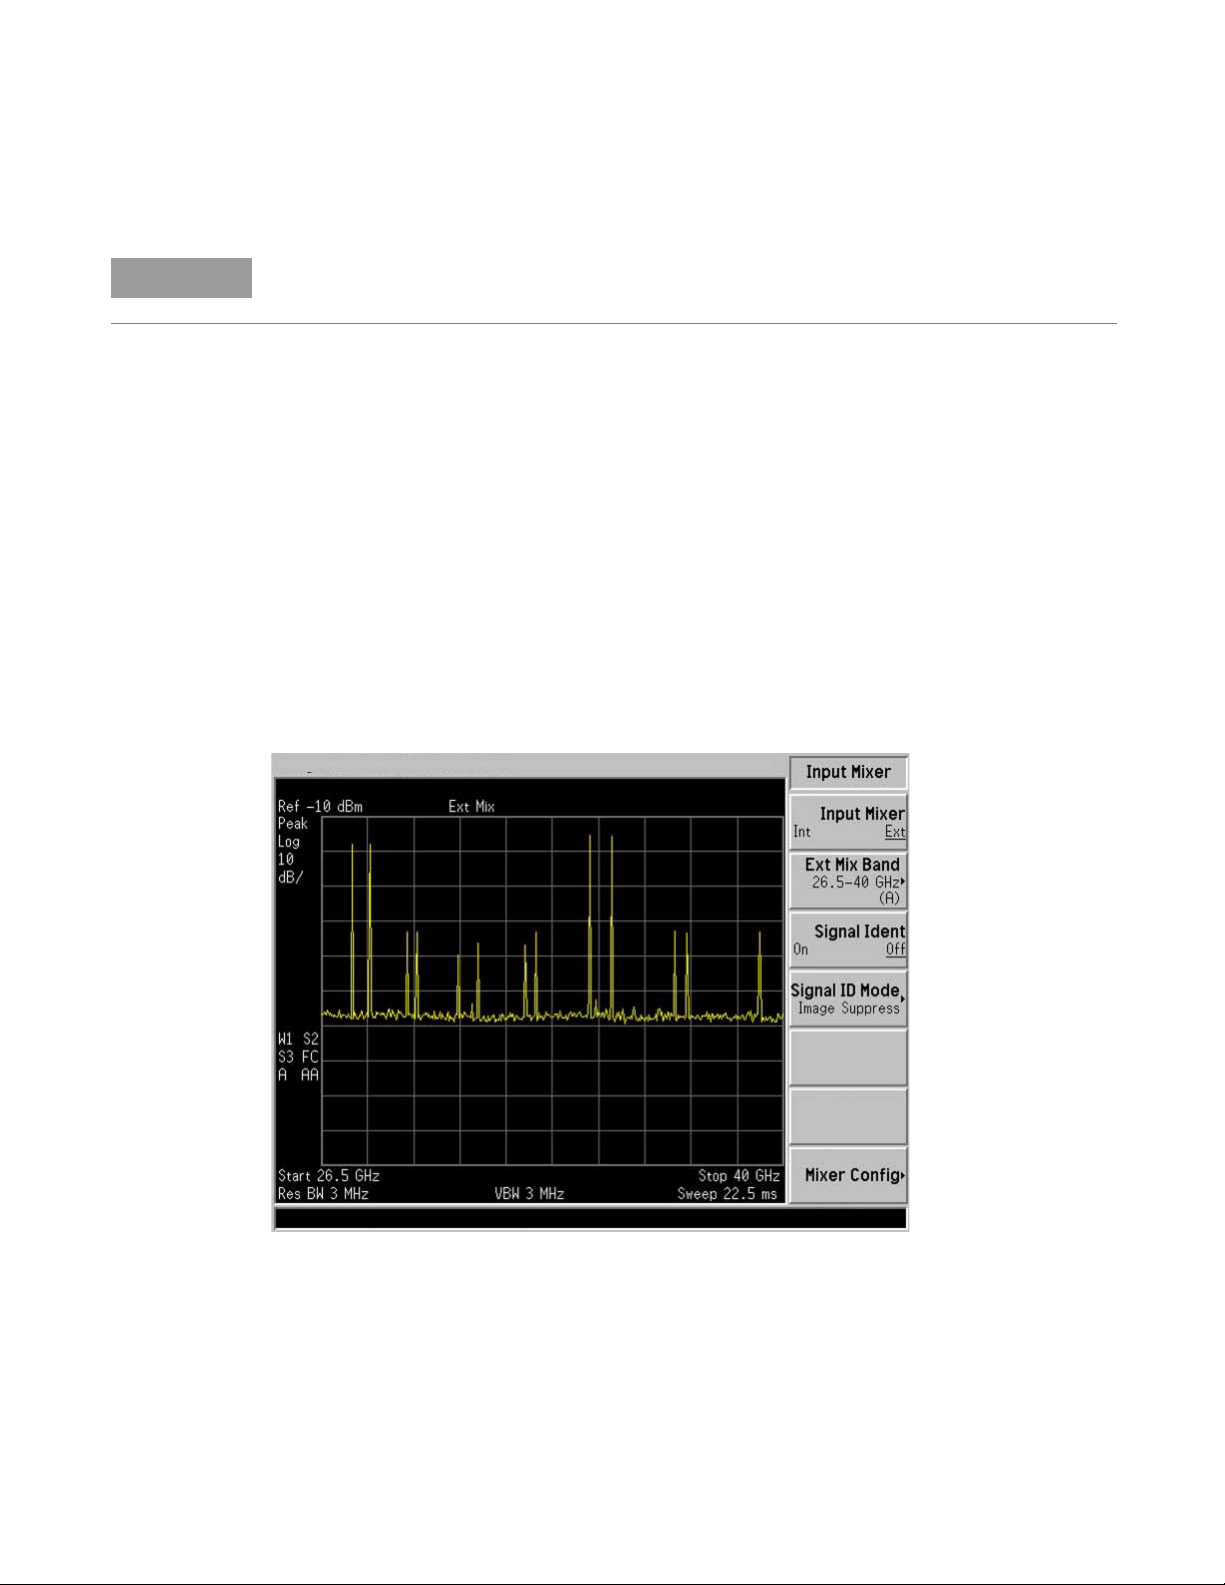
Signal identification
The IF output of a harmonic mixer will contain a signal at the intermediate frequency of the
analyzer whenever the harmonic frequency of the LO and the frequency of the RF differ by the
intermediate frequency.
As a result, within a single harmonic band, a single input signal can produce multiple responses on
the analyzer display, only one of which is valid (see Figure 2-2). These responses come in pairs,
where members of the valid response pair are separated by 642.8 MHz and either the right-most
(for negative harmonics) or left-most (for positive harmonics) member of the pair is the correct
response.
correction set Other. This will also turn corrections on resulting in a calibrated display. It is
recommended that the correction set entered be saved on the internal memory or the floppy
drive for future reference. See the ESA User’s and Programmer’s Reference guide for
information on saving correction values.
Figure 2-2 Multiple signal responses (E4407B)
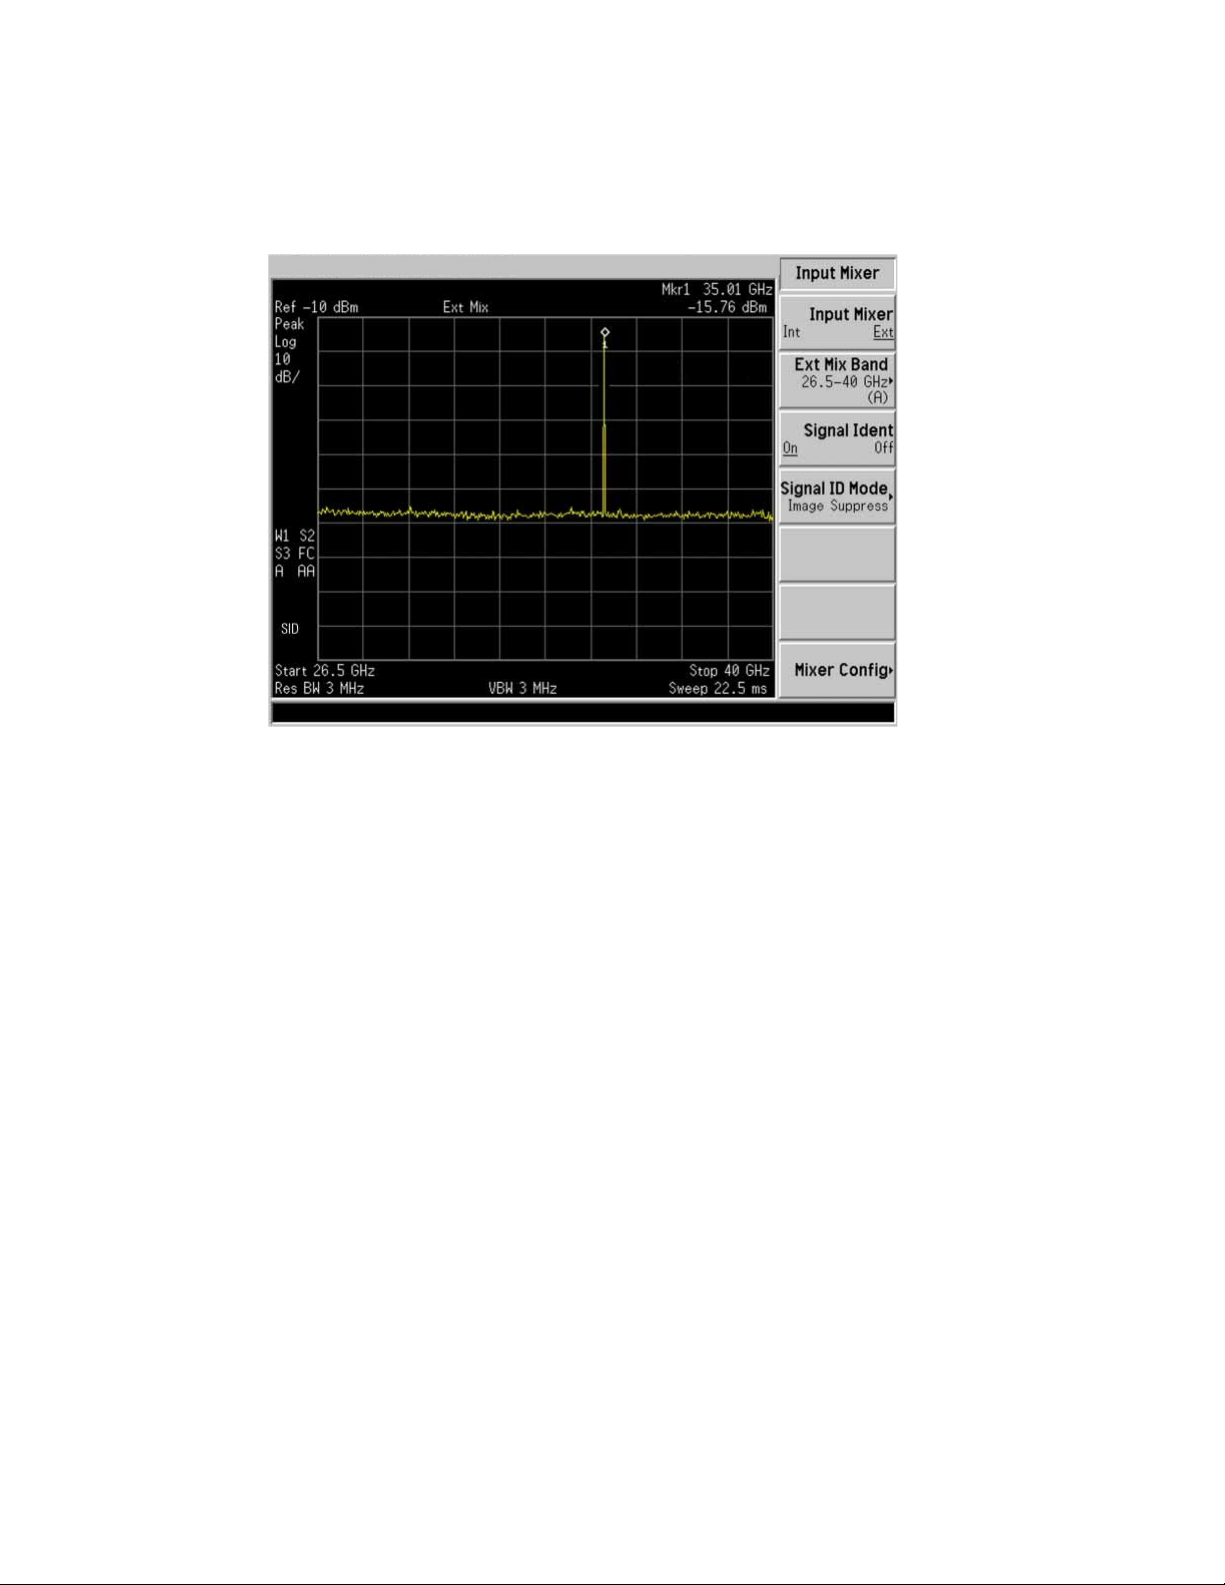
Identification of valid responses is achieved by simply turning on the signal-identification feature.
(instrument preset selects the Image Suppress signal identification mode.) Press Input/Output,
Input Mixer, Signal Ident (On) and note that now only the valid response (35 GHz) remains.
Press Peak Search to place a marker on the remaining response. The signal-identification routine
can introduce slight amplitude errors which is indicated by the message Signal Ident On, Amptd
Uncal. Refer to Figure 2-3.
30 Keysight 11970 Series User’s Guide
Page 31

Operation 2
After identifying a signal of interest, press Signal Ident (Off) before making final amplitude
measurements. Note that Image Suppress should only be used to identify the fundamental signal
and not for accurate amplitude measurements.
Figure 2-3 Valid signal responses (E4407B)
Keysight 11970 Series User’s Guide 31
Page 32

2Operation
Keysight 11970 SERIES
HARMONIC MIXER
NOTE
Using the Mixers with the E4440A, E4446A, or E4448A PSA Series Spectrum Analyzer (Option AYZ)
The Keysight Technologies PSA Series spectrum analyzers contain an extensive menu of functions
that help with millimeter measurements. Prior to starting this procedure, refer to “Spectrum
analyzer retrofit requirements” on page 13 for instrument requirements for the PSA Series
spectrum analyzers.
The following examples explain how to connect external mixers to the spectrum analyzer, choose
the band of interest, store and activate conversion-loss factors, and how to use the
signal-identification functions.
Set up the equipment
1 Connect the signal source and harmonic mixer to the analyzer, as shown in Figure 2-4.
Figure 2-4 Harmonic mixer setup (E4440A/ E4446A/ E4448A)
Keysight 11970-60013 SMA type cables should be used to connect the mixer IF and LO ports to
the analyzer. Do not over-tighten the cables. The maximum torque should not exceed 112 N-cm
(10 in-lb.).
2 On the analyzer, press Preset, Factory Preset, if present.
3 Select external mixing by pressing Input/Output, Input Mixer, Input Mixer (Ext).
4 The analyzer frequency band will be set to 26.5 - 40 GHz (A). To choose a different band, press
Ext Mix Band, then press the desired band frequency range/letter key. For this example, we will
use band A, which ranges from 36.5 GHz to 40 GHz.
32 Keysight 11970 Series User’s Guide
Page 33

Operation 2
NOTE
Amplitude calibration
The conversion loss versus frequency data can be entered on your analyzer from one of three
sources.
–From a Conversion Loss Data Disk, supplied with your mixer. See “Using a conversion-loss data
disk” on page 29.
– Data from the calibration sheet supplied with your mixer. The 11970A, Q, and V band mixers
calibrated after May 2011 have two calibration sheets. Use the sheet that contains the text ‘Not
for use with the Keysight X-Series Signal Analyzers’. An example of the calibration sheet is
shown in Figure 2-24.
– From conversion-loss data located on the mixer body label.
Using a conversion-loss data disk
The conversion-loss data for your mixer can be quickly loaded in the memory of an ESA or PSA
series analyzer from a floppy disk. The following process works with the floppy disk provided by the
factory with your new mixer, or with one that you have stored the correction data. This process
eliminates the time consuming and sometimes error-prone process of manually entering the data
from a table.
Loading data
1 Insert the conversion-loss data disk (from the factory or your own) into the floppy drive of the
analyzer.
2 Press File, then Load.
3 Press Type, More, then select Corrections.
4 Press Directory Select, highlight drive -A-, then press Directory Select again.
5 Use the down arrow to select the file. The factory supplied disk has a file with the OTH
extension which places the data in the corrections set “other” location.
6 Press Load Now to load the conversion loss values into the correction table of the analyzer.
Viewing data
1 Press Amplitude, More, Corrections, Other (ON) and Edit to view the correction values.
2 Use the front-panel knob or up/down arrows to scroll through the list of correction values.
Manually entering conversion-loss data
1 The analyzer frequency band will be set to 26.5 - 40 GHz (A). To choose a different band, press
Ext Mix Band and then press the desired band frequency range/letter key. For this example, we
will use band A, which ranges from 26.5 GHz to 40 GHz.
To correct for the conversion-loss of the harmonic mixer in use, the analyzer amplitude correction
feature is used.
2 Press AMPLITUDE Y Scale, More, Corrections. Select a correction set for use with external
mixing. The recommended set to use is Other although any available set could be used.
Keysight 11970 Series User’s Guide 33
Page 34
2Operation
NOTE
3 Press Edit to enter the appropriate conversion loss data for the mixer in use. These values are
More correction points entered across the band in use will improve frequency response accuracy.
Up to 200 points may be defined for each set.
4 Once the desired correction points are entered, press Return, Correction (On) to activate
Signal identification
The IF output of a harmonic mixer will contain a signal at the intermediate frequency of the
analyzer whenever the harmonic frequency of the LO and the frequency of the RF differ by the
intermediate frequency.
As a result, within a single harmonic band, a single input signal can produce multiple responses on
the analyzer display, only one of which is valid (see Figure 2-5). These responses come in pairs,
where members of the valid response pair are separated by 642.8 MHz and either the right-most
(for negative harmonics) or left-most (for positive harmonics) member of the pair is the correct
response.
listed on the mixer, or a calibration sheet that is supplied with the mixer.
correction set Other. This will also turn corrections on resulting in a calibrated display. It is
recommended that the correction set entered be saved on the internal memory or the floppy
drive for future reference. See the PSA User’s and Programmer’s Reference guide for
information on saving correction values.
Figure 2-5 Multiple signal responses (E4440A/ E4446A/ E4448A)
Identification of valid responses is achieved by simply turning on the signal-identification feature.
(instrument preset selects the Image Suppress signal identification mode.) Press Input/Output,
Input Mixer, Signal Ident (On) and note that now only the valid response (35 GHz) remains.
Press Peak Search to place a marker on the remaining response. Refer to Figure 2-6.
34 Keysight 11970 Series User’s Guide
Page 35
Operation 2
After identifying a signal of interest, press Signal Ident (Off) before making final amplitude
measurements. Note that Image Suppress should only be used to identify the fundamental signal
and not for accurate amplitude measurements.
Figure 2-6 Valid signal responses (E4440A/ E4446A/ E4448A)
Keysight 11970 Series User’s Guide 35
Page 36
2Operation
NOTE
Keysight 11970 SERIES
HARMONIC MIXER
Using the 11970A, Q, U, V, and W Mixers with the N9030A and N9010A X-Series Signal Analyzers (Option EXM)
Refer to “Spectrum analyzer retrofit requirements” on page 13 for configuration requirements.
The following examples explain how to connect the external mixers to the signal analyzer using a
diplexer, choose the band of interest, activate conversion loss correction data, and how to use the
signal-identification functions.
Set up the equipment
1 Connect the signal source, diplexer, and harmonic mixer to the signal analyzer as shown in
Figure 2-7.
The maximum torque for the SMA cables and adapters should not exceed 122 N-cm (10 in-lb.)
Figure 2-7 External mixer setup (N9030A/ N9010A)
2 On the analyzer press Mode, Spectrum Analyzer.
3 Select external mixing by pressing Input/Output, External Mixer, External Mixer, External
Mixer Setup.
4 The default is 11970A. To select Q, U, V or W bands, press Mixer Presets, Keysight 11970, then
select the appropriate key corresponding to 11970 frequency band.
5 Press Return twice to view the spectrum display.
6 Tune the analyzer to the input signal frequency by pressing FREQ Channel, and enter a center
frequency or a start and stop frequency.
36 Keysight 11970 Series User’s Guide
Page 37

7 Many responses may appear on screen. Turn on the Signal ID function to identify true signals
NOTE
from images and harmonics.
Press Input Output, External Mixer, Signal ID Mode, Image Suppress, Signal ID On.
See “Signal ID” on page 39 for more information.
Amplitude calibration
1 See Loading conversion loss data for the signal analyzer below. This will guide you through
entering the conversion loss data provided with the mixer, into a corrections file that can be
activated to provide amplitude corrected measurements.
2 To access corrections, press Input/ Output, More, Corrections, Select Correction.
3 Chose a correction from the list. Note that you used one of the Corrections numbered 1-6 when
you entered the conversion loss data into the instrument.
4 Press Correction On to apply the corrections to the measurement.
Assure only ONE correction file is turned on because it is possible to turn on multiple correction
files, and if some of the files share the same frequency points, the correction that results for those
shared frequency points will cause measurement errors. Therefore assure that only the correction
file required for the measurement is turned on, and turn off all other corrections.
Operation 2
Loading conversion loss data for the signal analyzer
The conversion loss data supplied with your mixer can be loaded into your signal analyzer from one
of two sources:
– By downloading the 70xxxxxx_X.csv file located on the CD ROM disk that is provided with your
mixer. The 70xxxxxx_X.csv file is transferred from the CD to a USB memory device, and then the
USB memory device inserted into the PXA, and the file transferred to one of the analyzer
corrections array locations. The USB memory device should be scanned for viruses before use.
– The mixer ships with a printed copy of the conversion loss data. Find the printed copy
conversion loss data that has the text "For Use with Keysight X-Series analyzers only". The
conversion loss data will need to be manually entered as frequency and amplitude pairs into the
analyzer corrections file. An example of calibration data is shown Figure 2-23.
The CD also contains 70xxxxxx_X.pdf files of the conversion loss data that can be printed, and
then manually entered into a Correction array location. You will need to enter the frequency and
amplitude pairs into the analyzer corrections file. An example of calibration data is shown
Figure 2-23.
Downloading the conversion loss .csv files to the analyzer corrections array
1 Install the CD ROM provided with the mixer, into a PC and view the contents of the CD.
2 Locate the 70xxxxxx_X.csv file.
Keysight 11970 Series User’s Guide 37
Page 38

2Operation
NOTE
For the 11970A, 11970Q and 11970V, this is the conversion loss file used for almost all
applications. However, for the mixer model numbers listed above, there are two other
70xxxxxx_.csv files on the CD that may be used in special cases.
– As an example, on the 11970Q mixers, the additional two files are 70Qxxxxxx_8.csv and
– The 70Qxxxxxx_10.csv file contains conversion loss data for the 10th harmonic only, and this
The reason you may want to use one of these special files is when making measurements that
span the normal 40 GHz, 8th to 10 harmonic mixing transition. The two files provide conversion
loss data that allow calibrated measurements when you need to measure slightly above or below
the normal transition frequency, and want the measurement to be made using a single harmonic.
70Qxxxxxx_10.csv. The 70Qxxxxxx_8.csv file contains conversion loss data for the 8th
harmonic only, and this data allows the 8th harmonic to be used to a slightly higher tuned
frequency than the normal 40 GHz transition from the 8th to the 10 harmonic. However, only a
portion of Q band can be covered by the 8th harmonic. See the 70Qxxxxxx_8.csv file for the
exact frequency coverage.
data allows the 10th harmonic to be used to a lower tuned frequency than the normal 40 GHz
transition from the 8th to the 10 harmonic. The conversion loss will be worse below 40 GHz
compared to using the normal 70Qxxxxx_X.csv file.
3 Copy the.csv file to a USB memory device.
4 Insert the USB memory stick into one of the USB ports on the signal analyzer.
5 It is recommended that you connect a mouse and keyboard to the signal analyzer.
6 Press Input/ Output, More, Corrections, Select Correction.
7 Choose a correction array from the list of Correction 1 through Correction 6. Correction 1 has a
provision to store antenna corrections, so if antenna corrections are required, reserve this array
for that use. If you want to see if anything is already stored in a particular correction, press
Correction, Edit. To delete a correction table, press Return, assure the Select Correction key
corresponds to the correction you want to delete, and press Delete Correction.
8 Once the correction array number is selected, press Recall, Data (import), Amplitude
Correction and chose one of the correction array numbers.
9 Press Open, use the pull down arrow in the "look in" box to navigate to the USB memory stick,
and locate the 70xxxxxx_X.csv file.
10 Select the 70xxxxxx_X.csv file and click Open. The conversion loss data will now load into the
specified corrections array. To view the contents of the corrections array in the conversion loss
table, press Input/ Output, More, Corrections, select the corrections array number, and press
Edit. Press Return to go back to the measurement screen.
Loading the .csv file automatically populates the Description and Comment fields found under the
Corrections, Properties key. To edit these fields, press Input/ Output, More, Corrections, Select
Correction, select the correction number, press Properties, Description or Comment.
Compensating for IF cable and diplexer loss
The external diplexer has 1dB of loss at 300 MHz. The cable that connects the diplexer to the
signal analyzer has loss depending on cable length.
1 Press Input/Output, External Mixer, Cable IF Loss and enter the cable loss plus the 1dB
diplexer loss.
38 Keysight 11970 Series User’s Guide
Page 39

Operation 2
NOTE
NOTE
Manually entering conversion loss data
1 Locate the printed copy of the conversion loss data that has the text "For use with Keysight
X-Series analyzers only".
Or
Insert the CD provided with the mixer into a PC and navigate to the 70xxxxxx_X.pdf file. The file
contains tabular and graphic conversion loss data. Be careful to select the correct file since
there are three files provided for the 11970A, Q and V band mixers. Print the 70xxxxxx_X.pdf file
to create a printed copy.
For the 11970A, 11970Q and 11970V, this is the conversion loss file that is used for almost all
applications. however, for the mixer model numbers listed above, there are two other
70xxxxxx_X.csv files on the CD that can be read and printed using Windows notepad. See the
notes under “Loading Conversion Loss Data for the Signal Analyzer” on page 35.
2 Press Input/ Output, More, Corrections, Select Correction.
3 Choose a correction array from the list of Correction 1 through Correction 6. Correction 1 has a
provision to store antenna corrections, so if antenna corrections are required, reserve this array
for that use. If you want to see if anything is already stored in a particular correction, press
Correction, Ed it. To delete a correction table, press Return, assure the Select Correction key
corresponds to the correction you want to delete, and press Delete Correction.
4 After selecting the correction number, press Edit. Use the keys provided to enter the frequency
5 It is possible to add a description and a comment of what the selected correction is, and have
Signal ID
Image suppress
The Image Suppress mode of Signal ID mathematically removes all image and multiple responses
of signals present at the mixer input. Two hidden sweeps are taken in succession. The second
sweep is offset in LO frequency by 2*IF/N. For each point in each trace, the smaller amplitude from
the two traces is taken and placed in that point in Trace 1. Responses of each trace that lie on top
of one another will remain and are valid signals, others are images and are suppressed.
This function takes control of and uses Trace 1. Any data in this trace prior to activating Image
Suppress will be lost.
In Image Suppress Mode, synchronization is ensured by first turning off Signal ID, initiating a single
sweep, then turning on Signal ID followed by two single sweeps.
and amplitude (conversion loss) points from the calibration data table. Conversion loss values
are entered as positive numbers. When finished, press Return.
this description appear on the Description or Comment key. Press Properties, and connect a
keyboard to the instrument. For example, press Comment and type 11970V Serial XXxxxxxxxx.
Press Done.
Keysight 11970 Series User’s Guide 39
Page 40

2Operation
NOTE
Image shift
Like the Image Suppress mode, Image Shift is a two sweep sequence. The data from the first
sweep is placed in Trace 1 and the data from the second (LO frequency shifted by 2*IF/N) sweep is
placed in Trace 2. Signal responses of Trace 1 and Trace 2 that have the same horizontal position
are considered to be in the current band and therefore can be analyzed with the amplitude and
frequency measurement systems of the SA. All other responses are invalid and should be ignored.
This function takes control of and uses Trace 1 and Trace 2. Any data in these traces prior to
activating Image Shift will be lost.
To synchronize in Image Shift Mode, turn off Signal ID and then initiate a single sweep. Then turn
on Signal ID and initiate two single sweeps. The results of the first sweep after Signal ID is turned
on are available in Trace 1. The next sweep is shifted and the data from that sweep is available in
Trace 2. The unshifted and shifted data can then be compared.
40 Keysight 11970 Series User’s Guide
Page 41
Operation 2
NOTE
Keysight 11970 SERIES
HARMONIC MIXER
Using the 11970A, Q, U, V, and W Mixers with the N9040B X- Series Signal Analyzer (Option EXM)
Refer to “Spectrum analyzer retrofit requirements” on page 13 for configuration requirements.
The following examples explain how to connect the external mixers to the signal analyzer using a
diplexer, choose the band of interest, activate conversion loss correction data, and how to use the
signal-identification functions.
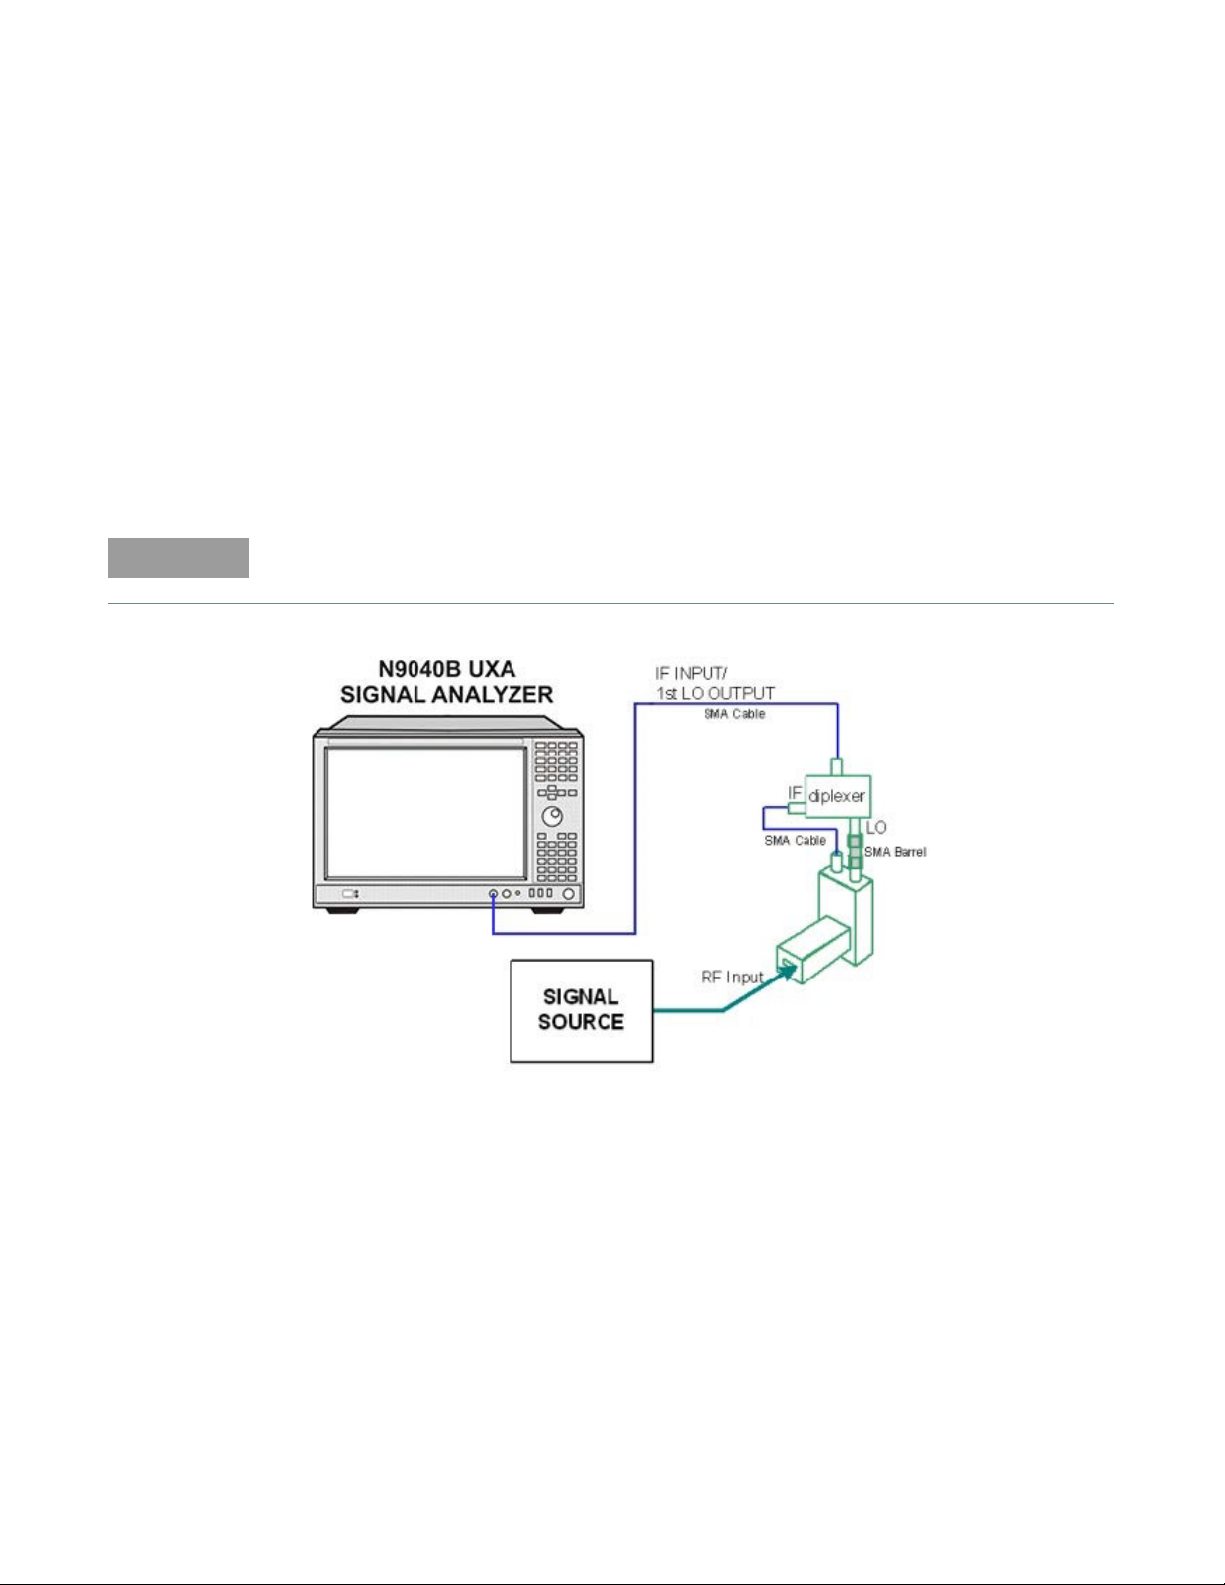
Set up the equipment
1 Connect the signal source, diplexer, and harmonic mixer to the signal analyzer as shown in
Figure 2-8.
The maximum torque for the SMA cables and adapters should not exceed 122 N-cm (10 in-lb.)
Figure 2-8 External mixer setup (N9040B)
2 On the analyzer press MODE/MEAS hardkey. Tap Spectrum Analyzer, OK.
3 Select external mixing by pressing Input/Output hardkey. Tap Select Input, External Mixer,
External Mixer Setup.
4 The default is 11970A. To select Q, U, V or W bands, tap Mixer Presets, and under the 11970
selections chose the appropriate 11970 frequency band. Tap Close to return to the Spectrum
display.
5 Tune the analyzer to the input frequency by pressing FREQ hardkey and enter a center
frequency, or start and stop frequencies. To enter a center frequency tap Center Frequency
twice and enter a value.
Keysight 11970 Series User’s Guide 41
Page 42
2Operation
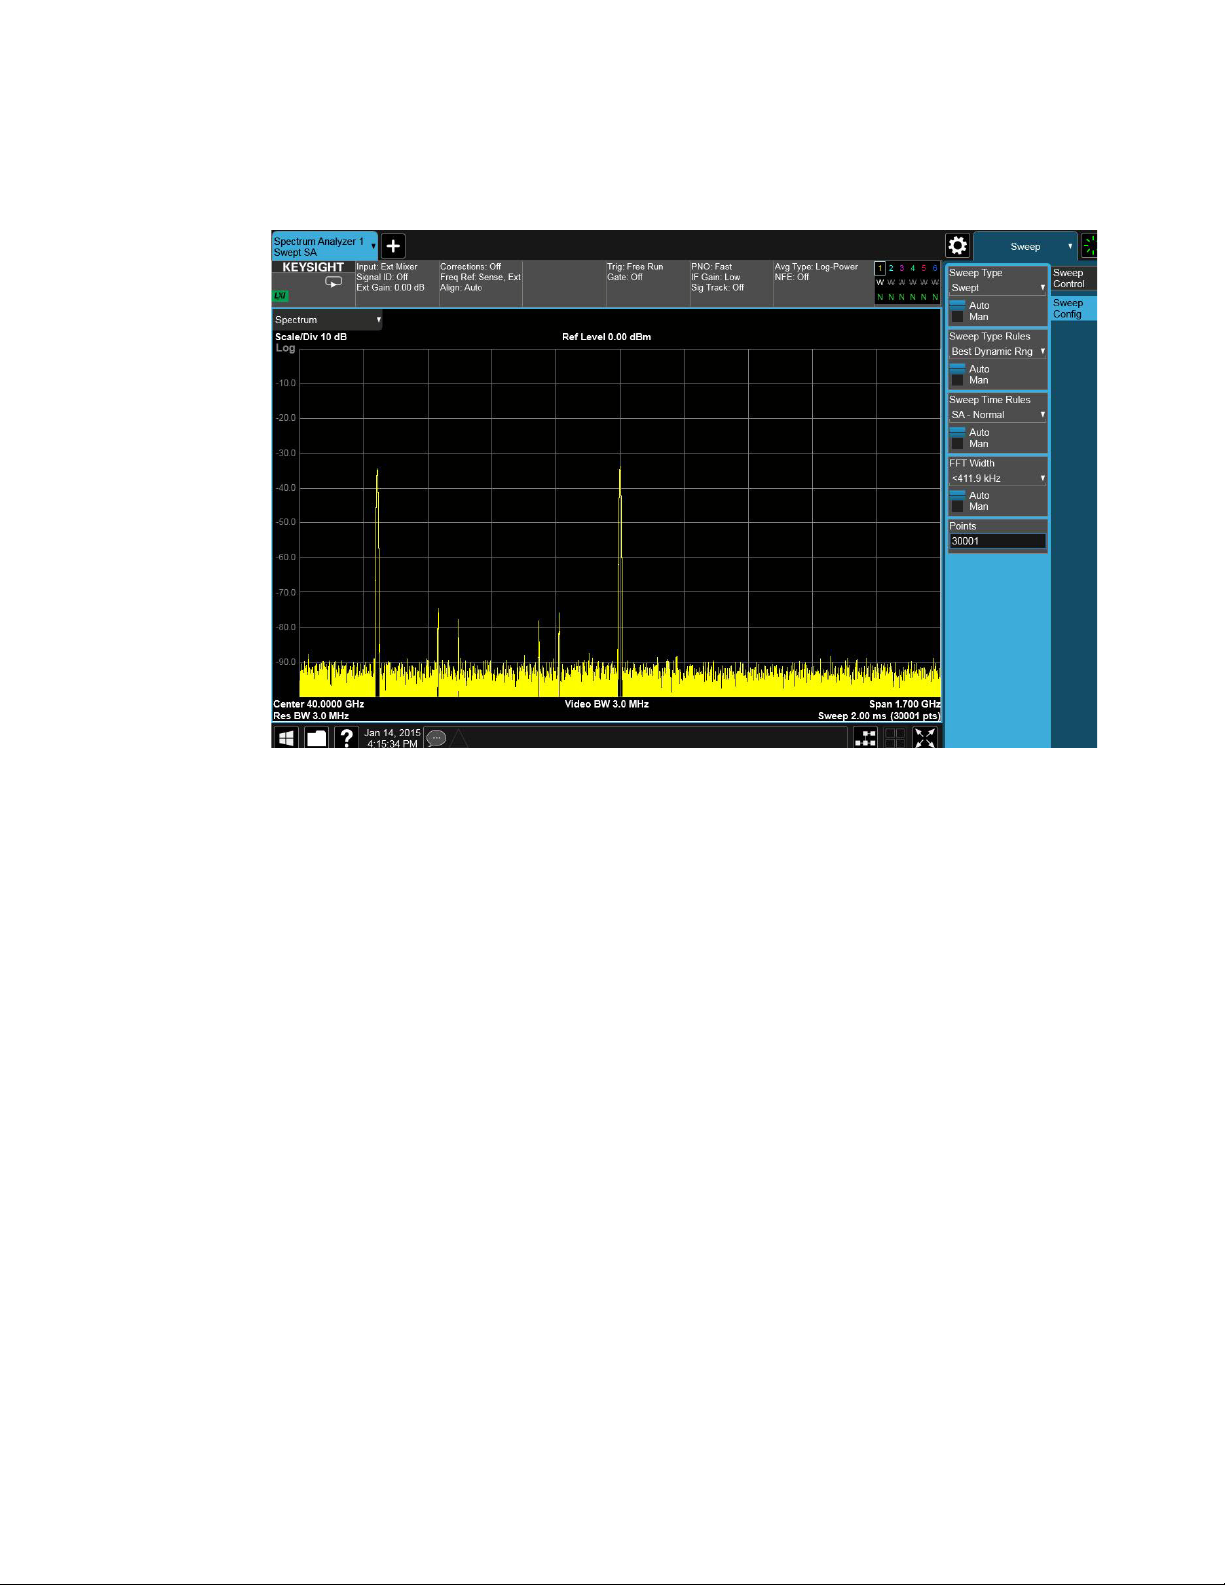
6 Increase the number of sweep points to obtain increased frequency resolution. Press SWEEP
hardkey. Tap Sweep Config, tap Points twice, and enter 30001.
Figure 2-9 Multiple signal responses (N9040B)
7 Many responses may appear on screen. Turn on Signal ID function to identify true signals from
images and multiples. Press Input/Output hardkey. Tap Signal ID to toggle Signal ID on. Tap
Signal ID Mode and select Image Suppress. See “Signal ID” on page 46 for more information.
42 Keysight 11970 Series User’s Guide
Page 43

Operation 2
NOTE
Figure 2-10 Valid signal responses (N9040B)
Amplitude calibration
1 See Loading Conversion Loss Data for the Signal Analyzer below. This will guide you through
entering the conversion loss data provided with the mixer, into a corrections file that can be
activated to provide amplitude corrected measurements.
2 To access corrections, tap Corrections, Edit Corrections, Select Correction.
3 Chose a correction from the list. Note that you used one of the Corrections numbered 1-6 when
you entered the conversion loss data into the instrument. Tap Close.
4 Tap Correction On to apply the corrections to the measurement. Corrections On will
automatically toggle the Apply Corrections setting to On.
Assure only ONE correction file is turned on because it is possible to turn on multiple correction
files, and if some of the files share the same frequency points, the correction that results for those
shared frequency points will cause measurement errors. Therefore assure that only the correction
file required for the measurement is turned on, and turn off all other corrections.
Keysight 11970 Series User’s Guide 43
Page 44

2Operation
NOTE
Loading conversion loss data for the signal analyzer
The conversion loss data supplied with your mixer can be loaded into your signal analyzer from one
of two sources:
– By downloading the 70xxxxxx_X.csv file located on the CD ROM disk that is provided with your
– The mixer ships with a printed copy of the conversion loss data. Find the printed copy
Downloading the conversion loss .csv files to the analyzer corrections array
1 Install the CD ROM provided with the mixer, into a PC and view the contents of the CD.
mixer. The 70xxxxxx_X.csv file is transferred from the CD to a USB memory device, and then the
USB memory device inserted into the PXA, and the file transferred to one of the analyzer
corrections array locations. The USB memory device should be scanned for viruses before use.
conversion loss data that has the text "For Use with Keysight X-Series analyzers only". The
conversion loss data will need to be manually entered as frequency and amplitude pairs into the
analyzer corrections file. An example of calibration data is shown Figure 2-23.
The CD also contains 70xxxxxx_X.pdf files of the conversion loss data that can be printed, and
then manually entered into a Correction array location. You will need to enter the frequency and
amplitude pairs into the analyzer corrections file. An example of calibration data is shown
Figure 2-23.
2 Locate the 70xxxxxx_X.csv file.
For the 11970A, 11970Q and 11970V, this is the conversion loss file used for almost all
applications. However, for the mixer model numbers listed above, there are two other
70xxxxxx_.csv files on the CD that may be used in special cases.
– As an example, on the 11970Q mixers, the additional two files are 70Qxxxxxx_8.csv and
70Qxxxxxx_10.csv. The 70Qxxxxxx_8.csv file contains conversion loss data for the 8th
harmonic only, and this data allows the 8th harmonic to be used to a slightly higher tuned
frequency than the normal 40 GHz transition from the 8th to the 10 harmonic. However, only a
portion of Q band can be covered by the 8th harmonic. See the 70Qxxxxxx_8.csv file for the
exact frequency coverage.
– The 70Qxxxxxx_10.csv file contains conversion loss data for the 10th harmonic only, and this
data allows the 10th harmonic to be used to a lower tuned frequency than the normal 40 GHz
transition from the 8th to the 10 harmonic. The conversion loss will be worse below 40 GHz
compared to using the normal 70Qxxxxx_X.csv file.
The reason you may want to use one of these special files is when making measurements that
span the normal 40 GHz, 8th to 10 harmonic mixing transition. The two files provide conversion
loss data that allow calibrated measurements when you need to measure slightly above or below
the normal transition frequency, and want the measurement to be made using a single harmonic.
3 Copy the .csv file to a USB memory device.
4 Insert the USB memory stick into one of the USB ports on the signal analyzer.
5 Tap Corrections, Select Correction.
44 Keysight 11970 Series User’s Guide
Page 45
Operation 2
6 Choose a correction array from the list of Correction 1 through Correction 8. Correction 1 has a
provision to store antenna corrections, so if antenna corrections are required, reserve this array
for that use, If you want to see if anything is already stored in a particular correction, tap one of
the correction numbers, and Edit Correction. To delete the correction table tap Delete
Correction. Tap Close to exit the Edit screen.
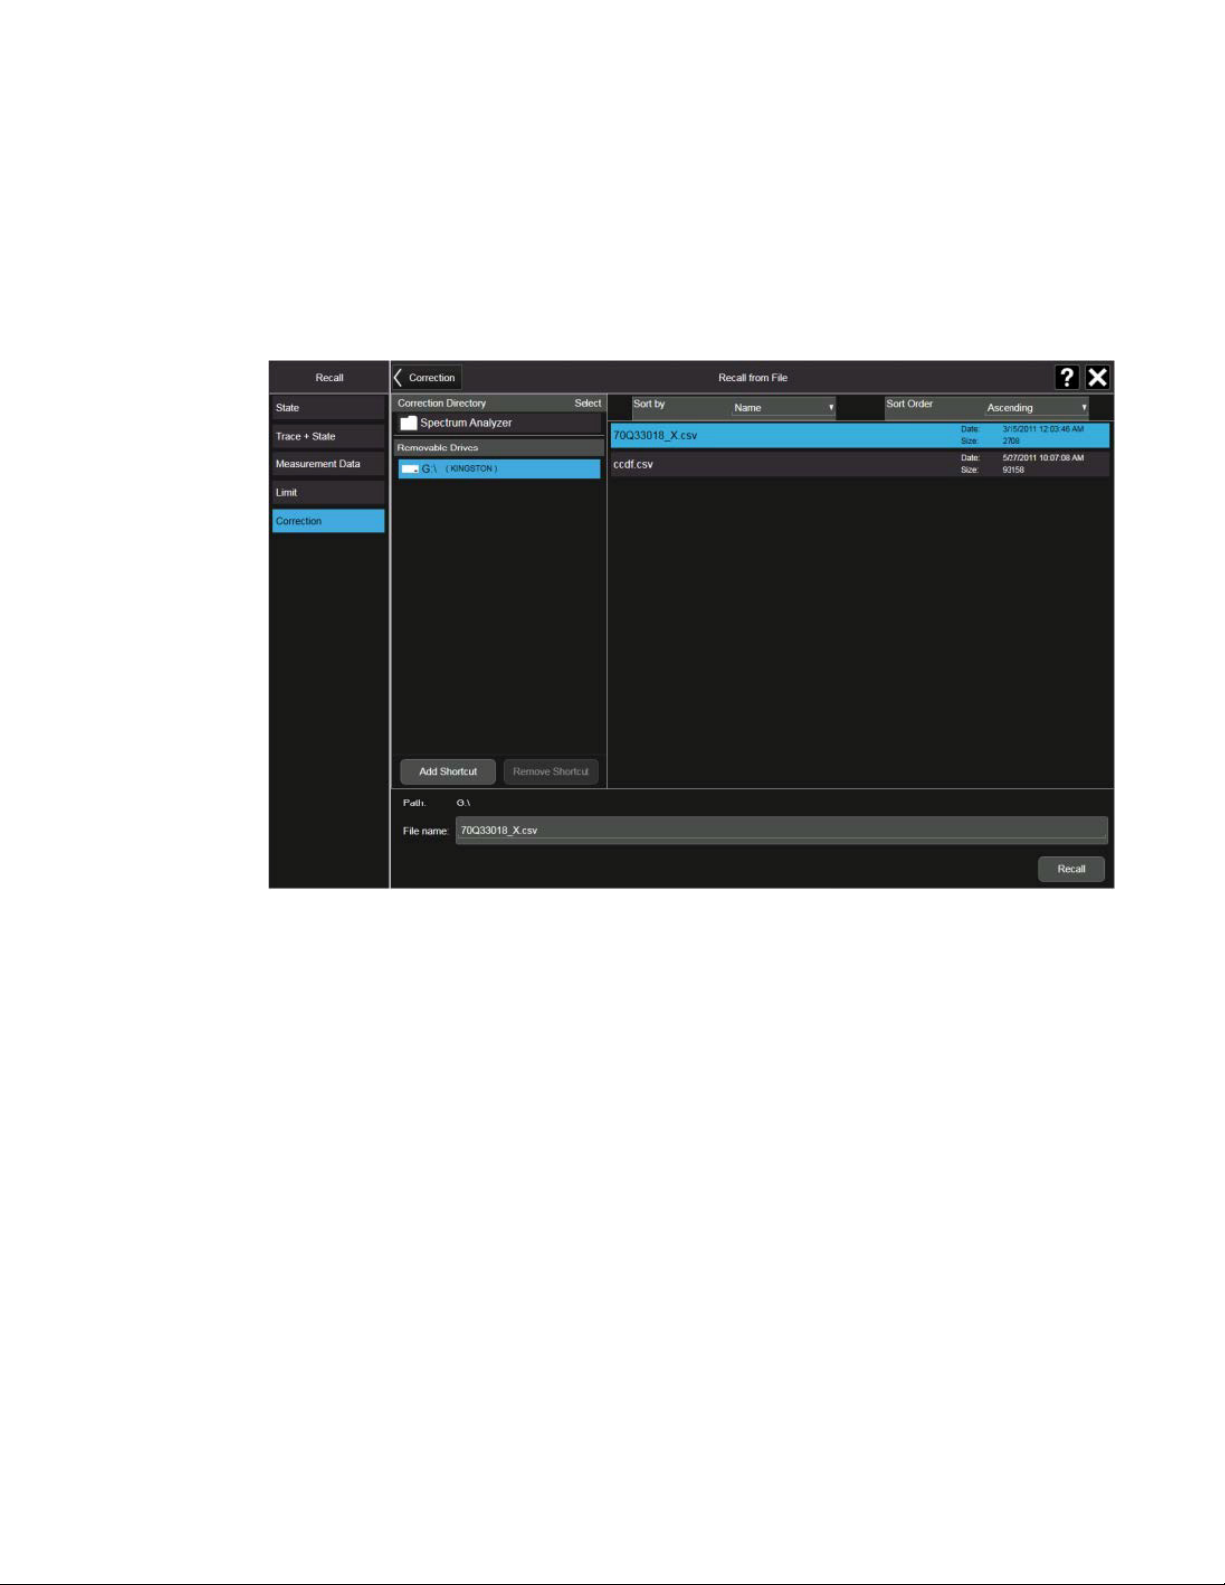
7 Once the correction array number is selected, press Recall hardkey and tap Correction, Recall
From, and select external drive designator under Removable Drives.
Figure 2-11 Loading the conversion loss files to the corrections array
8 Select the 70xxxxxx_X.csv file that corresponds to your mixer serial number and tap Recall. The
conversion loss data will load into the specified corrections array. To view the contents of the
correction array, tap Edit Corrections. Tap Close to go back to the measurement screen.
9 Loading the .csv file automatically populates the Description and Comments fields found under
Edit Corrections, Settings. To edit these fields, tap on the field and use the pop-up keyboard to
make changes. Tap Done when changes are complete.
Compensating for IF cable and diplexer loss
The external diplexer has 1dB of loss at 300 MHz. The cable that connects the diplexer to the
signal analyzer has loss depending on cable length.
1 Press Input/Output hardkey and tap Cable IF Loss twice then enter the cable loss plus the 1 dB
diplexer loss.
Keysight 11970 Series User’s Guide 45
Page 46

2Operation
NOTE
NOTE
Manually entering conversion loss data
1 Locate the printed copy of the conversion loss data that has the text "For use with Keysight
For the 11970A, 11970Q and 11970V, this is the conversion loss file that is used for almost all
applications. however, for the mixer model numbers listed above, there are two other
70xxxxxx_X.csv files on the CD that can be read and printed using Windows notepad. See the
notes under “Loading conversion loss data for the signal analyzer” on page 44.
2 Press Input/Output hardkey. Tap Corrections, Select Correction.
3 Choose a correction array from the list of Correction 1 through Correction 8. Correction 1 has a
4 To enter values into the table tap Edit Correction, insert Row Below. Tap on boxes under Freq
5 It is possible to add a description and comment of what the selected correction is, and have this
X-Series analyzers only".
Or
Insert the CD provided with the mixer into a PC and navigate to the 70xxxxxx_X.pdf file. The file
contains tabular and graphic conversion loss data. Be careful to select the correct file since
there are three files provided for the 11970A, Q and V band mixers. Print the 70xxxxxx_X.pdf file
to create a printed copy.
provision to store antenna corrections, so if antenna corrections are required, reserve this array
for that use. If you want to see if anything is already stored in a particular correction, tap one of
the correction numbers, and Edit Correction. To delete a correction table, tap Delete
Correction.
or Amptd and enter the frequency and amplitude (conversion loss) points from the calibration
data table. Conversion loss values are entered as positive numbers.
description appear on the Description or Comment field. Tap Settings and tap on the field and
use the pop-up keyboard to enter text. Tap Done when changes are complete.
6 Tap Close to exit the Edit Corrections screen.
Signal ID
Image suppress
The Image Suppress mode of Signal ID mathematically removes all image and multiple responses
of signals present at the mixer input. Two hidden sweeps are taken in succession. The second
sweep is offset in LO frequency by 2*IF/N. For each point in each trace, the smaller amplitude from
the two traces is taken and placed in that point in Trace 1. Responses of each trace that lie on top
of one another will remain and are valid signals, others are images and are suppressed.
This function takes control of and uses Trace 1. Any data in this trace prior to activating Image
Suppress will be lost.
In Image Suppress Mode, synchronization is ensured by first turning off Signal ID, initiating a single
sweep, then turning on Signal ID followed by two single sweeps.
46 Keysight 11970 Series User’s Guide
Page 47

Image shift
NOTE
Like the Image Suppress mode, Image Shift is a two sweep sequence. The data from the first
sweep is placed in Trace 1 and the data from the second (LO frequency shifted by 2*IF/N) sweep is
placed in Trace 2. Signal responses of Trace 1 and Trace 2 that have the same horizontal position
are considered to be in the current band and therefore can be analyzed with the amplitude and
frequency measurement systems of the SA. All other responses are invalid and should be ignored.
This function takes control of and uses Trace 1 and Trace 2. Any data in these traces prior to
activating Image Shift will be lost.
To synchronize in Image Shift Mode, turn off Signal ID and then initiate a single sweep. Then turn
on Signal ID and initiate two single sweeps. The results of the first sweep after Signal ID is turned
on are available in Trace 1. The next sweep is shifted and the data from that sweep is available in
Trace 2. The unshifted and shifted data can then be compared.
Operation 2
Keysight 11970 Series User’s Guide 47
Page 48

2Operation
NOTE
Using the Mixers with the 856X Series Spectrum Analyzers
External millimeter mixers can be used to extend the frequency coverage of the 8560 E-Series and
EC-Series spectrum analyzers. (The 8560E/EC Option 002 and Option 327 do not have external
mixing capability.)
The 8560 E-Series and EC-Series spectrum analyzers contain an extensive menu of functions that
help with millimeter measurements. This example explains how to connect external mixers to the
spectrum analyzer, choose the band of interest, store conversion-loss factors, and how to use the
optional automatic signal-identification functions.
Set up the equipment
1 Figure 2-12 illustrates how to connect an external harmonic mixer to the spectrum analyzer.
Figure 2-12 External mixed setup (856X)
Good-quality shielded SMA-type cables should be used to connect the mixer to the spectrum
analyzer to ensure that no signal attenuation occurs. Keysight 11970-60013 SMA-type cables
may be used. Do not over-tighten the cables; the maximum torque should not exceed 112 N-cm
(10 in-lb.).
Select the frequency band
2 Specify unpreselected external mixing by pressing CONFIG, then EXT MXR PRE UNPR until
UNPR is selected.
3 To select a frequency above 18 GHz:
a Press AUX CTRL, EXTERNAL MIXER to set the analyzer to external mixer mode.
48 Keysight 11970 Series User’s Guide
Page 49

Operation 2
b Enter the desired frequency directly using the center-frequency function.
c Notice in Table 2 -1 that some frequencies overlap and fall into two bands. To be sure that
the desired band is selected, refer to Tab le 2-1 and select the desired frequency band, then
use the full band function to enter this band.
d In the external mixer menu, press FULL BAND, then press the step up ( key until the letter
preceding BAND in the active function area corresponds to the desired frequency band.
Table 2-1 External mixer frequency ranges
Frequency band Frequency range Mixing harmonic Conversion loss
K 18.0 to 26.5 6- 30 dB
A 26.5 to 40.0 8- 30 dB
Q 33.0 to 50.0 10- 30 dB
U 40.0 to 60.0 10- 30 dB
V 50.0 to 75.0 14- 30 dB
E 60.0 to 90.0 16- 30 dB
W 75.0 to 110.0 18- 30 dB
F 90.0 to 140.0 24- 30 dB
D 110.0 to 170.0 30- 30 dB
G 140.0 to 220.0 36- 30 dB
Y 170.0 to 260.0 44- 30 dB
J 220.0 to 325.0 54- 30 dB
In this example, we'll look at U-band, which ranges from 40 GHz to 60 GHz, as shown in
Figure 2-13. The LOCK HARMONIC function “locks” the spectrum analyzer in that band, ensuring
that the spectrum analyzer sweeps only the chosen band. LOCK ON OFF is automatically set to ON
when FULL BAND is pressed.
Keysight 11970 Series User’s Guide 49
Page 50
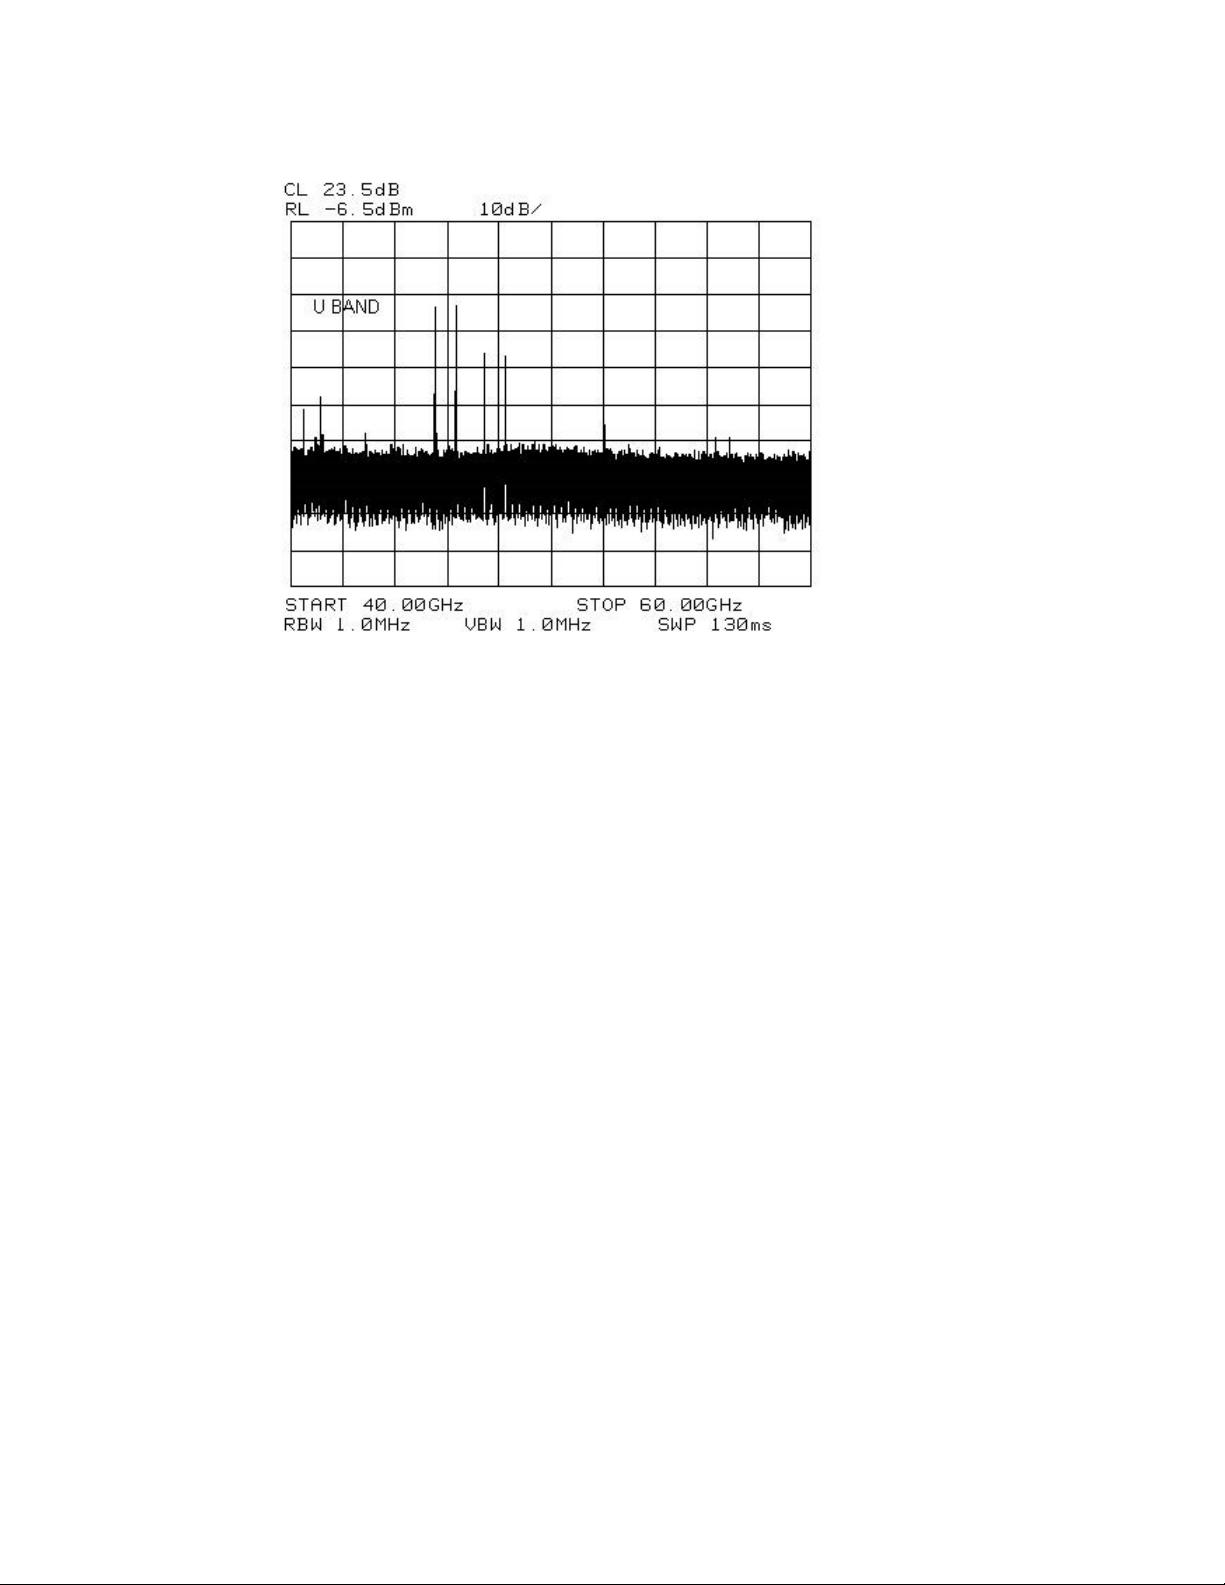
2Operation
Figure 2-13 Select the band of interest
Save the average conversion-loss value
4 Default conversion-loss values that are stored in the analyzer for each frequency band are listed
in Table 2-1 on page 49. These values approximate the values for the Keysight 11970 series
mixers. Other conversion-loss values may be entered into the spectrum analyzer in two ways.
The first method lets you to save the average conversion-loss value for the entire band using
AVERAGE CNV LOSS. To activate this function:
a Press AUX CTRL, EXTERNAL MIXER, AMPTD CORRECT, AVERAGE CNV LOSS.
b Enter the appropriate average conversion-loss value. On Keysight 11970 Series harmonic
mixers, these values are listed on the mixer, or a calibration sheet that is supplied with the
mixer. The 11970A, Q, and V band mixers calibrated after May 2011 have two calibration
sheets. Use the sheet that contains the text "Not for use with the Keysight X-Series signal
analyzers". The U-band mixer used for this example had an average conversion loss of 23.5
dB, as shown in Figure 2-14.
50 Keysight 11970 Series User’s Guide
Page 51

Operation 2
Figure 2-14 Store and correct for conversion loss
The second method for storing conversion-loss information lets you save individual
conversion-loss data points at specific intervals across the harmonic band, using CNV LOSS VS
FREQ.
To view or enter a conversion-loss data point:
a Press CNV LOSS VS FREQ.
b Enter the conversion-loss data at the frequency shown.
c Use the step up (key to step through the band, entering the conversion loss at each step.
Signal identification
5 The IF output of a harmonic mixer contains many mixer products (frequencies of LO ± source,
2LO ± source, 3LO ± source…nLO ± source). As a result, within a single harmonic band, a single
input signal can produce many responses, only one of which is valid.
These responses come in pairs, where the members of the valid pair are spaced 621.4 MHz
apart (see Figure 2-15) and the right-most member for the pair is the correct response (for this
analyzer, the left member of a pair is not valid).
Keysight 11970 Series User’s Guide 51
Page 52
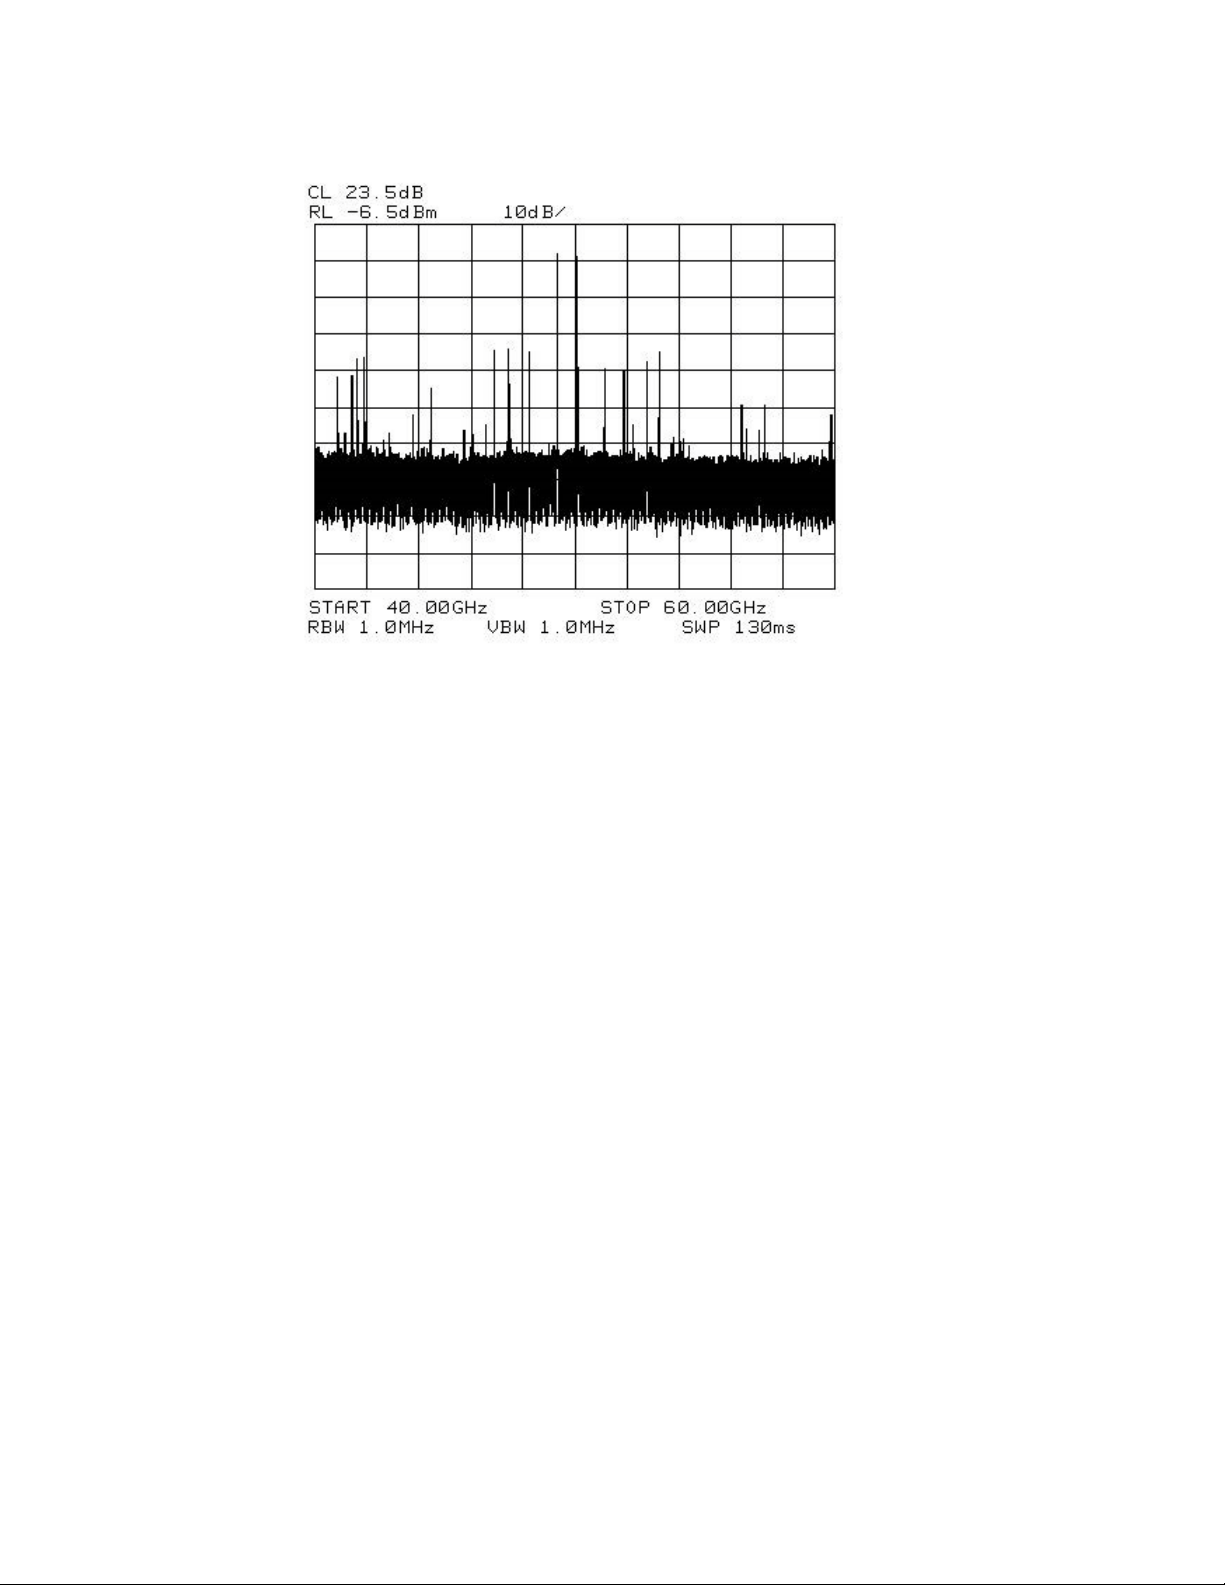
2Operation
Figure 2-15 Signal responses produced by a 50 GHz signal in U band
Identify signals with the frequency-shift method
6 Signal-identification routines that identify the signal and images are available on instruments
with firmware revisions
valid signals uses the spectrum-analyzer function SIG ID ON OFF. When using this function,
smaller spans will yield more accurate measurements.
a Span down to 50 MHz.
b Press AUX CTRL, EXTERNAL MIXER, SIGNAL IDENT.
c Press SIG ID ON OFF until ON is selected.
Any signal not produced by the currently selected harmonic will be shifted horizontally on
alternate sweeps (see Figure 2-16). Therefore, when viewing the display, on alternate sweeps the
signal will appear, then not appear, at the frequency of interest. The correct signal produced by the
selected harmonic will be shifted in a vertical direction only, as shown in Figure 2-17.
~920528, or with Option 008. The frequency-shift method of identifying
52 Keysight 11970 Series User’s Guide
Page 53
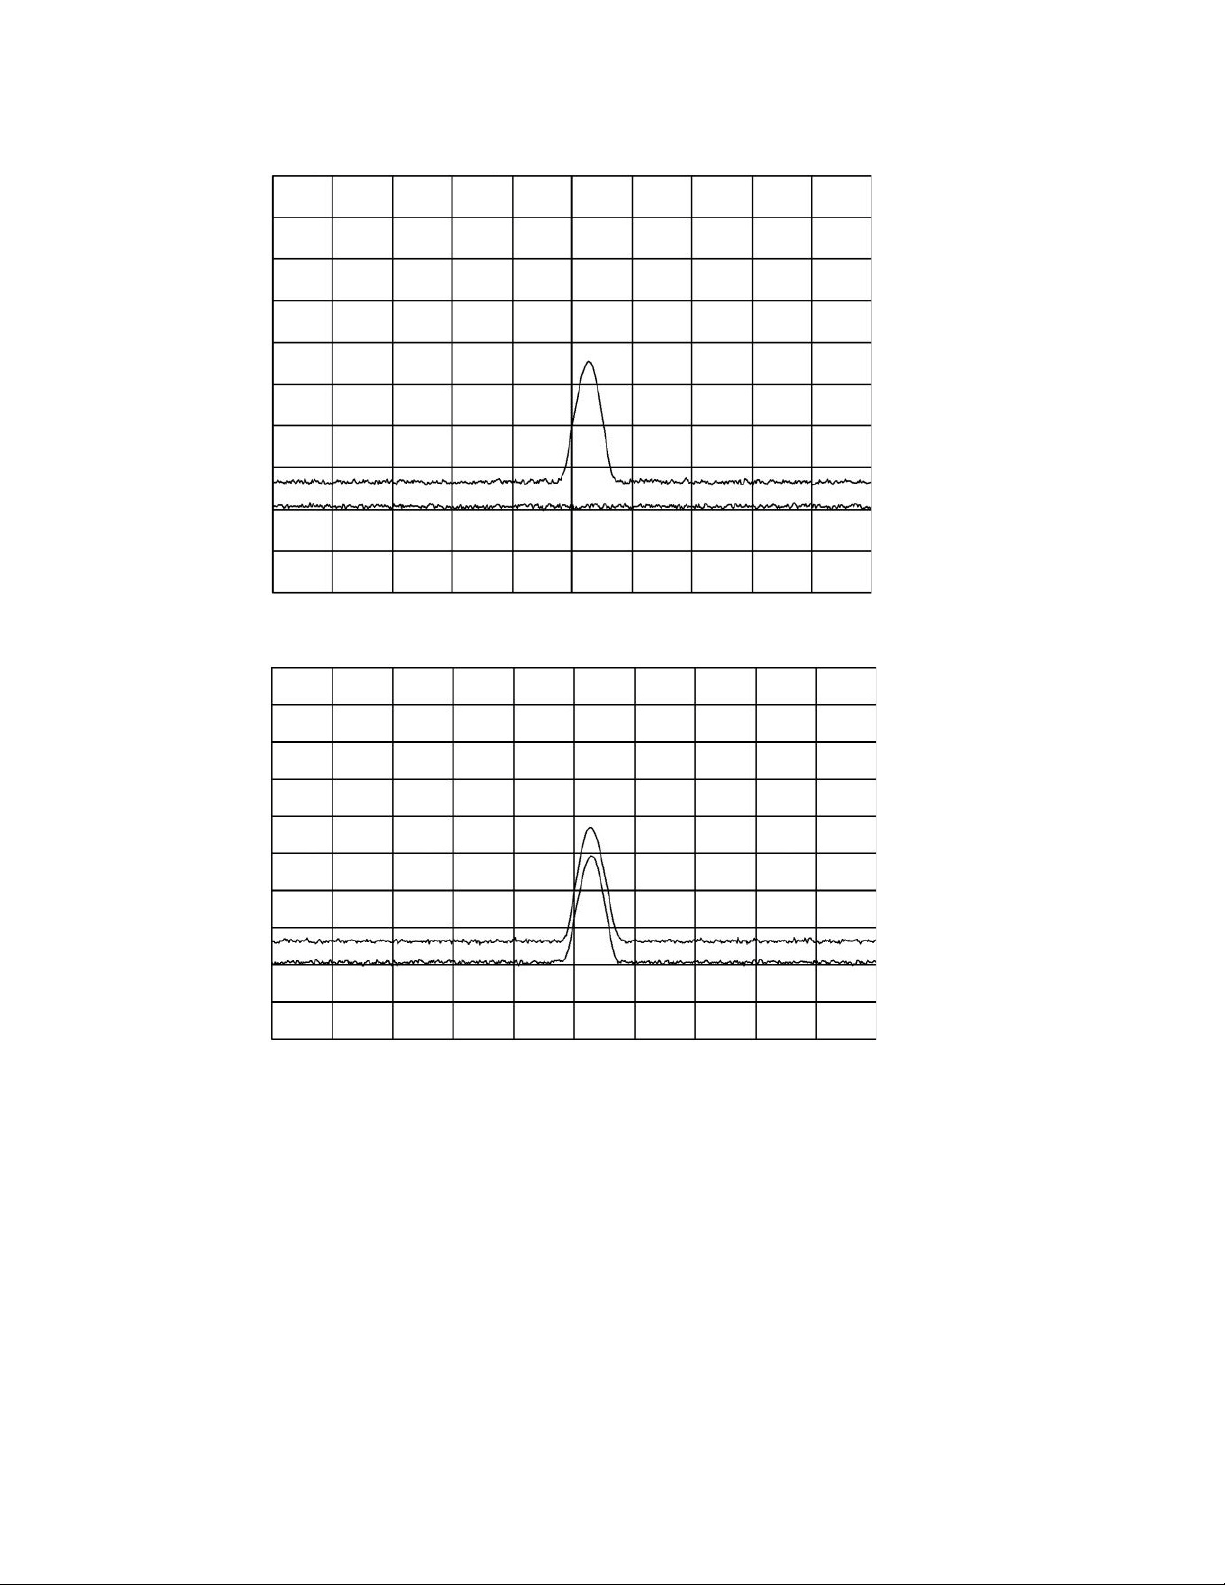
Figure 2-16 Response for invalid signals
Operation 2
Figure 2-17 Response for valid signals
Identify signals in wide frequency spans
7 SIG ID AT MKR identifies signals in wide frequency spans, using harmonic search. SIG ID AT
MKR automatically determines the proper frequency of a signal and displays its value on the
spectrum analyzer.
– Activating SIG ID AT MKR on an image of the signal will yield a reading in the active block, as
shown in Figure 2-18. The true signal frequency is given with an identifier that the marker
resides on an image. If the marker is placed on a true signal, and SIG ID AT MKR is activated,
the signal frequency will appear without the IMAGE notation, as shown in Figure 2-19.
Keysight 11970 Series User’s Guide 53
Page 54

2Operation
8 To activate SIG ID AT MKR:
9 To exit the external mixer mode, press AUX CTRL, then INTERNAL MIXER.
a Place a marker on a signal.
b Press AUX CTRL, EXTERNAL MIXER, SIGNAL IDENT, SIG ID AT MKR.
c To exit the external mixer mode, press AUX CTRL, then INTERNAL MIXER.
Figure 2-18 SIG ID AT MKR performed on an image signal
Figure 2-19 SIG ID AT MKR performed on a true signal
54 Keysight 11970 Series User’s Guide
Page 55
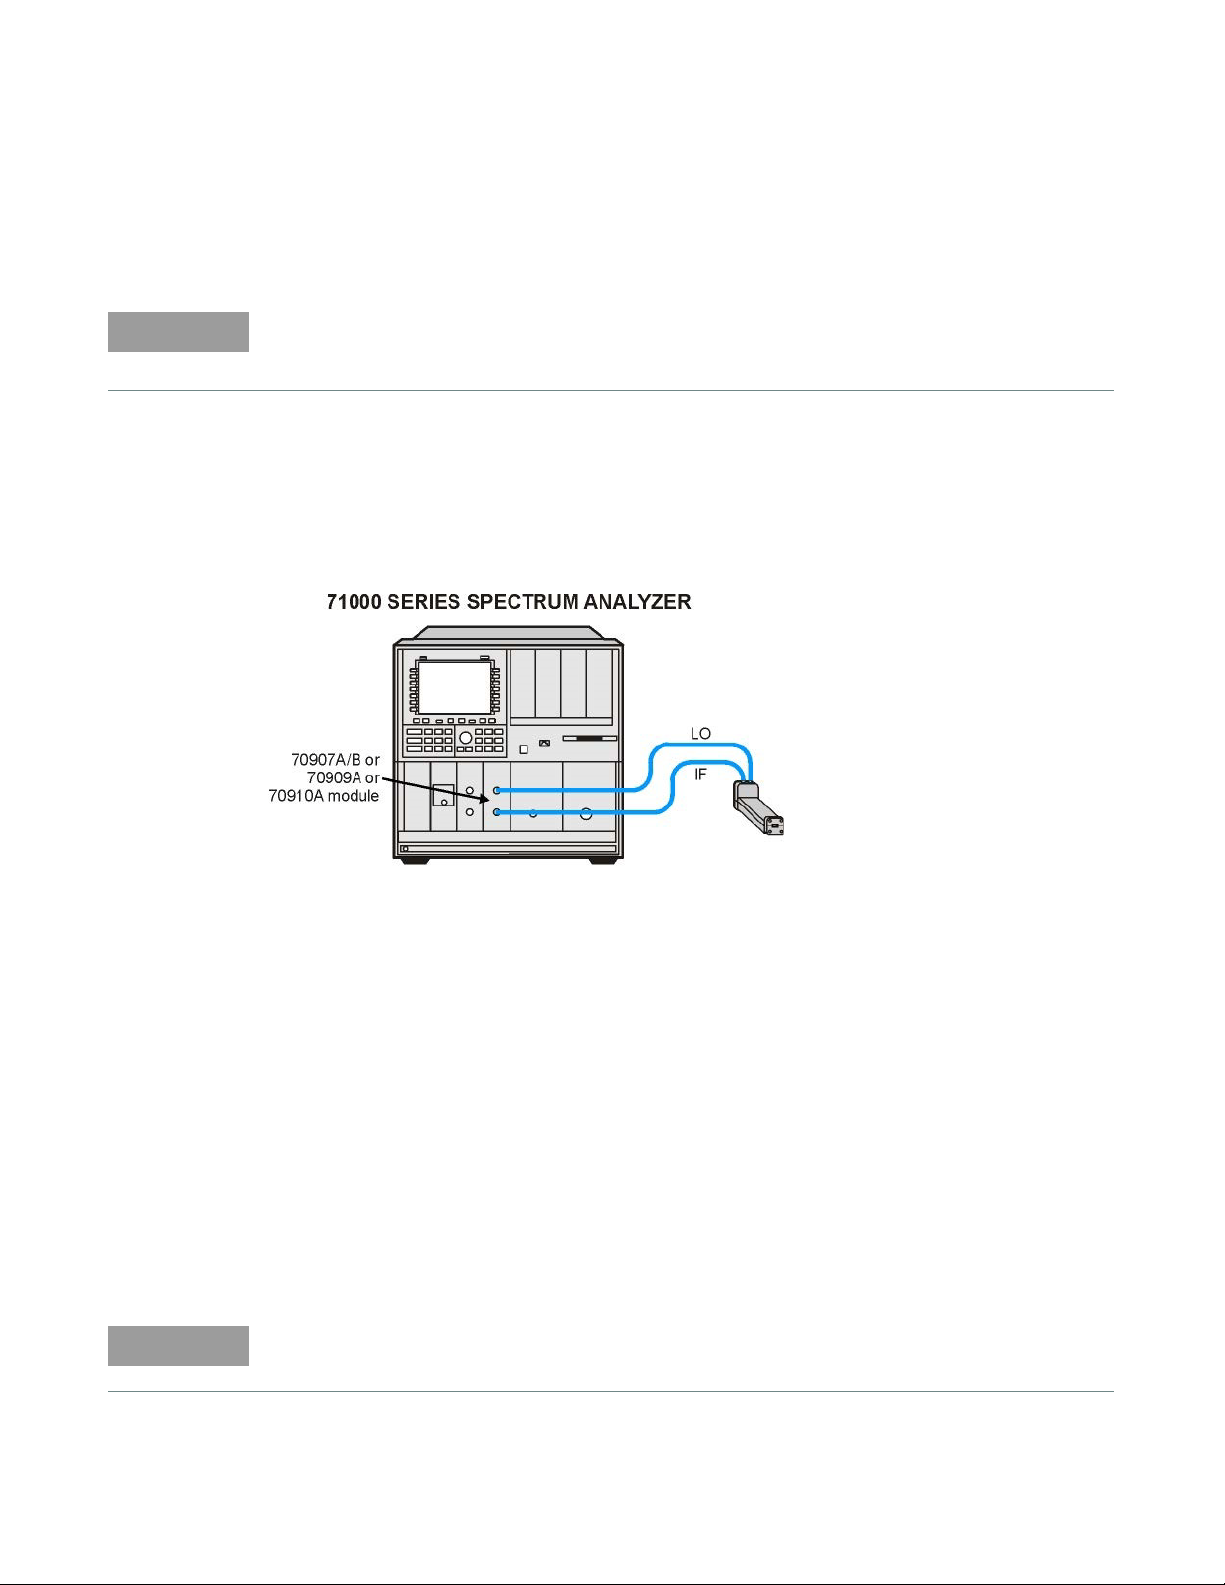
Using the Mixers with MMS Analyzers
NOTE
NOTE
Preliminary operation
This section provides information for the Keysight 70907A (or B), however the operation of the
Keysight 70909A and Keysight 70910A is similar. Minor d ifferences may be noted, but the
necessary deviations from these exact instructions will be obvious.
Equipment connection
Connect the equipment as shown in Figure 2-20. Use the following checklist to verify the
connections:
– Keysight 11970 LO IN to Keysight 70907B LO OUTPUT (SMA cable, 11970-60013)
– Keysight 11970 IF OUT to Keysight 70907B IF INPUT (SMA cable, 11970-60013)
Operation 2
Figure 2-20 Keysight 11970 connections to the Keysight 71000 series spectrum analyzer
Operation
Band selection
Use the following key sequence to enter the external mixing mode and to select the desired band
of operation:
Press the softkey for the desired band.
The above band selection key sequence must be used to enter the external mixing band of
operation. Do not enter in the center frequency of the band directly.
MENU
Select Input - choose external mixer input, for example: “IN 2 EM 70910A”
State
ext mixer
fulband KAQUVE
Keysight 11970 Series User’s Guide 55
Page 56

2Operation
NOTE
Amplitude calibration for a single frequency
Enter the conversion loss at the desired frequency from either the data listed on the mixer label, or
a calibration sheet supplied with the mixer. The 11970A, Q, and V band mixers calibrated after May
2011 have two calibration sheets. Use the sheet that contains the text "Not for use with the
Keysight X-Series signal analyzers". Use the following key sequence to enter the conversion loss
values:
Enter the conversion loss value of the desired frequency, then terminate the entry with dB.
The above procedure is a single-point conversion-loss correction. For an alternative procedure,
available by remote programming only, refer to “Conversion loss versus frequency correction” on
page 59.
General descriptions of Keysight 71000 series spectrum analyzer external-mixing
functions
State
ext mixer
CONV LOSS
ext mixer Allows access to the following softkey functions that control the
measurement range when an external mixer extends the spectrum analyzer
frequency range. The ext mixer softkey can be found under the State key.
fulband KAQUVE
fulband WFDGYJ
CONV LOSS
SIGNAL IDENT
fulband KAQUVE
and
fulband WFDGYJ
Specify the frequency range for measurements made with external mixers.
Twelve frequency bands are available. Table 2 -2 lists the start and stop
frequencies of each band and also shows which local-oscillator harmonic
(N) is used for the mixing process. Once a band is selected, the frequency
range is locked and the spectrum analyzer tunes with the local-oscillator
harmonic for that band only.
56 Keysight 11970 Series User’s Guide
Page 57

Table 2-2 External mixing bands and associated mixing harmonics
Band Harmonic number (N) Frequency range (GHz)
K 6- 18.0 to 26.5
A 8+ 26.5 to 40.0
Q 10+ 33.0 to 50.0
U 10+ 40.0 to 60.0
V 14+ 50.0 to 75.0
E 16+ 60.0 to 90.0
W 18+ 75.0 to 110.0
F 24+ 90.0 to 140.0
D 30+ 110.0 to 170.0
G 36+ 140.0 to 220.0
Y 42+ 170.0 to 260.0
J 50+ 220.0 to 330.0
Operation 2
Keysight 11970 Series User’s Guide 57
Page 58

2Operation
NOTE
CONV LOSS
(conversion loss)
Preset Input Sets which active input port will be selected when the INSTR PRESET is
INSTR PRESET Resets to the preset input and to the lowest full frequency range available.
SIGNAL IDENT
(signal identity)
Offsets the reference level to compensate for amplitude losses at the active
input port. If necessary, use select input to activate the desired input port
before specifying its conversion-loss offset.
To clear the offset, enter a conversion loss of zero.
After the instrument preset, a default value of 30 dB is activated
automatically for the input port of the external-mixer-interface module.
pressed. The preset input softkey can be accessed by pressing State, then
MORE.
(For an external mixer, this is band A.) This is a front panel key.
Press Frequency, More, sig id options.
Executes a routine to identify real, in-band signals using either the image
(default) or shift methods.
Several options are available under sig id options:
– SIG ID ) CF
Places the marker on the identified real signal and centers the signal on
the display.
– SIG ID MAN OFF
Selects manual or automatic (default) mode.
– IMAGE/SHIFT
Selects the routine to use for identification.
– SIG ID AMPTD D
Specifies the amplitude difference between the marked signal and
signals tested as images or harmonics (default is 10 dB; applies only to
IMAGE mode.)
– IMAGE N START
Determines the frequency range for possible image or harmonic
responses by selecting the lowest and highest local oscillator harmonic
used for mixing, according to the tuning equation below:
F
= N x FLO \ IF
S
Default is 1.
– IMAGE N STOP
See “IMAGE N START” definition above. Default is 40.
See Table 2-3 for available frequency ranges and related harmonic numbers. Use the IMAGE N
START and IMAGE N STOP softkeys for the image identification only.
58 Keysight 11970 Series User’s Guide
Page 59

Table 2-3 Frequency ranges and corresponding harmonic numbers
NOTE
Band/Range Harmonic number and sign of IF (N)
Internal mixing - Keysight 71210C
Internal mixing - Keysight 71200C
2.9 - 6.2
6.0 - 12.7
12.5 - 19.9
19.7 - 22.0/26.5
2.9 - 6.2
6.0 - 12.8
12.6 - 22.0
-1
-2
+3
+4
-1
-2
-4
Operation 2
K: 18.0 - 26.5
A: 26.5 - 40.0
Q: 33.0 - 50.0
U: 40.0 - 60.0
V: 50.0 - 75.0
External mixing - Keysight 70907A/
70907B/ 70910A/ 70909A
E: 60.0 - 90.0
W: 75.0 - 110.0
F: 90.0 - 140.0
D: 110.0 - 170.0
G: 140.0 - 220.0
Y: 170.0 - 260.0
J: 220.0 - 330.0
Conversion loss versus frequency correction
The Keysight 71000 Series Spectrum Analyzers with the Keysight 70907A (or B) External Mixer
Interface Module installed has the amplitude-correction function (AMPCOR) available by remote
programming.
Use AMPCOR to compensate for the Keysight 11970 Series frequency-dependent conversion-loss
variations. Up to 200 pairs of frequency-amplitude correction points can be entered, depending on
the amount of available internal memory. The frequency values entered must be in increasing
order, or an error condition results. Whenever AMPCOR is on, the correction values are added to all
measurement results.
+6
+8
+10
+10
+14
+16
+18
+24
+30
+36
+42
+50
The values of the correction points are applied across the active measurement range. Between
points, the correction value are interpolated. When the measuring at frequencies outside of the
first and last correction pairs from memory.
When AMPCOR is executed, the frequency pairs are stored in internal memory. The remote
commands DISPOSE ALL, FORMAT, ERASE, and DISPOSE AMP COR erase the
amplitude-correction pairs from memory.
DISPOSE ALL, FORMAT, and ERASE erases much more than the amplitude-correction pairs from
memory. Do not use these commands without referring to the programmer’s manual for the
Keysight 70000 and Keysight 70900B to determine their effect on instrument programming.
Keysight 11970 Series User’s Guide 59
Page 60

2Operation
Because AMPCOR adjusts IF gain and attenuation, AMPCOR should be used with care when
measuring signals near the compression level (also at a frequency that is corrected by the
AMPCOR command).
To use AMPCOR for the Keysight 11970 conversion loss correction, first set the single-point
conversion loss function to zero with the following command:
Then build the AMPCOR table with frequency conversion loss pairs. The following example
program line shows three pairs of frequency conversion loss values for a typical Keysight 11970V.
The conversion loss corrections are activated by the AMPCOR ON command; use AMPCOR OFF to
deactivate the function (be sure to manually enter a single-point conversion-loss value if AMPCOR
has been used).
To print out an existing AMPCOR table, use the program listed below:
10 dim A$ (1:20) [30]
20 OUTPUT 718; “CONVLOSS 0DB;”
30 OUTPUT 718; “AMPCOR 50 GHZ, 46.1DB, 52GHZ, 46.7DB, 53GHZ,47.2DB;”
40 !
50 OUTPUT 718; “AMPCOR?;”
60 ENTER 718 USING “%,k”;A$ (*)
70 !
80 FOR I=1 TO 10
90 PRINT “Point “;I,A$ (I)
100 NEXT I
110 END
OUTPUT 718; “CNVLOSS 0DB;”
OUTPUT 718; “AMPCOR 50GHZ, 49.6DB, 51GHZ, 49.1DB, 52GHZ,48.6DB;”
Line 30:
Generates an AMPCOR table.
Line 60:
% specifies that an EOI terminates the entire statement. “K” specifies that an L
terminates the
F
individual string entry.
Returned values are in the format where the frequency in Hz is listed first, followed by the
conversion loss in dB. See the following example:
60 Keysight 11970 Series User’s Guide
Page 61

Operation 2
NOTE
Point 1 50.00000000E+9,46.1
Point 2 52.00000000E+9,46.7
Point 3 53.00000000E+9,47.2
Point 4
Point 5
Point 6
Point 7
Point 8
Point 9
Point 10
Point 11
For further information, consult the Keysight 70900B Local-Oscillator-Controlled Modules
Programming Manual, part number 70900-90284.
Keysight 11970 Series User’s Guide 61
Page 62

2Operation
NOTE
CAUTION
Using the Mixers with the 8566B Spectrum Analyzer
Set up the equipment
1 Connect the external harmonic mixer to the spectrum analyzer, as shown in Figure 2-21.
Good-quality shielded SMA-type cables should be used to connect the mixer to the spectrum
analyzer to ensure that no signal attenuation occurs. Keysight 11970-60013 SMA-type cables
may be used. Do not over-tighten the cables; the maximum torque should not exceed 112 N-cm
(10 in-lb.).
Figure 2-21 External mixer connection
Before connecting the Keysight 11975A Amplifier, set the ALC switch to ON. Failure to do so can
damage the mixer.
2 Power up the spectrum analyzer and then the amplifier.
3 Adjust the amplifier power to 16 dBm.
4 To access the spectrum analyzer’s millimeter bands, press SHIFT and then the up arrow (until
the desired band is displayed on the screen, as shown in Figure 2-22. Note that this is
important because toggling through the bands, causes the band to automatically harmonic
lock as evidenced by the on-screen annotation of “Harmonic 6” changing to “Harmonic 6L”,
where “L” stands for locked, or you could press Shift+z to manually harmonic lock.
62 Keysight 11970 Series User’s Guide
Page 63

Figure 2-22 Typical milimeter signal display
Operation 2
A menu of millimeter measurement functions is accessed by pressing SHIFT, 1, MHz. Even though
the spectrum analyzer is in an external mixer band, the 8566B spectrum analyzer retains full
operation capability (except for use of the RF input attenuator and preselector).
Amplitude calibration
Procedure
Each 11970 series harmonic mixer is characterized at the factory and comes with a calibration
chart (See Figure 2-24). The horizontal axis of the chart gives the frequency range of the mixer and
the two vertical axis scales are calibrated in conversion loss and in reference level offset.
To correct the amplitude calibration of the spectrum analyzer to account for the conversion loss of
the harmonic mixer, press SHIFT, 1, MHz, which accesses the millimeter menu. Then press SHIFT,
5, MHz to access conversion loss entry and key in the appropriate value on the spectrum analyzer
as shown on the mixer calibration chart.
For measurements that span the entire band, choose an average value of conversion loss from the
conversion loss chart. For those spectrum analyzers with date codes earlier than 13.8.86, the
conversion loss is changed using the reference level function. Press SHIFT, then REFERENCE
LEVEL, then key in the reference level offset shown on the right side of the mixer calibration chart.
Keysight 11970 Series User’s Guide 63
Page 64

2Operation
Signal identification
Figure 2-22 shows a typical full-band display of a single input signal. Direct interpretation of the
display is difficult because of the large number of responses produced by several local oscillator
harmonics generated in the mixer. To solve this problem the 8566B spectrum analyzer uses two
methods of signal identification.
The first is an automatic image search in which the spectrum analyzer looks for a signal image
within a preset range of harmonic numbers. This automatic signal identification routine is initiated
by pressing SHIFT, 3, MHz. Upon completion, one of three messages appears on the CRT: SIGNAL
NOT IDENTIFIED, SIGNAL IDENTIFIED OUT OF BAND (with the frequency), or CENTER (with the
identified signal frequency). The range of harmonic numbers through which the spectrum analyzer
searches can be changed by accessing “search start HN” and “search stop HN,” which are SHIFT,
7, MHz and SHIFT, 8, MHz, respectively.
The second method, manual signal identification, is a fast method of verifying that the displayed
signal is a true signal in the specified band. Press SHIFT, 4, MHz to activate this function. Positive
signal identification is indicated if the signal in question does not change frequency and is reduced
in amplitude by one to two divisions on alternate sweeps. A failed signal identification is indicated
by the signal disappearing or shifting in frequency.
64 Keysight 11970 Series User’s Guide
Page 65

Operation 2
Figure 2-23 Calibration sheet 1
Keysight 11970 Series User’s Guide 65
Page 66

2Operation
Figure 2-24 Calibration sheet 2
66 Keysight 11970 Series User’s Guide
Page 67

Keysight 11970 Series Harmonic Mixers
User’s Guide
3 Service
Maintenance 68
This chapter covers care and maintenance of the mixer
67
Page 68

3Service
Maintenance
Repairs
The only maintenance required for the 11970 Series Mixers is preventive maintenance. When you
are not using your mixer, cover its waveguide input with its waveguide cap. Also, though the 11970
Mixers can absorb more punishment than is normal for such devices, you should avoid subjecting
them to unnecessary shock or vibration.
The 11970 Mixers are NOT field-repairable. If your mixer fails, DO NOT try to repair it yourself, you
will void the warranty. Instead, notify the nearest Keysight office.
68 Keysight 11970 Series User’s Guide
Page 69

This information is subject to change
without notice. Always refer to the
Keysight website for the latest
revision.
© Keysight Technologies 2011 - 2019
Edition 3, October 31, 2019
Printed in Malaysia
*11970-90040*
11970-90040
www.keysight.com
 Loading...