


VibWire-108
Vibrating Wire Sensor Interface Unit
User Manual Version 1.05 - Otcober 2008
Introduction
The following document details the model types, configuration
and operational features for the Keynes Controls VibWire-108
range of vibrating wire sensor interface.
The VibWire-108 units contains 8 x 4 wire sensor inputs and The
sensor interface consists of two inputs, one for the vibrating wire
sensor and the other for temperature/analogue input.
This document shows all the different hardware configurations and
User options available for the operation of the instrument.
All instruments are supplied with on-board frequency display and
a speaker also with or without analogue output ports.
Hardware Options
VibWire-108-RS485 RS 485 serial comms unit
VibWire-108-SDI12 SDI-12 serial comms unit
VibWire-108 Analogue Output
.
Instrument Scanning Operations
The VibWire-108 is a multiplexed instrument and as such scans
each channel before working out the sensor frequency and moving
on to the next channel. Only after all of the sensor inputs are
scanned are the results made available for data transmission across
the various communications networks or analogue output interface.
Configuration
The only time the sensor inputs require any configuration is when
the analogue output channels are to be used. For SDI-12 and
RS485 the sensor inputs operate automatically.
Real-time Operations
The VibWire-108 can be set to operate in real-time mode with the
real-time display operating on a single channel only. This is ideal
for testing and setting up sensors as any adjustment to the sensor is
instantly shown on the display.
Power Consumption
All of the VibWire systems use advanced power management
operations to minimise the power consumption and so make the
instrument ideal for stand-alone remote applications. Power
requirements are:
Power Supply 11-18V DC @ 0.25A
Scanning mode: 70mA aprox 30 seconds / scan
Display mode: 90mA continuous
SDI-12/RS485 network: Waiting for command 20mA continuous
Analog output mode: 25mA continuous
Solar Panels 4.8W cell gives 1 Reading /Hr indefinitely
Photo VibWire-108
Field Operations
There are various VW-108 models available offerings cable free,
GPRS modem, SDI-12/RS-485 serial port communications and
analogue outputs. All instruments no mater the model contain an
on board frequency display, ceramic speaker and User keyboard.
In order to ensure that the VibWire-108 systems operate as reliably
as possible they all contain lightening protection on sensor inputs
and isolated serial ports for digital data transmission.
The VibWire-108 series of instruments support everything needed
to make and report accurate vibrating wire sensor readings and also
to act as local display and diagnostic tool and report data across all
of the most common communication interfaces and data
transmission networks.
Fully Integrated Data Logger
The VibWire-108 has been fully integrated to the Keynes Gateway
data logger and communications interface. The Gateway can act as
a communications interface for connecting the VibWire-108 to
range of cable free networks such as GPRS and ZigBee. The
Gateway also supports USB data stick recording making it ideal for
fixed site recording.
The Gateway also controls the power management for the
VibWire-108 and switches off any third party equipment when not
in use to minimise systems power requirements.
Keynes Controls Reserves the right to make changes without notification. Refer to
the network drawing for details of the electrical connections.

Index
Page No. Description
1 Introduction
Instrument Scanning Operations
Power Consumption
2 Index
3 USB Data Recording
Gateway Settings for USB Data Recording
4 SDI-12 Serial Network Connection
Starting SDI-12 on the VibWire-108
5 RS-485 Serial Network Connections
Starting Data Acqusition Operations on a 485 Network
6 VibWire-108 Serial Port Communications
Command Structure and Operations across an RS-485 Network
Timing Constraints RS-485 / SDI-12 Network
Data Access Time
RS-485/ SDI-12 Commands
7 Start Measurement Commands
Initial Configuration
Table Of Commands SDI12 & RS-485
Communication ports Settings for SDI-12 & RS-485 network
8 Examples Of Using RS-485 / SDI-12 Instructions
Changing the ID Number (address)
ID Number Query
Start Measurements upon distributed instruments upon a network
9 Start Concurrent measurements on a number of distributed instruments
Read values from VibWire-108
Temperature / Current loop Data Format
10 Connection to an analogue data acquisition system
Technical specification - analogue output ports
Theory of operation
Starting Analogue Output Ports
11 Optimising the Analogue Output Settings
Integration to NDACS 6000 Logger
12 Real-time Frequency Display
Loud speaker
Sensor Problems
13 Vibrating Wire Sensor Installation
Lightening Protection
Multiple instrument installation
PCB Jumper Settings
14 Local Cable Free Systems
Local operation under 500 m to Gateway
Configuring the VibWire-108 for Data Transmission
Setting Data Transmission Rates
Setting Sensor Polling Rate
15 Antenna Installation
Typical Antenna solutions for 2.4 GHz Applications, Basic System Installation,
Directional Antenna Systems - External Mounting, Omni-directional antenna - External Mounting
16 Mesh networks, Network Operations
17 User Command Summary
18 GPRS Operations
Terminal Port & Hyperterminal Connection, GPRS Modem Configurations, Data Management
User Display & Speaker Unit
19 Database Operations
Data integrity Operations, Data Summary plots, Global Solutions, Local Systems
GPRS modem specifications
20 Example GPRS network configuration settings
Terminal Port & Hyper-terminal Connection
21 Serial Port to USB Communications
Active Comms Port
22 Serial Port to Ethernet Communication
Technical Specifications
23 Vibrating Wire Sensors
24 Vibrating Wire Sensor Applications
25 Case Study - Bore Hole Pump Control, Stand-alone Weir Control System with Data Logger

3
Add example of USB logging with example
Record data to a usb stick at 1 minute interval using 2 x VibWire108 instruments on an SDI-12 network to the Gateway data
recorder. Make sure the uSB adapter is connected to the Gateway.
Step 1 - Configuring the VibWire-108
There are 2 parameters needed to be set within the VibWire-108
when configuring operation with the Gateway or in fact any other
SDI-12 based device.
Number of Channels to scan (default =8) See page 17
Instrument ID number (0-9) (See Page 17)
Set ID number on the first instrument to 0
Set ID number on the second instrument to 4
Gateway Logger Parameters
Go the USB Data Recording menu options from the Gateway
menu system
1. Baud rate = 9600 (default) no need to adjust
2. MyFile.csv comma separated variable
User defined filename
3. Highest Column = K
For this example setting he Highest column to K represents
11 data values ie the 11th letter in the alphabet.
Column 1 = record number
Column 2 = Date
Column 3 = Time
Columns 4 - 11 representing data values returned from the
VibWire-108 instruments.
See Gateway Manual for full details.
USB Data Recording Applications
The VibWire-108 data can be stored to the USB memory stick
when used in collaboration with an SDI-12 network data recoreder.
The Keynes Gateway supports SDI-12 network and USB data
recording making it ideal for stand-alone permanent data recording
applications.
The Gateway and USB interface are both immersion proof and so
Suitable for operation in the harshest of environments. Should a
site flood then the instrumentation will still operate.
USB Data Recording
Data from a VibWire-108 can be stored directly to USB memory
stick using the Keynes Gateway data recorder with the USB
interface attachment.
Configuring VibWire-108 for USB Data Recording:
1. Set the number of channels to be scanned.
2. Activate the SDI-12 Port (See page 4)
The VibWire-108 only reports data for channels set to be scanned.
The lower the number of scanned channels the faster the instrument
responds and the lower the amount of power need for operations.
3. To store data to the USB data stick via the Gateway Logger
Using the 9 pin serial port on the Gateway and a teriminal program
on a laptop or other suitable programming device, configure the
Gateway to undertake the following operations:
A) Set the sample rate - typically 1 Scan / Min
B) Define the data table for storage for the Frequency &
temperature parameters
C) Assign storage as USB from the Gateway menu.
See
http://keynes-controls.com/2008/Downloads/GatewayManualV102.pdf
For full Gateway manual details.
Gateway Programming Options for USB Data Recording
1 Baud rate 9600 (Default)
2 Filename Prefix MYLOG (Name of file)
3 Highest Column AF (Last column in table)
4 Logging interval (mins) 1 (Data storage rate)
SDI-12 Configuration Parameters
Set the output to be SErAL -- serial port output. This will activate
the data to be sent out across SDI-12 network.
Channel Scanning
The lower the number of channels scanned on the VibWire-108
then the faster the instrument returns results and the lower the
amount of power required for operations.
VibWire-108
USB Flash Drives
1 - 8 Gb storage
Part No.
NP-GAT-USB-01
USB interface for Gateway
SDI-12 Network
Minimum VibWire-108 system
Suitable for USB data recording
Item 3, the highest column is the position in the Gateway internal
data table into which data is stored.
Once the USB adapter is fitted onto the Gateway and the unit is set
to record then information starts to be stored to the USB stick. The
VibWire-108 will be activated from the Gateway and powered off
between scans to save power. To replace the USB stick simply pull
and and swap with another device.

SDI-12 serial data transmitted
Earth
12V DC
12V DC
SDI-12 Serial Network Connection
Figure 7
Starting SDI-12 on the VibWire-108 Instrument Identifier
To activate the analogue output channels on the VibWire-108. Each instrument deployed on the SDI-12 multi-drop network
must have a unique instrument identifier set in order to identify
1. Starting at specific instrument on the network. For the SDI-12 network this
identifier is 0-9.
See Page 8 for details on setting the ID number.
2. Select “Menu In” button
3. Use the Up & Down Keys to select the option “Seral”
“Analg C0d C1d C2d C3d C4d C5d C6d C7d” are the other options available
Once the “Seral” output is selected the “Menu Out” key has to be pressed to confirm this option.
4. The VW-108 will return to the display
and now the SDI-12/RS-485 port for the instrument is now activated.
4
Earth
Earth
Earth
Earth
NPN-4
NPN-3
NPN-4
NPN-3
485 + / SDI-12
485 -
+ 12V
Gnd
The SDI-12 multi-drop network requires only 1 wire to be
connected between instruments for the communication of data.
This ensures that the installation and use of the SDI-12 network
very simple operation. The SDI-12 network has a limited range but
is ideally suited when connecting instruments together within an
enclosure or when systems are deployed locally.
Each instrument can have its own independent power supply but
must have the two dedicated network wires connected as shown
above in Fig 7. A unique instrument identifier has to configured in
order to access data from a dedicated instrument. Any data logger
supporting the SDI-12 network can obtain information from the
VibWire-108-SDI12.
Ensure that a good Earth
connection is made and fitted to
each instrument in order that
the lightening protection
discharge tubes will operate.
SDI-12 data on pin 4
0V or Ground
Pin 4 on each instrument are daisy chained together for SDI-12
operations
Starting Data Acquisition Operation on a 485 Network
To activate the SDI-12/ 485 output channels on the VibWire-108
1. Starting at
2. Select “Menu In” button
3. Use the Up & Down Keys to select the option “SErAL”
“Analg C0d C1d C2d C3d C4d C5d C6d C7d” are the other options available
Once the “SErAL” output is selected the “Menu Out” key has to be pressed to confirm this option.
4. The VW-108 will return to the display
and now the SDI-12/RS-485 port of the instrument are now activated.
Instrument Identifier
Each instrument deployed on the RS-485 multi-drop network must have a unique instrument identifier set in order to identify specific
instrument on the network. For the RS-485 network this identifier is 0-9 and a-z
See Page 8 for details on setting the ID number.
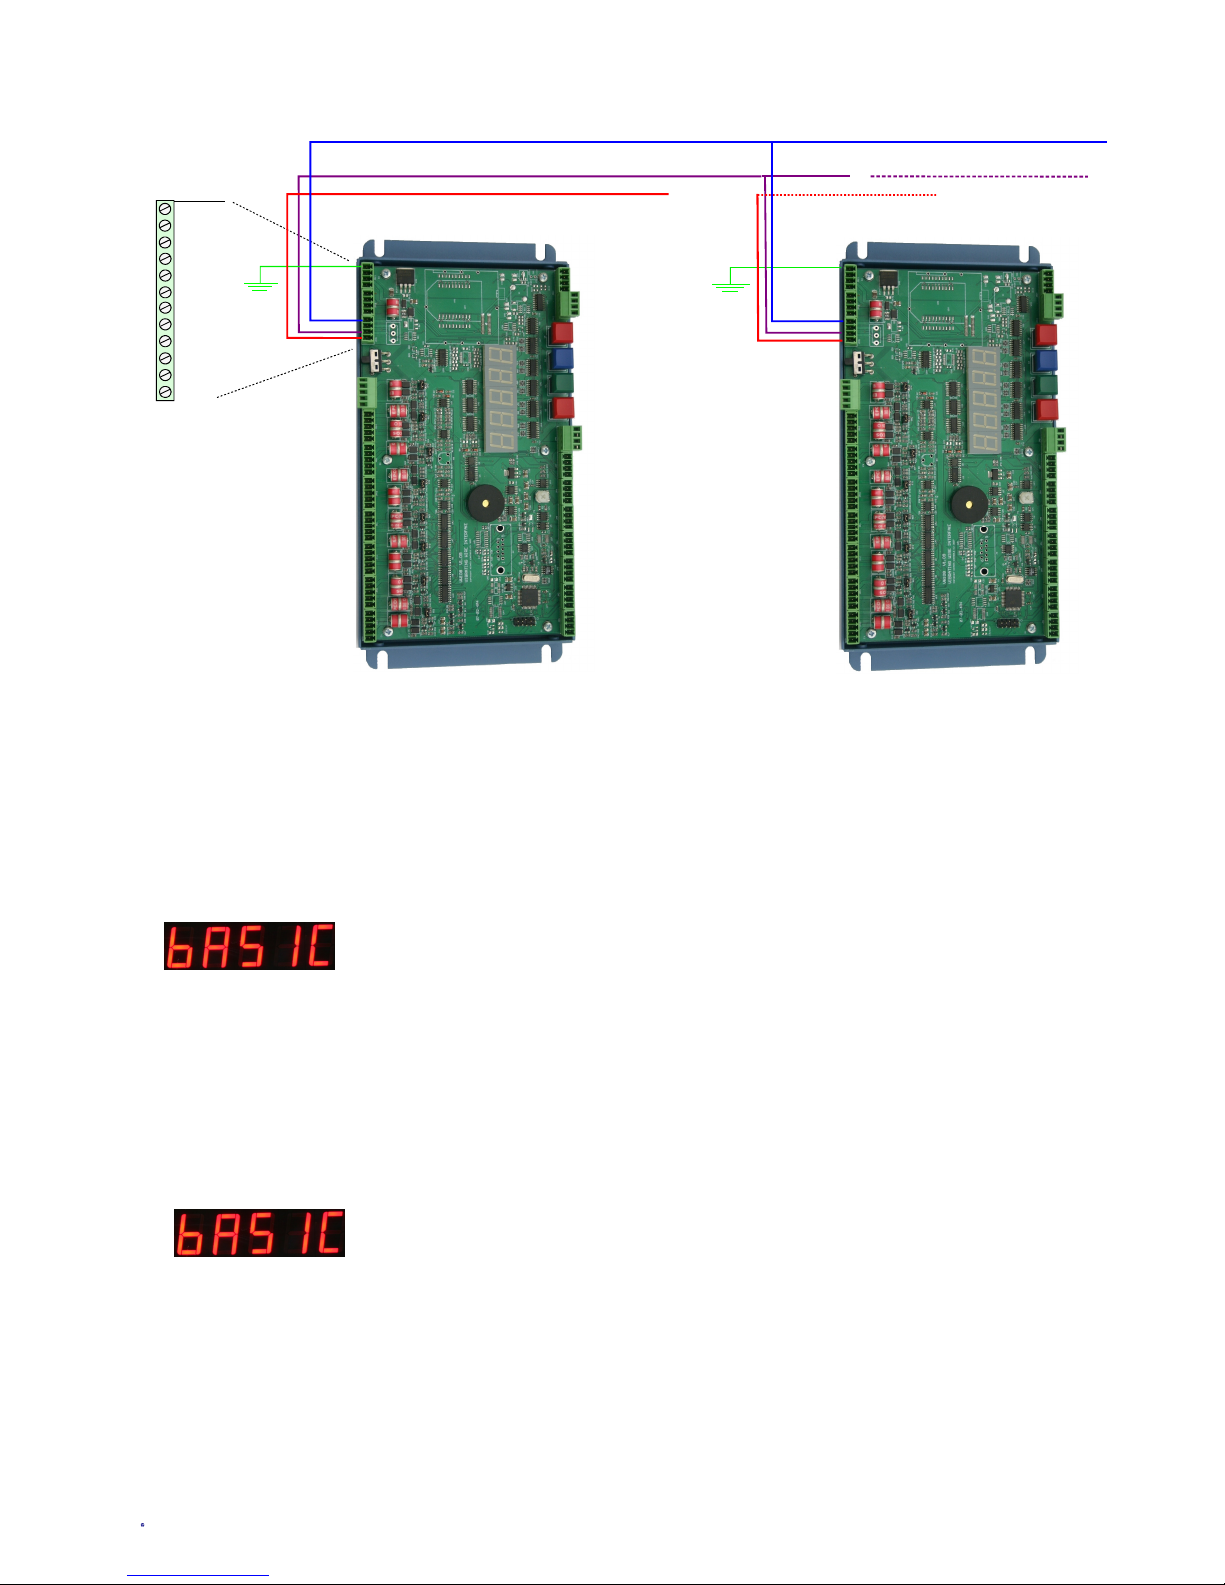
Earth, -RS485, +RS485 lines are connected in common to all units
RS-485 Serial Network Connections
Figure 7
Copyright Keynes Controls 2005- 2006 Release Version 1.06
12V DC
12V DC
RS485 - Common to all instruments
RS485 + Common to all instruments
Earth
Earth
Earth
Earth
NPN-4
NPN-3
NPN-4
NPN-3
485 + / SDI-12
485 -
+ 12V
Gnd
1
4
1 Gnd
2 Power
3 - RS485
4 + RS485 / SDI12
Control Signal Lines
5

VibWire-108 Serial Port Communications
The instructions below detail the operations to follow to operate the VibWire-108 across both the SDI-12 and RS-485 serial networks.
No sensor configuration details need be applied to the VibWire-108 when operating with the cable free transmitter, RS-485 or SDI-12
network. Simply connect the sensors to the interface as shown in Fig 2 and initiate the commands listed below.
Recommended Test
Use a single instrument only when undertaking initial measurements with a VibWire-108 on the RS-485 or SDI-12 network. This
simplifies the software and will speed up the understanding of the command used to obtain data. It is very easy to test the results
measured across the RS-485 and SDI-12 network with the ones shown on-board frequency display of the unit.
The results obtained across the RS-485 and SDI-12 network will be same as those shown on the display for a specified channel.
The default instrument address for a unit straight out of the box is 0
Issue command 0M! to start measurement operations. The VibWire-108 will scan all channels
0D0! returns items of data address data 4d1, data 4d1, data 4d1, data 4d1
Ensure that each instrument used on a network has a unique ID number assigned within its configuration in order to correctly identify
the data that is being recorded.
Command Structure and Operations Across An RS-485 Network
The VibWire-108 uses a command structure across the RS-485 network very similar to that used by the SDI-12 network in order to
simplify the overall system operations. Understanding the control of the instrument on one network be that RS-485 or SDI-12 will make
using the the unit on the other a very simple operation.
The RS-485 and SDI-12 network both operate at the same speed of 1200 baud.
Even though this is a relatively slow rate, as networks go, it is more than adequate for the small amounts of data transmitted by the
instrument.
No break characters are transmitted in an RS-485 command and any sent will be ignored by the instrument.
A short delay of approximately 10 ms is added between a command received by VibWire-108 and its transmission of data since this
delay is used to allow time for the host PC to turn off its transmitter when using soft-negotiation for data flow control operations.
Under normal RS-485 data transmission operations the RTS line on the serial port is used for flow control operations.
Keynes Controls recommends an RS-485 interface with Hardware negotiation is used to control the VibWire-108 across a network.
Timing Constraints RS-485 / SDI-12 Network
There are no timing constraints for the transmission of instructions and receipt of data across an RS-485 network compared to the
operations on and SDI-12 network.
Data Access Time
Typically the VibWire-108 takes 5 seconds to complete the scan of the first sensor and a further 3 seconds for any other sensor
connected to the instrument. The actual response time for the instrument is dependent upon number of sensor fitted and can interrogated
using the
RS-485/ SDI-12 Commands
The commands used by instruments on the SDI-12 and RS485 network are the same
In the following commands 'a' and 'b' are the address of the instrument and can only be integers 0 to 9 or the characters a - z.
where
'ttt' represents a time in seconds (0 to 999 seconds)
'n' or 'nn' represends a number of channels (00 to 99 channels)
\r and \n are the Carrigde Return and Line Feed characters - ASCII 13 and 10.
12 mS
8 mS
SDI-12 Data
Figure 8 shows timing delay used on SDI-12 serial bus
prior to sending data
Page 6

Start Measurement Commands
There are 2 separate commands supported by the VibWire-108 for initiating measurements across an RS-485 network and are named
‘aM!’ and ‘aC!’. Table 1 includes a complete description of the commands used by the VibWire-108
The ‘aM!’ starts a measurement and responds as soon as the data is ready to be transmitted from the instrument. This command returns
all instrument sensor inputs as a string
The ‘aC!’ command starts concurrent operations that are used to initiate measurements upon multiple instruments deployed across the
network. The ‘aC!’ command frees the RS-485 bus so that other devices can operate freely.
Initial Configuration
To setup a multi-instrument RS-485 network the ID number used to select an instrument on the network has to be adjusted from the
default factory settings. It is recommended that each instrument is individually configured before being deployed in order that there is
no confusion within the configuration settings.
Care is to be taken that each instrument to be deployed has a unique ID number to ensure that data is correctly identified.
The initial factory set ID number for each instrument is 0.
Table Of Commands
The following commands are all those supported by the VibWire-108 for use on the SDI-12 nad 485 multi-drop serial networks.
Additional Information
1 Strain gauge data is given as frequency in units (Hz) The RS-485 commands are almost identical in their
2 Temperature data is given in millivolts (0000.0 to 2500.0) format and use to those used on an SDI-12 network.
3 Communication ports Settings for SDI-12 & RS485 network. 1200 baud 8 bit no parity
Description Master VibWire-108 Response
Acknowledge active a! a\r\n
Send ID:
provided to complement SDI-12 protocol
aI! a13KEYNESCOVibWire-1080001\r\n
Part Description assigned by Keynes
Address query
identifies instrument address
and commonly used on single instrument
operations only.
?!
Used to make command set SDI-12
compatible
a\r\n
Where a = number 0 - 9 for SDI-12
0 -9 letters a - z for RS485
A - Z
change Address:
used to change instrument address from
default to new one for network operations
aAb!
a = initial address b = new address
b\r\n
a : b = number 0 - 9 or a - z
Start Measurement
instruct an instrument to make
measurement
aM!
a = address of instrument
example 0M! starts scan for ID 0
a0608\r\n
instrument with address a returns 8 x
vibwire & 8 x temp after 60 seconds
Concurrent measurement:
Used for polling multiple instruments on
a network to start to make readings. This
command frees RS-485 bus for other devices
aC!
start measurement instrument address a
a06016\r\n
initial response only after receipt of instruct and no response when data ready
to be sent.
Send data
data returned
aND! = Vib + Vib + Therm + Therm
and has same format for each command
aD0! aD1! aD2! or aD3!
aD0! = channel 0 and 3 VibWire Sens
aD1! = channel 4 and 7 VibWire Sens
aD2! = channel 0 and 3 Therm/analog
aD3! = channel 4 and 7 Therm/analog
+xxxx.x+xxxx.x+xxxx.x+xxxx.x\r\n
Copyright Keynes Controls 2005- 2006 Release Version 1.06
Page 7

Copyright Keynes Controls 2005- 2006 Release Version 1.06
8
Examples Of Using RS-485/SDI-12 Instructions
The following examples show how to undertake the various tasks needed to setup and make readings across the RS-485 and SDI-12
networks.
The
SDI-12 networks only supports up to 10 instruments with address range: 0 to 9
Changing the ID Number (address)
The following example demonstrates how to change the instrument ID number from the default factory setting 0 to 5.
Use the command ‘aAb’ where a = Start ID b = Final ID
master sends: ‘0A5’ Instrument responds 5\r\n Return New Line (5 representing new ID number)
ID Number Query
This command has been included to remain compatible with the SDI-12 and should be used for used with single instrument operations
only. Useful command when identifying ID numbers for instruments to be deployed on a multi-instrument network.
The example below is to show the ID number of a single instrument
Use the command ‘?!’ .
master sends:: ‘?!’ Instrument responds 3\r\n Return New Line (3 is the ID number)
Start Measurements On Distributed Instruments Upon A Network
The following example shows how to start measurements on instruments with ID numbers 2, 7, and 9 respectively.
For this example the instruments are instructed to start readings one at a time and the network is not freed up until each instrument
responds that the readings are being undertaken.
The instruments will start their measurement operations but will not send data across the network until instructed to do so.
Use the command ‘aM!’ where a = Instrument ID Number
Examples of use.
The following example is based upon a simple application of 3 x VibWire-108 units connected together on a local network. Unit 1 with
address 2 has 4 vibrating wire sensors, Unit 2 with address 7 has 6 sensors connected and finally Unit 3 has only 2 sensors connected.
master sends: ‘2M!’ Instrument responds ‘20144\r\n’ indicated readings available after 60 secs
followed by ‘2\r\n’ when the measurement is completed
7M! ‘70206\r\n’
‘7\r\n’
9M! ‘90082\r\n’
‘9\r\n’
Note. For this command the RS-485 network will not become available until each instrument completes its measurement cycle.

Start Concurrent Measurements on a Number of Distributed Instruments
The following example shows how to start measurements on multiple instruments deployed on RS-485 and SDI-12 networks.
Concurrent measurements ‘aC!’ differ from the ‘aM!’ command as they free the network after the initial command response to allow
other devices to operate. Concurrent measurements enable multiple instruments to respond faster to measurement commands.
The ‘aC!’ command initiates the measurement cycle within the instrument to start reading from the sensors however the data still has
to be requested from the VibWire-108 before being sent across the network.
Example of concurrent measurements for instruments with ID numbers 1, 6, and 7 respectively.
For this example the instruments are instructed to start readings one at a time and the network is not freed up until each instrument
responds that the readings are being undertaken.
The instruments will start their measurement operations as soon as the command is received but will not send data across the network
until instructed to do so.
Use the command ‘aM!’ where a = Instrument ID Number
master sends: ‘1C!’ - 4 sensors Instrument responds ‘10144\r\n’ indicated readings available after 14 secs
The network is free for other devices as soon as this response is returned.
‘6C!’ -3 sensors ‘60113\r\n’
‘7C!’ - 5 sensors ‘70175\r\n’
Read Values From The VibWire-108
No matter which instruction ‘aM!’ or ‘aC!’ is used to initiate measurement operations for the VibWire-108 has to be instructed to send
data when it becomes available. It takes the instrument 60 seconds to make sensor values available after being instructed to make a
measurement. The vibrating wire readings are in Units Hz. The Temp/Current loop input are in Units mV..
Use the command: ‘aD0!’ -- Vibrating Wire inputs 0 - 3
‘aD1!’ -- Vibrating Wire inputs 4 - 7
‘aD2!’ -- Temp/current loop inputs 0 - 3 (values in mV)
‘aD3!’ -- Temp/current loop inputs 4 - 7 (values in mV
Instrument responds: ‘a+xxxx.x+xxxx.x+xxxx.x+xxxx.x\r\n’ xxxx.x is the format of the number returned - 1 decimal place
for example to read all the sensor data back from an instrument with ID = 4
master sends: ‘4D0!’ Instrument responds: ‘4+1011.3+1204.4+1101.3+1190.7’ Vibrating wire data
‘4D1!’ Instrument responds: ‘4+1021.5+0000.0+1141.2+0000.0’ 0000.0 is returned when no sensor installed
Temperature/Current loop Data Format
‘4D2!’ Instrument responds: ‘4+0050.6+0056.1+0101.2+0000.0’ shows results with only 3 temp/loop values
‘4D3!’ Instrument responds: ‘4+0051.4+0058.3+0110.2+0015.3’
No Data is available Instrument responds ‘a\r\n’ or this example ‘4\r\n’
Note. The temperature values are in mV only. Thermistor linearisation is needed is convert the results into engineering values.
Copyright Keynes Controls 2005- 2006 Release Version 1.06
Page 9

Connection to an analogue data acquisition system
The following details show how to configure and optimise the VibWire-108 analogue outputs to operate with a analogue input data
acquisition system or logger unit.
Technical Specifications - Analogue Output Ports
8 x 0 - 2.5V DC single analogue output ports - 16 bit DAC
8 x thermistor outputs - 3.3 KOhm completion resistors
Theory of Operation
The VW-108 can be connected to an external data acquisition system or data logger
using the analogue output ports fitted onto the instrument. In order that the correct values
can be interpreted by the logger/acquisition system they are first scaled into a suitable
analogue signal by the VW-108 before being passed on for measurement. Each output
channel can be uniquely configured to support any manufactures sensor.
When defining the operation of the analogue output each channel has to have the sensor
operating characteristics defined. For the VW-108 this means that the minimum operating
frequency and span are set into the instrument.
Once the operating frequencies for the sensor are assigned the instrument scales the measured sensor frequency
over the range 0V = minimum frequency and 2.5V = maximum frequency.
Connection to an Analogue Input or Data Acquisition System
The analogue output ports are singles ended and as such,; care should be taken
When connecting to a differential input channel.
- Sense = 0V (single ended ) or -Vin (Differential Input)
+ Sense = +Vin
VibWire-108 Analogue Port Configuration
Low Frequency := 500 - 3000Hz defined in 100 Hz intervals
Range := 100 Hz steps.
Starting Analogue Output Ports
To activate the analogue output channels on the VibWire-108
1. Starting at
2. Select “Menu In” button
3. Use the Up & Down Keys to select the option “Analg”
“Serial C0d C1d C2d C3d C4d C5d C6d C7d” are the other options available
Once the “Analg” output is selected the “Menu Out” key has to be pressed to confirm this option.
4. The VW-108 will return to the display
and now the analogue output channels for the instrument is now activated.
Each of the vibrating wire sensor inputs can be individually configured. Setting the analogue output channel is only needed
when using the instrument with an external data logger or analogue acquisition system and is not required when measurements
are to be made across and SDI-12/RS485/RS232 digital serial network.
Menu-out
Down
Up
Menu-in
0V
- Vin
+Vin
+2.5V
0V
- Vin
+Vin
+2.5V
0V
- Vin
+Vin
+2.5V
NDACS Logger
+
Sense
-
+
Therm
-
+
Sense
-
+
Therm
-
User Control Keys
Page 10
Figure 9
The example shown in Fig 9 shows the analogue
output from the VibWire-108 connected to the
NDACS logger unit. The NDACS logger
supports a full differential input and so the
connection to any other logger or acquisition
system will be the same.

Optimising the Analogue Output Settings
Example 1
The VibWire-108 contains 8 independently configurable analogue output ports and they are used to represent the output signal
from the sensor.
Each analogue output is of the range 0 - 2.5V DC and any analogue output must scale a result to within this range
Care should be taken to ensure that the output signal is scaled as close as possible to sensor range
For example, Channel 0 is used to output a signal from a sensor with operating range of 1452 - 3176 Hz
It is not possible to set the output range of the DAC directly to represent the absolute range of the sensor and so it must be set
to cover the sensor range with the minimum overlap in order to obtain the highest resolution.
a range of
0V = 1400 Hz & 2.5V = 3200 Hz so CH0 LF = 1400 and CH0 RA = 3200 - 1400 = 1800 Hz
will give the highest resolution for this example
DAC Resolution output port = 16 Bit so Frequency Resolution = 1800 / 65536 = 0.03 Hz
in practice accuracy of around 0.5 Hz can be achieved when connecting the VW-108 to an analogue data acquisition system
after allowing for the losses due to the Digital-analogue and Analogue-digital conversion process. The 0.5 Hz measurement
accuracy is achieved using the NDACS loggers.
Only when operating the VibWire-108 with an active analogue output port need the operating characteristics for the vibrating
wire sensor be defined.
For general purpose operations the analogue output should be set to represent the full operating range of the sensor.
Integration to NDACS 6000 Logger
Example 2
A vibrating wire pressure sensor with operating frequency 400 Hz to 1000 Hz connected to channel 5 on the VW-108
and the analogue output is to be connected to an NDACS 6000 logger unit.
CH5 LF = 400 CH5 RA = 600 ( where range = 1000 - 400) and CH(0-7).RA is the range parameter.
the NDACS input channel range is to be set to 2.5 V
therefore 0V = 400 Hz and 2.5V = 1000 Hz
The NDACS will use the ‘Scaled Current’ process option A = 1 B = 0 C = 2.5 D = 400 E = 1000
The data logger will scale the results over the full range Resolution = 600/65536 = 0.01 Hz
I
n practice an measurement accuracy of 0.05 Hz will be achieved after allowing for losses in the analogue conversion process.
Page 11

Real-time Frequency Display
All of the VibWire-108 models contain a 5 digit 7 segment display and this can be used to display the instantaneous frequency from any
of the vibrating wire sensor inputs.
Sensors can be deployed a considerable distance from the sensor interface and may well be have been embedded into a structure. To
ensure that the sensors are operating correctly simply observe the sensor operating frequency and then confirm the result is within the
operating range as specified by the manufacturer.
When operating in a real-time mode the instrument frequency display responds instantly to effects upon the sensor.
To use the VibWire-108 as a real-time frequency display follow the instructions below:
Assigning Real-time Frequency Display
To activate the real-time frequency display
1. Starting at
The “Basic” menu item is the first menu item available after the instrument is powered on.
2. Select “Menu In” button
3. Use the Up & Down Keys to select the option
The Display above shows the option required to place Channel 0 for real-time frequency output
the other options available are:
“Analg Seral C0d C1d C2d C3d C4d C5d C6d C7d” C0d = Channel 0 ........ C7d = Channel 7
Once the “C0d” option is selected then the “Menu Out” key has to be pressed to confirm this option.
4. The VW-108 will now display the real-time sensor frequency for channel 0.
The above example shows a typical real-time frequency result .
Sensor problems
Should a clean ping not be heard when the vibrating wire strain
gauge is being sampled by the instrument the following guide
should help.
1) If there is only random noise on the speaker for the defined
channel then check the wiring and circuit resistance. The most
common error is an open circuit. Locate and fix the broken
cable.
2) If a ping can be heard but it is faint then the sensor cable may be
too long, or a to high cable resistance is being used causing
degradation of the signal amplitude. Finally the gauge
sensitivity may be to low.
3) If the ping is not a pure tone then the gauge is possibly faulty.
The gauge may have become damaged during installation.
4) If a low frequency hum is heard then noise pick can be a
problem. If the gauge cabling is routed near a transformer,
electric motor, high current power cables, etc, then relocate or
reorient the gauge for minimum pickup. Ensure that only
shielded cable is used and that the shielding is terminated at a
single point to prevent capacitive pickup.
Loud Speaker
Page 12
All of the VW-108 range of instruments are supplied with an
internal ceramic speaker. The speaker can be activated and the
sensor ping and resultant echo can be heard.
The speaker used in collaboration of the frequency display should
enable nearly all sensors to be tested no matter their location using
only the VW-108 interface unit.
Figure 10
Loud Speaker
On/Off Switch
Frequency
Display
Speaker

Vibrating Wire Sensor Installation
The vibrating wire sensors are connected directly into the Sensor Input channels on the VibWire-108 and supports full 4 wire gauge
sensors. The instrument contains a completion resistor for the thermistor sensor enabling the temperature reading to be made along with
the vibrating wire sensor readings.
Connection to the instrument is as follows:
Earth
Earth
Earth
Earth
Amoured Cable
Sheath
+
Sense
-
+
Therm
-
+
Sense
-
+
Therm
-
Analogue Outputs
Sensor Inputs
Common Earth/Gnd Points
In order to ensure that there are sufficient points to terminate sensor
sheathing when amoured cable is used to connect a sensor to the
VibWire-108 the following terminal points are internally wired in
common:
Earth
Earth
Earth
Earth
Gnd
On the power supply connection terminals
Therm Sense -
on both the sensor input and analogue output terminals.
Fig 14 shows how the channels are wired together to form common
earth connection. Effectively all of the Earth, Gnd, S
ense
- and T
herm
- terminals are wired together.
Any earth Sheathing from armoured cable etc.. can be connected to
any of terminals mentioned above for ease of installation.
Lightening Protection
The lightening protection within the VibWire-108 cannot protect
the instrument from a direct lightening strike. It is used to protect
the instrument from local ground strikes close to the sensors and
cabling.
All of the sensor inputs are protected by transorb and gas discharge
tubes. The transorb are high capacitance devices and are not used
on all systems as they can distort low level signals to a point where
the instrument can not be accurately measured. The transorb does
protect the instrument at lower levels than the gas discharge tube,
and starts to become active around 12V.
The gas discharge tube protection activates at around 92V DC and
resets instantaneously after
Fig 14 shows the VibWire-108 connected to a system earth using
the Earth terminators mounted adjacent to the power connectors.
+
Sense
-
+
Therm
-
VW-108
Thermistor
Multiple Instrument Installation
Figure 16 shows how to Earth multiple instruments within a single
enclosure. Ensure that good quality cable of around 2.5 mm
diameter core is used to connect the instruments earths together and
that a good connection to a main system earth is obtained. The
Earth connection is essential for the lightening protection to work.
Figure 11
Figure 12
Figure 13
Figure 16
PCB Jumper Settings
All of the VibWire-108 models support
thermistor, analogue input for the range
0 - 2.5 V DC and current loop inputs.
For current loop operations such as
those 0- 20 mA, 4- 20 mA then external
excitation is required.
Jumper Open = 0-2.5V DC
4-20 mA loop
Jumper Closed = Thermistor
PCB Jumpers
Figure 15
Figure 14
Menu-out
Down
Up
Menu-in
Earth
Earth
Earth
Earth
Earth
Earth

Local Cable Free Systems
The VibWire-108 uses the Gateway communications interface and a ZigBee modem to create a mesh network solution. Single
instruments as as multiple devices can be combined to create a fully integrated solution. Data from the VibWire-108 or in fact any other
instruments on the SDI-12 network is stored within the Gateway prior to transmission across the network. When using the Gateway
nearly any 3rd part radio modem can be used.
Fig 17 - VibWire-108 with Zigby interface
Local Operation - Under 500 m to Gateway
The VibWire-108 mounted in a plastic or GRPS IP65 enclosure as
shown in Figure 17A with the antenna mounted in effective line of
site to the data logger or Keynes Gateway systems will operate to
a range of approximately 500m. Depending upon conditions at the
deployment site it is possible to get greater distances than 500 m so
long as there is little interference or no obstructions to the signal
path.
Mesh Network Operations
The mesh network operation is a feature of the ZigBee modem and
is not part of the Keynes Software. Simply installing a ZigBee
modem to the Gateway will give a system the full benefits of this
type of network operation.
Cable Free & Mesh Network Solutions
The VibWire-10 can be group together with other instruments or
used singularly onto a mesh network or any other type of local
cable free network using the Keynes Gateway Data Logger.
The Gateway is configured to record data from the VibWire-108
and then can be set to broadcast the results continually at a set time
to save power.
Mesh - ZigBee Network Configuration
For mesh network operations the only configuration parameters
that needs to be set for VibWire-108 are:
1. Number of channels to Scan / Instrument (see Page 17)
2. Instrument Identifier number (See Page 17)
The VibWire-108 needs about 500 mS to boot before a Scan
command will be activated.
Once all the instruments are connected on the SDI-12 network to
the Gateway and the unique ID numbers are set then scanning
operations can take place.
Allow
Power Up = 500 ms (Gateway Config Parameter)
For the VibWire-108 to settle after being initialised before starting
a scan. The Gateway stores all the acquired data and is configured
to broadcast the results across the mesh network.
The ZigBee network operations are a feature of the modem only
and not part of any Gateway itself. The Gateway only passes data
to the ZigBee modem. The ZigBee modem controls the mesh
network operations transparently.
Example. Two VibWire-108 instruments are connected to a
single Gateway interface to create a 16 channel sensor system to
transmit data on to a ZigBee mesh network. The scan rate to 1
reading each minute.
VibWire-108 Configuration
1. Set the Number of channels to Scan to 8 for both instruments.
2. Set ID = 0 for instrument 1
ID = 1 for instrument 2
SDI-12 Setup - Data Acquisition Rate
The acquisition rate is controlled by the interval used to send the
start measurement commands to the instruments on a network.
Using SDI-12 Setup menu option within the Gateway
Sample Interval (seconds) : = 60 (1min) or 3600 (1Hr)
The Gateway issues the !m command and waits for the ViBWire108 to respond. Once the data is ready it is stored into the data table
of the Gateway prior to transmission across the network.
Full details are within the Gateway Manual
14
Figure 17 above shows the VibWire-108 as a single instrument
solution in collaboration with Gateway Interface.
Fig 17A Complete 8 channel vibrating wire sensor system
VibWire-108
Gateway
GPRS Modem
SDI-12 connection
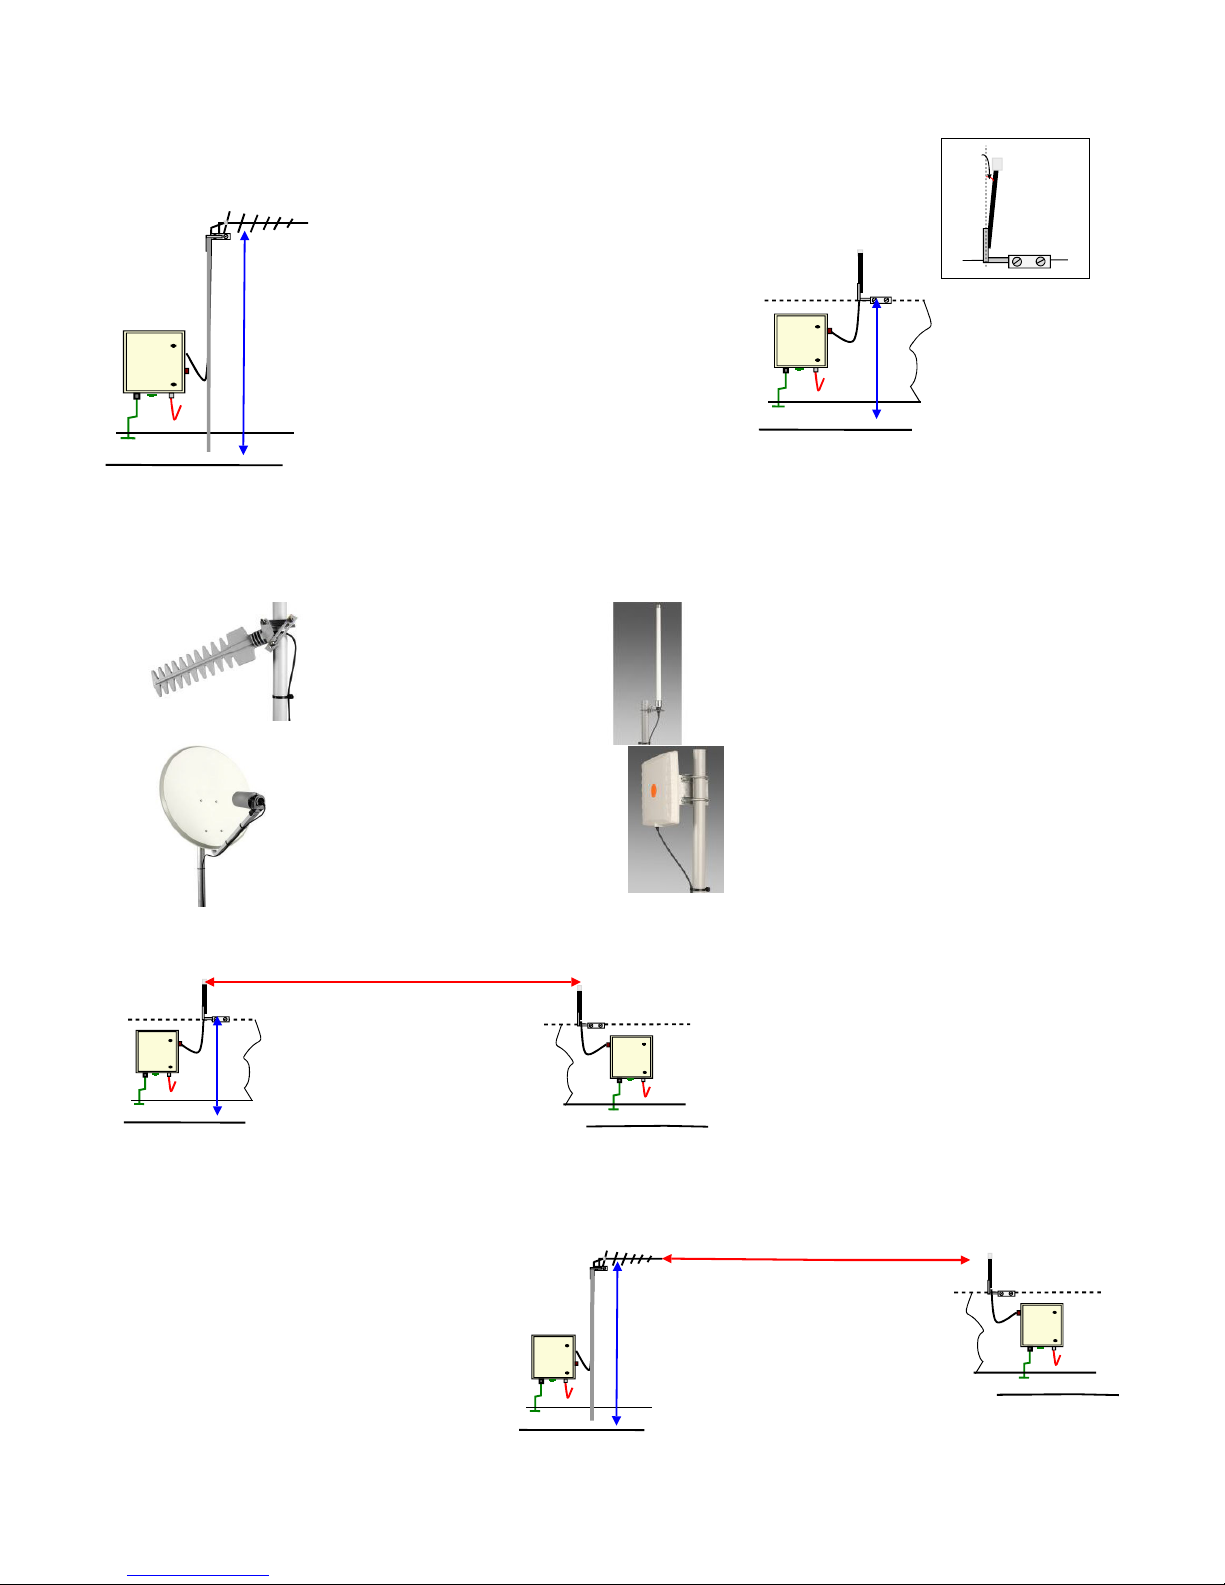
1 m
1.5 m
For the best results the directional antenna
should be located away from any nearby
objects and greater than 1.5 m above the ground
1 m
800 m - 1 km line of sight ra nge
3 - 8 dB gain
omni-directio nal
antenna
1.5 m
1 - 2.5 km r ange
depending antenna gain and keepin g
antenna in lin e of sight o f each other .
7 - 27 db G ain
directional
antenna
Antenna Type
Dish
Frequency
2400 - 2500 MHz
Gain
9 dBi
20 dBi
25 dBi
Polarisation
Vertical
Beamwidth
(Azimuth / Elevation) 60° / 60°
Antenna type
YAGI
Frequency
2400 - 2500 MHz
Gain
13 dBi
Polarisation
Linear
Beamwidth
(Azimuth / Elevation) 44° / 48°
Product code
OMNI-A0050
Frequency
2400 - 2500 MHz
Gain
8 dBi
Polarisation
Vertical
Beamwidth
(Azimuth / Elevation) 360° / 16°
Antenna Type
Panel Antenna
Frequency
2400 - 2500 MHz
Gain
14 dBi
Polarisation
Linear (Vertical or Horizontal)
Beam width
(Azimuth / Elevation) 43° / 43°
Typical Antenna Solutions for 2.4 GHz Applications
3 Deg
Antenna Installation
In order to achieve the optimum range or the highest signal strength
for the chosen antenna systems then care has to be taken with the
choice and deployment
Basic System Installation
Omni-directional antenna - external mounting
For instruments that are deployed fairly close
together and in clear line of sight of each other
then omni-directional antenna systems will be
ideal for data transmission. Omni-directional
antenna systems are the simplest install and
maintain.
For optimum range mount the antenna clear of
any object and about 1 m above the ground. Any
change in this deployment will degrade the
range and this degradation will depend upon the
environmental conditions prevailing at the site.
Directional antenna Systems - external mounting
Directional antenna offer increased range for the
same transmitted power by restricting the
transmitted signal to a specified direction. In order
to get the best results it is important to keep the
antenna clear of any local metallic objects above
the ground. Deploy the antenna about 1.5 m above
the ground and make sure any mast system being
used is firmly installed.
Ensure that the directional antenna is pointing
absolutely at the data logging system antenna and
that the polarisation between remote systems is the
same ie. Vertical-to-Vertical or Horizontal-toHorizontal polarisation.
Figure 18
Figure 19
Figure 20
Figure 21
Circular polarised antenna systems are the only type that should be
use when systems with mixed polarisation antenna are to be used
together.
For optimum range tilt the standard omnidirectional antenna 3 deg from the
vertical in the directional of the receive
unit
Keep the antenna 1m above the ground
and free from any close objects.
Antenna systems available from
Round Solutions GmbH & Co KG Im Steingrund 3, D-63303 Dreieich, Germany
Tel: +49 (0) 6103 960510 Fax: +49 (0) 6103 960509
www.roundsolutions.com
Node
1
Node
2
Node
3
Node
4
Node
6
Node
5
Data Recording
Outstatio
n
550 m
6
5
0
m
6
5
0
m
7
0
0
m
550 m
Node 1
Node 2
Node 3
Node 4
Node 6
Node 5
Data Record ing
Outstation
550 m
6
5
0
m
550 m
16
Internally Mounted antenna within IP65 enclosure
0 m - 300 m line of sight range
3 - 5 dB gain
omni-directional antenna
GRP or Plastic
IP65 enclosure only
Earth Termination
The VibWire-108 supports direct
connection of a number of the smaller
omni-directional antennas
These antennas can be fitted within
the IP65 enclosure but it is essential
that this enclosure must be GRP or
plastic in order to minimise any
signal attenuation.
The range is reduced compared to
externally mounted antenna but
installation is considerably reduced.
Earth
Termination
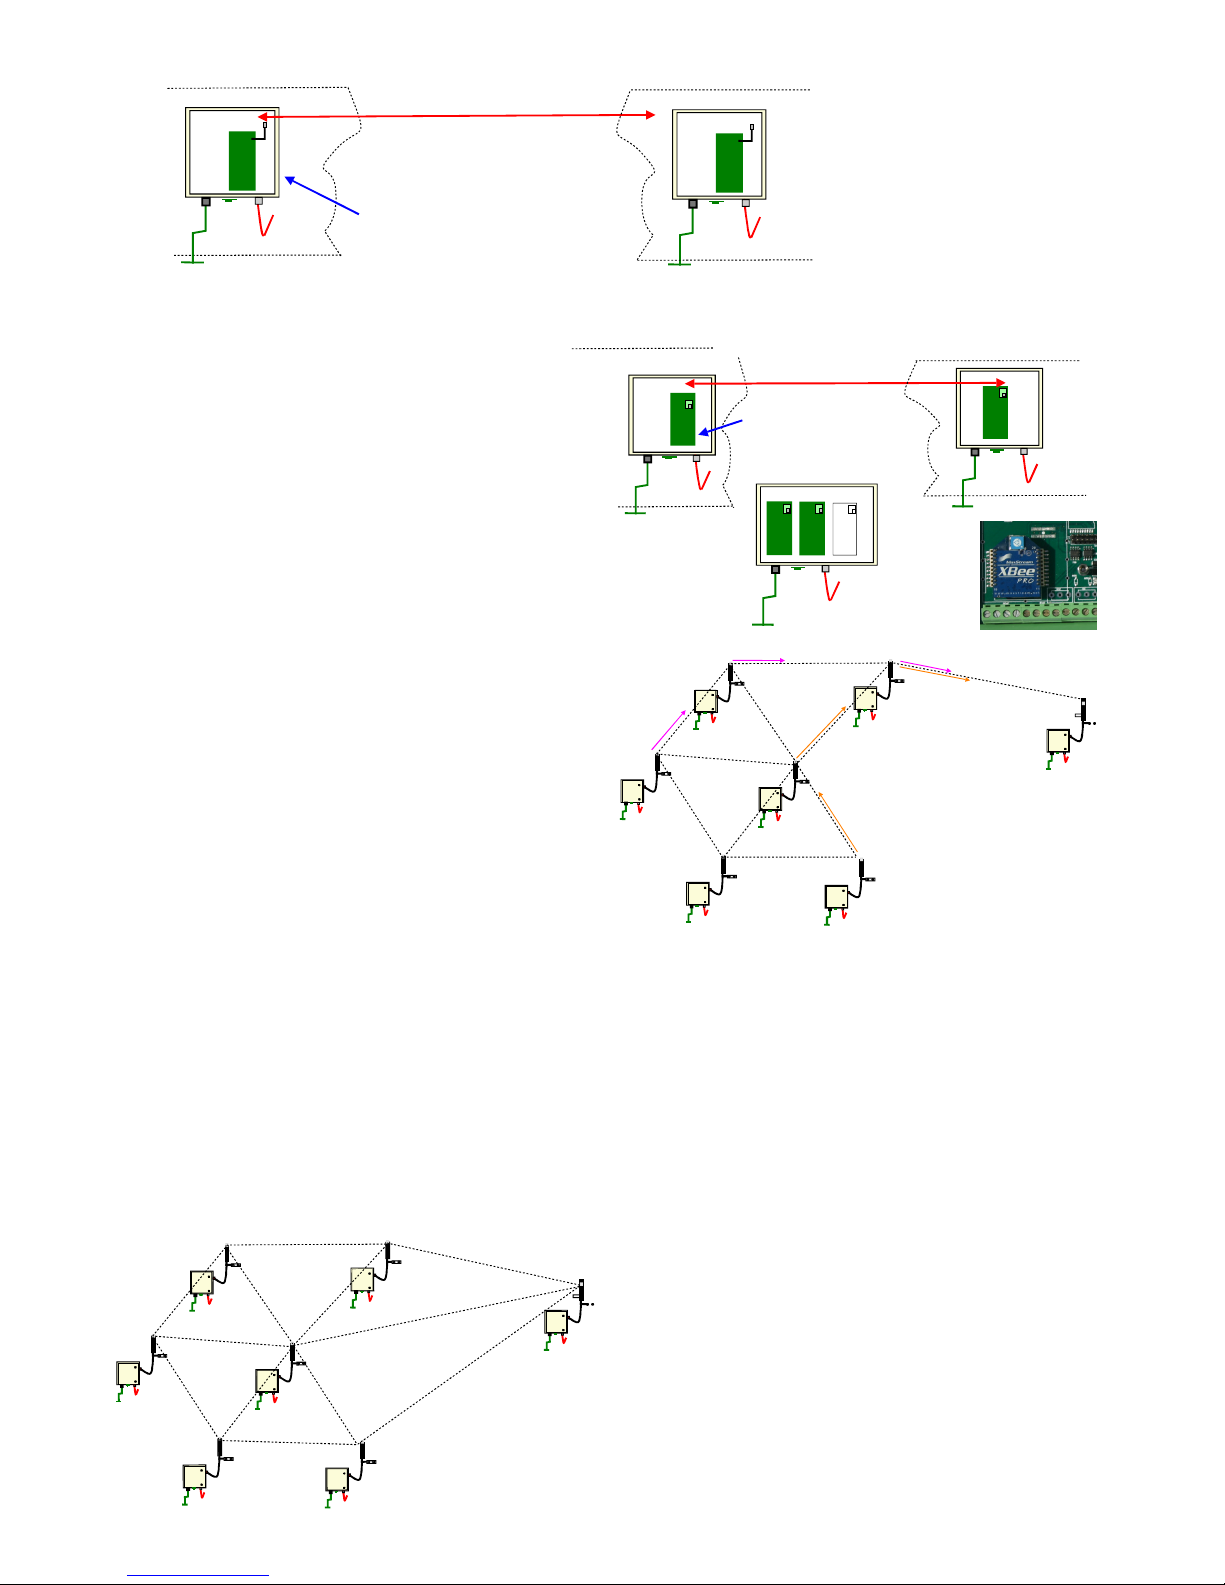
0 - 15 m line of sight range
GRP or Plastic
IP65 enclosure only
Internal Embedded Chip Antenna
For systems deployed within a 15m line of sight or when local
expansion of a instrument box is required then a VibWire-108
system with local cable free interface should be used.
A number of cable free instruments can be mounted within a
single enclosure and configured to operate as a mesh network.
An additional instrument is easy to add as all that is required is
to power the unit and connect in the sensors.
Chip antenna systems only operate over very small distances
but have the advantage that the antenna fits on the instrument
PCB see Fig 23A.
Mesh Networks
(available last quarter 2006)
Networking
Spread Spectrum Type: DSSS (Direct Sequence Spread Spectrum)
Networking Topology: Peer-to-peer, point-to-point & point-to-
multipoint
Error Handling: Retries & acknowledgements
Filtration Options: PAN ID, channel and addresses
Channel Capacity: XBee: 16 Channels
Addressing: 65,000 network addresses available for each
channel
Encryption: 128-bit AES (coming soon)
General
Frequency Band: 2.4000 - 2.4835 GHz
Data 250,000 bps
Industrial (-40 – 85° C) temperature rating
U.FL RF Connector, Chip or Integrated
Whip antenna options
Fig 23A
Network Operations
The transceiver unit embedded within the VibWire-108 can used
for direct point-to-point communications as well as forming a node
within a mesh network.
For Point-to-Point communications each instrument talks directly
to the data recording outstation. A mesh network routes the data
from one instrument to the next until it reaches the data recorder.
The Keynes Controls Gateway products are fully integrated to the
VibWire-108 and can be used as a cable free data recorder, an
interface between the mesh network, GPRS mobile phone and local
area networks.
The mesh networks operate by routing data between one node and
the next until it reaches the desired location. The mesh network can
also correct for data path loss so long as another route can be found.
Fig 24 shows a simple mesh network with multiple nodes. Upon
occasion when the direct link between Node-1, Node-6 and the
Data Recording Outstation fail then data can be routed
automatically via Node-5. This operation ensures that data
communication remains very reliable even different sections of the
network are blocked. Fig 25 shows the mesh network operational
with new data route.
Fig 24
Fig 25
Figure 22
Figure 23

Basic
Disp
PEROD
ID
Tra
Tra.int
CH0.LF
CH0.RA
CH1.LF
Menu-up & Down
Analg
Activate analogue outputs
SDi12l
Activate SDI-12 or 485 ports for data
C0d
Channel 0 Real-time results display
C1d
Channel 1 Real-time results display
C2d
Channel 2 Real-time results display
C3d
Channel 3 Real-time results display
C4d
Channel 4 Real-time results display
C5d
Channel 5 Real-time results display
C6d
Channel 6 Real-time results display
C7d
Channel 7 Real-time results display
Per
Freq
Pst
1S
5S
15S
1MIN
1HR
6HR
24HR
ID Range
0..255
1S 0T
2S 0T
4S 0T
8S 0T
1S 1T
2S 2T
4S 4T
8S 8T
5 S
60 S
360 S
500
600
700
800
900
1000
1200
1400
1600
1800
2000
2200
2400
2600
2800
3000
100
200
300
400
500
600
700
800
900
1000
5000
Menu-in & Out
Per = Period Freq = Frequency in Hz Pst = Percentage of range
Sensor activation period
Instrument identifier = 0 - 255
Select number and type of sensor output for data
transmission when operating in cable free mode
Updated rate for transmitted data
Analogue output scaling only
Low frequency
Vibrating wire sensor
Frequency range
DISP := This option is used to select the type of engineering
results that are shown on the 7 segment display.
Per = 1/ Freq = period of oscillation in milli Sec
Freq = XXXX.X in Hz
Pst = Percentage of range
the percentage of range is used to optimise the settings
for the analogue output port in order to achieve the best
result
Example. A vibrating wire sensor showing a PSt = 0.1 on the
display and settings of LF (Low frequency) of 500 Hz and range
of 2000 Hz. This indicates that the results from the sensor is only
operating over the lower 10% of the defined range i.e 500 - 700 Hz
For the assigned range above the analogue output port has a scaling
of 0 - 2.5V DC using a 16 bit DAC (65536 levels) and will therefore
have 0V = 500 Hz & 2.5V = 2500 Hz, so
resolution = (2500-500)/65536 = 0.03 Hz.
However with the instrument adjusted to operate over the range of
500 to 700 Hz as observed above then
0V = 500 Hz & 2.5V = 700 Hz so resolution = 200/65536
= 0.003 Hz
PEROD := Sensor Excitation Period
This option defines the update period for the sensor excitation and
measurement operation. There is always a trade off between the
sensor update rate and the power supply requirements of the
instruments.
For fast dynamic changes a fast sensor update rate is required but
for slow static measurements only a low update rate is required.
User Command Summary
PEROD := Sensor Activation Period
Defines the sensor scan period for the instrument.
When fitted the analogue output channels are updated after
each scan.
1S, 5S, 15S, 1min, 1Hr, 6Hr, 24Hr.
ID := System identifier number
Each instrument requires a unique identification number
that is required to locate a specific instrument upon a
network. Currently the identifier is an integer of range 0 ..
255 offering a maximum
TRa := Transmission Data Options. (Not used RS485/SDI-12)
To optimise the network bandwidth in order to ensure the
maxium number of sensors can be deployed the User is
allowed to select the number and type of sensor inputs used
on the VibWire-108 for data transmission across a network.
1S 0T represents 1 vibrating wire sensors - no temperature
2S 0T represents 2 vibrating wire sensors - no temperature
1S 1T represents 1 vibrating wire sensor - 1 temp sensor
2S 2T represents 2 vibrating wire senors - 2 temp sensors
Tra.int := Defines the rate of data transmission across a cable free
network.
The transceiver fitted inside the VibWire-108 is
powered on during the data transmission operation and
powered off into a sleep mode between updates.
The faster the data transmission rate the greater the
power required to drive the instrument. A compromise
is needed to adjust power requirements to the amount
of data to be transmitted to guarantee that not readings
are lost.
(Not used on RS485/SDI-12 networks)
5S, 60S, 360S
(Operations of Version 1.06 instruments only)
17

Network Transmission Costs
There are no unexpected costs associated with operating the VibWire-108on a network as the Gateway supports both Pay-As-You-Go and contract
SIMMS within the modem for most major network suppliers.
Data transmission per scan is as low a 5K so it is easy to obtain the best
price plan on Pay-As-You-Go operations and the correct contract SIMM
agreement to minimise contract costs. What ever option is taken the User
determines how much data is transmitted.
Data Management
Each of the instruments is identified by an assigned name and its
information stored into a database. Once the data is being recorded it can
accessed and processed to produce reports, plots and trends and even
shown on a web page within a 3GL mobile phone.
User Display & Speaker Unit
During installation a User can observe the sensor frequency directly within
the on-board display. For sensors deployed a long way from the
instrument, embedded into a structure or down holes then a useful feature
to determine if the vibrating wire sensors are operating correctly is simply
to listen to the returned sensor signal. Should the signal be a tone then the
sensor is functioning. However should this signal be very distorted then it
shows clear signs that the sensor has malfunctioned. Both a frequency
display and embedded speaker are standard parts of this instrument.
Process Measurement Solutions
18
Group of instruments on local network connected to a mesh network
VibWire-108
NP-ANG-108
VibWire-108
SLAVE - 2 SLAVE - 10SLAVE - 1
SDI-12 network
GPRS modem
Telit GT-863-PY Modems
Telit GM862/3/4 modules
Part No.
NP-GT-863-PY
Power Supply Management
The Gateway not only controls the communications across the
SDI-12 network but also controls power management for the
modem or radio interface. The Gateway powers off third party
systems such as the GPRS modem when not in use to save power.
Single & Multiple Instrument Operations
The VibWire-108 uses the Keynes Gateway to communicate across
the GPRS network. The VibWire-108 communicates data to the
Gateway across a local SDI-12 bus.
Single instrument operations the VibWire-108 ID = 0
For multiple instrument operations each VibWire-108 must have a
unique ID number defined. Failure to define a unique ID number
will result in corrupt or unreliable data.
GPRS Operations
The VibWire-108 connects to the GPRS network vai the use of the
Keynes Gateway interface or any other data logger that supports
modem operations.
The Gateway acts as a control interface for the VibWire-108. It
controls the acquisition of data and stores the results for
transmission. When a number of instruments are in use the data is
gathered into a single record in a table for transmission across the
network. Information can be sent straight away or buffered for later
upload.
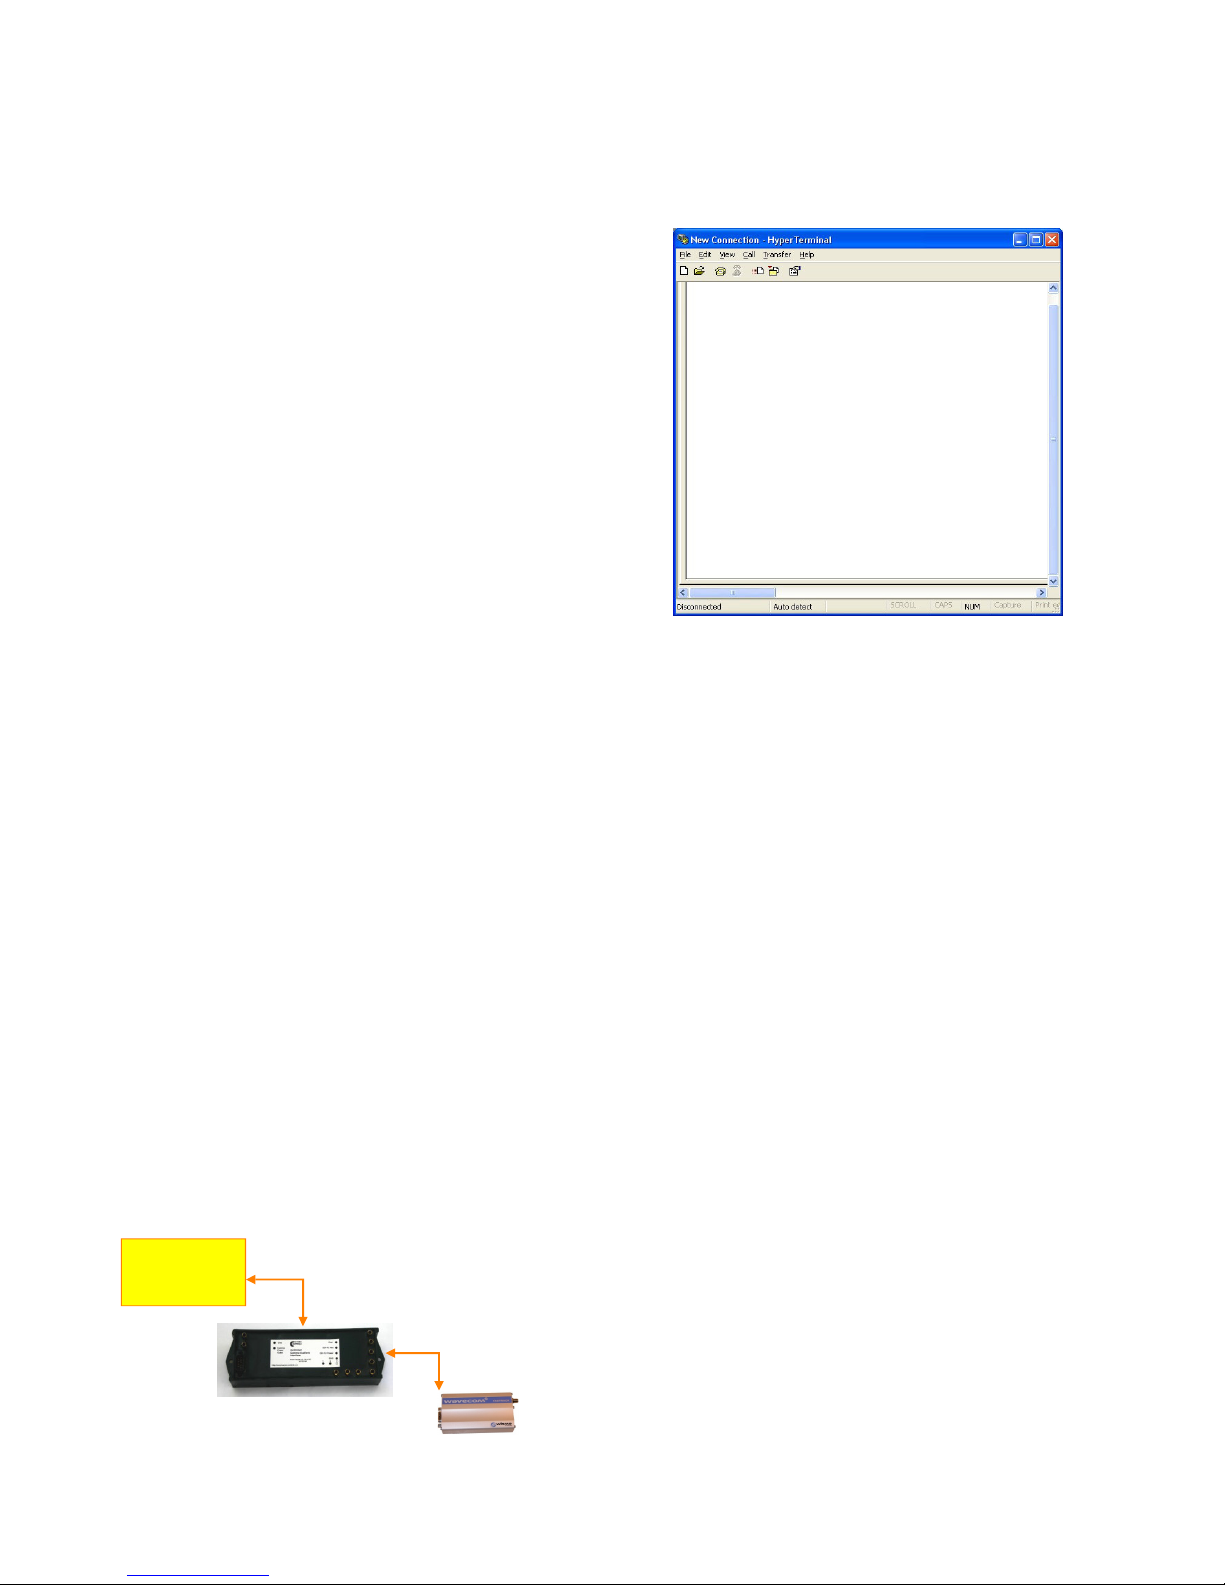
Terminal Port & Hyper-terminal Connection
The Gateway is configured using a terminal emulator program and
a serial port connection to a laptop or PC. The serial port on the
Gateway is configured by default to be:
9600 Baud
8 Data Bit
No Parity
1 stop bit
A 9 Pin RS232 cross over cable is required to connect the Gateway
to a laptop/PC serial port.
For full details see the Gateway manual.
See http://www.keynes-controls.com/2008/Downloads/GatewayManV101.pdf
The RS-232 port on the front of the instrument uses a standard 9
pin D connector modem cable to connect to a PC.
Modem Configuration For GPRS Network
The following parameters are all that need be assigned in order to send data
from the Gateway across the network and all set using the terminal port.
The VibWire-108 connects to a GPRS network as shown in Fig X above
APN (access point number)
Username
Network Password
IP Address (instrument gateway)
Instrument Tag name
Data Storage Operations
Data is stored within the Gateway prior to transmission across the
GPRS network and can be set to transfer data at a pre-set time or
immediately upon being acquired.
In the unfortunately condition that the GPRS network fails then
data is stored with in the Gateway until it can de accessed by the
User, or when the GPRS network becomes available when a new
download can take place.
Data Transmission Rate on GPRS Network
The interval for sending data cross the GPORS network is defined
within the Gateway by:
GPRS Menu
Default connection interval (hrs) = 1 ( 1 hr)
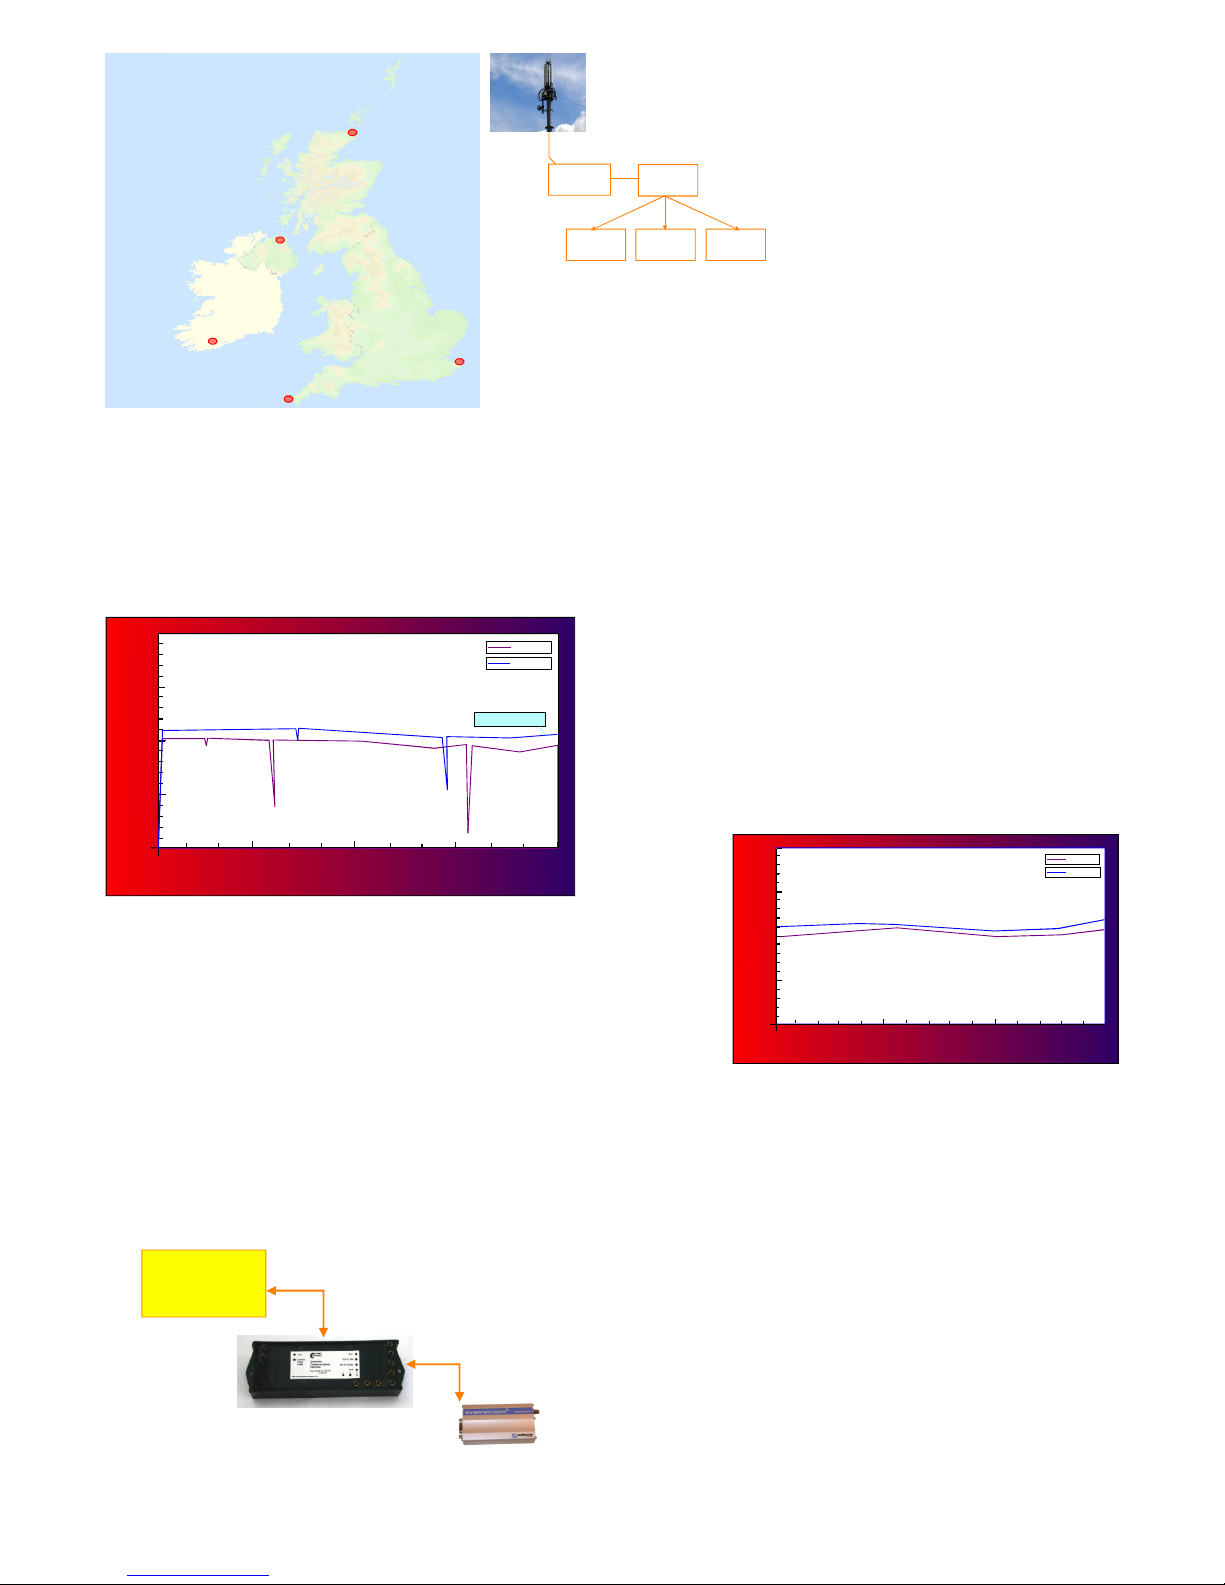
Global Solutions
For widely distributed systems with instruments deployed anywhere
within a GPRS network then only a Internet connection will be required to
gather information from the instruments no matter where they are located
and how they are deployed. Instruments can be deployed globally and all
the information easily brought back to a single location for storage and
processing.
Local Systems
The database software can be integrated to locally deployed instruments
and can be used as the data logger in many applications. It is best deployed
when there is a secure fixed site with adequate power is available on a
stand-alone dedicated computer system
The most practical method of integrating the database to the locally
deployed instrument systems is by reading transmitted data from across the
local networks and these can be any combination of SDI-12/RS485 serial
port networks, Ethernet and Cable free 2.4 GHz cable free mesh network.
GPRS/GSM Modem Specifications
•
Dual Band 900/1800 MHz GM862-GPRS
• Quad Band 850/900/1800/1900 MHz on
GM862-QUAD
• Output Power: Class 4 (2W) at GSM 900 MHz
• Class 1 (1W) at GSM 1800/1900 MHz
• Integrated SIM card reader
• ROSH compliant
• Operating temperature range -20 to +70 Deg C
• Automatic network identification
• Automatic connection
• Remote network data services
• 50 Ohm antenna termination
• Antenna connector - SMA/M
• Pay-as-you-go SIMM card data services
Figure 30 shows everything needed to get 8 channels of vibrating wire sensors onto
a GPRS or 2.4 GHz cable free network. The solar panel shown is a 6W cell and this
with the battery backup will give 1 reading per hour indefinitely. For short periods
the scan rate can be increased for faster sampling.
Flexible Data Scan Operations
The Gateway scans the VibWire-108 instruments
and transmits the data across the GPRS network at
a specified rate and goes into stand-by mode
between scans to save power.
Standby - Power Saving
The Gateway goers into standby mode in between
scans. The VibWire-108 and the modem are
powered off until needed.
Machine
Gateway
SQL
Database
Generate
Reports
Archive
Results
Web Based
Reports
Mobile Phone
GPRS/GSM network
connection
06:00
12:00
18:00
23:59
GPRS Operations
The VibWire-108-GPRS enables true cable free
operations to be undertaken any where that a mobile
phone network exists and when used in collaboration
with the Keynes network database systems.
Information can be gathered and stored into a single
database for many instruments deployed upon the
GPRS network so long as suitable Internet connection
can be made. No longer does a databse have to be
located near to or directly connected to the instruments
making the measurements.
Database Operations
The Keynes Controls database application utilises the free issue MySQL
software and a series of Java applets to gather and format the instrument
data into a format suitable for archiving. A wide range of third party add
on software is available to support graphical interpretation of data within
the database. Keynes Controls can also supply a web server interface
enabling data to be displayed across the world wide web.
06:00
12:00
18:00
23:59
Sensor Frequency Hz
Updated at 10min Interval
Time (Hours)
0
500
1000
1500
2000
Sensor 1
Sensor 2
Sept 11th 2006
Data Integrity Operations
When acquiring data across local networks the Keynes Controls software
checks and automatically maintains the data integrity of any
measurements. Before data is archived it is verified to be correct and any
mistake in a value is recovered from the specified instrument before data
storage.
Data Summary Plots
Most types of data analysis can be undertaken when the information is
archived within the database. This analysis can be as simple as detecting
and reporting missed data, statistical analysis upon a range of
measurements and all results can be presented upon a range of summary
plots both in local Windows and on web pages.
Monthly Sum mary - Sensor Freque ncy Hz
Average Valu e - Sept 2006
Time (Days)
1
500
1000
1500
2000
Sensor 1
10 th
20 th
30 th
Sensor 2
Fig 28 - Daily Data Summary Plot
Fig 29 - Monthly Data Summary Plot
19
Figure 30
VibWire-108
Gateway
GPRS Modem
SDI-12 connection
Example GPRS Configuration Settings
The following examples show the AT commands needed to
connect to the 4 most popular GPRS networks in the UK. Other
networks will be configured very similar to the ones below.
Virgin: SMS 800 Texts
PAYG: GPRS CONFIGURATION
:
at+cgdcont=1,"IP","goto.virginmobile.uk","0.0.0.0",0,0
at#userid="user"
at#passw=""
at#sktset=0,4000,"82.152.20.37"
at#sktop
Vodafone: subscription only service
Data10 tarrif: 10MB + £2/MB there after
PAY-as-you-go tarrif
at+cgdcont=1,"IP","pp.vodafone.co.uk","0.0.0.0",0,0
at#userid="web"
at#passw="web"
at#sktset=0,4000,"82.152.20.37"
at#sktop
T-Mobile: depending on t-zone add-on
Zone dependent service
at+cgdcont=1,"IP","general.t-mobile.uk","0.0.0.0",0,0
at#userid="user"
at#passw="wap"
at#sktset=0,4000,"82.152.20.37"
at#sktop
Orange:
Mobile office Pay-As-You-Go Service
Normal PAYG You may need to add access to data :
at+cgdcont=1,"IP","orangeinternet","0.0.0.0",0,0
at#userid=""
at#passw=""
at#sktset=0,4000,"82.152.20.37"
at#sktop
Terminal Port & Hyper-terminal Connection
The VibWire-108 is connected to a Keynes Gateway unit that acts
as a data buffer for the sensor data as well as the control interface
for the modem.
20
VibWire-108 with GSM /GPRS Modem
VibWire-108
Gateway
GPRS Modem
SDI-12 connection
at+cgdcont=1,"IP","orangeinternet","0.0.0.
0",0,0
at#userid=""
at#passw=""
at#sktset=0,4000,"82.152.20.37"
at#sktop
Example above shows instructions required to operate instrument
on the Orange GPRS network and has been included to the
operation of the terminal program.
Figure 32
1
9
RS232 to USB
Converter
U
S
B
C
a
b
l
e
9 Pin Male
Connector
9 Pin Female
Connector
Terminal Port
Pin-out of terminal port
USB port
on PC
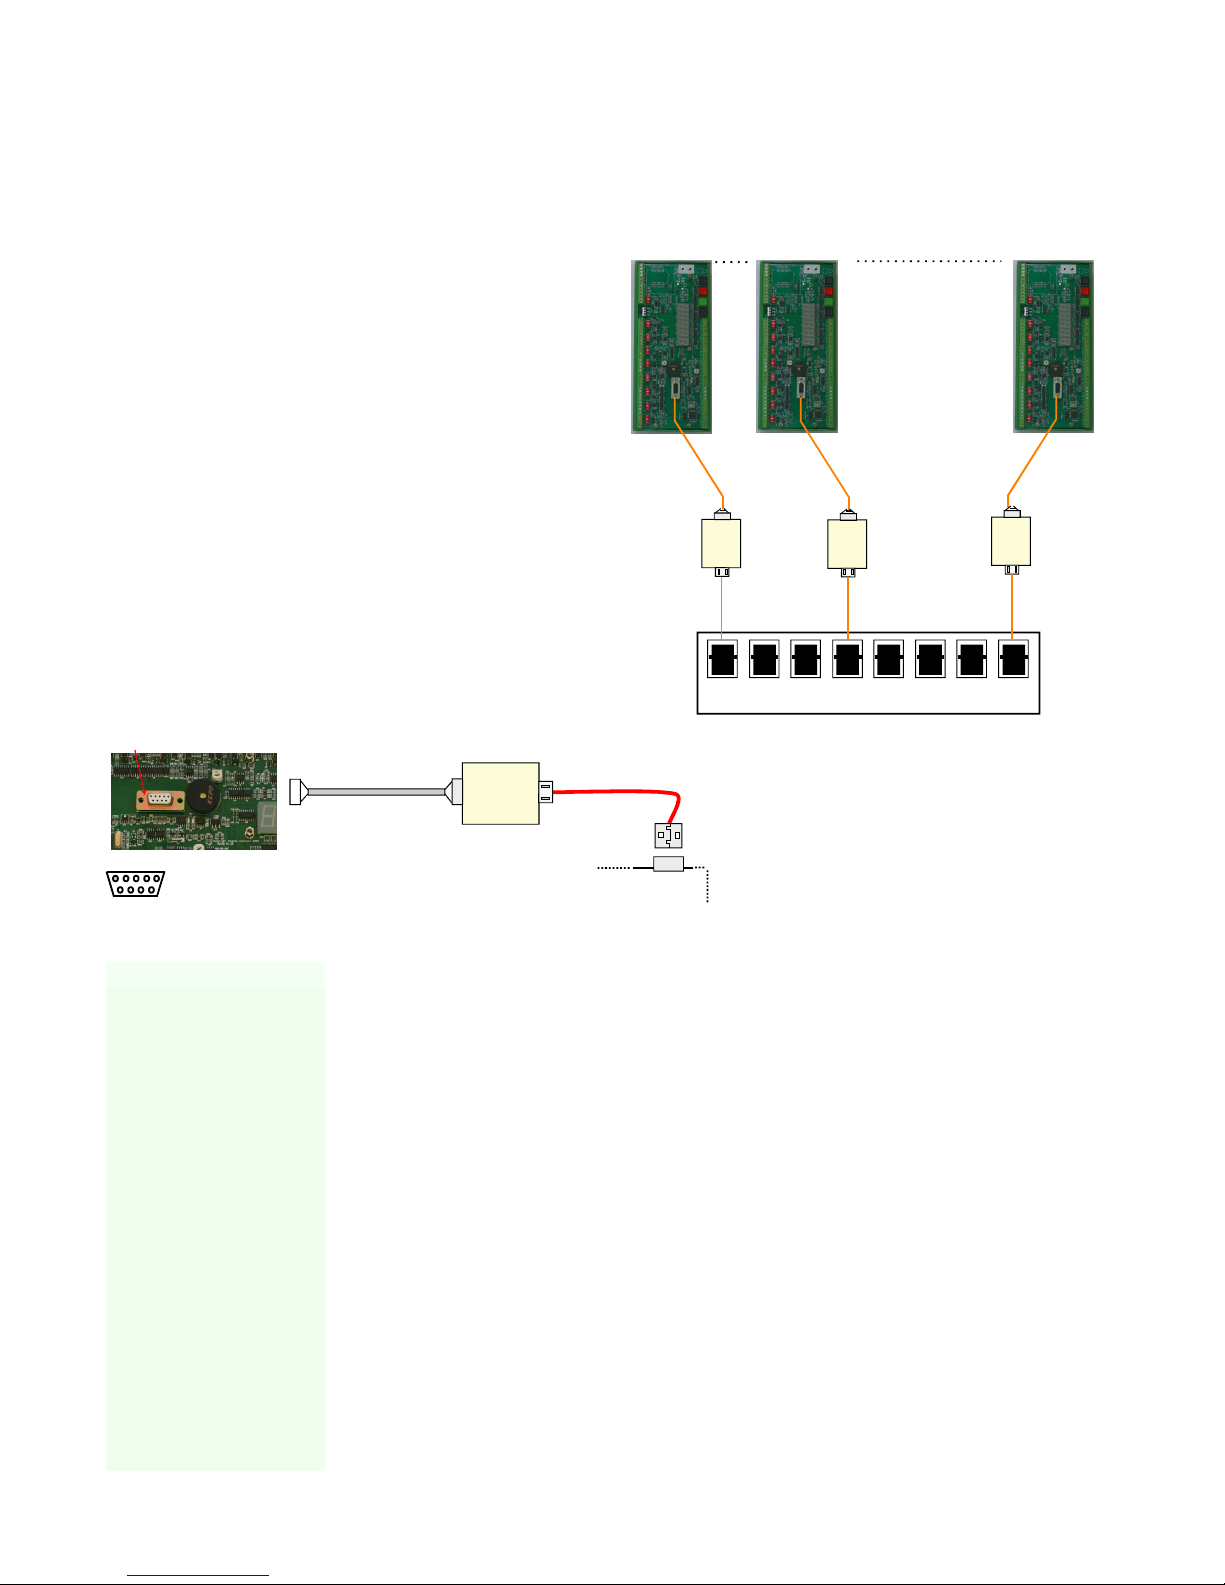
Serial Port to USB Communication
Using a serial port to USB converter it is possible to communicate
to the VibWire-108 using a standard USB port on on laptop or PDA
in order to configure the terminal or download information.
Any terminal program can be used but a common application
program is the Microsoft Hyper-terminal and this is used in the
example below.
Serial Port Interface Cable
A standard 9 pin serial port cable terminated with male and female
D-connectors is all that is required to communicate to the
instrument.
Port Control Options
Set any serial port configuration to RS232 mode - only Rx / Tx
lines are used.
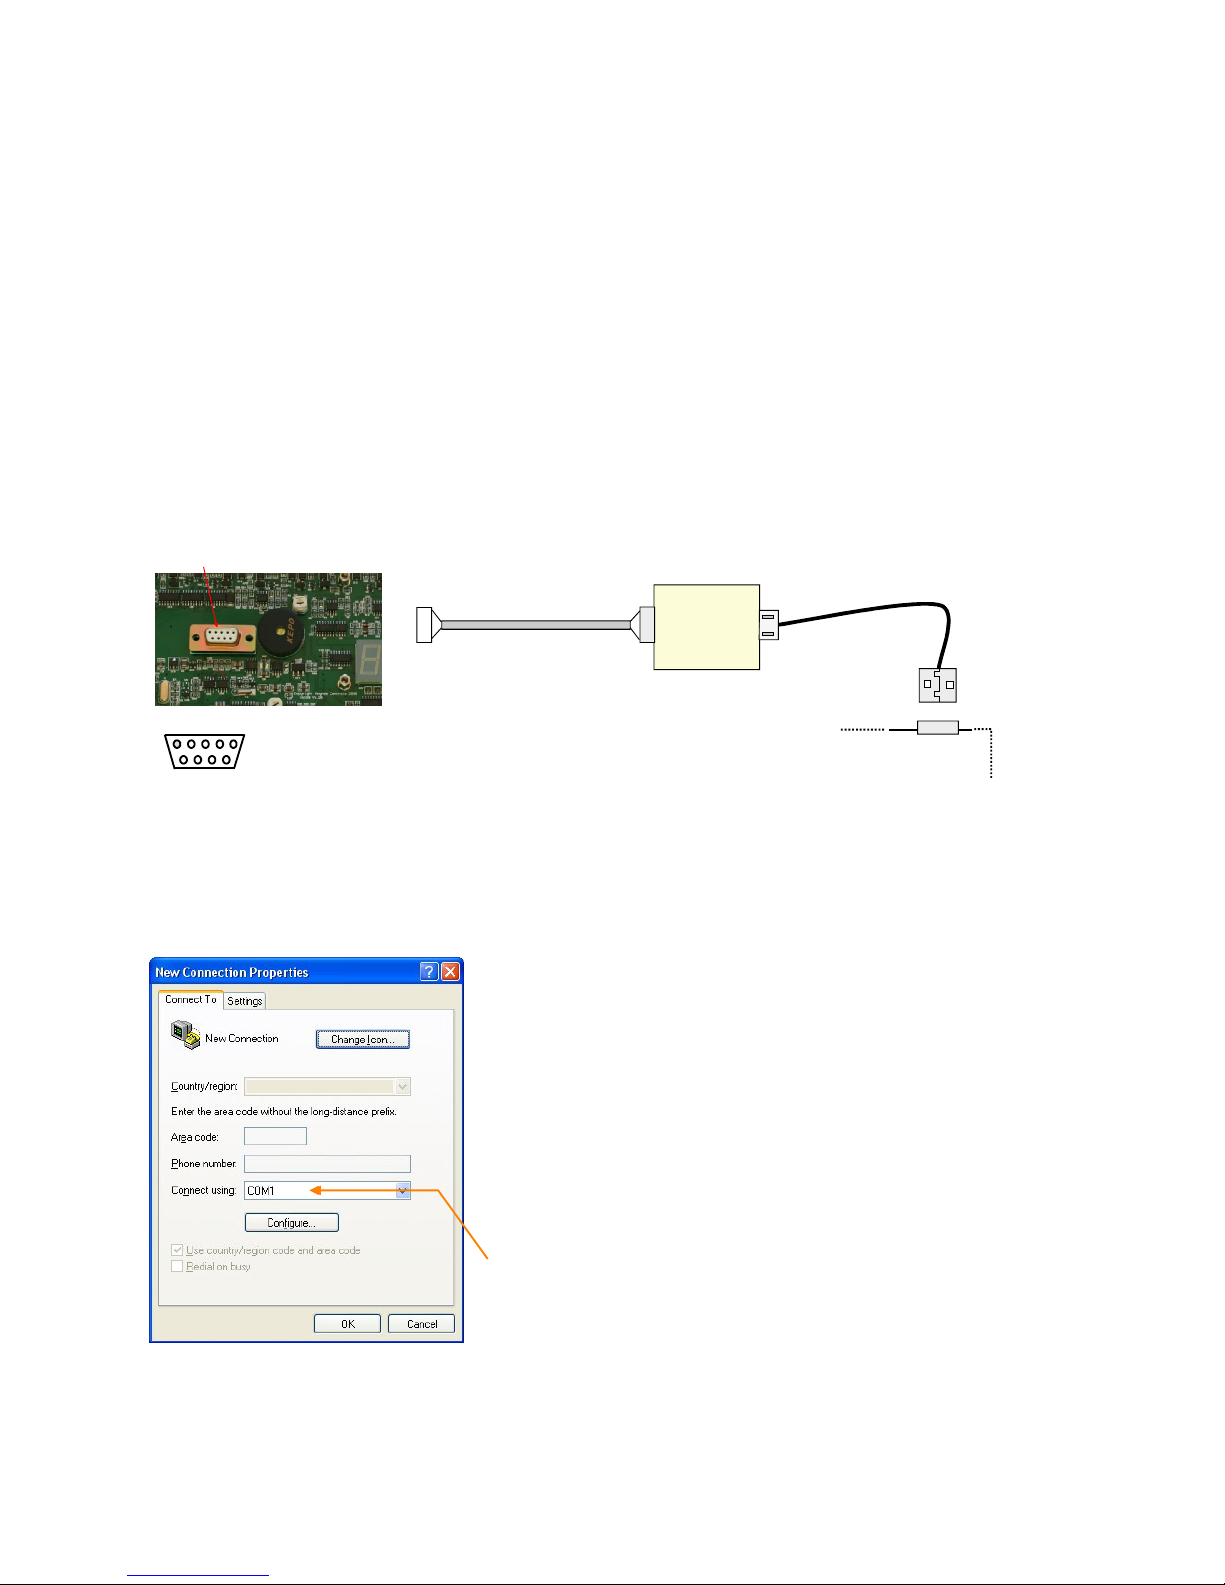
Active Port
Active Comms Port.
Once the USB interface is installed into the PC the driver software
within a Windows based operating system identifies the active port
name.
Take care to select the serial port identifier when using the terminal
program to talk to the instrument.
Failure to assign the correct serial port within the terminal program
will prevent communication to the instrument.
The terminal configuration window below shows Hyper-terminal
set to operate under serial port Com-1.
21
Figure 31
Figure 42
1
9
RS232 to
Ethernet
Converter
9 Pin Male
Connector
9 Pin Female
Connector
Terminal Port
Pin-out of terminal port
Ethernet port
on PC
Ethernet Cross Over Cable
Serial Port to Ethernet Communication
Using a serial port to Ethernet converter it is possible to communicate to
the VibWire-108 using a standard Ethernet port on a laptop or PDA in
order to configure the terminal or download information.
Any terminal program can be used but a common application program is
the Microsoft Hyper-terminal and this is used in the example below.
Serial Port Interface Cable
A standard 9 pin serial port cable terminated with male and female Dconnectors is all that is required to communicate to the instrument.
There are many different manufactures of Serial port to Ethernet
converters that can be used with the VibWire-108. Keynes Controls do not
restrict the operations of the instruments to any particular model.
Some interesting sites for converter modules are:
http://www.perle.co.uk/products/Serial-to-Ethernet.shtml
http://www.hw-group.com/products/converter/index_en.html
Port Control Options
Set any serial port configuration to RS232 mode - only Rx / Tx
lines are used.
Communications
In order to communicate with a laptop or other computer system take care
to ensure the network settings for the converter module are compatible to
the host PC or network onto which it will be attached.
Typical Network Layout
2
0
m
100 m
Ethernet Hub/Switch
RS-232 to
Serial
Converter
22
Figure 33
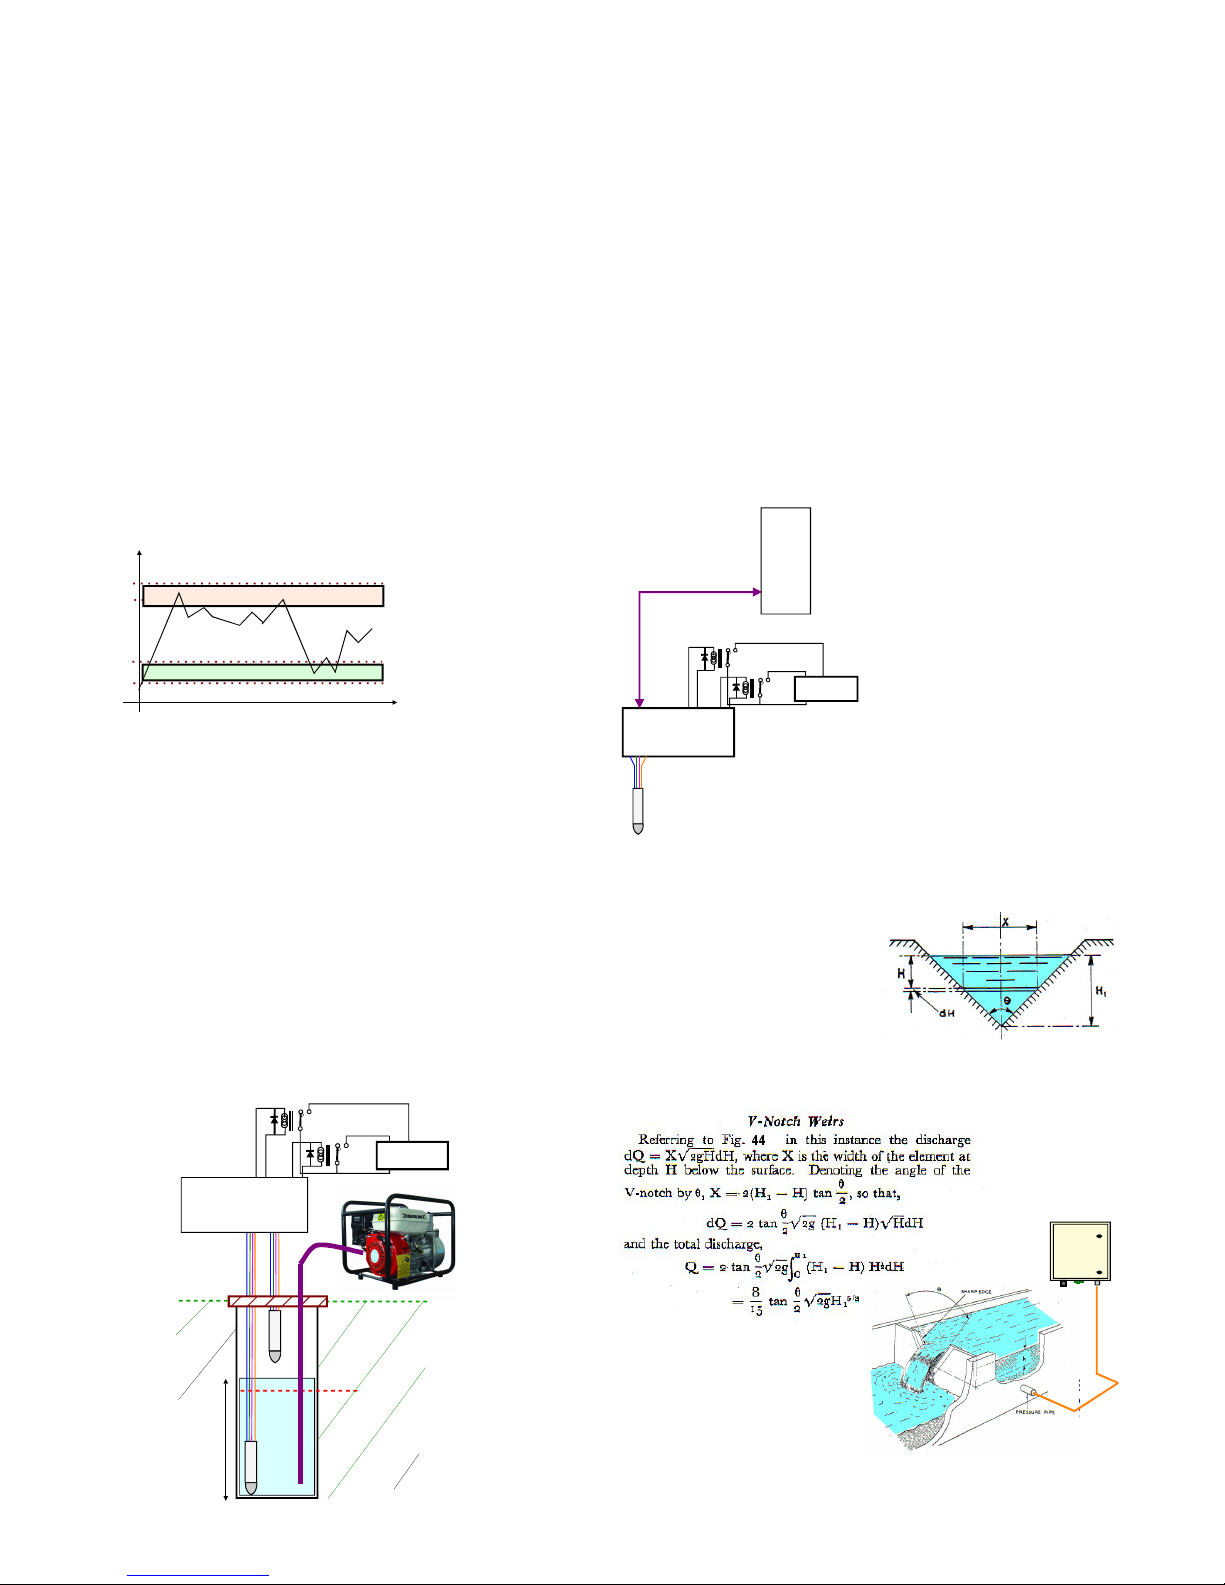
Figure 44
Description
Frequency Display
6 Segment LED display - resolution 0.1 Hz
Vibrating Wire Inputs
8 multiplexed inputs
Analogue Output
16 bit 0 - 2V DC - scaled to frequency
Scan Time
2 - 30 Secs scan option s2,4,8 chan-
Line Resistance
Upto 2 K ohms
Analogue Inputs
8 inputs 0- 2.5V DC
or 300 - 5 K Ohm RTD
Lightning Protection
Gas Discharge Tube - option Transorb
Vibrating Wire Frequency
400 - 6 K Hz auto resonance
Operating Voltage
9 - 24V DC
Sensor Input
Full Differential
Power Supply
Scanning mode
70 mA Duration 30 secs
Display mode
90 mA Continuous
SDI-12 mode
20 mA Continuous while waiting for commands
RS4-85 mode
20 mA Continuous while waiting for commands
Analogue output mode
25 mA Continuous
Technical specifications are may change without notification and the power options mentioned above are approximate.
Technical Specifications

GEOSENSE Vibrating Wire piezometers and transducers use the well-proven method of
converting fluid pressures on a sensitive diaphragm into a frequency signal.
Frequency signals i.e. those generated using vibrating wire sensors are particularly suitable
for demanding environments such as that often occur within Civil Engineering applications
Vibrating wire sensors ideally suit the harsh civil engineering environment since the signals
are capable of long transmission distances without degradation, tolerant of wet wiring
conditions and resistant to external electrical noise.
Specifications
Excitation:
Pluck or swept frequency
Voltage Protection:
Semitron BiPolar 230 V
Thermistor:
3k Ohms at 25 oC
Over-range:
minimum twice pressure
Resolution:
0.025% FSO (minimum)
Accuracy:
< 0.25 % FSO (see Notes)
Thermal Effect:
< 0.02% FSO /oC
Operating range:
-20 oC +100 oC
Cable:
2 pair PVC outer sheath.
Typical range:
3500-2200 Hz
Nominal zero value:
3130 Hz
For additional details contact
Geotechnical Centre . Rougham Industrial Estate . Rougham . Bury St Edmunds . Suffolk . IP30 9ND . England
Tel: +44 (0) 1359 271167 . Fax: +44 (0) 1359 271168 . email: info@mgsgeosense.co.uk. www.mgsgeosense.co.uk
Vibrating Wire Sensors
The VibWire-108 supports most manufacturers sensors and a small summary of these is shown below.
Crack meter
Crack meters are available with ranges up to 100 mm
Resolution
0.025% of range
Accuracy
± 0.2% of range
Temperature effect
–0.02mm/°C (typical)
Operating temperature
–30 to +70°C
Cable: 2 and 4 Core screened
Joint meters are available with ranges up to 100 mm
Resolution:
0.025% of range
Accuracy:
± 0.2% of range
Temperature effect:
–0.02mm/°C (typical)
Operating temperature:
–30 to +70°C
Cable:
2 Core screened
Gauge Type:
TSR/5.5/T surface mounting strain gauge.
Gauge factor:
3.025 x 10⁻³ micro-strain per Hz squared.
Measurement range:
> 3000 micro-strain.
Resolution:
Generally better than 1 micro-strain.
Coil Resistance:
Approximately 100 ohms.
Operating temp range:
-200C to 800C.
Thermal coefficient:
11 ppm per 0C.
Effective Gauge length:
50 mm ( nominal )
De-bonded length:
175 mm
Overall length:
1.39 m
Standard diameter :
15 mm
Resolution :
0.5 micro-strain
Strain range:
2500 micro-strain
Thermal expansion:
12 ppm /deg C
Range:
3,000 micro-strain, set mid-range.
Resolution:
1 micro-strain
Accuracy:
± 0.1% FS.
Thermal Coefficient:
11 ppm / °C.
Operating Temp:
-20 °C to 80 °C.
The details on this page have been obtained from the sensor manufacturers web
sites and are liable for change at any time.
Surface strain gauge
Joint meters
Rebar Strain meter
Embedment Strain Gauge
For additional details see
BELL LANE, UCKFIELD, EAST SUSSEX, TN22 1QL, ENGLAND
Website www.soil.co.uk Tel: 01825 761740
Gage Technique International
PO Box 30
Trowbridge, Wiltshire
BA14 8YD, England
Tel: +44(0)1761 431777
Fax: +44(0)1761 431888
enquiries@gage-technique.com
www.gage-technique.com
23
Figure 35
Figure 36
Figure 37
24
Surface strain gauge
Vibrating Wire
strain gauge
Crack meter
Gauge
Crack meter gauge expands
in length as the crack grows
in size.
Displacement sensor on the
beam and attached to the
vertical support will increase
with the sliding motion of beam
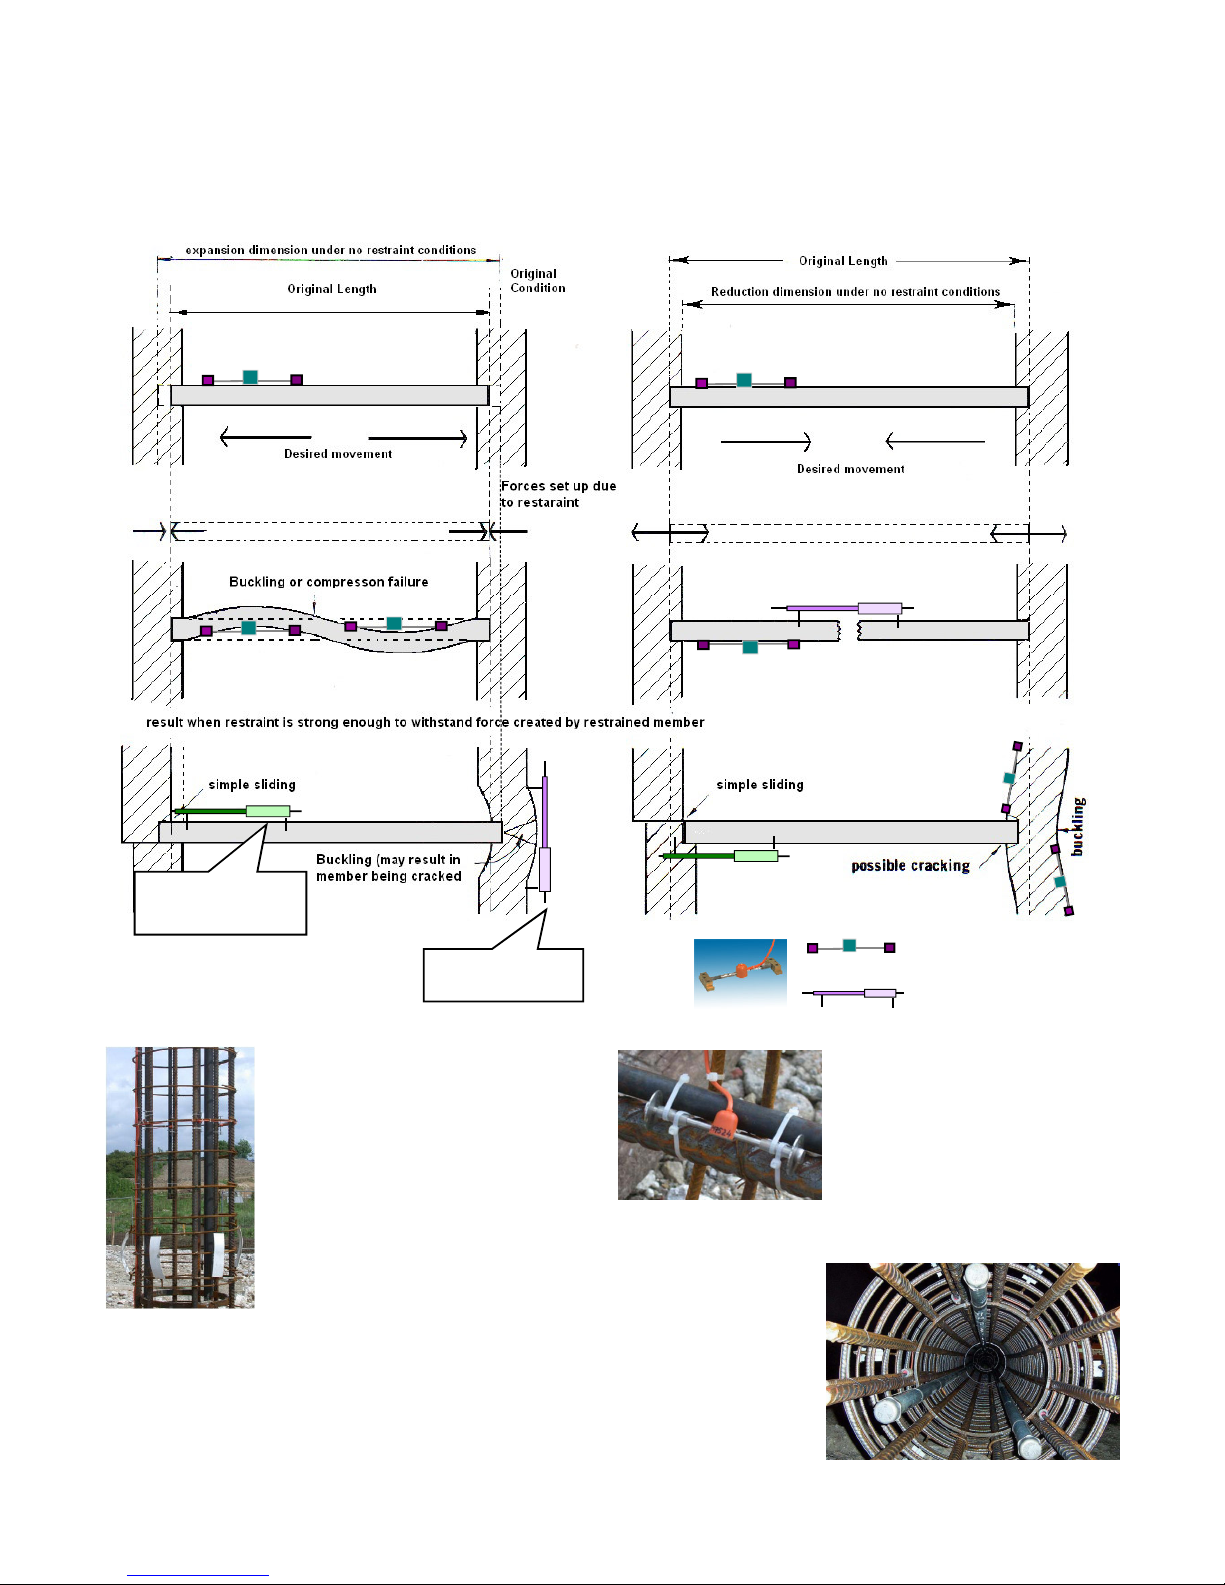
Vibrating Wire Sensor Applications
The details below show just a few of the applications for which
vibrating wire sensors are used. The best results from the
instrumentation are only achieved when a good understanding for
the overall structural behaviour is available. The examples
demonstrate the common uses of structural monitoring within civil
engineering applications.
The embedment or dumbbell gauge
(See Fig 40) is designed to measure
strain in concrete. This vibrating wire
strain gauge is typically tied to a
reinforcing cage. It is usual to install
them in arrays of three or four gauges
at several depths horizons within the
structure.
Fig 39
Figures 38 and 39 show sister bar gauges and
examples of their installation and use. The
sister bar strain gauge comprises of two
lengths of ribbed rebar welded to a central
gauge section. The central gauge section has
a miniature stainless steel, vibrating wire
strain gauge element, fitted along the
longitudinal axis of the gauge. Incorporated
within the gauge section are two coils for
excitation and output of the vibrating wire
strain gauge element. This type of gauge is
particularly rugged and reliable. They are
particularly applicable for strain
measurements in mass concrete pours where
placing of concrete is remote and
uncontrolled such as typically occurs in
diaphragm walls or deep piles.
The sister bars can be connected to a single
VibWire-108 instrument and data
Fig 38
Fig 40
A lot of vibrating wire sensor applications are undertaken with the
sensors buried into the structure such as within concrete or within
a bore hole. The vibrating wire sensors maintain very accurate
results without need for re-calibration over many years and generally more reliable than other forms of sensor, less prone to failure
in damp conditions and relatively easy to install.
Page 25
Case Study - Bore Hole Pump Control
The following examples detail the use the VibWire-108 range of
instruments within water flow and control systems. Two examples
are shown. The first example demonstrates the VibWire-108 as a
stand-alone control system used to monitor bore hole water and the
second example, shows how the VibWire-108 is used with a data
logger to report on and control the water flow in a v-notch weir.
Bore Hole Water Level Control
The VibWire-108 can be configured to operate as a stand-alone
control system when used with Vibrating wire peizometers and the
transistor output ports.
Fig 43 shows a sealed bore hole with 2 peizometers deployed. The
lower level sensor reports the water level height. The top sensor
acts as a reference and reports the internal bore hole pressure only.
The water level height measurement can be in error if there is a
build up of gas pressure in the hole and it is to correct for gas
pressure changes that the reference is fitted.
+12v DC
Trans Out
+12v DC
Trans Out
Sluce Valve
Control Unit
Vibrating
Wire
Pressure
Sensor
1205.4
Data Logger
SDI-12 network
Freq Hz
Time (min)
Hysterisis Band
Hysterisis Band
Alarm High H2
Alarm Low L2
Alarm High H1
Alarm Low L1
Stand-alone Weir Control System with Data Logger
For applications where a control system is required to let a set
amount of water to flow and to maintain a record of events then a
control system similar to that shown below will be required. Apart
from maintaining details of flow the control unit can also act as an
alarm system and shut of water flow should the defined limited be
exceeded.
Consider the example of the V-notch weir below. A dedicated
complex formula is required to calculate the discharge over the
bottom of the notch. There are a number of different formula
available for this calculation but they depend upon the water height
at different positions within the weir.
A series of vibrating wire peizometers are used to monitor the
water height and are connected to the VibWire-108. The VibWire108 communicates the water height details to a programmable
logger, such as the Keynes Controls gateway systems. The logger
is used to calculate the discharge and to record the results.
Vibrating
Wire
Peizometer
Pump Ignition
On/Off
+12v DC
Trans Out
+12v DC
Trans Out
1205.4
H
Reference
Peizometer
Bore Hole
The VibWire-108 is configured to activate the digital output when
the water height exceeds the higher alarm levels. Upon detection of
a water level exceeding the pre-determined upper alarm level then
the transistor output is activated to switch a relay.
The relay switching can be used to activate the ignition circuit on
the pump if it is powered by a petrol engine or switch the power
supply if an electric pump is being used.
Summary
As long as the Peizometer frequency settings are defined correctly
and a suitable hysteresis level is set, then the VibWire-108 can run
indefinitely to control a pump to maintain the water level within a
bore hole below a pre-set level.
Fig 42 shows the basic control
system showing the VW-108
connected to a logger across a
digital network.
The instantaneous pressure
levels are monitored by the
logger and used within the Vnotch discharge formula.
The logger can be used to
produce a permanent result
record that can be downloaded
by an operator and also to trigger
the transistor outputs within the
VibWire-108 when used for
alarm level control.
Fig 42
Fig 45 shows the v-notch weir
profile. The water height is
measured accurately using a
precision vibrating wire sensor
and these types of sensors are very
accurate and stable over long
periods of time.
Fig 45
Fig 44
15
0 m
Figure 41
Figure 43
The Gateway can record the
vibrating wire sensor data and
convert it into engineering
units.
The formulae above are typical
of those that can be handled
within the Gateway interface.
 Loading...