


Document number
14418D27-01
76.5 GHz
RCS Imaging Evaluation System
(76.5GHz Imaging RADAR)
MODEL : RCS05
FCC ID : 2AON3-RCS05
Instruction Manual
Ver. 6.12
April 02, 2019
Keycom Corporation
Introduction
This manual describes the function outline of the 76.5 GHz RCS Imaging Evaluation System (76.5 GHz Imaging RADAR),
the name and description of each part, operating procedures, precautions on use, and so on.
Safety Notices
CAUTION
A CAUTION notice denotes a hazard. It calls attention to an operating procedure,
practice, or the like that, if not correctly performed or adhered to, could result in
damage to the product or loss of important data. Do not proceed beyond a CAUTION
notice until the indicated conditions are fully understood and met.
WARNING
A WARNING notice denotes a hazard. It calls attention to an operating procedure,
practice, or the like that, if not correctly performed or adhered to, could result in
personal injury or death. Do not proceed beyond a WARNING notice until the indicated
conditions are fully understood and met.
WARNING
There is a reflecting mirror rotating at high speed inside the device, and it is extremely
dangerous to use the device by opening the radome or the case.
Although the radome and the case are tightened so as not to be opened with TRX
Flat Head Screw , PLEASE DO NOT OPEN THEM ABSOLUTELY.
Please note that it will be out of warranty if opened.
1. System overview
In this system, reflection distribution from the object to be measured such as automobile can be displayed as an image,
and RCS * can be calculated from the measurement result. (RCS *: Radar Cross Section radar reflection cross section,
expressed in m 2 in real number, in dBsm in logarithm)
(1) Features of the system
(a) Millimeter wave pulse radar with a center frequency of 76.5 GHz, which is a specific low power device without
license.
(b) By using the parabolic mirror rotating at high speed for the reflector of the primary radiator, it is possible to obtain
a 3-dimensional wide range image in a short time.
(c) By specifying the horizontal and vertical rectangular range and distance range of the measured image, RCS
calculation is possible by selecting the object.
(d) Since all the CLK, IF, and RF signals are phase synchronized and the phase component of the signal is also detected
by the IQ Mixer, the data within the specified range is calculated by IQ phase synthesis of the total RCS and the peak
value Peak RCS can be calculated.
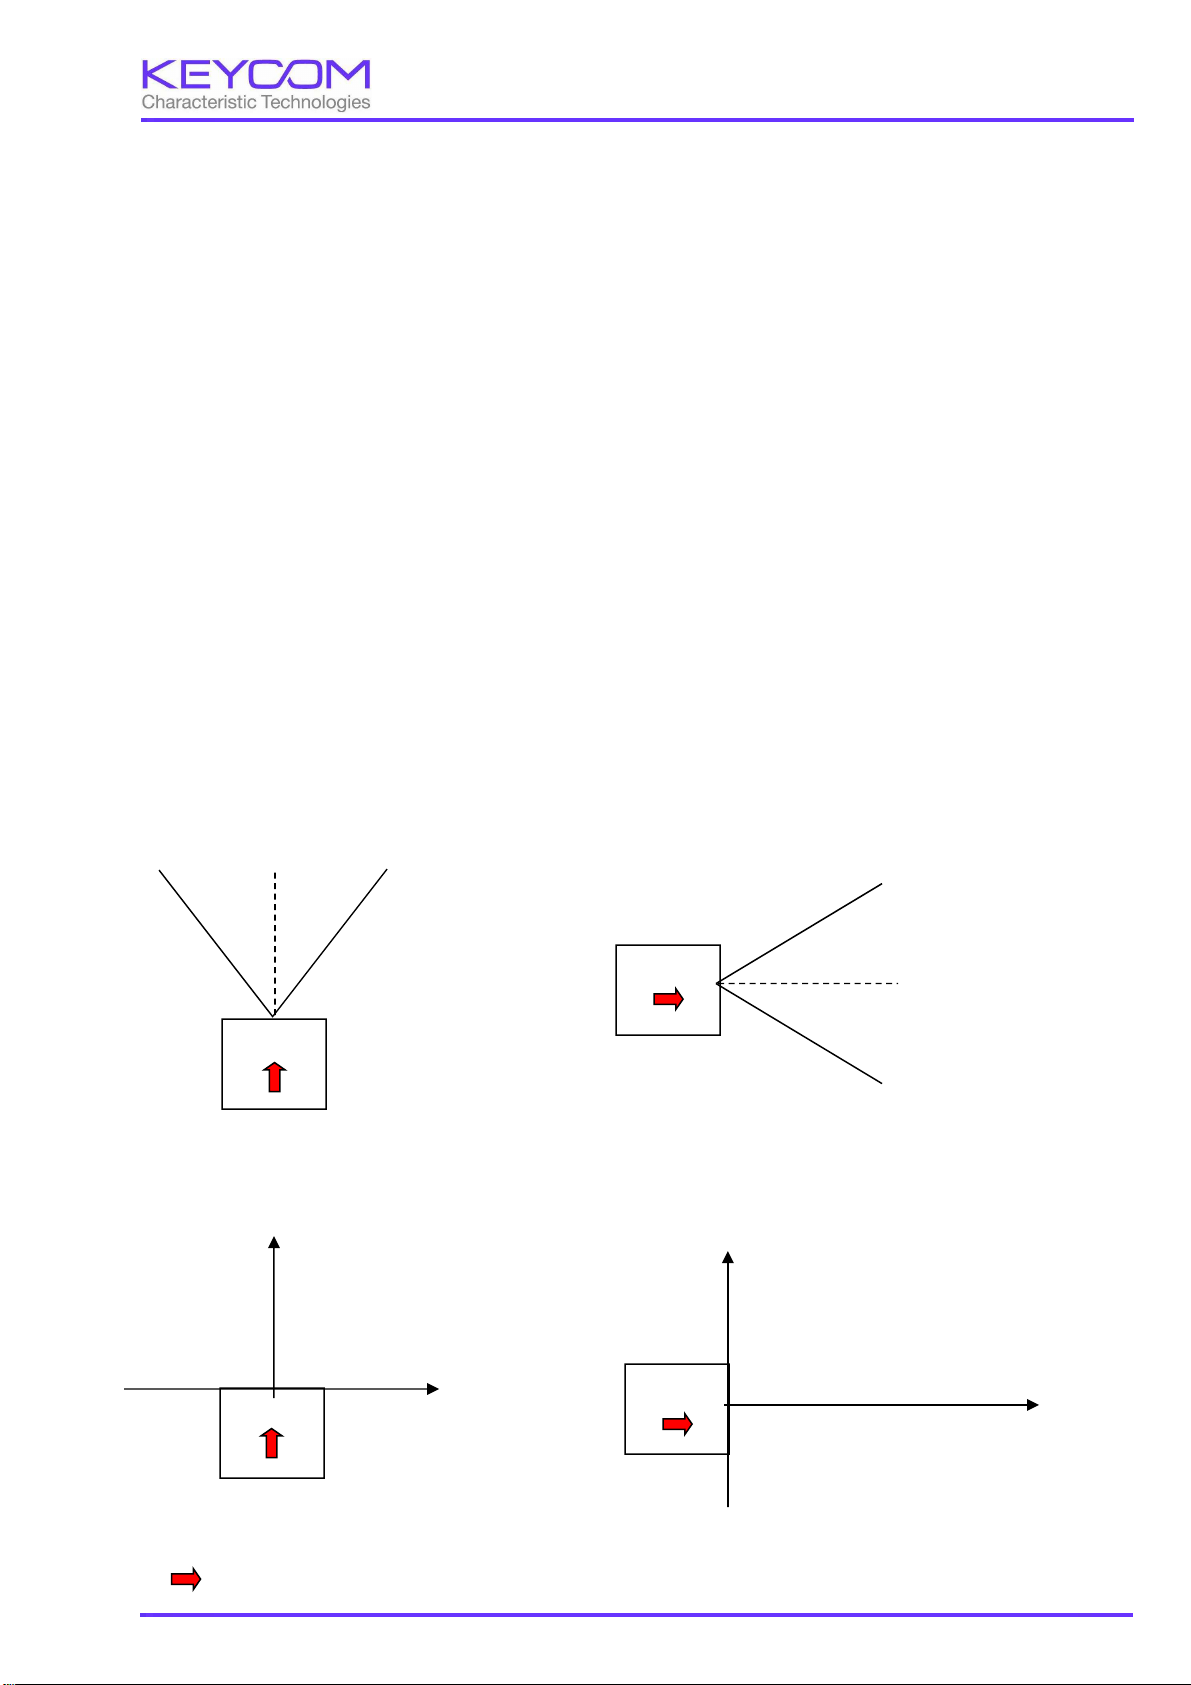
(2) Definition of coordinates
There are three types of coordinate system of the system, polar coordinates, orthogonal coordinates, and cell
coordinates. The definition of each coordinate system is explained below.
Polar coordinate
θ(Theta)、φ(Phi)、d
(d is the distance from the antenna to the target.)
-θ
0°
RADAR
Top view Side view
+θ
RADAR
+φ
0°
-φ
Cartesian coordinates
x, y, z
“ “
z
x
RADAR
Top view Side view
is the front direction of the radar
RADAR
y
z
1
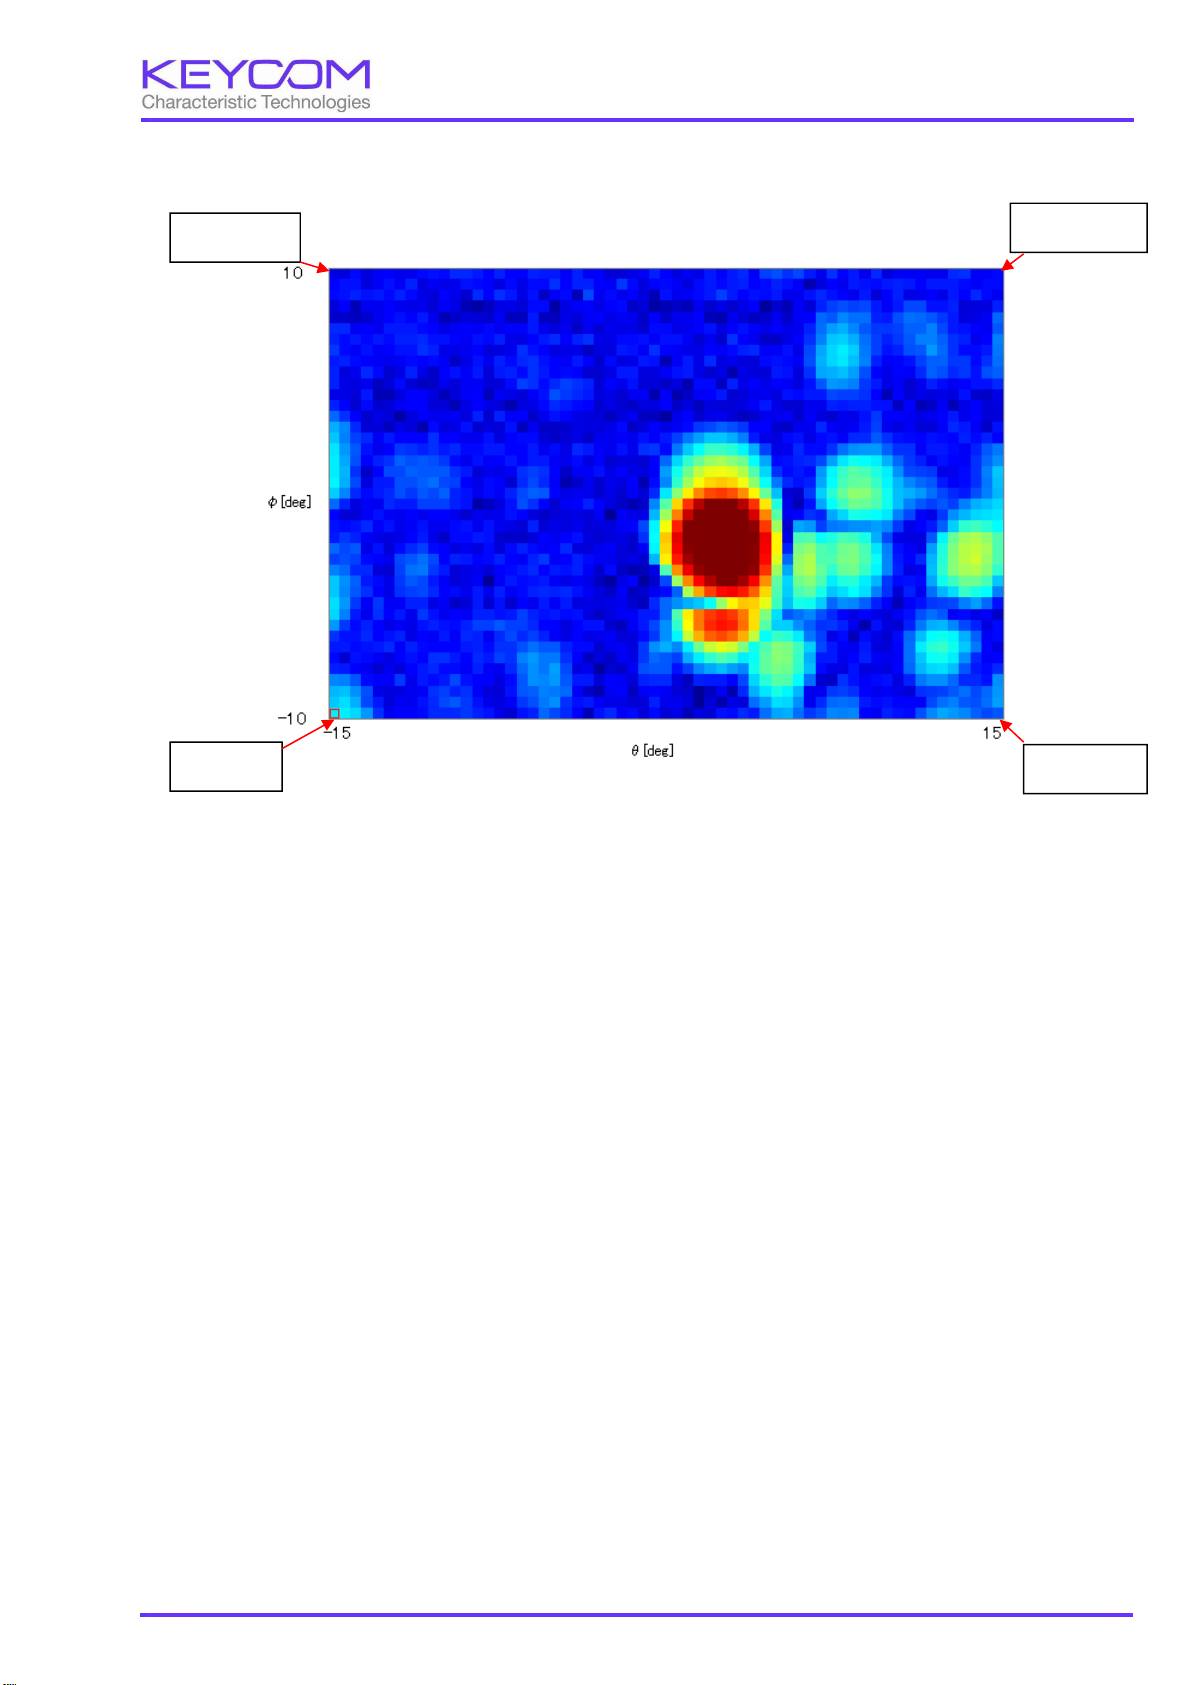
Cell coordinates
Pθ, Pφ
Pθ=0,Pφ=40
Pθ=60,Pφ=40
Pθ=60,Pφ=0
Pθ=0,Pφ=0
The cell coordinates are the data cell number of the image screen. In the above figure, the range of horizontal 30 °
vertical 20 ° is measured in increments of 0.5 ° both in the horizontal and vertical directions, and is an example of the
cell coordinates when the number N of data in the horizontal direction is 61 and the number M of data in the vertical
direction is 41.
Correspondence between cell coordinates and polar coordinates
θ = Pθ* (horizontal measurement angle unit) + horizontal measurement start angle
φ = Pφ* (measurement unit in the vertical direction) + measurement start angle in the vertical direction
The measurement angle unit in the horizontal direction is fixed at 0.5 °, and the measurement angle unit in the vertical
direction may be 0.5 °, 1 °, 2 ° depending on the setting.
2
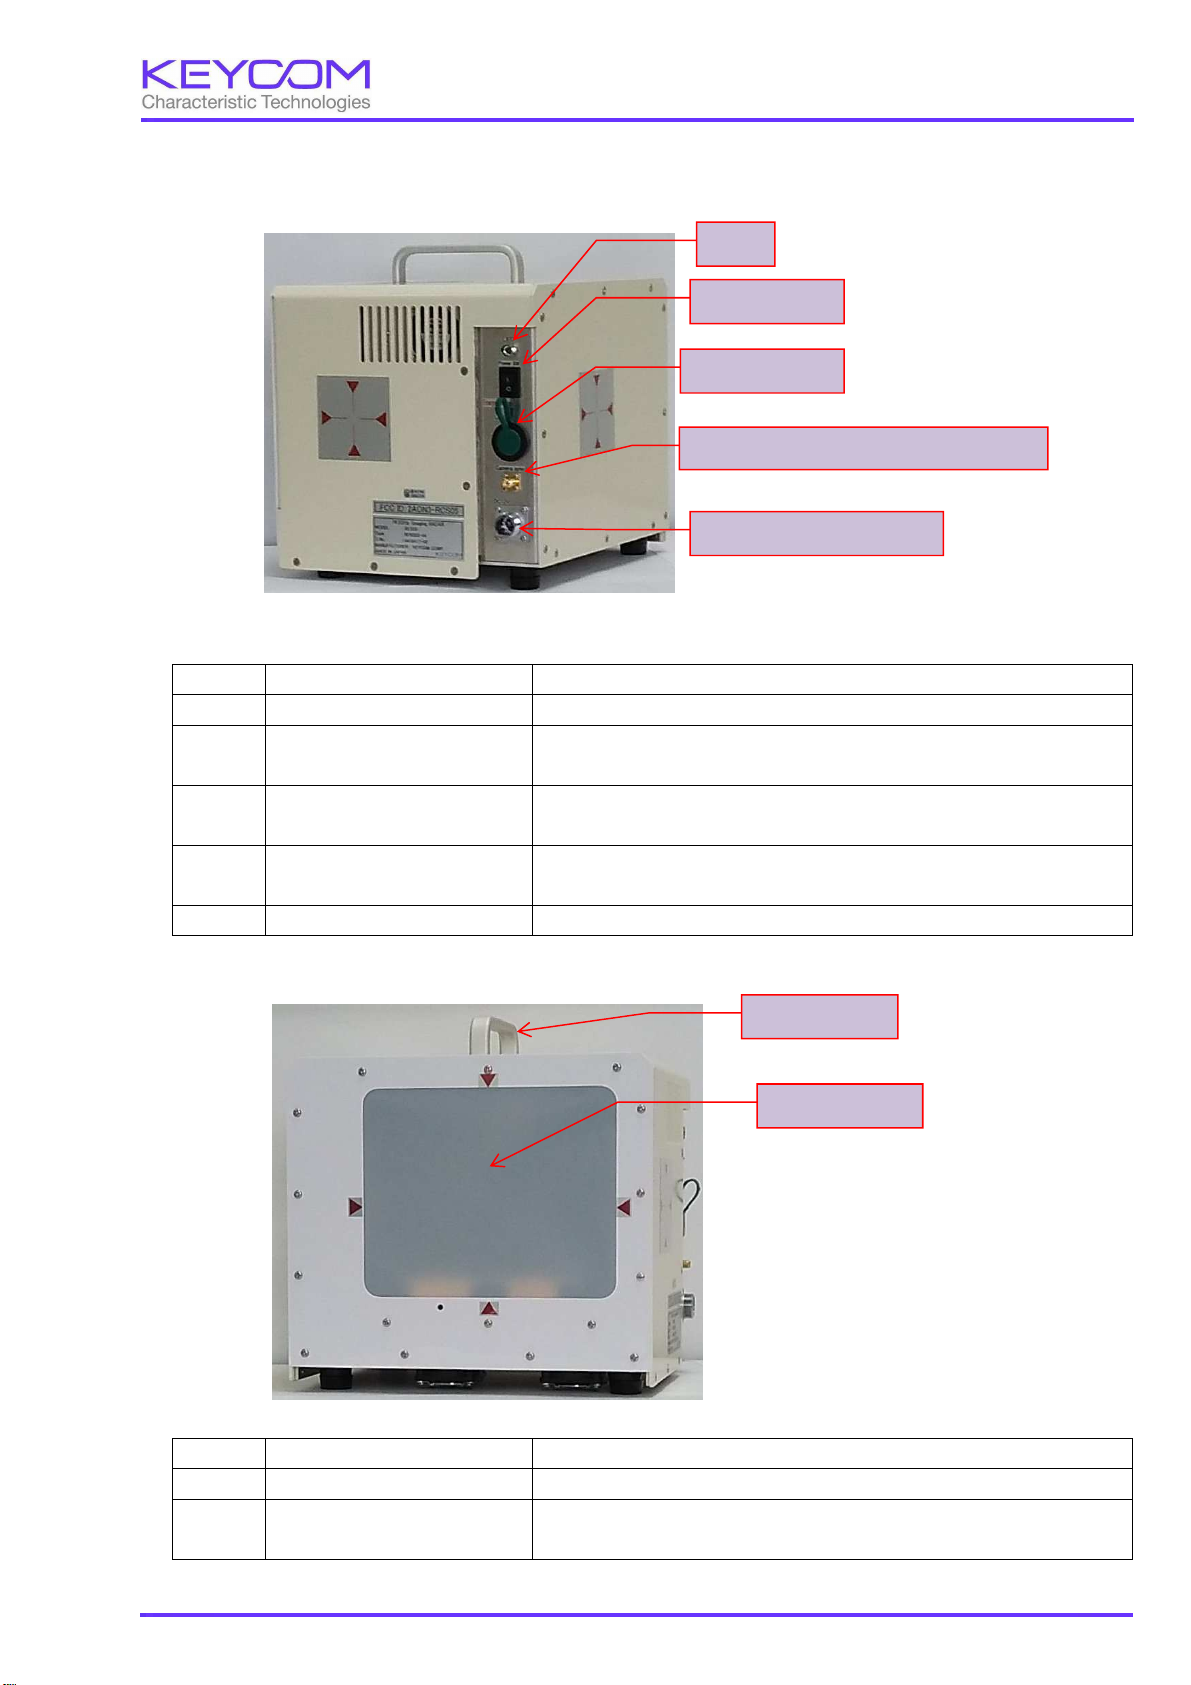
" side pushes it ON,
Connects to the measuring computer Connector for inserting the USB
for
ronization signal data of 4 cameras is
It is a resin cover that covers the transmission direction surface of
2. Explanation of each part
(1) Rear Panel
LED
Power switch
USB connector
The cross mark of the photograph is the center position of the mirror
No. Name Description
1 LED Lights up when the power to the device is turned on.
2 Power switch This switch turns on / off power. Pressing "┃
3 USB connector
4 Synchronization signal
5 DC 12 V power connector This is a 3 pin connector that connects DC 12 V AC adapter.
(2) Front Panel
Synchronization signal for camera
DC 12 V power connector
pushing "○" side turns it OFF.
cable.
0 V is output while image synch
camera
being acquired, and 3.3 V is output for the others.
Handle
No. Name Description
1 Handle Used for moving the movable hand tool.
2 Radome surface
the radome surface radio wave.
Radome surface
3

3. Measurement computer requirements
The requirements of the measuring computer connected to this system are as follows.
No. Item Requirement Remarks
1 CPU Intel Core 3 or higher
2 Memory 4G Bytes or more
3 HDD free space 32G Bytes or more
4 Display resolution 1280 x 1024 dots or more
5 I/O USB 2.0 1 port or more
6 OS Windows 7, windows 10 recommended
4

4. System startup and shutdown
(1) Start up the system
(a) Connect the instrument main unit and the measuring computer with a USB cable.
(b) Turn on the power switch of the main unit. (Push the "┃" side of the locker switch in)
(c) Turn on the measuring computer.
(d) When the OS of the measurement computer starts, start the measurement program (76 GHz RCSimaging.exe).
(CAUTION: Start up the measurement program after about 10 seconds elapsed after turning on the power of the unit.)
(2) System termination
(a) Exit the measurement program.
(b) Shut down the measuring computer and turn off the power.
(c) Turn off the main unit's power switch. (Push in the "○" side of the locker switch)
5. Preparation for measurement
(1) Installation of the main unit
Install the unit in a horizontal position.
Point the radome side (resin side) of the main unit toward the object to be measured.
(2) System initialization
When you start the measurement program, initialization processing of the main unit will be performed automatically.
The initialization process takes about 10 to 20 seconds, during which the wording "On Standby" appears in the message
display area. Also, since the key operation of the measurement program does not work, please wait until the end.
When initialization processing is completed, the word "Standby OK" is displayed in the message display area.
(3) Setting of automatic saving of csv file (Please refer to Appendix 1 for explanation of csv file.)
If you select "Auto save" from the "Settings" menu on the main screen, the following screen will be displayed.
①
②
③
① Check to save the data to a file while measuring.
② Specify the folder to save measurement data.
③ Specify a fixed character string to be added to the beginning of the file. The date and time (YYYYMMDDhhmmdd)
automatically appends this fixed character string to the file name, and the extension is csv.
5

6. Operation of measurement program
The operation of each measurement screen of the measurement program is explained below.
(1) Main screen
This is the first screen displayed when starting the measurement program. Operate this screen to perform image data
acquisition and RCS calculation operation.
(8)
(9)
(1)
(13 )
(10)
(11)
(2)
(3)
(4)
(5)
(15)
(14)
(12)
(6)
(7)
No. Name Operation explanation
(1) Image display area This is an image display area where image images and graphs of
measurement data are displayed.
(2) Title Enter the name of the measurement. This input is saved in the
measurement data file.
(3) Comment Enter comments on measurement. This input is saved in the measurement
data file.
(4) Distance range Enter the distance range for which you want to measure the image.
Received signals outside the distance range are not displayed and are not
used for calculation. It can be set between 3 m and 55 m.
・Recalculate Click the Recalculate button when changing the distance range.
(5) Image This area allows you to make settings for displaying images.
・Max Level /Min Level Specify the maximum value and minimum value of the image display level.
・Redraw Click this to re-display the image.
・Cell frame display When checked, a border appears on the cell border of the image.
・φ Axis Fit To Screen When checked, in the image display, theφaxis is expanded to fill the
screen in the same way as ± 10 ° regardless of the set angle of the tilt.
・Distance specification You can drag the slide bar and display the image of the cross section with
the distance specified in units of 15 cm in the image display area.
(6) P (d) Graph This area can be used to display the P (d) Graph of the relationship
6

No. Name Operation explanation
between distance and received power.
P
/
Pφ Specify the cell coordinates on the screen for which you want to display
θ
the P (d)graph. You can also specify it by clicking on the image screen.
・Graph display Click to display the P (d) Graph.
(7) P (x) graph A graph can be displayed on the relationship between the x coordinate
calculated from θ and distance d and received power. It is an area where
setting for that is done.
・Tilt Specify the tilt angle for displaying the P (x) graph.
・Detecting Range Detection distance range in the distance direction can be specified in units
of 0.15 m within the range of 0 to ± 1.5 m.
・Distance specification You can drag the slide bar in the specified tilt direction and display the
intensity graph in the X axis direction specified distance in 15 cm
increments. When specifying the detection range other than 0 m, this
distance specification is the median value.
・Graph display Click to display the P (x) graph.
(8) φrange
(Vertical tilt range)
Click to specify the measurement range of the tilt angle. As a guide
S: Short range (within about 10 m) is ± 10 °
M: Middle range (within about 20 m) is ± 5 °
L: Long range (about 40 m or less) is ± 2.5 °
Hold horizontally (Fix) for more than 40 m.
In the case of S, M, L, the range of the tilt angle set while the mirror turns
11 is scanned and measurement is completed.
S = 2 °, M = 1 ° and L = 0.5 ° for the tilt angle.
SH and MH are high definition mode measuring tilt in increments of 0.5 °,
SH is 41 turns and MH is 21 turns to scan one screen.
(9) Number of Measurement By checking "specify", you can specify the number of times to acquire
image data. When "Continuous" is checked, image data is continuously
acquired until "Stop Measurement" button is pressed.
(10) Start Turning Motor /
Stop Turning Motor
(Turning motor rotation)
Click to start turning the parabolic mirror.
While turning, "Stop Turning Motor" is displayed, and you can stop turning
the parabolic mirror by clicking.
(11) Start Measurement /
Stop Measurement
(12) Save As Image
(Save image data)
(13) RCS Reference
(Reference value)
Click to start acquiring image data. During data acquisition, "Stop
Measurement" is displayed, and you can click to end data acquisition.
Data in the image display area can be saved as bitmap data or JPEG data.
Click to capture the reflected received power of a known RCS corner
reflector as a reference to the system. (For details, see 7 (1))
(14) Target Click to calculate the RCS value of the target. (For details, see 7 (2))
(15) Message display area A message about the operation of the system is displayed.
7

(2)Setting parameters
Open the "Settings" menu on the main screen.
"Settings" menu
When "Parameter Setting 1" is selected, the following screen will be displayed.
The items that can be entered on the above screen are parameters related to the operation of the system, so there is
no need to change it.
If the system is operating normally, please do not change the value. To change the setting please enter the password
"keycom123".
A description of each parameter is explained in Appendix 2.
8

Click the "Start Turning Motor" button and rotate the rotating mirror. (Please wait for about 5 seconds until the
(3)Setting of turning motor
When you select " Parameter Setting 2 (Setting of turning motor) " from "Settings" on the main screen, the following
screen will be displayed.
Items that can be entered on the above screen are parameters related to timing of measurement, so there is no need
to change. If the system is operating normally, please do not change the value.A description of each parameter is
explained in Appendix 2.
(4)Scale change screen
While the P (d) or P (x) graph is displayed in the image display area, the following screen will be displayed if you select
Scale (graph scale) from the Settings menu on the main screen.
For the graph displayed on the main screen, it is possible to specify the maximum value, the minimum value, and the
increment of the scale for each axis.
(5)Measurement procedure
To acquire image data, follow the procedure below.
①Start the measurement program.
②
Wait until the initialization process ends.
After that, set measurement parameters such as Title, comment,
distance range, φrange, number of measurements.
③
rotation stabilizes.)
9

④Click the "Start Measurement" button to start acquiring data.
⑤If necessary, set the Max Level /Min Level of the image, Distance specifications, the P(d)/P(x) graph display.
(6)Saving measured data (For each saved data format, refer to Appendix 1.)
In addition to performing automatic saving of measured data, you can also execute it from the File menu.
There are the following three types of storage.
(a) Save the latest acquired data in raw data format
Select "Save as raw data" from the "File" menu on the main screen.
The measured data is saved in CSV format.
In this case, only one image data is saved.
(b) Save multiple measured data (Multiple File)
Select "Save as Multiple File" from the "File" menu.
Measurement data stored in memory is saved in CSV format.
Up to 1000 image data can be stored in the memory. A serial number is automatically assigned to the file name, and
a file is created for each image data.
The contents of the memory are cleared each time the "Start Measurement" button is clicked.
(c) Save as bitmap or JPEG
Select Save as image from the File menu.
The same operation can be done from the Save as image button on the main screen.
10

7.Acquisition of RCS
Acquiring the target’s RCS value is done in the following two steps.
(1) Reference measurement of target with known RCS value
(2) Measurement of RCS value unknown targets and RCS calculation
The operation of each step is explained below.
(1) Measure reference with known RCS value
Measure the reflected reception power of the object to be measured (known target, CR corner reflector, etc.) whose
RCS value is already known and store it in the measuring device as a reference with correspondence between RCS
value and received power. In order to calculate the RCS value by measuring the measurement object whose RCS
value is unknown, it is necessary to memorize this reference in advance.
① Measure the distance between the radar and the known target , set the distance range slightly longer so that the
reflected signal of the target
cm) of the radar.
And then acquire 2D imaging data.
(Note) Even if it is a point target like a CR,
of
more than 75cm
in the distance direction. Please click the Recalculate button when changing distance
comes in
the distance range
its
Tx pulse width is 5 ns, and there is a received signal with a width
in consideration of
the transmission pulse width (75
range.
②Drag the mouse in the image display area and place the target within the rectangular area.
Hold the left button and
move the mouse.
Release the left button here.
By designating the range like this, it is possible to measure only the reflected signal of the desired target (CR).
(Reference) To check the actual θ, φ angle of the specified rectangular range, you can check the angles of the start
and end points by opening the setting and clicking Specify Rectangle Range as shown below. (It is also possible to
specify by specifying an angle at the start point and the end point of this rectangular range specification.)
③Enter the measured distance (m) of CR in the "measured distance" field of the " RCS Reference" frame, enter the
known RCS value (dBsm) in the "RCS value input" field. When clicking the Get Reference button, the values of
the "total received power value (Total Power)" field, the "peak power value (Peak Power)" field and the "RCS value
11

input (Reference RCS) It is reflected in the system as a reference.
The maximum value of the received power value
Enter the RCS value (dBsm) for
the reference here.
which is phase-synthesized at the same distance
and averaged at the selected range is displayed.
The maximum peak value of the
measured received power value is
displayed.
Enter the actual distance
of the reference here.
Click here to reflect the
reference.
(Note: The value obtained here is saved in the measuring device (personal computer software) until new reference is
obtained.)
For confirmation, enter the same distance (m) as the reference in the "Distance" field of the "Target" frame with the
distance range and rectangle range intact and "RCS calculation (Calculate RCS) "button is clicked, the calculated values
are displayed in the" total reception power (Total Power) "field, the" peak power value (Peak Power) "field and the"
RCS value result (RCS Result) " Confirm that the RCS value entered in the "Reference value (RCS Reference)" frame
and the measured and calculated RCS value of the "Target" frame almost agree.
In the case of a point target like CR, both Total RCS value and Peak RCS value almost agree. (See the figure below)
The RCS value calculated from the
maximum value of the phase
synthesized received power value of
the same distance is displayed.
Enter the same distance (4m) as
the reference for confirmation
The maximum value of the received power value
which is phase-synthesized at the same distance
and averaged at the selected range is displayed.
The maximum peak value of the measured
received power value is displayed.
The RCS values calculated from the
maximum peak value are displayed.
Click to display the calculation
results in "Total Power", "Peak
Power" and "RCS Result".
(2)Measurement of RCS value unknown targets and RCS calculation
Measure the reflected reception power of the measurement object whose RCS value is not known and calculate the
RCS based on the measurement result and the RCS reference stored in (1). (Caution) Please keep the unknown target
at the same distance as the REF measurement distance, preferably as much as possible from the REF measurement
time without measuring time. (When distance is different, distance correction of RCS value by radar equation is performed
and measurement is done, but please include including some error when REF measurement environment and target
measurement environment · time are different.)
In the same way as (1) below
①Estimate the distance between the radar and the unknown target, set the measurement range in the distance
direction (Distance Range) slightly longer in consideration of the transmit pulse width (75 cm) of the radar, and then
acquire the 2D imaging data. Please click the Recalculate button when changing distance range.
②If the REF measurement distance is different from the target measurement distance, measure the distance of the
target or click the cell at the center of the target to be measured in the image display area to display the P (d) graph
and set the target distance to Confirm and change "Distance (m)" in "Target" frame. The distance of the pulse radar
12

is read at the rising edge of the pulse, but the distance of the point where the amplitude exceeds 80% of the peak and
the point where the power exceeds the peak of -2 dB is taken as the measurement distance of the IM radar. As an
example, the P (d) graph of the target at 5.5 m is shown below. When you click the -2 dB point of the peak, the
measured distance is displayed at the bottom of the screen.
P (d) graph display of 5.5 m target
(Since the Distance scale is set to -2 m ~, the transmission leakage is visible to 0 m.)
③Drag the mouse in the image display area and place the target within the rectangular area.
④Finally, clicking the "Calculate RCS" button in the "Target" frame displays the calculated values in the "Total
Power", "RCS result" field, "Peak Power" and "RCS result" fields.
Measurement example of target with unknown RCS value (actually CR 10 dBsm) with distance (5.5 m) different from
REF measurement distance. Even if the distance changes, the RCS measurement results almost agree.
[Reference] The following figure shows the signal intensity distribution in the horizontal direction in which the tilt + 3.5 °
distance designation is dragged to 5.7 m in the above figure and P (x) graph is displayed.
13

(3)Use of past measurement data
In this system, it is possible to read the data file of the reference and the target previously measured and saved. (You
can only read CSV files.)
For example, it can be used to read past reference data and measure the RCS of a new target based on it.
To read the data file, follow the procedure below.
①Select "Open" from the "File" menu on the main screen and open the saved file.
②Since the file is reproduced in the state immediately after the file is measured on the main screen, all operation /
RCS calculation described in 7 above becomes possible. However, 0 m point correction value, distance range,
rectangular range, target distance, RCS calculation result are read from the reproduced CSV data and displayed, but
the REF data is not read and the previous reference value of the IM radar display software was acquired The data
of time is left. To reproduce the REF data that acquired the reference value and measure the RCS of another target,
correctly input the measured distance of the reference value on the REF reproduction screen, and then input the
reference value acquisition button without changing the distance range and rectangular range After clicking to reflect
the REF, read the CSV file of another target, specify the distance range, the rectangular range, the target distance
and then measure the RCS. Please click the Recalculate button when changing distance range.
8. Difference between Total RCS and Peak RCS
(1)Peak RCS value calculation method
The method of using the maximum reflection level in the rectangular range and distance (time) range for calculation
as the RCS of that target. Specifically, convert the I and Q components of each cell selected in the rectangular range
and distance (time) range to amplitude, and select the maximum amplitude max from among them. Calculate the RCS
value by converting the amplitude max to the power value and then comparing it with the REF power value.
(2)Calculation method of Total RCS value
It is a calculation method that takes into consideration that I and Q signals received at the same time in the selected
rectangular range and distance (time) range should be phased. When the distance between the radar and the target is
long, the I and Q signals at the same time on the entire target are phase synthesized. If the distance is short, the I and
14

Q signals at the same time in the rectangular range of a part of the target are phase synthesized. In this method, the
range synthesized by the beam width of the actual radar is different, so it is necessary to take this point into
consideration in the short range.
I and Q signals at the same time in the selected rectangular range are phase synthesized and multiple amplitude values
are obtained within the selected distance (time) range. We select the maximum amplitude in the distance (time) range
and set the RCS value calculated by the phase-synthesized I and Q signals as the RCS of that target. Calculate the
RCS value by converting the amplitude max to the power value and then comparing it with the REF power value.
(3)Difference between Total RCS and Peak RCS
As you can see from the above explanation, Peak RCS is the largest one among the selected rectangular range and
distance (time) range, so even if you change the range somewhat, there is not much variation.
To the contrary, since Total RCS is calculated by phase combination of I and Q components within the rectangular range
and distance (time) range, the calculated value changes by changing the rectangular range and distance (time) range,
but the rectangular range and By appropriately setting the distance (time) range, it is thought that calculation results
close to those measured by actual radar can be obtained.
9.Usage notes
(1)Since the radome on the front of the equipment is a 0.1 mm Teflon sheet, please handle it carefully so as not to
damage it. Especially when packing and transporting, please apply a protective plate so that pressure is not applied to
the radome side.
(2)If the operation stops for some reason during measurement, turn off the power of all the devices and turn the power
on again.
(3)To terminate the measurement program and restart it,
according to the following procedure.
①Terminate the measurement program.
②Turn off the power of the main unit.
③Turn on the power of the main unit.
④Wait approximately 10 seconds to start the measurement program.
(4)Since the main body of the device is not waterproofed, please be careful that there is no water wetting etc.
(5)Do not operate the machine by tilting it. Failure to do so may result.
(6)If the initialization operation does not end even after launching the software, turn off the power, insert a thin rod
from the 3 Φ adjustment hole at the bottom of the radome, level the mirror manually, then turn the power back on.
(It may not be possible to start if the mirror is inclined.)
3 Φ adjustment hole
(7)Connect other antennas and transmitters to this radar and do not install or operate it.
please turn on the power of the main unit again
CAUTION
(8)This equipment complies with the FCC radiation exposure limitation stated on an uncontrolled environment and
meets the FCC Radio Exposure Guidelines. Please leave this device 20 cm or more away from the human body and
install and operate it.
15

10.specification
Model name RCS05
Frequency 76.5GHz (76-77GHz) Occupied frequency bandwidth: 1GHz
RF Output Power + 6dBm typ. (+8~+4dBm) Ant gain: 35dBi EIRP: +41dBm typ. (+43~+39dBm)
Radar system Pulse radar Emission identifier: P0N
pulse width: 5ns
pulse repetition frequency:1MHz
Rated Supply Voltage +12V DC
Horizontal Detection
33°
Angle steps for
0.5°
horizontal
Angle resolution 3°
Sensitivity for
50m
distance(RCS10dBsm)
Accuracy for distance 15cm
Resolution for distance 1m
Display • Image
• RCS of an object or enclosed part
• Signal strength of specified part
Record • 2D data(Get on screen refresh time)
• 3D data(You need the HDD. You need ten times the time in 2D data)
External output • Clock output for camera synchronization (for shooting radar screens and camera photos
at the same time)
Vertical Detection angle 20°
Angle steps for horizontal 2° Screen Refresh Time 0.9 seconds
Angle steps for horizontal 0.5° Screen Refresh Time 4 seconds
Vertical Detection angle 10°
Angle steps for horizontal 1° Screen Refresh Time 0.8 seconds
Angle steps for horizontal0.5° Screen Refresh Time 2 seconds
Vertical Detection angle 5°
Angle steps for horizontal 0.5° Screen Refresh Time 0.7 seconds
Vertical Detection angle 0°
Screen Refresh Time 0.1 seconds
16

points in the vertical direction
(Appendix 1) Data format of saved files
1.Multiple File format
The measurement data file is a text file in CSV format and can be read by spreadsheet software such as Excel.
The structure in the file is as follows, one file is created every time the image data is scanned once.
Multiple File
Header section
Measurement data section
Rectangular range data
section
Two-dimensional display
section
Each part will be explained below.
(1)Header section
File ID: RI76G0301 ←file identifier
Title: CR-a=130mm ←Measurement name
Date/Time: 2011/12/13 18:48:14 ←Measurement date and time
Comment: Corner reflector a = 130 mm ←Comment
Frequency[GHz]: 76.5 ←Transmission frequency
Range ←Distance range
Min[m]: 5
Max[m]: 10
Number of Data Points
Theta:
Phi:
61 ←number of data points in the horizontal
direction N
11 ←number of data
M
Start Point ←Measurement start angle
Theta[deg]: -15
Phi[deg]: -10
Stop Point ←measurement end angle
Theta[deg]: 15
Phi[deg]: 10
Increment ←measurement angle unit
Theta[deg]: 0.5
Phi[deg]: 2
Reference ←Reference with known RCS value
Power[dBm]: 8.266 -4.219 (total power, peak power)
RCS[dBsm]: -10
Distance[m]: 4 ←Actual measured distance of reference
17

Target ←target with unknown RCS value
Power[dBm]: 9.70802 -4.154127 (total power, peak power)
RCS[dBsm]: -0.05798 -1.435127
4 ←measured distance or measured distance of target by IM radar or
Distance[m]:
estimated distance
(2)Measurement data section
Maximum value data is stored as one coordinate on one row
Theta θcoordinate (unit: °)
Phi φcoordinate (unit: °)
d Distance of maximum value (unit: m)
I I value of I / Q detection (digital value obtained from A / D converter)
Q Q value of I / Q detection (digital value obtained from A / D converter)
AMP Amplitude value (digital value) of voltage obtained from I / Q value
POWER Received power value (dBm) obtained from POWER I / Q value
(3)Rectangular range data section
Rectangle Rectangular area selected during RCS calculation
Start Theta: θ start angle of the rectangular area (unit: °)
Start Phi: φstart angle of the rectangular area (unit: °)
Stop Theta: θ end angle of the rectangular area (unit: °)
Stop Phi: φend angle of the rectangular area (unit: °)
Freq[GHz] for Calc.: Frequency when calculating reference value and RCS value
(4)Two-dimensional display section
Here, the received power value (dBm) for each measuring point is expressed in two-dimensional form.
The horizontal axis is the θ direction and the vertical axis is theφdirection.
18

ilt direction
2.Format of raw data file
The raw data file is a text file in CSV format and can be read by spreadsheet software such as Excel.
The configuration in the file is as follows, and the data for one scan of the image data is recorded.
raw data file
Header section
Measurement data section
Rectangular range data
section
Same as the format of multiple file
Two-dimensional display
section
header of raw data
Data section of raw data
Since the first header part to the two-dimensional display part have the same format as the measurement data file, the
explanation is omitted.
Each item of the raw data section is explained below.
(1)header of raw data
Pulse Width
1 ←It is a value representing pulse width, but ignore it because it is not
used.
Distance Offset 90 ←"0 m point correction value" on the parameter setting screen
Up(1)/Down(0) 0 ←Flag indicating the t
Scanning in the upward:1
Scanning in the downward: 0
(2)Data section of raw data
Theta Position Cell coordinate Pθ
Phi Position Cell coordinate Pφ
Sample Number Sampling number
I I value of I / Q detection (digital value obtained from A / D converter)
Q Q value of I / Q detection (digital value obtained from A / D converter)
Amp Amplitude value (digital value) of voltage obtained from I / Q value
19

(Appendix 2) Explanation of system parameters
Parameters related to the operation of this system can be set from the screen.
These parameters are described below.
1.Parameter setting 1
No. Name Description
1 Limit sensor upper end The angle from the upper limit sensor position to the horizontal
position in the tilt motion is expressed as the product of the motor
moving step number (3000) and the gear ratio (19). One tilt rotation
(360 °) corresponds to 57 thousand steps.
2 Tilt speed (RPM) The speed of the tilt motor is expressed in rpm.
3 Tilt acceleration (Rev / s 2) The tilt motor acceleration is expressed as Rev / s2.
4 Digital filter proportional term
This is the proportional term of the digital filter of the tilt motor.
5 Digital filter integral term This is the integral term of the digital filter of the tilt motor.
6 Overshoot upper end As the upper end of the movement range in the tilt motion, the angle
from the horizontal position is expressed by the number of moving
steps of the motor. One tilt rotation (360 °) corresponds to 57
thousand steps.
7 Overshoot lower end As the lower end of the movement range in the tilt motion, the angle
from the horizontal position is expressed by the number of moving
steps of the motor.One tilt rotation (360 °) corresponds to 57 thousand
steps.
8 Measurement upper end As the upper end of the measurement range in the tilt motion, the
angle from the horizontal position is expressed by the encoder step
number.
One encoder revolution (360 °) corresponds to 8192 steps.
9 Measurement bottom end
position
As the lower end of the measurement range in the tilt motion, the angle
from the horizontal position is expressed by the encoder step number.
One encoder revolution (360 °) corresponds to 8192 steps.
10 0 m Point correction value This is an adjustment value to adjust the measurement distance.
11 sampling resolution (m)
This represents discrete value of the sampling distance.
12 I Signal offset This is an offset adjustment value for I signal. (It is normally 0)
13 Q signal offset This is an offset adjustment value for the Q signal. (It is normally 0)
14 ADC input impedance Indicates the input impedance of the A / D converter.
15 ADC full-scale voltage This is the voltage range of the A / D converter used in this device.
16 Antenna attenuation loss This represents the attenuation loss value of the antenna.
17 Measurement time interval If it is necessary to keep the measurement interval constant, specify
the repetition time
of measuring
one image longer than the actual
measurement time.
If the specified measurement interval is shorter than the actual
measurement time,
the latter is applied.
2.Parameter Setting 2 (Setting of turning motor)
No. Name Description
1
Measurement start delay time
This is the delay time from the heading sensor detection in the
turning direction to the start of data acquisition. (It is a unit of μ
20

seconds)
2 Interval Frame Number The number of frames averaged.
(Appendix 3) Maintain settings
Various setting values are saved in the file
named
“initRADAR.dat”.
When you log in to a personal computer with a user name and install a software from the CD-ROM, the initial
“initRADAR.dat” is also saved in the same folder as the software exe file is.
When you start up the software after installation, the software reads “initRADAR.dat”. But when you exit from the
software, “initRADAR.dat” is saved in a different folder which is automatically specified by your personal computer’s
OS according to user names.
If you log in to the computer with the same user name as the one named when you installed the software, it reads the
saved “initRADAR.dat” and the setting value you saved last time is reproduced.
When you changed some settings, the various setting values are automatically saved in “initRADAR.dat” when you exit
from the software.
(Note) If you log into the computer with a different user name from the one which was named when the software was
installed and you do not have rights to access to the folder where the “initRADAR.dat” is, various setting values may
not be automatically saved in “initRADAR.dat” when you exit from the software.
21
 Loading...