

Kestrel Meters 4100 User Manual
NK
Kestrel® 410 0
Pocket Air Flow Tracker
Instruction Manual
Kestrel® 4100 Pocket Air Flow Tracker
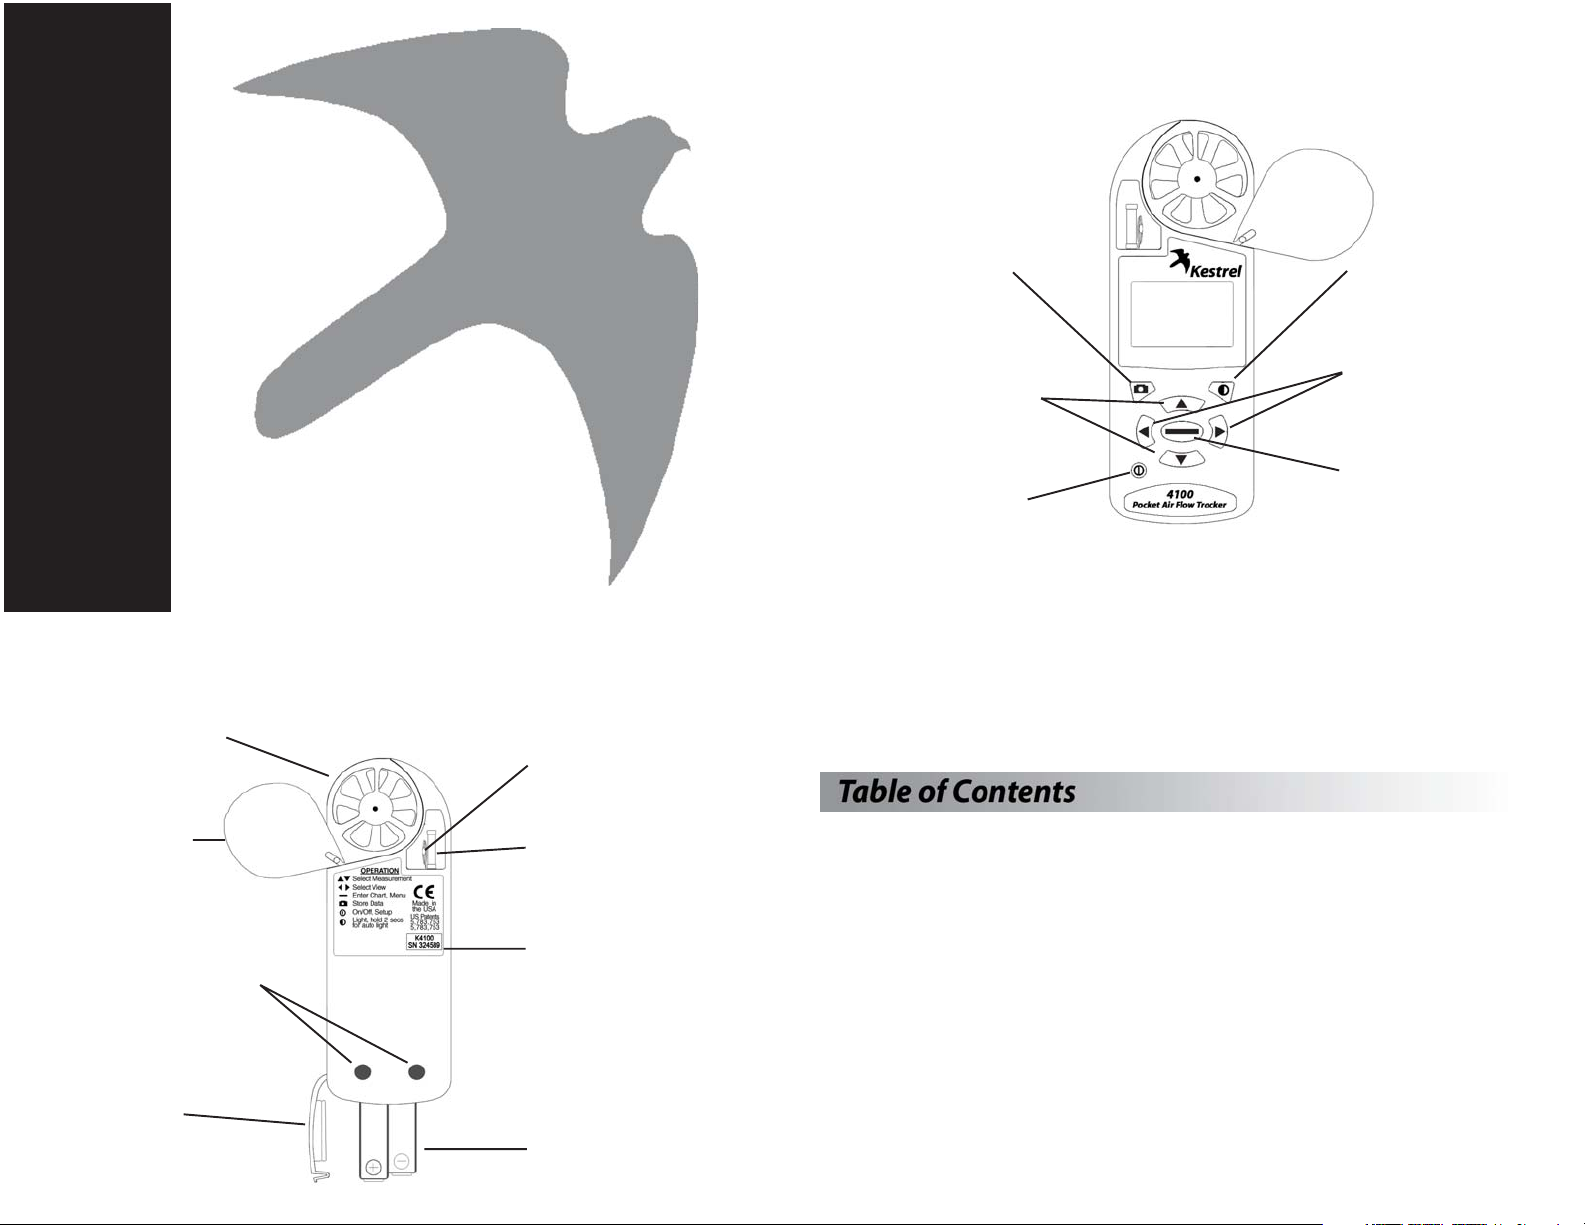
MANUAL MEMORY BUTTON
Press to manually store current
conditions to memory.
MEASUREMENT BUTTONS
Press to scroll between screens:
Date/Time, Measurements,
User Defined Screens
POWER/SETUP BUTTON
Hold to turn power on or off. Press
to enter and exit Main Setup Menu.
FRONT
BACKLIGHT BUTTON
Press to activate
backlight
for 1 minute.
MODE BUTTONS
Press to change mode of
measurements: Current,
Min/Max/Avg, Chart.
COMMAND BUTTON
In Chart Screens, press
to view data points.
In Setup Menus, press
to make selection.
2
Kestrel® 4100 Pocket Air Flow Tracker
IMPELLER
Sapphire jewel bearings
on a user-replaceable
impeller.
IMPELLER COVER
Swivel cover protects
impeller when not in use.
DATA UPLOAD OPTICAL COUPLER
Software and serial port
interface sold separately.
BATTERY DOOR
Sealed with o-ring to keep
product watertight.
BACK
TEMPERATURE SENSOR
Hermetically sealed
precision thermistor.
HUMIDITY SENSOR
Capacitive sensor.
SERIAL NUMBER
2 AAA BAT TERIES
Congratulations on your purchase of the Kestrel 4100 Pocket Air Flow Tracker! The Kestrel 4100 is the next
generation of handheld HVAC instruments. Now, you can instantly measure air velocity, air flow and
environmental conditions easily, accurately, and right in the palm of your hand.
While the Kestrel 4100 is user-friendly and simple to use (and the Quick Start Card will help get you started),
reading the instruction manual is recommended in order to use the Kestrel 4100 to its fullest potential. NK,
manufacturer of Kestrel Pocket Weather Meters, is available to answer questions and provide support. Contact
NK by phone: 610.447.1555, fax: 610.447.1577, email: info@nkhome.com, or web: www.nkhome.com.
Getting Started
Screen Navigation
Special Functions
Main Setup Menu 10-12
Application Examples 13
Memory Capabilities 14
PC Upload 14
Glossary 15
Factory Default Settings 16
3
NK
Specifications 17
Pouch and Lanyards 5
Battery Installation 5
On/Off 5
Date and Time Set Up 5
Measurements and Modes 6-7
Charts 7
User Screens 8
Min/Max and Averaging 8
Relative Humidity 8
Backlight 9
Air Flow 9
Manual Data Storage 9
4
Pouch and Lanyards
Wrist and neck lanyards and a small pouch have been provided. To install
the lanyard of your choice, feed the thin end of the lanyard around the
metal post on the battery door (as shown in diagram). Feed the thick
end of the lanyard through the loop on the thin end. Using tweezers
can help.
Battery Installation
Use only AAA batteries. Install batteries as indicated on the battery door. After installing the
batteries, the Kestrel 4100 will automatically start in the Date and Time Setting mode. (See Date
and Time Setup below.) Custom settings and chart data will be saved during a battery change.
Turning the Kestrel 4100 ON and OFF
ON: Press the
OFF: Hold the
button.
button for two seconds. Or, press the button, then press the button with the
word OFF highlighted. (Note: If auto store is enabled, your unit will continue to automatically
store data when the power is turned off.)
The Kestrel 4100 is set up to display 6 Measurements (some are actually
calculations) in 3 Modes.
The Measurements are listed to the right with their corresponding screen
icon. Use the
and buttons to scroll through the various Measurements.
The Modes are:
Current - displays the instantaneous reading
Min/Max/Avg - displays the Minimum/Maximum/Average readings from
stored data
Chart - displays a graphical representation of up to 480 stored data points
Examples of each of these screens are shown below. Use the and buttons
to scroll through the various Modes.
Modes use
Measurements
use
Air Velocity
Air Flow
Temperature
Wind Chill
HI
Humidity
Heat Index
Dew Point
Date and Time Setup
The first time that you turn on your Kestrel 4100, as well as after a battery change,
you will need to set the date and time. The Introduction Screen will appear for 3
seconds, followed by the Date/Time Setup Screen. Press the
to scroll through the settings. Press the
and buttons to scroll through the
setting options. After entering the date and time, press the
and buttons
button to exit
the Date/Time Setup. Then press the button again to exit the Main Setup Menu.
5
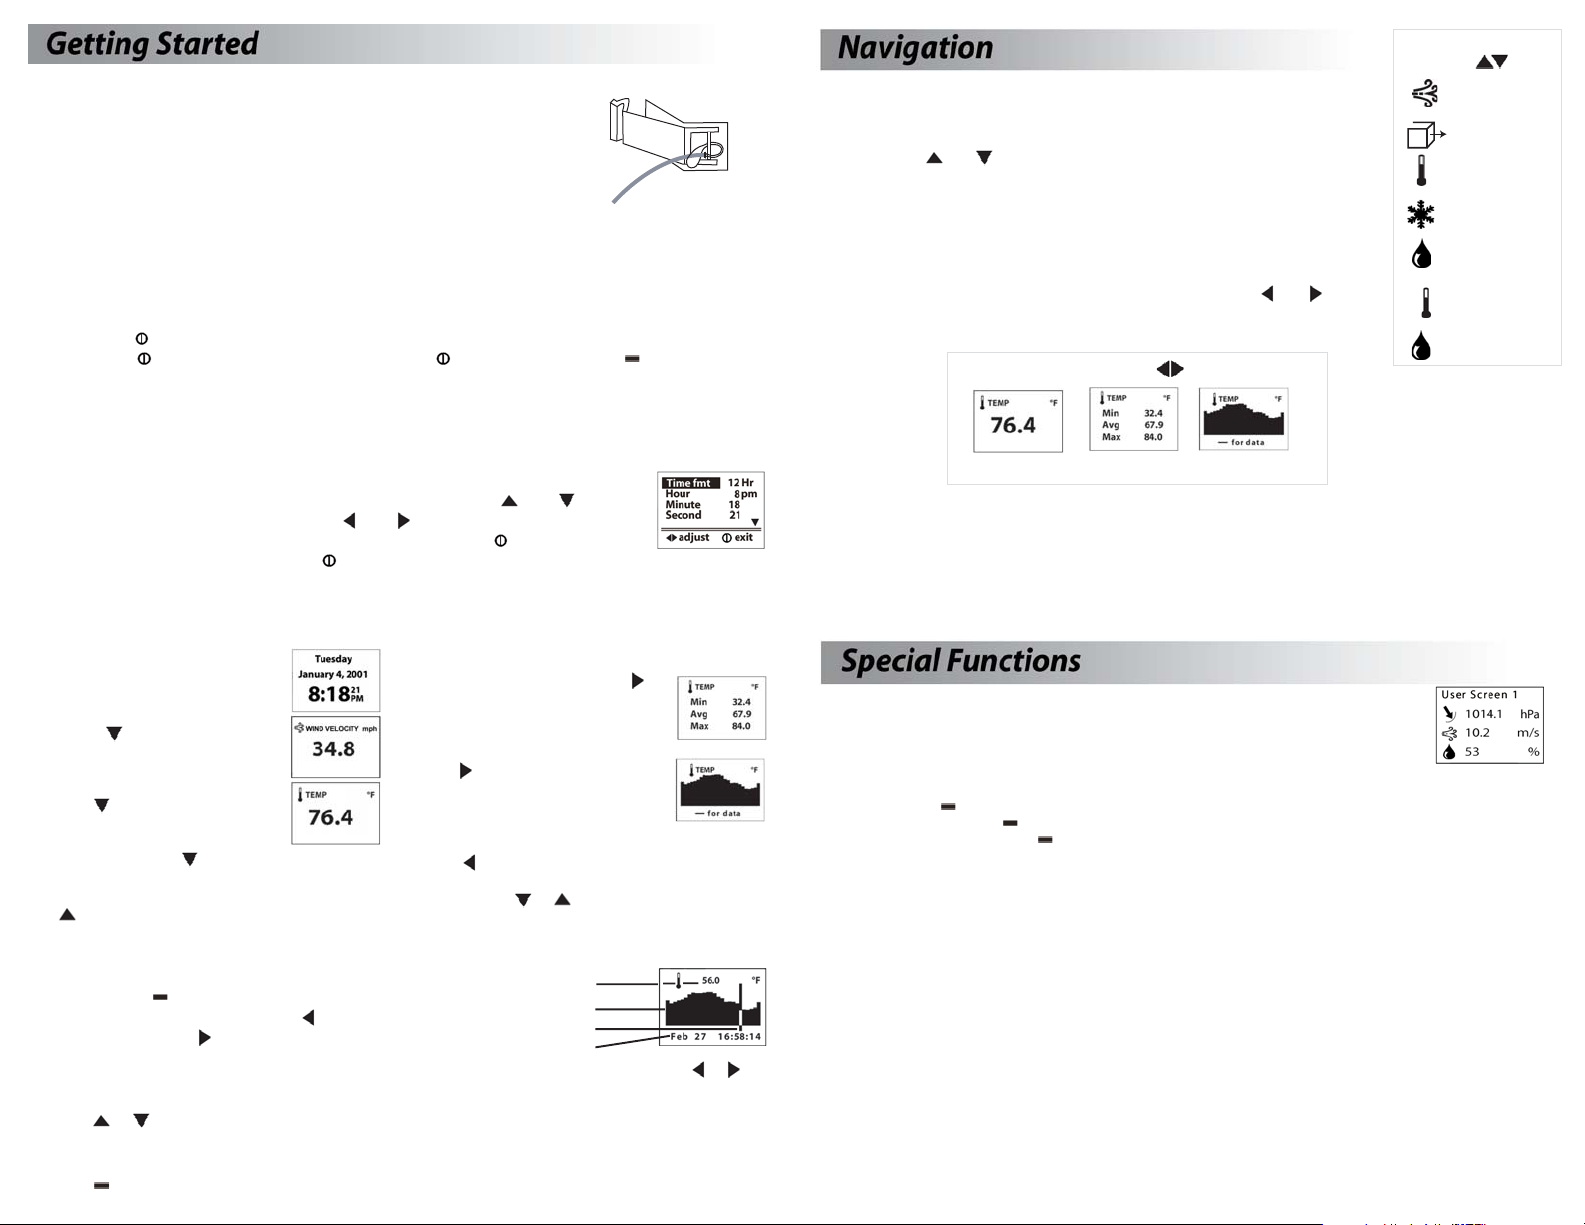
Measurement Navigation
Starting on the Date & Time Screen…
…Press the button to scroll to the
Current Wind Velocity Screen.
Press the button again to scroll to
the Current Air Flow Screen.
Continue pressing the button to scroll through
the Current Measurement Screens, listed on the
previous page, followed by the 3 User Screens. Press
the button to scroll through these screens in
reverse order.
Mode Navigation
While in a Current Screen, press the
button to view the Min/Max/Avg for a
measurement. If there is no stored
data, the values will be displayed as --.-
Press the button again to view a
chart for the measurement. If there is
no stored data, the axis will appear, but
the chart will be blank.
Press the button to return to the Min/Max/Avg and
Current Screens. From either Min/Max/Avg or Chart
Screen, press the or button to scroll through the
Min/Max/Avg or Chart Screen for the other
measurements.
Navigation of Charts
The Kestrel 4000 is capable of storing up to 480 data points. To review
the data, press the button while viewing a chart. A cursor will appear
on the most recent data point. Press the button to scroll through
older data points and the button to scroll through more recent data
points. The date and time at which the data was stored will be displayed
at the bottom of the screen. The data value will be displayed at the top of the screen. Hold down the or
button to scroll quickly through the data points.
Press the or button to review the data for the other measurements. Please note that the cursor will
remain at the same date and time. If new data is stored while viewing chart data, the entire chart will shift left
with the new data point charted on the right. The cursor will not shift with the chart.
Press the button to return to the Chart Mode.
Value
Chart
Cursor
Date & Time
7
Current Min/Max/Avg Chart
In addition to these Measurements and Modes, there are also 3 User Screens, which simultaneously show 3 current measurements (see pages 8 and 11 for more information); and the Date
& Time Screen, which gives the current date and time.
6
User Screens
The Kestrel 4100 has three User Screens which can be customized to display three
current measurements simultaneously. (See page 11 for setup instructions.)
Min/Max/Avg for Velocity, Air Flow and Wind Chill
The Min/Max/Avg values for Wind Velocity, Air Flow and Wind Chill are measured independently from the
stored and charted data. While viewing the Min/Max/Avg screen for either Wind Velocity, Air Flow or Wind
Chill, press the button when the screen displays “--average” to begin collecting data for both
measurements. Press the button when the screen displays “--stop” to stop collecting data and hold the
values on the display. Press the button when the screen displays “--clear” to clear the data. This routine will
work simultaneously for all measurements, regardless of which one is displayed while the routine is run. The
Min/Max/Avg for Wind Velocity, Air Flow and Wind Chill will not affect any other Min/Max/Avg or stored data.
Relative Humidity
The Kestrel 4000 is capable of measuring RH very accurately (+/- 3% RH). However, there are a number of
circumstances that can reduce the Kestrel 4000’s ability to perform within these specifications:
• Direct sun will heat the air inside the humidity sensor enclosure and cause inaccurate readings. Keep the
Kestrel 4000 in the shade when taking RH measurements.
• Rapid large temperature changes, such as when taking a Kestrel stored inside at 70°F outside to a
temperature of 40°F, can require as long as 30 minutes to for the temperature inside the RH enclosure to
match the temperature outside, permitting the unit to provide accurate RH readings. Any air flow over the
RH sensor enclosure, even as low as 2 mph, significantly speeds up the response time.
When taking measurements under conditions where there is a significant change in temperature (more
than 2C or 4F) be sure to allow enough time for the RH value to stabilize. The greater the temperature
change, the greater the time. You can use the logging capability of the K4000 to confirm that the unit has
stabilized to a correct reading: Set the memory options to a relatively short logging interval (20 seconds
works well, see page 10 for instructions), select the graphical display of RH, and you can see when the value
is no longer changing significantly. At that point, the RH value is stable and can be relied upon to be within
the accuracy specifications.
8
 Loading...