

Page 1
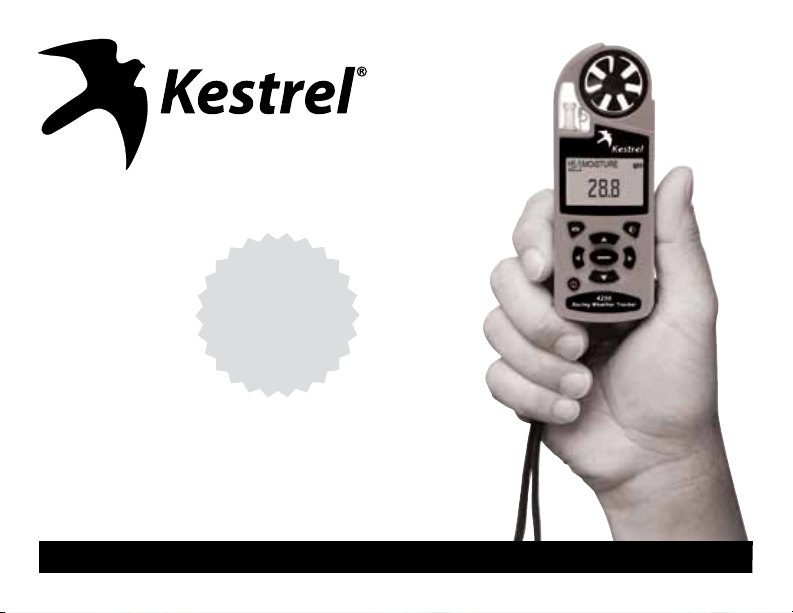
4250
Racing Weather Tracker
with Backlight
In a hurry?
Be sure to read pages
5-7 to ensure that
your Kestrel is setup
properly!
Instruction Manual for Kestrel 4250
Racing Weather Tracker
1
www.kestrelweather.com 800.784.4221
Revised 07/29/10
Revised 09/07
Page 2
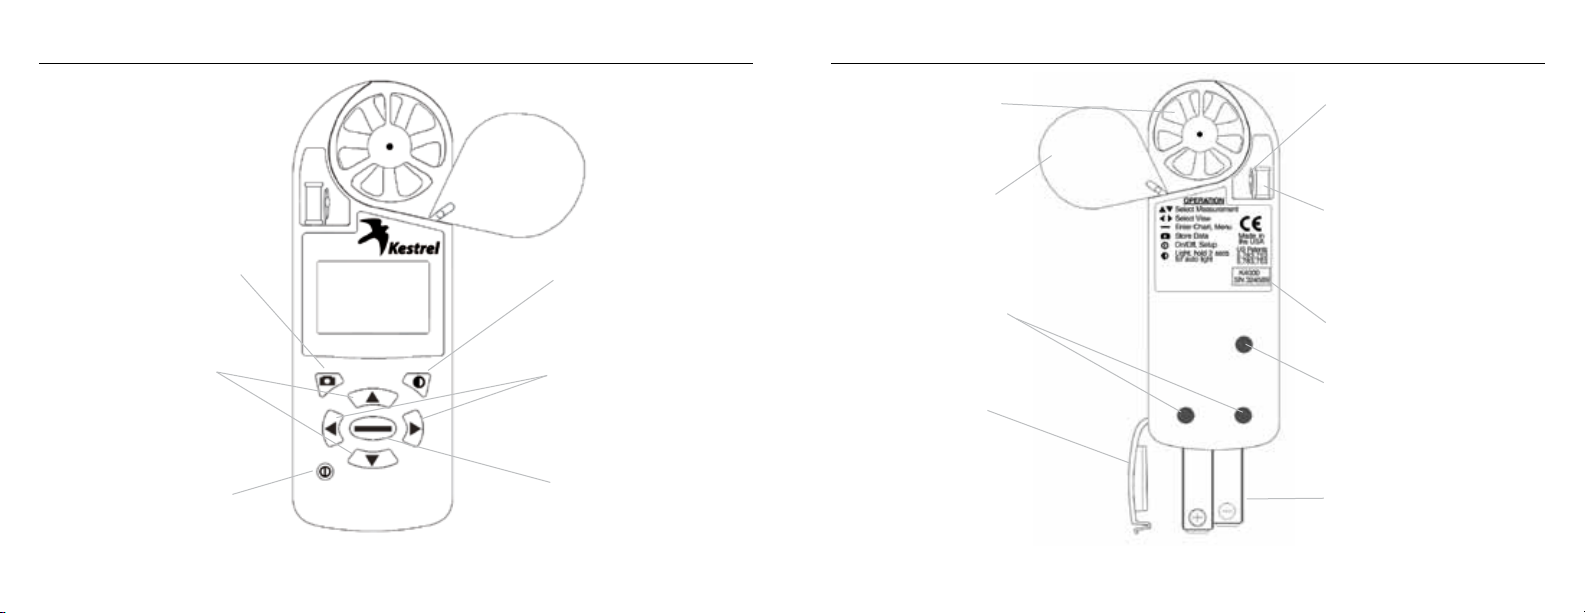
Kestrel® 4250 Racing Weather® Tracker
3
MANUAL MEMORY
BUTTON Press to manually
store current conditions to
memory.
MEASUREMENT BUTTONS
Press to scroll between
screens: Date/Time,
Measurements, User
Dened Screens
POWER/SETUP BUTTON
Hold to turn power on or
o. Press to enter and exit
Main Setup Menu.
IMPELLER Zytec™
V-bearings on a userreplaceable impeller.
IMPELLER COVER Swivel
cover protects impeller
when not in use.
BACKLIGHT BUTTON
Press to activate
backlight for 1 minute.
MODE BUTTONS Press
to change mode of
measurements: Current,
Min/Max/Avg, Chart.
COMMAND BUTTON
In Chart Screens, press
to view data points. In
Setup Menus, press to
FRONT BACK
make selection.
DATA UPLOAD OPTICAL
COUPLER Software and
serial port interface sold
separately.
BATTERY DOOR Sealed
with o-ring to keep
product watertight.
TEMPERATURE SENSOR
Hermetically sealed precision
thermistor coiled to isolate
from case temperature.
HUMIDITY SENSOR Capacitive
sensor with secondary
thermistor to improve
accuracy and response.
SERIAL NUMBER
PRESSURE SENSOR Monolithic
silicon piezoresistive sensor.
Do NOT insert any objects
into this hole.
AAA BATTERIES
Page 3
Kestrel® 4250 Racing Weather® Tracker
TABLE OF CONTENTS
GETTING STARTED . . . . . . . . . . . . . . . . . . . . . . . . . . . . . . . . . . . . . . . . . . . . . . . . . . . . . . . . . . . . . . . . . . . . . . . . . . . . . . . . . . . . . 5
NAVIGATION . . . . . . . . . . . . . . . . . . . . . . . . . . . . . . . . . . . . . . . . . . . . . . . . . . . . . . . . . . . . . . . . . . . . . . . . . . . . . . . . . . . . . . . . . . . 6
SPECIAL FUNCTIONS . . . . . . . . . . . . . . . . . . . . . . . . . . . . . . . . . . . . . . . . . . . . . . . . . . . . . . . . . . . . . . . . . . . . . . . . . . . . . . . . . . . 8
MAIN SETUP MENU . . . . . . . . . . . . . . . . . . . . . . . . . . . . . . . . . . . . . . . . . . . . . . . . . . . . . . . . . . . . . . . . . . . . . . . . . . . . . . . . . . .12
APPLICATION EXAMPLES . . . . . . . . . . . . . . . . . . . . . . . . . . . . . . . . . . . . . . . . . . . . . . . . . . . . . . . . . . . . . . . . . . . . . . . . . . . . . . 18
MEMORY CAPABILITIES . . . . . . . . . . . . . . . . . . . . . . . . . . . . . . . . . . . . . . . . . . . . . . . . . . . . . . . . . . . . . . . . . . . . . . . . . . . . . . . . 19
GLOSSARY . . . . . . . . . . . . . . . . . . . . . . . . . . . . . . . . . . . . . . . . . . . . . . . . . . . . . . . . . . . . . . . . . . . . . . . . . . . . . . . . . . . . . . . . . . . . 20
DEFAULT SETTINGS . . . . . . . . . . . . . . . . . . . . . . . . . . . . . . . . . . . . . . . . . . . . . . . . . . . . . . . . . . . . . . . . . . . . . . . . . . . . . . . . . . . .23
FREQUENTLY ASKED QUESTIONS . . . . . . . . . . . . . . . . . . . . . . . . . . . . . . . . . . . . . . . . . . . . . . . . . . . . . . . . . . . . . . . . . . . . . . 24
CUSTOMER SERVICE . . . . . . . . . . . . . . . . . . . . . . . . . . . . . . . . . . . . . . . . . . . . . . . . . . . . . . . . . . . . . . . . . . . . . . . . . . . . . . . . . . .29
Congratulations on the purchase of your Kestrel 4250 Racing Weather Tracker! The Kestrel 4250 is our newest
and most comprehensive Racing-specic instrument. It not only measures EVERY major environmental
condition easily, accurately and right in the palm of your hand, but now also automatically calculates Density
Altitude and Water Grains (Humidity Ratio).
While the Kestrel 4250 is user-friendly and simple to use, reading the instruction manual is recommended in
order to use the Kestrel 4250 to its fullest potential.
NK, manufacturer of Kestrel Pocket Weather Meters, is available to answer questions
and provide support. Contact NK by phone: 610.447.1555, fax: 610.447.1577, email:
info@nkhome.com, or web: www.kestrelweather.com.
5
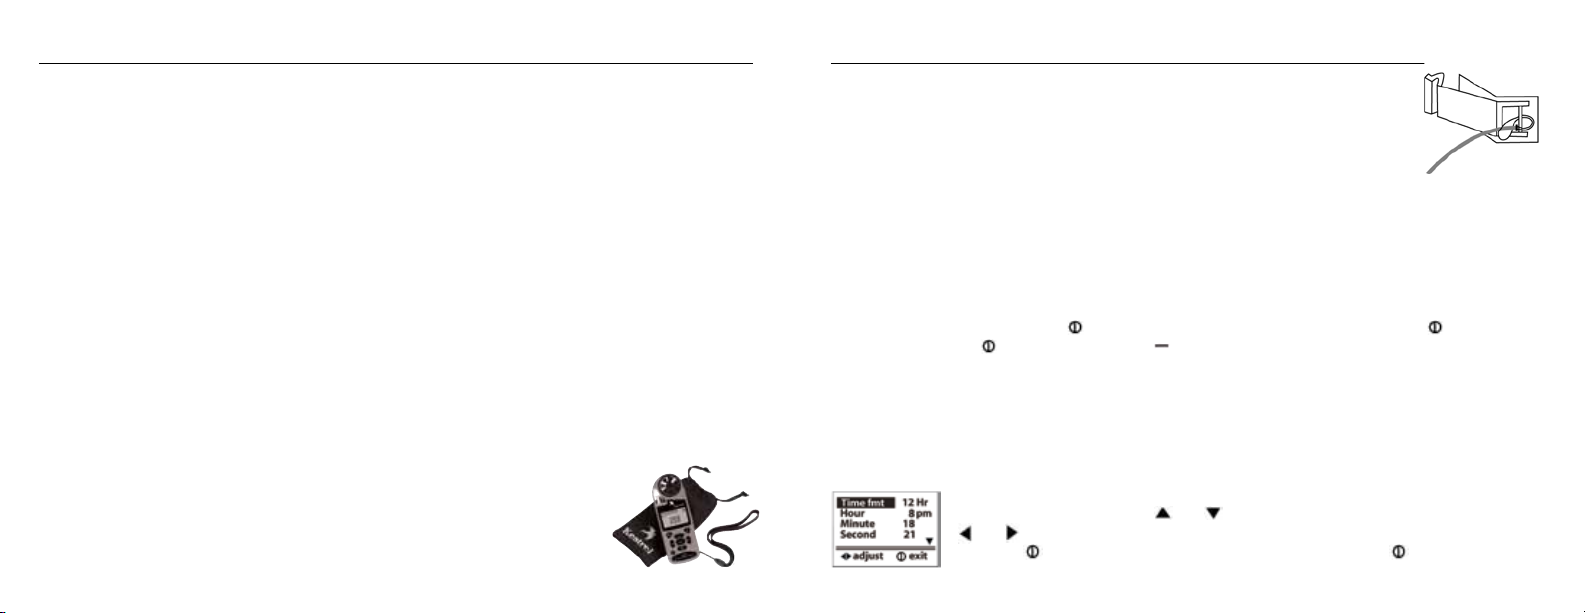
GETTING STARTED
Pouch and Lanyards
Wrist and neck lanyards and a small pouch have been provided. To install the lanyard,
feed the thin end of the lanyard around the metal post on the battery door (as shown
in diagram). Feed the thick end of the lanyard through the loop on the thin end. Using
tweezers can help.
Battery Installation
Use only AAA batteries. Install batteries as indicated on the battery door. After installing the batteries, the
Kestrel 4250 will automatically start in the Date and Time Setting mode. (See Date and Time Setup below.)
Custom settings and chart data will be saved during a battery change; only the date/time and MMA values
will be lost.
Turning the Kestrel Meter ON and OFF
To turn the Kestrel Meter ON, press the button. To turn the Kestrel Meter OFF, hold the button for two
seconds. Or, press the button, then press the button with the word OFF highlighted. (Note: your unit
will continue to automatically store data when the power is turned o.) When rst turned on, the Kestrel
Meter will display a splash screen displaying the model number, the battery indicator, and the code version.
This battery indicator will indicate the percentage of battery life remaining, which is helpful in preventing
unexpected dead batteries.
Date and Time Setup
The rst time that you turn on your Kestrel Meter, as well as after a battery change, you will need to set the
date and time. The Introduction Screen will appear for 3 seconds, followed by the Date/
Time Setup Screen. Press the and buttons to scroll through the settings. Press the
and buttons to scroll through the setting options. After entering the date and time,
press the button to exit the Date/Time Setup. Then press the button again to exit
the Main Setup Menu.
Page 4
Kestrel® 4250 Racing Weather® Tracker
7
Measurements use and
Wind Speed
Temperature
Humidity
Water Grains /Moisture
Dew Point
Station
Pressure
Density Altitude
Air
Density
Relative Air Density
Hidden Functions:
Wind Chill
Heat Index
Wet Bulb
Barometric Pressure
Altitude
See measurements section on p.14
to activate hidden functions
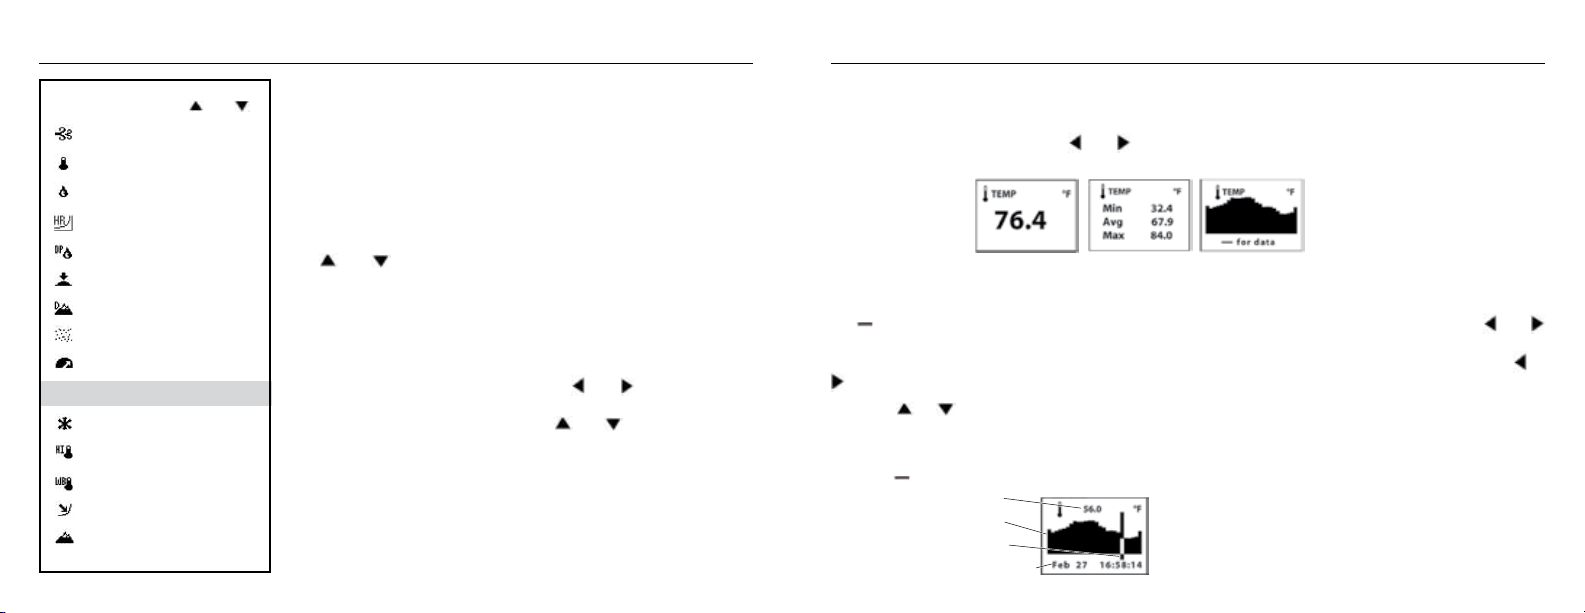
NAVIGATION
The Kestrel 4250 is set up to display 9 Measurements (some are
calculations) in 3 Modes.
The Measurements are listed here with their corresponding screen
icon. In addition to these Measurements and Modes, there are also 3
User Screens (one is hidden in default mode), which simultaneously
show 3 current measurements, and the Date & Time Screen. Use
the and buttons to scroll through the various Measurements,
followed by the 2 default User Screens and the Date/Time Screen. Any
of these screens can be turned o so that you can customize your
Kestrel Meter to show the screens that your application requires.
Additional measurements are available. (See the Measurements
section in the Main Menu.)
The Modes are displayed below. Use the and buttons to scroll
through the various Modes. From any mode, you may still scroll to a
dierent Measurement by pressing the and buttons.
Current - Displays the instantaneous reading.
Min/Max/Avg - Displays the Minimum/Maximum/Average readings
from stored data. If there is no stored data, the values will be displayed
as --.-.
Chart - Displays a graphical representation of up to 2000 stored data points for each measurement. If there
is no stored data, the axis will appear, but the chart will be blank. (See the following section for information
on Chart Navigation.) Modes use and
Navigation of Charts
The Kestrel 4250 is capable of storing up to 2000 data points for each measurement. To review the data, press
the button while viewing a chart. A cursor will appear on the most recent data point. Press the and
buttons to scroll through the data points. The date and time at which the data was stored will be displayed at
the bottom of the screen, and the data value will be displayed at the top of the screen. Hold down the or
button to scroll quickly through the data points.
Press the or button to review the data for the other measurements. Please note that the cursor will
remain at the same date and time. If new data is stored while viewing chart data, the entire chart will shift left
with the new data point charted on the right. The cursor will not shift with the chart.
Press the button to return to the Chart Mode.
Value
Chart
Cursor
Date & Time
Page 5
Kestrel® 4250 Racing Weather® Tracker
9
SPECIAL FUNCTIONS
Customizable User Screens
The Kestrel Meter has three User Screens that can be customized to display three current
measurements simultaneously. These screens can also be turned o. (See the Main Menu
section for setup instructions.)
Max/Avg for Wind Speed & Wind Chill
The Max/Avg values for the wind speed and wind chill values are measured independently from the stored
and charted data.
This allows the user to start and stop the averaging period in the most appropriate manner for their
application. Averaging on all wind-related values (Wind Speed and Wind Chill) will be started and
stopped together.
While viewing the Min/Max/Avg screen for any of these measurements, hold the unit into the wind, and
press the button when the screen displays “--average” to begin collecting data for all measurements, and
again when the screen displays “--stop” to stop collecting data and hold the values on the display. Press the
button when the screen displays “--clear” to clear the data. This routine will work simultaneously for all
measurements, regardless of which one is displayed while the routine is run. The Max/Avg for these wind
values will not aect any other Min/Max/Avg or stored data.
Manual Data Storage
To manually store data, press the button. One of the following will appear: Data Stored (data has been
captured and will appear on chart), Full (Overwrite is o and data log is full), or O (Manual Store button has
been disabled). (See the Main Setup Menu section for more information on memory.)
Backlight
The Kestrel Meter has a high-visibility green backlight, which makes the display easily read in low-light
conditions.
Press the
button within one minute to deactivate the light manually.
Relative Humidity
The Kestrel Meter is capable of measuring RH to a high accuracy: +/– 3% RH between 5 and 95%. To ensure
operation within these specications, please follow these recommendations:
• Avoid taking measurements in direct sunlight, which will heat the air inside the humidity sensor enclosure
• If your circumstances force you to expose the Kestrel Meter to a large temperature swing prior to taking
button to activate the backlight. The light will remain activated for one minute. Press the
and cause inaccurate readings.
a relative humidity reading (such as when taking a Kestrel Meter stored inside at 70° F outside to a
temperature of 40° F), you will need to take additional steps to ensure that the Kestrel Meter’s external
temperature sensor is in thermal equilibrium.
- Ideally, provide an wind speed of at least 1 M/S (2.2 MPH), over the temperature sensor—point the
Kestrel Meter into the wind. If there is no wind, simply wave the unit back and forth so air passes
over the sensors. With airow over the temperature sensors and humidity chambers, readings within
specications will be provided within two to three minutes, even after a large temperature shift.
- If no airow can be provided, you must allow sucient time for the RH value to stabilize. This can take
as long as 20 minutes—the greater the temperature change, the greater the time. You can use the
logging capability of the Kestrel Meter to conrm that the unit has stabilized to a correct reading: Set
the memory options to a relatively short logging interval (20 seconds works well), select the graphical
Page 6
Kestrel® 4250 Racing Weather® Tracker
11
display of RH, and you can see when the value is no longer changing signicantly. At that point, the RH
value is stable and can be relied upon to be within the accuracy specications.
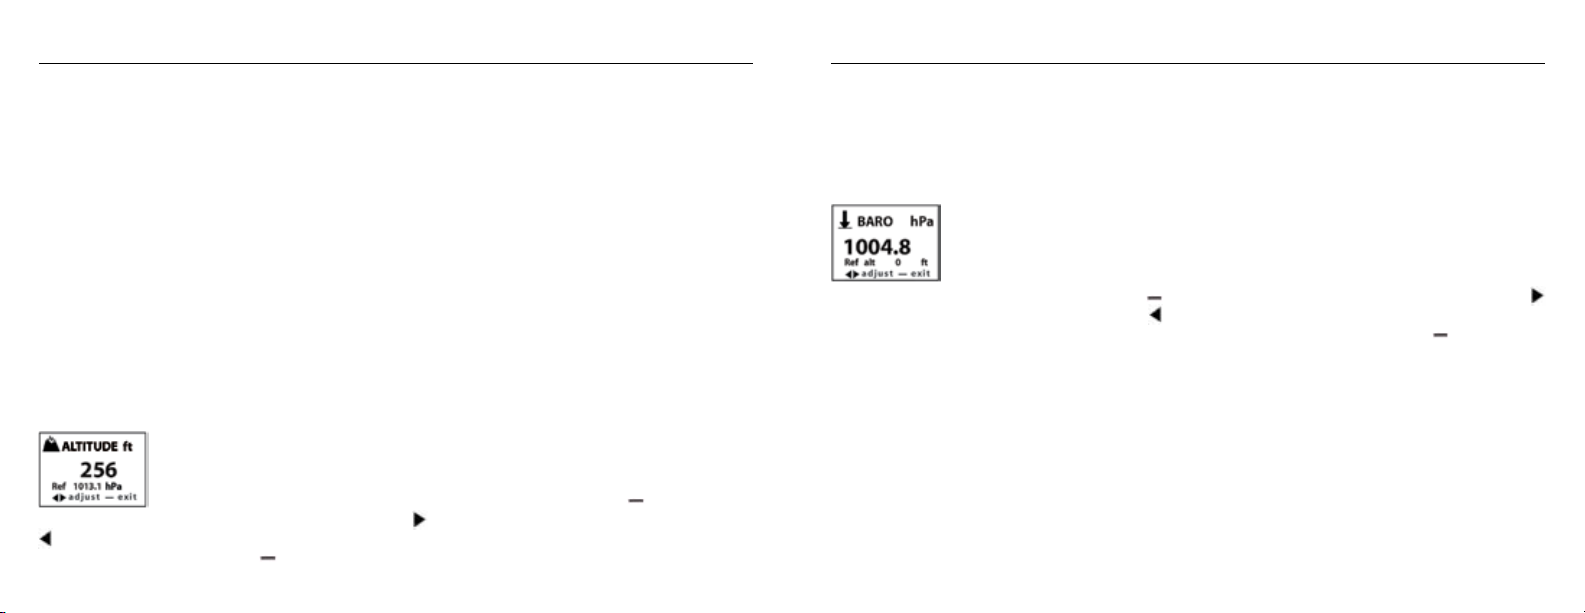
Station Pressure, Barometric Pressure and Altitude Adjustment
The Kestrel 4250 Meter measures “station” pressure — the actual air pressure in the measurement
location. Station (Absolute) Pressure is what is shown on the “Pressure” screen. Station pressure
changes in response to two things — changes in altitude and changes in the atmosphere.
* If your racing software program asks for Station Pressure or Absolute Pressure, then use the “Pressure”
screen displayed on the Kestrel.
* If your racing software program asks for Barometric Pressure and Altitude, see below.
Barometric pressure is station pressure corrected to sea level. In order to make the correction, the Kestrel
Meter needs an accurate reference altitude. Altitude is the height above sea level. In order to correctly
calculate altitude, the unit needs an accurate barometric pressure reference, also known as an “altimeter
setting”. Fortunately, you only need to know ONE of these values (current barometric pressure or current
altitude) in order to set your Kestrel Meter up to show accurate readings.
Starting with the known barometric pressure for your location
You can obtain your current barometric pressure by checking an internet weather site for
a nearby location, or contacting a local airport. Set this value as your reference pressure
on the ALTITUDE screen to determine your correct altitude: Press the button to enter
the reference setting mode. Press the button to increase the reference pressure or the
button to decrease the reference pressure. You will notice that the altitude will change with changes in
the reference pressure. Press the button to exit the adjustment mode. Set your Kestrel Meter down on a
table and allow the altitude reading to stabilize. (Note: very small changes in pressure generate noticeable
changes in altitude. In order to provide meaningful readings for activities where altitude changes quickly,
the Kestrel Meter features rapid altitude response. This is why the altitude readings tend to uctuate by a
few feet.) After obtaining a current altitude from the ALTITUDE screen, move to the BARO screen and enter
this value as your reference altitude by following the same procedure. Both readings will now be accurate.
Starting with a known altitude for your location
You can obtain your altitude from a topographical map or local landmark. Google Earth
is an excellent free program that provides the exact altitude for any given address: www.
earth.google.com/. Set this value as your reference altitude on the BARO screen to
determine your barometric pressure: Press the button to enter the reference setting mode. Press the
button to increase the reference altitude or the button to decrease the reference altitude. You will notice
that the barometric pressure will change with changes in the reference altitude. Press the button to exit
the adjustment mode. Again, allow the Kestrel Meter to stabilize, then enter the value from the BARO screen
as your reference pressure on the ALTITUDE screen by following the same procedure. Both readings are now
accurate.
When reviewing stored data, remember that changes in pressure AND changes in location/altitude will aect
the stored values. When tracking pressure changes relative to weather, set the reference altitude on the BARO
screen and keep the Kestrel Meter in one location. Your graph history will now show trends in barometric
pressure. Your altitude as shown on the ALTITUDE screen will change as the weather changes, but you can
ignore this screen for this purpose.
If you are planning a day hike would like to track your altitude, you’ll need to enter the correct reference
pressure on the ALTITUDE screen as described above in “starting with the known barometric pressure.”
You can now track the altitude changes as you hike. In this instance, you should ignore the values on the
Page 7

Kestrel® 4250 Racing Weather® Tracker
13
BARO screen, since the pressure changes will be due to changes in elevation far more than to changes in the
weather.
In general, changes in barometric pressure associated with weather changes are small over the course of one
day, but they will aect the accuracy of the altimeter over time. This is why aircraft reset their altimeters at
every aireld by entering the eld’s “altimeter setting” or reference pressure. Accordingly, if accurate altitude
readings are your primary interest, you should reset the reference pressure on your Kestrel Meter regularly.
If you encounter an elevation landmark, you can adjust the reference pressure until the altitude matches the
landmark elevation. This will correct the altitude for any pressure changes due to the weather. (Or, you can
obtain an updated reference pressure from the sources described above.)
The above discussion applies to ALL pressure altimeters, including one you may have in a watch or other
device, but not to GPS altimeters, which use satellite triangulation to determine altitude. Note that with
present GPS technology, pressure altimeters remain more accurate for measuring altitude change.
This is why airplanes still rely on pressure altimeters, not GPS.
Finally, the DENSITY ALTITUDE screen is calculated from the absolute values of station pressure,
relative humidity and temperature, and is not aected by the reference values entered in the BARO and
ALTITUDE screens.
MAIN SETUP MENU
You can customize your Kestrel Meter in multiple ways. Press the button to access the Main Setup Menu.
Press the button to select the highlighted setting. The Main Setup Menu contains: OFF, Memory Options,
Measurements, Graph Scale, Units, User Screens, System, Date & Time, Language and Restore.
O
Press the then the button to turn the display o. Even when the Kestrel Meter’s display is turned
o, the unit will continue to automatically store data at the dened Store Rate. The battery life will be
decreased if data is stored frequently. The only way to completely shut o the unit is to remove the
batteries. Custom settings and data will be stored when the batteries are removed.
Memory Options
These settings control the data storage properties.
Setting Description Operation
Clear Log
(Go/Done)
Reset MMA
(Go/Done)
Auto Store
(On/O)
Store Rate
(2 sec. – 12 hr)
All stored data is cleared. This will also clear
Min/Max/Avg data.
All Min/Max/Avg data is cleared. Chart data
will remain intact.
When On, data is automatically stored at
preset Store Rate. When O, data is only
stored when manually captured with the
button.
The frequency at which data sets are
automatically stored. (Battery life may be
shortened if data is stored frequently.)
Press or to clear the log.
Press or to clear the MMA.
Press or to toggle between
On and O.
Press or to increase or
decrease Store Rate frequency.
Page 8

Kestrel® 4250 Racing Weather® Tracker
15
Overwrite
(On/O)
Man Store
(On/O)
Measurements
Measurement screens can be turned o, or “hidden” from the normal measurement navigation. For
example, if wind chill is not of interest, it can be hidden. Press the
and OFF for each individual measurement. Press the or button to highlight the desired measurement.
Press the button to return to the Main Setup Menu. Even when measurements are hidden, the Kestrel
Meter will continue to log data for all measurements. If you wish to see the logged data for measurements
that are hidden, simply enter the Measurement screen and turn them back on. The data will be stored in the
same manner as all other measurements, as specied in the Store Rate.
Graph Scale
These settings control the chart limits of your Kestrel Meter. Depending on the conditions, the lower and
upper limits of the chart scale may need to be adjusted in order to get the best view of the data. Highlight
the desired measurement by pressing the or button. Select the highlighted measurement by
pressing the button. Press the or button to increase or decrease the value of the limits. Press the
or button to change between the upper and lower limits. Press the button to exit and return to the
Measurement Selection screen. Press the button to return to the Main Setup Menu.
This setting only applies when the data
log is full. When On, oldest data point is
discarded to allow memory for the new data
point. When O, new data points are not
saved.
When On, data is stored when the
button is pressed. When o, the button
is disabled.
or button to toggle between ON
Press or to toggle between
On and O.
Press or to toggle between
On and O.
Units
The units of measure can be adjusted to best suit the application. The following units are available:
Wind Speed m/s meters per second
Temperature, Dewpoint,
Wet Bulb Temp & Heat Index
Pressure inHg inches mercury
Altitude, Density Altitude m meters
Moisture (Water Grains) gpp grains per pound
Air Density lb/ft3 pounds per cubic foot
Highlight the desired measurement by pressing the
through the available units. Press the button to return to the Main Setup Menu.
km/h kilometers per hour
kt knots
mph miles per hour
fpm feet per minute
Bft Beaufort
°C Celsius
°F Fahrenheit
hPa hectopascals
psi pounds per square inch
mb millibar
ft feet
g/kg grams per kilogram
kg/m3 kilograms per cubic meter
or button. Press the or button to scroll
Page 9

Kestrel® 4250 Racing Weather® Tracker
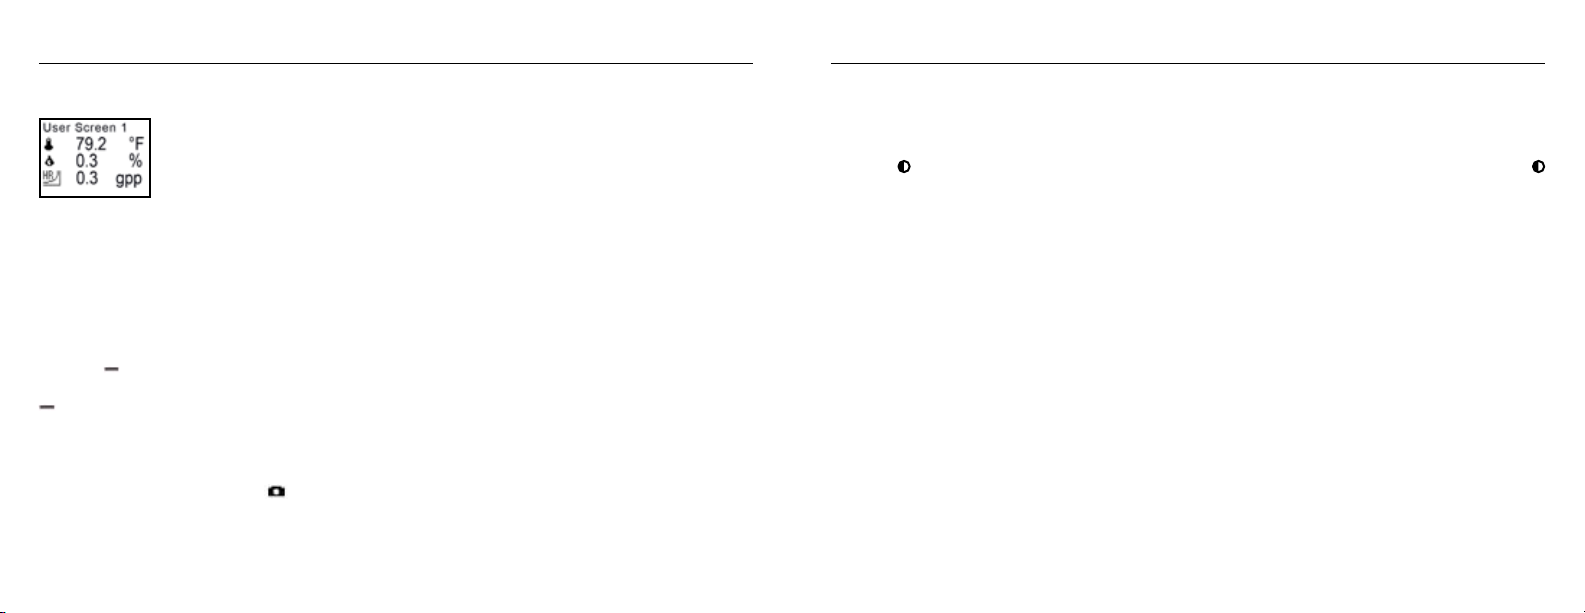
User Screens
The three User Screens can be recongured to display the most appropriate information for your
application. For example, if you need to monitor the wind speed, humidity and barometric pressure, a User
Screen can display these current measurement values on the same screen for quick reference. Only current
measurements can be selected for the User Screens — Min/Max/Avg and Charts are not available.
Highlight the desired User Screen by pressing the
highlighted User Screen. Press the or buttons to change lines, and the or button to scroll
through the available measurements for each highlighted line. Press the button to return to the User
Screen Setup Menu. Repeat above process for the other User Screens or press the button to return to
the Main Setup Menu. The User Screens may also be hidden if not needed.
System
The display Contrast and Auto Shutdown can be recongured as required. The relative humidity and
pressure sensors can also be recalibrated. Press the or buttons to highlight the appropriate selection,
and the or button to adjust or select.
The Contrast can be adjusted for better visibility depending on the ambient lighting conditions. Press the
or button to increase or decrease the contrast from 0 to 20 (0 is lightest, 20 is darkest).
The display can be set to automatically turn o in order to conserve the battery life. Auto Shutdown will
only occur after the preset time has elapsed without any button presses. Press the or button to scroll
through the Auto Shutdown options (15 minutes, 60 minutes, O). Battery life will be shortened if the Auto
Shutdown is turned to O.
Baro Cal - Recalibration of this sensor is not typically required, and it is not recommended that you recalibrate
without speaking to an NK technician. The pressure sensor can be calibrated if necessary. It is extremely
important to know the precise altitude and mean sea level barometric pressure at the time of calibrating
the sensor. First, set the reference altitude on the BARO measurement screen to the known altitude (see
or button. Press the button to select the
17
Pressure Adjustment section for instructions). Then adjust the calibrating setting on the Baro Cal screen to
the known mean sea level barometric pressure. If recalibration is desired, the unit may also be returned to
NK for service.
Humidity Cal - Recalibration of this sensor is not typically required, and it is not recommended that you
recalibrate without speaking to an NK technician. The humidity sensor can be calibrated by “teaching” it the
correct humidity. Some special equipment is required for this calibration, including two hermetically sealed
containers and saturated salt solutions. NK oers a calibration kit, and instructions are available on
www.nkhome.com. If recalibration is desired, the unit may also be returned to NK for service.
Date & Time
The date and time, as well as date and time formats, can be adjusted. The Time Formats available are 12
hour and 24 hour. The Date formats available are day/month/year and month/day/year. (See the Date and
Time Set Up section for instructions.) Press the button to return to the Main Setup Menu.
Language
Displayed text can be set in one of ve languages: English, French, German, Italian or Spanish. To choose
a language, use the or buttons to highlight the desired language. Press the button to select the
language and return to the Main Setup Menu. Otherwise, press the button to return to the Main Setup
Menu without changing languages.
Restore
Default settings for units of measure, date and time formats, and system settings can be restored. (See the
Factory Default Settings section for more information.) Press the or button to highlight the desired
default setting: Metric, Imperial or Defaults. Press the or button to reset the factory setting. Press the
button to return to the Main Setup Menu.
Page 10

Kestrel® 4250 Racing Weather® Tracker
APPLICATION EXAMPLES
This section provides examples of applications where a Kestrel Racing Meter might be used, and the
appropriate memory settings.
Weather Monitoring for Race Weekend
Auto Store On
Store Rate 1/2 hr
Overwrite On
Man Store On
These settings will allow you to track conditions for 1 month. When the memory is full, each new
measurement will be stored in place of the oldest data point. The charts will provide a quick look at the
recent weather conditions. Keep an eye out for falling barometric pressure, which indicates that a storm
is coming.
Weather Monitoring - In the Staging Lanes
Auto Store On
Store Rate 1 min
Overwrite O
Man Store On
These settings will allow you to track the conditions for more than 24 hours. Measurements will be stored
every minute, and stop storing when the log is full. This will let you review the data at your convenience. To
get the full use of the available memory, be sure to clear data at the start of each race day.
MEMORY CAPABILITIES
Store Rate Total Memory Store Rate Total Memory
2 sec 53 min, 20 sec
5 sec 2 hr, 13 min, 20 sec
10 sec 4 hr, 26 min, 40 sec
20 sec 8 hr, 53 min, 20 sec
30 sec 13 hr, 20 min
1 min 1 day, 2 hr, 40 min
2 min 2 days, 5 hr, 20 min
5 min 5 days, 13 hr, 20 min
10 min 11 days, 2 hr, 40 min
20 min 22 days, 5 hr, 20 min
30 min 33 days, 8 hr
1 hr 66 days, 16 hr
2 hr 133 days, 8 hr
5 hr 333 days, 8 hr
12 hr 800 days
19
Page 11

Kestrel® 4250 Racing Weather® Tracker
21
GLOSSARY
The below denitions have been greatly simplied in order to keep this section brief. We strongly
recommend that anyone who wishes to make use of these measurements refer to one of the many
excellent weather references available for a more in-depth denition. On the internet, visit www.usatoday.
com or www.noaa.gov. Or, locate the USA Today publication, The Weather Book. Please note that any words
in a denition printed in italics are themselves dened in this glossary.
Altimeter Setting
An aviation term for the local barometric pressure. Same as reference pressure.
Altitude
The distance above sea level. The Kestrel Meter calculates altitude based on the measured station pressure
and the input barometric pressure — or “reference pressure”.
Air Density
The mass of air per unit volume. It is a function of temperature, humidity, and pressure.
Barometric Pressure
The air pressure of your location reduced to sea level. Pressure will change as weather systems move into
your location. Falling pressure indicates the arrival of a low pressure system and expected precipitation or
storm conditions. Steady or rising pressure indicates clear weather. A correct altitude must be input for the
Kestrel Meter to display barometric pressure correctly.
Density Altitude
The altitude at which you would be, given the current air density. Often used by individuals who tune
high performance internal combustion engines, such as race car engines. Also of interest pilots in order to
determine how an aircraft will perform.
Dewpoint
The temperature to which air must be cooled in order for condensation to occur. The dierence between
dewpoint and temperature is referred to as the “temperature/dew point spread”. A low dewpoint spread
indicates high relative humidity, while a large dewpoint spread indicates dry conditions.
Heat Index
A practical measure of how hot the current combination of relative humidity and temperature feels to a
human body. Higher relative humidity makes it seem hotter because the body’s ability to cool itself by
evaporating perspiration is reduced.
Moisture Content (Water Grains)
The ratio between the actual mass of water vapor present in moist air — to the mass of the dry air.
Reference Pressure
The local barometric pressure. Input to the altitude screen to provide correct altitude readings. Also known
as the altimeter setting.
Relative Air Density
A proportion of measured air density to standard air density. Standard air density uses standard (xed)
values for temperature, humidity and pressure.
Relative Humidity
The amount of water vapor actually in the air divided by the maximum amount of water vapor the air could
hold at that temperature, expressed as a percentage.
Station Pressure
The air pressure of your location, NOT reduced to the sea level equivalent.
Page 12

Kestrel® 4250 Racing Weather® Tracker
23
Temperature
The ambient air temperature.
Wet Bulb Temperature
The lowest temperature to which a thermometer can be cooled by evaporating water into the air
at constant pressure. This measurement is a holdover from the use of an instrument called a sling
psychrometer. To measure wet bulb temperature with a sling psychrometer, a thermometer with a wet
cloth covering over the bulb is spun rapidly through the air. If the relative humidity is high, there will be
little evaporative cooling and the wet bulb temperature will be quite close to the ambient temperature.
Some exercise physiology guides use wet bulb temperature, rather than heat index, as a measure of the
safety of exercise in hot and humid conditions.
Wind Chill
The cooling eect of combining wind and temperature. The wind chill gives a more accurate reading of
how cold it really feels to the human body. The Kestrel Meter’s wind chill is based on the National Weather
Service standards as of November 1, 2001.
DEFAULT SETTINGS
UNIT METRIC IMPERIAL
Wind Functions M/s mph
Temperature Functions °C °F
Barometric Pressure hPa inHg
Altitude Functions M Ft
Time Format 24 hour 12 hour
Date Format Day/month/year Month/day/year
Moisture Content g/kg gpp
Air Density kg/m3 lb/ft
Relative Air Density % %
SETTING FACTORY DEFAULT
Automatic Data Store On
Data Store Rate 1 hour
Data Overwrite On
Manual Data Store On
User Screen 1 Temperature, Humidity, Moisture
User Screen 2 Air Density, Relative Air Density, Density Altitude
User Screen 3 (available) Wind Speed, Dewpoint, Station Pressure
Display Contrast 10
Automatic Shutdown 15 minutes
Language English
PC Upload
Stored data may be uploaded to a PC with the optional Kestrel Interface.
3
Page 13

Kestrel® 4250 Racing Weather® Tracker
25
Think the weather conditions at the track are the same as the information
you are getting from back at the trailer? Think again.
Even slight changes in air density, water grains, and density altitude can dramatically aect a machine’s
performance. With the added ability to easily measure and track these and other critical factors, such as
absolute pressure, temperature, humidity, wind speed and barometric pressure, the Kestrel 4250 Racing
Weather Tracker arms racers with the accurate weather data needed to make those last minute jetting or
tuning decisions.
Conditions on the track can often vary greatly from those in the pits. The rugged, portable and easy to
use Kestrel 4250 Racing Weather Tracker quickly provides racers and pit crews with the most accurate and
up-to-date data available where you need it most — at the track. It allows tuners to determine what last
minute changes need to be made based on the current local conditions, even immediately before the rst
lap around the track or pass down the drag strip — giving you that competitive edge at a fraction of the
cost of other systems on the market.
The Kestrel 4250 Racing Weather Tracker also features an automatic and manual data storage function,
allowing you to easily keep logs of race day conditions from track to track, year to year. The Kestrel PC
Interface and Communicator Software allows data to be easily transferred directly to a PC or laptop —
making long-term storage, in-depth analysis, and detailed charting of stored data a breeze.
FREQUENTLY ASKED QUESTIONS
Why is it important to know the weather conditions, and how can the Kestrel 4250 help me win races?
Weather aects your performance. Period. If you are not using something to measure the weather conditions
then you are missing a piece of valuable information that can help you win races. Environmental conditions
such as relative humidity, density altitude, dewpoint and wind speed all inuence your car. By monitoring
these conditions and analyzing how weather patterns from previous races change your car’s performance,
you are able to make more informed dial-in and tuning decisions. Since the Kestrel 4250 Pocket Weather
Tracker is portable and accurate, it enables you to monitor the weather conditions that concern you right at
the track, not at the trailer miles away.
Any suggestions where and when is the best time to take readings? Before or after a run, or both?
We don’t claim to be racing experts, but here are some tips that will help. The one thing we can say is
that consistency is a must. Pick a system and stick with it. It’s often easier to record the weather data
immediately after returning from a run. That way it won’t matter if you get delayed at the start. Also, you
can set the Kestrel to automatically store data every ve minutes, and then just coordinate times with the
timeslip. Lastly, for the most accurate readings possible, it’s best to keep the Kestrel 4250 in the shade, and
make sure air is circulating through the temperature sensor (the curly thing), either by holding it in the
breeze or by waving it around.
I have E.T. prediction software and I want to make sure I am imputing the correct readings for my
dial-in.
· If your software asks for station or raw pressure, use “pressure” screen displayed on Kestrel.
· If your software asks for density altitude, you can use the value that your Kestrel 4250 automatically
measures.
· If your software asks for barometric pressure and altitude, make sure you know your track’s altitude ahead
of time and enter it in as the “reference altitude.”
Page 14

Kestrel® 4250 Racing Weather® Tracker
27
I don’t have E.T. prediction software, any help you can oer how I can dial in with the Kestrel alone?
We went to the experts to get an answer for this one. Here’s how they do it at Martino Motorsports: The
density altitude reading is the most important to us. For every 150 ft. increase in DA, our car will lose .01 in
elapsed time, and for every 150 ft. decrease our car will pick up .01 in elapsed time. But we can get the same
DA and have two completely dierent runs. This is due to humidity factor. Although the DA might be the
same, you can have a dierent temperature and humidity combination. For every 15% increase in humidity
our car’s performance will decrease .01 in elapsed time and for every 15% decrease in humidity our car’s
performance will increase .01 in performance.
I’ve seen a lot of high dollar weather units on the market, yours is so inexpensive,
can it really be accurate?
The engineers at NK have been working on the Kestrel’s functionality for over ten years, and have been
awarded four patents on their innovative engineering. Additionally, each and every Kestrel is calibrated
against NIST-traceable standards, and can be recalibrated in the eld or factory. We’re so sure of Kestrel
Meter’s functionality that we guarantee each Kestrel for ve-years, and each one comes with a Certicate of
Conformity. Visit www.kestrelweather.com for detailed specications.
Why is my Kestrel Meter is not registering wind speed?
It probably just needs a replacement impeller. You can verify this by removing the impeller (press rmly
on the sides of the impeller), and turn the unit on to the wind speed screen. Hold the Kestrel Meter near a
television, computer monitor or some electronic device and it will display a wind speed. Or, wave a magnet
(like a refrigerator magnet) back and forth by the Kestrel Meter. If the Kestrel Meter is working properly, you
will register a wind speed reading, even though there is no impeller installed. Simply purchase a new impeller
and your Kestrel Meter’s wind speed readings will be restored to factory calibration.
What is the best way to take accurate temperature and humidity readings?
Avoid taking measurements in direct sunlight, and be sure there is airow over the sensors. Especially if you
expose the Kestrel Meter to a large temperature swing prior to taking a reading (such as taking a Kestrel
Meter from the indoors to the outdoors in the winter), airow over the sensors is necessary to measure
accurate temperature and humidity readings. You can ensure airow by either placing the Kestrel Meter in a
breeze, or by waving it back and forth. If no airow can be provided, you must allow up to 20 minutes for the
values to stabilize and accurate readings to be displayed.
Why does my screen turn black in the heat? Why does screen become sluggish or blank in the cold?
The liquid crystal display used in Kestrel Meters has an operational temperature range of -49.0 to 257.0°F
(-45.0 to 125.0°C). Above this temperature, the whole screen will turn black. Below this temperature, the
liquid crystals will freeze and not display a reading. Even in these conditions, your Kestrel Meter will still
continue to measure and record readings as specied by the automatic and manual data storage rates,
you will just not be able to read the display until the environment’s temperature is within the operational
range. In cold environments, you can keep the Kestrel Meter warm in your pocket and remove it only to
take readings. Be sure to wave the unit back and forth to create airow over the sensors to ensure the most
accurate reading possible.
Why doesn’t my Kestrel Meter match the local Weather Report?
Obtaining a weather report from a local television station, airport or internet site will give you the weather
where those instruments are, which is not necessarily the same as where you are. Your Kestrel Meter is
measuring the conditions right where you are. The nature of microclimates and weather fronts is that they
are varied, and even locations as close as a mile apart can have dierent weather readings. You can certainly
use these weather reporting services for good estimates of what the conditions will be, but for the most
accurate readings at your particular location, the Kestrel Meter is better.
Page 15

Kestrel® 4250 Racing Weather® Tracker
CUSTOMER SERVICE
KESTREL POCKET WEATHER METERS 5-YEAR LIMITED WARRANTY
NK does not believe in “disposable electronics.” We know that Kestrel Meters don’t typically lead pampered
lives, and we design them for years of performance in tough conditions. Every Kestrel is designed and
manufactured at NK’s facility in Boothwyn, Pennsylvania, to be the accurate, reliable weather instrument
you need for your application. If for any reason you are not satised with the performance or operation of
your Kestrel meter in the rst 30 days, you may return it to your place of purchase for a full refund.
We guarantee every Kestrel Pocket Weather Meter to be free of defects in materials and workmanship for a period of FIVE YEARS from their date of rst consumer purchase. NK will repair or replace
any defective product or part when notied within the warranty period, and will return the product via
domestic ground shipping or NK’s choice of method of international shipping at no charge.
29
remedy with respect to any breach of the NK Limited Warranty set forth herein. All product liability
and warranty options are governed exclusively by the laws of the Commonwealth of Pennsylvania.
Your warranty period will be measured from your date of purchase. The best way to ensure full warranty
coverage is to REGISTER your NK product promptly on our website: www.kestrelweather.com. We
keep your registration information strictly condential and do not sell it, share it, or use it for anything but
product-related information bulletins (which you may decline receiving). If you do not register and cannot
provide proof of purchase, your warranty period will be measured from our date of manufacture, determined by serial number.
We request that you contact NK if you feel your product is not working properly. We can often solve product
issues by phone or e-mail, saving you the time and expense of returning the unit. If we require the product
to be returned, we will issue a Return Authorization to expedite the handling of your warranty claim.
The following shall be excluded from warranty coverage: damage due to improper use or neglect (including corrosion); damage caused by severe or excessive impact, crushing or mechanical harm; modications or attempted repairs by someone other than an authorized NK/Kestrel repair agent; impeller failure
not caused by a manufacturing defect; normal usage wear; failed batteries; and accuracy issues resolvable
by recalibration. Recalibration is provided free of charge within thirty (30) days of purchase if necessary.
Except for the warranties set forth herein, NK disclaims all other warranties, expressed, implied or
statutory, including, but not limited to, the implied warranties of merchantability or tness for a
particular purpose. Any implied warranties that may be imposed by applicable law are limited to
the term of this warranty. In no event shall NK be liable for any incidental, special or consequential
damages, including, but not limited to, loss of business, loss of prots, loss of data or use, whether
in an action in contract or tort or based on a warranty, arising out of or in connection with the use
or performance of an NK product, even if NK has been advised of the possibility of such damages.
You agree that repair, and (upon availability) replacement, as applicable, is your sole and exclusive
The Kestrel Pocket Weather Meters are covered by the following patents: 5,783,753, 5,939,645, 6,257,074,
and 7,059,170.
Calibrations, Certications and Service
Every NK product is tested and calibrated before it leaves our factory. We guarantee that it will perform within
specications when you receive it. Each Kestrel Meter comes with a Certicate of Conformity, with the stated
specications for that product on the back. If you feel an NK product is not meeting specs when you receive
it, call us and we’ll make sure you are operating it correctly. If it still appears that it may be out of spec, return
it to us within 30 days of purchase and we will test and recalibrate all values at no charge. Beyond 30 days,
we oer reasonably-priced tests, calibration services and N.I.S.T. certied calibrations as well as Kestrel Meter
tune-ups.
All of our measurements are traceable to the National Institute of Standards and Technology, ensuring
the highest level of accuracy. Our primary Calibration Standards are sent for calibration in accordance
Page 16

Kestrel® 4250 Racing Weather® Tracker
with N.I.S.T. requirements and based on a regular schedule. Only approved laboratories and N.I.S.T themselves
are used for these calibration services. Incoming and outgoing data is supplied with the certicate of
calibration.
We also oer full factory service on every product we manufacture for as long as we make the product (and
as long after as component availability permits). If we can’t repair a product, we will oer you a brand-new
replacement under our Customer Care Program (even for accidental damage and misuse). Cost of repairs and
other important information can be found on our website.
We request that you contact NK if you feel your product is not working properly. We can often solve product
issues by phone or e-mail, saving you the time and expense of returning the unit. If we require the product to
be returned, we will issue a Return Authorization to expedite the handling of your claim.
Visit www.kestrelweather.com for more information and pricing for these services.
Lifetime Customer Care Warranty
NK wants you to be an NK customer for life, so we take care of you even beyond the terms of the above
warranty with our Customer Care Program. Trade-in any Kestrel Pocket Weather Meter, no matter the age or
condition, and receive a generous discount on the replacement product (same model only). Our Customer
Care Program applies only as long as we manufacture the product, and does not cover product upgrades.
31
Kestrel® Pocket Weather® Meters are designed and manufactured in the USA by:
NIELSEN-KELLERMAN
21 Creek Circle, Boothwyn, PA 19061
Phone: (610) 447-1555 Fax: (610) 447-1577
Web: www.kestrelweather.com
Email: kestrel@nkhome.com
Instruction Manual for Kestrel 4250 version: 4.27 ALL
Please register your Kestrel Meter at www.KestrelWeather.com
Page 17

Kestrel® 4250 Racing Weather® Tracker
Kestrel® Pocket Weather® Meters are designed and manufactured in the USA by:
NIELSEN-KELLERMAN
21 Creek Circle, Boothwyn, PA 19061
Phone: (610) 447-1555 Fax: (610) 447-1577
Web: www.kestrelweather.com
Email: kestrel@nkhome.com
Please register your Kestrel Meter at www.KestrelWeather.com
 Loading...