

Kestrel Heat Index Reference Guide
Note: Geat index guidelines make the following assumptions:
» The person is 5’7”, 147 lbs
» Clothing: long trousers and short-sleeved shirt
» Internal body temperature: 98.6
°F
OSHA Heat Index Guidelines
HEAT INDEX RISK LEVEL PROTECTIVE MEASURES
Less than 91°F Lower(Caution) Basic heat safety and planning
91 to 103 °F Moderate Drink ~4 cups of water/hour
103 to 115 °F High Drink water every 15-20 minutes
Greater than 115 °F Very hight to extreme Drink water frequently
This guidance is available online at www.osha.gov/SLTC/heatillness/heat_index
Take breaks as needed
Take frequent breaks
Schedule heavy work tasks when the heat index
is lower
Reschedule non-essential heavy work if possible
Alert workers to heat index for the day and
identify precations in place including who to call
for medical help
!! WARNING!!
These Heat Index Reference Guidelines are
summarized from well-regarded published
papers, policies and position statements
relating to preventing heat injury. These
guidelines are provided for reference only and
do not constitute medical advice.
These Guidelines and your Kestrel Heat
Stress product must be employed with care
and good judgment. Please remember that
certain individuals are more susceptible
to exertional heat stress and the Kestrel
products are environmental meters, not a
medical device. For more information on heat
stress injury prevention, visit heatstress.com
When in doubt, be conservative, reduce work
time, and increase rest and hydration.
Heat Index Chart
Use the chart below to assess the potential severity of heat stress. The chart should be used as a guideline only–
individual reactions to the heat will vary among your athletes!
1. Across the top of the chart, locate the ENVIRONMENTAL TEMPERATURE, i.e. the air temperature.
2. Down the left side of the chart, locate the RELATIVE HUMIDITY.
3. Follow across and down to nd the APPARENT TEMPERATURE (HEAT INDEX). The apparent temperature is the
combined index of heat and humidity. It is an index of the body’s sensation of heat caused by the temperature
and humidity (the reverse of the “wind chill factor”).
HEAT INDEX
ENVIRONMENTAL TEMPERATURE (°F)
70° 75° 80° 85° 90° 95° 100° 105° 110° 115° 120°
Relative Humidity Apparent Temperature *
0% 64° 69° 73° 78° 83° 87° 91° 95° 99° 103° 107°
10% 65° 70° 75° 80° 85° 90° 95° 100° 105° 111° 116°
20% 66° 72° 77° 82° 87° 93° 99° 105° 112° 120° 66°
30% 67° 73° 78° 84° 90° 96° 104° 113° 123° 67° 67°
40% 68° 74° 79° 86° 93° 101° 110° 123° 68° 68°
50% 69° 75° 81° 88° 96° 107° 120° 69° 69°
60% 70° 76° 82° 90° 100° 114° 70° 70°
70% 70° 77° 85° 93° 106° 124° 70°
80% 71° 78° 86° 97° 113° 71°
90% 71° 79° 88° 102° 122° 71°
100% 72° 80° 91° 108° 72°
* Combined index of heat and humidity...what it “feels like” to the body. Source: National Oceanic and Atmospheric Administration
Recommended Modications to Athletic Participation Based on the Heat Index
APPARENT TEMPERATURE HEAT STRESS RISK WITH PHYSICAL ACTIVITY AND/OR PROLONGED EXPOSURE
90°-104° Heat cramps or heat exhaustion possible
Modify practice; take water breaks every 15 to 20 minutes.
105°-124° Heat cramps or heat exhaustion likely. Heatstroke possible
Modify practice. NO HELMET OR SHOULDER PADS, t-shirt and shorts only;
frequent (every 15 minutes) water and rest breaks.
>125° Heat stroke highly likely
Recommend NO PRACTICE!
Note: This Heat Index chart is designed to provide general guidelines for assessing the potential severity of heat stress . Individual
reactions to heat will vary. It should be remembered that heat illness can occur at lower temperatures than indicated on the chart.
In addition, studies indicate that susceptibility to heat disorders tends to increase with age.
Contact your local weather line, the National Wether Service, or weather.com for current temperature and humidity.

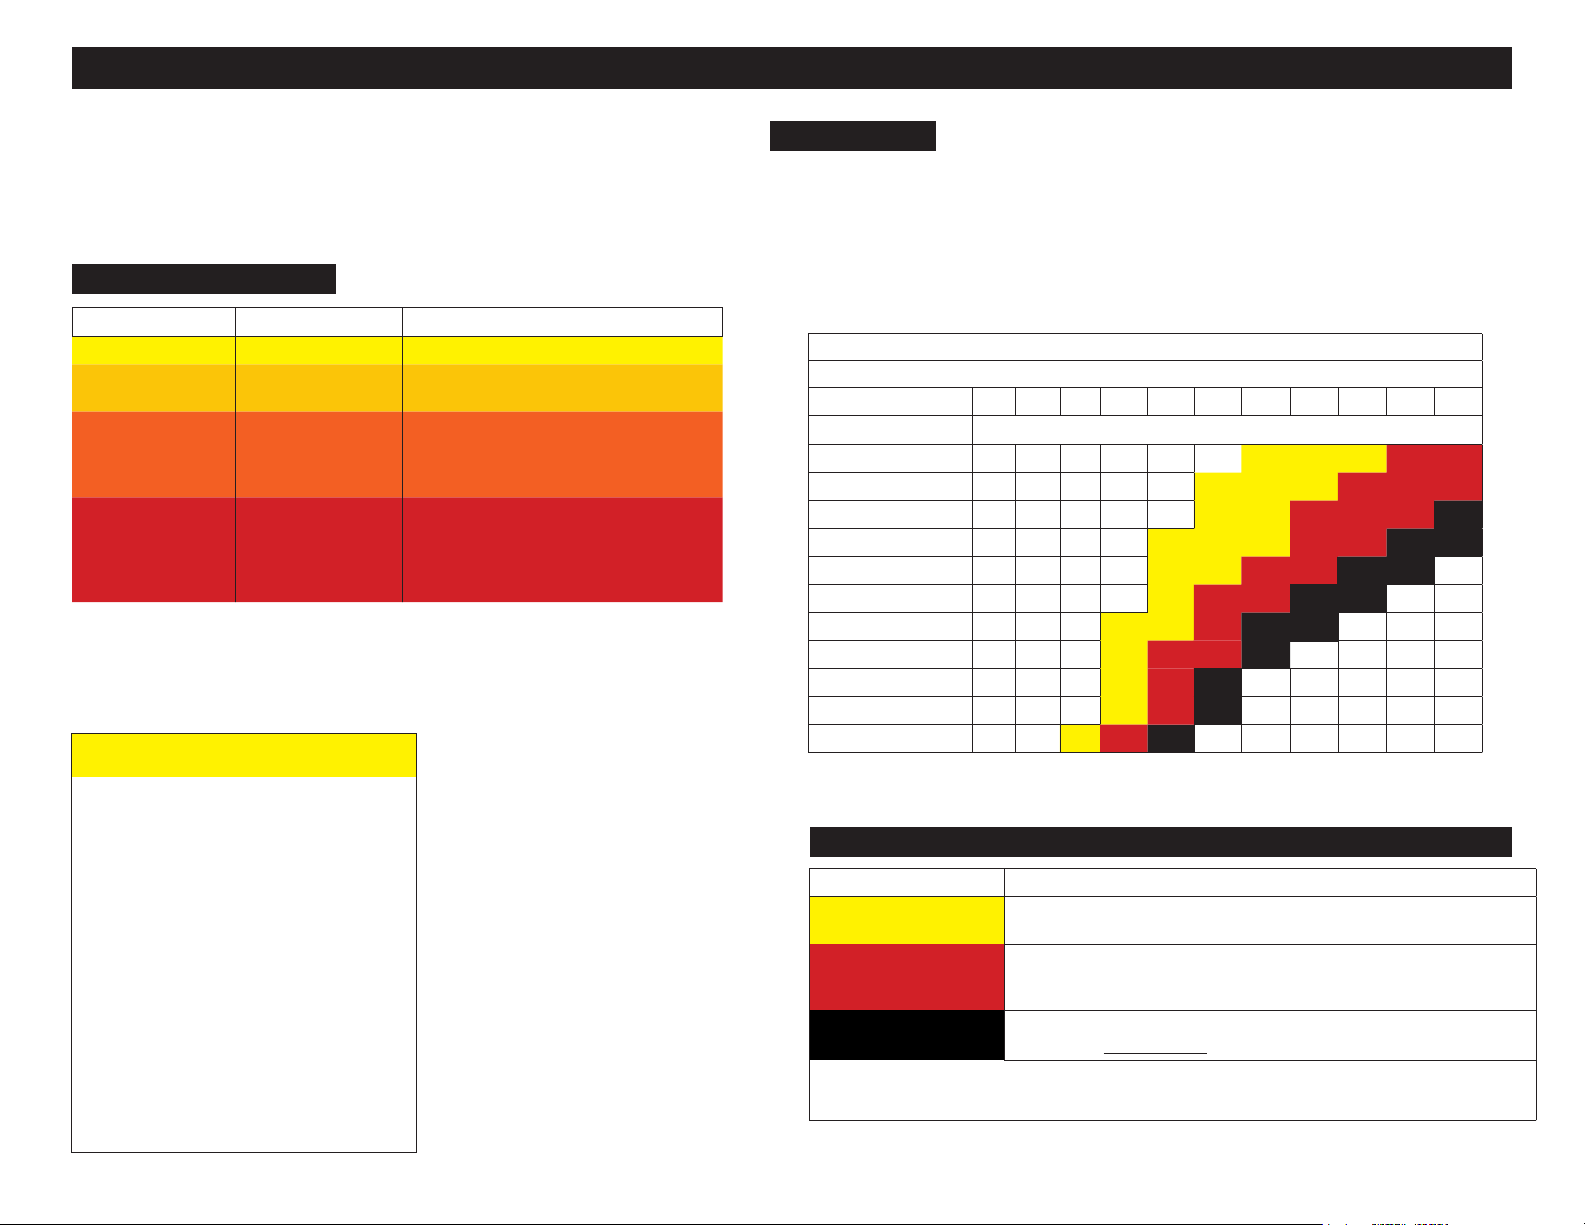
National Oceanic and Atmospheric Administration’s (NOAA) National Weather Service Heat Index
TEMPERATURE (°F)
80 82 84 86 88 90 92 94 96 98 100 102 104 106 108 110
40
45
50
55
60
65
70
RELATIVE HUMIDITY (%)
75
80
85
90
95
100
Korey Stringer Institute’s Recommendations Based on NOAA’s Heat Index Chart
80 81 83 85 88 91 94 97 101 105 109 114 119 124 130 136
80 82 84 87 89 93 96 100 104 109 114 119 124 130 137
81 83 85 88 91 95 99 103 108 113 118 124 131 137
81 84 86 89 93 97 101 106 112 117 124 130 137
82 84 88 91 95 100 105 110 116 123 129 137
82 85 89 93 98 103 108 114 121 128 136
83 86 90 95 100 105 112 119 126 134
84 86 92 97 103 109 116 124 132
84 89 94 100 106 113 121 129
85 90 96 102 110 117 126 135
86 91 98 105 113 122 131
86 93 100 108 117 127
87 95 103 112 121 132
LIKELIHOOD OF HEAT DISORDERS WITH PROLONGED EXPOSURE OR STRENUOUS ACTIVITY
CAUTION
EXTREME CAUTION
DANGER
EXTREME DANGER
ALERT LEVEL RECOMMENDED ACTIONS
RED- EXTREME DANGER 1. Cancel and/or postpone activity to cooler time of the day.
1. Maximum of 1 hour of training. Consider postponing activity to cooler time of the day.
2. Schedule at least 4 rest breaks of 4 minutes each within the hour.
ORANGE- DANGER
GOLD- EXTREME CAUTION
BRIGHT YELLOW- CAUTION
3. Recheck the environmental condition every 30 minutes to monitor for changes.
4. Have cooling stations for before, during and after exercise.
5. No additional conditioning allowed in the same day.
1. Maximum of 2 hour of training. Consider postponing activity to cooler time of the day.
2. Schedule at least 4 rest breaks of 4 minutes each within each hour, or a 10 minute
break every 30 minutes of training.
3. Recheck the environmental condition every 30 minutes to monitor for changes.
4. Have cooling stations for before, during and after exercise.
1. Optional water breaks every 30 minutes for 10 minutes in duration. Coordinate breaks
with assigned contest ofcials.
2. Preparation of cooling modalities (example: ice towels) is recommended.
319036_1_15.10.14
 Loading...