

Page 1
QUICK START GUIDE
KEPCO
An ISO 9001 Company.
SOLAR DEVICE TESTER
USING BOP 1KW
I — INTRODUCTION
SCOPE OF MANUAL. This Quick Start Guide covers
the description and operation of the Solar Device Tester
demonstration application written in LabView.
DESCRIPTION. The Solar Device Tester demonstration
application is a simple standalone application that uses the
Kepco Solar Device Tester subvi to control the output of the
BOP and to take the measurements needed to characterize
a solar device. The subvi can be adapted to an overall Test
application as needed.
The BOP 1KW is connected directly to the solar device and
controlled by the computer. Because measurements are
done by the BOP 1KW, external DVMs are not needed. The
BOP 1KW changes the output and makes synchronized
measurements, and goes on to the next point at a rate of
up to 20mS per point. The Solar Device Tester demonstration application uses a LabView subvi to produce an I-V
curve that characterizes the solar device (such as solar
cells, solar panels, etc.) under test. For accurate voltage
measurements remote sensing is recommended (as
detailed in the BOP 1KW Operator manual, Section 2).
BOP 1KW
SOLAR DEVICE
TESTER
Protection Limit ensures that the BOP output does not
exceed the capacity of the solar device. The negative Protection Limit is normally set close to zero to prevent the
solar device from overheating.
II — OPERATION
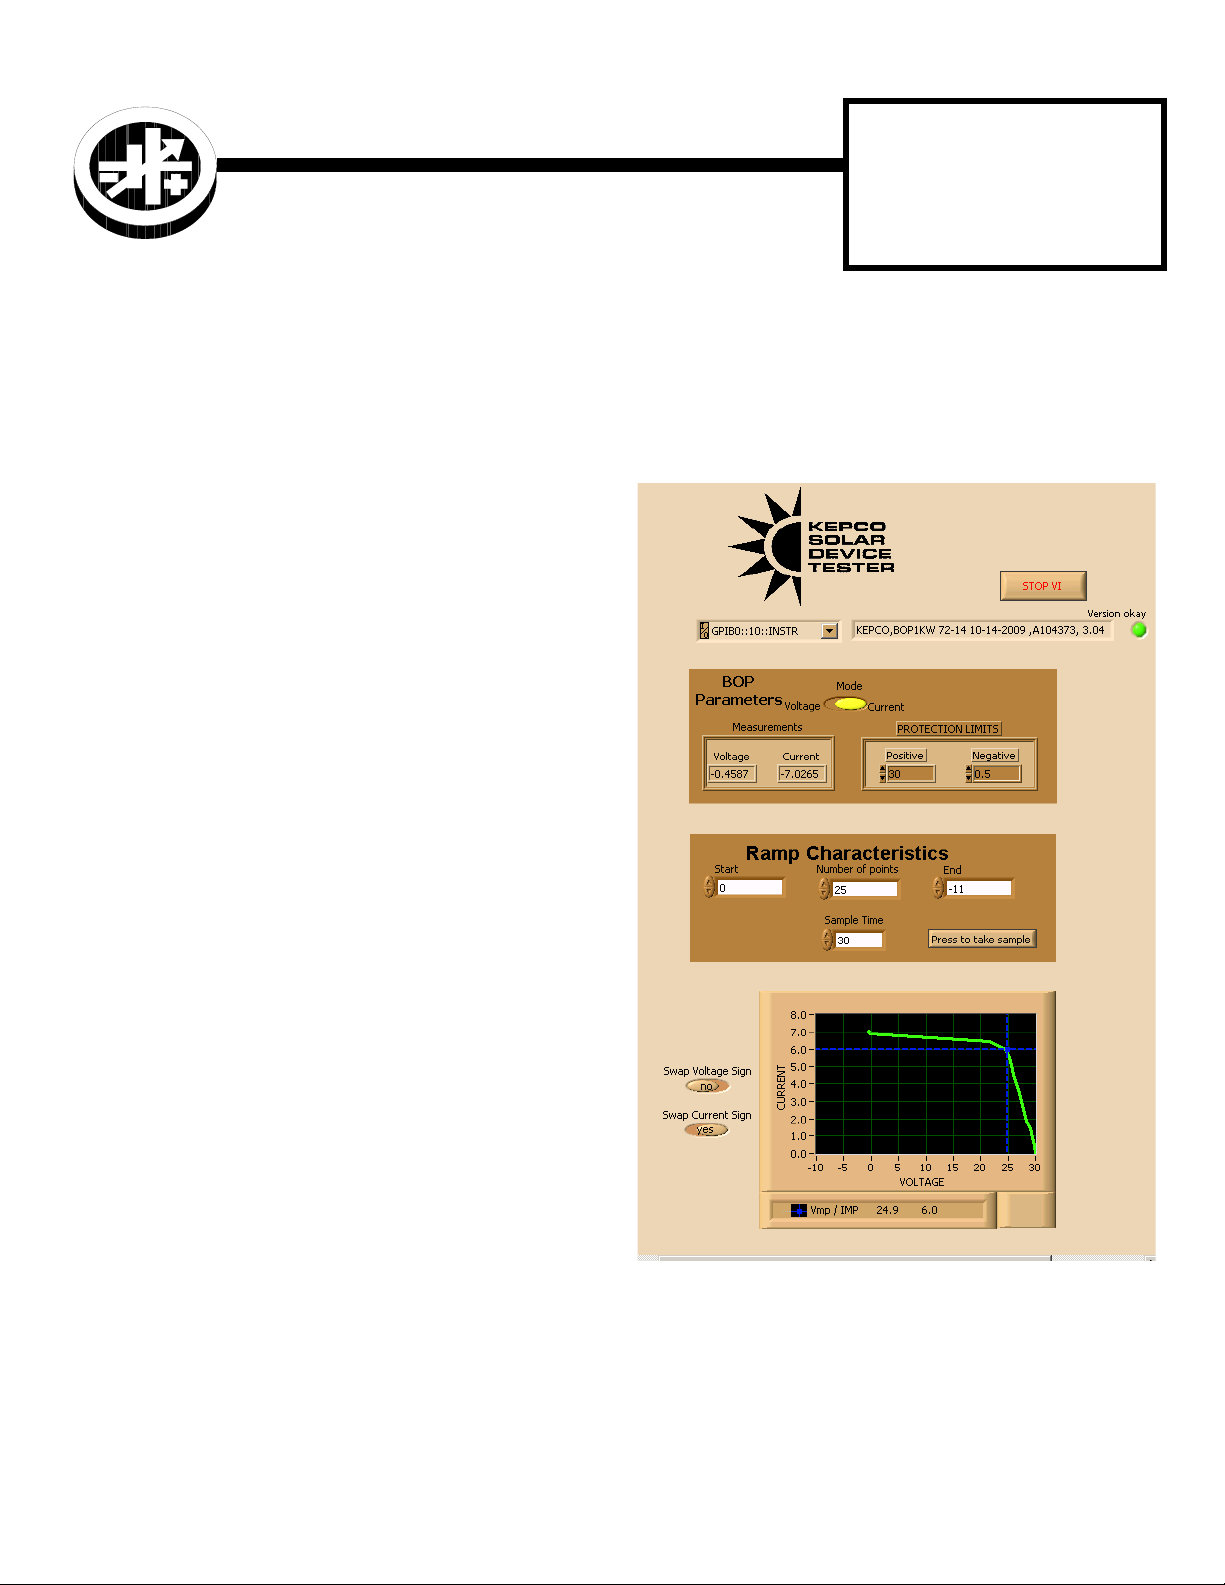
The user interface included with the Solar Device Tester
demonstration application is illustrated in Figure 1. The bottom of Figure 1 shows a typical I-V curve taken by the
subvi.
USING THE DEMONSTRATION APPLICATION.
The Version OK indicator (at the top of the panel shown in
Figure 1) lights green to verify that the BOP firmware supports the demonstration application and the subvi, or red to
indicate that the firmware does not support the demonstration application. An upgrade kit to allow older units to support the demonstration application may be purchased at
www.kepcopower.com/bophibuy.htm#upgrade.
The BOP Parameters display allows the user to select voltage or current mode by clicking on the Mode switch. The
switch is green for voltage and yellow for current.
The start and end points for the sequence of setpoints that
will characterize the device are entered under Ramp Characteristics. The Start and End Point units are in Amperes
for Current Mode and Volts for Voltage mode. The positive
FIGURE 1. Demonstration Application Interface Showing
User Inputs and Rendered I-V Curve Output
Once the Start and End points are chosen, the user enters
the Number of Points, Milliseconds to Wait and whether to
swap the sign of the measurements. The number of points
KEPCO, INC. " 131-38 SANFORD AVENUE " FLUSHING, NY. 11355 U.S.A. " TEL (718) 461-7000 " FAX (718) 767-1102
http://www.kepcopower.com " email: hq@kepcopower.com
©2009, KEPCO, INC 1
Data subject to change without notice 228-1684
Page 2

determines the resolution or level of detail of the characterization and can be set to as few as 10 to as many as
40,000 points per I-V Curve. Clicking the Swap Voltage
Sign or Swap Current Sign buttons to the left of the I-V
curve allows rendering of the I-V curve as preferred for I-V
Trace and I-V Dark type tests.
Clicking the Press to Take Sample button causes the
application to invoke the subvi which changes the BOP
output, creating a linear ramp. At each step, the BOP
1KW provides a measured voltage and current value.
While the curve is being taken, the voltage and current
values (displayed under BOP Parameters) change, providing status to the user. When the ramp is completed,
these measurements are provided as an array, which the
application renders as the I-V curve shown in Figure 1.
The subvi also provides measured Vmp and Imp, which is
graphically marked on the curve with a cursor formed by
intersecting vertical and horizontal lines.
SOLAR DEVICE TESTER SUBVI. The Solar Device
Tester subvi, written in LabView, includes an operator
panel (see Figure 2). The subvi may be used as is in an
overall Test application. The overall application will typically use the measurement data provided by the Solar
Device Tester subvi to produce an I-V curve that characterizes the device, and includes the four key device characteristics: Voltage Maximum Power (Vmp), Current
Maximum Power (Imp), Voltage Open Collector (Voc) and
Current Short Circuit (Isc) as well as Maximum Power
Point (Pmp). The calculated values of Vmp, Imp and Pmp
appear under Real Time Output. Isc and Voc are the highest values that appear in the Measured Current and Measured Voltage Arrays, respectively. Figure 1 shows a
typical I-V curve characterizing a solar device produced
from the data accumulated by the Solar Device Tester
subvi.
KEPCO, INC. " 131-38 SANFORD AVENUE " FLUSHING, NY. 11355 U.S.A. " TEL (718) 461-7000 " FAX (718) 767-1102
http://www.kepcopower.com " email: hq@kepcopower.com
2 228-1684 120409
Page 3

FIGURE 2. Solar Device Tester Subvi
The Real Time Output, BOP Parameters and Ramp Characteristics, shown in Figure 2, function as described for the
demonstration application. When the subvi is invoked by
an application, the subvi calculates a Settings Array as
shown in Figure 2. The settings array shows the sequential
setpoints for the main channel as determined by the start
and end points and the number of points supplied. An
arrow to the left of the settings array allows the user to
scroll and view each point. To the right of the settings array
are the Measured Current and Voltage arrays, showing the
measured values at each point from the previous execution
of the subvi.
At each point the BOP 1KW main channel is set to a level,
and after the user-programmable delay (using the Milliseconds to Wait input under Ramp Characteristics), the subvi
requests voltage and current measurements. These
requests are made with a single command line to insure
the voltage and current measurements are from the same
sample. The programmable delay is adjustable from 20 mS
to 2 Seconds. If the BOP 1KW is connected to a solar cell,
the best timing has been found to be 25 mS.
When all measurements are completed, the Measure Current and Voltage arrays to the right of the Settings array are
updated to show the measured values at each point. (In the
demonstration application the two arrays of points are used
to update the I-V curve. The Imp and Vmp values update
the cursor position.)
At the left, under Real Time Output, the user can monitor
the test in progress by viewing the instantaneous outputs of
the solar device under test: Voltage and Current. Voltage
Maximum Power (Vmp), Current Maximum Power (Imp)
and the Maximum Power Point (Pmp) are calculated in real
time, and are viewable when the characterization is complete.
KEPCO, INC. " 131-38 SANFORD AVENUE " FLUSHING, NY. 11355 U.S.A. " TEL (718) 461-7000 " FAX (718) 767-1102
120409 228-1684 3
http://www.kepcopower.com " email: hq@kepcopower.com
 Loading...