

KEF Reference 5 Silver Satin Walnut, Reference 5 Blue Ice White, Reference 5 Copper Black Aluminium, Reference 1 Blue Ice White, Reference 1 Luxury Gloss Rosewood kef_reference_white_paper (3).pdf
...Page 1

KEF R&D
THE REFERENCE
01
Page 2

Contents
1 Heritage 1
1.1 KEF Reference – A Brief history 1
2 Philosophy 2
3 The model range 5
4 Technology 6
4.1 External acoustics 6
4.1.1 Mid and high frequencies 6
4.1.2 3-way design approach 8
4.1.3 Controlling dispersion at the bass to mid crossover 8
4.1.4 Cabinet di raction 9
4.1.5 Overall dispersion performance 11
4.2 Low frequency response 12
4.2.1 Optimising the port behaviour 14
4.3 Internal acoustics and vibration control 18
4.3.1 Controlling closure standing wave resonances 18
4.3.2 Cabinet vibration control 20
4.4 Driver details 22
4.4.1 Uni-Q Driver 22
4.4.2 Low frequency drivers 27
4.4.3 Motor system design 28
4.5 Crossover design 30
4.5.1 Crossover component distortions 30
4.5.2 Crossover lter order 31
4.5.3 Impedance conjugation and ampli er load 35
5 Voicing the loudspeakers 37
6 Summary 38
7 References 40
Appendix I. Uni-Q 41
I.I. Acoustical point source 41
I.II. Matched Directivity 41
Appendix II. Tangerine waveguide 43
Appendix III. Optimal dome shape 44
Appendix IV. Sti ened dome 45
IV.I. Optimum Geometry 45
IV.II. The Solution 46
Appendix V. Vented tweeter 46
Appendix VI. Z- ex surround 47
Appendix VII. Room modes and loudspeaker positioning 48
VII.I. What is a room mode? 48
VII.II. The e ect of modes on loudspeaker responses 49
VII.III. Positioning 49
Appendix VIII. General loudspeaker positioning tips 50
02
Page 3
1 Heritage
1.1 KEF Reference – A Brief history
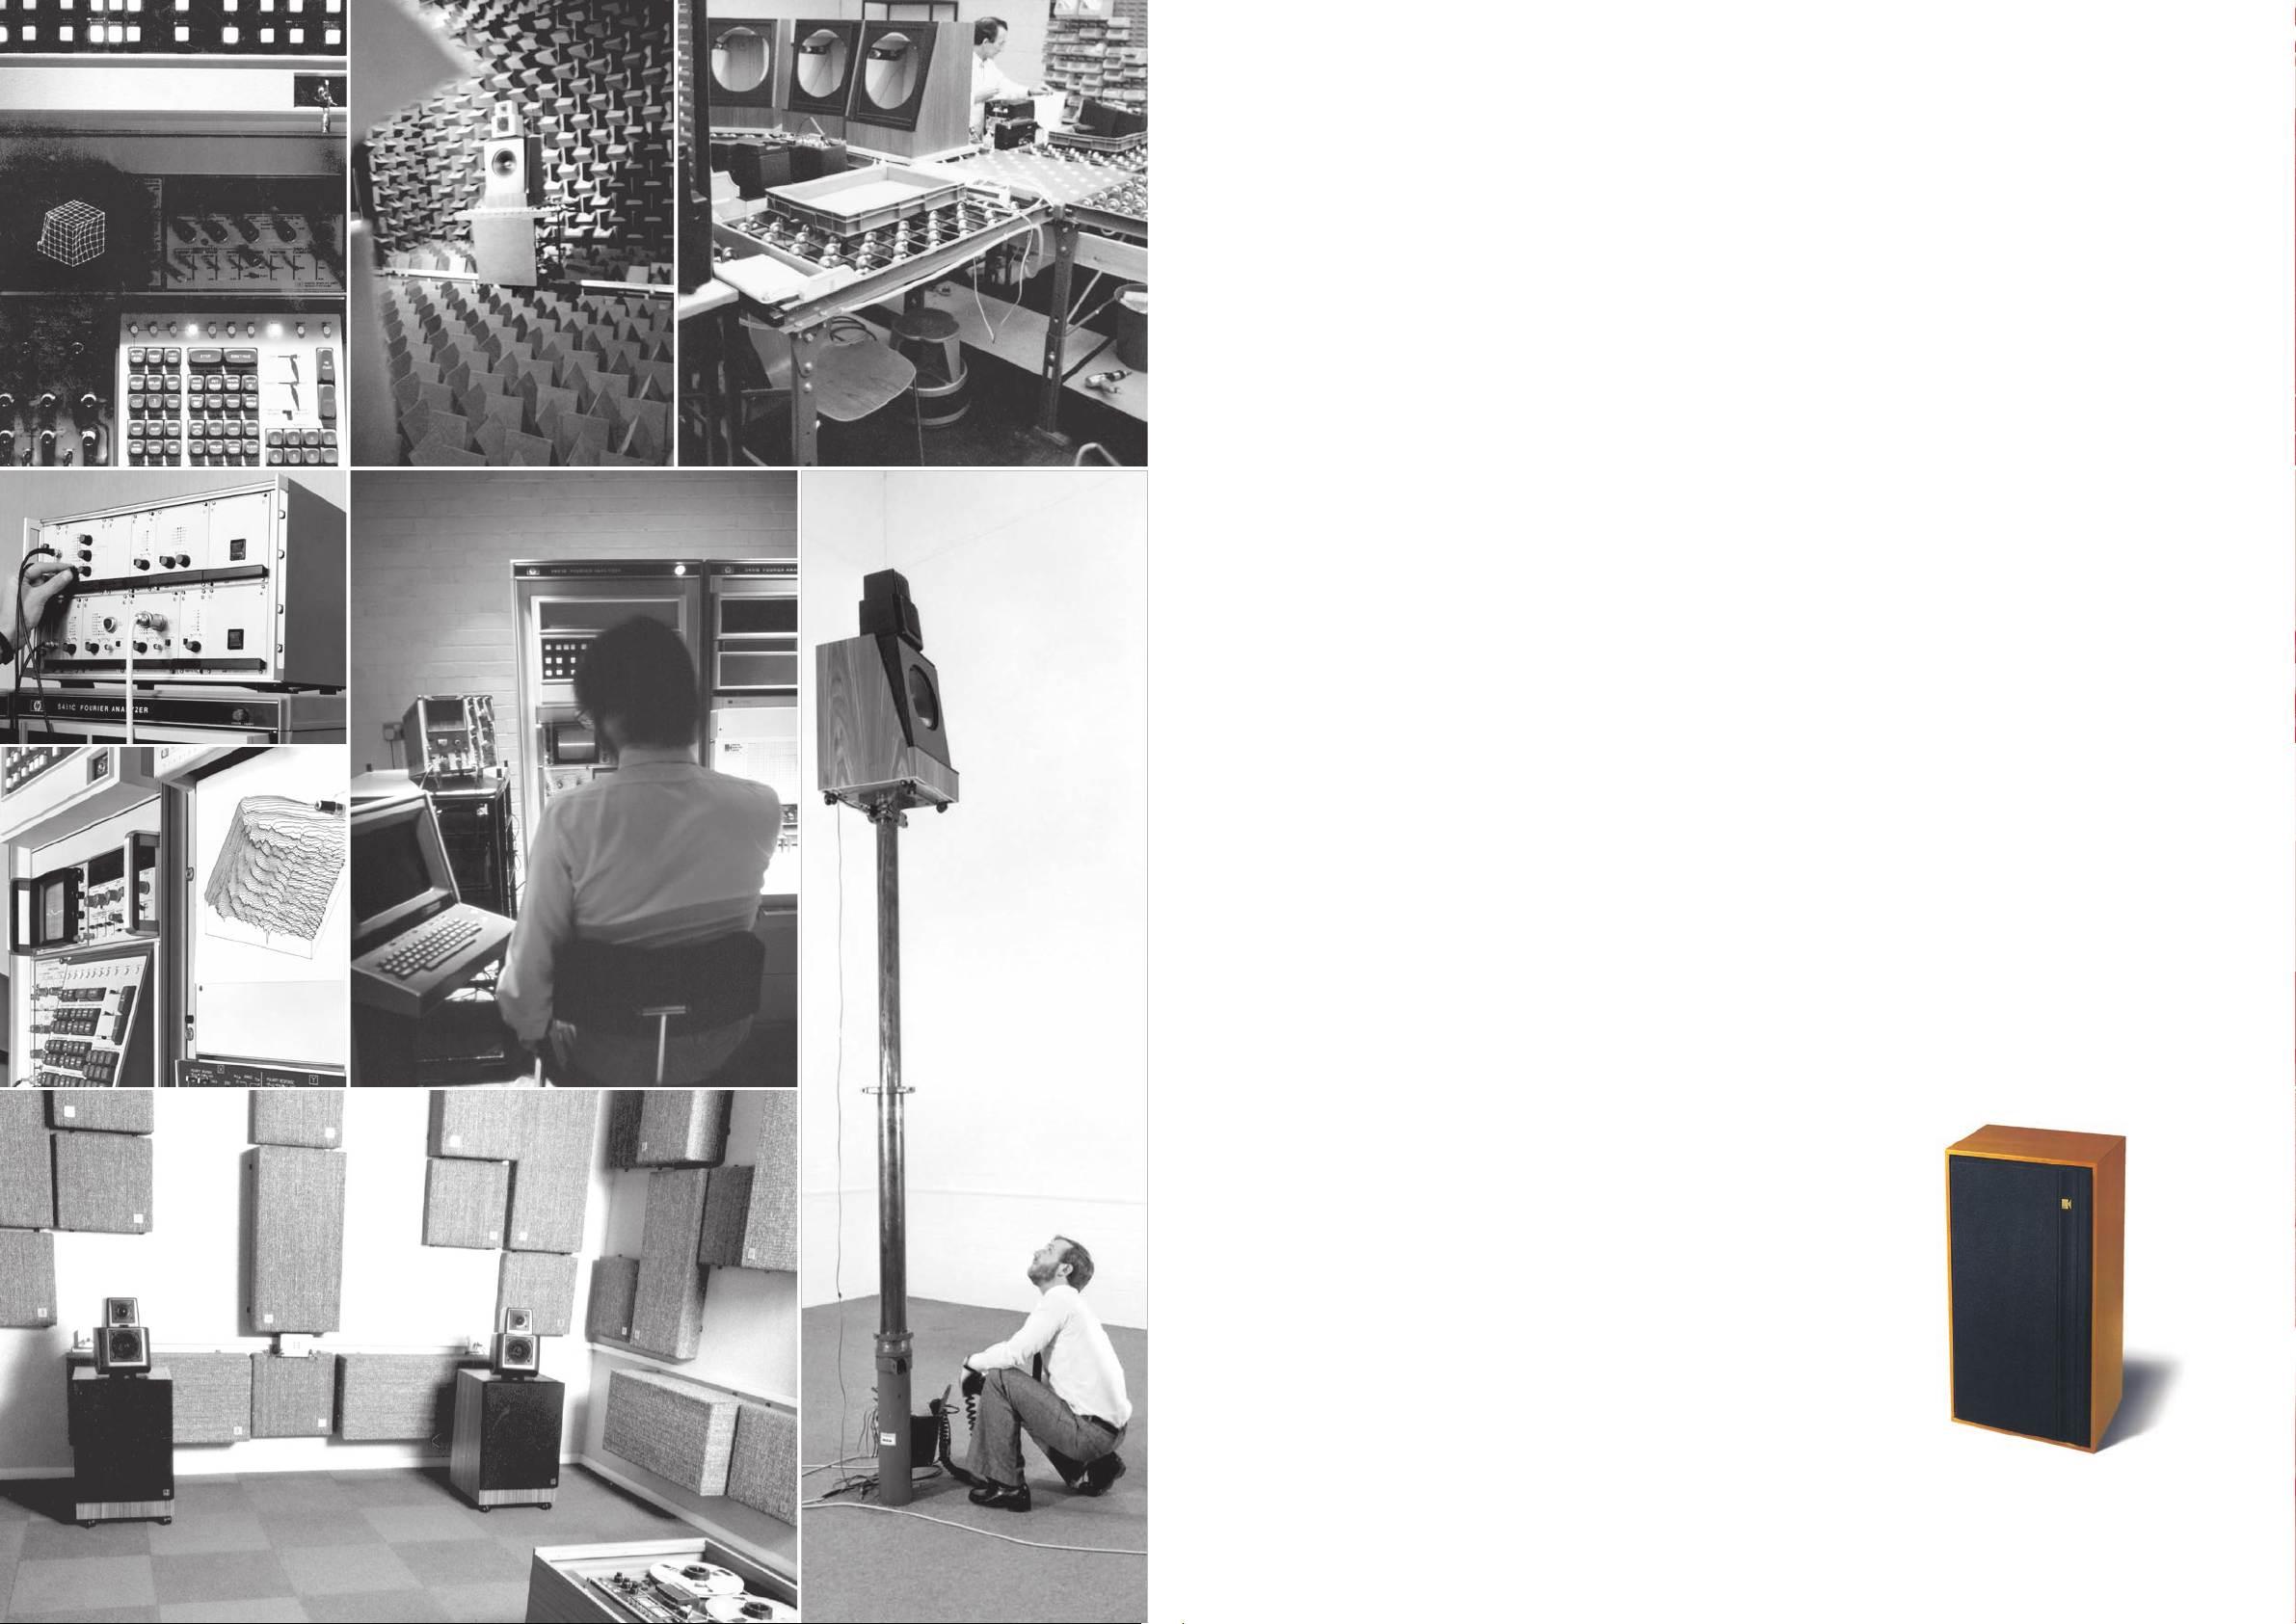
The birth of the Hi-Fi industry in the 1950s was
followed by it’s adolescence in the 1960s with the
1970s being the decade in which the industry matured
to adulthood. KEF’s success in the 1960s meant that in
the early 1970s the founder of KEF Raymond Cooke,
a great believer in applying objective engineering
methodology, was able to make a massive investment
in digital technology and specialist engineers. By
purchasing Hewlett-Packard computers and Fourier
analysers the KEF engineers could acquire acoustic
measurement data and use it in a pioneering computer
aided design process. An added bonus was the
improvement in production quality control since this
data could be stored and response variations quanti ed.
A new line of products was conceived to herald
the use of this technology in KEF’s design and
manufacturing processes.
Because KEF wished to balance a number of client
needs – the BBC’s technical criteria, burgeoning
audiophile tendencies, commercial realities and other
considerations – a conscious decision was made to
improve the performance of domestic loudspeakers
with the aid of computers, while respecting various
external in uences.
=
=
The first speaker to benefit from computer-aided
design was the Model 104, the début product in 1973’s
all-new Reference Series, designed by Laurie Fincham,
then Research Director of KEF Electronics, and
Malcolm Jones. Raymond once stated that ‘Finding a
new name for this product was a challenge. I wanted to
avoid misleading words like “monitor”, which had been
over-used and discredited. A description was needed
to convey the idea that every loudspeaker is subject to
test and scrutiny at all signi cant stages of assembly –
culminating in a nal test comparison with a laboratory
maintained reference standard which in practice is the
nal approved prototype. Hence the method became
the name of the new series: “Reference”.’
needs of the various markets, even remarking, ‘We [the
UK audio community] generate as much discussion and
talk about hi- as any other country. But the equipment
bought by most British people is fairly middle-ofthe-road, and it should be good value for money.’
Raymond’s mild pessimism about the potential sales
for costlier models for the UK market proved to be
unfounded, as the rst Reference Series product was a
success, and added immeasurably to KEF’s prestige at
home.
In addition to exceptional performance, KEF speakers
bearing the Reference name exhibited superior
construction offering a sense of luxury. This quality
has been revered by the team responsible for building
Reference products, from the rst models through to
the present day.
KEF developed the testing protocol in-house to ensure
that every production speaker sounded exactly as
the the laboratory reference sounded. One cannot
overestimate the value of the Reference Series to
KEF, for nearly 40 of its 50 years, for the standards
it set, from veneer matching to rigorous testing.
Today’s Reference models still adhere to the self-same
methodology and scrutiny before being shipped. Of
course the engineering techniques have progressed
and as it will be seen are still setting the standard for
methodical engineering design re ned by and for music
lovers.
Among the features that appealed to more
sophisticated markets were electronic overload
protection, matched stereo pairs and – especially
for territories such as the USA, with average room
size being far greater than that in British, European
or Japanese homes – high power handling. Raymond
was not unaware of, nor afraid to discuss the di erent
The Reference 104 from 1973.
1
Page 4
2 Philosophy
Loudspeakers are the final stage in the sound
reproduction chain. It is ultimately down to the
loudspeaker to generate the sound that the listener
will hear. While other pieces of audio equipment
have quite clearly de ned roles, and it is fairly obvious
to outline how they would ideally perform, the ideal
loudspeaker is more di cult to de ne. For example, an
ideal CD player would recreate the encoded waveform
as a voltage without any deviation or added artefact.
That is not to say that the design of a good disc player
is straightforward, but simply that the ideal function is
quite clear.
To define the ideal loudspeaker, it is simplest to first
consider what the audio system as a whole is trying
to achieve. The ideal audio system should be able to
recreate a live sonic event so that it is indistinguishable
from the original. The listener should be transported
to the original environment of the live event. He should
be convinced that he is sitting in the actual concert hall
in which the live event occurred. He should experience
the acoustic of the space, perceive the locations of
the instruments, interact with the space and hear the
change in the sound as he turns his head toward the
soloist.
Many recordings are available that never existed as live
events. For example, a rock band captured in a studio
on a multi-track system or music with synthesised
instruments. Nevertheless, the same objective applies
for these situations: the sonic event that we wish to
hear is the one that was envisaged by the musicians
and producer.
Can this be achieved? Clearly, there are implications for
the delity of the replay system: the system must not
colour the sound with the introduction of distortion
or dynamic range compressions; the system must
have a neutral timbral character, without resonance or
imbalance; the system should have a good temporal
resolution such that it does not “smear” the sonic
event. Each of these fidelity requirements provides
clear targets for the loudspeaker designer.
However, this ideal audio system has two further
implications that are more difficult to handle. Firstly,
the spatial information of the original event should be
captured and replayed. Secondly, the listener should
hear only the acoustic space of the original event and
not the acoustic space in which he is actually located.
Technically, neither stereo nor conventional
multichannel is sufficient to recreate the exact sound
eld of an event. However, our perception is not exact:
our auditory system builds a scene in our mind’s eye
(ear) based on cues in the signals arriving at our ears.
Cues such as the relative arrival time and level of the
sound at each of our ears, such as the loudness and
decay rate of the reverberation following a staccato
note, such as the relative loudness of instruments in an
ensemble. Stereo provides a simple means by which
the artist or recordist may communicate these cues to
the listener. The listener builds a picture of the sonic
event in their mind, perhaps not to the extent that he
perceives the sonic event indistinguishably from the
original, but su cient to emotionally connect with the
experience of listening to the original.
Loudspeakers must be designed to maximise the
communication of these spatial cues. To do this a
loudspeaker must have a response that does not
change rapidly with direction. An irregular dispersion
can result in the situation in which the loudspeaker
itself results in spatial cues that con ict with those in
the recording.
Controlling the loudspeakers’ directivity is also key
to avoiding loss of midrange and treble delity, which
can happen when loudspeakers are placed in a real
listening environment. One of the features of our
auditory perception is that we are well used to hearing
sounds that include re ections o close surfaces. Our
auditory system can easily identify the direct sound
and separate out re ections to the extent that we do
not perceive the re ections as separate events. Indeed,
the listener will attribute any timbral imbalance in the
reflections to the original source. This means that
loudspeakers must have a frequency response that is
good in all directions, not simply in the direct path to
the listener. Loudspeakers must have a smooth and
flat on-axis frequency response and a smooth and
balanced frequency response in other directions. If this
is achieved, the listener is able to “hear through” the
room in which he is located and perceive the acoustic
space captured in the recorded sound.
In summary, loudspeakers must have a smooth and
balanced response both in terms of frequency and
space. The sound from loudspeakers should emanate
from the drivers themselves and not from other
components, such as resonating panels or openings.
The drivers should operate in a well-controlled manner
throughout and beyond their band. Loudspeaker should
have low distortion and compression, and a good
temporal response.
“Of all art, music is the most indefinable and the
most expressive, the most insubstantial and the
most immediate, the most transitory and the most
imperishable. Transformed to a dance of electrons
along a wire, its ghost lives on. When KEF returns
music to its rightful habituation, your ears and mind,
they aim to do so in the most natural way they can…
without drama, without exaggeration, without arti ce.”
(Raymond Cooke OBE, KEF founder).
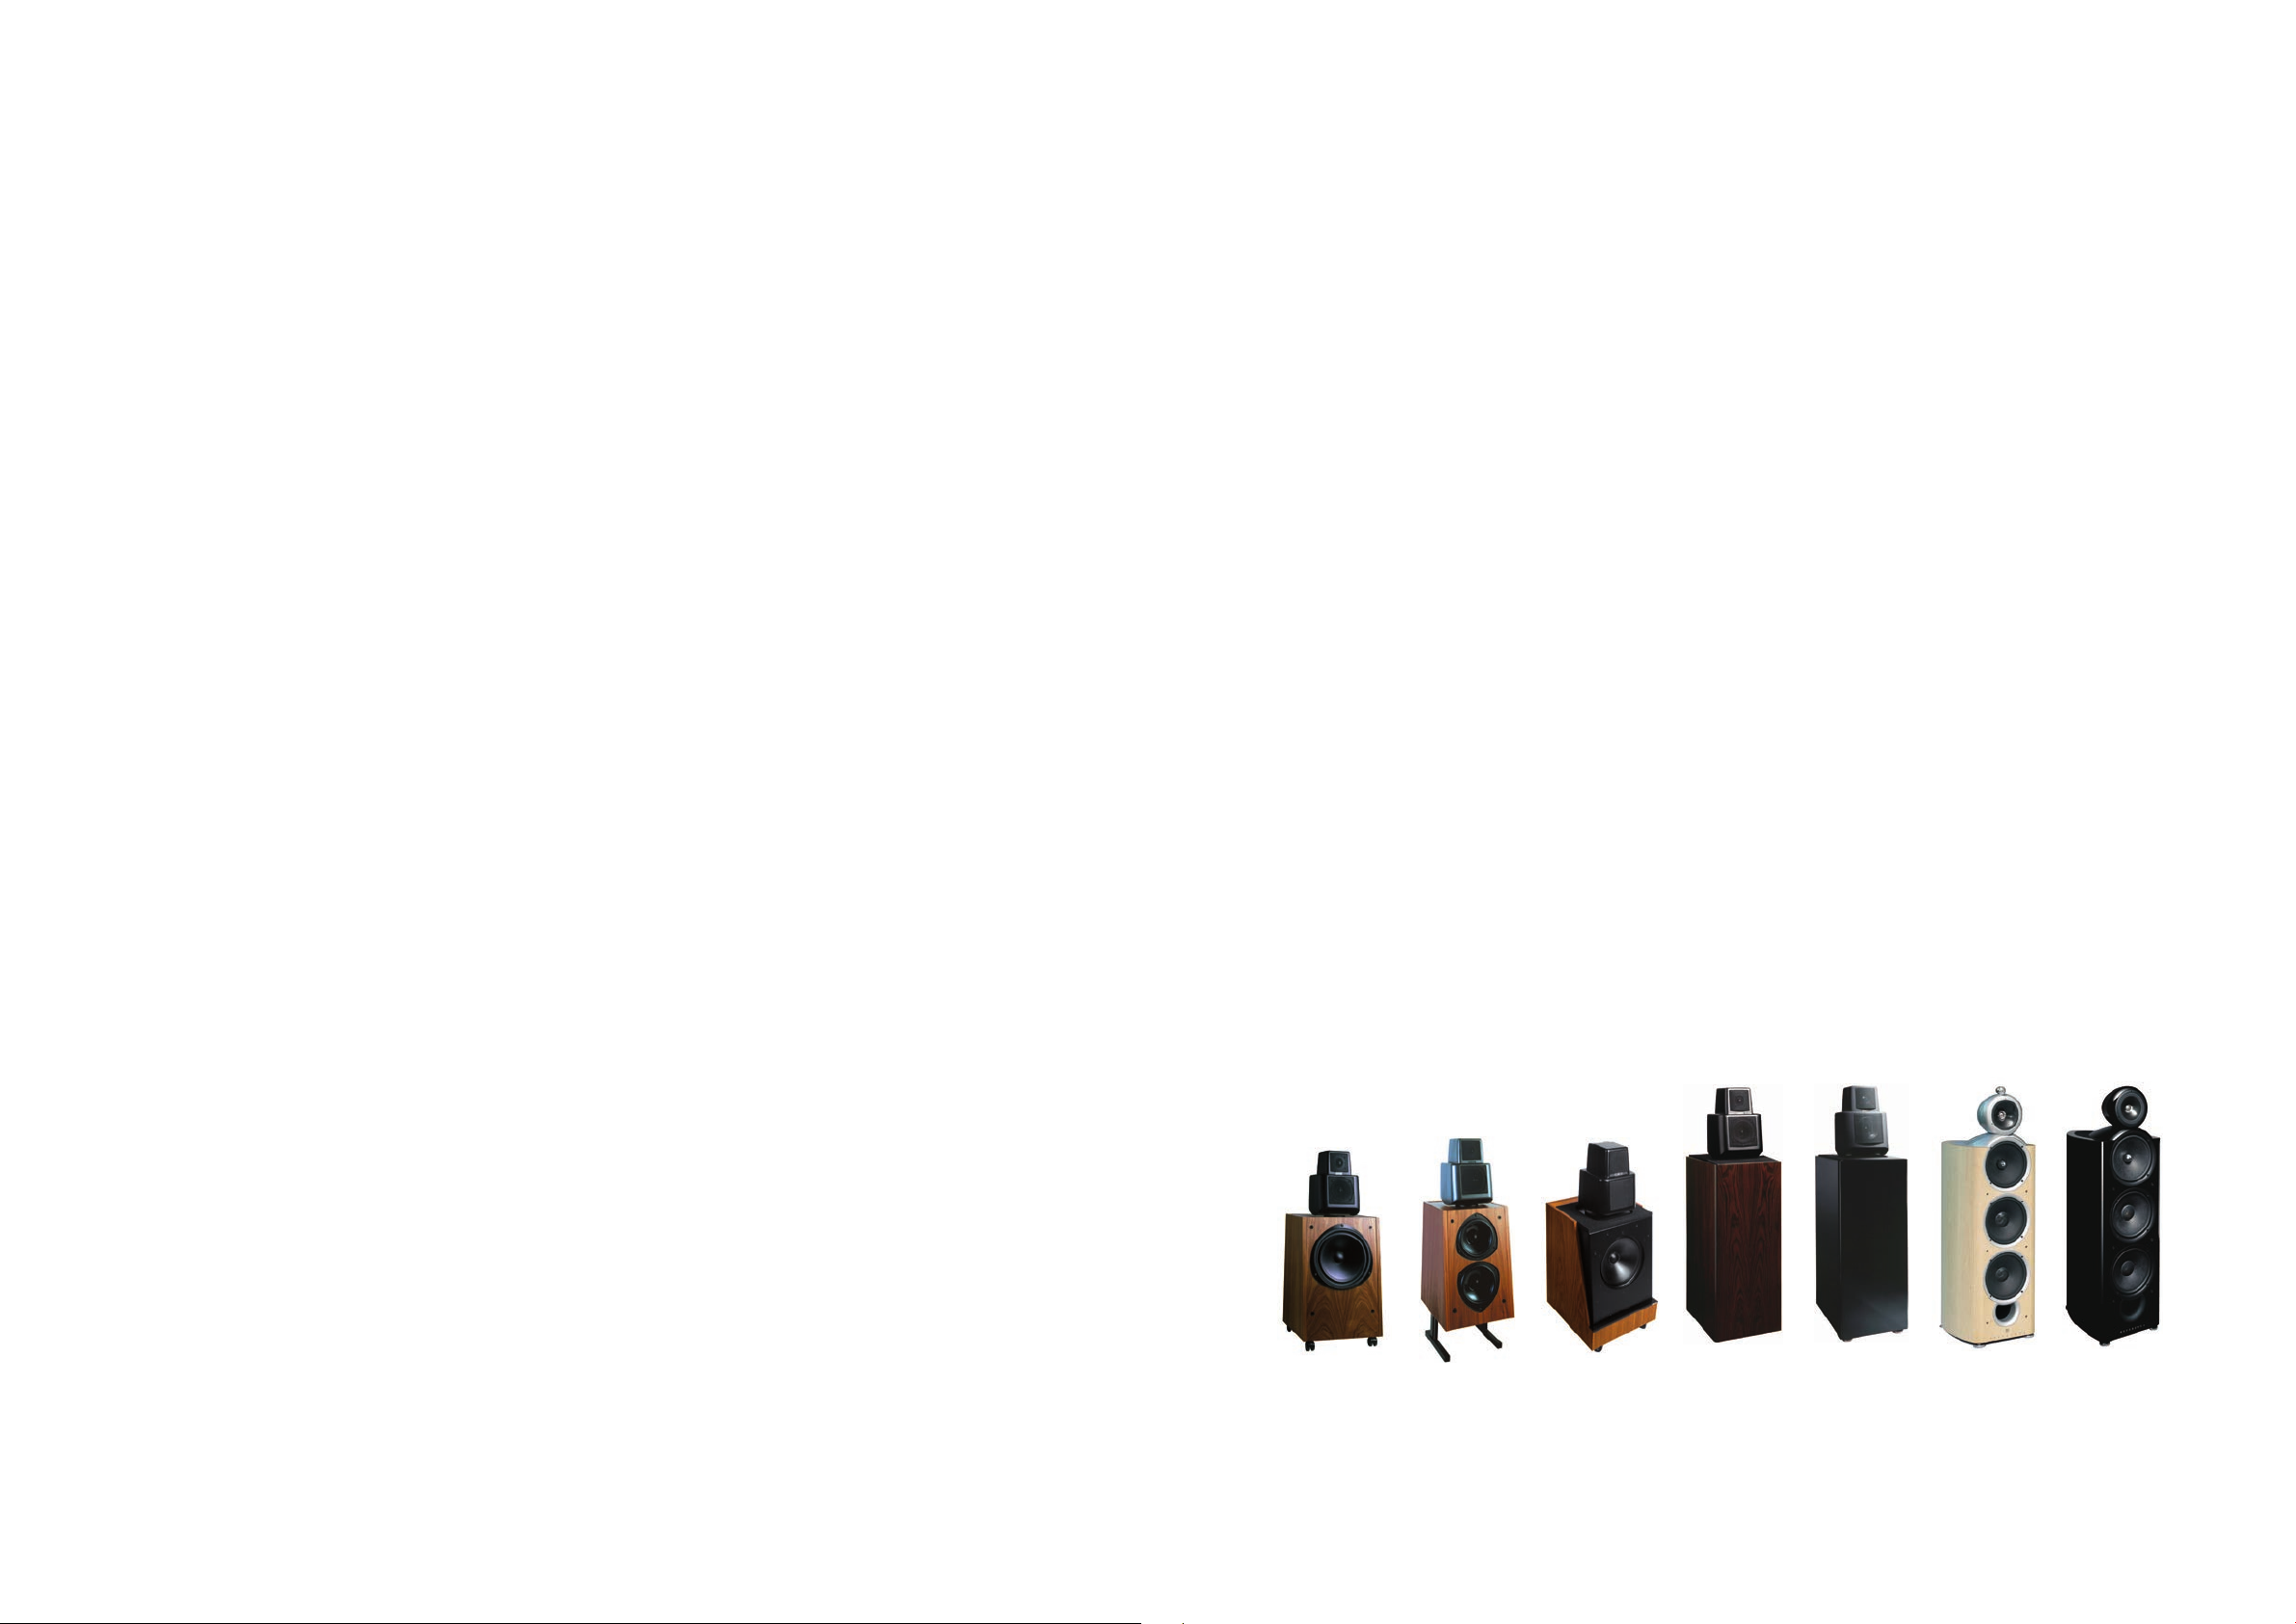
Model 105
(
)
1977-79
After 30 years of continous innovation and development, the Reference loudspeakers are
the perfect embodiment of the KEF philosophy to acoustic engineering.
Model 105/4
(
)
1980-82
Model 105/2
(
)
1979-87
Model 107
(
1986-89
)
Model 107/2
(
)
1990-96
Model 207
(
2001-2006
)
Model 207
(
2006-2014
)
2
3
Page 5
3 The model range
The perfect reproduction of recorded sound is what
KEF’s Reference Series has always stood for.
Back in the 1970s KEF was the first manufacturer
to use computers to create better loudspeakers. By
pioneering the use of these powerful analytics, KEF
engineers matched pairs of speakers to within half a
decibel - the audio equivalent of identical twins. Exact
pair matching delivers perfect stereo reproduction, so
these revolutionary speakers won instant acclaim for
their superior acoustic precision. The name ‘Reference’
was born.
Today’s Reference is enhanced by new technologies
and advanced materials that simply didn’t exist before,
massively extending their performance envelope
to exploit the full potential of modern music and
moving image formats. But the spirit is the same: to
achieve the purest and most accurate reproduction of
recorded sound in a way that perfectly captures the
full emotional range, depth and detail of the original
performance.
positioned either side of a 125mm (5inch) and 25mm
(1inch) vented aluminium domed tweeter, Uni-Q point
source driver array.
REFERENCE 8b: a compact yet powerful subwoofer,
it uses twin 500W Class D amplifiers, each driving
a 225mm (9inch) long-throw, ultra-low distortion
drive unit, connected back-to-back in a heavily braced,
acoustically inert cabinet.
Through this white paper we will explain in much more
detail the acoustic fundamentals, which are at the core
of the latest Reference loudspeakers.
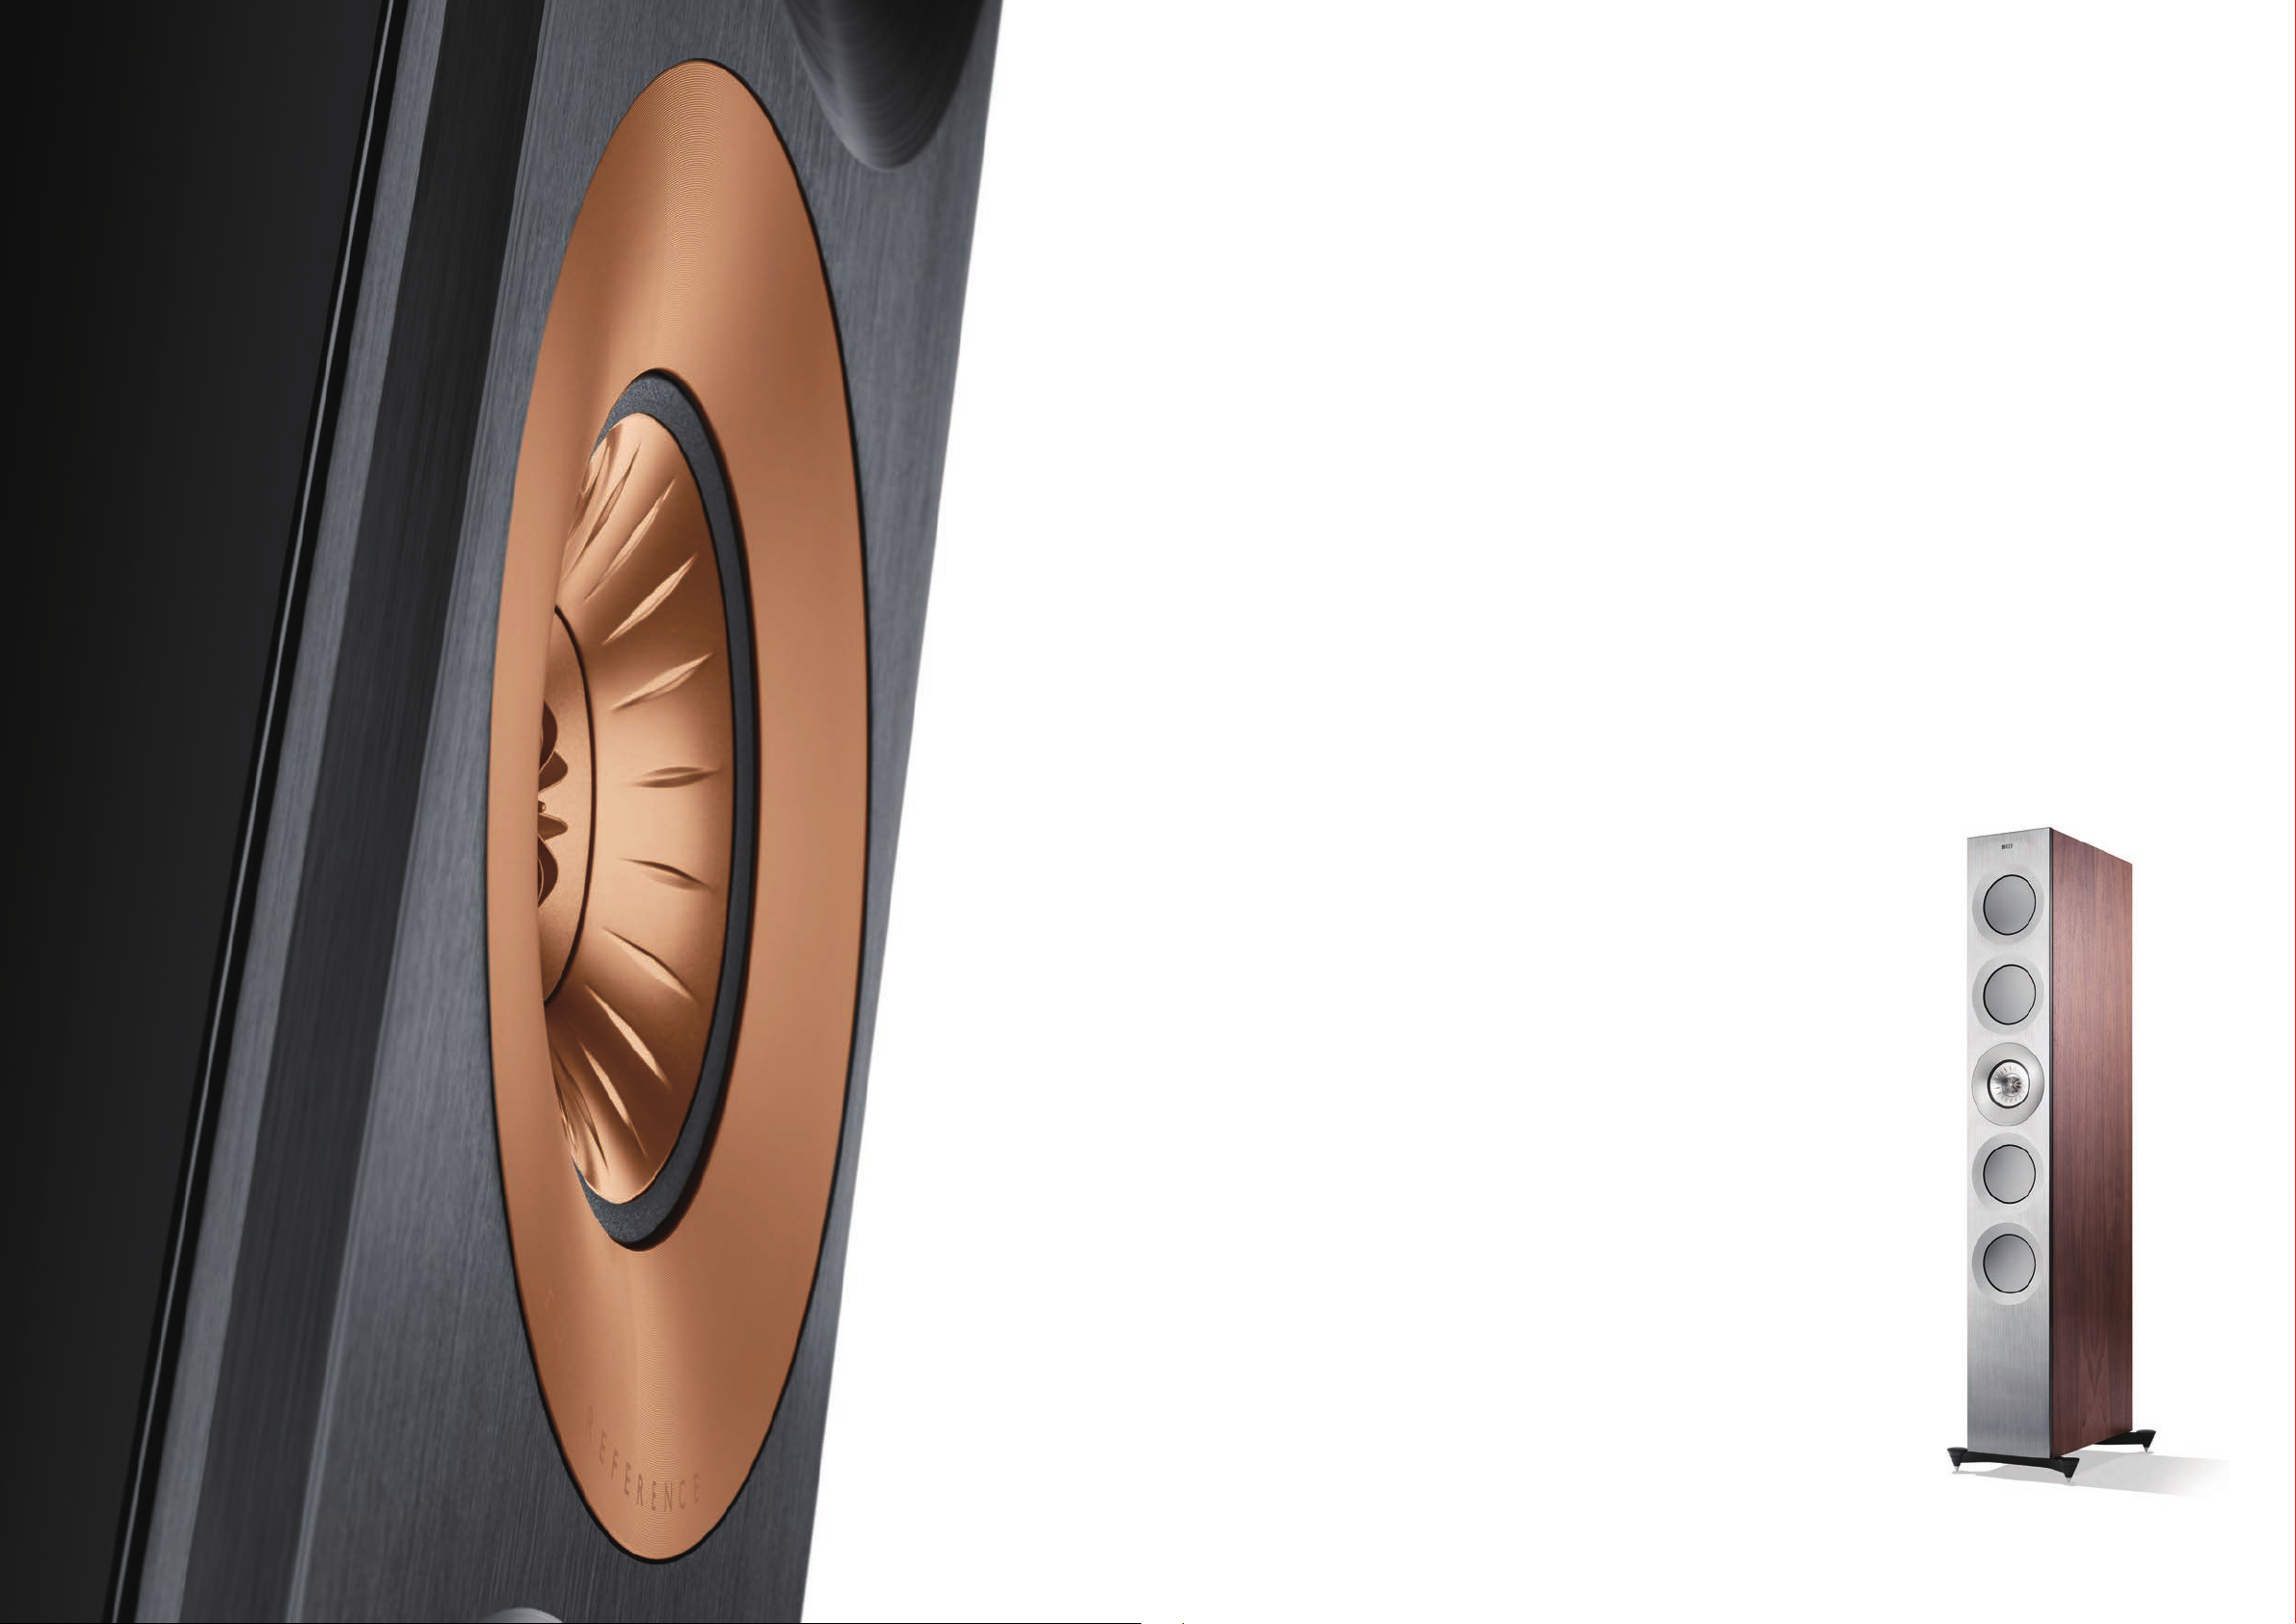
The Reference comprises six designs:
REFERENCE 1: a three-way, stand-mount design
featuring the innovative, 125mm (5inch) MF and 25mm
(1inch) vented aluminium domed tweeter, Uni-Q
point source driver array and single 165mm (6.5inch)
aluminium bass driver.
REFERENCE 3: the smaller of two oor standers, the
three-way design features twin 165mm (6.5inch) bass
drivers, perfectly positioned above and below a 125mm
(5inch) MF and 25mm (1inch) vented aluminium domed
tweeter, Uni-Q point source driver array, e ectively in
a D’Appolito con guration.
REFERENCE 5: a formidable three-way floor stand
design, it utilises four 165mm (6.5inch) bass drivers,
positioned above and below a 125mm (5inch) MF
and 25mm (1inch) vented aluminium domed tweeter,
Uni-Q point source driver array.
REFERENCE 4c: a full range centre channel using four
165mm (6.5inch) bass drivers, positioned either side
of a 125mm (5inch) MF and 25mm (1inch) vented
aluminium domed tweeter, Uni-Q point source driver
array.
REFERENCE 2c: a compact centre channel speaker that
features two 165mm (6.5inch) aluminium bass drivers,
Reference 5
5
Page 6
4 Technology
The technology used in The Reference is introduced in
this section. Whilst it is tempting to delve straight in to
the component details, it is easier to understand the
design by rst looking at the outside of the enclosures.
Indeed this is the starting point for the engineering
development.
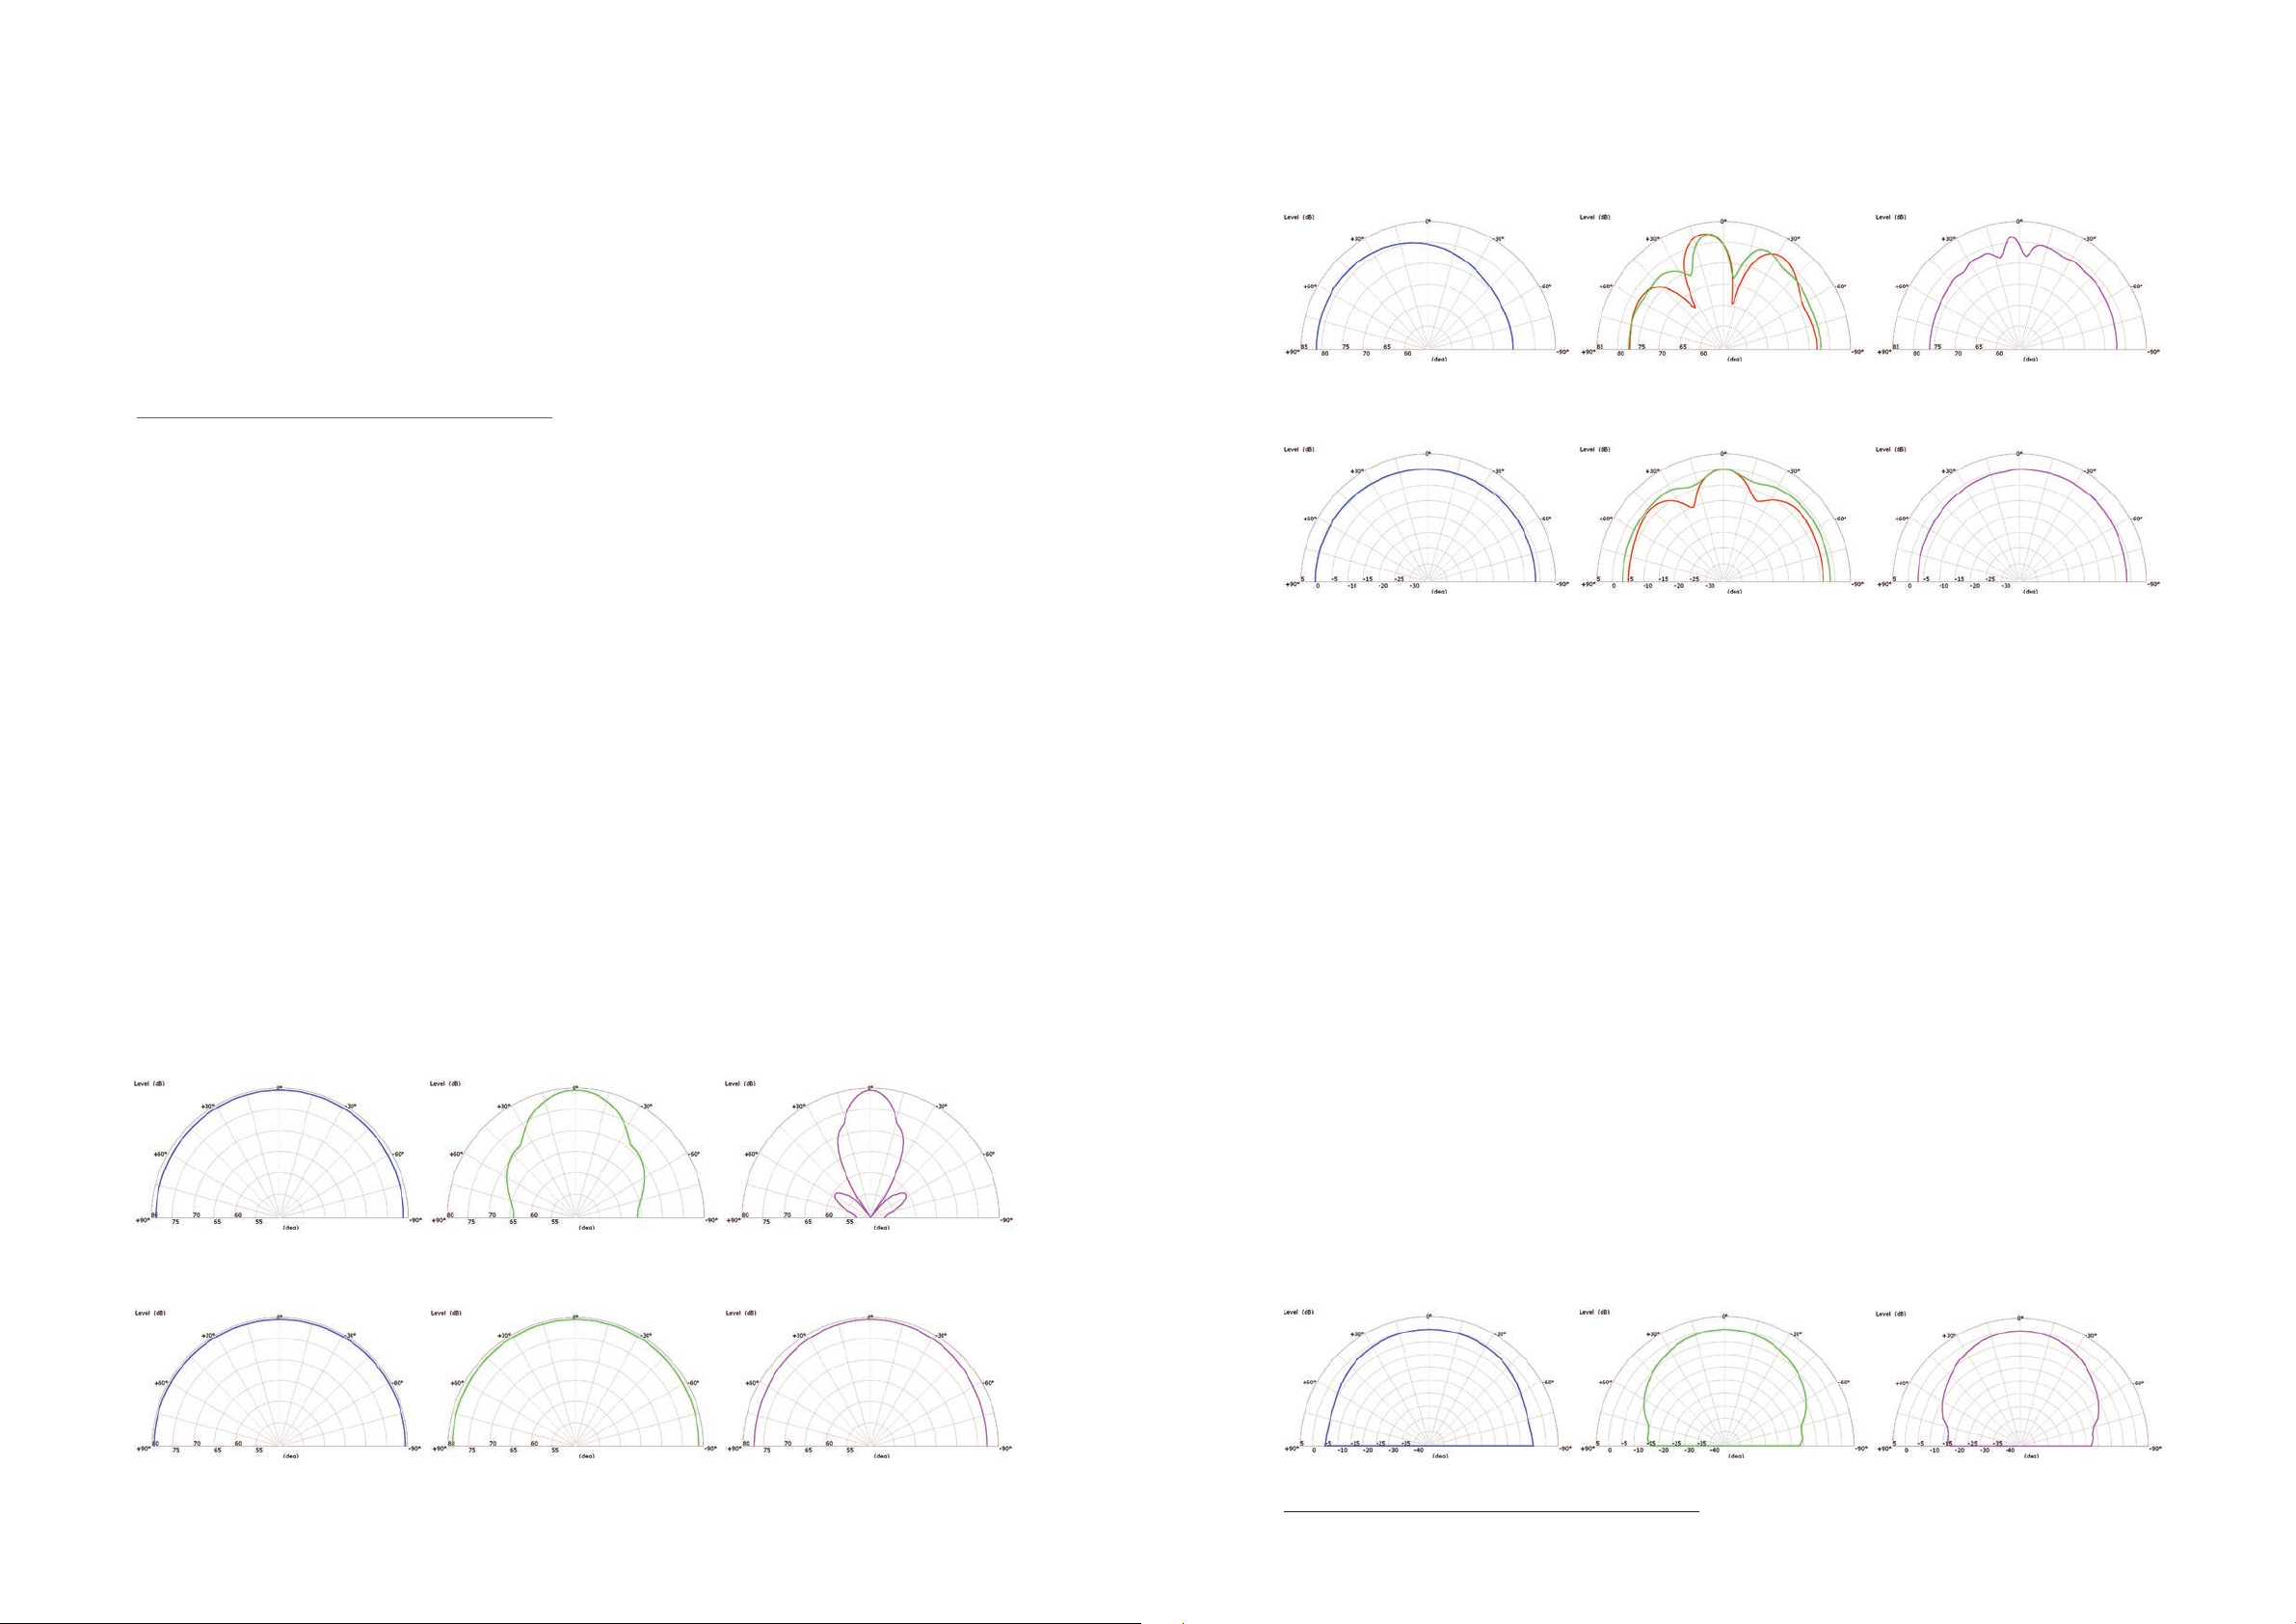
characteristics of an ideal 160mm bass driver at low,
mid and high frequencies. At high frequencies the
driver is very directional and there are some particular
directions where there are nulls in the output. By
contrast, Figure 2 shows the dispersion characteristics
at the same frequencies for a 25mm ideal driver. The
25mm driver has very wide dispersion at all three
4.1 External acoustics
frequencies shown, this is because it is small compared
to an acoustic wavelength in all cases. However, to
In the philosophy section some aims are described
that the perfect loudspeaker should try and achieve.
reproduce a 50Hz signal at 90dB at 1m the 25mm
diaphragm would need to move 20cm back and forth.
Primary among these was that the loudspeaker should
have smooth and balanced dispersion and frequency
response. The key to achieving this goal, particularly
in terms of the dispersion, is careful design of the
acoustics on the outside of the enclosure. The shape
of the cabinet, the number and size of the drivers, the
positioning of the drivers are all critical to ensuring a
high level of performance.
It is important that the output from each of the
separate drivers is integrated together into a single
coherent sound. As sound is a wave it is possible to get
destructive summation, where sound from two sources
cancels resulting in lower output than either source
individually. For example, Figure 3 and Figure 4 show
the dispersion resulting from using the ideal 160mm
and 25mm drivers together in a two way loudspeaker.
4.1.1 Mid and high frequencies
The tweeter is positioned 200mm away from the
woofer. The first figure shows the result when a 1
In a high quality loudspeaker it is necessary to
use multiple drivers of different size. This is due
to conflicting requirements for drivers designed
to reproduce high and low frequencies. To create
significant sound at low frequencies it is necessary
to use a large diaphragm that can move plenty of air.
However, at high frequencies a small diaphragm is
needed for good dispersion and to avoid diaphragm
order crossover is used and the second gure with a 4th
order. At first inspection the dispersion is reasonable
at high or low frequencies when only one of the two
drivers operates. In the midrange region, when both
drivers contribute to the loudspeaker output, the
dispersion pattern is very poor due to interference
between the two drivers. Some deep nulls are seen in
the directional response.
resonance. For example, Figure 1 shows the dispersion
Figure 1. Polar dispersion of a 160mm ideal driver, with rigid at piston mounted in in nite ba e, at 500Hz, 3kHz and 6kHz.
Figure 3. Polar dispersion of theoretical system with ideal 25mm driver 200mm to the right of an ideal 160mm driver with 1st order Butterworth crossover at 2kHz, polar
plots at 500Hz 3kHz (green) 2kHz (red) and 6kHz.
th
Figure 4. Polar dispersion of theoretical system with ideal 25mm driver 200mm to the right of an ideal 160mm driver with 4
plots at 500Hz 3kHz (green) 2kHz (red) and 6kHz.
Another behaviour can be noted on the high and low
frequency graphs and is particularly obvious on the
st
4th order crossover: at low frequencies the dispersion
is skewed to the left, towards the location of the
low frequency driver, and at high frequencies the
dispersion is skewed to the right towards the high
frequency driver.
For The Reference a new Uni-Q driver has been
designed using technology from the Blade loudspeaker,
the details of the new drivers are outlined in section 4.4.
Figure 5 shows the frontal horizontal polar measured
data for the prototype Reference 5 loudspeakers.
At each frequency the response is symmetrical and
smooth, with increasing frequency the directivity gently
order Linkwitz Riley crossover at 2kHz, polar
and monotonically narrows.
1
The KEF Uni-Q
to these issues. The tweeter is placed at the acoustic
centre of the midrange driver. This immediately
overcomes the issue of a coherent source location
over the operating range of the tweeter and the
midrange. In addition, unlike other concentric tweeter
and midrange solutions, the tweeter dispersion is
carefully matched to the midrange using both the
KEF tangerine waveguide2 and the shape of the
midrange cone, acting as a waveguide. Because of the
matched dispersion and the shared source location,
the crossover design is much simpler than in a
conventional system. No interference dips or lobeing
occurs. The result is an array of two drivers that is
driver is the rst step in the solution
The Reference Uni-Q is designed to cover the
frequency range from 350Hz upwards. This allows
the Uni-Q array to cover the entire critical upper six
octaves of the audio band whilst at the same time
not requiring excessive excursion of the midrange
cone. This is very important as with the tweeter and
midrange driver in such close proximity there is the
potential for interaction to occur if the midrange
movement was not kept to an insignificant level. This
350Hz cut o also allows the midrange driver size to
be chosen based on optimal dispersion matching with
the tweeter, rather than based on the bass output
requirements.
totally coherent and with almost ideal dispersion and
response characteristics.
Figure 2. Polar dispersion of a 25mm ideal driver, with rigid at piston mounted in in nite ba e, at 500Hz, 3kHz and 6kHz.
6
Figure 5. Horizontal polar dispersion measurements of prototype Reference 5 system with crossover, polar plots at 500Hz 3kHz and 6kHz.
1 Please see Uni-Q section in Appendices for more details.
2 Please see Tangerine Waveguide section in Appendices for more details.
7
Page 7
4.1.2 3-way design approach
The frequency range below 350Hz is handled by
dedicated bass drivers making The Reference systems
3-way designs. With each additional splitting of the
audio bandwidth the complexity of the system increases
and the more di cult it is to make a loudspeaker with
a coherent overall output. Two way designs normally
require the midrange and the low frequencies to be
reproduced by a single driver. Usually this results in a
compromise, choosing a smaller low/mid driver gives
better dispersion and a better behaved diaphragm but
will limit the bass output level. A larger cone could be
used to give more maximum bass output but normally
at the expense of dispersion and response smoothness
at the top end of the LF/MF driver. By contrast, with a
4-way design the additional complexity is hard to justify
compared to a 3-way design. Firstly, in a 4-way design it
typically becomes necessary to use a very low bottom
crossover point and this is a particular challenge as it
increases the crossover complexity signi cantly in terms
of number of components. Secondly, each crossover
point adds an inevitable amount of time smearing3 to
the system and this becomes particularly problematic
with a low crossover point. Thirdly, the bass e ciency
of the loudspeaker is predominantly determined by
the cabinet volume available to the low frequency
driver - adding a lower mid section to create a 4-way
loudspeaker uses additional cabinet volume that could
be otherwise used for the bass section. Finally, the
system dispersion at low-mid frequencies is largely
determined by the driver positions and adding another
set of drivers makes it much more challenging to
position all the drivers in locations where they will sum
e ectively to give a good overall dispersion. The caveat
to a 3-way design is that the drivers must cover a
larger frequency range compared to the 4-way design.
However, with modern state-of-the-art transducers
this is achievable.
octaves above this frequency. Secondly, in the mid
and low frequency region, from 100Hz to 600Hz, the
loudspeaker directivity is largely determined by shape of
the loudspeaker cabinet and driver positions. The use
of a consistent 6.5inch LF driver size allows all models
to use identical cabinet widths resulting in horizontal
dispersion across the range which is almost exactly
the same. Finally, for the larger models several drivers
are used together and share the input power equally.
Each 6.5inch driver is designed to be extremely linear
and cope with exceptionally high power individually.
Consequently this con guration is able to play at higher
power levels with lower distortion than would be
possible if fewer larger drivers were used.
A common misconception is that only large drivers
are able to efficiently produce deep bass. This is not
the case. Thiele and Small (formerly of KEF) showed in
their seminal series of papers in the 1970s that it is only
the cabinet volume that limits the e ciency of the bass
output of a loudspeaker [1] [2] [3] [4]. It is, however,
necessary to move a large volume of air in order to
produce bass at high sound levels. The multiple drivers
help in this aspect too, the four 6.5inch bass drivers
in Reference 5 have equivalent radiating area to a
12inch subwoofer driver and extremely large excursion
capability.
Below 500Hz, the drivers themselves all have wide
dispersion and it is the cabinet, driver locations and the
crossover design that determine the system dispersion.
In all of the models the 6.5inch LF drivers are placed as
close as possible to the MF driver of the Uni-Q in order
to minimise lobeing and interference dips at the lower
crossover. The oorstanding models use a symmetrical
driver layout first described by Joseph D’Appolito
[5] and designed to avoid vertical off-axis lobeing at
crossover. The configuration is most frequently used
to crossover between a pair of midrange drivers to
a tweeter. However, in this circumstance it is not
normally possible to avoid off-axis interference dips
close to the listening axis in the vertical polar response
as typically the inter driver spacing is significant
compared to the acoustic wavelength. With The
Reference D’Appolito layout the crossover frequency is
much lower and consequently the acoustic wavelength
is large enough that interference dips in the vertical
response are pushed well away from the listening axis.
The D’Appolito arrangement also has the additional
bene t that the apparent acoustic source does not shift
away from the position of the Uni-Q driver over the
entire frequency range of the loudspeaker.
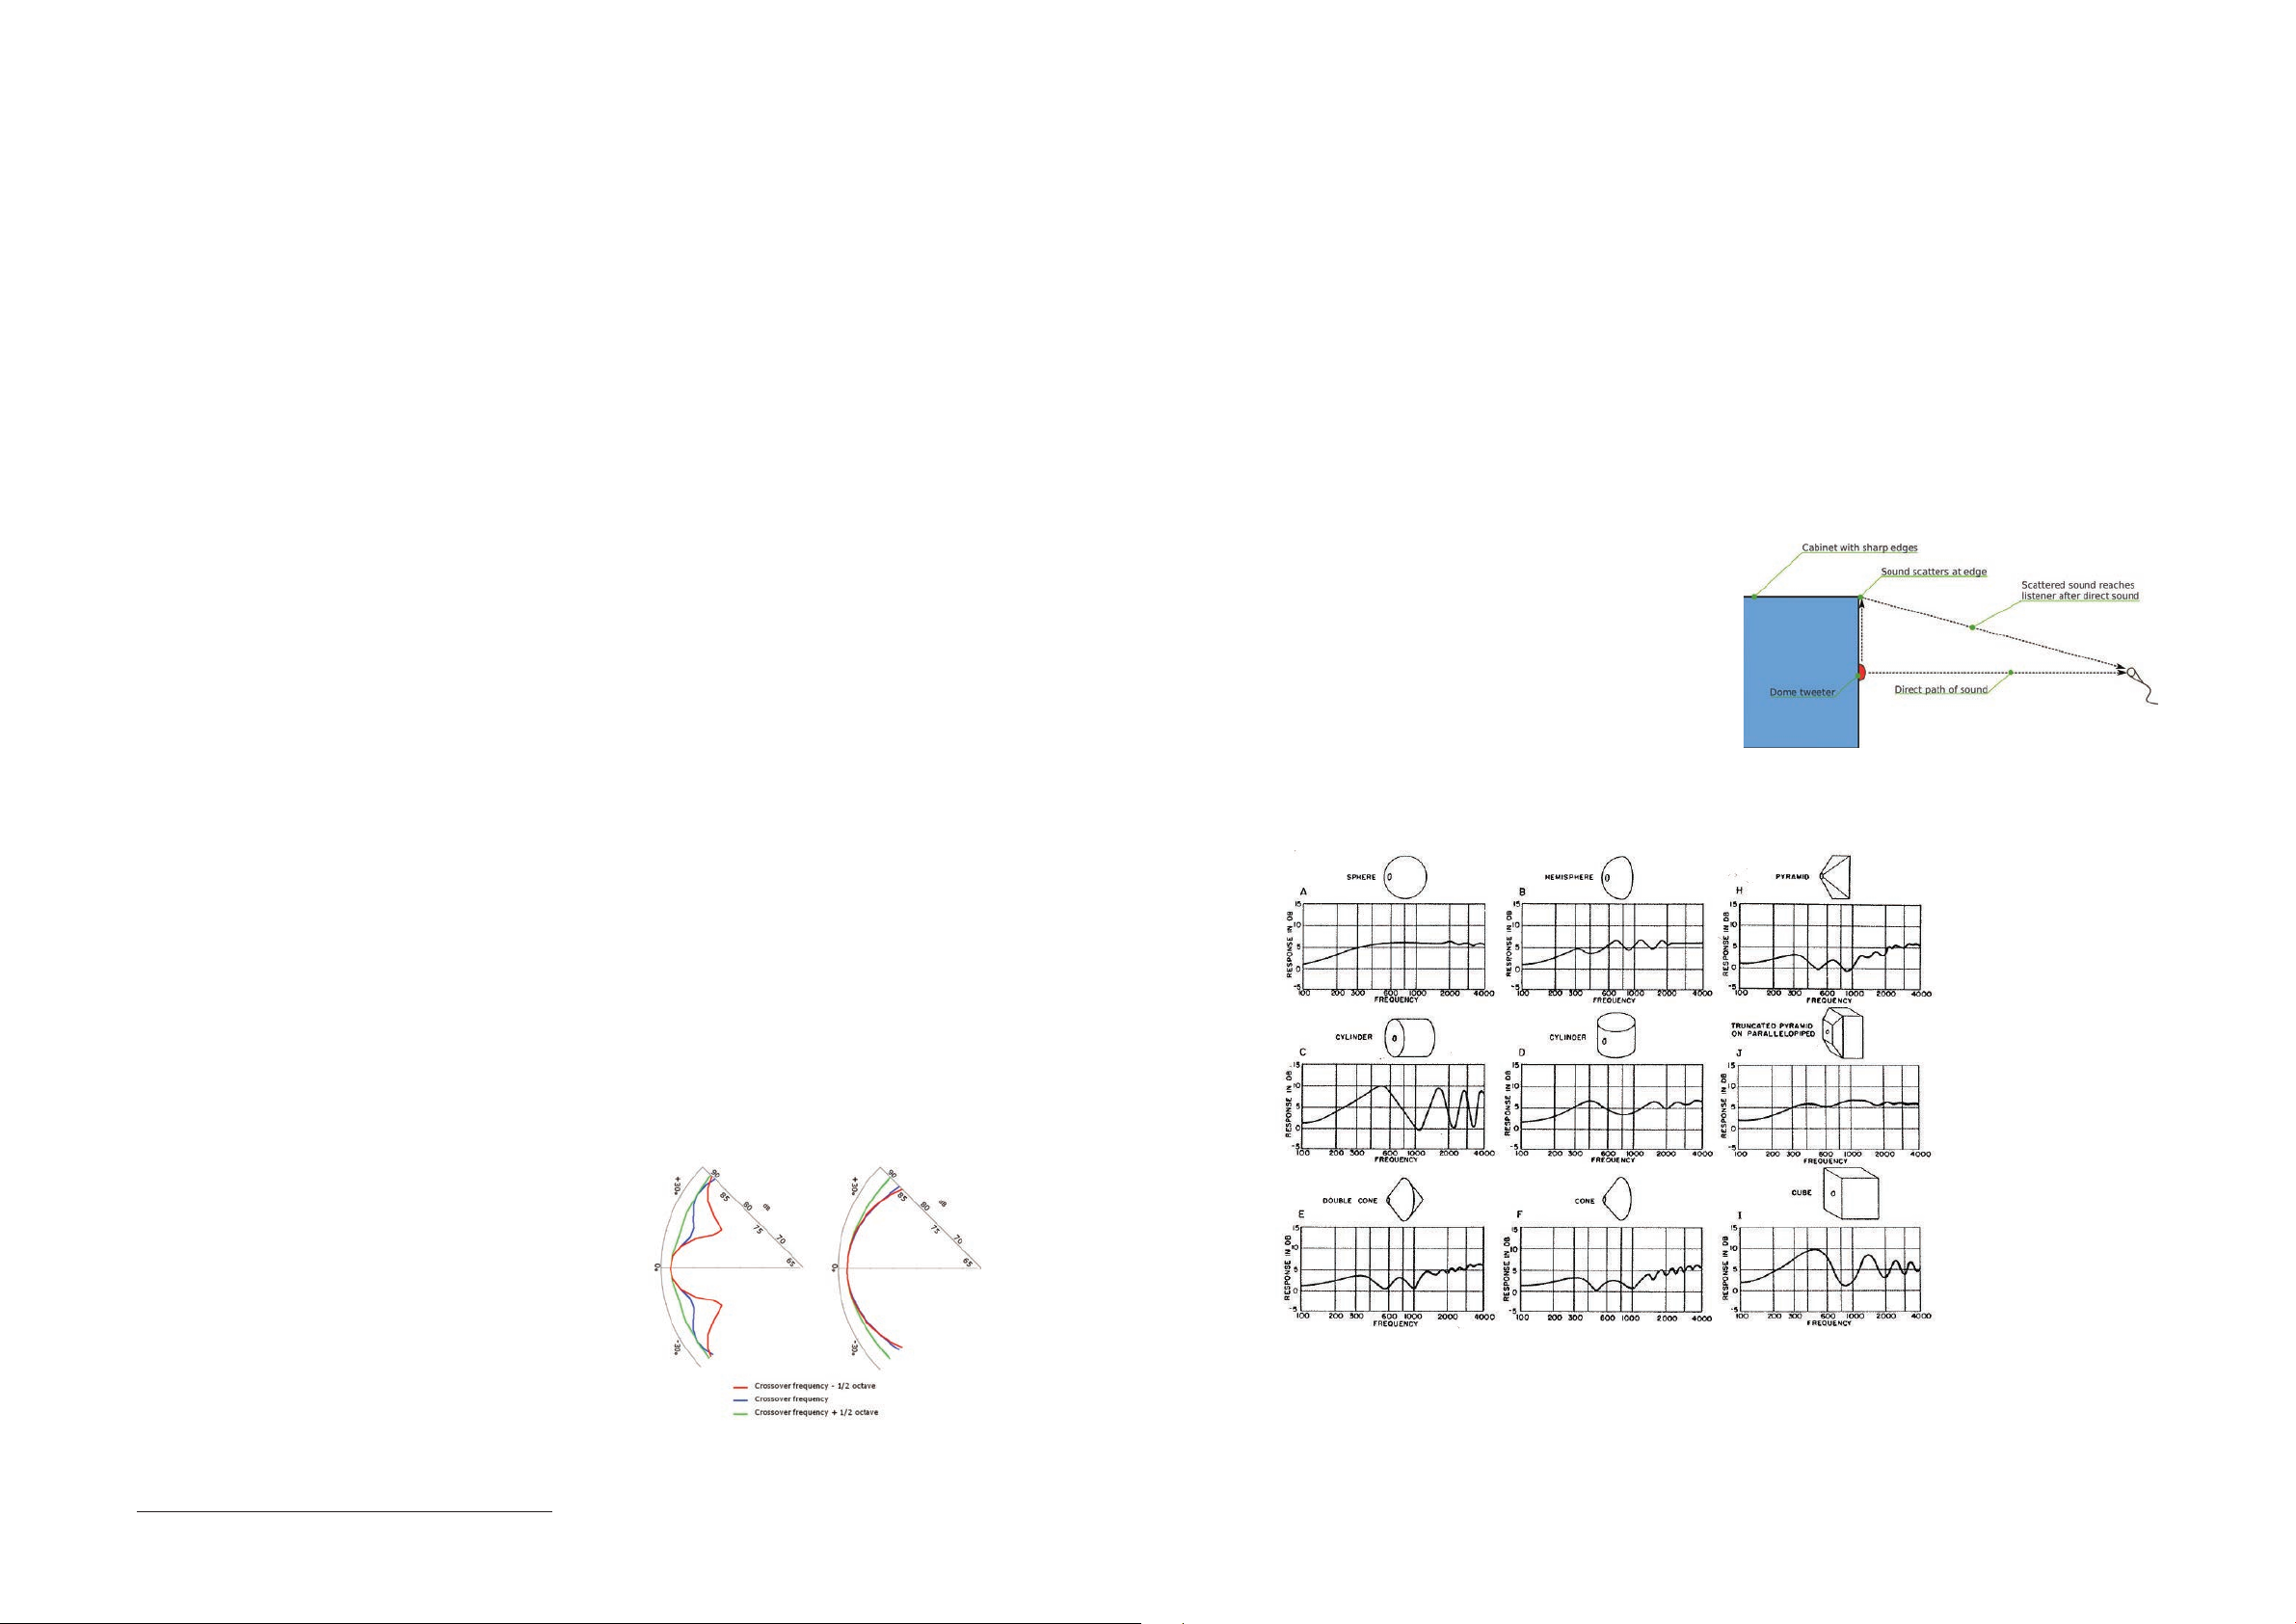
4.1.4 Cabinet di raction
The shape of the loudspeaker cabinet has a very
large effect on the smoothness of the directivity
and frequency response of a loudspeaker. Edges and
openings can scatter the sound from the drivers, the
tweeter in particular, and this results in irregularities
in the response that are typically focused at the main
listening position. Figure 7 illustrates the underlying
physical behaviour: when the sound from the driver
hits a discontinuity, such as the edge of the cabinet,
the sound will scatter and be re-radiated in all
directions. If this sound reaches the listener it will arrive
momentarily later than the direct sound from the
driver. At the frequency that this arrival time di erence
is half a wavelength the sound from the two paths will
destructively sum resulting in a null in the loudspeaker
response.
Olsen was the first to look at this diffraction effect
Figure 7. Diagrammatic explanation of di raction e ect.
4.1.3 Controlling dispersion at the bass
to mid crossover
All models in The Reference range use 6.5inch drivers
to handle the low frequencies of the loudspeaker
output. This driver has been developed especially
for the new range, the full details are outlined in
section 4.4. There are several reasons to use the
same size driver across the loudspeaker range. Firstly,
the 6.5inch driver is easily capable of being used up
to the LF/MF crossover frequency of 350Hz, which
is the same across all models. Indeed the new driver
has a diaphragm that remains rigid more than two
3 This refers to the non-constant group delay resulting from causal active,
passive or digital crossover lters. FIR ltering allows other options but has
8
problems of its own, such as pre-ringing, latency and frequency resolution at
low frequencies.
Figure 6. D’Appolito polar response comparison, left a conventional arrangement
using a tweeter and two midrange driver s, right with a Uni-Q driver and
four low frequency drivers as on Reference 5.
Figure 8. Reproduction of Olsen’s classic loudspeaker enclosure ba e-di raction experiment.
in detail and his classic experiments in cabinet shape
are reproduced in Figure 8 [6, p.23]. These graphs
are widely reproduced [7, p.318][8, p.347]. and give
a good initial guideline for the preferred shape of the
loudspeaker cabinet to minimise this e ect. However,
there is an important e ect that is not demonstrated
in Olsen’s classic experiments: the e ect of the driver
dispersion on the diffraction effect. For example,
9
Page 8
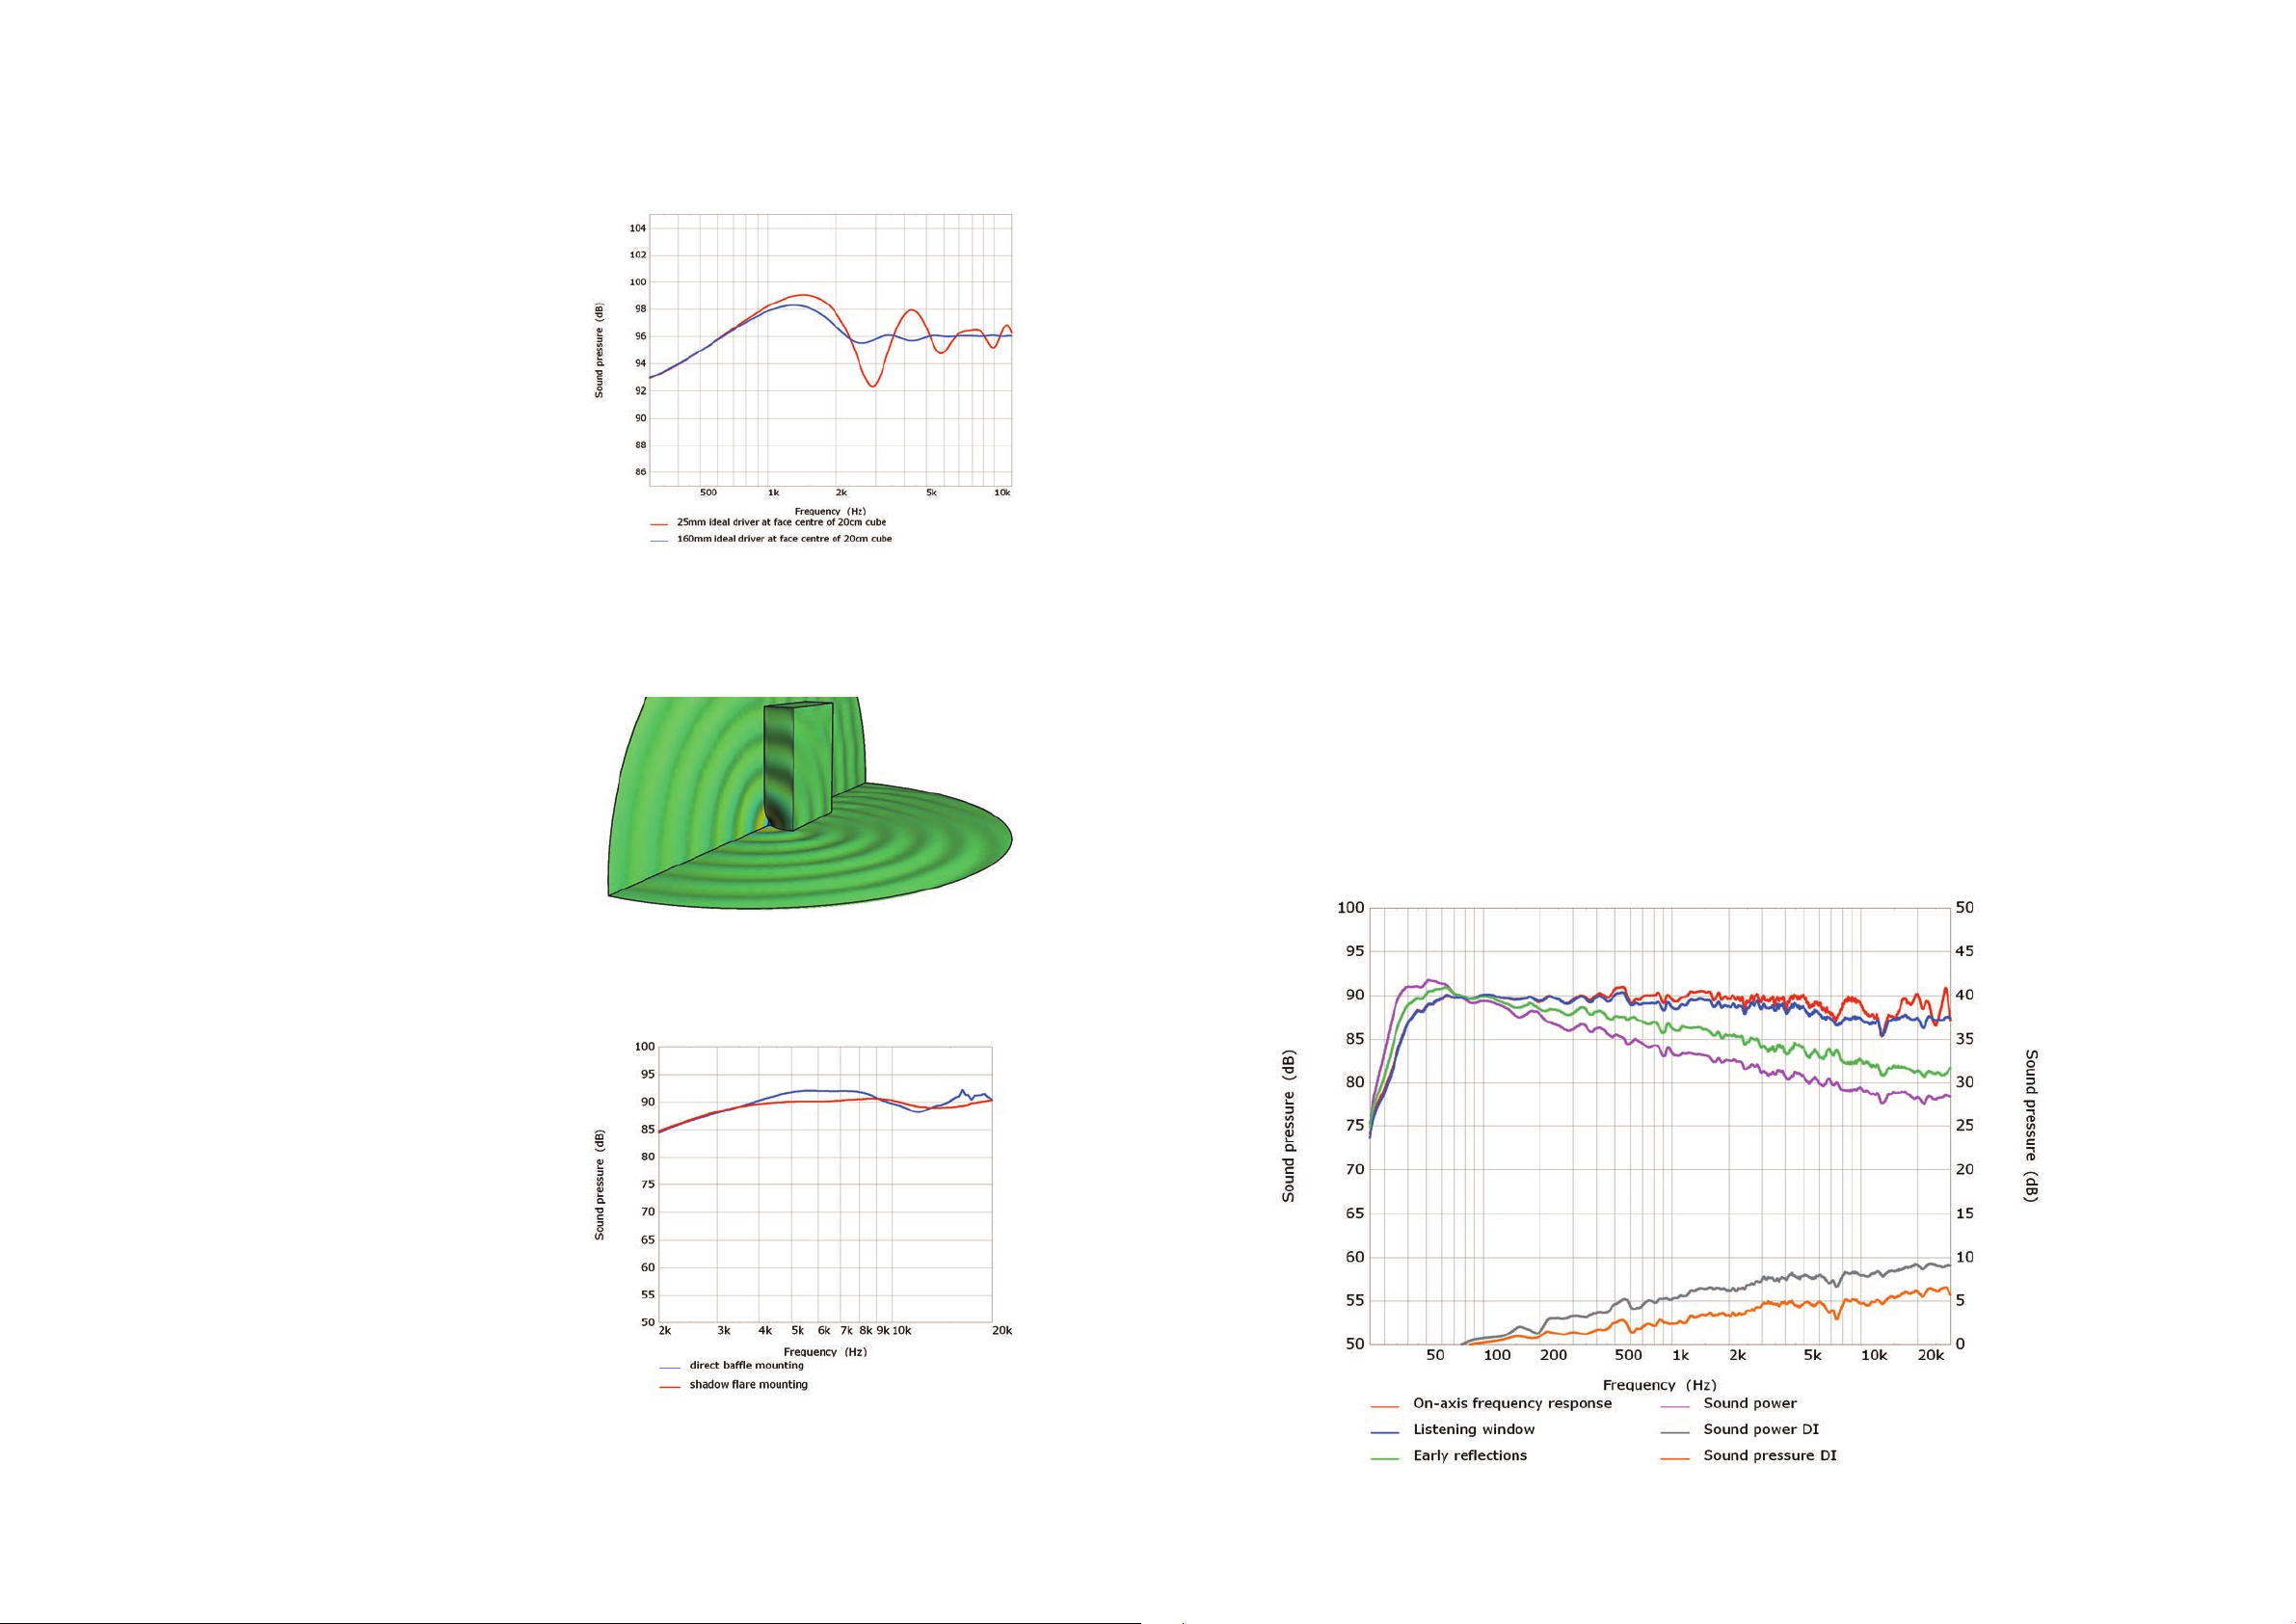
Figure 9 shows the modelled response of two di erent
size ideal drivers located at the face centre of a 20cm
cube. The red curve is the response for a 25mm driver
and the blue curve is the response for a 160mm driver.
With the 160mm driver the response above 2kHz is
much smoother than for the 25mm driver. The raw
dispersion of these drivers was shown in Figure 1 and
2 above, note that the location of the dip for this cube
is 3kHz which corresponds to the second polar plot
for each driver size. At 3kHz the 25mm driver has
an almost omnidirectional polar response, this means
a strong sound wave reaches the edge of the cube
and consequently the diffraction effect is severe. The
160mm driver is a little more directional and, as much
less sound reaches the edge, the diffraction effect is
much less severe.
As was discussed above, the very wide dispersion of
a baffle mounted 25mm tweeter in the lower treble
region is actually a problem in terms of directivity
matching with the midrange driver at crossover.
It is also something of a worst case in terms of
diffraction because it fully “illuminates” the edges of
the loudspeaker cabinet in the 3kHz region where
the first diffraction dip is typically seen. A less often
mentioned benefit of the Uni-Q driver is that the
tweeter dispersion in the lower treble is controlled by
the wave-guide of the Uni-Q driver and the di raction
problem is lessened.
BEM analysis was used to simulate the cabinet
diffraction in detail with the full driver and geometry
details. Out of this work the “Shadow Flare” was
developed. The Shadow Flare is a shallow waveguide
that smoothly blends the Uni-Q driver into the ba e
of The Reference cabinets. This waveguide further
controls the dispersion of the Uni-Q tweeter and
midrange driver and creates an acoustic shadow in the
region of the cabinet edge closest to the driver. This
reduces the cabinet diffraction effect significantly to
the extent that little irregularity is seen on the tweeter
or midrange driver responses when they are mounted
in the system. For example, the e ect on the tweeter
response can be seen in Figure 11.
Figure 9. Comparison of the di raction e ect with radiators of di erent size placed
in the centre of a cubic enclosure
Figure 10. FEA modelled acoustic pressure on, and around, cabinet surface due to
MF driver output.
of the reasons for this is to minimise the diffraction.
This location also serves another purpose as it greatly
reduces the audibility of any remaining port midrange
leakage as fully outlined in section 4.2.
4.1.5 Overall dispersion performance
Figure 12 shows a set of frequency responses for an
early prototype of Reference 5. The curves shown
in this plot are the figures of merit for assessing
loudspeakers as suggested by the research work of
Floyd Toole [9] [10]. The curves are measured at 96
data points per octave without any smoothing. Based
on these gures of merit Toole was able to predict real
listener preference with a remarkable accuracy. This
research work is an important endorsement of the
KEF philosophy of focusing strongly on the loudspeaker
dispersion. The interested reader is directed to Toole’s
many publications for full explanation of how to
interpret the data. Brie y, this set of data shows that
the loudspeaker response is exceptionally flat and
smooth, free from resonance and that the dispersion
is smooth and well controlled. Note that there is
no change in any of the responses at the crossover
frequencies of 350Hz and 2500Hz.
10
In addition to the cabinet edges, other discontinuities
can cause diffraction issues. For this reason the low
frequency drivers have been designed to be as low
pro le as possible so that they present as little deviation
from the flat front baffle as possible. The port exits
are located on the rear of the loudspeakers and one
Figure 11. Uni-Q driver HF response with and without shadow are to control the
di raction e ect.
Figure 12. Family of directional response curves for early Reference 5 prototype.
11
Page 9
4.2 Low frequency response
The main loudspeakers in The Reference use ported
enclosure designs. This section outlines the reason for
this choice and how this maximises the performance of
the loudspeakers for the size and drivers used.
One might ask the question, why do we need a
loudspeaker enclosure at all, what purpose does it
serve? The answer is really quite simple: it is because
when the cone of the loudspeaker driver moves
forward it creates just as much sound at the back
of the driver as the front. Figure 13 illustrates this
behaviour, without an enclosure the positive acoustic
pressure created at the front of the driver is cancelled
by the negative pressure created at the rear of the
driver. This cancellation e ect is extremely e ective at
low frequencies, consequently a loudspeaker driver
in free air outputs virtually no bass even at maximum
input power.
The enclosure is required to contain the negative rear
acoustic pressure to prevent it from interfering with the
sound from the front of the driver. The simplest design
of enclosure is the sealed-box, which simply contains
the rear radiation in a completely closed cabinet as
shown in Figure 14.
The enclosure, however, changes the loading
experienced by the loudspeaker driver. When the cone
is displaced, the pressure change inside the enclosure
results in an additional restoring force which pushes
the cone back towards the rest position. Effectively
the enclosure behaves like an additional stiffness is
connected to the cone - the smaller the enclosure the
greater this stiffness. This is the reason why a small
loudspeaker cannot produce deep bass efficiently.
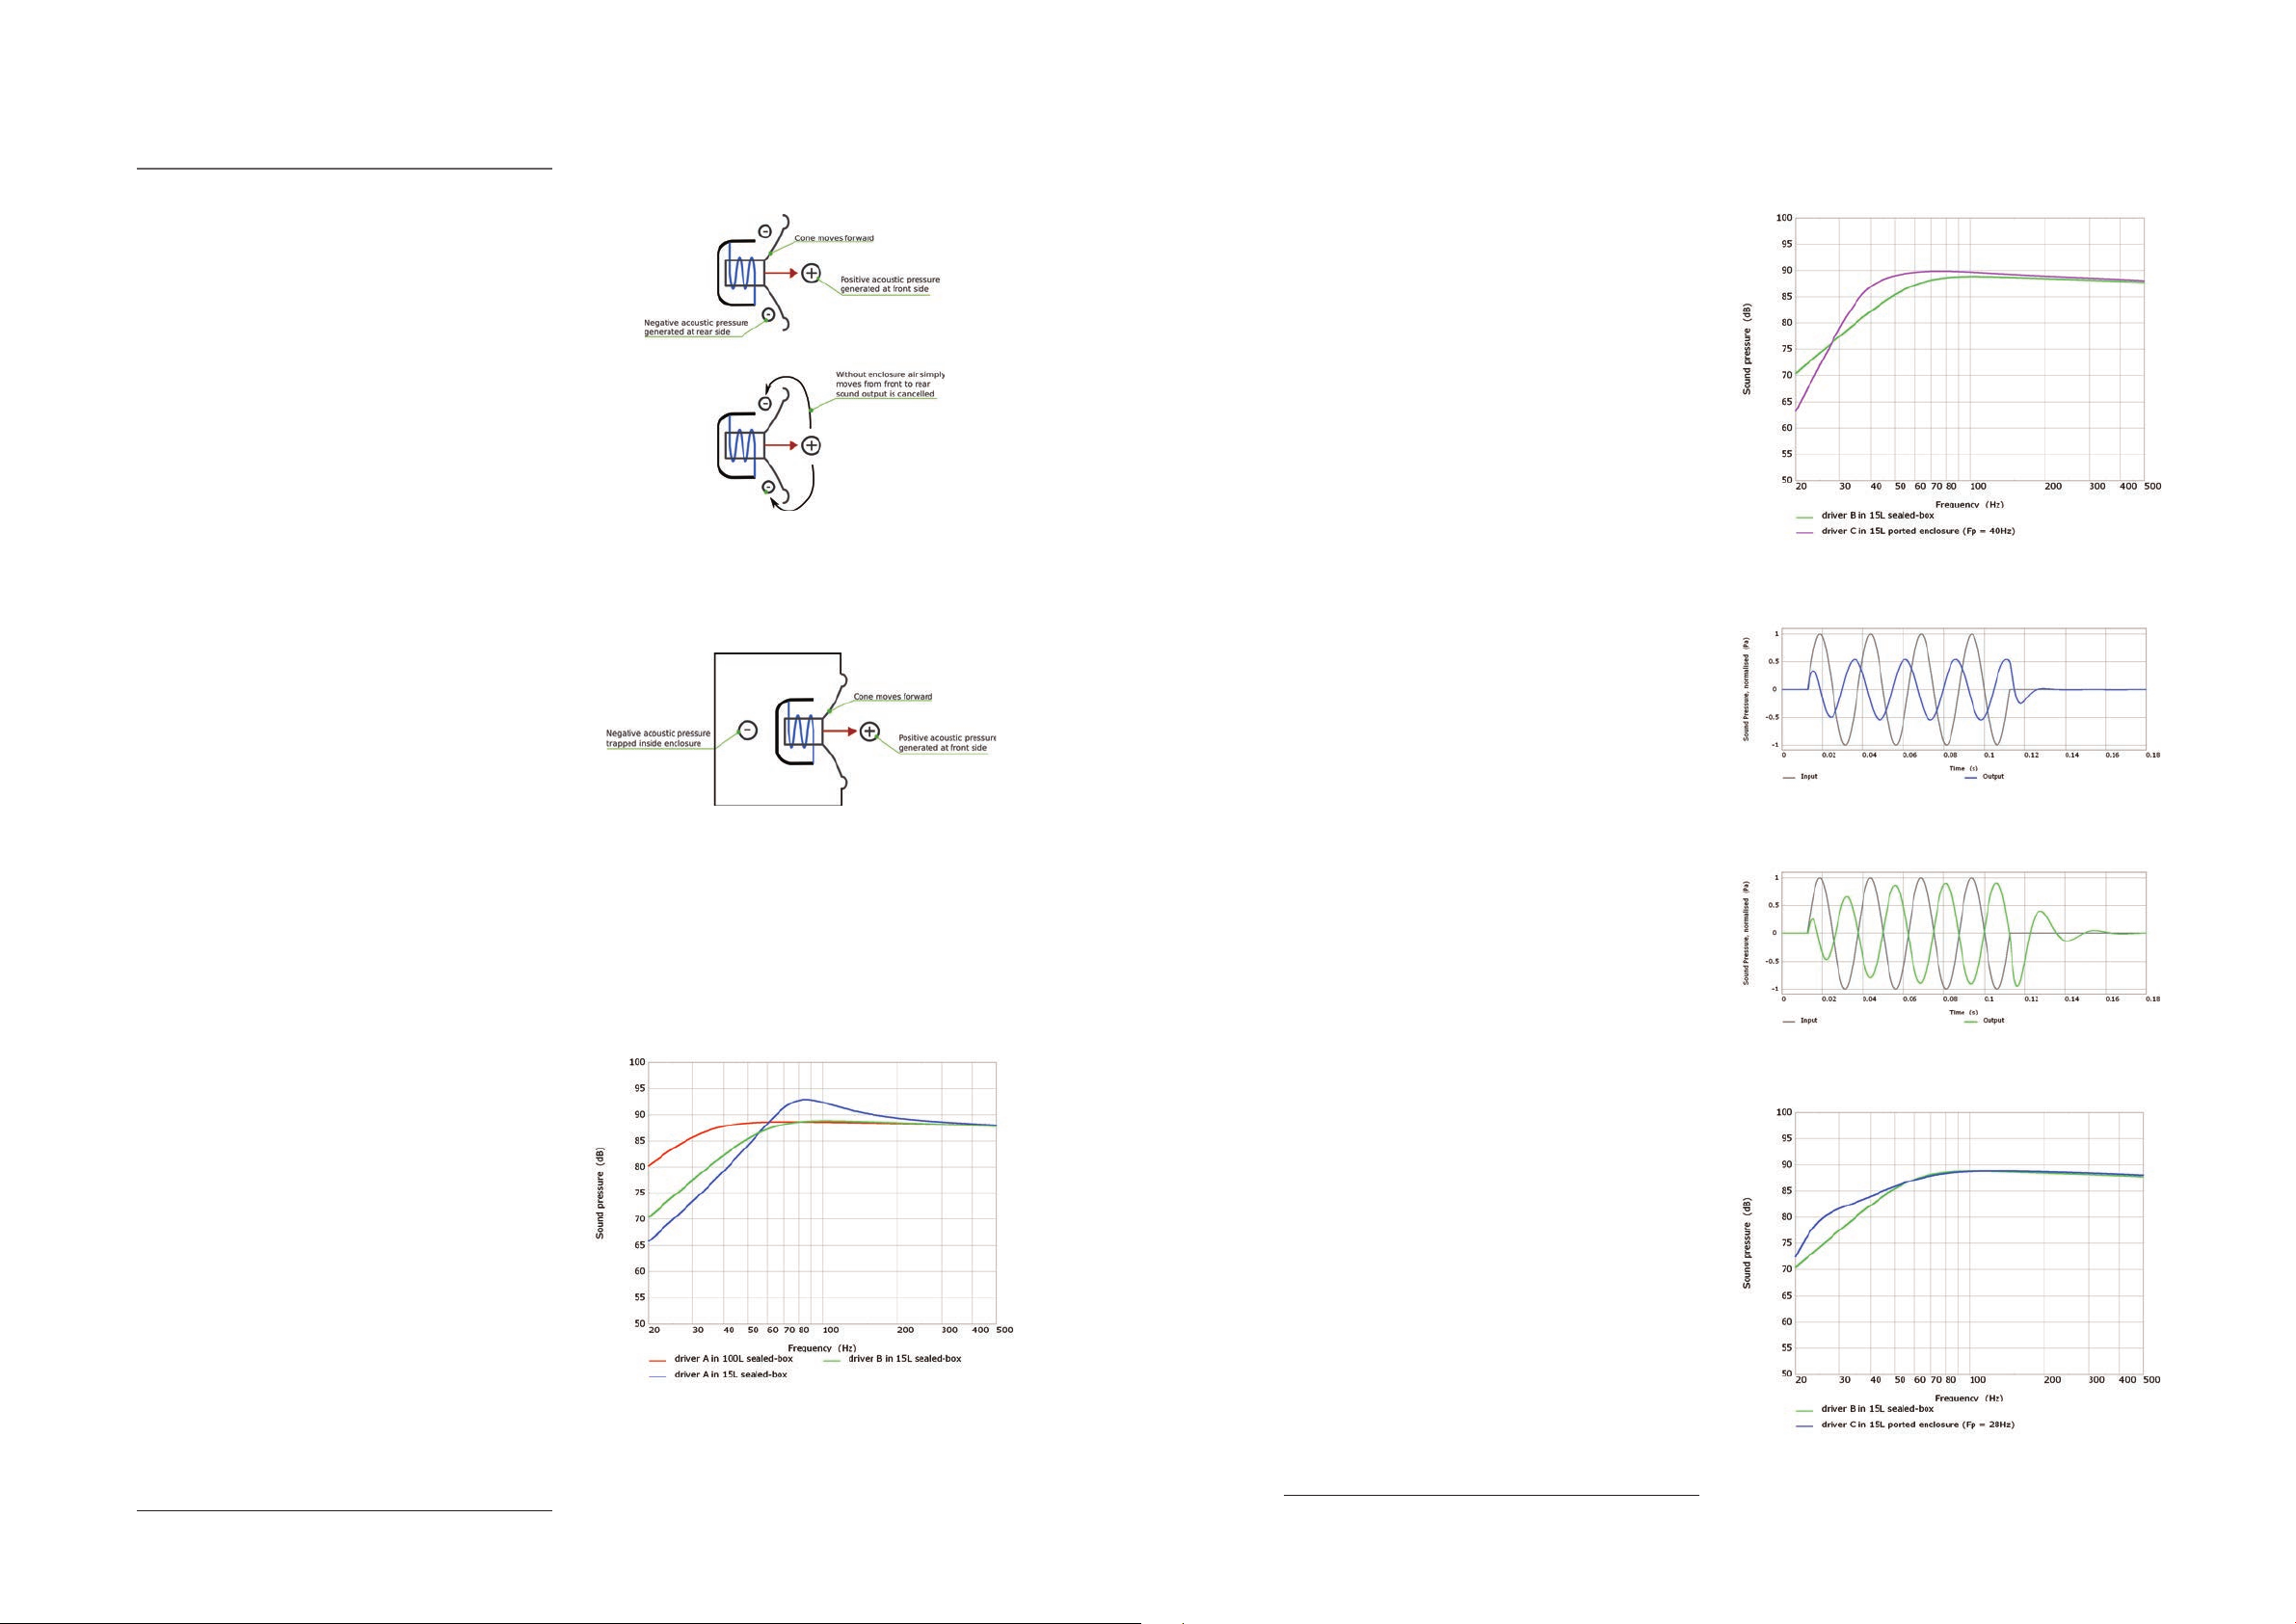
The effect is very dramatic, for example Figure 15
shows the modelled response of a single 160mm
bass driver which has been optimised to work well
without any cabinet loading, given the label driver A
4
In an extremely large 100L box this driver can give a
huge amount of bass efficiency (-3dB point at 28Hz)
however, once placed into a more reasonable cabinet
of 15L the response is very poor and all of the bass
extension is gone due to the additional stiffness of
the cabinet. Another response is shown, this time for
a driver optimised to work as well as possible in the
available 15L, labelled driver B. This achieves quite a
tidy frequency response and bass extension down to
approximately 50Hz (-3dB).
Figure 13. Family of directional response curves for early Reference 5
prototype.
Figure 14. Illustration of a closed box loudspeaker.
.
Figure 15. Variation in frequency response of a 160mm bass driver as the rear
enclosure volume is changed.
A ported enclosure includes a tuned port or vent
connecting the inside of the enclosure to the
listening environment. The port allows the bass to be
augmented around the region that the vent is tuned
and allows greater bass extension from a given size of
loudspeaker. Figure 16 shows the simulated response
of a 160mm driver placed in a 15L ported enclosure
compared to the previously shown optimal closed box
160mm driver. The -3dB point has been extended
from around 50Hz to approximately 38Hz. Perceptually
this is a very large change and the ported enclosure will
sound far more extended in the bass than the closed
box.
For many listeners the ported version will be much
more favourable than the closed due to the additional
bass extension, however, the additional bass extension
is not without compromise. With the addition of
the port to the low frequency system, the system
order has been increased and as a result the transient
response is worsened. For example Figures 17 and 18
show the response of the closed and ported systems
to a low frequency toneburst input, the difference
in the temporal response is quite clearly seen. This
creates something of a dilemma as, depending on their
personal preference and room characteristics and
loudspeaker position, some listeners will prefer the
ported response while others will prefer the closed
box response.
For The Reference, as a solution to this issue, the main
loudspeakers are supplied with two different length
port liners. The shorter of the two liners results in
a loudspeaker response similar to that shown in the
ported system above. Fitting the longer liner results
in a frequency response similar to that shown in
Figure 19, the same closed box response is shown for
easy comparison with Figure 16. This low frequency
alignment is speci cally designed to roll o very slowly
and gently in the upper bass octaves. In many listening
rooms this will compensate for the natural bass
5
augmentation due to the closest room boundaries
.
The toneburst response with the longer port liner is
shown in Figure 20. Comparison with Figures 17 and
18 show that the temporal response is now quite close
to the closed box system yet the bass e ciency around
30-40Hz is usefully augmented by the low port output.
An additional bene t of this approach, other than the
adjustability, is that the port helps to control the driver
excursion even in the lower tuning mode. Figure 21
Figure 16. Comparison of two 15L loudspeaker systems each with a single 160mm
LF driver and using a sealed and ported box design.
Figure 17. Response of closed box loudspeaker shown in Figure 16 to a 40Hz
toneburst.
Figure 18. Response of ported loudspeaker shown in Figure 16 to a 40Hz toneburst
Figure 19. Comparison of two 15L loudspeaker systems each with a single 160mm
LF driver and using a sealed and ported box design.
12
4 Note that driver A parameters are probably unachievable, for example the
total moving mass is only 6g and the resonance is around 5Hz.
5 Please see appendix VII on the acoustics of listening rooms for more details.
6 A standard four string bass tuning sets the open bottom string fundamental
to approximately 41Hz. The less common ve and six string tuning typically
use a tuning of around 30Hz. In most music the energy content below
13
Page 10
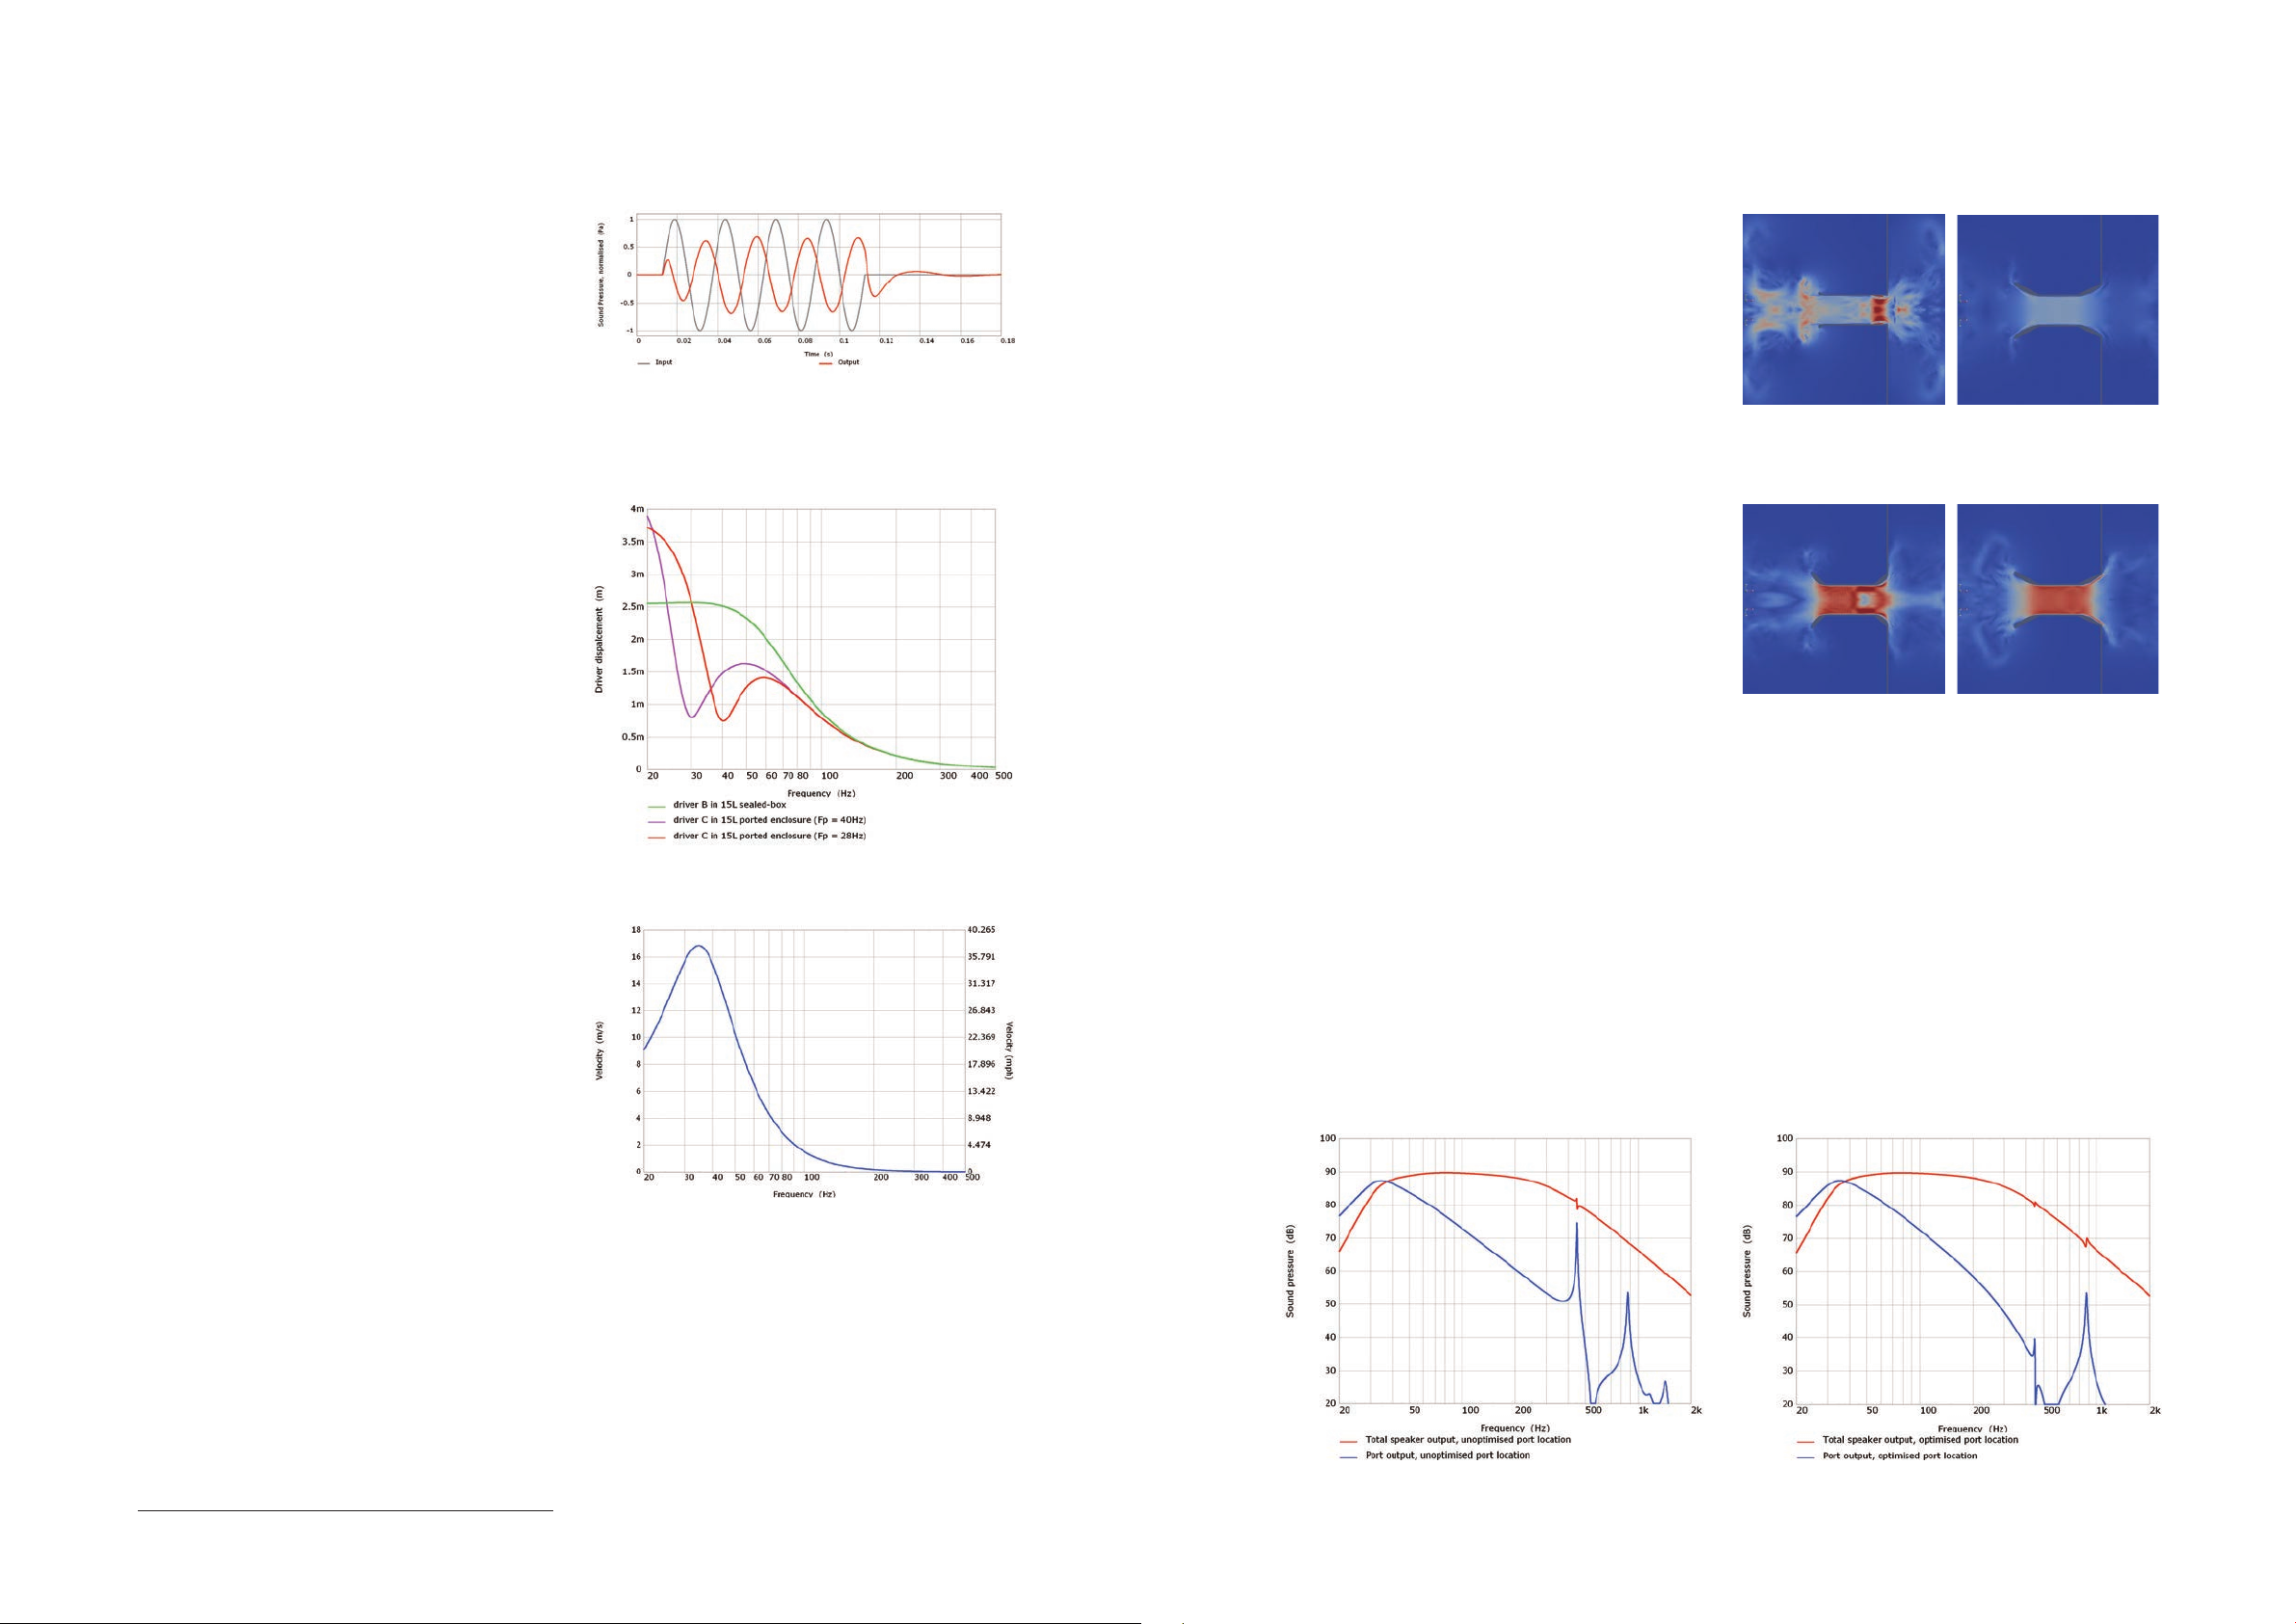
shows the driver excursion at an input voltage of 2.83V
for each of the three systems. Over much of the bass
region the ported systems require the driver to move
less, particularly in the region around 30-80Hz which
typically has the highest energy content in modern
6
music
The user is left to experiment to find the best
options according to their personal taste and listening
environment. With the floor standing models, which
have two ports, it is also possible to use intermediate
tunings by using one long and one short port. This
allows a ner degree of control over the bass response.
Figure 20. Response of ported loudspeaker shown in Figure 19 to a 40Hz toneburst.
At KEF the airflow in a loudspeaker port can be
computer modelled using Computational Fluid
Dynamics (CFD). Using this tool a flare profile has
been developed that is optimised to delay the onset
of turbulence to high output levels. This are pro le is
used on the ports of The Reference. Figures 23 and 24
show some of the ow results from the CFD analysis
for di erent types of port. The optimised port shape,
on the right in each case, shows a very even flow
pressure through the entire port tube. By comparison,
on the unoptimised ports you can clearly see turbulent
vortices inside the ports that will lead to power
compression and noise during use.
Figure 23. Instantaneous ow pressure contour of straight tube por t (left) compared
to optimised port (right) computed using CFD, note that both ports
are shown on the same colour scale and at the same instant. For this
analysis the peak velocity is 10ms.
4.2.1 Optimising the port behaviour
The models in the section above show the theoretical
response of various different types of low frequency
loudspeaker design. The behaviour of the cabinet and
port are simpli ed. This is very useful for gauging the
overall performance and optimising a particular design.
However, it is very important to account for the “higher
order” effects that occur in a real loudspeaker. The
port, in particular, presents a real engineering challenge
and The Reference incorporates several design
approaches and technologies to ensure that the real life
port behaviour is close to the theoretical ideal.
Port ow
Figure 22 shows the peak port velocity versus
frequency for the 40Hz tuned ported system that
was described above for an input level of 10V rms
(around 25 watts). The velocity close to the port tuning
frequency is surprisingly high - more than 15 metres
per second (approximately 33mph or 54kmph). At
these velocity magnitudes it is important to carefully
consider the port airflow in order to avoid port
turbulence. When turbulence occurs in the port the
efficiency drops dramatically and the bass output is
severely compressed. Additionally the turbulent flow
generates noise that the listener may hear.
There is a great deal of existing research into uid ow
in the field of vehicle aerodynamics. Unfortunately
these studies are often not very relevant to port
flow problems as turbulence is either inevitable in
such applications, or the priority is to maximise the
flow efficiency and whether the flow is laminar or
turbulent is of little consequence. Indeed some famous
and ingenious methods for reducing drag, such as the
texturing on a golf ball, function by inducing turbulent
flow. However, there are some excellent studies of
Figure 21. Lumped circuit representation of a generic electromagnetic loudspeaker.
Figure 22. Peak port air velocity for a theoretical 15L speaker at an input level of
10V rms (approx 25Watts).
port ow published by the AES, in particular Salvatti,
Devantier and Button published a very comprehensive
summary of experiments on ports of different types
[11]. They show quite clearly that a smooth walled
port results in less output compression and noise than
a textured port, and they also demonstrate that the
port performance can be greatly improved with careful
design of the pro le and ares.
Port locations
The theoretically ideal behaviour of the port is
dependent upon the air in the loudspeaker enclosure
acting like a perfect acoustic compliance, or spring,
and the port itself acting like a perfect acoustic mass,
or single united plug of air. The behaviour of a real
loudspeaker enclosure and port is somewhat more
complex. The result of this is that, in addition to the
Figure 24. Instantaneous ow pressure contour of unoptimised port (left) compared
to optimised port (right) computed using CFD, note that both ports
are shown on the same colour scale and at the same instant. For this
analysis the peak velocity is 15ms.
desired output at low frequencies, the port can also
output signi cant sound in the mid-band. In particular,
enclosure standing wave resonances can quite easily
leak out from the port if care is not taken with the
design of the enclosure and the placement of the port.
The left hand chart shows the port output with an
unoptimised location, the right with the port location
optimised. The reduction in the midrange leakage
through the port of the rst standing wave resonance,
For example, Figure 25 shows the modelled response
of the low frequency section in a ported loudspeaker
system that includes standing wave resonances in
the enclosure. In this model there is little acoustic
wadding in the enclosure to make it very easy to see
the resulting behaviour as the port location is changed.
Figure 25. Simulated comparison of the loudspeaker output and port output with unoptimised port location (left) and optimised port location (right).
at 450Hz, is dramatic. The output of the second is
relatively una ected in this case and the third resonance
is also reduced in level. Note that the location of the
port in this case has been specifically optimised to
control the leakage of the 450Hz resonance as this is
the most di cult to control by other means.
14
30Hz is signi cantly lower than rest of the bass region.
15
Page 11
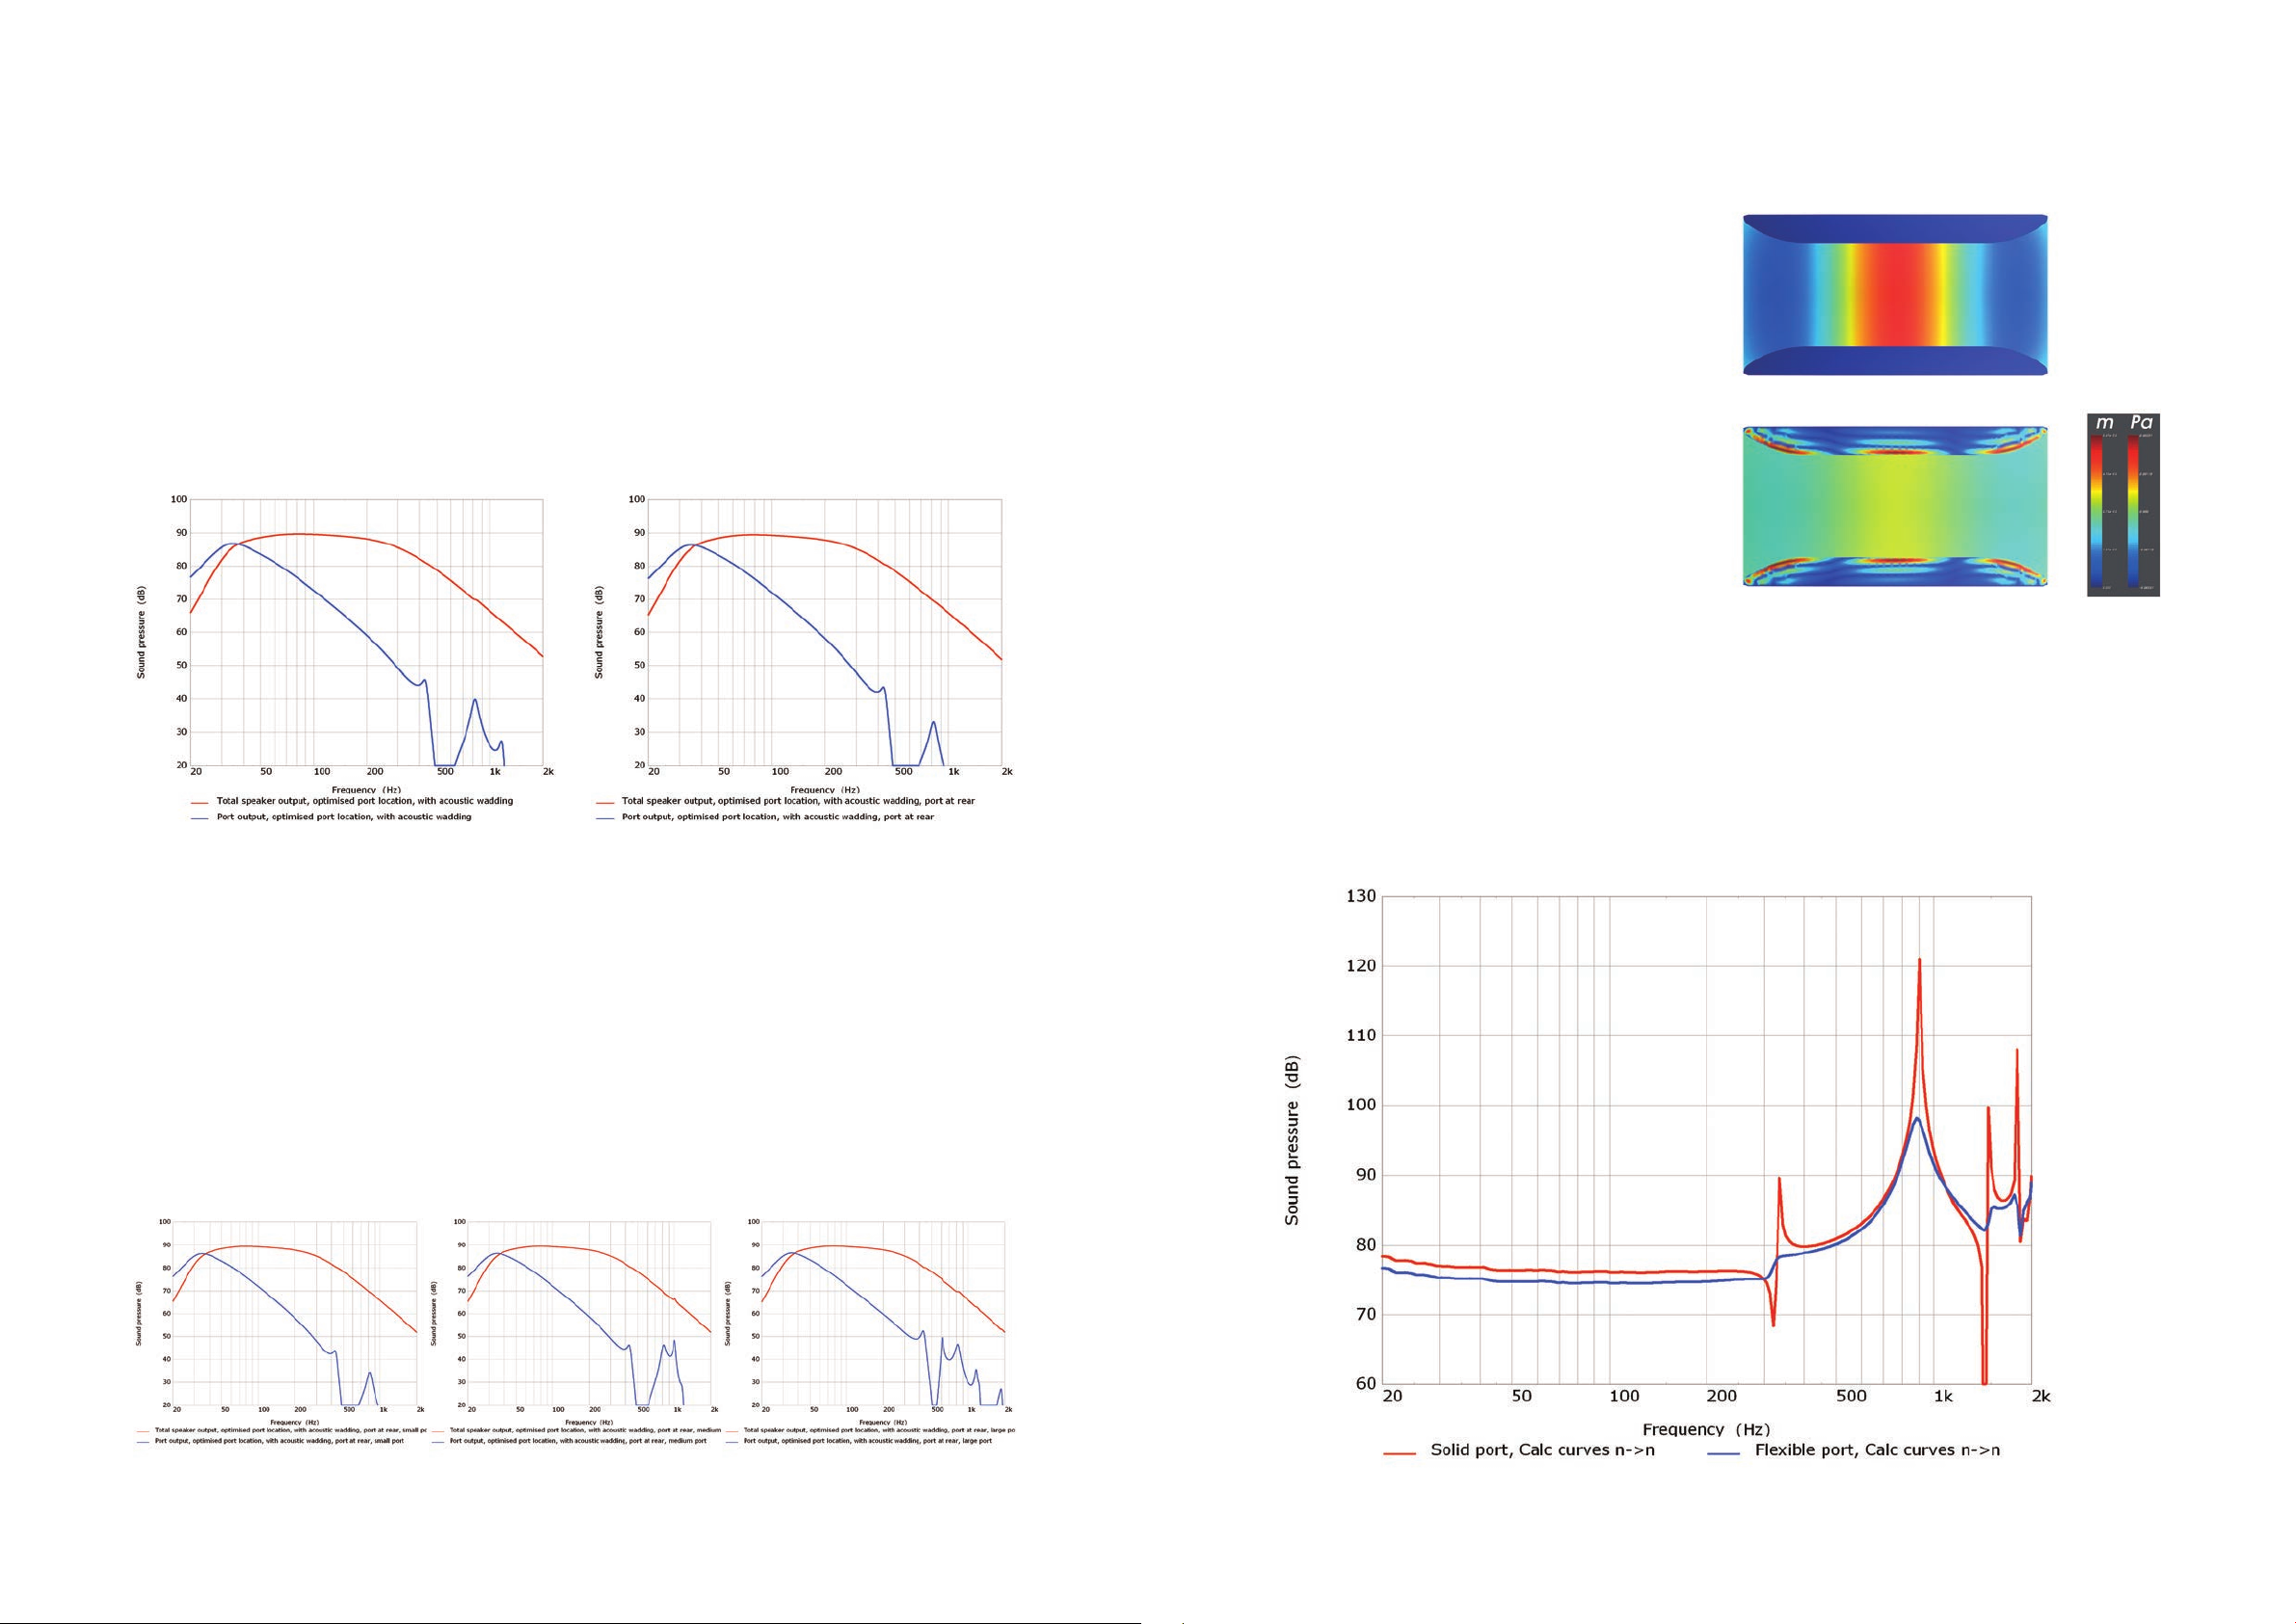
Adding wadding to the optimised port version further
reduces the midrange leakage as shown in Figure 26.
Eagle eyed readers will also note that as wadding is
added the small “glitches” on the system response, due
to coupling between the driver and the standing wave
resonances, also disappear. Another design feature of
The Reference is that the ports are located on the
back of the loudspeakers. This is intentionally done
midrange leakage through the port even more di cult
to hear from the listening position as the majority
of the midrange port output is directed away from
the listener. The rear placement effect is also shown
in Figure 26. Note that on this figure the midrange
leakage from the port is now at an extremely low level
compared to the loudspeaker’s main output, which is
approximately 90dB.
for a few reasons. One of these is that it makes any
Figure 26. Simulated comparison of the loudspeaker output and port output with optimised port location and enclosure acoustic wadding, port at front (left) and port at rear (right).
Reducing the magnitude of the longitudinal resonances
cannot simply be achieved by filling the port with
acoustic foam since this would reduce output in
the bass region and prevent an efficient alignment.
An alternative method to control the longitudinal
resonance was devised for the LS50, by creating a port
with exible walls. For The Reference this is achieved
by using a soft foam insert to form the port walls. At
midrange frequencies the soft walls of the port flex
and dissipate energy from the resonances. This can be
clearly seen in Figure 28, which shows the modelled
acoustic pressure and port wall displacement at the
first standing wave frequency of the port. The right
hand result, with the flexible walls has significantly
lower pressure at the centre of the port. The
acoustic pressure at the surface of the port causes a
compressional wave to form in the soft wall material,
the energy is gently absorbed as the compressional
wave travels into the port wall.
Figure 29 shows a comparison of the acoustic pressure
in the centre of the two modelled ports. The peak
pressure at the 900Hz rst standing-wave resonance is
reduced by approximately 20dB compared to the solid
port.
Figure 28. Comparison of the FEA modelled pressure magnitude in the loudspeaker
port at the rst standing wave with rigid walls (above) and exible walls
(below).
Port standing waves
In order to minimise turbulence and bass output at
high levels it is necessary to use a large and long port.
However, the port itself has standing waves due to the
sudden change in the acoustic environment at the inner
and outer ends. This is the same type of longitudinal
resonance that is seen in a pipe organ. Just like a pipe
organ, a longer port/pipe has a lower fundamental
response of the modelled system discussed above with
a small, medium and large port. The small port behaves
exactly the same as the models shown above, whereas
with the medium and large ports additional resonances
have appeared in the port output. These resonances
correspond to the fundamental and harmonics of the
port standing waves.
standing wave resonance. Figure 27 shows the
Figure 27. Simulated comparison of the loudspeaker output and port output with optimised port location and enclosure acoustic wadding, port at rear and small (left) medium
(middle) and large (right) port.
Figure 29. Comparison of the FEA modelled internal acoustic pressure in a solid and exible port
16
17
Page 12
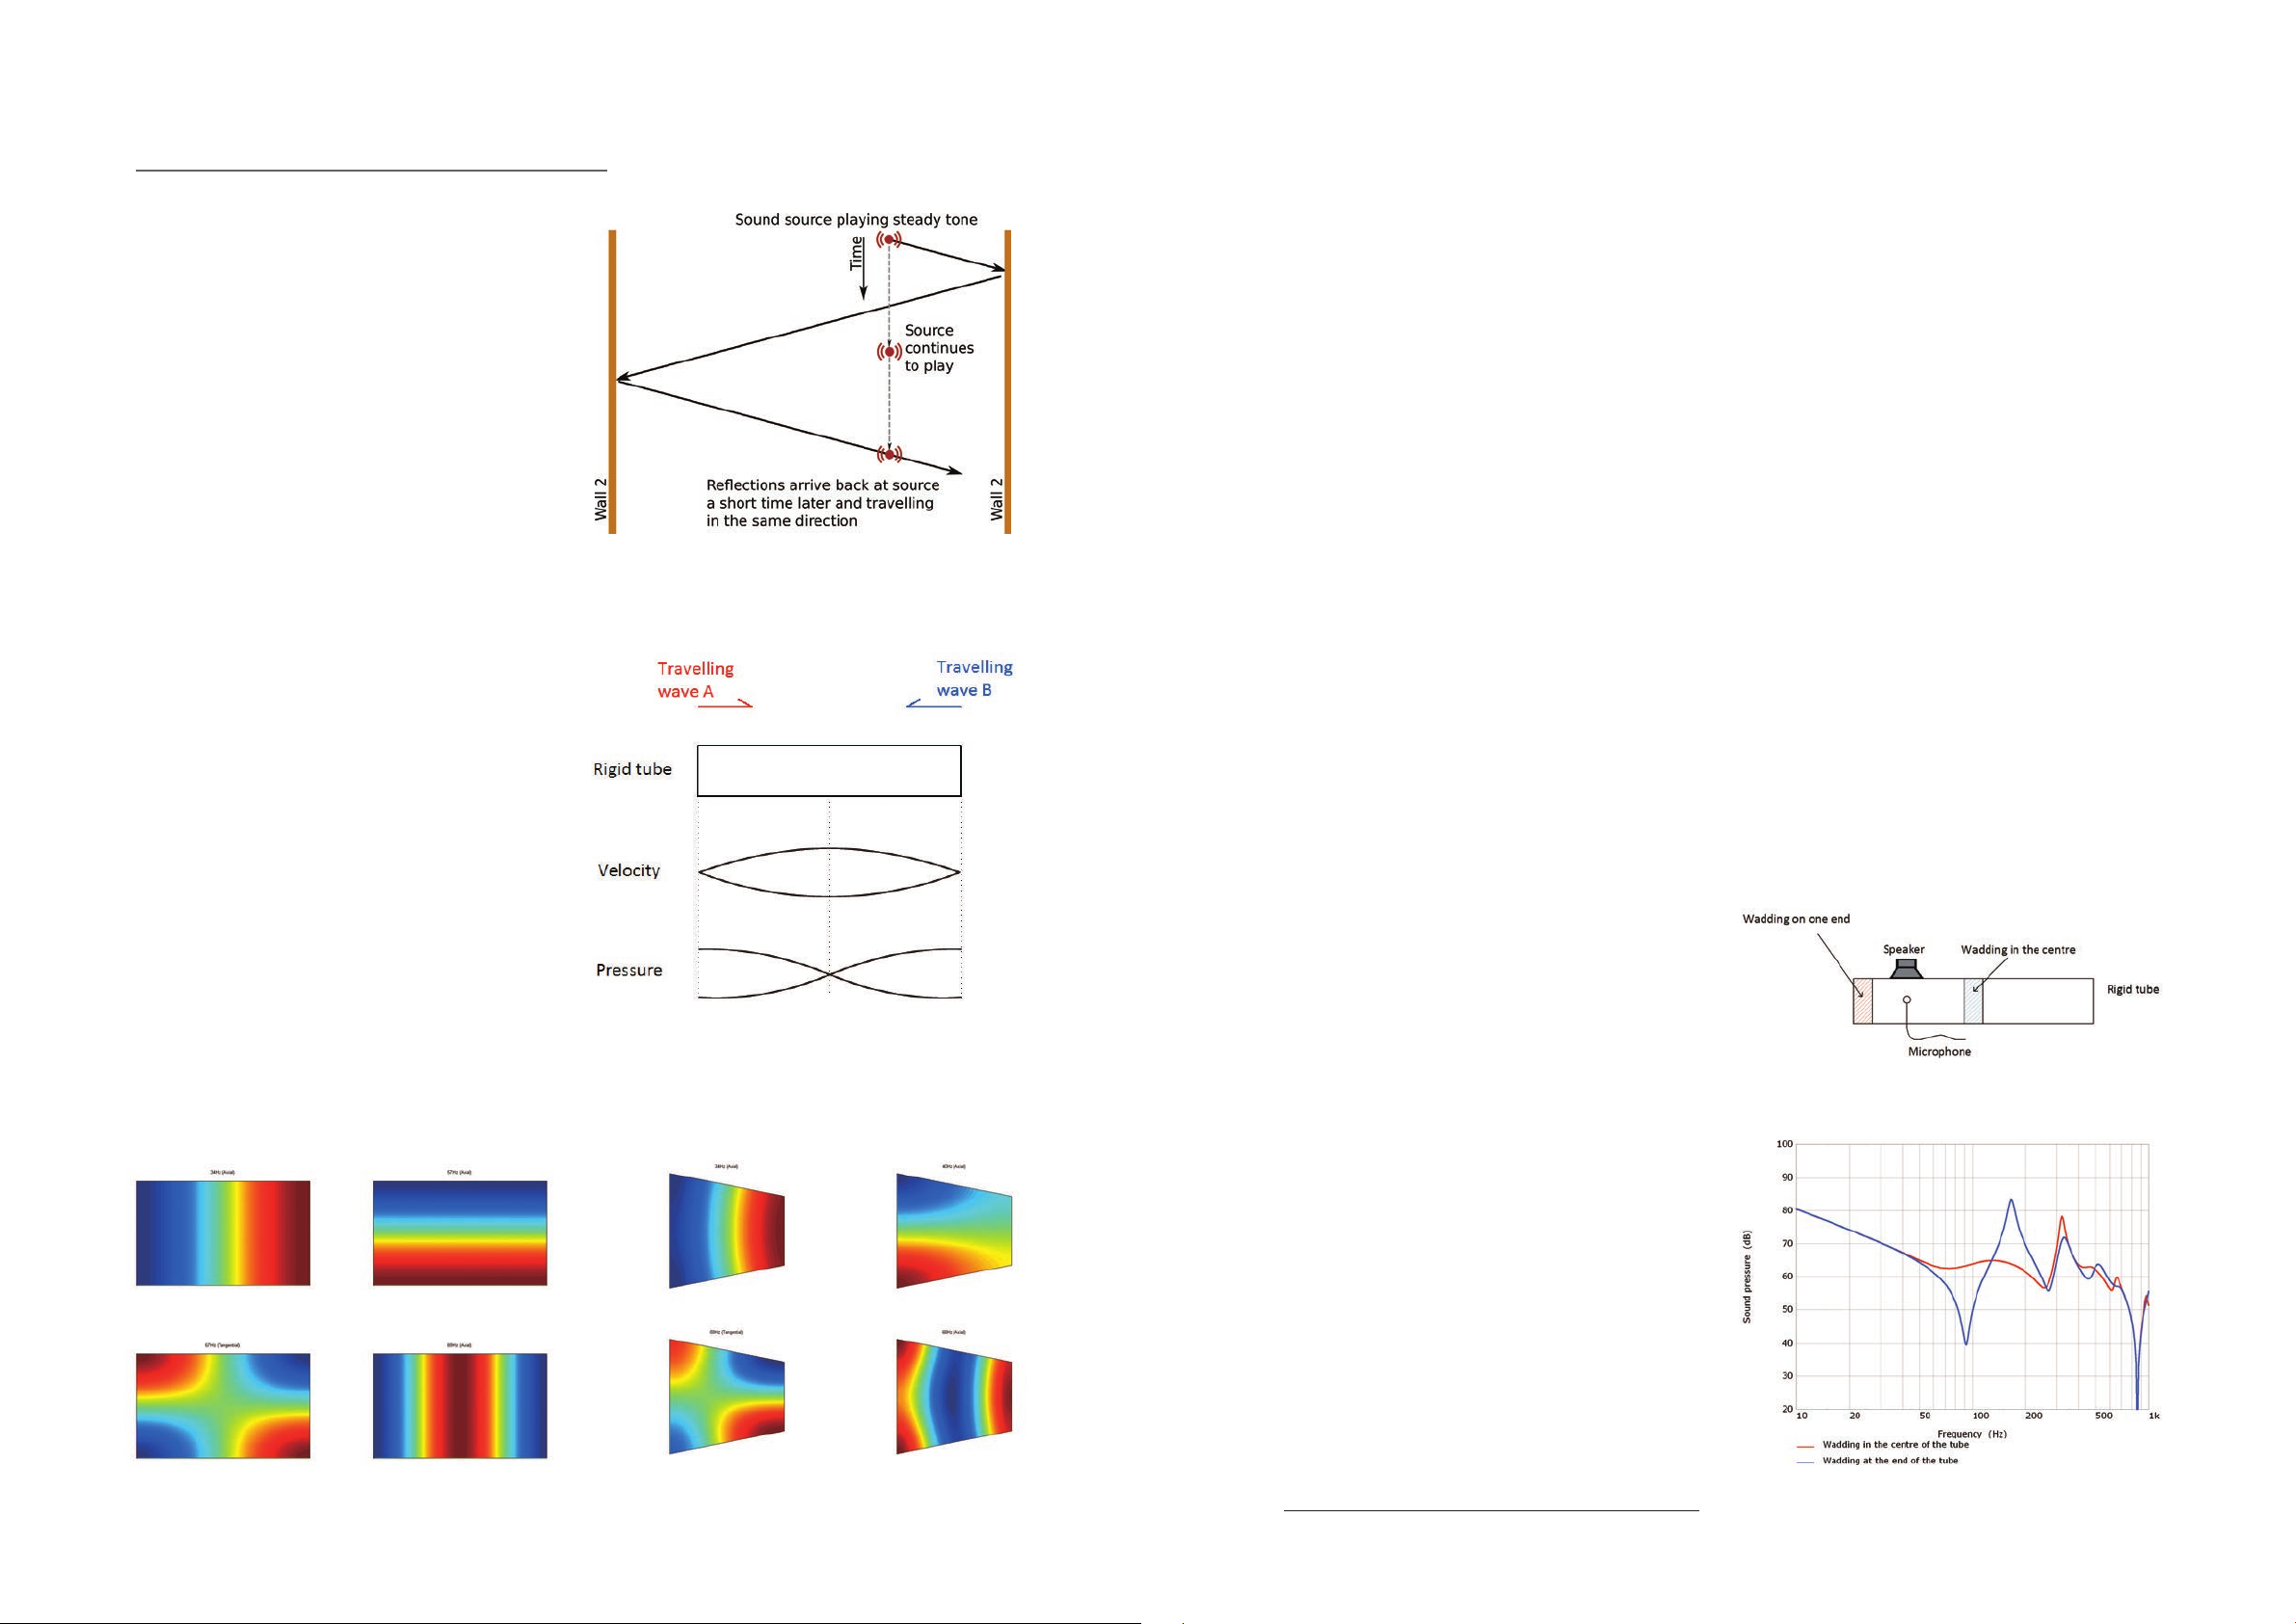
4.3 Internal acoustics and vibration control
4.3.1 Controlling enclosure standing
wave resonances
The sound inside a rigid enclosure reflects from the
enclosure surfaces with very little attenuation. This
situation leads to standing wave resonances. The
simplest explanation of a standing wave resonance is
to consider the sound between two parallel walls as
illustrated in Figure 30. In this example the source plays
a steady tone and radiated sound travels towards the
first wall, reflects towards the second wall and then
reflects again arriving back at the source. The sound
travelling on the re ected path arrives back at the origin
a short time later. If this time difference corresponds
to a multiple of a period of the radiated tone, then the
radiated sound is re-enforced by the re ection. Every
cycle adds more energy into the system and the sound
pressure gets higher and higher.
The reason that this phenomenon is called a standing
wave is that eventually the sound pressure between
the two boundaries falls into a steady oscillating pattern
and no travelling wave behaviour is visible. Figure 31
shows the standing wave pattern that occurs when the
time delay is one wave period and the corresponding
air particle velocity.
A common misconception is that if the walls of an
enclosure are not parallel the standing waves will not
occur. This is not correct, for example, gure 32 shows
the FEA computed first standing wave pattern in an
enclosure with parallel and non parallel walls. Even
though the walls are not parallel there is still an acoustic
path that sets up a standing wave situation. With
parallel walls, the path is the same for all frequencies,
which means that all the standing wave resonances
occur at frequency multiples. When the walls are not
parallel this will not be the case but there are still just
Figure 32. First four standing waves of a rectangular enclosure (left) compared to a trapezoidal enclosure (right)
Figure 30. Illustration of standing wave resonance mechanism.
Figure 31. First standing wave pattern (or mode shape) between two parallel rigid
walls.
as many standing waves in the undamped enclosure.
It is inevitable that standing waves will occur in the LF
enclosures within the bandwidth of the driver’s output
as the enclosure is large compared to a wavelength
at the upper end of the low frequency bandwidth.
When an enclosure standing wave is excited, very high
acoustic pressures are generated in the enclosure. The
effect on the sound output is predominantly due to
two effects. Firstly, the enclosure acoustic loading on
the LF driver is changed due to this high pressure acting
on the back of the driver cone, this typically causes a
glitch or dip in the driver output. Secondly, the high
7
acoustic pressure can be radiated through the ports
.
As with the ports, a great deal can be achieved by
carefully optimising the shape of the enclosure and
the location of the drivers. The driver location is
particularly important as it is the driver that is the
sound source that causes the standing wave to form. In
addition, acoustical damping material can be added to
the enclosure.
The size of the enclosure is of particular importance.
The largest dimension of the enclosure determines the
frequency of the rst standing wave resonance. If the
enclosure is large then the rst standing wave will be
relatively lower in frequency. This is not desirable as
it is much more difficult to dampen a low frequency
standing wave with acoustic wadding. In addition, the
effect of an enclosure standing wave on the driver
cone motion is greater if the standing wave frequency
is closer to the port and driver fundamental resonance.
Because of this, The Reference LF enclosures are
partitioned into smaller enclosures to push the standing
wave frequencies higher.
The quantity and position of the acoustic wadding is
critical for optimal performance. If too little wadding is
added to the loudspeaker the standing wave resonances
will not be suppressed. If too much wadding is added
the acoustic output from the port will be restricted and
the driver motion dampened. For the most efficient
damping, the wadding needs to be positioned where
the air velocity is highest. Referring to Figure 31, at the
enclosure walls the air velocity is zero, it is much more
e ective to locate the wadding towards the centre of
the enclosure. For example Figure 33 shows the e ect
of two different wadding placements upon the first
standing wave resonance of a tube shaped enclosure.
In both instances the same quantity of wadding is used,
however the placement at the centre of the tube is
Figure 33. The e ect of wadding placement on the attenuation of standing waves.
18
7 The transmission of these high pressures through the cabinet walls is
relatively minimal [12].
19
Page 13
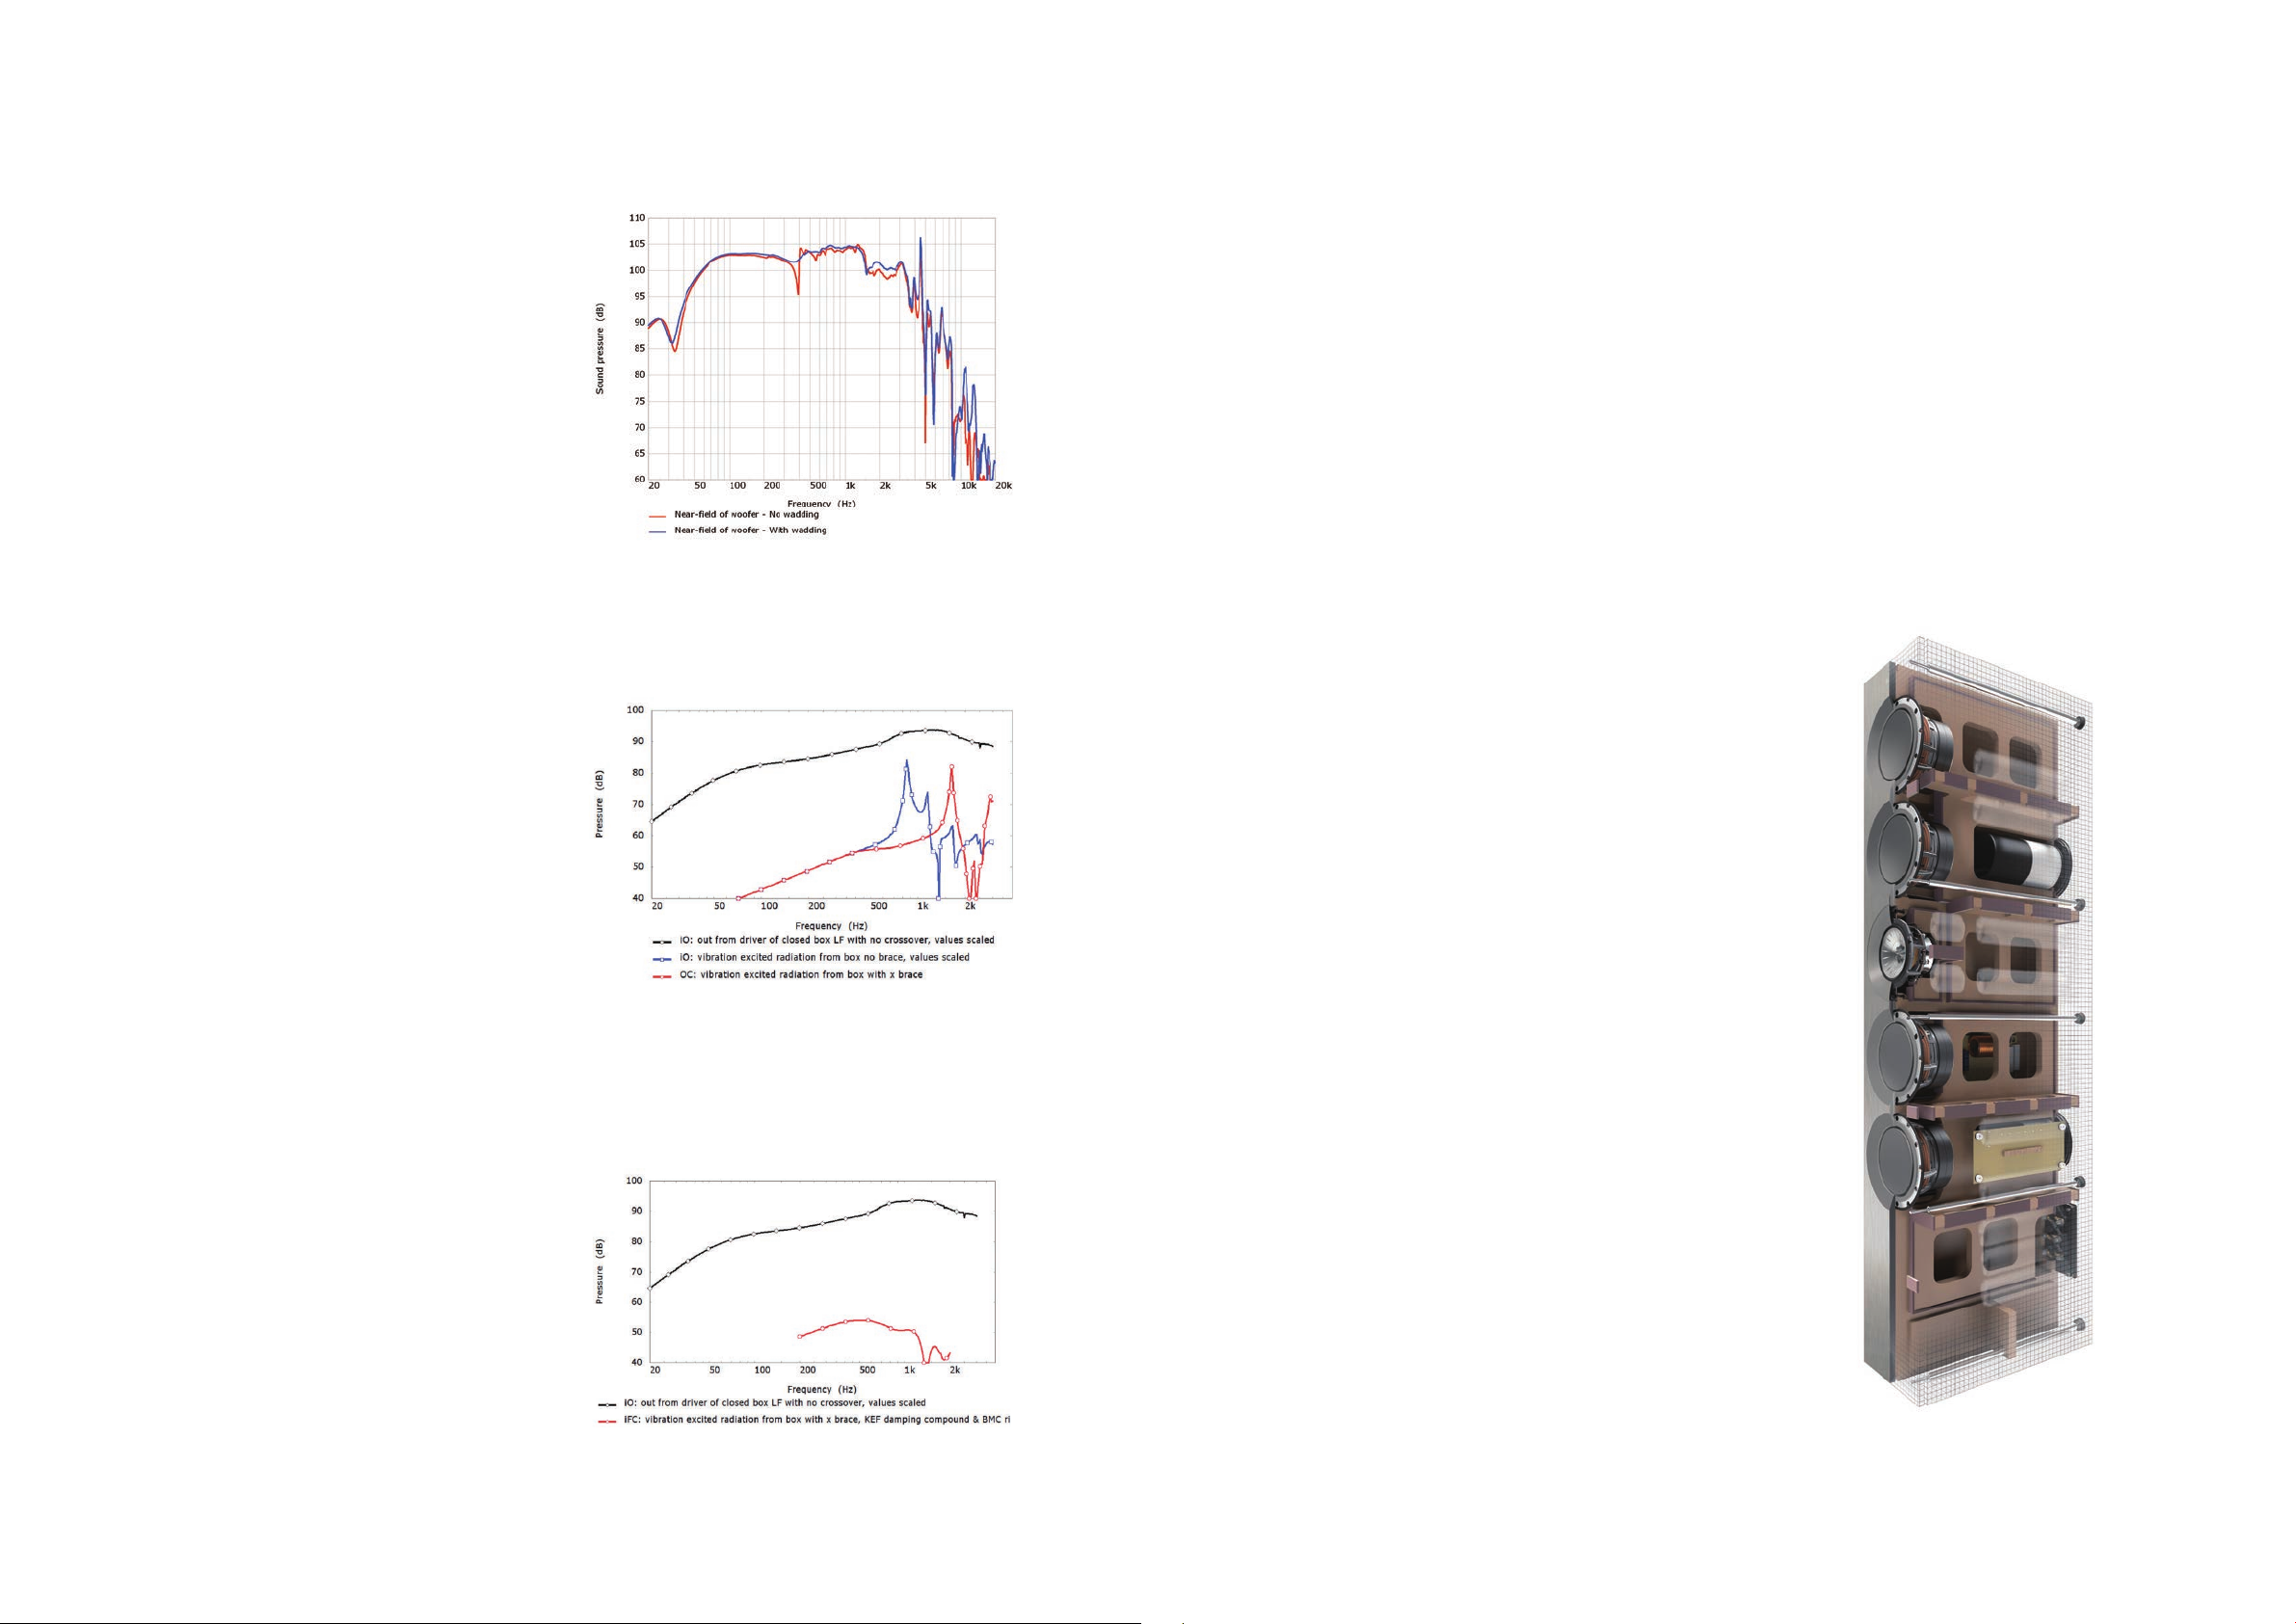
much more e ective, particularly at the lowest standing
wave.
Figure 34 shows some real measurements from
a prototype of Reference 5 with no wadding and
with optimised wadding in the enclosure. These
measurements are taken with the microphone very
close to one of the low frequency drivers to clearly
show the standing wave effects, the dip at 35Hz is
due to the port. Note that even before the wadding
is added to the enclosure the behaviour is very good,
this is due to the carefully designed enclosure and
driver locations. Once the wadding has been added
the overall response is smoother, the dip at 400Hz
(corresponding to the rst standing wave) is suppressed
and there is little change to the low frequency response
save for a slight shift in the port tuning frequency.
4.3.2 Cabinet vibration control
To reproduce the most realistic listening experience,
the sound needs to come purely from the drivers
and not from the cabinet. Any resonant vibration
from the cabinet panels will add unwanted distortion
to the music. This means that the cabinet walls of
a loudspeaker ought to be as inert as possible. The
construction of The Reference cabinets has always
been a strength of the range. The new models maintain
this tradition and are constructed in thick high density
wood the extensive internal bracing. Conventional
internal bracing aims precisely to stiffen and support
the inside structure as well as each panel. Figure 35
illustrates the e ect of adding a pair of braces, crossing
behind the driver, compared to a box without any
bracing. The braced box has raised the resonance from
600Hz to 1.6kHz but the amplitude of the peak still
remains the same. Adding sti ness to the cabinet will
always have this effect, to reduce the severity of the
resonance it is necessary to add damping.
Figure 37 shows a cross section of Reference 5, the
cabinet walls are supported by extensive internal
bracing. These braces are connected to the cabinet
walls using a layer of damping material. The drivers are
also braced by the internal structure and connected
using a layer of damping material to further control
the cabinet vibration. The front baffle of the cabinet
is constructed in an exceptionally strong laminated
aluminium and resin composite, this adds a great
deal of strength and mass to the cabinets. The ba e
also forms part of the damping arrangement and is
connected resiliently to the rest of the cabinet using
high loss pads.
Figure 34. Near eld measurements of an LF driver from a prototype of Reference 5
showing the response with and without wadding added to the enclosure.
Figure 35. Closed box FEA predicted output from diaphragm and walls with and
without x-brace.
20
During the development of the KEF LS50, it was
found that by adding material with high mechanical
resistance and low stiffness between the walls, baffle,
driver and brace a dramatic amount of damping could
be added to the cabinet. Figure 36 shows the same
loudspeaker previously shown in Figure 35 using this
damped bracing configuration. The peak at 1.6kHz is
dramatically reduced in amplitude by about 30dB. The
Reference uses this technology throughout the range in
order to minimise the cabinet vibration.
Figure 36. Closed box FEA predicted output from diaphragm and walls with
constrained layer of damping material between brace and walls.
Figure 37. CAD section of Reference 5 showing extensive internal damped bracing.
21
Page 14
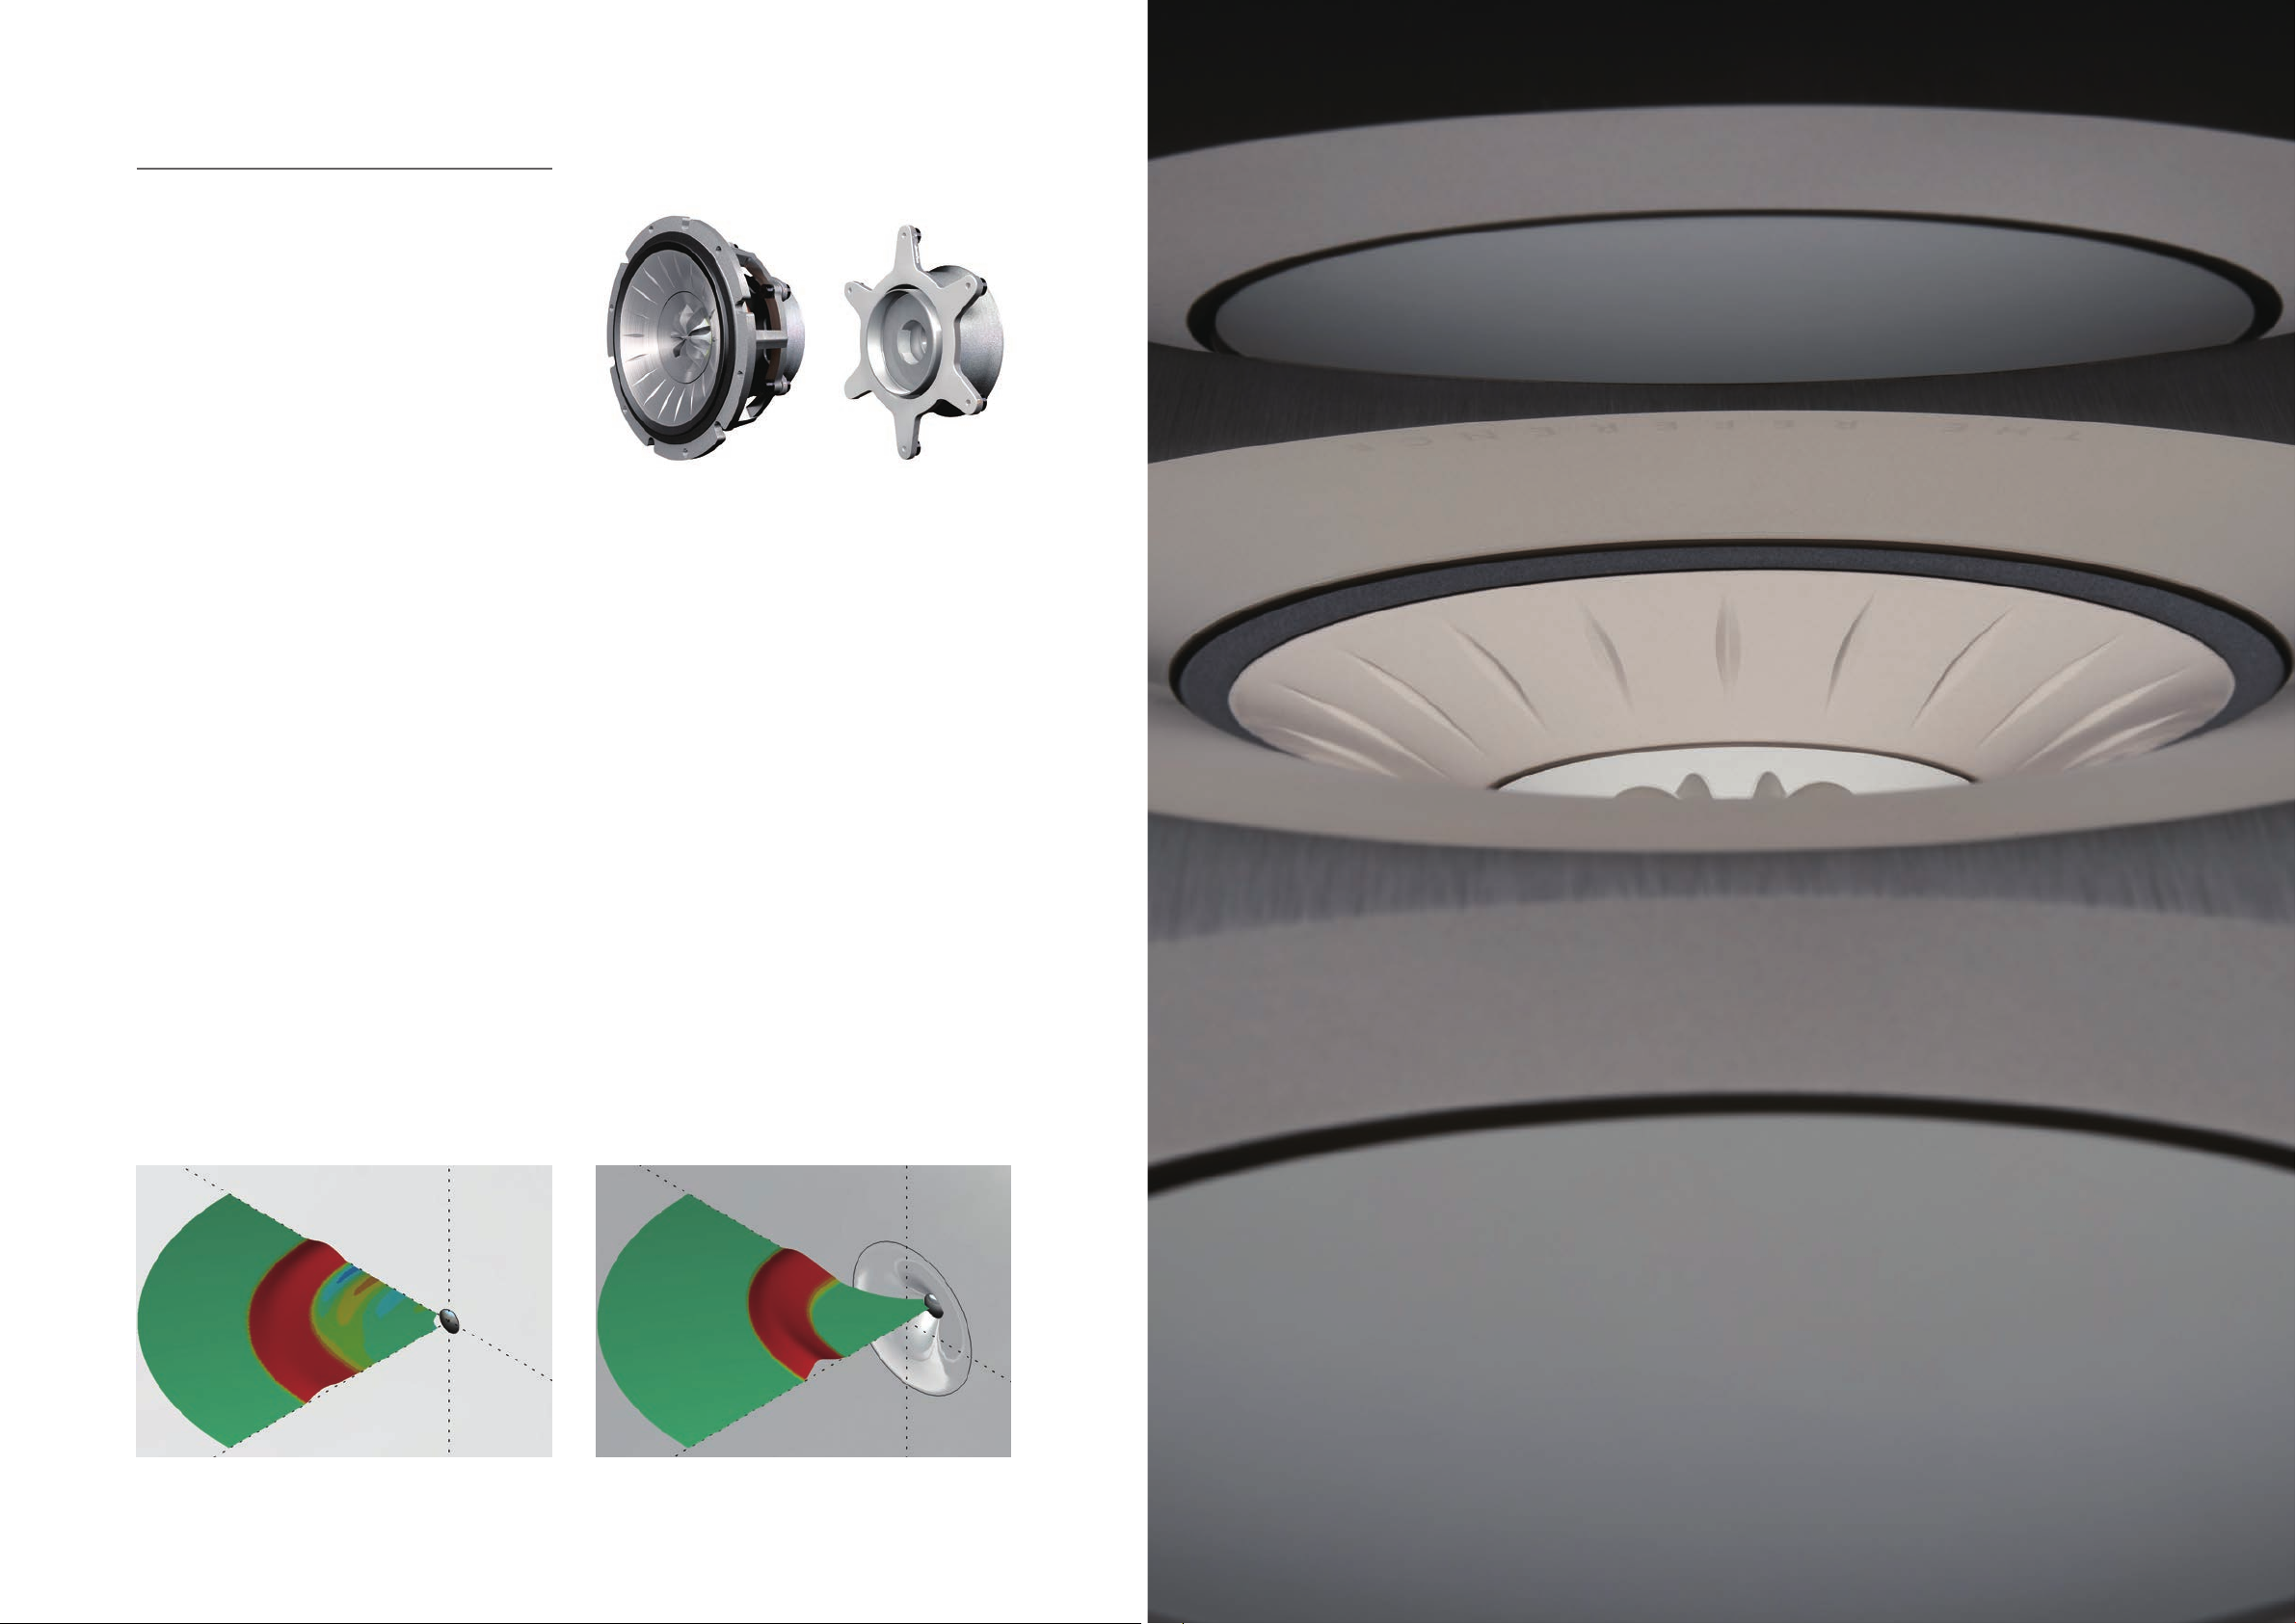
4.4 Driver details
4.4.1 Uni-Q Driver
The Reference uses a specially developed 11th
generation Uni-Q driver array. This particular Uni-Q
is only used in The Reference and incorporates
many features found in that of the agship KEF Blade
loudspeaker. Figure 38 shows a CAD rendering of
the new driver, with the midrange motor shown in
isolation on the right. In particular, note how open the
rear of the driver is, this is done intentionally in order
to maximise the rear venting of the midrange. On the
right hand image the large aluminium ring on the top
of the motor system is visible, another identical ring
is buried in the magnet system to help to control the
midrange distortion. The design of this driver is outlined
in more detail in the next few paragraphs.
The Tweeter
The tweeter in the new Uni-Q is closely based on
that of the KEF Blade. It uses a powerful neodymium
motor system with a ring magnet and a copper cap
to reduce distortion. The rear acoustic design of the
tweeter is critical for low distortion performance. The
new Reference tweeter uses a large central vent which
carries the rear acoustic radiation gently away from the
back of the dome. More information can be found in
Appendix V.
The dome itself is constructed from aluminium and
uses KEF’s patented stiffened dome design. This is a
unique technology which enables the 25mm dome to
extend into the ultrasonic bandwidth, more information
can be found in Appendix IV.
The acoustic design around the tweeter dome is
absolutely critical to the performance of the 11
generation Uni-Q design. It has taken most of KEF’s 20
th
Figure 38. CAD rendering of The Reference Uni-Q, right hand image shows
midrange motor in isolation.
plus years of experience in designing the Uni-Q to fully
understand and fully optimise this area.
The first stage in getting the optimal performance
from the tweeter is to match the shape of the tweeter
dome to the surrounding waveguide. If these two parts
are not matched then large response irregularities can
appear in the tweeter output. More information is
given in Appendix III. Once the waveguide and dome
geometries are matched, then the waveguide can be
fully utilised to control the tweeter dispersion and to
match this to the midrange driver. When combined
with the optimal dome shape technology, the overall
tweeter response is - unlike a conventional bafflemounted tweeter - completely free from o -axis nulls.
This difference can be clearly seen in Figure 39. This
optimal geometry is patented, and hence only found in
KEF Uni-Q loudspeakers.
22
Figure 39. Comparison of a HF transient radiated by a conventional 25mm dome on ba e (left) and a optimally shaped 25mm dome in a waveguide (right).
Page 15
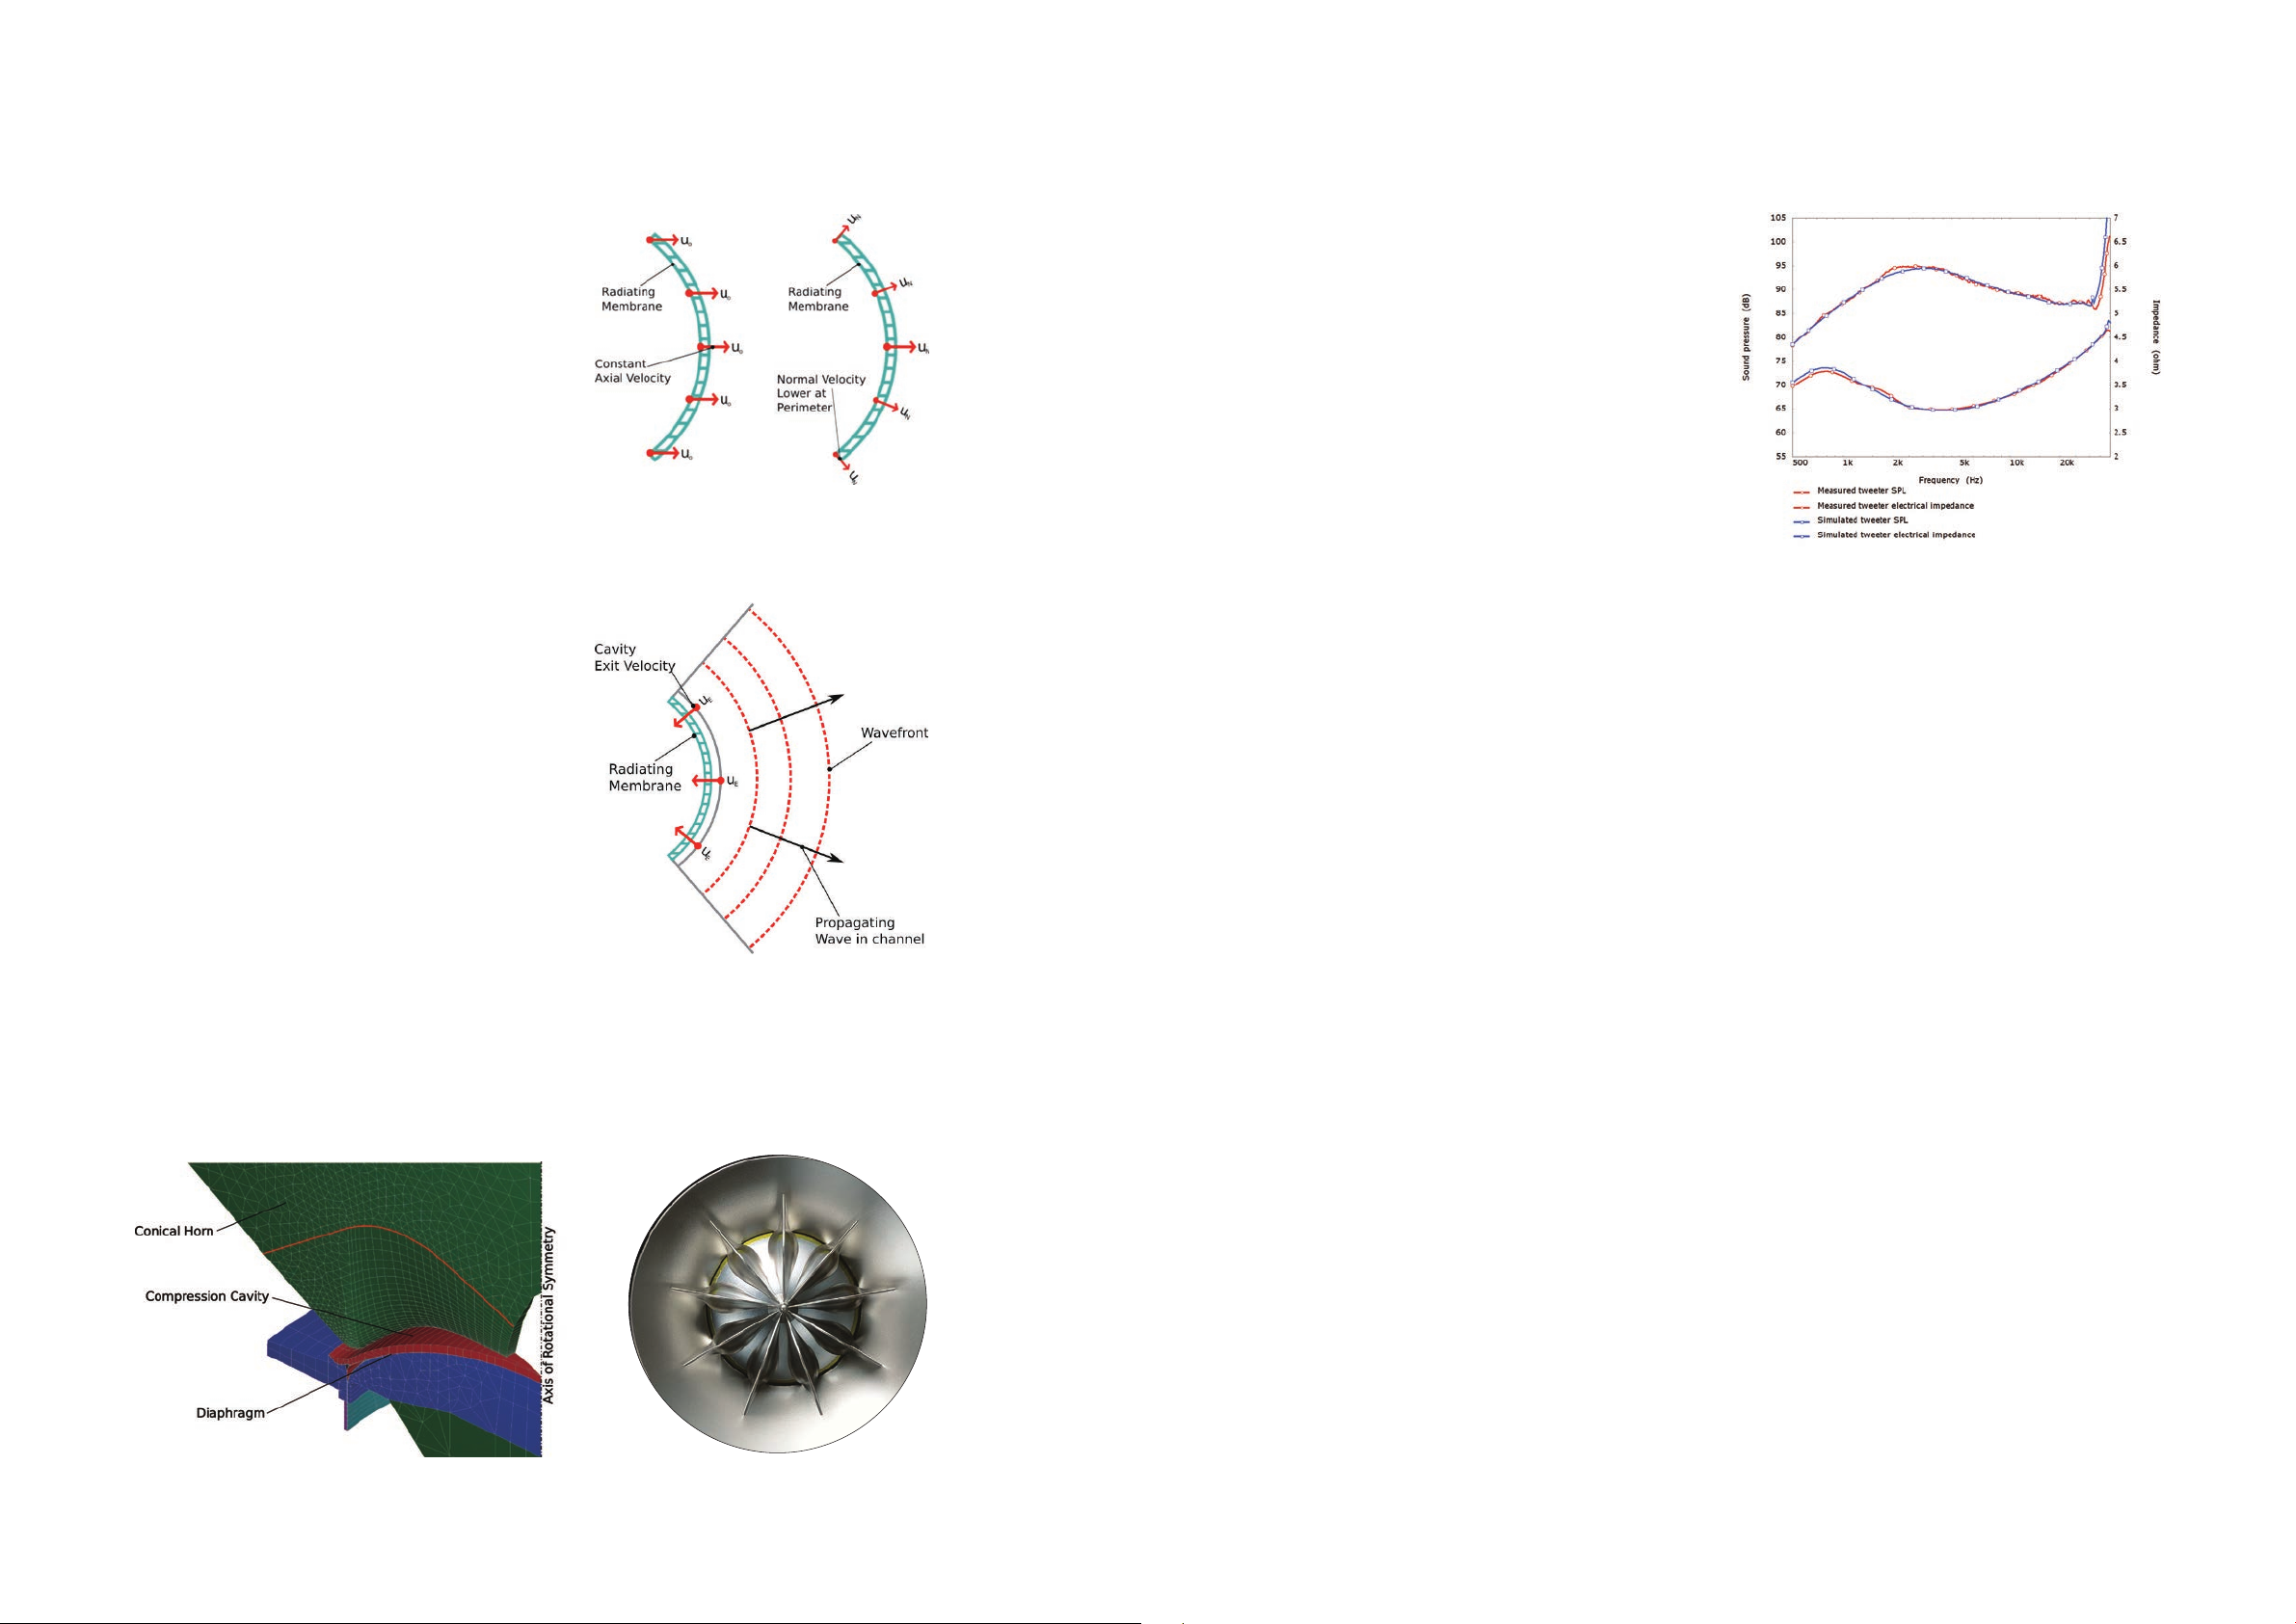
The tangerine waveguide is another key piece of
technology that is used by KEF to optimise the high
frequency performance of the Uni-Q driver. A dome is
close to the ideal shape for a loudspeaker diaphragm,
particularly when placed in an optimal dome and
waveguide configuration. However, a dome tweeter
does not quite have the correct surface velocity to be
the perfect radiator – when a signal is played through
the tweeter the dome moves in one axis. Because the
angle of the dome surface relative to this motion is
greater towards the edge of the dome, this means that
the surface-normal velocity is lower towards the dome
perimeter. Ideally the surface-normal velocity would be
constant over the entire dome surface. This di erence
is illustrated in gure 40.
The purpose of the tangerine waveguide is to correct
for this difference between the real normal velocity
and ideal normal velocity by directing the output from
the dome into a small chamber under the tangerine
waveguide and then to control the expansion of the
sound into the waveguide through specially shaped
channels. The design of the channels is a very complex
process and required extensive use of FEA computer
models in addition to involved mathematical analysis.
A still from one of the computer models is shown in
Figure 42 along with the nal production part.
Figure 40. Comparison of tweeter dome axial and surface normal velocity.
Figure 41. Illustration of the target behaviour of the tangerine waveguide.
Figure 43 shows the frequency response of a
prototype of The Reference tweeter measured in a
test waveguide. Also shown in this gure is a computer
model of the same device. Note that the two
responses are in very good agreement. The tweeter
response is exceptionally smooth without any trace
of resonance or interference. The sensitivity of the
tweeter is greater at the lower end of the device due
to the waveguide which actually assists in the acoustic
coupling of the tweeter dome. In the 2kHz region,
which is a critical area in most music material, the
sensitivity is much higher than a conventional tweeter.
In the crossover this downward tilt is corrected but the
bene cial result is that the tweeter runs “cool” as less
power is delivered to the tweeter at the lower end. For
example at 2kHz almost one quarter of the power is
fed to the tweeter, this is a huge advantage in terms of
the maximum output and the linearity of the treble.
In the full loudspeakers, the tweeter “waveguide”
incorporates several physical parts and it is absolutely
critical that these are designed to disturb the tweeter
output as little as possible. The tangerine waveguide,
the midrange cone, the midrange surround, the
shadow are and the ba e all form a single continuous
waveguide surface. At each junction between two
parts on this surface the gap is carefully controlled
to minimise any effect and the parts meet exactly
tangentially. The midrange surround uses a Z-Flex
design so that it too forms this surface as smoothly as
possible (see Appendix VI for more details).
Figure 43. Frequency response of a prototype of The Reference tweeter measured in
a test waveguide
24
Figure 42. FEA computer model of the tangerine waveguide (left), nal production waveguide (right).
The Midrange
The midrange driver has a di cult task: it must bridge
the gap between the low and high frequencies, covering
the range over which our ears are most sensitive. It
is therefore exceptionally important that a midrange
driver is well behaved above the working range,
otherwise they might con ict with the tweeter output.
The shape of the midrange driver cone, surround and
surrounding objects are very important. In addition,
the midrange driver cone experiences much higher
vibrational forces than a bass driver cone because if the
range over which it operates.
The Uni-Q uses a 5inch aluminium cone driver for
the midrange output. The size of this driver is carefully
optimised so that the dispersion of the tweeter and
the midrange matches as well as possible at crossover.
Aluminium is a very good choice of material for a
loudspeaker diaphragm as it is both sti and light and
25
Page 16
4.4.2 Low frequency drivers
also easy to form into a complex shape. The sti ness
and low mass mean that the cone operates as a rigidly
body over the entire midrange region. This is unlike
some competitor drivers where the cone operates in
resonance over much of the working bandwidth. The
benefit of a rigid body operation is that the sound
radiated from the cone is free from irregularities due
to differences in how the cone vibrates at different
frequencies, providing the best possible coherence
to the radiated sound. The rigid operation is also
very important in controlling the dispersion of the
driver. The target is for the dispersion of the midrange
driver to slowly narrow monotonically as frequency
increases. When a cone enters breakup the dispersion
characteristic changes and typically becomes wider, this
sudden change in dispersion is not desirable.
The issue with metal diaphragms is that when they
do enter breakup, as they have little internal damping,
very large irregularities in the response occur. These
can be easily 15dB or more in magnitude. This is large
enough to be a problem even if breakup occurs well
above the crossover frequency. It is possible to add
damping material directly to the cone to control these
resonances, however, this is not a good solution as this
direct damping application is very heavy and this results
in a driver with low sensitivity.
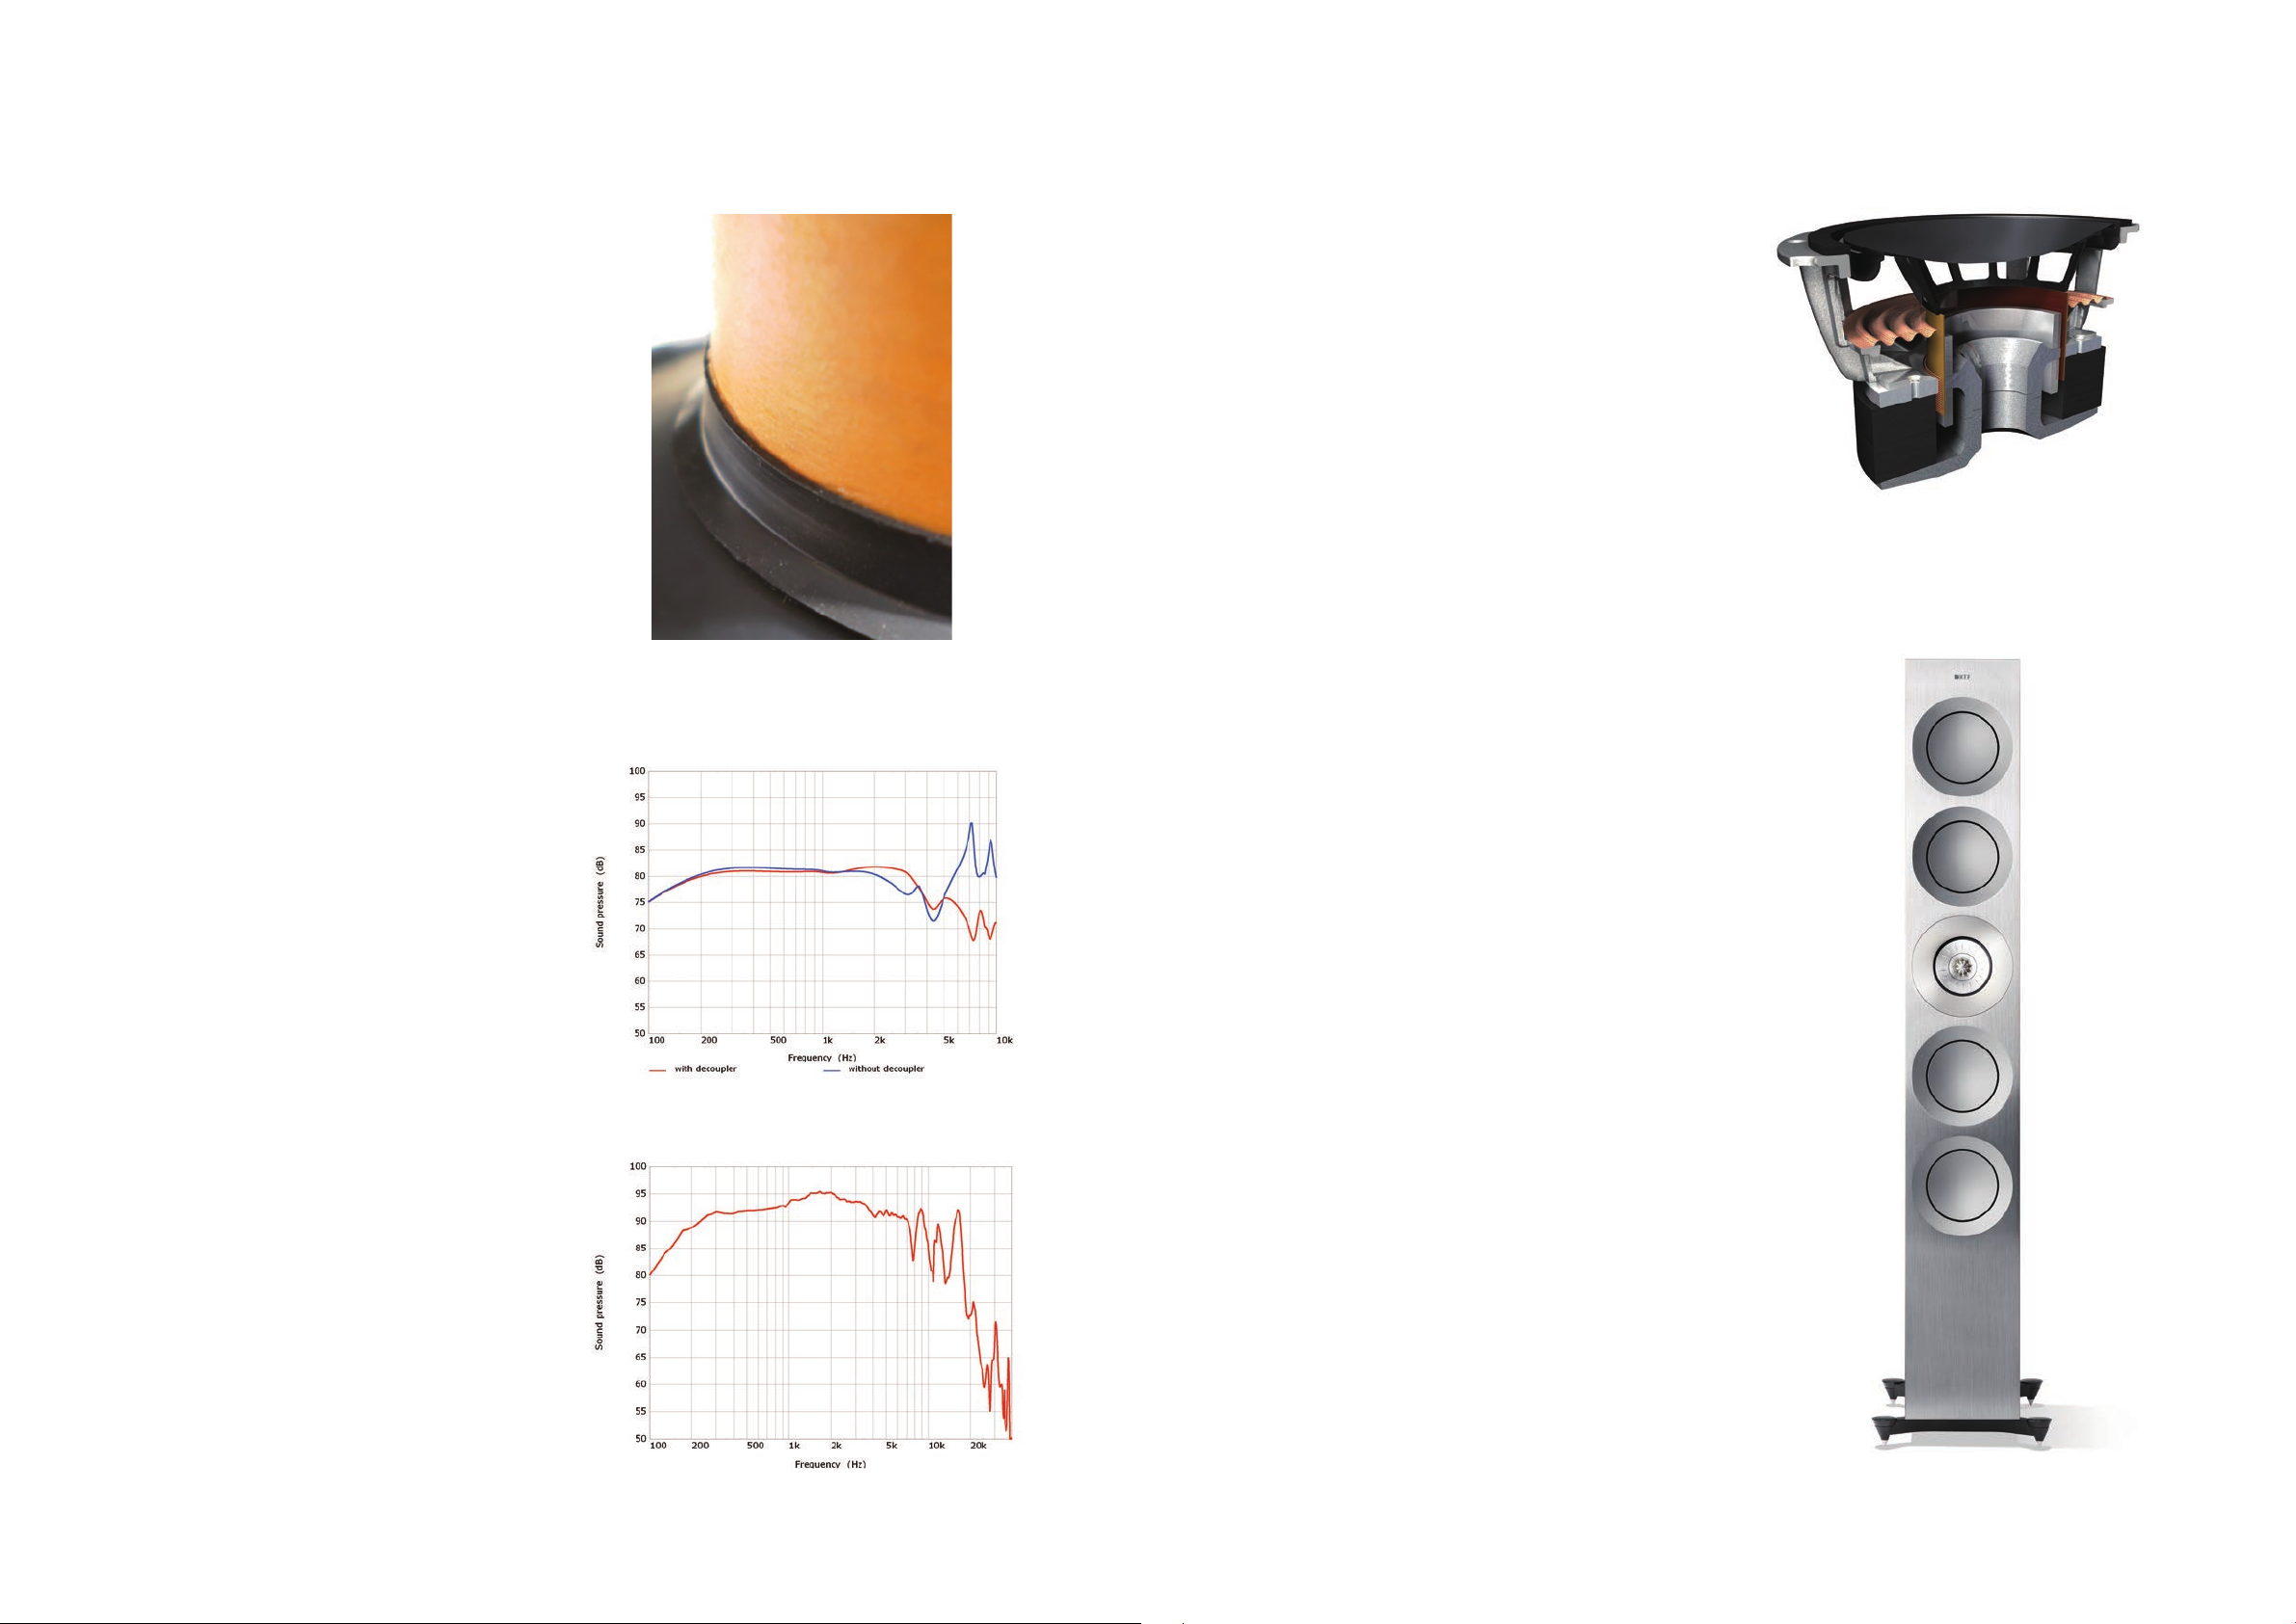
Figure 44. Cone neck control resilient link between the cone and the voice coil.
The low frequency driver is shown in section in,
right. Computer modelling was used extensively in
the design of this driver in order to achieve the best
possible performance. Rather than a conventional cone
diaphragm, the driver uses a shallow aluminium disc.
This gives the driver a much lower pro le when placed
in the loudspeaker baffle and ensures that it has the
minimum e ect on the response of the midrange and
tweeter.
The rear of this disc is supported by a vented coupler.
This is a unique technology to KEF that was first
developed for the Blade loudspeaker. The vented
coupler serves two purposes, firstly it allows very
free movement of air away from the driver as the
diaphragm moves. With a conventional driver, air can
often be trapped inside the voice coil and this can
lead to losses and distortion at high levels. At the
centre of the motor system there is a large venting
hole that further aids the movement of air at the rear
of the driver. The geometry of the vented coupler is
ne tuned using computer analysis so that it connects
with the aluminium disc at a “nodal” position. A nodal
position is a region on a structure where a particular
resonance has no e ect. By choosing a nodal position
to drive the aluminium disc the rst resonance of the
disc is suppressed.
Bass driver cross section
KEF use a unique technology called cone neck control
to avoid the traditional breakup problems of metal
cone drivers. With cone neck control the cone is not
rigidly connected to the voice coil of the driver. A
resilient high damping link is used to connect the two
parts together. This link is carefully designed and fine
tuned with the help of computer modelling so that
within the band of the driver the force from the voice
coil is fully transferred to the cone. Above crossover,
however, the resilient link begins to ex and to damp
the cone motion. The effect on the driver response
is quite dramatic. The breakup peak from the driver
is reduced by around 15dB and the driver response
is considerably smoother. The penalty is a small mass
increase in the moving parts, albeit much less than
using a direct damping approach. Figure 45 shows the
modelled frequency response of a midrange driver with
and without cone neck control technology.
The overall frequency response of the midrange driver
is shown in Figure 46. The frequency response is very
smooth and well controlled to well above the crossover
frequency of approximately 2.5kHz.
Figure 45. Midrange driver response with and without cone neck control technology.
Figure 46. Axial frequency response of the midrange driver measured in 2pi at 1v/1m.
The voice coil on the bass drivers is particularly large
compared to other drivers of a similar size. This is very
important as at high levels a great deal of heat must
be dissipated from the coil. A large voice coil has a
fundamental advantage in this respect as for the same
power input it will not become as hot, simply because
it has a greater thermal mass. Secondly, the larger
area aids the dissipation of this heat into the motor
system and surrounding metal work. The overall result
is much less power compression. The larger voice coil
could present a problem in terms of mass, however to
overcome this issue the coil uses aluminium wire.
The driver uses an undercut pole and an overhung
voice coil design. Both of these features are to
maximise the excursion capability of the driver for low
distortion output even at high levels. The surround
and suspension of the driver are also carefully designed
with this in mind. In order to control the distortion in
the upper bass and lower midrange region the motor
system incorporates large aluminium Faraday rings
above and below the magnetic gap.
26
27
Page 17
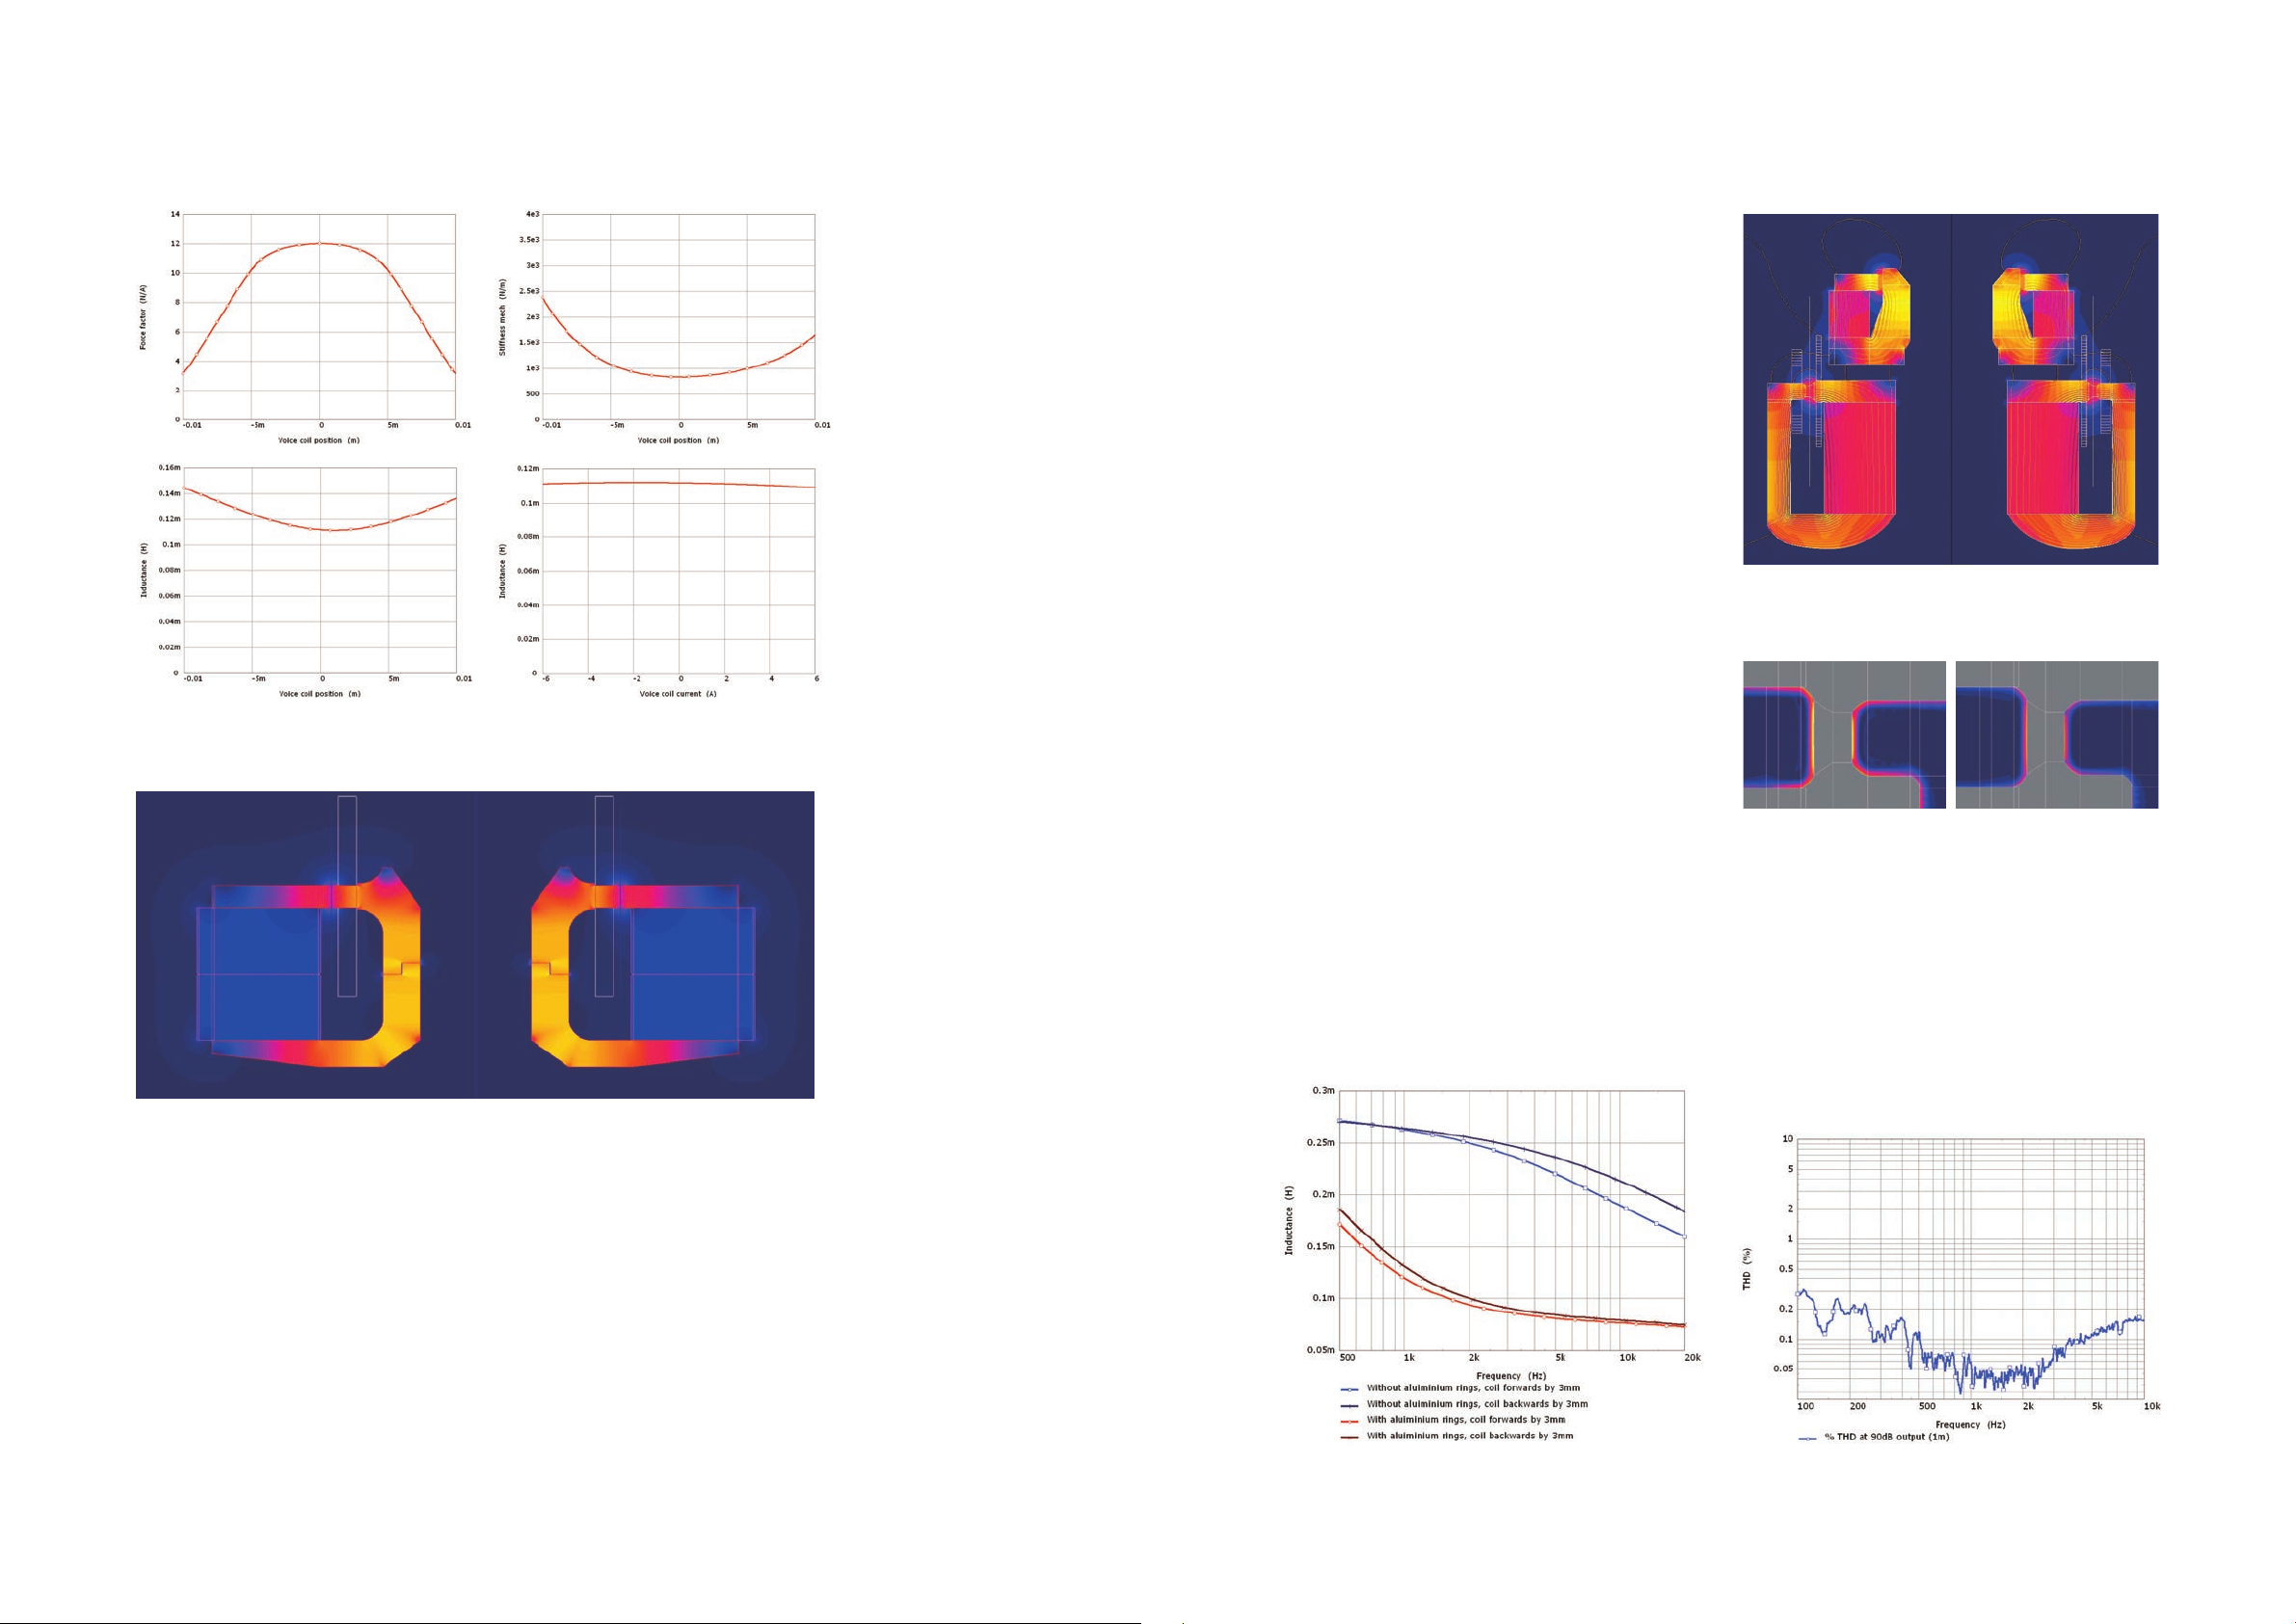
Figure 47. Non-linear LF driver parameters measured with Klippel analyser system, 16Ohm driver version.
Reference motor systems use a mix of underhung
(tweeter) and overhung (low frequency/midrange)
voice coil designs to ensure that the the force from the
motor system is not modulated with the motion of
the driver diaphragm. In addition both motor systems
incorporate carefully designed conductive regions.
The tweeter has a copper sleeve on the inside of
the magnetic gap, the low frequency and midrange
use large aluminium rings above and below the gap.
These conductive regions are inductively coupled to
the voice coil and they are used to cancel the selfinductive behaviour of the voice coil. The placement
and size of the rings are fine tuned using computer
analysis to ensure that the voice coil inductance is not
modulated with the voice coil position. In addition, the
cancellation of the voice coil inductance itself is very
effective in reducing distortion. This is because the
magnetic moment generated by the voice coil will, if
not controlled, modulate the permanent magnetic eld.
For example Figure 50 shows the magnetic ux density
generated in the steel parts near the midrange motor
gap due to the voice coil current, with the conductive
rings in place the magnitude of this ux is signi cantly
lower. Figure 51 shows the corresponding inductance
for two voice coil positions.
The result of this attention to detail in the design
of the drivers and motor systems in general is that
the distortion performance of the loudspeakers is
exceptional. Figure 52 shows the percentage harmonic
distortion of a prototype of Reference 5 at a 90dB/1m
output level. The mid-band distortion is less than 0.07%.
Figure 49. FEA magnetic analysis of Uni-Q motor showing flux density due to
permanent magnets.
Figure 50. Flux density modulation of midrange motor system gap area at 2000Hz
without conductive regions (left) and with conductive regions (right).
28
Figure 48. Static magnetic FEA simulation of LF driver motor with ux density shown as colour.
4.4.3 Motor system design
The Reference system and driver design has speci cally
focused on achieving the lowest possible distortion
performance. Though there are several sources of nonlinearity in loudspeakers, it is the driver motor system
design that is most critical in achieving low distortion
in the midband region where the diaphragm motion
is small. At KEF, advanced FEA computer analysis
methods are used to design the motor system and to
analyse the distortion performance. For the Uni-Q
driver, due to the close proximity of the mid and
high frequency motors, the two magnetic systems
must be designed to work together. Figure 49 shows
a static magnetic FEA analysis of the MF and HF
motor systems, the magnetic flux density due to the
permanent neodymium magnets is shown. The eld of
each motor is concentrated in the magnetic gaps, there
is little stray eld. The undercut design on the midrange
driver can be clearly seen, as can the large central
venting hole used to accommodate the rear loading of
the tweeter.
Figure 51. Midrange voice coil inductance versus frequency for motor system with
and without aluminium rings.
Figure 52. Measured THD of Reference 5 prototype as a percentage of the output
SPL at a level of 90dB/1m.
29
Page 18
4.5 Crossover design
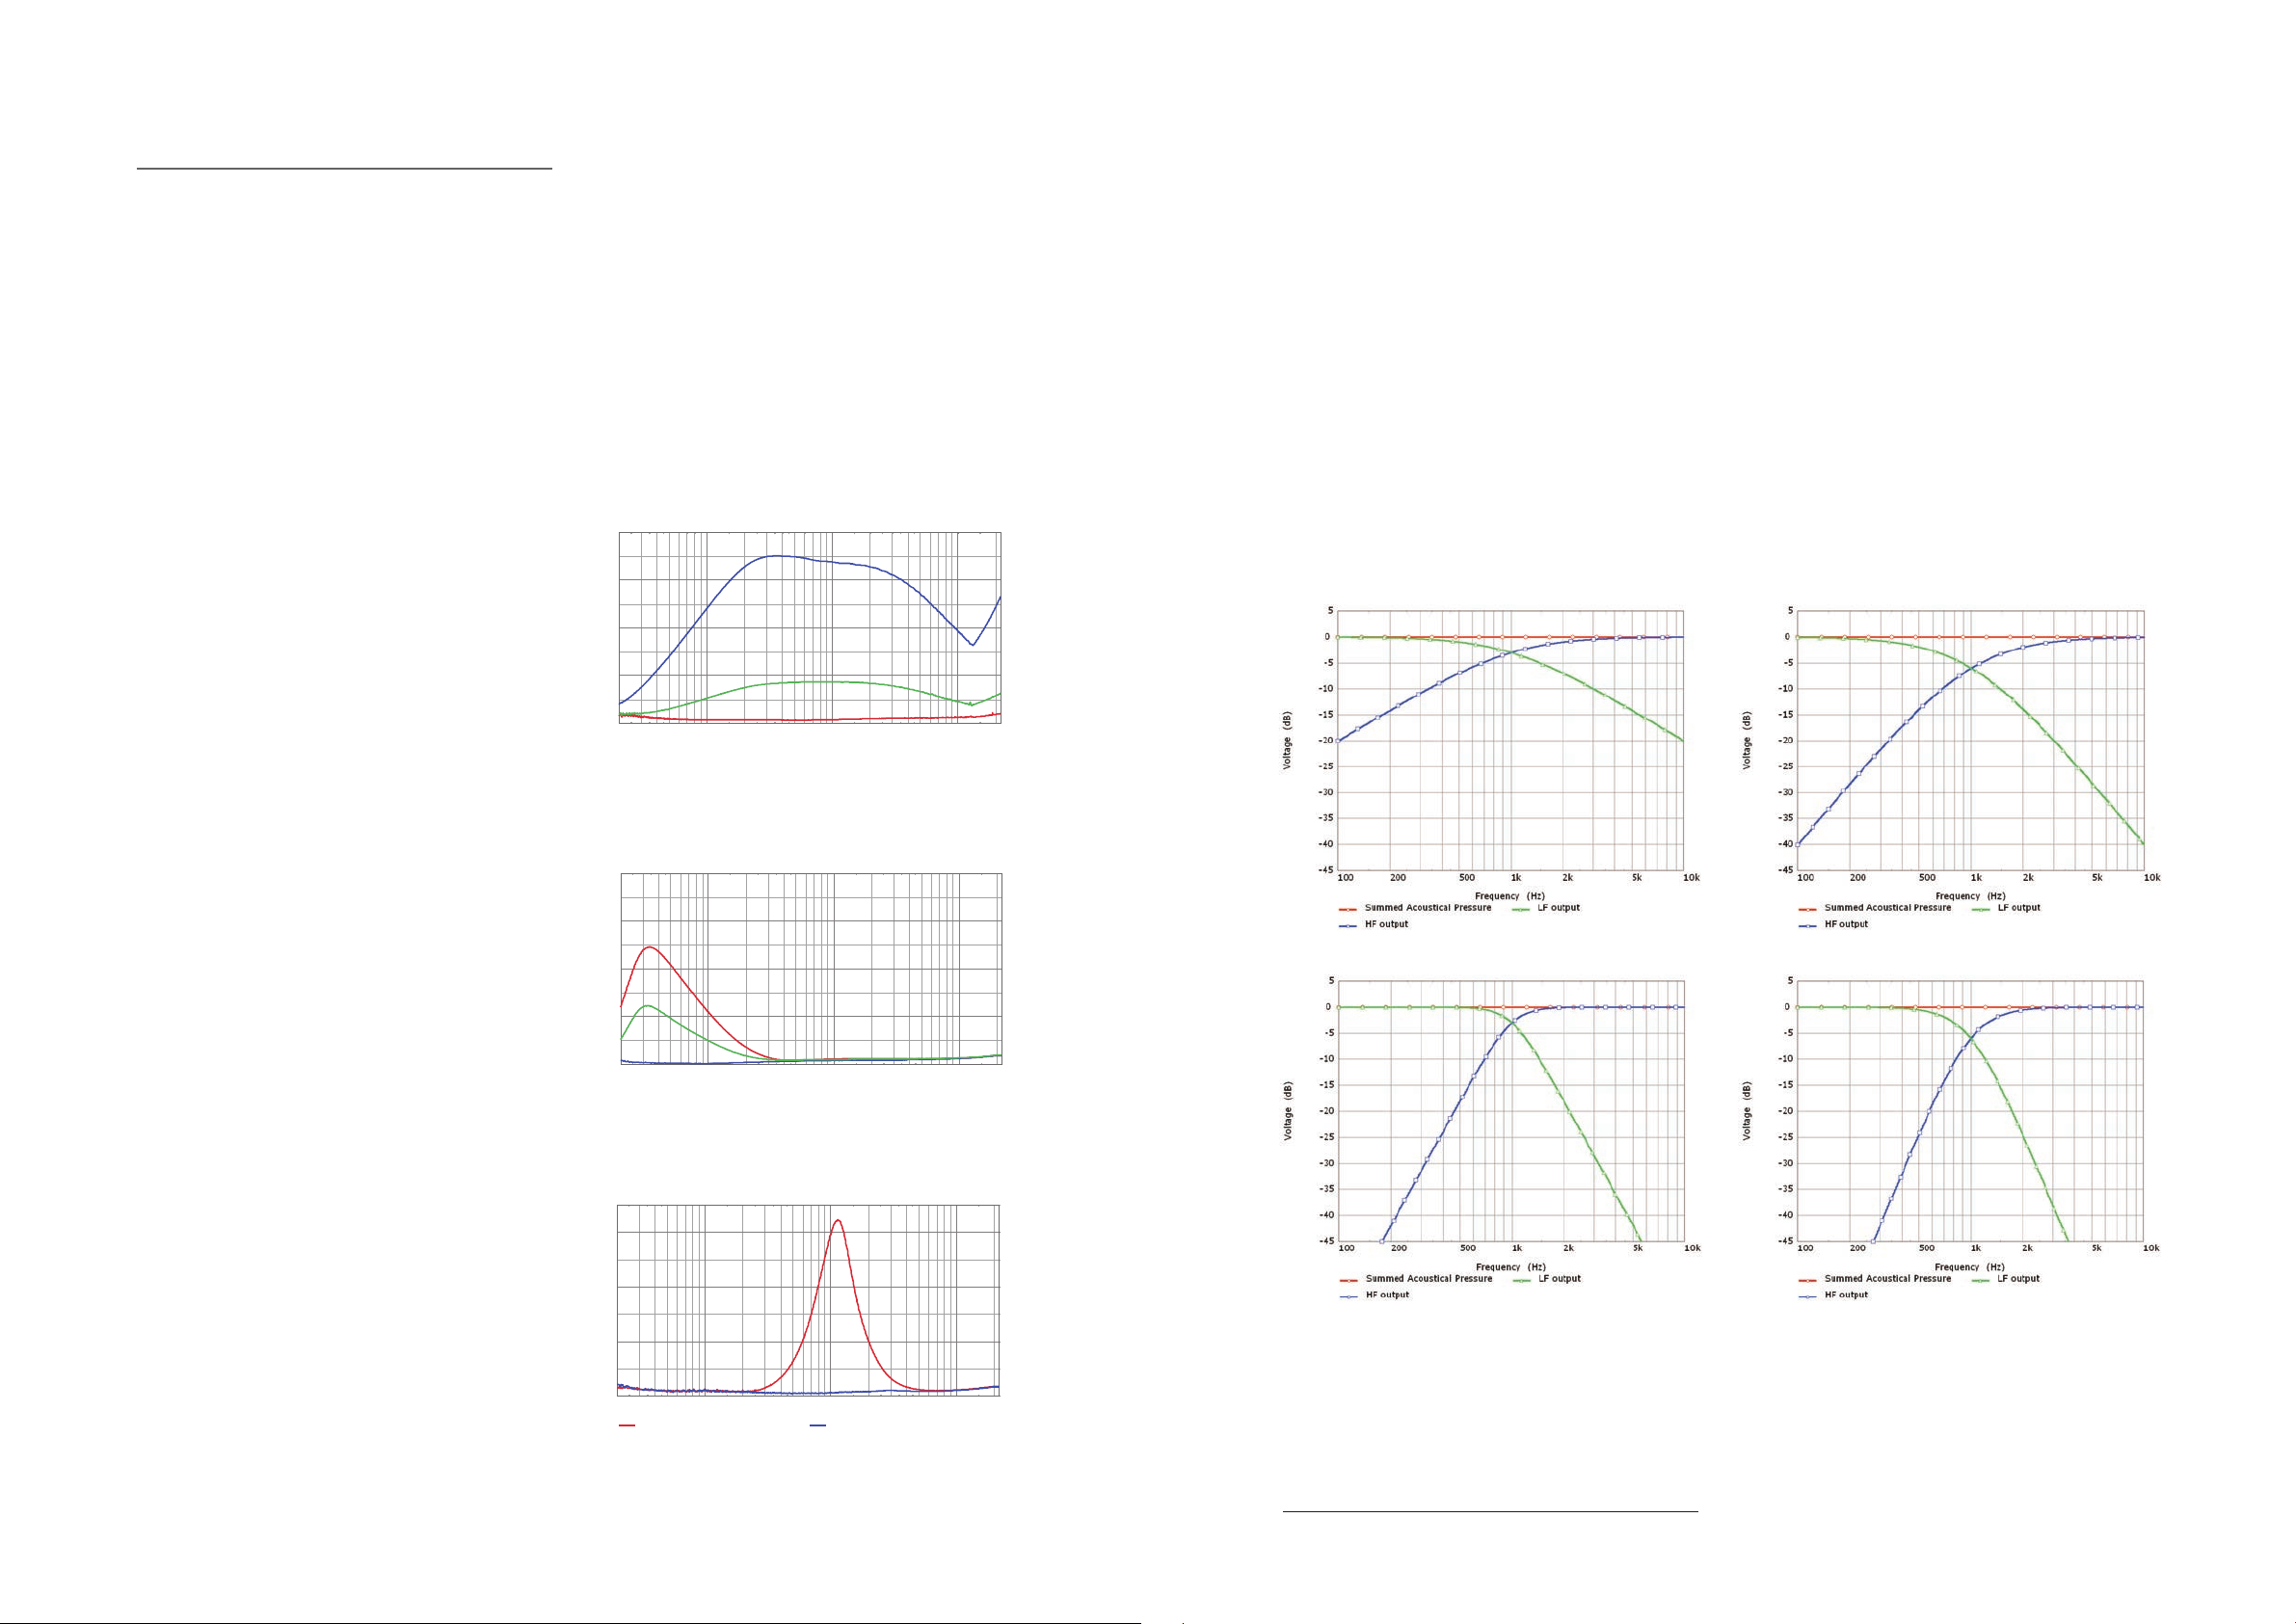
(%) Amplitude, %THD
Frequency (Hz)
(%) Amplitude, %THD
Frequency (Hz)
(%) Amplitude, %THD
Frequency (Hz)
Poor components
Chosen compone nts
4.5.2 Crossover lter order
The crossover is the electrical circuit that divides the
input signal and sends appropriate parts to the relevant
drivers in the loudspeaker system. The Reference
loudspeakers are passive designs, this means that the
electrical crossover circuit is not powered and the
components must perform at the high power levels
that are sent to the loudspeaker by the driving ampli er.
Crossover design can be a complex subject and there
are plenty of strong opinions of how it should be
approached. The approach taken to the design of The
Reference crossovers are outlined in the following
sections.
4.5.1 Crossover component distortions
Passive crossovers are constructed from simple
electronic components such as resistors, capacitors
and inductors. Real resistors, capacitors and inductors
are not ideal, and all introduce some level of distortion
to the system. Selecting the correct types of each
component can greatly affect the performance of
the crossover, and choosing the wrong components
can result in a crossover that introduces a significant
amount of distortion into the loudspeaker system.
large level of distortion, whilst correctly selecting the
components can reduce the distortion generated
by the crossover to a negligible level. By using this
methodology through the whole crossover network,
the result is a lower distortion and a better sounding
loudspeaker system.
0.4
0.35
0.3
0.25
0.2
0.15
0.1
0.05
0
20 50 200 500 2k 5k 20k
Figure 53. Measured component percentage THD at 20V input level for three
100 1k 10k
inductors of the same inductance, similar cost and similar resistance but
di erent constructions and manufacturers.
Crossover filters have been widely studied and there
are numerous publications on di erent approaches to
their design. The most widely known are the classical
Butterworth and Linkwitz-Riley types. Both of these
families of filters can be implemented in either active
electronics or with passive electronics8. These filters
have the characteristic that when the output of a
complimentary high-pass filter and low-pass filter
are summed the resulting signal has a perfectly flat
frequency response. In a loudspeaker the high-pass
lter would feed the signal to the tweeter and the low
pass filter would feed the signal to the woofer. The
order of a lter determines how much attenuation is
present in the lter stop band. The rst four of these
classical crossover designs can be seen in Figure 56,
all filters result in a crossover frequency of exactly
1000Hz and result in a flat summed response. The
e ect of increasing lter order can be clearly seen - the
1st order high-pass lter provides 20dB of attenuation
to the tweeter at 100Hz, whereas the 2nd order highpass lter provides 40dB of attenuation to the tweeter
at 100Hz.
For The Reference, extensive objective testing of
individual components were carried out to identify
those with the lowest distortion. This study turned
out some extremely surprising results. In many cases
there was little correlation between the size, cost or
published specification and the measured component
distortion. For example, Figure 53 shows the distortion
levels of three identical value inductors of a similar size,
cost and DC resistance, but of di erent constructions.
As can be seen, the worst inductor had 10 times more
distortion than the best.
Figure 54 shows a comparison of the measured
distortion for some different capacitors. Again, there
were significant differences between different types.
Using this testing allowed very quick identification
of the best components for further investigation in
listening tests.
This testing approach was also applied to fully
constructed crossovers, for example Figure 55 shows
the measured distortion of a prototype Reference 5
high frequency crossover circuit. Both curves are for
the same circuit, but one has been built with a single
poor component choice, whilst the other has been
made using only low distortion components. This
shows that a single bad component can introduce a
0.4
0.35
0.3
0.25
0.2
0.15
0.1
0.05
0
20 50 200 500 2k 5k 20k
Figure 54. Measured component percentage THD at 20V input level for three
0.35
0.3
0.25
0.2
0.15
0.1
0.05
0
20 50 200 500 2k 5k 20k
Figure 55. Distortion measurement of full HF crossover at 20V input level with two
100 1k 10k
capacitors of the same capacitance, but different constructions and
manufacturers.
100 1k 10k
di erent component selections, note the component values and lter
responses are identical.
Figure 56. Classical crossover lter arrangements, from top left to bottom right, 1st order Butterworth, 2nd order Linkwitz-Riley, 3
rd
order Butterworth, 4th order Linkwit z-Riley.
30
8 This is only true given certain constraints on the load, typically in text books
the component values required to achieve the classic lter types are given
for a purely resistive load.
31
Page 19
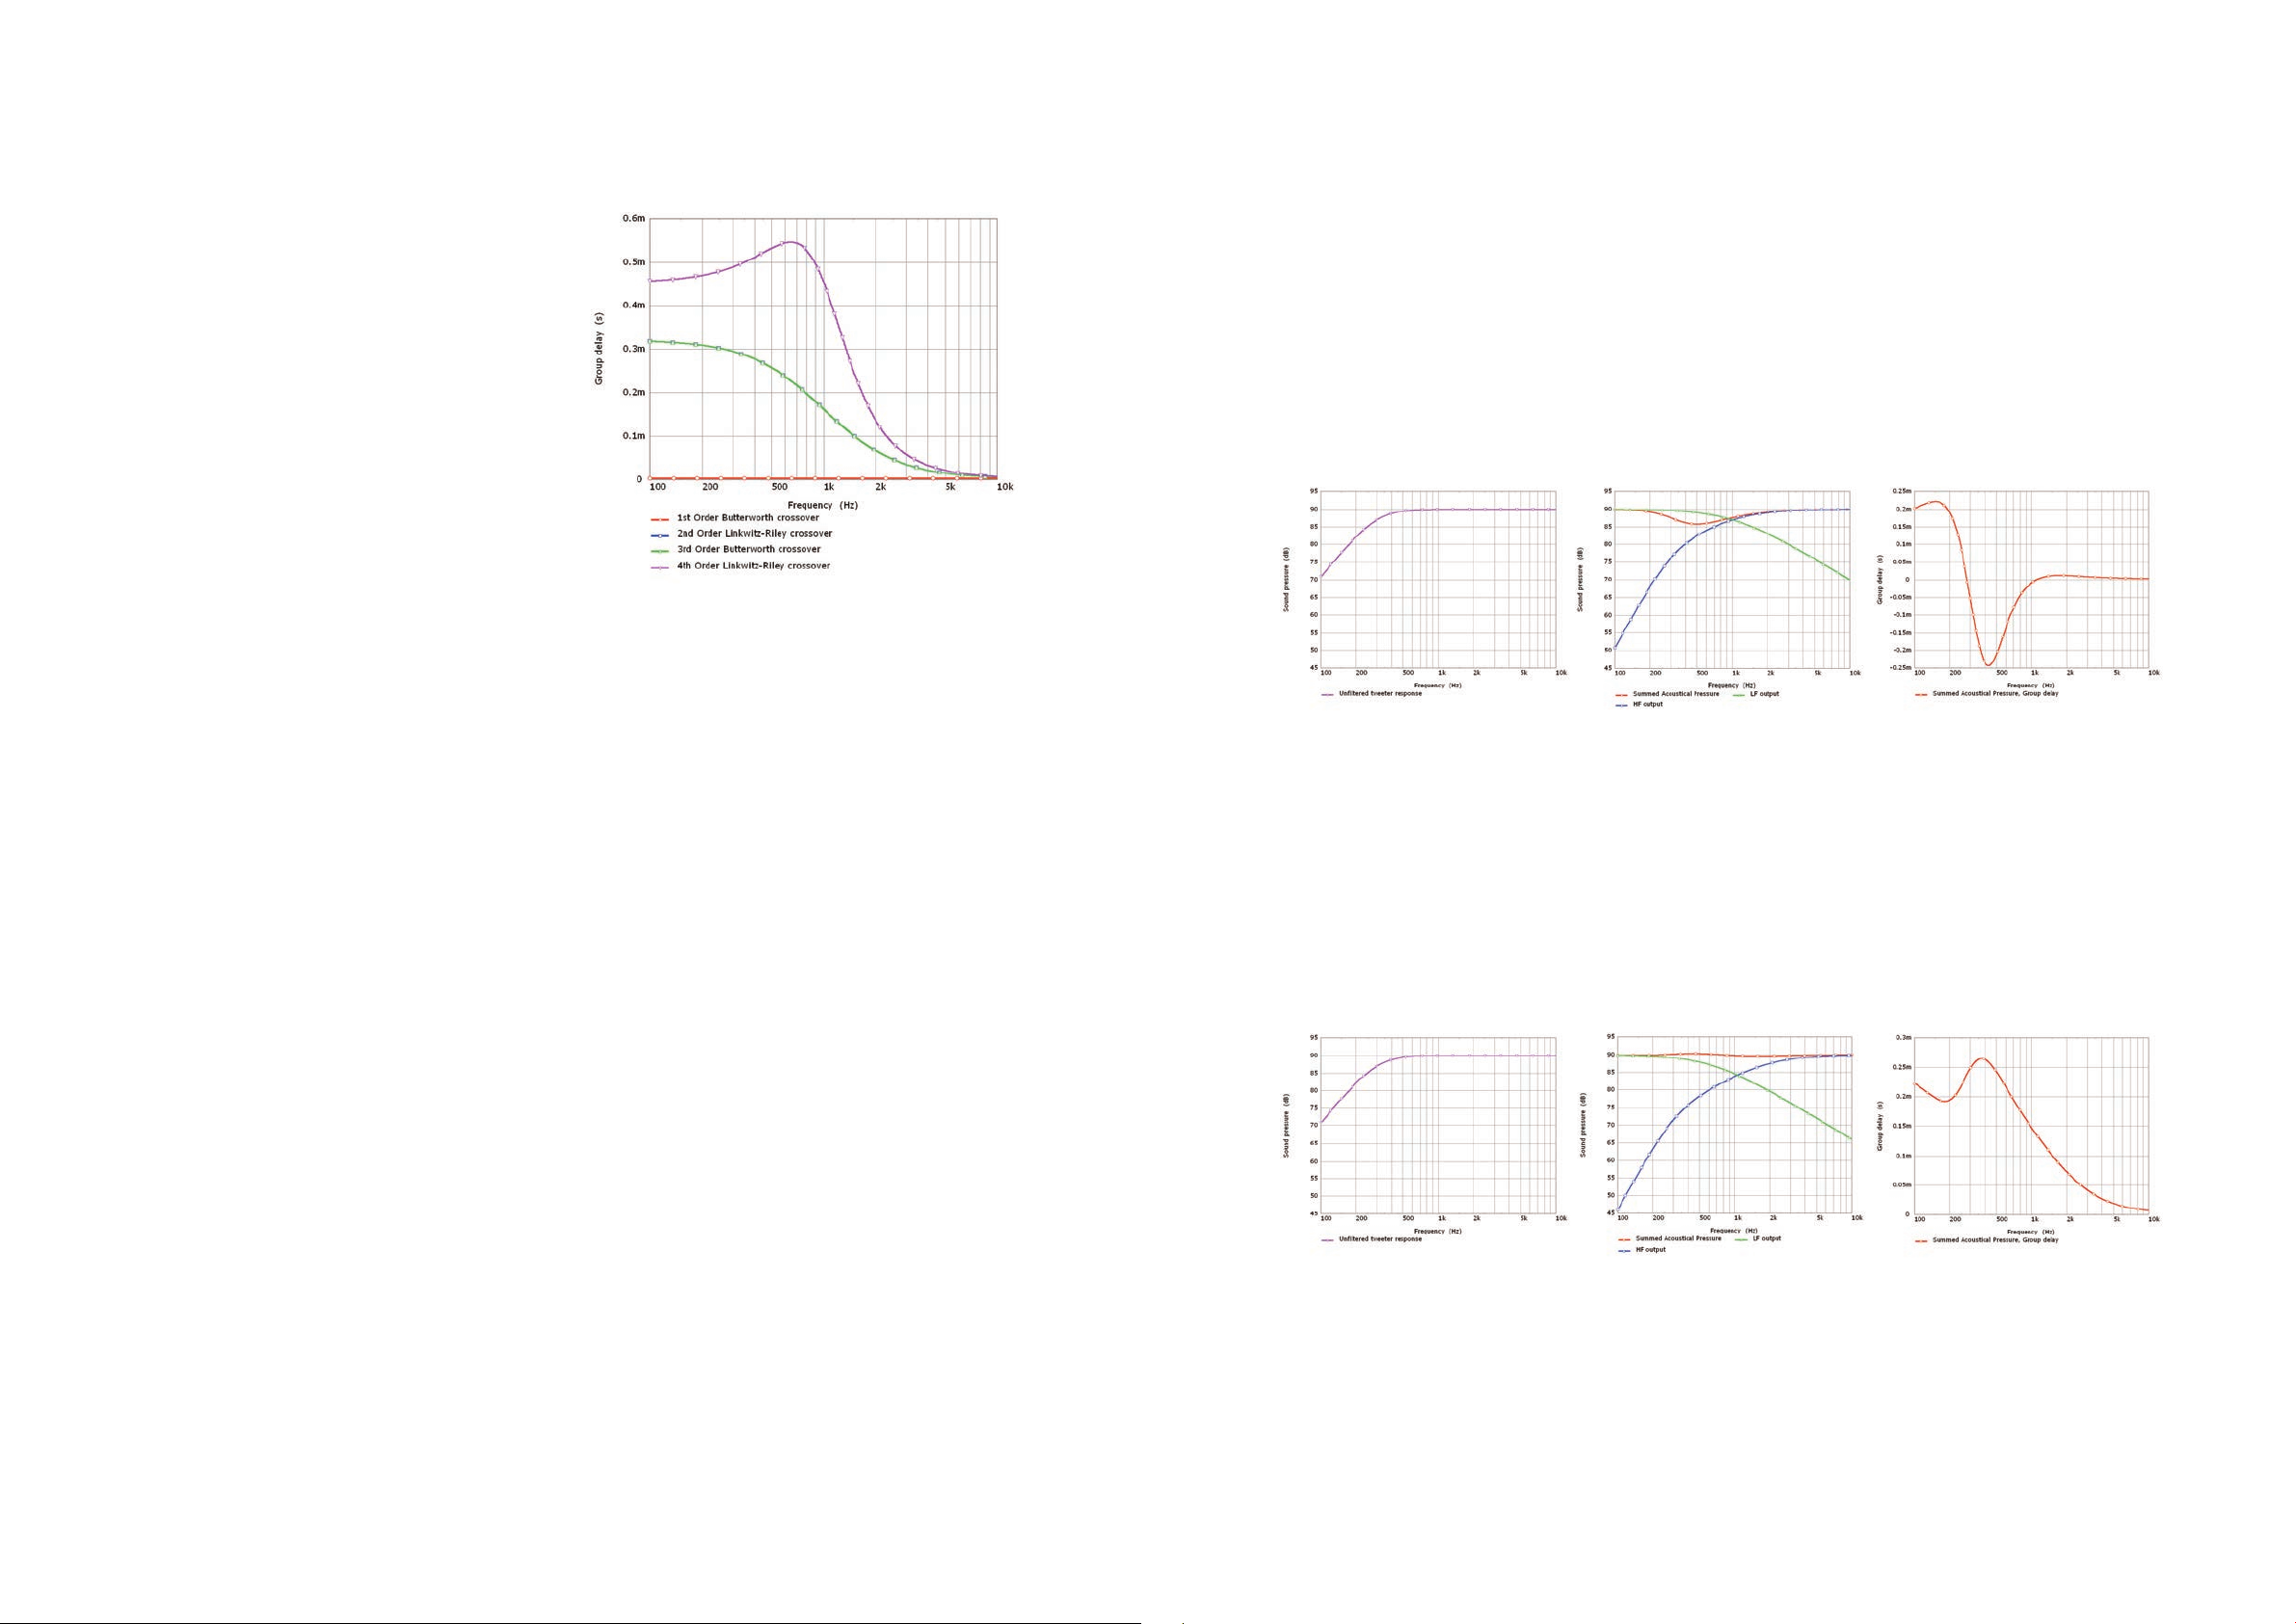
In terms of a loudspeaker one might think that a higher
order will always be preferable, because the tweeter
can be protected better from low frequency signals
and the woofer signal can be curtailed before any high
frequency cone breakup. However, there are several
considerations that are not shown by the frequency
level response. Firstly, a greater number of components
are required for a higher order crossover and this
makes it much more di cult to design a passive circuit
that is completely transparent and distortion free.
Secondly, with increasing filter order the summed
signal becomes increasingly smeared in time. One
way to look at this time smearing is in terms of the
relative transmission delay of the crossover to di erent
frequencies, this information is shown in Figure 57. It
can be clearly seen that the time smearing is worse
for the higher order crossovers. Note that this time
smearing is inherent to the type of filter rather than
the realisation of the lter. This means that irrespective
of whether the filter is passive active or digital, a
Butterworth 3rd order crossover lter will result in the
same group delay characteristic.
Figure 57. Group delay of classical crossover filter arrangements. Note that
the group delay of the 2
Butterworth crossover are identical
nd
order Linkwitz-Riley and the 3rd order
raw response of the loudspeaker drivers is completely
neglected. In reality the raw driver responses must be
taken into account. Figure 58 demonstrates this. The
left figure shows the raw response of a theoretical
tweeter with an exceptional response of -3dB at
300Hz. The centre and right hand figure show the
overall response and group delay when a 1st order
Butterworth crossover is used with this tweeter and
a perfect woofer. Even with this exceptional tweeter
response the overall frequency response is no longer
st
Figure 58. Raw tweeter response (left), 1
order Butterworth crossover using this tweeter (centre), overall group delay (right).
at and there is signi cant time smearing evident in the
group delay plot. The reason that this approach did not
work is that the response of the drivers must be taken
into account when designing the crossover, it is the
overall transfer function of crossover lter plus driver
that counts. Unless the drivers themselves have no rollo then it will not be possible to achieve the theoretical
zero time smear of the 1st order Butterworth
crossovers. In practice this is simply not possible.
Polarity inversion of the some of the drivers in a
multi-way loudspeaker in order to avoid interference
dips at the crossover frequency is commonplace.
This is necessary because of the time smearing of the
crossover filters and the drivers themselves. This can
be a source of confusion. For example the classical
nd
order Linkwitz-Riley crossover requires one of
2
the driver polarities to be reversed, whereas the 4th
order Linkwitz-Riley does not. The time smearing of a
second order crossover means that at the crossover
frequency the low frequency signal is delayed by half a
wave period and the polarity reversal is necessary to
achieve proper summation between the two drivers.
The 4th order crossover has more time smearing and
the low frequency signal is delayed by a full wave
period and hence no polarity reversal is required.
There is no advantage to the fact that tweeter polarity
is not inverted in the 4th order system, this is simply a
consequence of the greater time smearing.
st
order Butterworth crossover filter has the
The 1
interesting property that there is no time smearing.
This fact, combined with it’s simplicity, has made it very
popular among audiophile loudspeakers. However,
the lack of time smearing is something of a fallacy.
While it is absolutely true that complimentary 1st
order Butterworth lters will sum to a result without
time smearing, in these classical crossover types the
It is possible to achieve a reasonable response using this
tweeter and a first order crossover, by inverting the
tweeter polarity and manually optimising the lters, as
shown in Figure 59, however note that the group delay
is now comparable to a second order crossover.
An important point to note is that the time smearing
from a crossover is dependent upon the crossover
frequency. This is because the group delay introduced
by a crossover is proportional to the wave period
Figure 59. Raw tweeter response (left), manually optimised 1
st
order crossover using this tweeter (centre), overall group delay (right).
Using digital filters it is possible to achieve crossover
filtering without any time smearing and with a high
order roll o . The lters required to achieve this exhibit
an unusual time domain impulse responses, an example
is shown in Figure 60, with a pre-ringing before the
main body of the impulse. There is some evidence to
suggest that this pre-ringing is responsible for audible
artefacts [13] [14]. Provided that the output from the
at the crossover frequency. This means that time
smearing is much more problematic with low
frequency crossovers. This is a significant reason why
a 3-way design approach has been taken with The
Reference, in order to avoid a very low crossover
frequency necessary on a 4-way system. It is also
one of the reasons why it is extremely difficult to
crossover convincingly between main loudspeaker and
a subwoofer.
drivers arrives at the listener in sync, the pre-ringing
of the filters will cancel in the summation between
the high and low frequency sections of the crossover.
However, with most loudspeakers having separate
treble and midrange drivers the relative arrival time of
the tweeter and midrange signal is not constant and
varies with listener position. Even with the listener
located in a position where the sound arrives in sync
32
33
Page 20
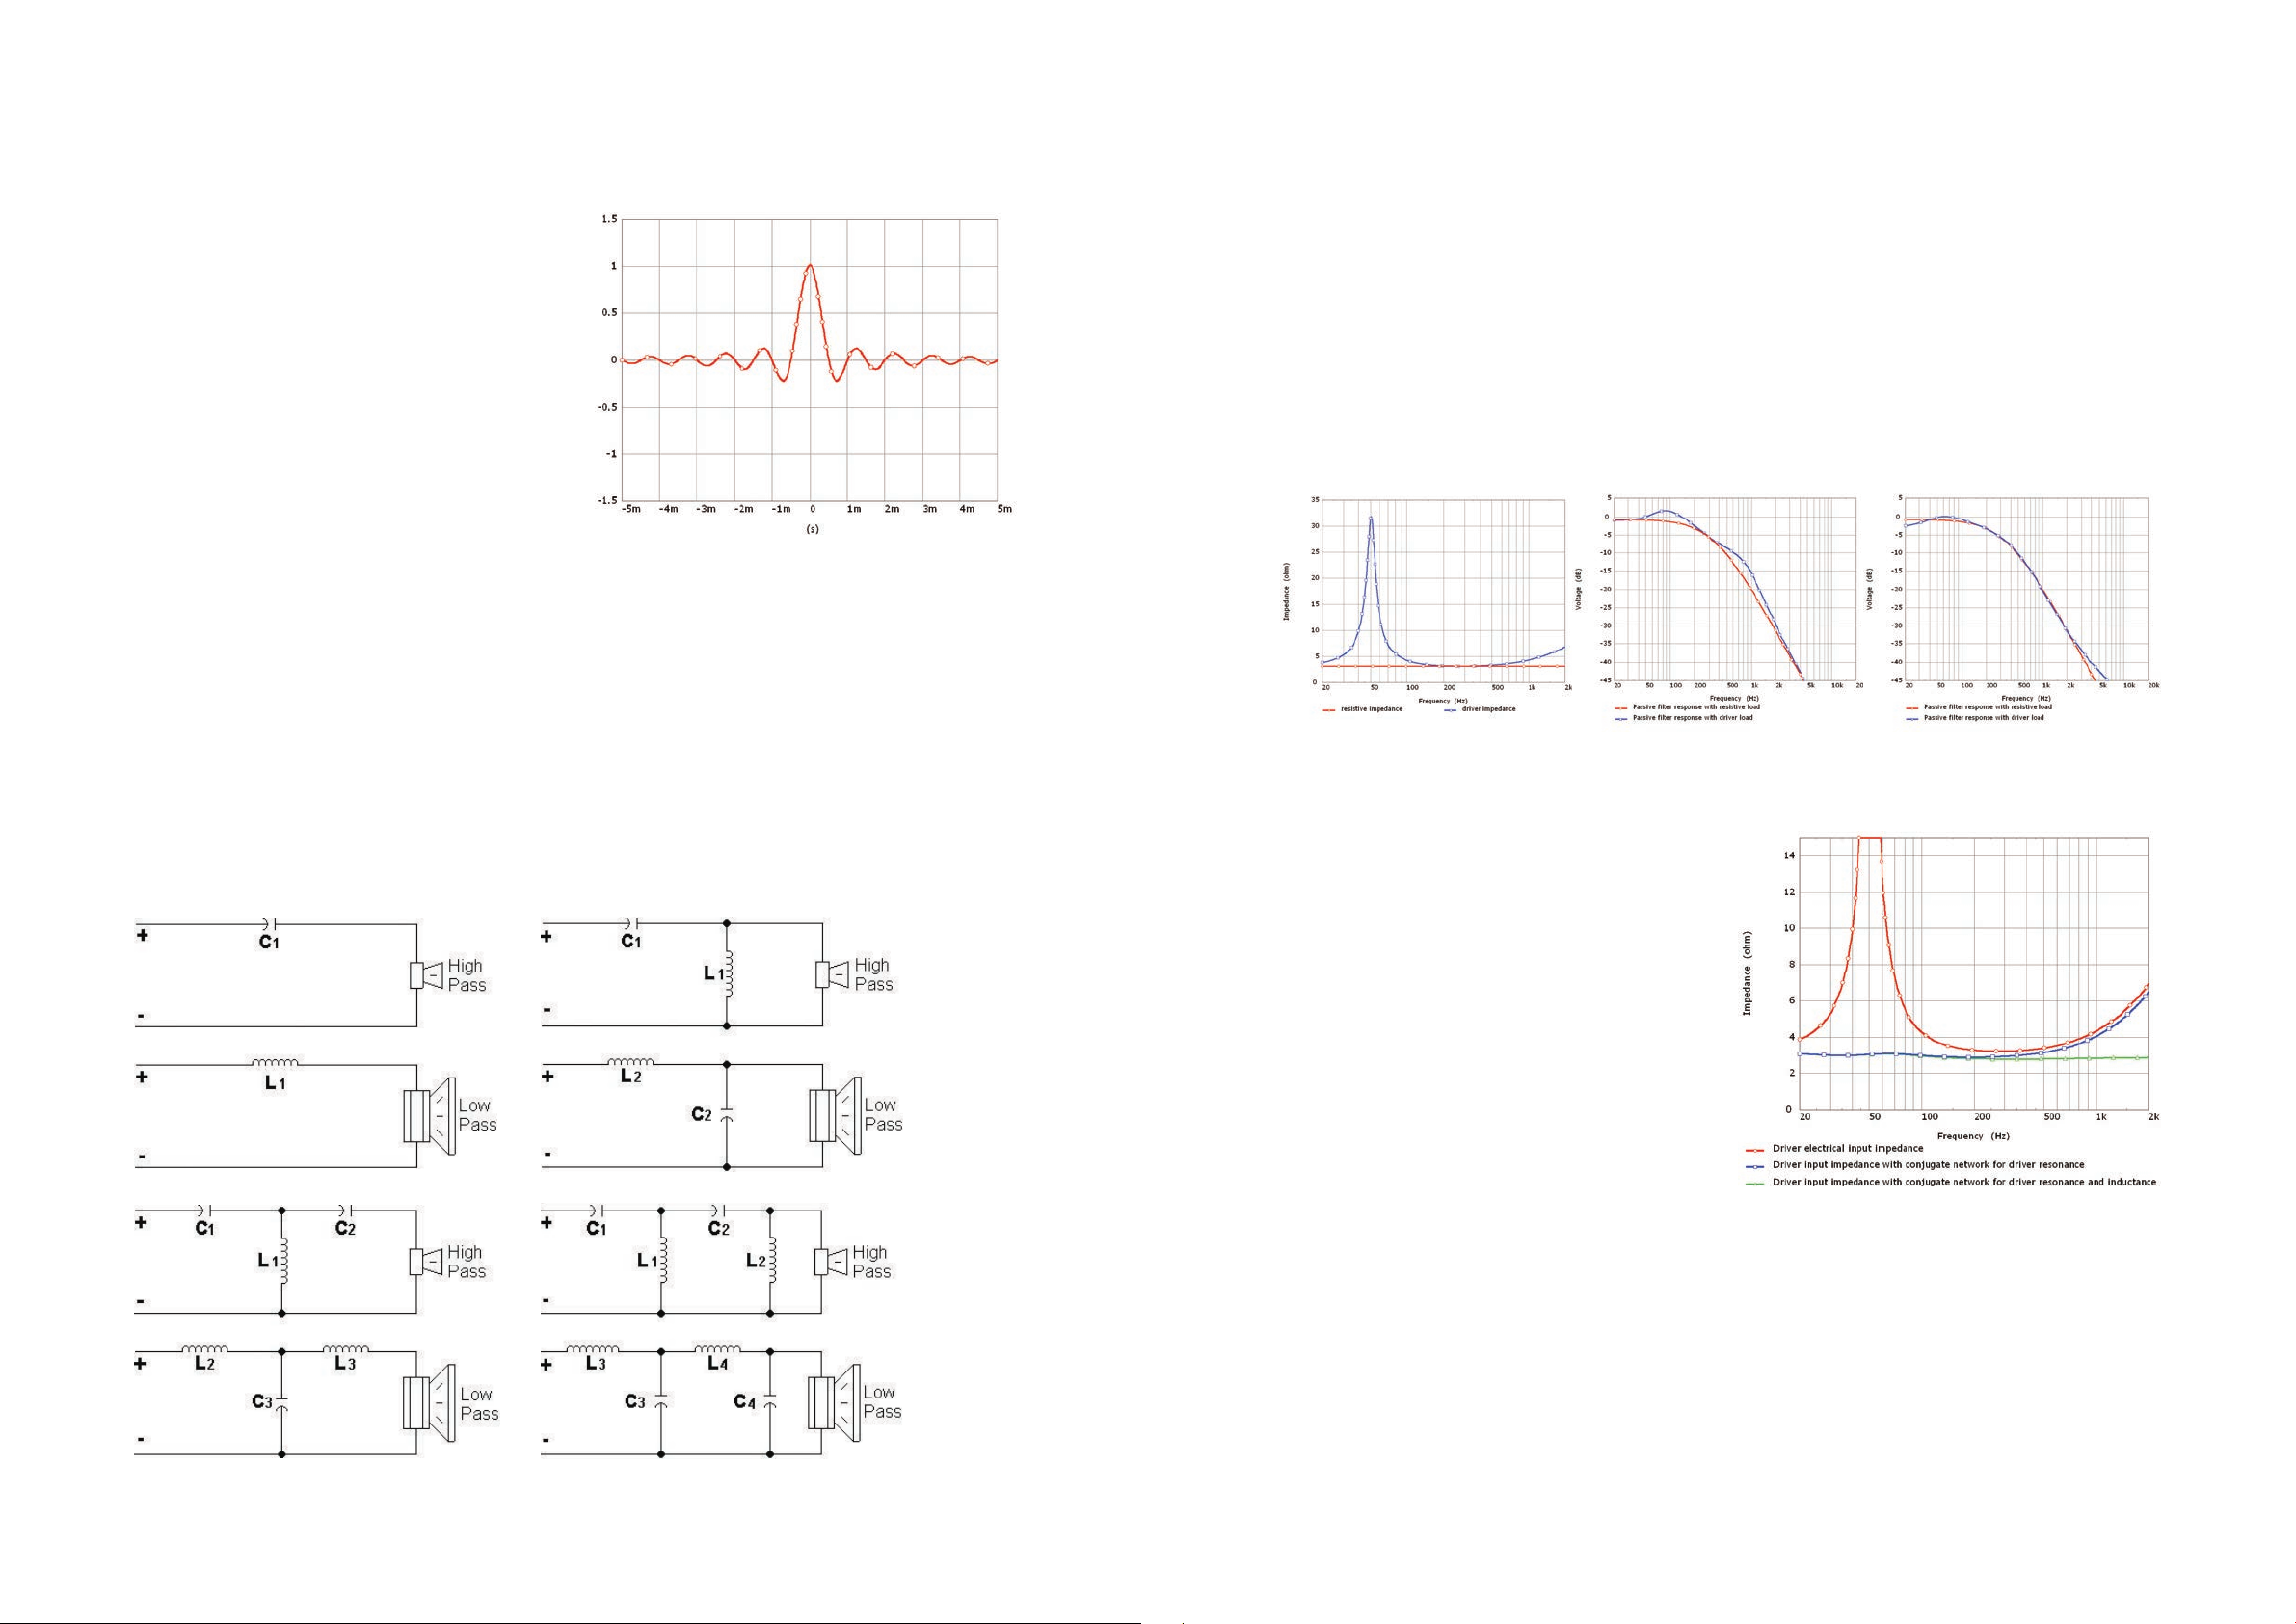
4.5.3 Impedance conjugation and
ampli er load
from the two drivers the reflections from the room
boundaries are likely to contain traces of the preringing artefact.
With conventional loudspeaker systems the choice
of crossover lter has a large e ect on the dispersion
of the loudspeaker. The dispersion of The Reference
models, due to the Uni-Q driver and careful design
of the low frequency directivity, is largely unaffected
by the filter choice. This allows much more freedom
to design a crossover with as little compromise as
possible.
st
The Reference crossovers use a combination of 1
and
2nd order electrical filters. These filters do not follow
any classical type but rather are carefully designed,
using a combination of computer modelling and
listening tests, to ensure good overall summation and
equalisation of the natural driver responses. In some
places a Thiele style notch is incorporated into some
of the lter sections [15]. The emphasis has been to
try and use the simplest possible lters that are able to
fully control the drivers. Filters with an order greater
than two have been avoided because of the additional
components that they add to the signal path (see Figure
61)
Figure 60. Example of a linear phase lter impulse response.
The Reference loudspeakers make use of impedance
conjugation networks in the crossovers. Conjugate
networks are required because real drivers have
an electrical impedance that is not constant with
frequency. Figure 62 shows a typical driver’s electrical
impedance magnitude compared to a resistor. With
a resistive load, a passive filter circuit can achieve
any of the classical filter responses exactly. Figure 62
demonstrates this for a 350Hz 2nd order Linkwitz-Riley
crossover, with a resistive load the correct filter
Figure 62. a. Comparison of electrical the impedance of a real loudspeaker driver and a purely resistive impedance (left).
b. Passive low-pass lter response with each load, lter designed to give 350Hz Linkwitz-Riley response with a 3.2 Ohm load (middle).
c. Passive low-pass lter response with resistive and real loudspeaker driver load, lter designed to give best match to 350Hz Linkwitz-Riley response in each case (right).
response is achieved. Also shown is the response
achieved with the same passive filter loaded with
the driver shown in Figure 62, due to the electrical
interaction between the passive filter and the driver,
the lter response target is not achieved. It is possible
to get a slightly better match by manually optimising the
crossover components, the result is shown in Figure 62.
However, the version with the driver load still shows
some response irregularity as well as attenuation of the
very low frequency response.
These interaction issues can be overcome by using
impedance conjugation networks. This entails adding
extra crossover components in parallel with the
drivers to compensate for the natural driver electrical
impedance. For example, figure 63 shows the input
impedance for the same driver discussed above with
the addition of a conjugation network to compensate
for the impedance peak at driver resonance and for
the rising impedance at high frequencies from the
coil inductance. With both conjugation networks in
place the electrical impedance of the speaker is almost
perfectly resistive and consequently the response
irregularity issues above completely disappear.
34
Figure 61. Passive crossover component layouts for 1st (top left), 2nd (top right), 3rd (bottom left) and 4th (bottom right) orders
There is also a big change in the amplifier loading
when an impedance conjugation network is added to a
crossover. Figure 64 shows this ampli er load di erence
for a typical two-way closed-box loudspeaker system
as an impedance magnitude and phase chart. This
type of gure is widely used in various publications to
aid consumers to asses the relative driving difficulty
when comparing loudspeakers. Unfortunately this
information does not lend itself to easy comparison as
both low impedance magnitude and high impedance
phase lead to di cult loudspeaker loads. For example,
considering Figure 64, the impedance magnitude of the
Figure 63. Typical loudspeaker driver electrical input impedance with impedance
conjugation components
35
Page 21
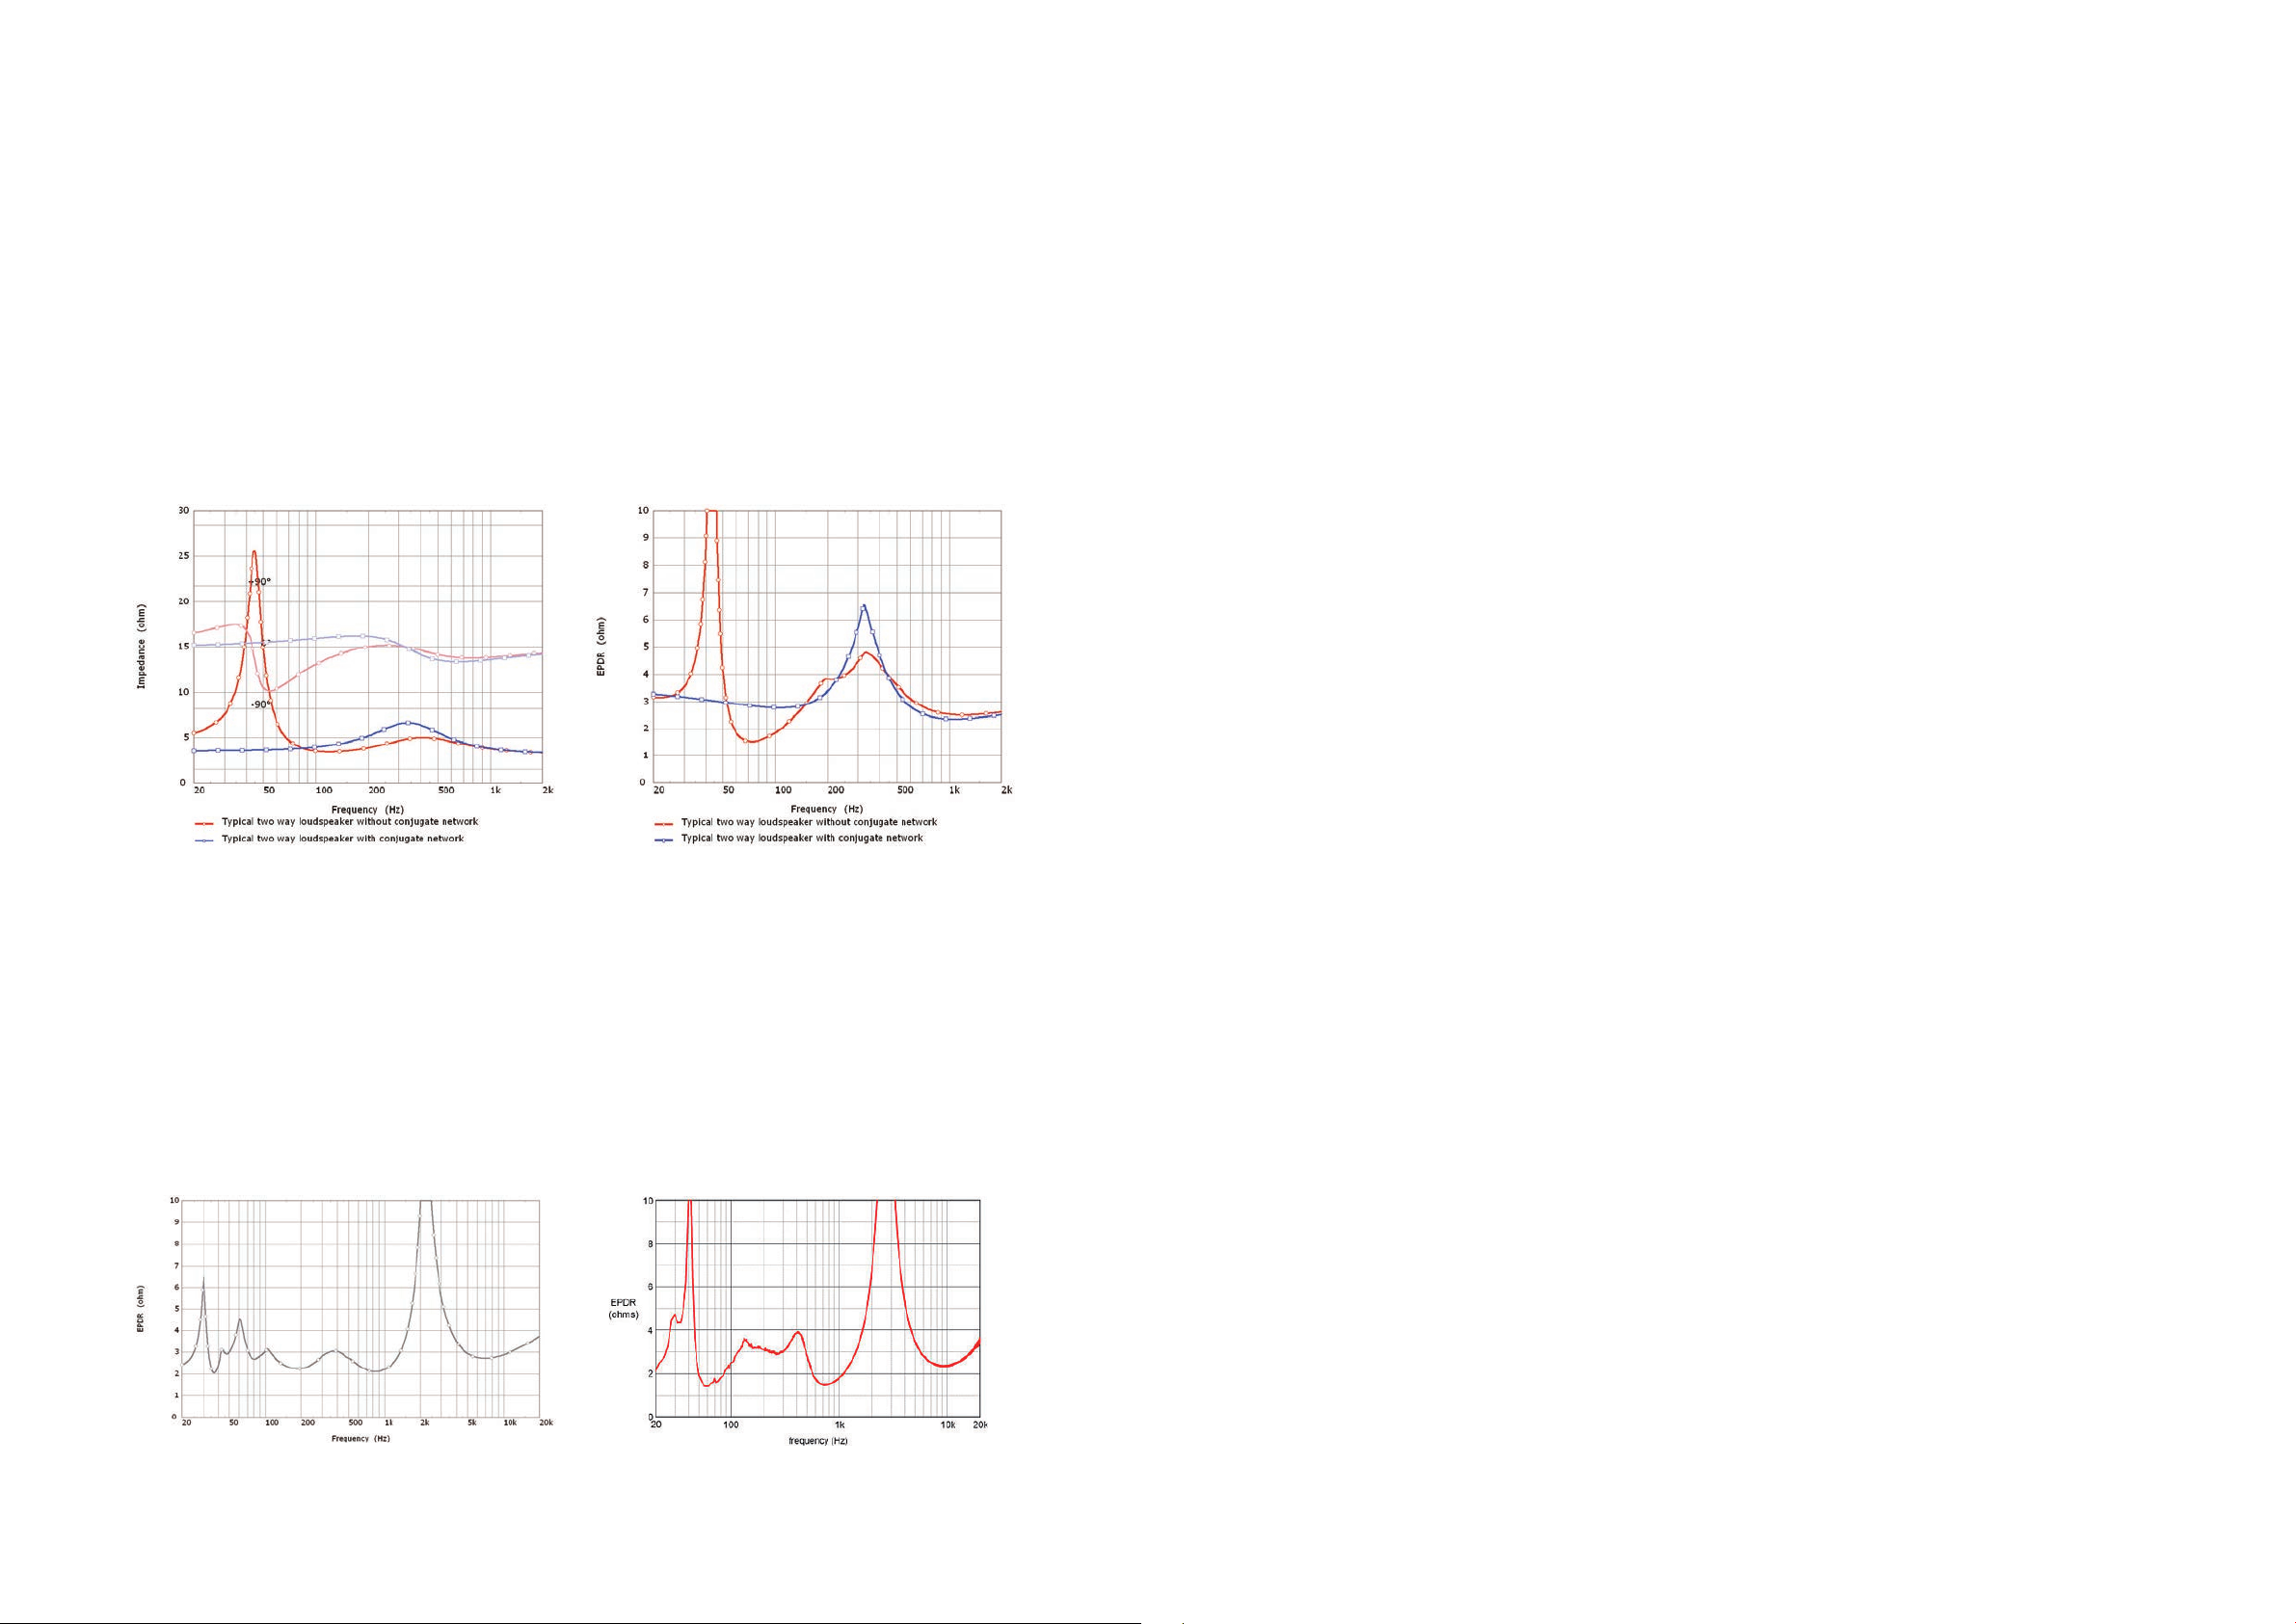
5 Voicing the loudspeakers
version with the conjugate network is lower at 60Hz
whereas the version without a conjugate network has
a signi cantly higher impedance phase angle. Another
approach to looking at the impedance data has been
suggested by Keith Howard [16], based on the work of
Benjamin [17]. This approach presents the equivalent
purely resistive load that would result in the same
peak power dissipation in the output stage of a class
B ampli er, thus combining impedance magnitude and
phase into one gure of merit. This measure is called
the “equivalent peak dissipation resistance” (EPDR),
plotted in Figure 64 for the same two loudspeakers.
From this plot it is clear that the loudspeaker without
the conjugation network is a significantly more
di cult load to drive. Not only does this mean that a
loudspeaker with impedance conjugation may be used
with a wider range of amplifiers, but it also means
that the loudspeaker will perform better with any
given ampli er because less power is dissipated in the
ampli er output stage in trying to drive the awkward
load.
The crossovers were initially designed from measured
responses of the individual drivers mounted in the
nal enclosure and based on the underlying approach
outlined in section 4.5. Listening tests were used
extensively to arrive at the nal design for each model.
The listening sessions for the early prototype
loudspeakers spanned several months and involved
a large number of experienced KEF personnel, each
with their own personal music tastes and preferences.
The listening process is very much integrated with the
technical engineering. Concerns raised during listening
were rigorously investigated using various measurement
techniques to try and identify any underlying physical
cause. In numerous cases a clear correlation was found
between objective data and subjective conjecture. This
approach, though time consuming, is very effective.
When issues are raised during listening it is often
tempting to immediately change the loudspeaker
voicing in an attempt to improve the loudspeaker’s
character. However, if an underlying problem exists
then it will remain unresolved and the loudspeaker’s
balance will be compromised in order to disguise it.
Particular attention was paid to the component
selection and the crossover layout. The short-listed
components following the component distortion
measurements described in section 4.5.1 were
individually auditioned to ensure they did not limit
the perceived sound quality. The capacitors for the
higher-frequency section are vibration damped with
mastic, to prevent sonic deterioration due to vibration.
The crossovers are split into two different circuit
boards and mounted apart from one another inside
the loudspeaker. The crossover circuit boards are
decoupled from the cabinet walls to minimise vibration
transfer to the components. Each board only contains
three inductors in order that they can be oriented in
perpendicular planes to minimise cross talk.
Gratifyingly, as this systematic procedure progressed
the preferred subjective performance merged with the
balance that gave the best objective measurements. In
particular the lowest distortion and the smoothest and
attest on and o -axis frequency response.
Figure 64. a. Typical closed-box two-way loudspeaker system electrical input impedance with and without a conjugate network in the crossover (left).
There is also a clear disadvantage to using impedance
conjugation networks and that is that the number of
components in the crossover is increased signi cantly.
b. Equivalent Peak Dissipation Resistance for the same two systems (right).
approach it is possible to bene t from the advantages
described above while not adding too many additional
components to the crossover.
The impact of this is that there is more opportunity for
the crossover to generate artefacts and distortion into
the signal. For The Reference impedance conjugation
has been used selectively where necessary to control
the crossover to loudspeaker interface and to ensure
that the loudspeaker load is reasonable for a good
The result is a good balance between the different
compromises whilst still retaining a relatively easy load
for the ampli er. The EPDR of an early prototype of
Reference 5 is shown in Figure 65 below in comparison
to a competitor loudspeaker.
quality amplifier. By selective application of this
36
Figure 65. EPDR of Reference 5 prototype system (left) compared to competitor loudspeaker.
37
Page 22
6 Summary
The Reference has been developed with a strong
belief that the only way to design a truly exceptional
loudspeaker is through rigorous engineering and
attention to detail. The strength and depth of the
methods described in this paper give just a small
window into the meticulous approach necessary to
achieve best possible performance.
Loudspeaker design is a great challenge for the engineer,
uniquely combining several di erent interacting physical
mechanisms. Allied to this is the astonishing sensitivity
of the auditory system, which dictates the loudspeaker
must have an extremely wide bandwidth, high dynamic
range, exceptional linearity and controlled dispersion.
There are few other devices that require the same level
of ne control over the behaviour of physically moving
parts. This complexity perhaps explains why “state of
the art” in loudspeakers is still advancing despite being a
90-year-old discipline.
Judgement and compromise are a large part of the
loudspeaker engineer’s skills. It is often the case that
the pursuit of one particular performance aspect is to
the detriment of another. It is only with experience and
technical innovation that the optimum operating points
can be found. KEF has a long history of innovation and
acoustic technology development, and this is the critical
foundation to the development of this range.
The result is a range of loudspeakers that are
themselves with little identifiable character, “without
drama, without exaggeration, without artifice”, such
that the focus of the listener falls solely upon the music.
38
Page 23
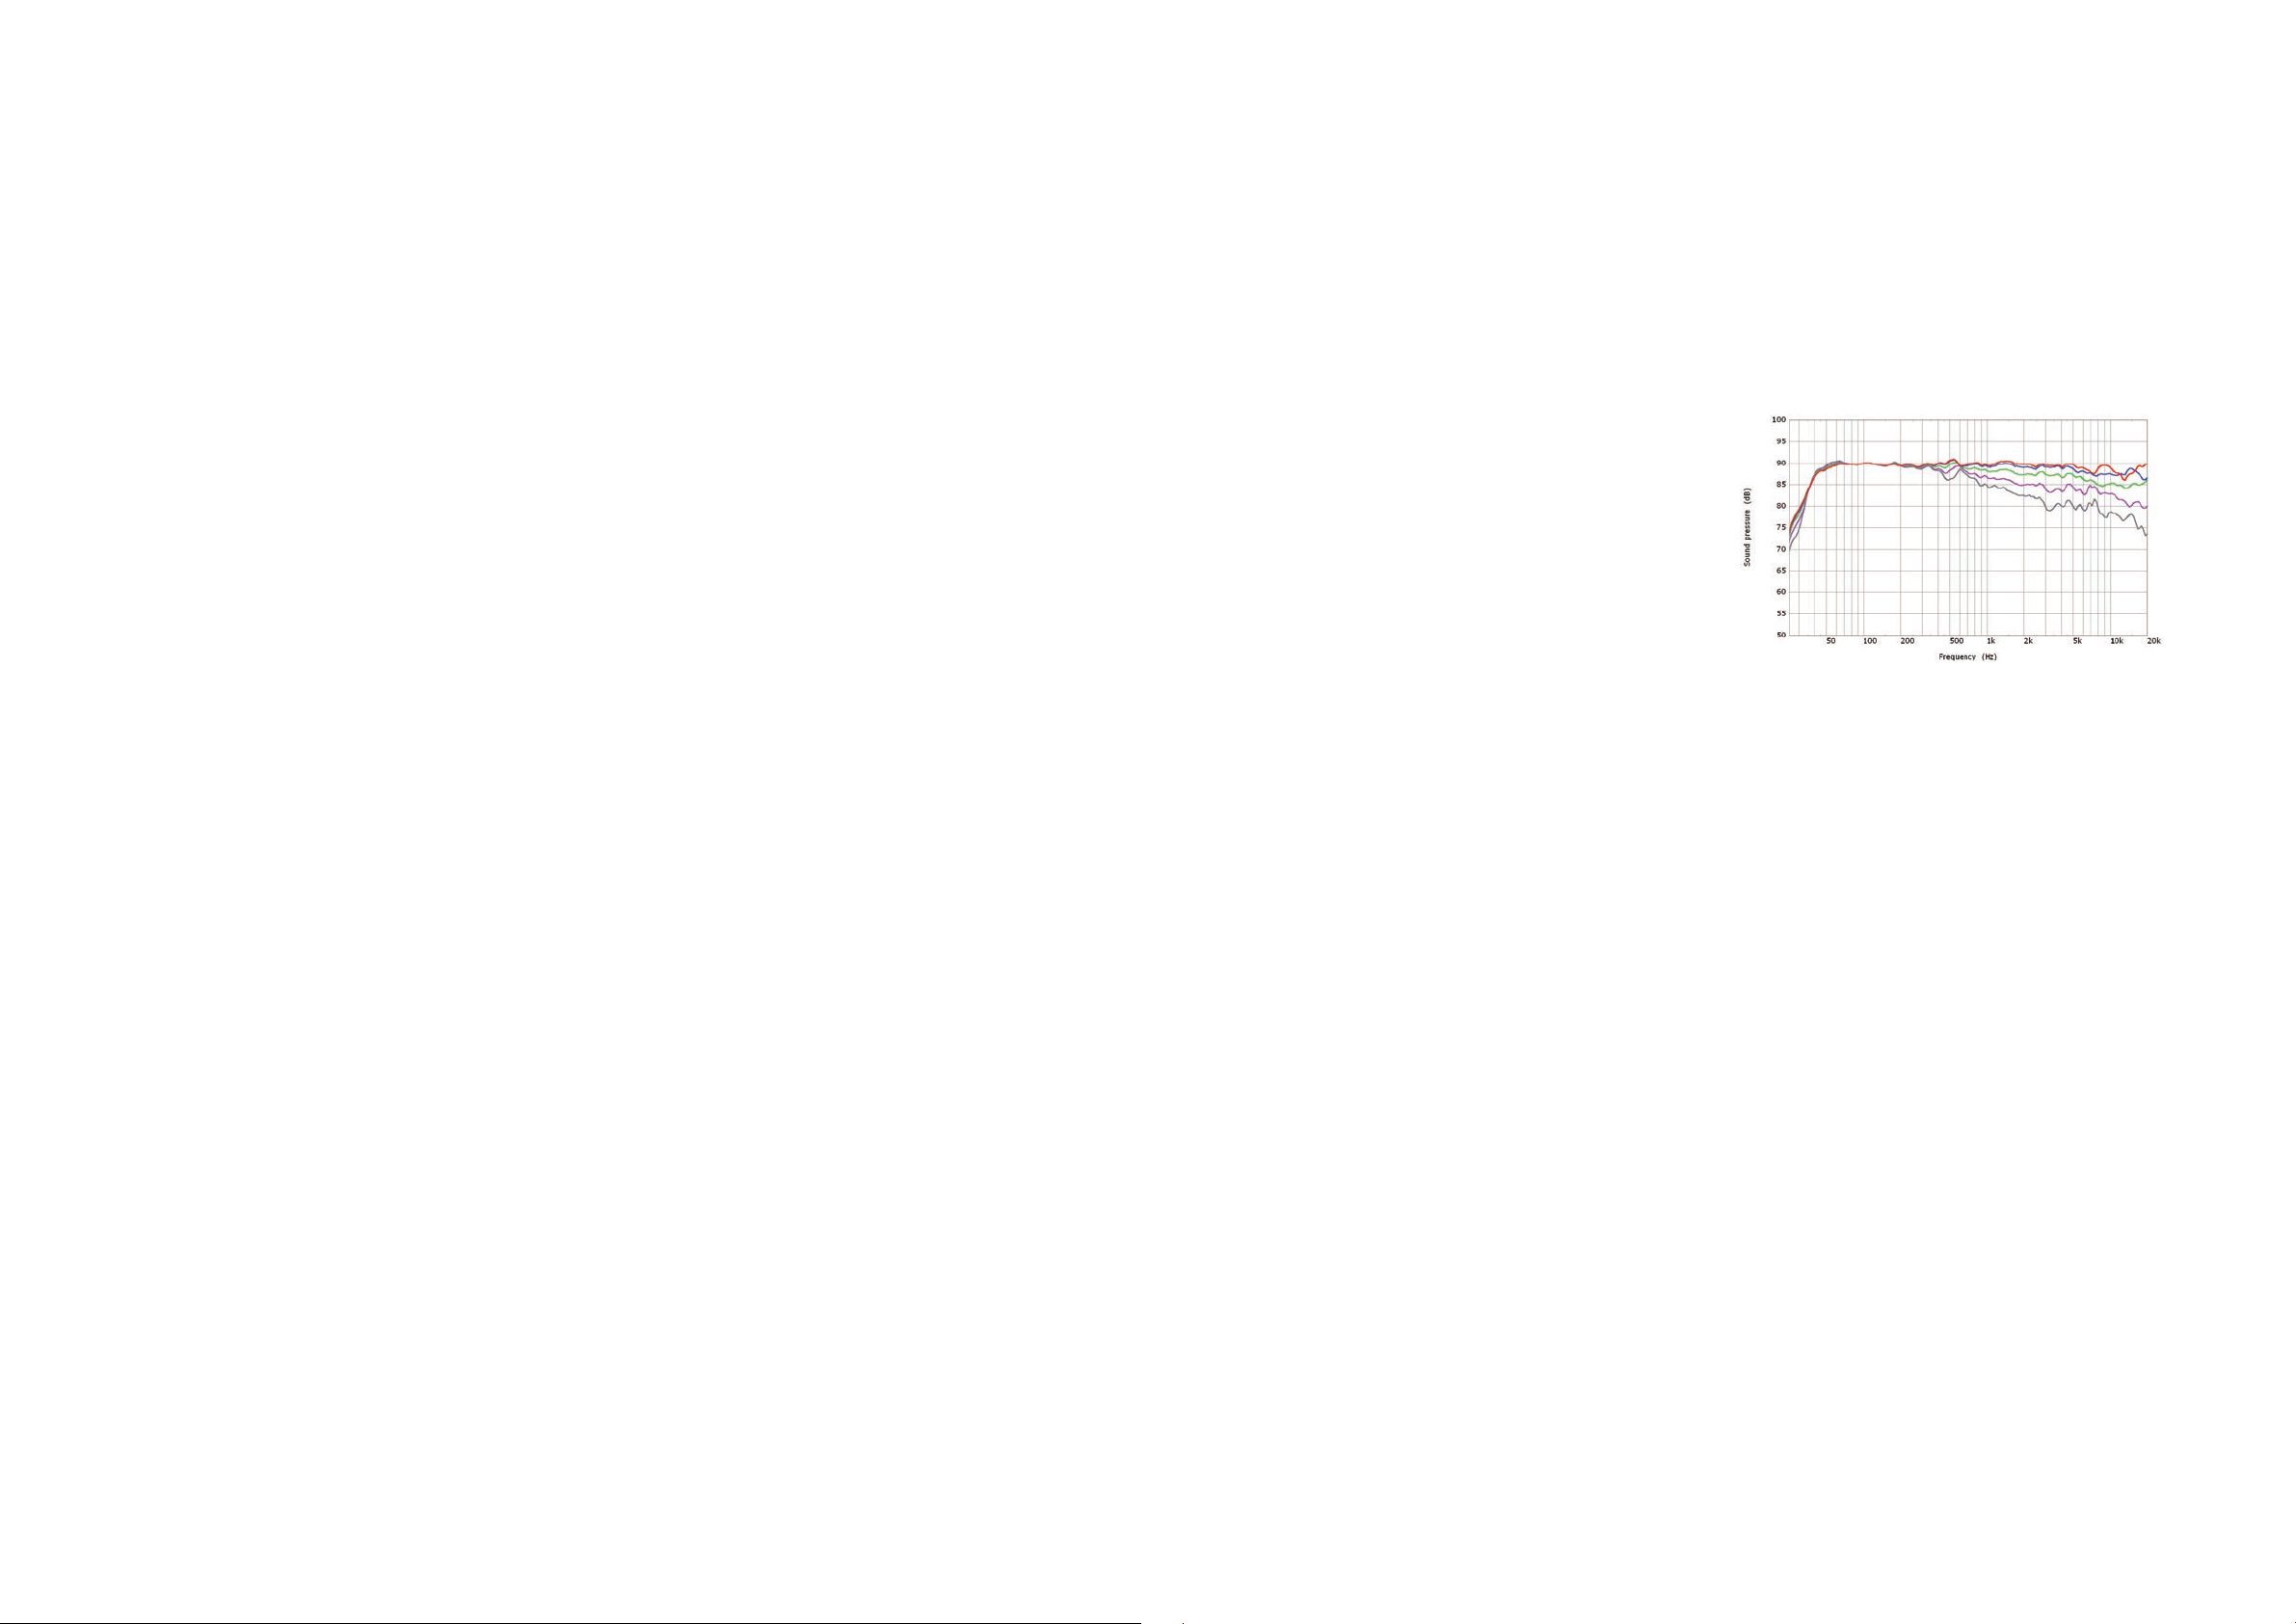
7 References
Appendix I. Uni-Q
[1]
N. Thiele, “Loudspeakers in Vented Boxes: Part 1,”
J. Audio Eng. Soc., vol. 19, no. 5, pp. 382–392, May
1971.
[2]
N. Thiele, “Loudspeakers in Vented Boxes: Part 2,”
J. Audio Eng. Soc., vol. 19, no. 19, pp. 471–483, Jun.
1971.
[3]
R. H. Small, “Closed-Box Loudspeaker Systems
Part I: Analysis,” J. Audio Eng. Soc., vol. 20, no. 10,
pp. 798–808, Dec. 1972.
[4]
R. H. Small, “Vented-Box Loudspeaker Systems-
Part 1: Small-Signal Analysis,” J. Audio Eng. Soc., vol.
21, no. 5, pp. 363–372, Jun. 1973.
[5]
J. A. D’Appolito, “A Geometric Approach
to Eliminating Lobing Error in Multiway
Loudspeakers,” in Audio Engineering Society
Convention 74, 1983.
[6]
H. F. Olsen, Acoustical Engineering (reprint).
Professional Audio Journals Inc., 1991.
[7]
J. Borwick, Loudspeaker and headphone handbook.
Oxford; Boston: Focal Press, 2001.
[8]
M. Colloms, High Performance Loudspeakers, 5th
Edition. John Wiley & Sons, 1997.
[9]
F. E. Toole, “Loudspeaker Measurements and
Their Relationship to Listener Preferences: Part 1,”
J. Audio Eng. Soc., vol. 34, no. 4, pp. 227–235, Apr.
1986.
[10]
F. E. Toole, Sound reproduction loudspeakers and
rooms. Amsterdam; Boston: Elsevier, 2008.
[11]
A. Salvatti, A. Devantier, and D. J. Button,
“Maximizing Performance from Loudspeaker
Ports,” J. Audio Eng. Soc., vol. 50, no. 1/2, pp. 19–
45, Jan. 2002.
[12]
M. Dodd, “The Development of the KEF LS50,
a Compact Two Way Loudspeaker System,”
presented at the Audio Engineering Society
Conference: 51
Loudspeakers and Headphones, 2013.
[13]
A. Rimell and M. J. Hawksford, “Digital-Crossover
Design Strategy for Drive Units with Impaired and
Noncoincident Polar Characteristics,” presented
at the Audio Engineering Society Convention 95,
1993.
st
International Conference:
[14]
P. G. Craven, “Antialias Filters and System
Transient Response at High Sample Rates,” J. Audio
Eng. Soc., vol. 52, no. 3, pp. 216–242, Mar. 2004.
[15]
N. Thiele, “Loudspeaker Crossovers with Notched
Responses,” presented at the Audio Engineering
Society Convention 108, 2000.
[16]
K. Howard, “Heavy Load: How Loudspeakers
Torture Ampli ers.” .
[17]
E. Benjamin, “Audio Power Amplifiers for
Loudspeaker Loads,” J. Audio Eng. Soc., vol. 42, no.
9, pp. 670–683, Sep. 1994.
[18]
M. Dodd and J. Oclee-Brown, “New Methodology
for the Acoustic Design of Compression Driver
Phase Plugs with Concentric Annular Channels,” J.
Audio Eng. Soc., vol. 57, no. 10, pp. 771–787, Oct.
2009.
[19]
M. Dodd and J. Oclee-Brown, “A New
Methodology for the Acoustic Design of
Compression Driver Phase Plugs with Radial
Channels,” in The 125
2008.
[20]
M. Dodd, “Optimum Diaphragm and Waveguide
Geometry for Coincident source Drive Units,” in
The 121
st
Convention of the AES, 2006.
th
Convention of the AES,
Of the many landmark innovations KEF has pioneered,
arguably the greatest of all is the Uni-Q® point source
driver array, with its outstanding acoustic clarity and
off-axis dispersion. Through continuous innovation
and development since 1988, the Uni-Q driver array
achieves a level of sound quality over a broad area
simply not achieved from conventional speakers.
Sounds come at you so naturally that it seems as if the
musicians or actors are actually there in front of you.
Whether you are in the centre of the room or o to
one side, recordings sound real and convincing. Uni-Q
achieves this because, unlike conventional speakers, the
sound that is critical to the experience comes from the
same point in space, and is produced in a controlled
and continuous way over the whole audio range.
It is not easy to produce a convincing and realistic
illusion of a live performance because the sound from
a high quality loudspeaker does not come from a single
source, or drive unit. Two or more units are required
to faithfully reproduce the entire audio spectrum from
the low bass produced by a concert organ or a cinema
explosion, to the delicate nuances of the human voice
in the midrange right up to the shimmering treble of
cymbals. Most loudspeakers have the midrange and
treble drive units mounted one above the other, so
the sound is coming from two di erent places, causing
audio ‘confusion’ and losing the chance of achieving
a truly natural sound. With Uni-Q, the midrange and
treble units are mounted at precisely the same point in
space – allowing them to integrate perfectly and create
the ideal sound field for the listener to experience a
convincingly natural sound.
I.I. Acoustical point source
It has been well known for many years in the audio
industry that one of the ideal forms for a loudspeaker
is the ‘point source’- where all the sound is radiated
from the same point in space. To do this, the drive
units (for example, the bass and treble units in a
two-way system) need to be mounted so that their
acoustic centres are at the same place. The problem in
achieving this was the sheer physical size of the treble
unit, which prevented it from fitting in the centre of
the bass unit. Various forms of co-axial units emerged
where the tweeter was mounted either in front of or
behind the acoustic centre of the bass unit but these
have signi cant drawbacks. The key to the invention of
Uni-Q was the arrival on the market of a new magnetic
material called Neodymium-Iron-Boron, which has ten
times the magnetic strength of a conventional ferrite
magnet. This material allowed a high sensitivity treble
unit to be made small enough to fit within the voice
coil diameter of a typical bass unit and so be placed
at the precise point where the acoustic sources are
‘coincident’.
Figure 66. On and o -axis response curves of a well designed Uni-Q system.
With the acoustic centres at the same point in space
the acoustic outputs of the bass and treble units are
‘time-aligned’ in all directions allowing the designer to
achieve perfect integration between the units not just
on one axis, as is the situation with vertically separated
units, but in all directions. The rst advantage of Uni-Q,
therefore, is the lack of the vertical interference pattern
of separated bass and treble units, which restricts the
region of high quality sound output to only +/- 10
degrees above and below the principle axis. This same
e ect not only limits the vertical listening area but also
produces a dip in the total energy output in the bass/
treble crossover region, causing a distortion of the
reverberant energy in the listening room. In Uni-Q
systems this e ect is completely eliminated.
I.II. Matched Directivity
The second advantage of Uni-Q is what we call
‘matched directivity’. With the treble unit mounted at
the centre of the bass driver’s cone, its directivity (the
spread of sound away from the main axis) is governed
by the angle of the cone, which also largely determines
the directivity of the bass driver. So with the coincident
mounting of the two units, the directivity of the treble
unit is adjusted to be virtually the same as that of
the bass driver. As a listener moves away from the
main axis, the output of the treble unit falls off at
approximately the same rate as that of the bass unit,
thus improving the uniformity of tonal balance across
40
41
Page 24
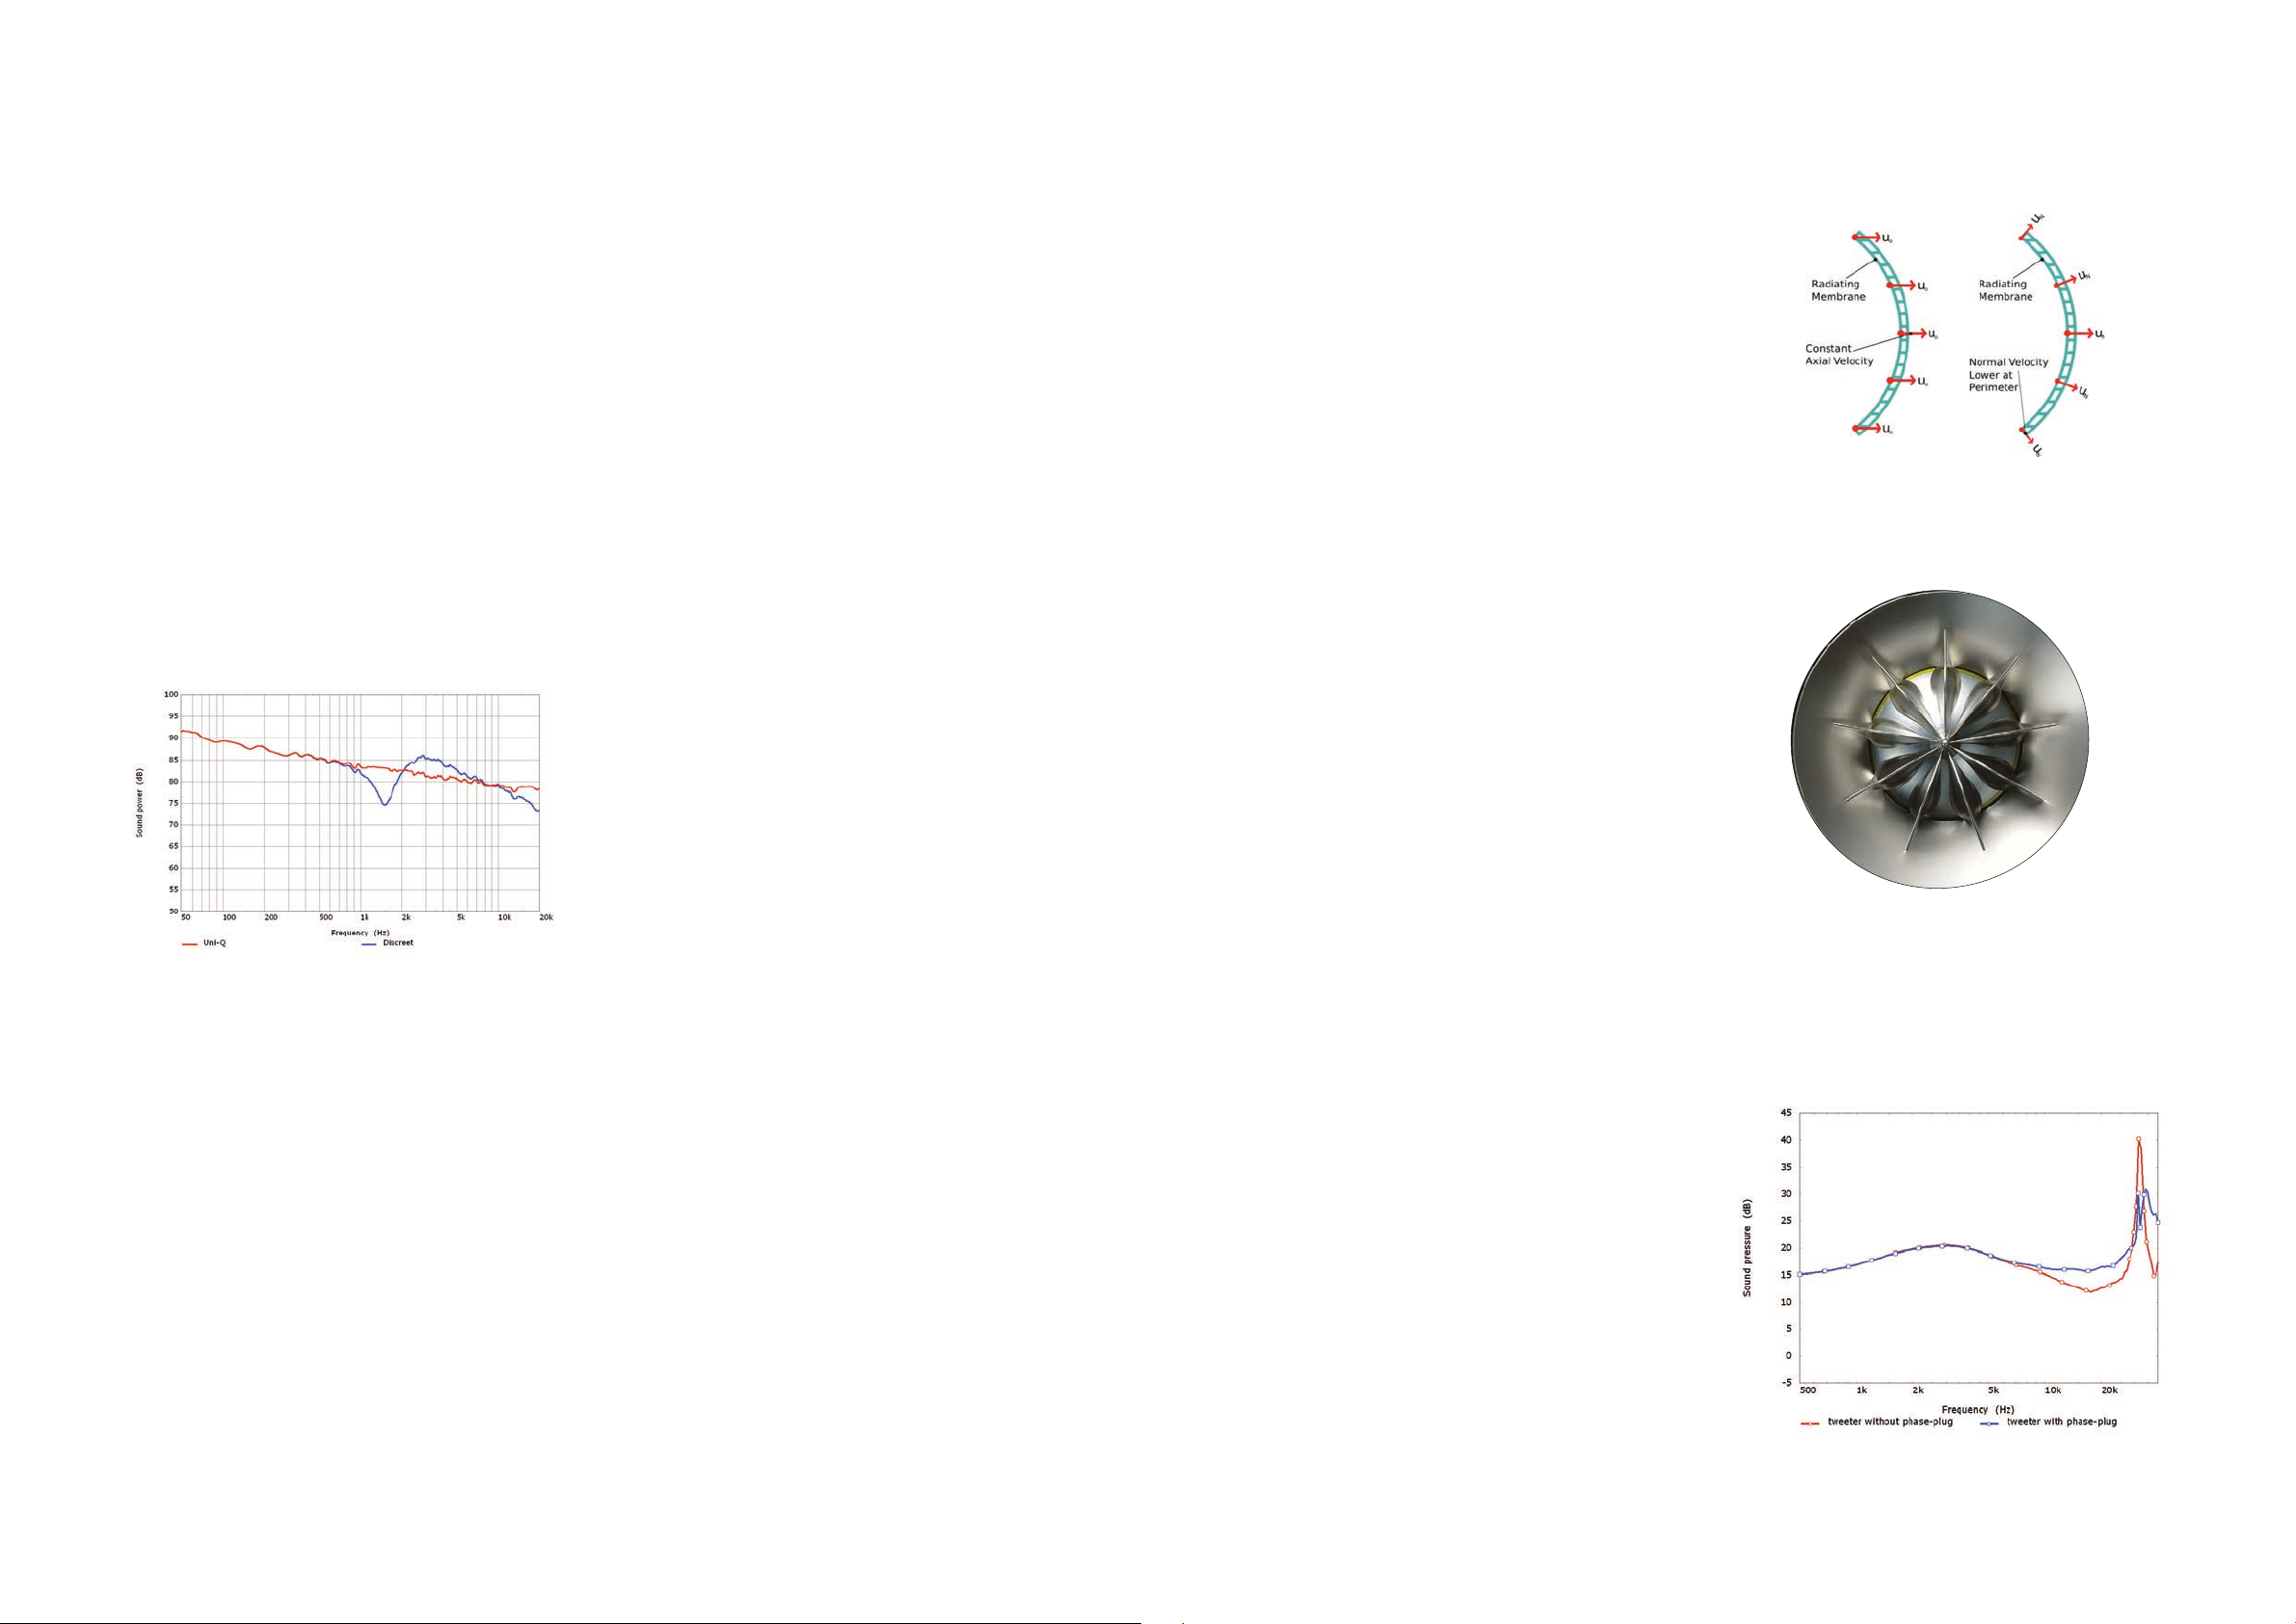
Appendix II. Tangerine waveguide
the listening area, and improving the off-axis stereo
imaging. The listener is not, therefore, as limited to a
central ‘sweet-spot’ as with conventional speakers. And,
of course, the same is also happening in the vertical
plane, so the reverberant energy in the listening room
maintains an even balance, adding realistic ambience to
the sound without introducing tonal colorations. The
directivity is often referred to in engineering terms as
the ‘Q’, and the ‘Unifying’ of the ‘Q’ gives rise to the
name ‘Uni-Q.
From a listener’s perspective, the combination of the
matched directivity and precise time alignment in all
directions gives significantly improved stereo imaging
over a wide listening area, the realism of which is
enhanced by the even balance of the reverberant
energy within the listening room.
The Tangerine Waveguide is a patented KEF Technology
which is now used in a number of products throughout
the range. The technology was developed following
research work into compression drivers, which are
used in high power systems for concerts [18].
Compression drivers are very susceptible to acoustic
resonances which occur in front of the tweeter dome.
Whilst looking into the behaviour of compression
drivers in detail, it was realised that the source of these
acoustic resonances is also present in a normal direct
radiating tweeter. The Tangerine Waveguide is designed
to compensate for these problems, improving the
coupling between the tweeter dome and the air [19].
As illustrated in Figure 68, because the dome moves in
one direction, in reaction to the force from the motor
system, the surface normal velocity at towards the
dome perimeter is smaller. This is because the dome
surface here is at an angle compared to the direction
of motion. Ideally the surface normal velocity would
be the same over the entire dome surface. This ideal
behaviour is not possible because it would require the
dome surface to stretch. The Tangerine Waveguide
acts like an acoustic lens to adapt the surface velocity
of the dome to the correct acoustic wave front to
propagate in the Uni-Q waveguides.
Figure 68. Comparison of tweeter dome axial and surface normal velocity.
Figure 67. Comparison of power response of a Uni-Q and discreet loudspeaker system.
With the Tangerine in place, the tweeter dispersion is
improved at the very top of the audio band and the
sensitivity is increased. The sensitivity increase is due to
improved impedance matching between the mechanical
and acoustical systems.
Figure 69. Tangerine waveguide in position on top of tweeter dome.
Figure 70. Simulated 1m axis pressure response of thet weeter when driven with
a constant unit harmonic acceleration with and without Tangerine
waveguide.
42
43
Page 25
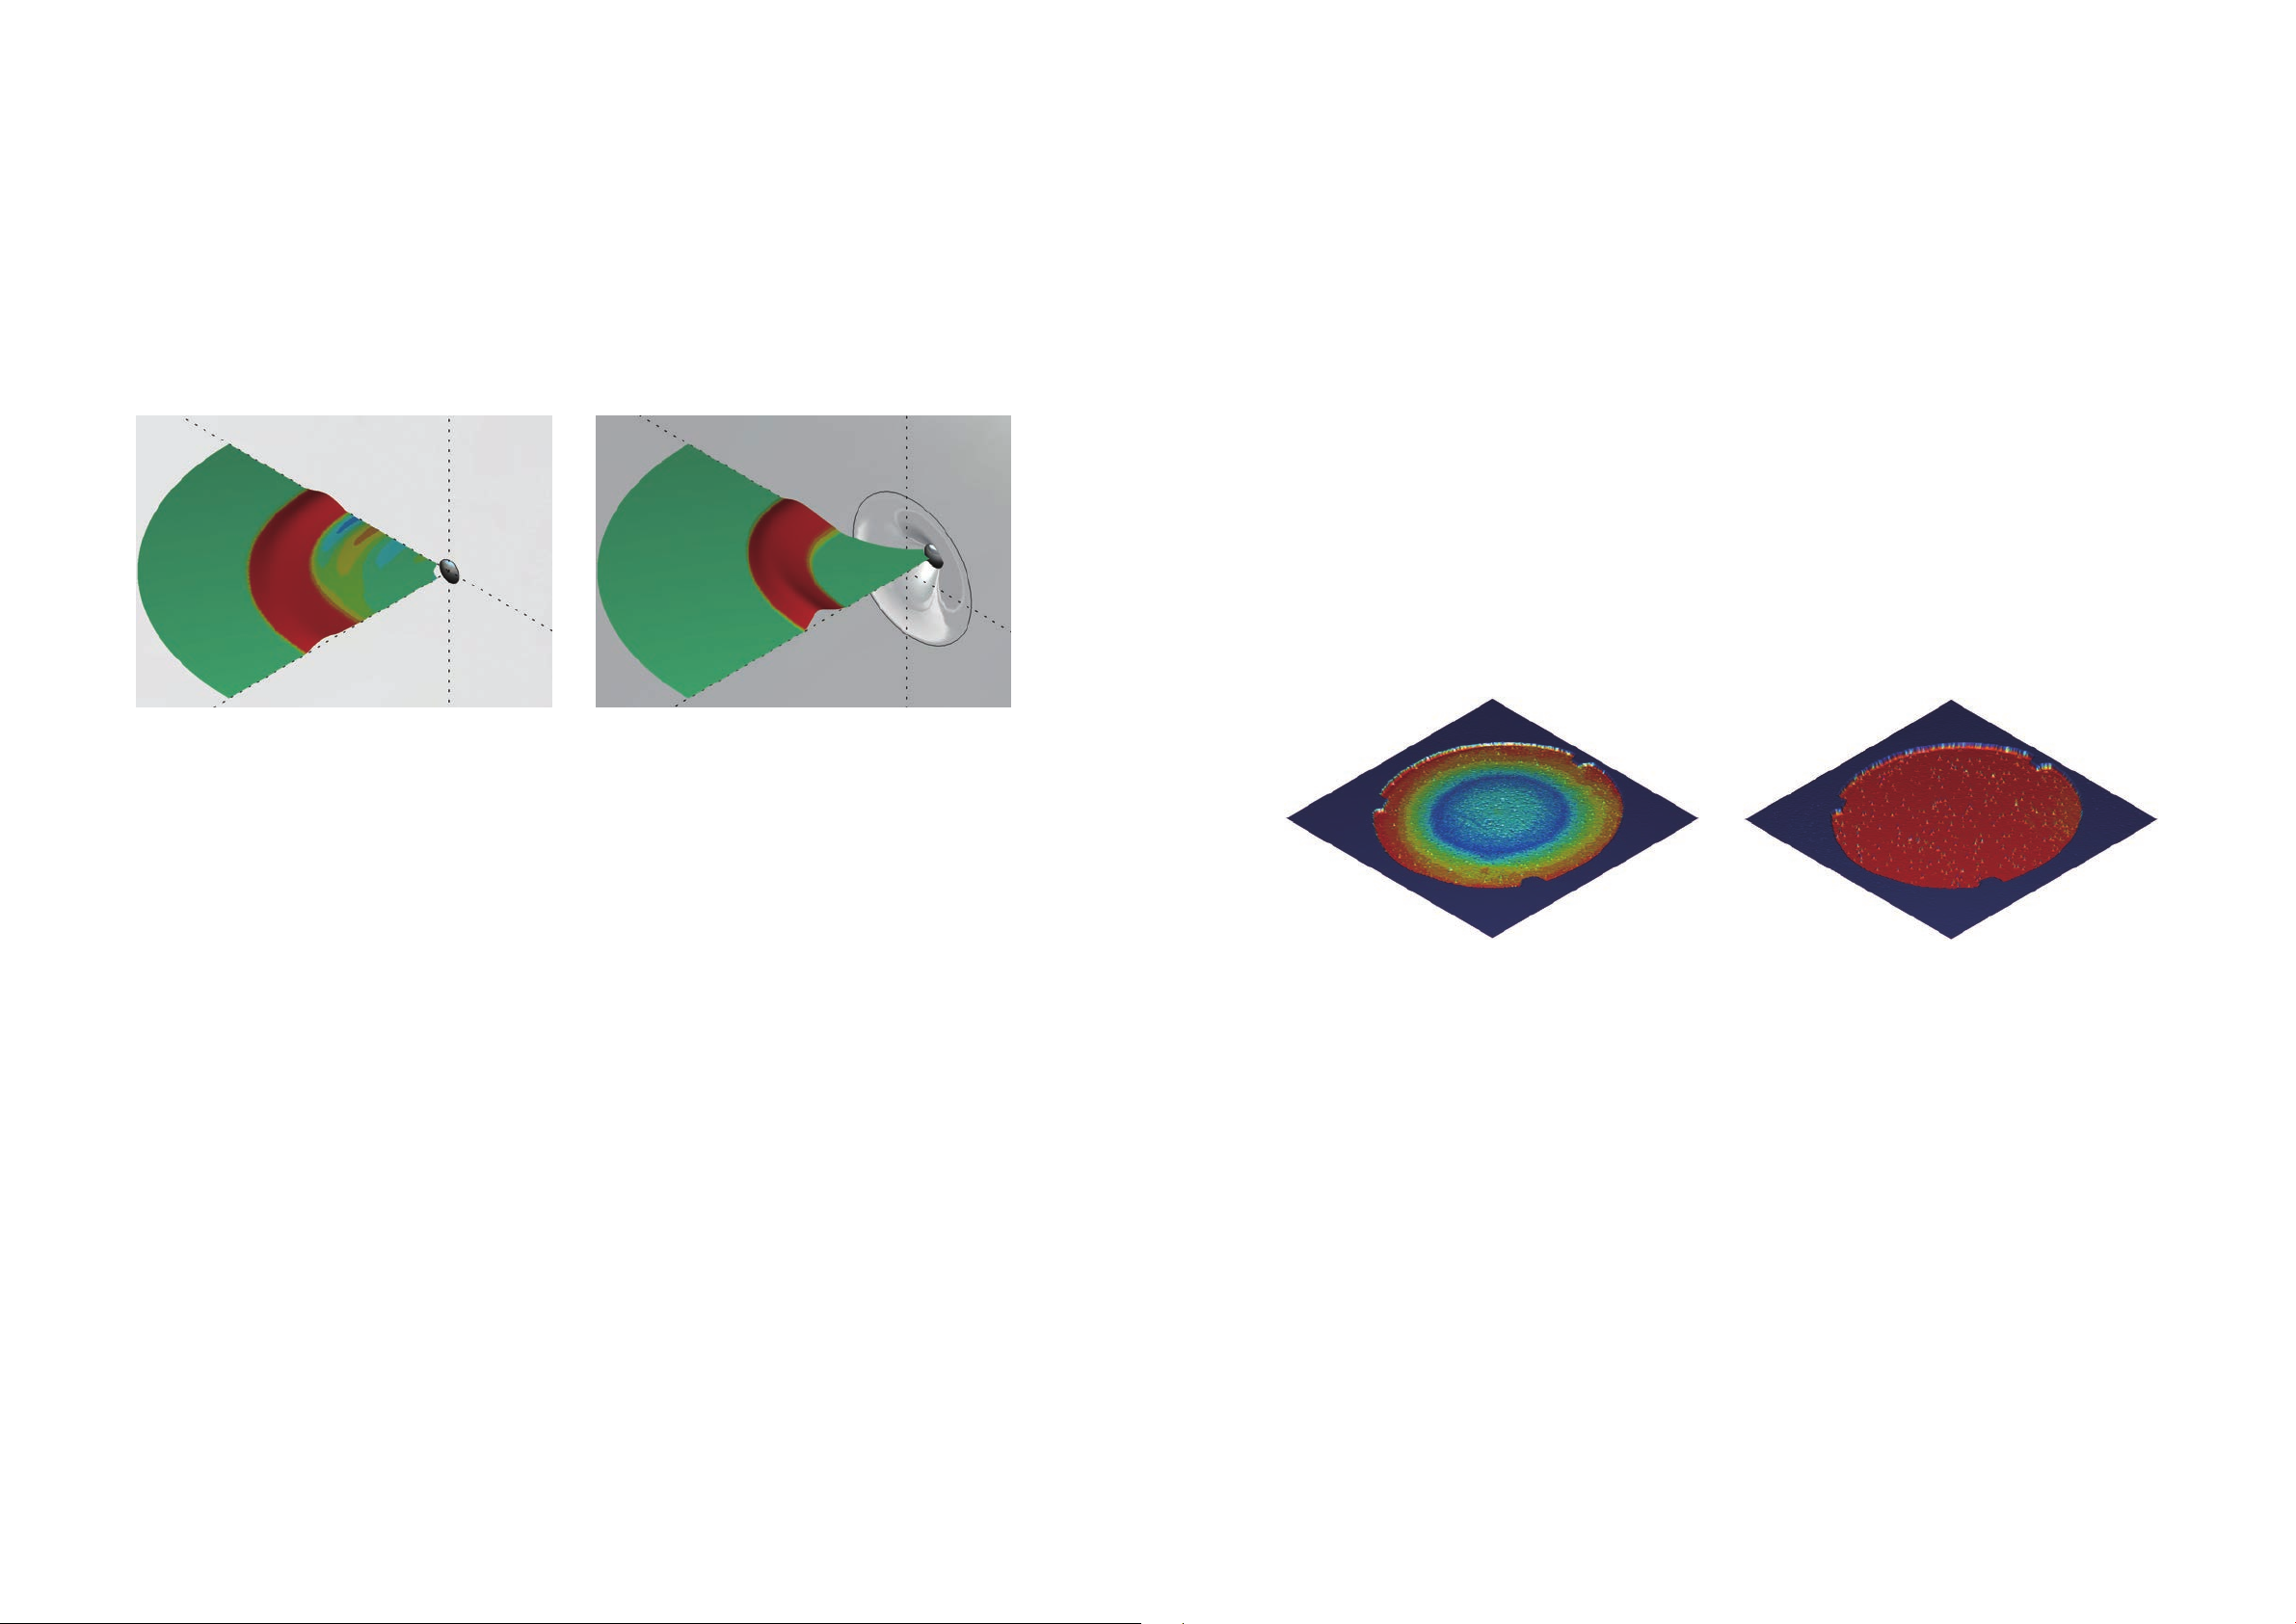
Appendix III. Optimal dome shape
Appendix IV. Sti ened dome
It is a common misconception in audio that the perfect
environment for a tweeter is a plain at ba e and that
any waveguide or discontinuity will always degrade the
performance even if carefully designed. Recent work by
KEF engineers has shown this not to be the case [20].
Figure 71. Comparison of a HF transient radiated by a conventional 25mm dome on ba e (left) and an optimally shaped 25mm dome in a waveguide (right).
In fact, if exactly the right shape of dome and
waveguide are used together their combined
performance can beat the conventional ideal of tweeter
in at ba e. This is a KEF patented technology.
When a tweeter is designed for use in a Uni-Q driver
array the shape of the dome must be set for optimum
acoustic performance, as discussed in Appendix III.
However, the acoustics is only half of the story; to
achieve the highest possible level of performance the
dome must be carefully constructed mechanically to
remain as rigid as possible.
The tweeter dome is constructed from extremely thin
aluminium. Aluminium is chosen as it has a remarkably
high stiffness combined with very low density. This
is important for the tweeter dome because for best
performance the dome must move rigidly without
deforming even at and above the highest frequencies
that we can hear. The highest frequency that a human
can hear is approximately 20,000Hz, this means that
we can hear sounds which repeat themselves as fast as
twenty thousand times a second. In order to move this
quickly the tweeter undergoes extremely high levels of
acceleration. At normal listening levels the tweeter hits
peak acceleration levels of around 10,000m/s2. This is
equivalent to 1000G of acceleration - more than 300
times that experienced during the launch of the Space
Shuttle.
At such high levels of acceleration it is extremely
difficult for the tweeter dome to remain rigid. The
inertia due to the mass of the dome material itself can
easily generate enough stress to deform the dome
during normal use. The acceleration of the dome
increases with frequency and ultimately there is a
maximum frequency above which the dome is unable
to remain rigid. The dome motion, including these
deformations, is too small to see with the naked eye
but it is possible to see them using a laser to record
and amplify the motion as shown below.
The soundfield in front of two tweeters has been
modelled using Finite Element Analysis, the results
are seen in Figure 71. A short pulse is sent to the
tweeters and the corresponding sound wave can be
seen radiating through the air. On the left is a model
of a simple dome tweeter in a baffle; on the right a
model of a dome tweeter and waveguide in the same
con guration found in the KEF Uni-Q. The dome and
waveguide model on the right uses the patented KEF
Optimum Dome and waveguide geometry. With the
tweeter mounted directly on the baffle the off axis
response shows irregularity. The version with the
waveguide does not show this irregularity.
This is because the solid boundaries of the waveguide
and baffle behave similarly to acoustical mirrors.
The waveguide and dome are arranged so that this
mirroring causes the dome to begin to behave similarly
to a pulsating spherical source. A pulsating spherical
source is the ideal radiator as it has a perfectly
omnidirectional dispersion. When used in conjunction
with the Tangerine Waveguide, the Uni-Q tweeter
approaches this acoustical ideal. The result is a tweeter
with a much wider dispersion and more consistent o
axis behaviour.
Figure 72. Laser vibrometer scan of a rigidly moving tweeter dome (right) and a exing tweeter dome (left)
IV.I. Optimum Geometry
Research work was carried out at KEF in the 1990s
to determine the dome shape that gave maximum
resistance to the acceleration force and hence
maximised the operational bandwidth. The study
concluded that the optimum shape for the dome was
an ellipse. In-fact, the optimum dome shape to resist
the acceleration forces and remain rigid is quite close to
the shape of the rounded end of a chicken egg. Using
this shape it is possible to improve the bandwidth that
a dome can be used over by around 75% compared
to a conventional dome shape. Unfortunately, recent
research work tells us that the optimum shape that we
require for the acoustics of the dome is a spherical cap
[20].
KEF research has resulted in two optimum shapes of
dome for di erent uses:
1. The elliptical shape, optimum for the mechanics
2. The spherical cap, optimum for the acoustics
44
45
Page 26
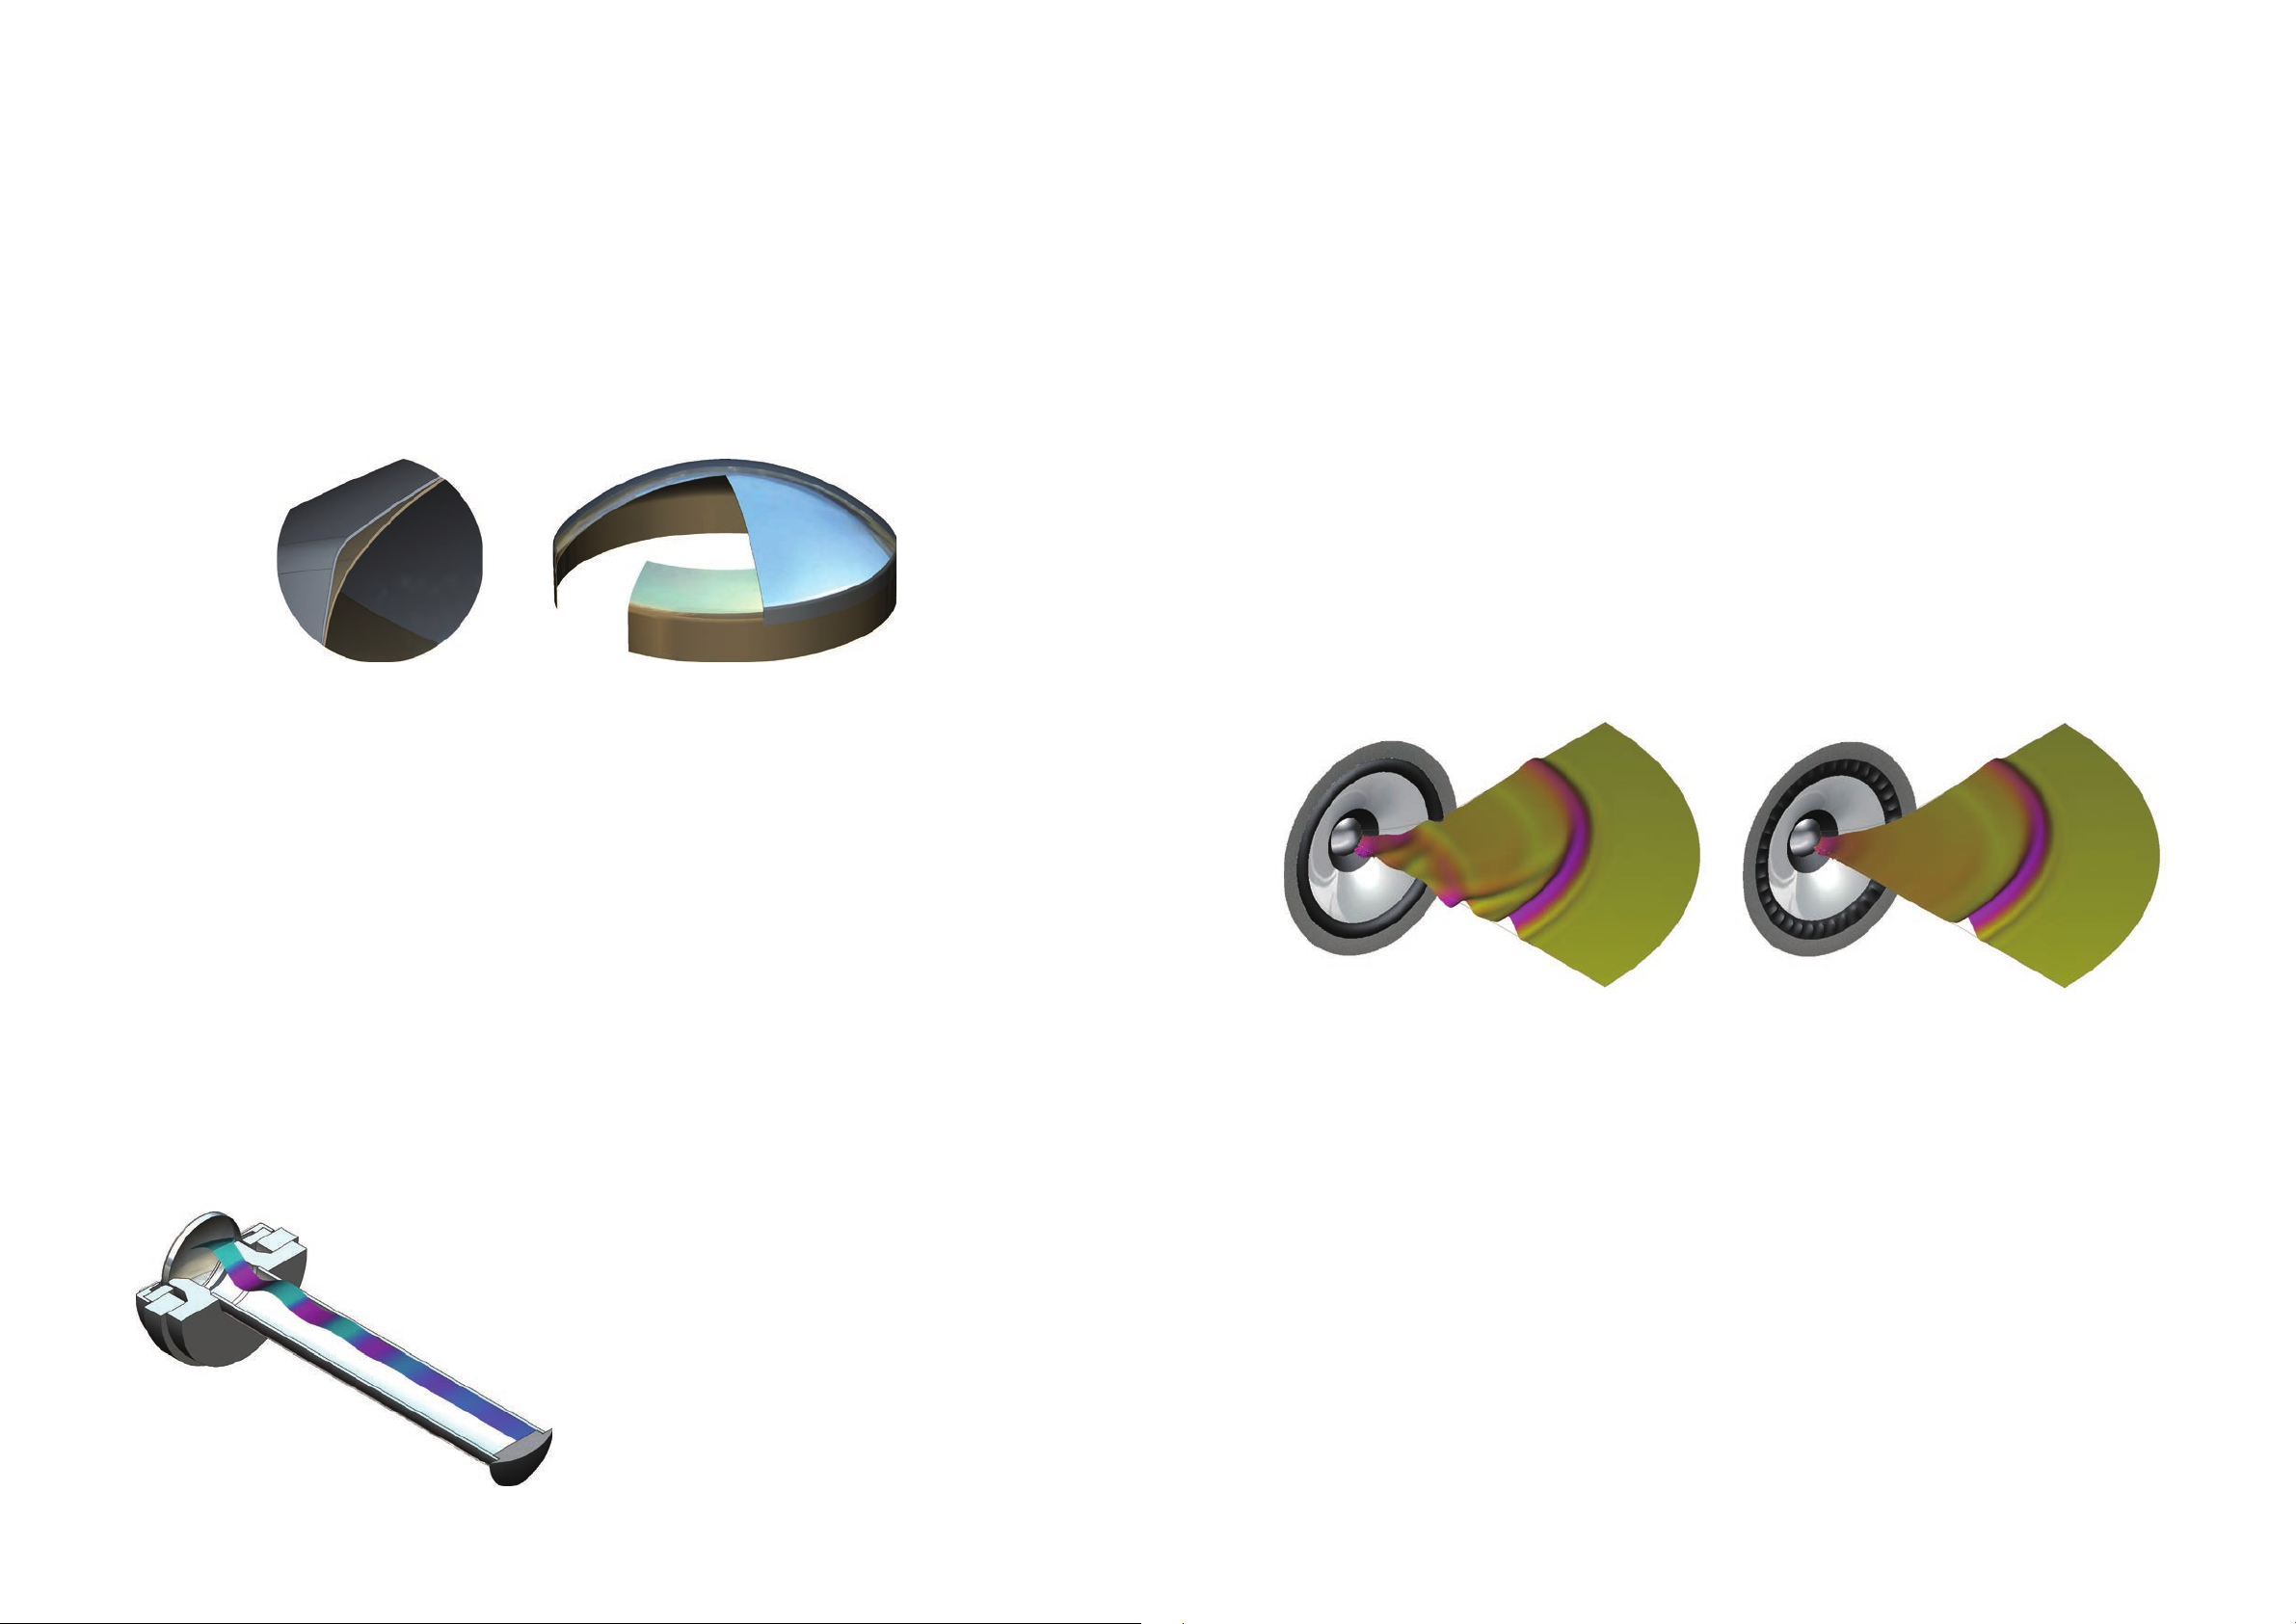
IV.II. The Solution
Appendix VI. Z- ex surround
The Stiffened Dome geometry enables both of
these optimum shapes to be used at the same time,
resulting in the best possible mechanical and acoustical
performance of dome. The Tweeter dome is made
from two parts: one elliptical, one a spherical cap.
These two shapes are superimposed, one placed on
top of the other, forming the patented KEF Stiffened
Dome.
Figure 73. 3D CAD sectional views of the tweeter dome and extended former that meet to form a triangular sti ening member at the dome edge. This patented technology is
the KEF sti ened dome.
At the edge of the dome the two shapes form a
triangle. The triangle is a fundamentally strong shape
and the edge of the dome is normally the weakest
part. Triangles are widely used in many engineering
structures because of their inherent strength. The
Stiffened Dome gives a far higher performance than
either the elliptical dome or the spherical cap shape
alone.
The surround is a critical component of any bass/
midrange driver. The designer must carefully choose the
material and shape so as to avoid irregularities in the
midband response due to resonance in the surround
whilst at the same time allowing sufficient excursion
of the cone in order to reproduce bass frequencies.
Most modern drivers use a half roll design typically
moulded from butyl rubber. The half-roll design can
often perform well if carefully designed, however, KEF’s
computer modelling techniques allow us to investigate
some more adventurous possibilities. The Z-Flex
surround is the result.
The Z-Flex Surround has a big impact on the high
frequency performance of the Uni-Q Driver Array.
Ideally, the Uni-Q tweeter would be in the throat
of a perfectly smooth waveguide. Under these
circumstances, provided the dome is correctly shaped,
the driver will give smooth hemispherical “point-source”
radiation and higher sensitivity than a tweeter in a at
ba e. Previous Uni-Q designs have used conventional
half roll surrounds but with this arrangement the ideal
situation is compromised. The waveguide created
by the cone and surround is not perfectly smooth:
it has an abrupt discontinuity at the surround. This
discontinuity causes di raction and secondary radiation
which smears the sound from the tweeter.
When the Z-Flex surround is mounted in the cabinet
and correctly trimmed it does not form a discontinuity
as a conventional surround does. In-fact, it creates a
close approximation to the ideal smooth waveguide.
The performance of the waveguide is extremely good
and very little di raction is generated.
Appendix V. Vented tweeter
The dome of a tweeter vibrates the air around it. In
front of the dome this vibration is propagated away
as sound. To the rear is an enclosed pocket of air.
If the enclosure is too small the air undergoes large
compressions and expansions. It will behave in a nonlinear manner and cause distortion. In a larger enclosure
the compressions and expansions are relatively small.
The air in this case will act as a linear spring and the
sound we hear will have much lower distortion.
The challenge is to design this enclosure in a way that
avoids standing wave resonance problems. The KEF
solution is to use a sealed narrow duct behind the
dome. Inside this duct acoustical damping material is
added in order to gently absorb the rearward wave
from the tweeter dome. The quantity and type of the
damping material is carefully ne tuned to give the best
possible absorption of the rear wave.
Figure 74 shows the behaviour of the tweeter vent.
Rear radiation from the dome travels down the duct
and is gently absorbed in the acoustic damping material.
Figure 75. FEA simulated tweeter impulse response with conventional surround (left) and with Z- ex surround (right).
46
Figure 74. FEA simulation of the air in the rear of the tweeter.
47
Page 27
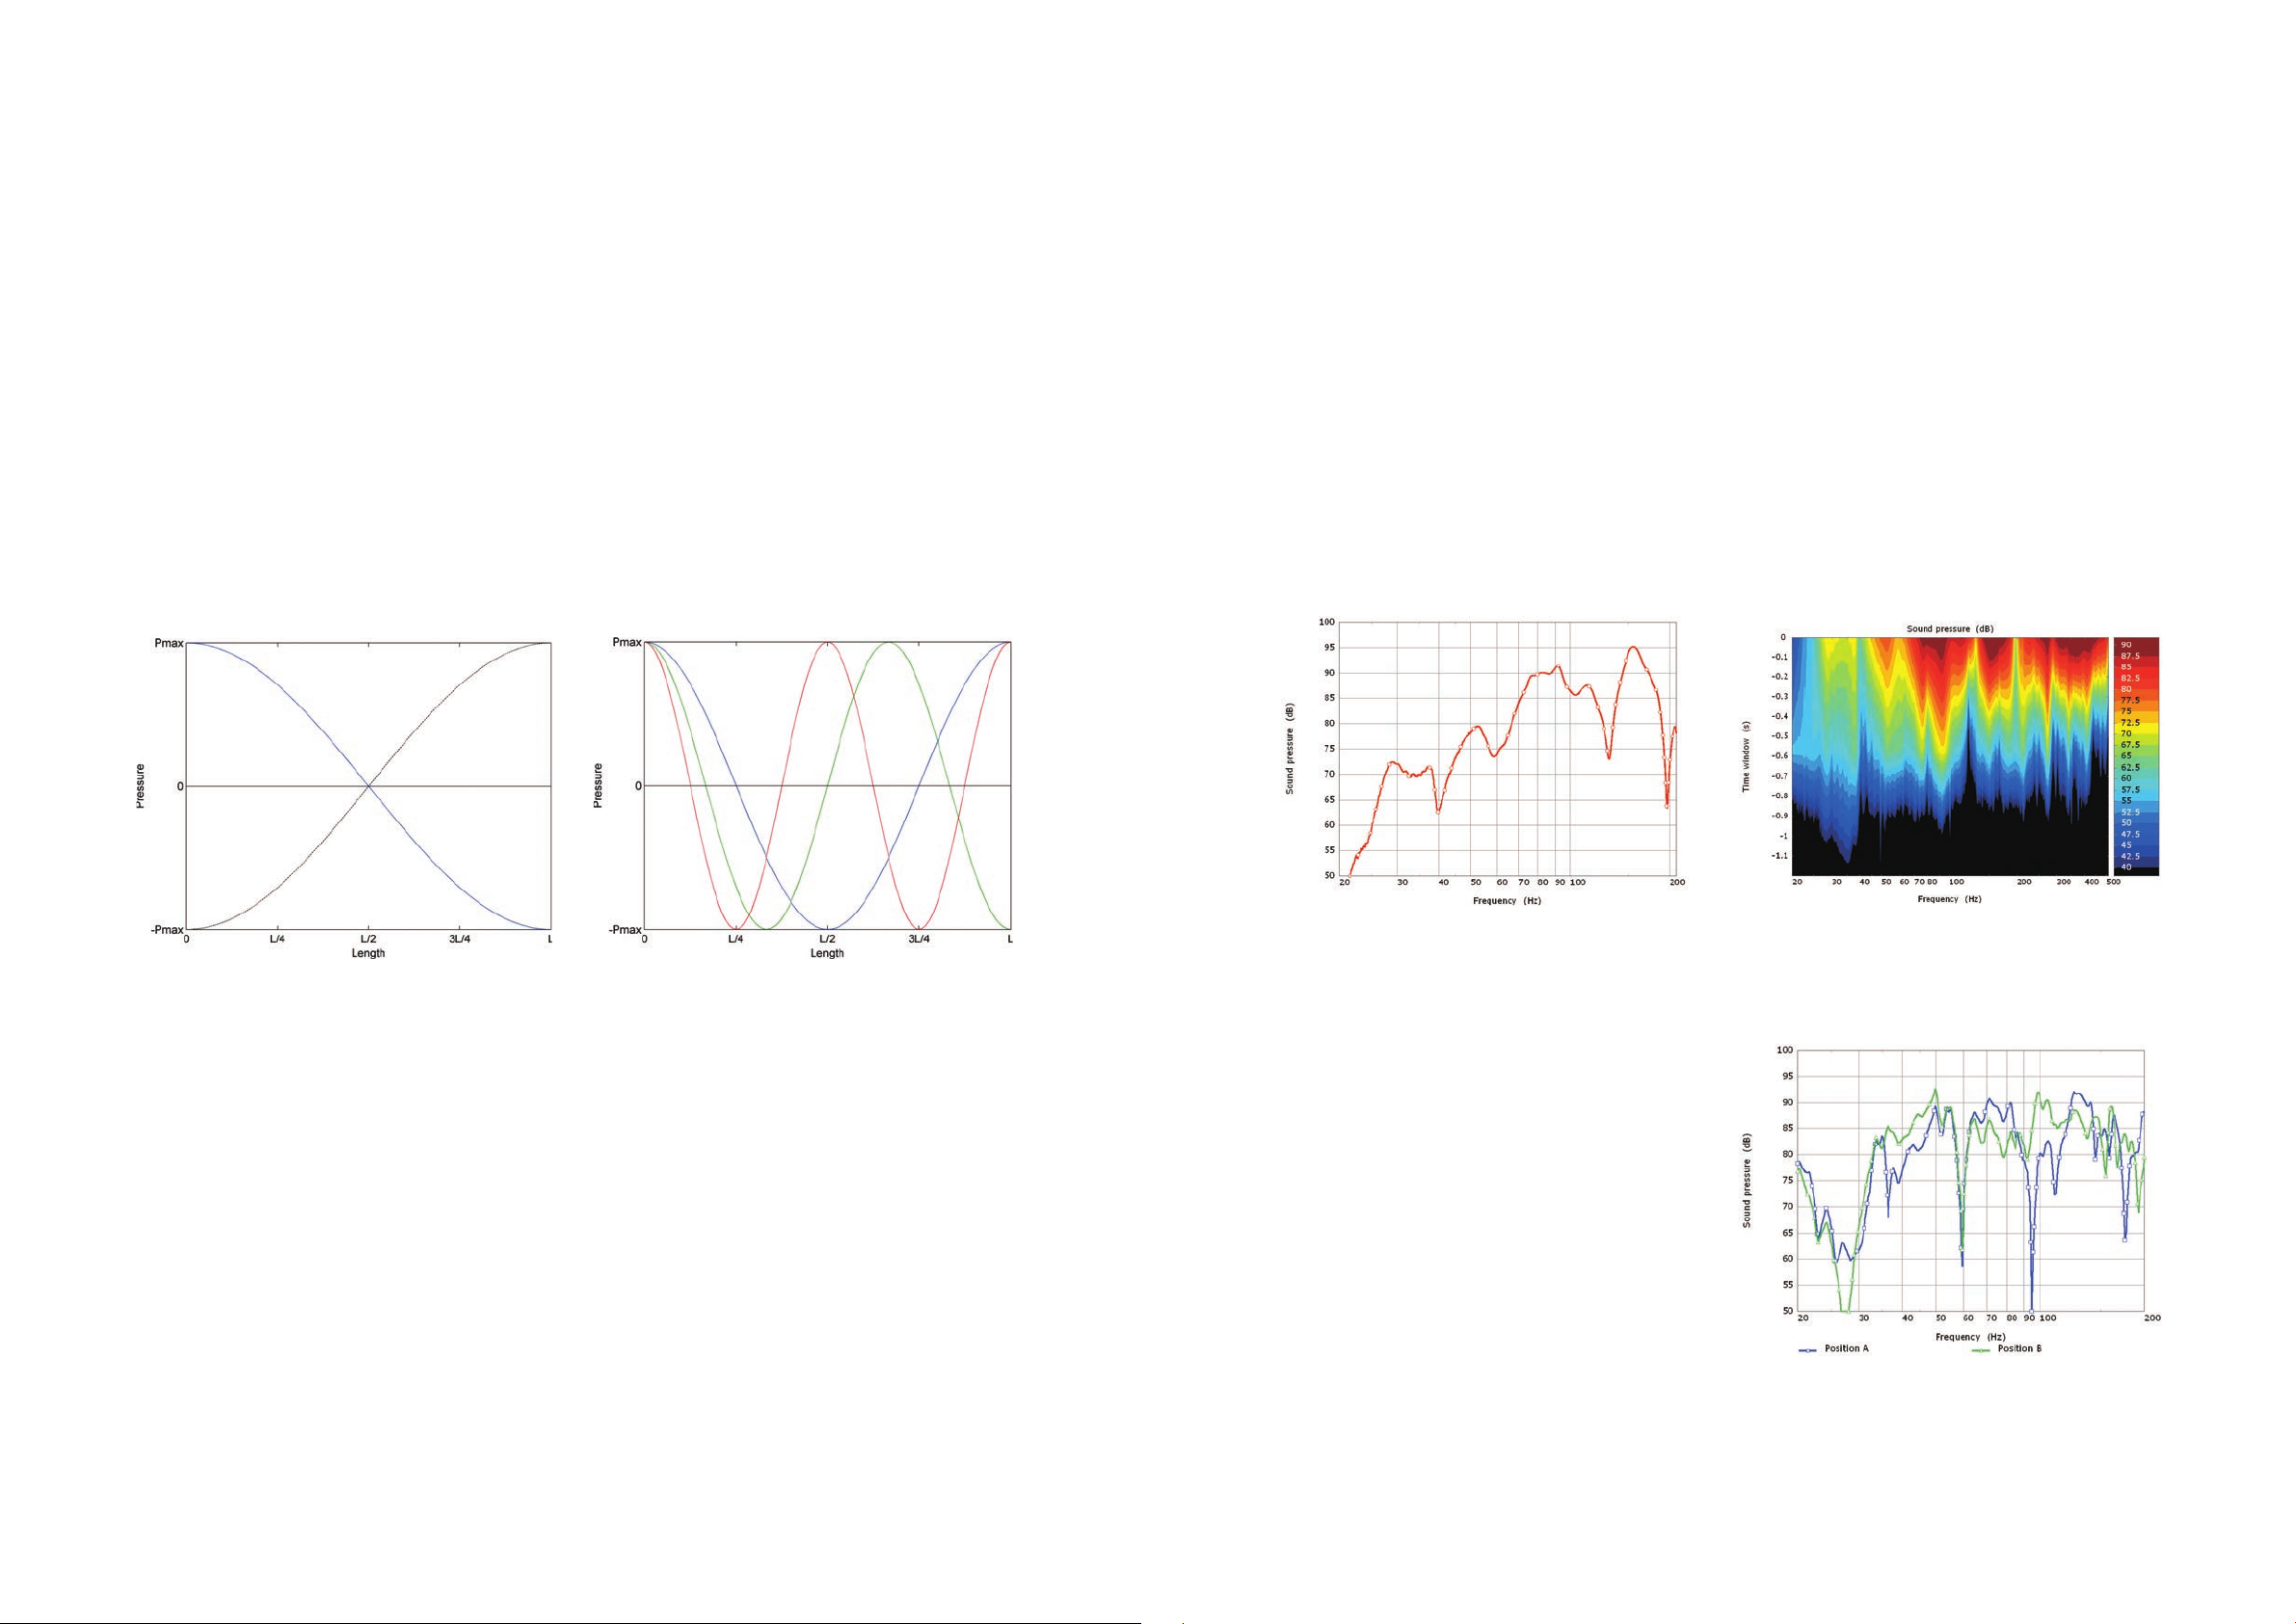
Appendix VII. Room modes and loudspeaker positioning
VII.II. The e ect of modes on loudspeaker responses
After the loudspeaker, the audio signal goes through
one more process before reaching the ears:
propagating across the room. This can have a signi cant
e ect on the overall performance of the loudspeaker,
especially at low frequencies where room modes can
play a prominent role in the clarity and evenness of
the sound. No two rooms are identical, and the e ects
are di cult to predict. However, these low frequency
problems can usually be signi cantly reduced through
careful positioning of the loudspeaker and listener.
VII.I. What is a room mode?
Room modes occur at frequencies where the
wavelength of the sound coincides with a dimension of
a room, resulting in a standing wave resonance. Longer
dimensions have lower frequency room modes than
shorter ones. They are typically problematic below
200Hz, and occur in all 3 dimensions of the room.
The standing waves formed in rooms are acoustically
similar to those formed in the loudspeaker cabinet, as
explained in Section 4.3.1.
Figure 76 shows the pressure of a room mode along
a length of a room. The strength of the mode varies
in a sinusoidal shape, being stronger at the walls due
to the build-up of sound pressure. There is a node
in the centre of the room where the pressure of the
mode is zero. The pressures either side of the node
are opposite phases, such that the total pressure in the
mode remains zero.
When a loudspeaker is placed in a room, if it is
near to a pressure maxima of a mode (the point at
which the magnitude of the pressure is at its largest
value) it will excite it strongly. If the loudspeaker is
placed near to a modal node (the point where the
pressure is zero), then the mode will be excited much
less. Excited modes result in resonant peaks in the
response coinciding with the modal frequencies, and
ringing in the time domain. Between the peaks nulls
are often seen in the frequency response and occur
due to destructive interference between adjacent
room resonances. The depth of these nulls is greatly
dependent upon the speaker position. In many ways
these nulls can be more audible than the peaks as they
tend to result in a perceived lack of bass.
Figure 77 shows a real in-room measurement. On the
left of the gure a standard frequency response plot is
shown, on the right a time frequency representation
of the same data. Comparing the two, it can be seen
that the peaks in the frequency response coincide with
time domain ringing. Similarly, the dips in the frequency
response result in dips in the time response. Note that
the decay time associated with these irregularities is far
greater than any of the other time smearing discussed
in the body of this paper. These measurements are of a
worst case scenario with the loudspeaker in the corner,
where it excites all the room modes
Figure 76. Modal pressure distributions between parallel walls for rst (left) and second, third and forth modes (right).
Modes will also occur at integer multiples of the original
resonant frequency (e.g. 20Hz, 40Hz, 60Hz, 80Hz…).
At these frequencies an additional half sine wave can be
tted into the length of the room. The rst mode will
be half a sine wave (180 degrees), the second a whole
sine wave (360 degrees), the third one and a half (540
degrees) and so on. Figure 76 shows the next 3 room
modes, tting between one and two wavelengths along
the length. As can be seen the positions of the nodes
and anti-nodes varies with the different resonances.
When the loudspeaker and listener positions are
moved around the room, the effect of the room
modes will change depending on their proximity to a
pressure maxima or minima.
The modes described so far are axial room modes,
involving standing waves formed between a pair of
parallel opposite walls. These are the strongest modal
resonances in a room. If the room dimensions are
integer multiples of each other, the modal resonances
of each dimension will occur at the same frequency.
This gives a low modal density with fewer but stronger
modal resonances, which is more audible than a
greater number of weaker resonances. The stronger
resonances are harder to control, which is why shapes
such as cubes are avoided when designing listening
rooms.
Modes will also form between two pairs of walls such
as the length and width, called a tangential mode.
Similarly, modes can form across all three dimensions,
called an oblique mode. Tangential and oblique modes
are weaker than axial modes, but can reinforce
resonances if they coincide in frequency. If room modes
are strong in a room, then they can be damped using
acoustic treatment, although large quantities are usually
needed due to the long wavelengths at low frequencies.
Figure 77. In-room loudspeaker response shown as frequency response chart (left) and short time Fourier response (right).
VII.III. Positioning
The e ects of room modes can never truly be avoided.
They can however be significantly reduced through
careful positioning of the loudspeakers in the room.
Small changes to the loudspeaker position can have
a very large effect. For example figure 78 shows the
response of a floor-standing loudspeaker measured
from the listening position for two di erent positions in
the room. The two positions are only 0.5m apart from
one another yet the change in the response is as much
as 7dB. The sound of the loudspeaker would be very
di erent in these two locations. It is tricky to provide
general advice that will work in all rooms, though there
are some tips on speaker placement in appendix VIII.
The best approach is to experiment with different
loudspeaker and listener locations to nd a layout with
a balanced overall sound. In some rooms, changing the
speaker location by as little as 10cm can make a big
di erence.
Figure 78. In-room loudspeaker measurements for two different loudspeaker
positions 0.5m apart.
48
49
Page 28

Appendix VIII. General loudspeaker positioning tips
• The speakers should be placed between 2 and
4m apart and the listener should be positioned
exactly equidistant from the loudspeakers, and at
approximately the same distance the speakers are
apart.
• Ideally a wall should be directly behind the
loudspeakers (the “front” wall). Both speakers should
be the same distance from this wall.
• The distance between the speakers and the front
wall is normally the most sensitive parameter for
low frequency tuning. It is recommended that the
listener ne-tune the loudspeaker to rear wall spacing
to find the optimal distance. Normally this distance
would be between 0.3m and 1.5m to the rear of the
loudspeakers.
• Avoid placing the listening position in close proximity
to any of the walls.
• Symmetry is very important for optimal stereo.
Ideally the side walls, to the left and the right of the
loudspeakers, should be at the same distance and of
the same construction.
•Toe-in can help to fine tune the stereo image and
the perceived high frequency energy. Maximum high
frequency energy will reach the listener when the
tweeters are pointing directly at the listening position.
With Uni-Q the balance does not su er if you listen
o axis, so using a atter setup with less toe can be a
very good option for lively rooms.
• Use a tape measure to ensure your spacings are
exactly the same, the ear is very sensitive to arrival
time.
• If it is not working, consider a complete change
of approach. By using a different wall behind the
loudspeakers you will most likely end up with a
di erent listening position too. The listening position
is just as important as the speaker positions.
• Bass traps can help a great deal to tame room mode
resonances which will tend to improve bass overhang.
However, they need to be physically large to have any
e ect on deep bass. Beware of poorly designed traps.
A typical bass trap to e ect frequencies below 80Hz
needs to have a volume of approximately 0.5m3.
• The side wall has only a small effect on the timbre
of a well designed loudspeaker provided it is not
closer than around 1m. Ideally the side wall should be
between 1 and 3m from the loudspeaker.
• If acoustically treating the room, it can be very helpful
to add diffusion (uneven reflective surfaces) to the
side walls. This helps to reduce timbral imbalance
due to the side walls while maintaining a good stereo
image.
50
Page 29

52
Visit: KEF.COM for more about KEF and its products.
KEF reserves the right, in line with continuing research and development, to amend or change speci cations. E&OE.
01.2020 | The Reference
 Loading...