

Technical description
Kamstrup 162M/382M
Kamstrup A/S
Industrivej 28, Stilling
DK-8660 Skanderborg
TEL: +45 89 93 10 00
FAX: +45 89 93 10 01
energi@kamstrup.com
www.kamstrup.com


TECHNICAL DESCRIPTION Kamstrup 162M/382M
5512-1040 GB/05.2012/Rev. C1
3
Contents
1 Revision history ................................................................................................................ 6
2 General description .......................................................................................................... 7
2.1 Terms ................................................................................................................................................. 7
2.2 Construction ....................................................................................................................................... 8
2.2.1 Terminals ............................................................................................................................... 8
2.2.2 Measurement Construction ..................................................................................................... 8
2.3 Meter types ........................................................................................................................................ 9
3 Functions ........................................................................................................................ 10
3.1 Start-up of meter .............................................................................................................................. 10
3.1.1 Software revision .................................................................................................................. 10
3.1.2 ROM checksum ..................................................................................................................... 10
3.2 Registers .......................................................................................................................................... 10
3.2.1 Energy registers .................................................................................................................... 11
3.2.2 Energy calculation ................................................................................................................ 12
3.2.3 Verification registers ............................................................................................................. 13
3.2.4 Resettable counter registers ................................................................................................. 13
3.2.5 Power registers ..................................................................................................................... 14
3.2.6 Other registers ...................................................................................................................... 15
3.2.7 Meter status register ............................................................................................................. 15
3.3 Time management ............................................................................................................................ 15
3.3.1 Real-time clock (RTC) ............................................................................................................ 15
3.3.2 Backup ................................................................................................................................. 16
3.3.3 Hour counter ......................................................................................................................... 16
3.4 Tariffs ............................................................................................................................................... 16
3.5 Voltage quality measurement ........................................................................................................... 16
3.5.1 Voltage measurement ........................................................................................................... 17
3.5.2 Registration of overvoltage/undervoltage .............................................................................. 17
3.5.3 Registration of voltage failures .............................................................................................. 18
3.5.4 Time stamp with RTC ............................................................................................................. 18
3.6 Loggers ............................................................................................................................................ 18
3.6.1 Debiting logger ..................................................................................................................... 18
3.6.2 Debiting logger 2 .................................................................................................................. 19
3.6.3 Load profile logger ................................................................................................................ 19
3.6.4 Analysis logger ..................................................................................................................... 21
3.6.5 Event logger for status .......................................................................................................... 22
3.6.6 Event logger for RTC .............................................................................................................. 22
3.6.7 Event logger for voltage quality ............................................................................................. 23
3.6.8 Event logger for the load profile logger .................................................................................. 23
3.6.9 Event logger for Cut off .......................................................................................................... 23
3.6.10 Event logger for neutral fault ................................................................................................. 23
3.7 Pulse inputs/outputs ........................................................................................................................ 26
3.7.1 Pulse inputs in the module area ............................................................................................ 26
3.7.2 Water meters ........................................................................................................................ 26
3.7.3 Electricity meters .................................................................................................................. 27
3.7.4 Pulse outputs in module area ............................................................................................... 27
3.7.5 S0 output ............................................................................................................................. 27
3.8 Auxillary Power Supply ...................................................................................................................... 28
3.9 Alarm handling/Push alarms............................................................................................................. 29
3.10 Load control ..................................................................................................................................... 29
4 Display ........................................................................................................................... 30
4.1 Value field ........................................................................................................................................ 31
4.2 Unit field .......................................................................................................................................... 31
4.3 Text field .......................................................................................................................................... 31
4.4 Mains voltage reading ...................................................................................................................... 31

TECHNICAL DESCRIPTION Kamstrup 162M/382M
5512-1040 GB/05.2012/Rev. C1
4
4.5 Phase current indication ................................................................................................................... 31
4.6 Tariff indication ................................................................................................................................ 32
4.7 Current quadrant reading .................................................................................................................. 32
4.8 Breaker status .................................................................................................................................. 32
4.9 Object identification field ................................................................................................................. 32
4.10 Display configuration ........................................................................................................................ 33
4.11 Display read-out of load profile logger ............................................................................................... 35
5 Integrated radio .............................................................................................................. 37
5.1 Communication via radio .................................................................................................................. 37
5.2 Software upload ............................................................................................................................... 37
6 Integrated disconnection ................................................................................................ 38
6.1 Disconnect function in the meter ...................................................................................................... 38
6.2 Manual disconnection and connection .............................................................................................. 39
6.3 Disconnection by means of communication commands .................................................................... 39
6.4 Smart disconnect .............................................................................................................................. 40
6.4.1 Delayed disconnection ......................................................................................................... 40
6.4.2 Overcurrent protection .......................................................................................................... 41
6.4.3 Current-controlled disconnection .......................................................................................... 41
6.4.4 Power-controlled disconnection ............................................................................................ 41
6.4.5 Reconnection ........................................................................................................................ 41
6.4.6 Disconnection basis ............................................................................................................. 41
6.4.7 Disconnection status ............................................................................................................ 41
6.5 Prepayment ...................................................................................................................................... 42
6.6 Status chart of the disconnect function ............................................................................................. 43
6.7 Disconnection on meters with APS .................................................................................................... 44
6.7.1 Using the push button .......................................................................................................... 44
6.7.2 Using commands (remote) .................................................................................................... 44
7 Meter communication ..................................................................................................... 45
7.1 Requirements for third party modules ............................................................................................... 45
7.2 KMP .................................................................................................................................................. 45
8 Technical specifications .................................................................................................. 46
8.1 Approvals and standards .................................................................................................................. 46
8.2 Technical data .................................................................................................................................. 46
8.2.1 Connections ......................................................................................................................... 48
8.2.2 2W module supply ................................................................................................................ 49
8.2.3 Module interface................................................................................................................... 49
8.3 Diagrams/charts ............................................................................................................................... 50
8.3.1 Dimensional sketch for 3-phase and Aron meter with/without breaker .................................. 50
8.3.2 Dimensional sketch for 1-phase meter with/without breaker ................................................. 50
9 Modules ......................................................................................................................... 51
9.1 Primary modules ............................................................................................................................... 51
9.2 Secondary communication modules ................................................................................................. 52
9.2.1 Variants of the secondary communication module ................................................................ 52
10 Ordering details ..................................................................................................... 53
10.1 Type number ..................................................................................................................................... 53
10.2 Configuration numbers ..................................................................................................................... 55
10.2.1 Configuration 1 ( A-B-CCC-DD-E ) ........................................................................................... 55
10.2.2 Configuration 2 ( FFF-GG-HH-I ) .............................................................................................. 57
10.2.3 Configuration 3 ( JJ-K-LL-M-NN ) ............................................................................................. 58
10.2.4 Configuration 4 ( OOO-PPP-QQ ) ............................................................................................ 59
10.2.5 Configuration 5 (RRR) ............................................................................................................ 59
10.3 Display readings ............................................................................................................................... 60
10.4 Period plan - Tariff and load control table .......................................................................................... 62
10.4.1 Setup working days and non-working days ............................................................................ 62

TECHNICAL DESCRIPTION Kamstrup 162M/382M
5512-1040 GB/05.2012/Rev. C1
5
10.4.2 Setup period A and B and tariff switch for each period. ......................................................... 62
10.4.3 Setup plan for load control 1 and 2 ....................................................................................... 63
10.4.4 Setup calender for exception days ........................................................................................ 64
10.4.5 On Demand tariff .................................................................................................................. 64
10.4.6 Load control delay ................................................................................................................ 64
10.5 Daylight saving table ........................................................................................................................ 65
10.6 Label ................................................................................................................................................ 66
10.7 Display configuration ........................................................................................................................ 67
10.8 Disconnect configuration .................................................................................................................. 69
11 Installation manual ................................................................................................ 70
11.1 Terminal numbering .......................................................................................................................... 70
11.2 Connection diagrams ........................................................................................................................ 71
11.3 Guidelines for safety and installation ................................................................................................ 72
11.4 Sealing ............................................................................................................................................. 73
12 Test specifications ................................................................................................. 74
13 Packing .................................................................................................................. 75
14 Accessories ............................................................................................................ 75

TECHNICAL DESCRIPTION Kamstrup 162M/382M
5512-1040 GB/05.2012/Rev. C1
6
1 Revision history
Revision Date Change
A1 2011-10-21 Document created
B1 2011-12-22 Figures are updated according to new mechanical design.
C1 2012-05-07 First release

TECHNICAL DESCRIPTION Kamstrup 162M/382M
5512-1040 GB/05.2012/Rev. C1
7
2 General description
Kamstrup 162M and 382M are a generation of directly connected electricity meters for the measurement and
registration of electrical energy. The meters are full-electronic without movable parts. Thus, energy registration is
not affected by shock and impact during transportation and mounting. Furthermore, measurements are correct,
no matter the physical mounting direction. Using shunt as measuring principle, it is possible to obtain a good
linearity, a very large dynamic area and immunity to magnetism and DC currents.
The easily readable display scrolls automatically between readings, or readings can be changed manually by the
consumer activating a push button. The required display readings as well as their order are configurable. In
addition to being read from the display, data can be collected via the optical output or from the module area by
means of a suitable communication module. The unique module area also permits external monitoring of tariffs,
pulse inputs and outputs, and configuration as well as connection of AMR and AMM modules.
From the factory, the meter can be configured to measure both imported and exported energy. The meters are
constructed with independent and galvanically separated measuring systems (the number of measuring systems
depends on the meter type). This ensures a correct measurement irrespective of how many and which
measurement systems are used. The energy registration is saved in the integral data logger, which ensures good
data history.
The meter construction makes it immune to magnetic influence, and the measuring accuracy will not be
influenced by magnetism.
It is possible to supply the meter with battery backup for the integrated RTC (Real Time Clock) used for tariff
control and time stamping of data and events.
The tariff control permits up to 8 tariffs. The tariffs can be managed by the internal clock (RTC) on the basis of
preprogrammed time tables. The tariff shifts can also be effected by summer time/standard time and holidays.
The meter is configurable and can be supplied from the factory with required functions. This ensures a minimum
of configuration during installation. Furthermore, the meter can be configured to verification mode, which
improves the resolutions of the energy indications, thereby reducing the duration of test and verification.
The meter is approved according to current electricity meter standards.
Kamstrup electricity meters are supported by a Kamstrup configuration tool called METERTOOL.
2.1 Terms
Integration period: The integration period is the length of time over which the power is averaged in order
to find e.g. the peak power. For instance, it can be 15 min.
Load profile logger: A logger that contains a series of energy values A+, A-, R+, R- depending on meter type.
The interval between each values is defined by the integration period. As default the
logger contains the last 4 months of data.
Debiting period: The debiting period is a configurable length of time between each debiting entries
where the value of a number of predefined meter regsiters are logged. Usually the
debiting period is 1 month.
Debiting logger: Contains a series of predefined meter registers that are logged with a customer-
specific time interval defined as the debiting period. The depth of the logger is 36
entries.

TECHNICAL DESCRIPTION Kamstrup 162M/382M
5512-1040 GB/05.2012/Rev. C1
8
2.2 Construction
The meter is designed as a three-piece plastic construction, consisting of housing, verification and meter covers,
all parts made of fire resistant plastic. The verification cover protects the metrological functions. It is not possible
to open the verification cover without breaking the metrological seal.
The meter cover covers the module area. Various communication modules, input/output and control modules can
be connected without reverification. Furthermore, the meter cover can be ordered with different lenghts. A short
version allows premounted terminal-pins or wires to be mounted, while longer version covers the terminal in- and
outputs
2.2.1 Terminals
The current terminal is a combined terminal and shunt. The terminal is the elevating type with one screw per
terminal, which secures quick and simple mounting. The construction and design of the terminal protect the
connected cable from being damaged during tightening. Furthermore, a good contact area is provided, which
minimises the contact resistance and thereby heating at heavy currents.
2.2.2 Measurement Construction
The meter is provided with 1 shunt per system for current mesurement, and it measures the voltage through a
voltage divider. A switch mode supply feeds measuring circuits and main processor with voltage. Furthermore, the
switch mode supply in combination with varistors and power resistors functions as an excellent transcient
protection.
The use of shunt and switch mode supply also makes sure that the meter is immune to magnetic influence.
Magnetic influence will be detected by the integral sensors and be registered in the meter’s event logger.
Using shunt as measuring principle for the current measurement where a resistance stable metal provokes a
given drop of voltage at a given current, makes the energy measurement secure and reliable. Another important
advantage of the measuring principle shunt is a linear change of the voltage drop, which is an expression of the
current consumption.
The meters are constructed with independent and galvanically separated measuring systems (the number of
measuring systems depends on the meter type). This ensures a correct measurement irrespective of how many
and which measurement systems are used.
The meter’s main processor with corresponding data logger has its own supply, which means that data is well
secured against transients.
Like voltage drop, energy consumption is calculated as an expression of the current compared to the phase
voltage and time. The energy registration per measuring system is communicated to the meter’s legal processor
via the meter’s internal bus system. After correction, the energies are summed in the main energy register.
Measured and calculated data is safely stored in the memory (EEPROM) and can be read out either via the module
area’s unique interface, or through the optical interface by means of an optical head.

TECHNICAL DESCRIPTION Kamstrup 162M/382M
5512-1040 GB/05.2012/Rev. C1
9
2.3 Meter types
Kamstrup’s direct meters are available in different variants depending on the application for which they are used.
As default, in addition to many other functions, the meters are provided with debiting logger, event loggers,
voltage quality measurement, tamper detection, and the possibility of using up to 8 tariffs. Furthermore, the
meters can be supplied from the factory with internal disconnect function for disconnection and connection of the
consumer’s supply, configured for the measurement of energy types in all 4 quadrants, with integrated radio
transceiver, load profile logger, prepayment function, APS and smart disconnect.
The summary below provides an overview of which functions the meter types include.
The meter's type number consists of 13 characters that describe the meter's hardware and mechanics:
684-XXX-XX-XX-XXX for the 3-phase meter and 686-XXX-XX-XX-XXX for the 1-phase meter.
Kamstrup 3-phase Direct meter is a 3-phase 4-wire meter, 684-3XX-XX-XX-XXX.
Kamstrup Aron Direct meter is a 3-phase 3-wire meter, 684-2XX-XX-XX-XXX.
Kamstrup 1-phase Direct meter is a 1-phase 2-wire meter, 686-1XX-XX-XX-XXX.
Meter Type 1-phase Aron 3-phase
Without
APS
Without
APS
With
APS
Without
APS
Without
Radio
Without breaker
With breaker
Kamstrup
Radio
Without breaker
With breaker
Table 1: Meter variants - hardware.

TECHNICAL DESCRIPTION Kamstrup 162M/382M
5512-1040 GB/05.2012/Rev. C1
10
3 Functions
3.1 Start-up of meter
In the first five seconds after being connected to power, the meter will show its software type and revision
number. In the next five seconds, the ROM checksum will be displayed.
3.1.1 Software revision
The 8 digits in the value field describes the software type and revision is shown in the text field in the upper right
corner.
3.1.2 ROM checksum
The four or five digits of the ROM CRC appear as one number resulting from the checksum calculation.
3.2 Registers
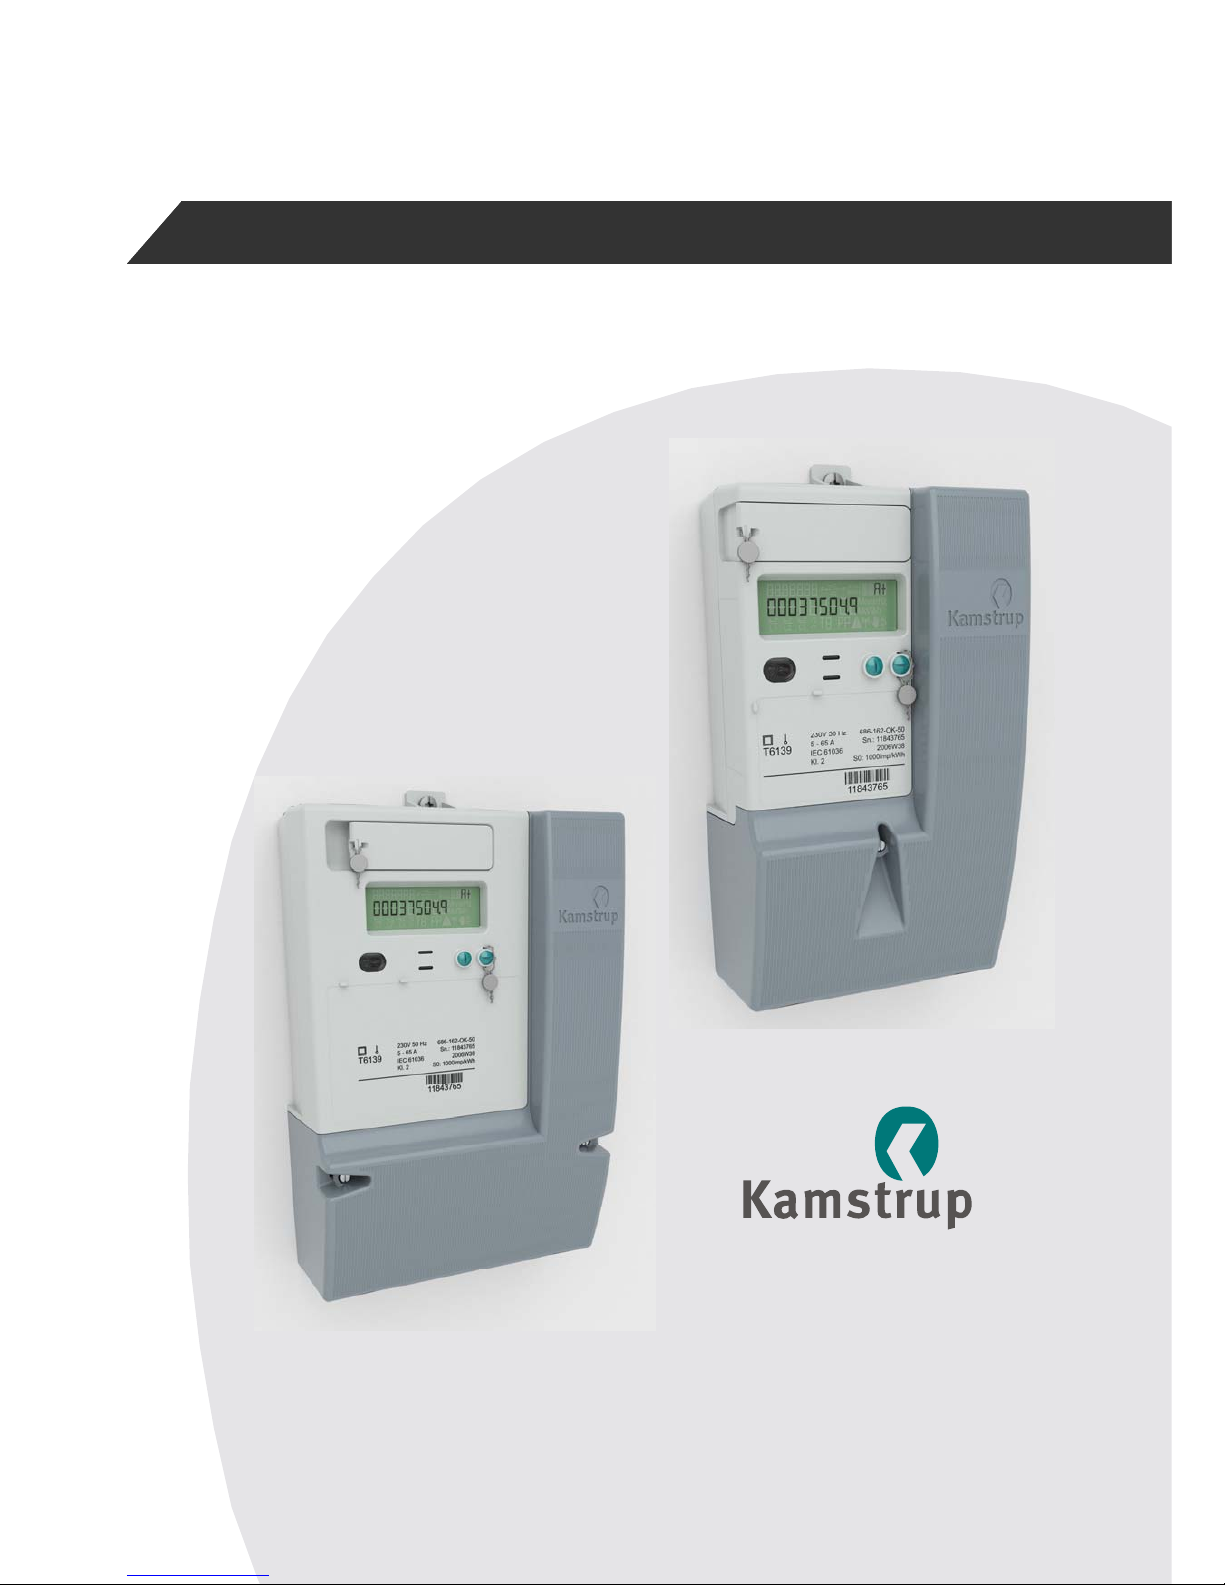
Kamstrup’s direct meters are constructed as 4-quadrant meters, which provide safe registration of various
measured data such as imported and exported energy for both active and reactive energy, tariffed energy, power,
voltage and current.
R+
kvarh
Rkvarh
A+
kWh
A-
kWh
1
2
3
4
+R
i
+R
c
-R
c
-R
i
Wvar
W
var
W
var
W
var
Figure 1: Energy and power measurement in 4 quadrants.
The basic meter is constructed as an import meter, but is available as an import/export meter for both active and
reactive energy. The possible energy registers are seen below. The OBIS code of each energy type is stated in
brackets according to EN 62056-61.
TECHNICAL DESCRIPTION Kamstrup 162M/382M
5512-1040 GB/05.2012/Rev. C1
11
A+ (1.8.0)
Active positive energy consists of active energy from quadrants 1 and 4.
A- (2.8.0)
Active negative energy consists of active energy from quadrants 2 and 3.
R+ (3.8.0)
Reactive positive energy consists of positive inductive energy from quadrant 1 and positive
capacitive energy from quadrant 2.
R- (4.8.0)
Reactive negative energy consists of negative inductive energy from quadrant 3 and
negative capacitive energy from quadrant 4.
R1 (5.8.0)
Positive inductive energy from quadrant 1.
R4 (8.8.0)
Negative inductive energy from quadrant 4.
3.2.1 Energy registers
The meter’s configuration determines the number of available registers.
The energy readings can be configured for display in format 7.0 (0000000) or format 6.1 (000000.0). Furthermore,
it is possible to select or deselect leading zeroes.
The meter’s main energy registers are:
A+ Active positive energy (consumption/import). Active energy from quadrants 1 and 4 is displayed in
kWh.
A- Active negative energy (production/export). Active energy from quadrants 2 and 3 is displayed in
kWh.

TECHNICAL DESCRIPTION Kamstrup 162M/382M
5512-1040 GB/05.2012/Rev. C1
12
R+ Reactive positive energy. Positive inductive energy from quadrant 1 and positive capacitive energy
from quadrant 2 are displayed in kvarh.
R- Reactive negative energy. Negative inductive energy from quadrant 3 and negative capacitive energy
from quadrant 4 are displayed in kvarh.
R1 Ri+ Reactive positive energy. Positive inductive energy from quadrant 1 is displayed in kvarh.
R4 Rc- Reactive negative energy. Negative capacitive energy from quadrant 4 is displayed in kvarh.
Furthermore, the above energy types are registered in tariffed registers T1, T2, T3, T4, T5, T6, T7 and T8.
For further information about tariff control, see section 3.4.
In addition, bidirectional positive registration in a register, i.e. active energy for import and export added
numerically, can be selected as a special register (control register). This register sums the energy positively
without considering whether the input and output terminals per system have been interchanged.
A1423 Numeric register for |A+| + |A-|. The value is displayed in kWh.
3.2.2 Energy calculation
There are several acceptable methods for calculating the energy in three-phase meters.
Three identical meters can obtain several different results for energy measurement dependent on the calculation
method.
If energy is imported on phases L1 and L2, and energy is exported on phase L3 as shown in Figure 2, the
calculation can be made according to the methods described below.
A- A+
L1
L3
L2
Figure 2: Example of energy consumption in a three-phase meter.
Figure 3 graphically shows the calculation of the total energy dependent on the applied calculation method. The
first method applies vector summation, which is known from the Ferraris meters where the energy is added in
consideration of sign. In the next example import and export are added individually, and finally is shown the
calculation with total summation where all contributions are added numerically is shown.

TECHNICAL DESCRIPTION Kamstrup 162M/382M
5512-1040 GB/05.2012/Rev. C1
13
A- A+
L1
L3
L2
A+
L1 L2
L3
A- A+
L1
L3
L2
A+
L1 L2
L3
A- A+
L1
L3
L2
A+
L1 L2
L3
A-
Vector summation Individually import/export Total summation
Figure 3: The three different calculation methods.
When using vector summation, the positive contributions are added and the negative contributions are
substracted in the same way as by electromechanical meters. Contributions from e.g. solar energy installations
will be set off in the total energy calculation. This calculation method is sensitive to incorrect installation and
manipulation.
Individually import/export calculation method has one register for the positive contributions and one for the
negative contributions.
Kamstrups 162M and 382M supports the individually import/export calculation method.
Note!
Total summation adds all contributions to the positive register whether one or all are negative. Kamstrup
Generation M meters doesn’t support this calculation method for the main energy registration, but have a
additional register for this called “A1423”.
3.2.3 Verification registers
For test purposes, the 4 main energy registers (A+, A-, R+, R-) can be displayed with higher resolution in format 3.4
(000.0000).
For test purpose it is possible to activate test mode. Test mode change the display setup to allow selection of
energy registers A+, A-, R+ and R- depending on the meter by activating the left push button. In test mode, the LED
blinks proportionally to the chosen energy type.
The meter changes automatically from test mode to normal mode 16 hours after the latest activation of the push
button, or if the meter is reset. METERTOOL can also be used for changing back to normal mode.
Finally, 6 seconds activation of the left push button can provoke a change to normal mode.
3.2.4 Resettable counter registers
The consumer can use a specific register (resettable counter) for monitoring the consumption in a given period,
e.g. every day or weekly.
In addition, the consumer can use another register (resettable counter) for monitoring the electricity production
that the consumer has delivered to the electricity grid, e.g. from a solar cell installation.
The resettable counters count with the same resolution as the main energy registers of the meter, but can be reset
by activating the push button for 6 seconds at the same time as the resettable counter reading is displayed.
No register values in the meter will decrease due to inverse current
flow, no matter of meter configuration.

TECHNICAL DESCRIPTION Kamstrup 162M/382M
5512-1040 GB/05.2012/Rev. C1
14
3.2.5 Power registers
The meter registers the current power (instantaneous power) in all four qudrants. Registration of active and
reactive Power in the meter use same individually Import/export calculation method as in the case of energy
measurements.
Actual power
Actual power shows the current three-phase power consumption. The actual power can be shown in the display
and is calculated and updated every second.
Peak Power
The peak power is the highest averagely determined power registered during the debiting period. The averagely
determined power is based on a period that corresponds to the integration period. The peak power is available for
P+
max
, P-
max
, Q+
max
and Q-
max
.
Furthermore, the meter can be configured to register the peak power P+
max
for T1 and T2. Thus, the biggest positive
active power during the debiting period is found for T1 and T2, respectively.
At the end of the debiting period, the peak power and the accumulated peak power are stored and a new period
starts. The accumulated peak power accumulates the values of each period and the accumulated peak power of
the previous period. The peak power, however, is reset after each period.
Below the power registers are described:
P+ Active positive instantaneous power of quadrants 1 and 4. The power is displayed in kW in format
4.3 (0000.000).
P- Active negative instantaneous power of quadrants 2 and 3. The power is displayed in kW in format
4.3 (0000.000).
Q+ Reactive positive instantaneous power of quadrants 1 and 2. The power is displayed in kvar in
format 4.3 (0000.000).
Q- Reactive negative instantaneous power of quadrants 3 and 4. The power is displayed in kvar in
format 4.3 (0000.000).
P+
max
Maximum active positive power during the debiting period measured over an integration period
deriving from quadrants 1 and 4. The power is displayed in kW in format 4.3 (0000.000).
P-
max
Maximum active negative power during the present debiting period measured over an integration
period deriving from quadrants 2 and 3. The power is displayed in kW in format 4.3 (0000.000).
Q+
max
Maximum reactive positive power during the present debiting period measured over an integration
period deriving from quadrants 1 and 2. The power is displayed in kvar in format 4.3 (0000.000).
Q-
max
Maximum reactive negative power during the present debiting period measured over an integration
period deriving from quadrants 3 and 4. The power is displayed in kvar in format 4.3 (0000.000).
P+
max akk
Accumulated maximum active positive power during the present debiting period. To calculate the
accumulated peak power, the peak power of the present debiting period is added to the
accumulated peak power of the last debiting period.
P+
max, daily
Max active power within the 24 hours in question.
P+
min, daily
Min. active power within the 24 hours in question.
Available power registers depend on the chosen energy type. E.g. a two-qudrant meter (A+, A-) only contains P+
and P- power registers.
Power threshold value
It is possible to let a counter register how many times a power threshold value is exceeded. The value only
applies to active positive power P+.
The threshold value can be configured between 0 and 99 kW. If the limit is exceeded within the integration period
(5, 15, 30 or 60 min.), the counting is made in the power threshold counter.
The power threshold counter is registered in the debiting logger of the meter, and is reset at every debiting stop.
TECHNICAL DESCRIPTION Kamstrup 162M/382M
5512-1040 GB/05.2012/Rev. C1
15
3.2.6 Other registers
Other registers that include measurement and registration of data and events are e.g:
RTC
Meter status
Magnetic influence
Access registration (Tamper)
Voltage quality
Meter number
Special data
Pulse input
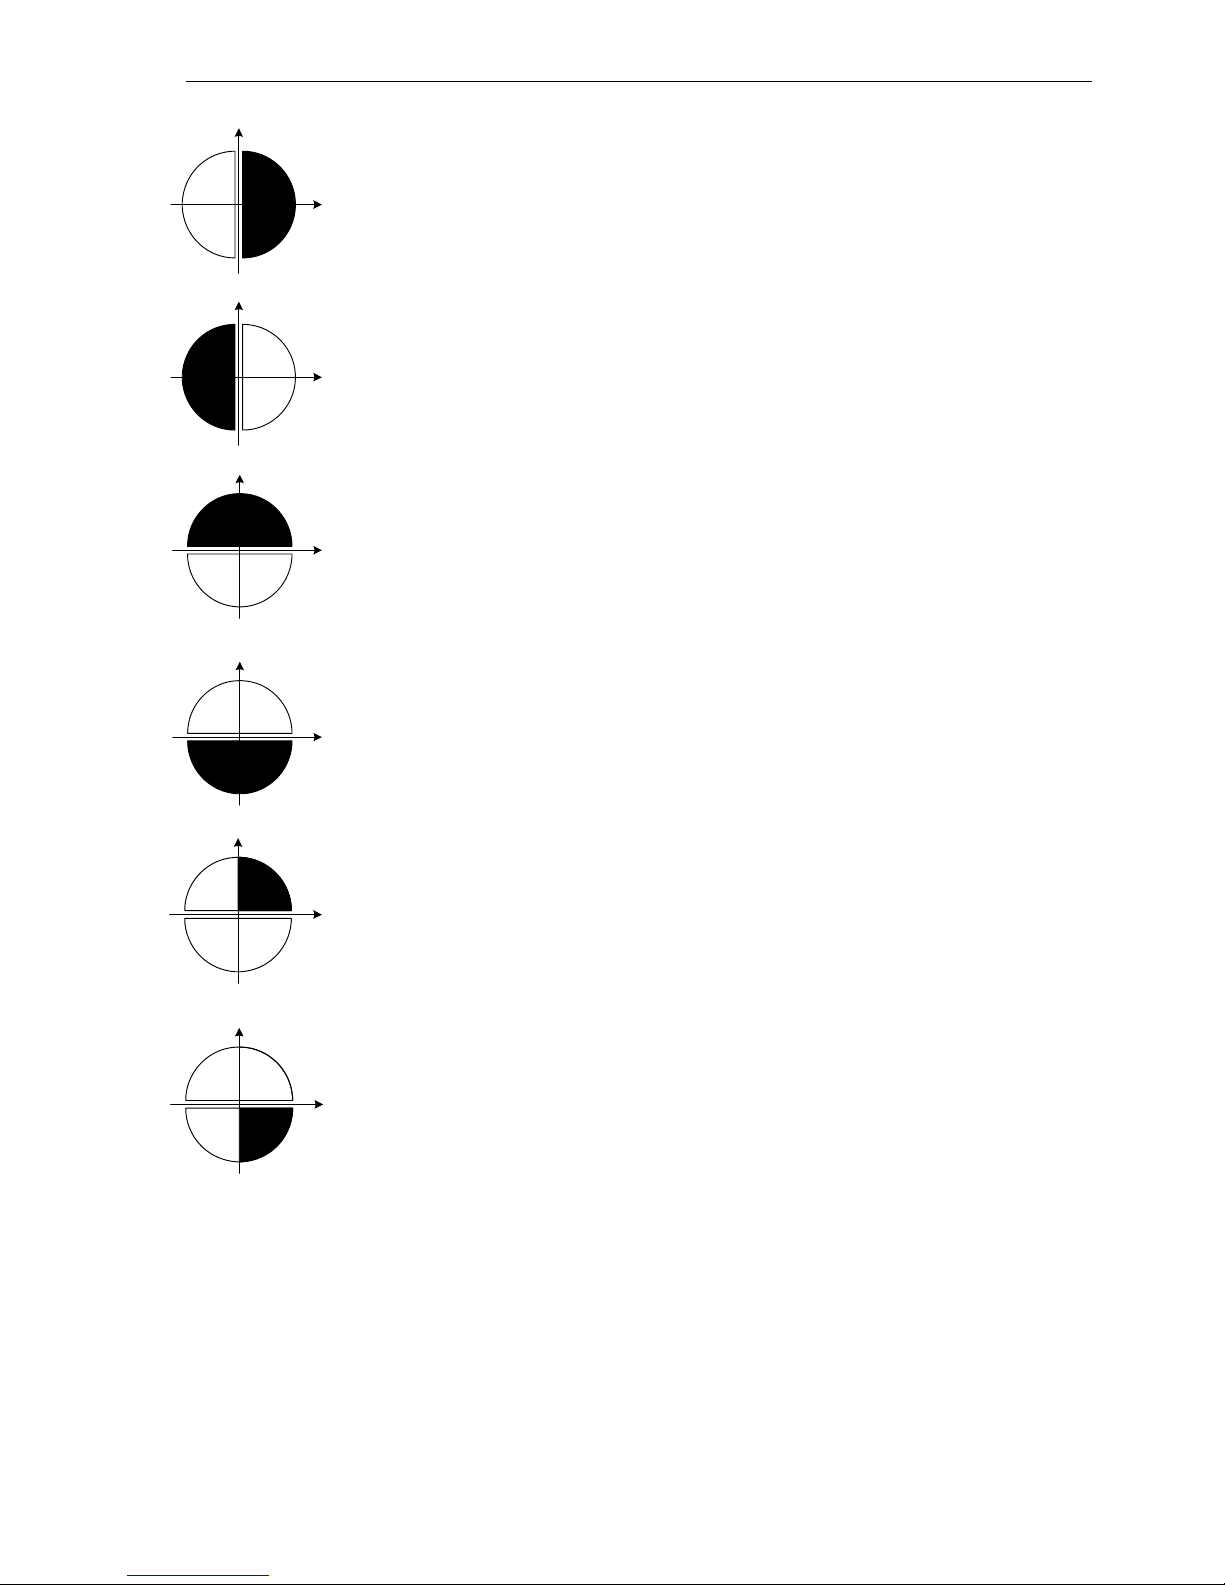
3.2.7 Meter status register
The meter status register consists of 8 digit number where each number can either “0” or “1”. Each digit indicates
the actual status of following possible event: (The sequence is from right to left)
- 1
st
Number: Is not in use
- 2
nd
Number: Indicates an error in EEPROM access or a data backup error
- 3
rd
Number: Indicates Magnetic detection
- 4
th
Number: Ram error
- 5
th
Number: ROM checksum error
- 6
th
Number: External alarm input (Only relevant if the functionality is enabled)
- 7
th
Number: Indicates tamper of the meter cover.
- 8
th
Number: Is not use
The status indicators are reset when the source to the indication disappears. Errors in digit number 2, 4 and 5 will
in most cases be permanent and requires the meter to be returned to Kamstrup.
In Figure 4 an example of the register shown in the display is illustrated.
L1
L2 L3
Figure 4: Meter status register indicates magnetic detection.
3.3 Time management
The meter has an internal real-time clock (RTC) with either battery or rechargeable backup unit (supercap).
3.3.1 Real-time clock (RTC)
The real-time clock (RTC) makes it possible to provide measured data with an accurate time stamp (typically
5ppm at 23C).
The real-time clock time stamps load profile and event values, changes tariff etc. In addition to the tariffs, it is
associated with a calendar.

TECHNICAL DESCRIPTION Kamstrup 162M/382M
5512-1040 GB/05.2012/Rev. C1
16
The time is adjustable via the configuration program METERTOOL for kWh meter or via reading system. It is
possible to use daylight saving time with corresponding preprogramming of shifting dates, see more in section
10.2.4.
3.3.2 Backup
The meters can be supplied with either a non-rechargeable unit (battery) or a rechargeable type (supercap). The
backup time of the battery depends on the period of time the meter is without mains supply, and in addition, the
battery gives access to further functions such as display views despite lack of mains supply, see section 4.10 for
further information.
The lifetime of the backup unit also depends on the mains voltage supply to the meter and the ambient
temperature. For specifications, see also section 8.2.
3.3.3 Hour counter
As the RTC manage the date and time in the meter, an hour counter register manage the number of operating
hours of the meter, i.e. number of hours where main voltage are supplied to the meter.
3.4 Tariffs
The meter allows registration in eight tariffs for each energy type depending on configuration, see section 3.2.1.
The tariffs are active when at least one tariff-register has been selected in the display set-up. Do not forget to
select control type when activating tariffs.
The tariffs can be controlled in three different ways:
- Via communication commands, e.g. from a module or via METERTOOL, or
- Through the module’s I/O, or
- Internally by means of time control via the RTC.
Module I/O controlled tariffs use the ports of the module connector for changing the tariffs, e.g. if a tariff control
module prepared for 230 VAC is connected to 230 VAC. The inverted function can also be selected.
Port 1:
Terminals 13 and 15
Port 2:
Terminals 33 and 15
Active tariff Active tariff
inverted
0 VAC 0 VAC
T1
T4
230VAC 0 VAC
T2
T3
0 VAC 230VAC
T3
T2
230VAC 230VAC
T4
T1
Table 2: 230VAC - tariff control.
The tariff reading is updated in the display every 10 secs. The active tariff is displayed by readings T1..T8.
The time-controlled tariff is possible using the RTC to control the tariffs on the basis of a preprogrammed shifting
table.
The set-up of the meter’s configuration makes conflicts between control methods impossible as the choice of one
method automatically excludes the others.
3.5 Voltage quality measurement
The meter makes it possible to register/measure the voltage quality.
The voltage quality measurement consists of voltage measurement, registration of maximum and minimum
voltage, overvoltage and undervoltage as well as voltage failures. All registrations take place per phase.
TECHNICAL DESCRIPTION Kamstrup 162M/382M
5512-1040 GB/05.2012/Rev. C1
17
3.5.1 Voltage measurement
The RMS voltage measured per phase with average determination every second forms the basis of the registration
of overvoltage, undervoltage, and voltage failures. The voltage per phase can be displayed with an accuracy
corresponding to the meter’s class.
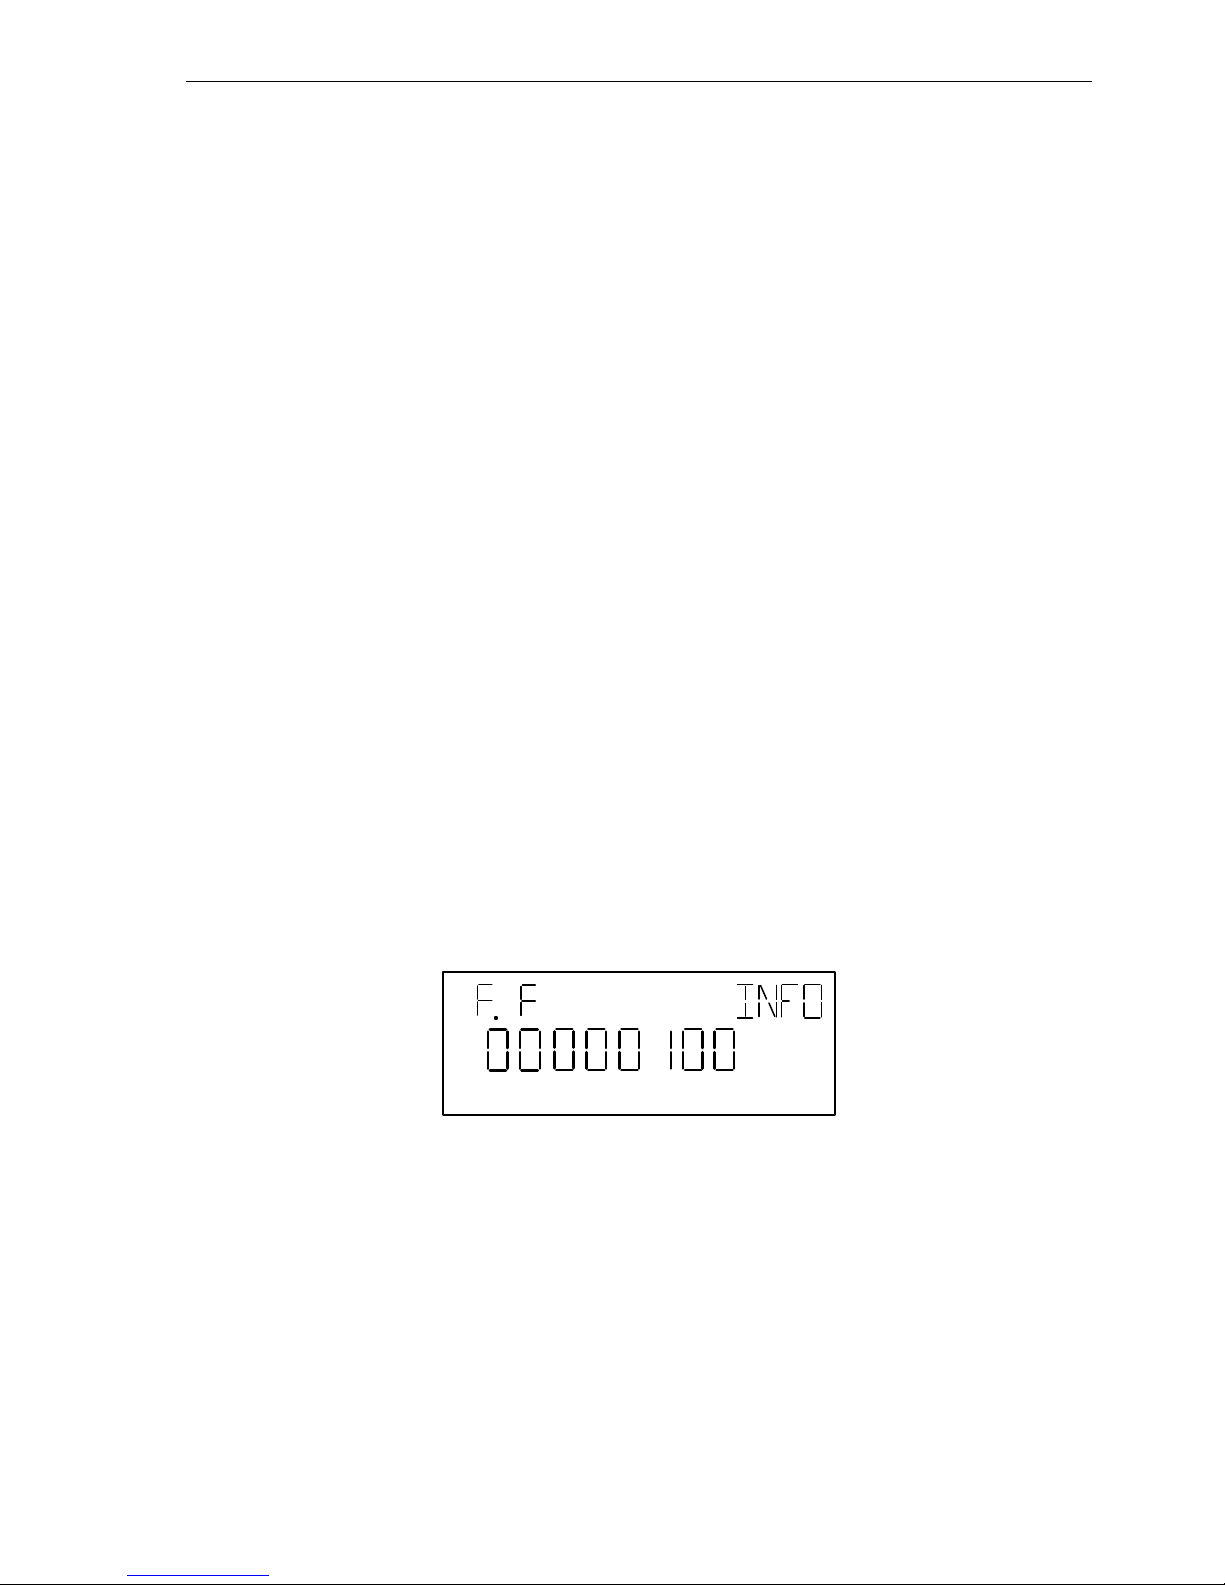
3.5.2 Registration of overvoltage/undervoltage
Registration of overvoltage/undervoltage for diagnosing the voltage situation of the individual consumer is an
important tool in connection with the evaluation of possible complaints from consumers as well as network
analysis.
If one or more phases has/have been outside a configurable overvoltage (U
High
) or undervoltage (U
Low
) limit for
some time (t
d
), this is registered in the meter's event logger for voltage quality. The registration includes date and
hour. The time period which triggers a registration can be configured between 10 secs. and 2550 secs.
The limits for registration of overvoltage and undervoltage are configurable from 0 to 20 %, i.e. from 230 VAC – 20
% (184 VAC) to 230 VAC + 20 % (276 VAC).
Time
Voltage
230 V
U
Low
U
High
t
1
t
2
t
3
t
4
t1+ t
d
t3+ t
d
U
Max
U
Min
Over voltage
Under voltage
Figure 5: Voltage quality measurements - under and over voltages.
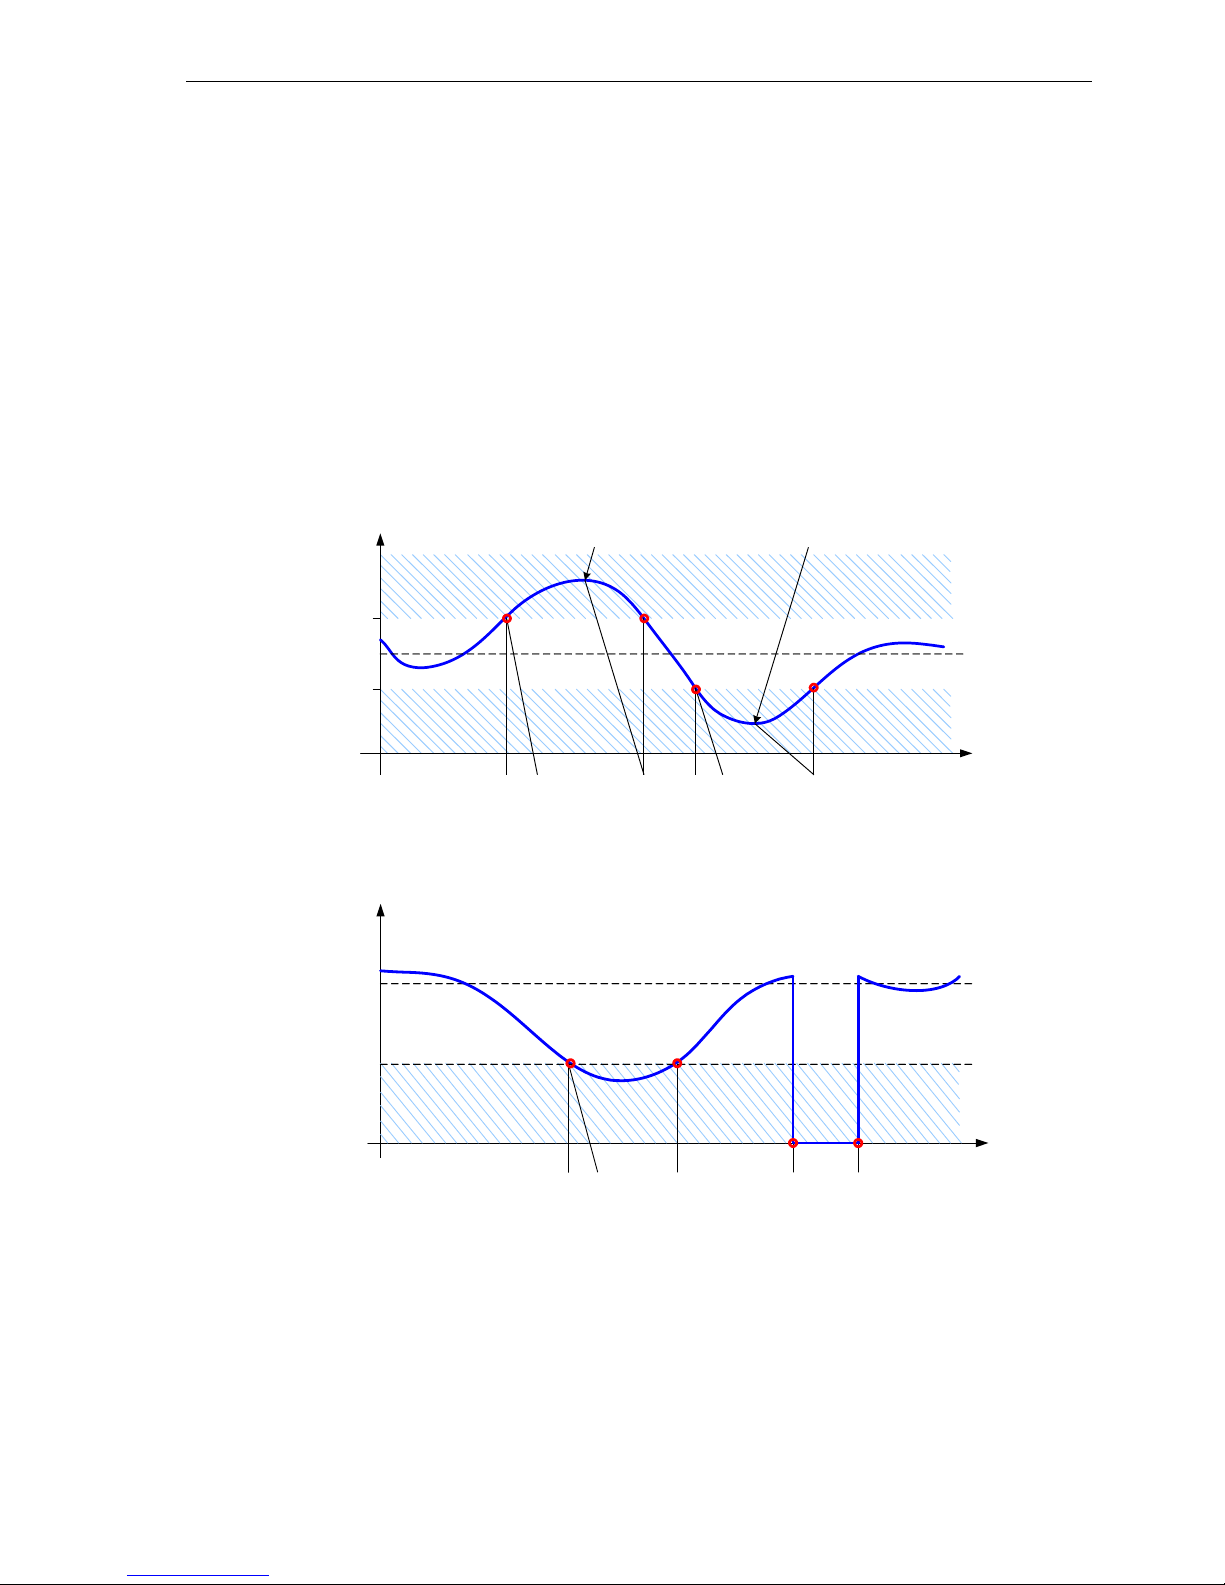
Time
Voltage
230 V
t
1
t
2
t
3
t
4
t1+ t
d
U
Cutoff
= 160 V
Voltage cut off
Figure 6: Voltage quality measurements - voltage cut-off.
Figure explanation
U
High
is the configurable limit for overvoltage in %
U
Low
is the configurable limit for undervoltage in %
U
max
is the peak voltage in the overvoltage period (t1 – t2)
U
min
is the minimum voltage in the undervoltage period (t3 – t4)
U
Cutoff
is the voltage failure per phase (t3 – t4)
t
(1-4)
indicates RTC.
TECHNICAL DESCRIPTION Kamstrup 162M/382M
5512-1040 GB/05.2012/Rev. C1
18
3.5.3 Registration of voltage failures
Voltage failures on one or more phases lasting longer than the configurable time periode (t
d
) are registered in the
event logger with time stamps at voltage dropout (t
3
) and voltage recovery (t4) in Figure 6.
The time for the event is registered with date and hour.
The time for how long a voltage failure should last before it is registered in the voltage quality logger can be
configured in steps of 10 secs. The range is between 0 and 2550 seconds.
3.5.4 Time stamp with RTC
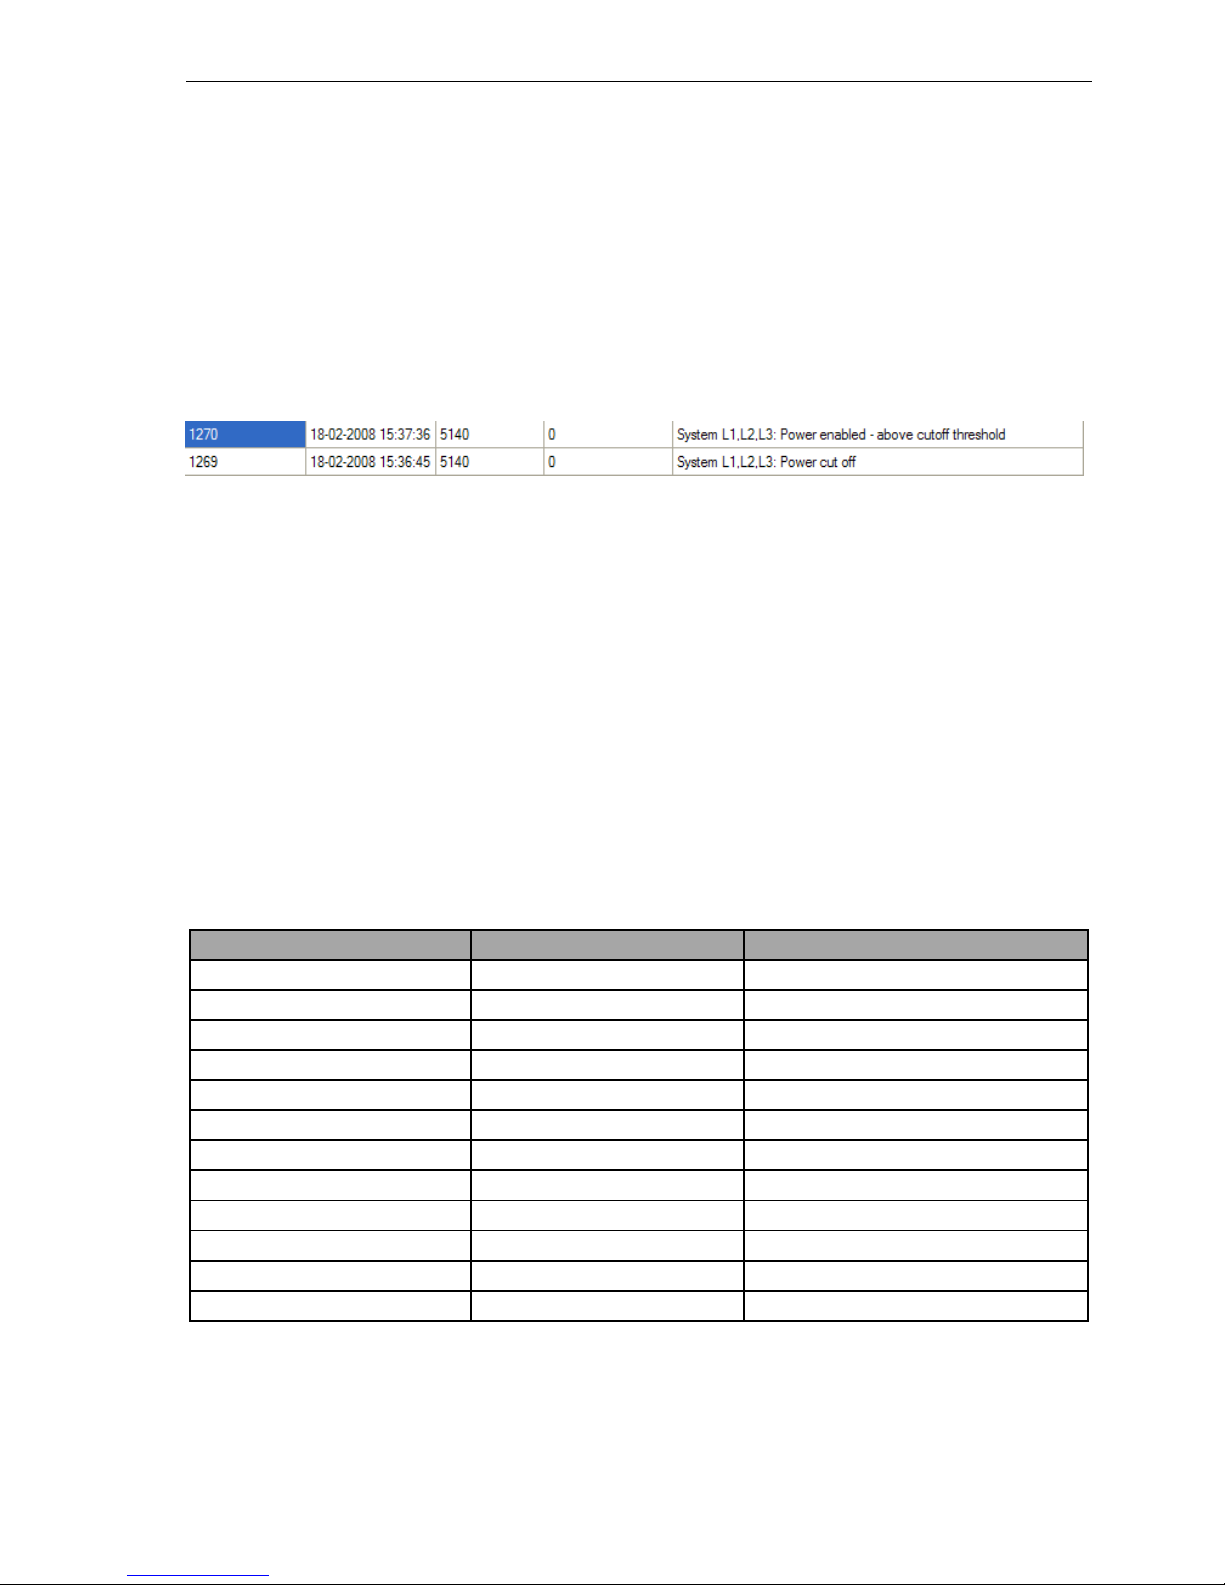
The time registration is made both at the the apperance of the voltage failure and at the return of voltage. An
example of this registration can be see in Figure 7, showing a read out from METERTOOL.
Figure 7: Logger registration of a voltage failure and re-power with correspondng log IDs and time stamps.
3.6 Loggers
The meter has several different loggers for registration of data and events, among others a debiting logger and
different loggers that secure the registration of events – as to internal errors, magnetic influence, access
registration (Tamper), clock, and voltage failure, load profile logger, andan analysis logger. The load profile and
analysis loggers share the same logging depth, which means that the depth of the analysis logger depends on the
logging depth of the load profile logger and thus the configuration of the meter.
3.6.1 Debiting logger
The debiting logger stores relevant data for a given period. The end of a debiting period is called debiting stop. A
debiting stop can be triggered by the meter’s internal clock or via a communication command.
With its logging depth of 36 loggings, the debiting logger makes it possible to store data for many purposes, e.g.
as a monthly logger controlled by either an internal RTC or an external unit. In the standard version, the loggings
are initiated by the meter’s time. The time for debiting stop has many options, e.g. monthly, every other month,
every six months or yearly.
The debiting logger stores the following values at debiting stop depending on the meter’s configuration:
Various Energy registers Power registers
Date Active energy A+
Peak power P+
max acc
Time Active energy A-
Peak power P+
max
Date
Quality info Reactive energy R+
Peak power P+
max
Hour
Hour counter Reactive energy R-
Accumulated peak power P+
max acc
Number of debiting periods Active energy A+ Tariff 1
Peak power P+
max
Tariff 1
Power threshold counter
Active energy A+ Tariff 2
Peak power P+
max
Tariff 1 Hour
Pulse input Active energy A+ Tariff 3
Peak power P+
max
Tariff 1 Date
Active energy A+ Tariff 4
Peak power P+
max
Tariff 2
Reactive energy R+ Tariff 1
Peak power P+
max
Tariff 2 Hour
Reactive energy R+ Tariff 2
Peak power P+
max
Tariff 2 Date
Reactive energy R+ Tariff 3
Reactive energy R+ Tariff 4
Table 3: Registers stored in debiting logger.
A combined RTC/Quality stamp includes besides time and date, a data quality mark, that validates each
registration of eventually time adjustments and/or voltage quality events, i.e. over and under voltages and
voltage interrupts.

TECHNICAL DESCRIPTION Kamstrup 162M/382M
5512-1040 GB/05.2012/Rev. C1
19
3.6.2 Debiting logger 2
In addition, the meter has a debiting logger 2, which logs the following registers:
Various Energy registers
Date Active energy A+
Time Active energy A-
Quality info Reactive energy R+
Hour counter Reactive energy R-
Active energy A+ Tariff 1
Active energy A+ Tariff 2
Active energy A+ Tariff 3
Active energy A+ Tariff 4
Active energy A- Tariff 1
Active energy A- Tariff 2
Active energy A- Tariff 3
Active energy A- Tariff 4
Reactive energy R+ Tariff 1
Reactive energy R+ Tariff 2
Reactive energy R+ Tariff 3
Reactive energy R+ Tariff 4
Reactive energy R- Tariff 1
Reactive energy R- Tariff 2
Reactive energy R- Tariff 3
Reactive energy R- Tariff 4
Table 4: Registers stored in debiting logger 2.
The log interval can be configured to one day, one week or one month via METERTOOL. The logging depth is 45
loggings.
The log interval is Kamstrup factory standard which is one day.
3.6.3 Load profile logger
Kamstrup’s directly connected meters have an internal load profile logger that registers the energy with a
configurable interval, with the possibility of readouts, if required.
The meter enables the read-out of energy values in the load profile logger as both absolute and relative (delta)
values. Every data set includes log ID, RTC/Quality stamp and up to four energy registers.
The log ID is the meter’s identification of the data set and is only used in connection with readout. The RTC time
stamp indicates time of logging data in date and hour together with validation information. The number of register
values depends on the meter’s configuration of energy types.
The number of energy registers for which the meter is configured determines the number of registers for which the
load profile is logged.
The RTC/Quality stamp includes time, date and a data quality info, that validates each registration of eventually
time adjustments and/or voltage quality events, i.e. over and under voltages and voltage interrupts.
Readout can take place by means of the open standard DLMS or Kamstrup's own protocol KMP. The data format at
readout depends on whether absolute values or relative values are read out. The format of absolute values
follows the format in which data is registered (7.2), whereas the format of the relative values is [3.2] (XXX.XX)
kWh.
TECHNICAL DESCRIPTION Kamstrup 162M/382M
5512-1040 GB/05.2012/Rev. C1
20
The registration interval follows the integration period, and the integration period can be changed after the
commissioning.
IMPORTANT: If the integration period is changed, the load profile logger is deleted.
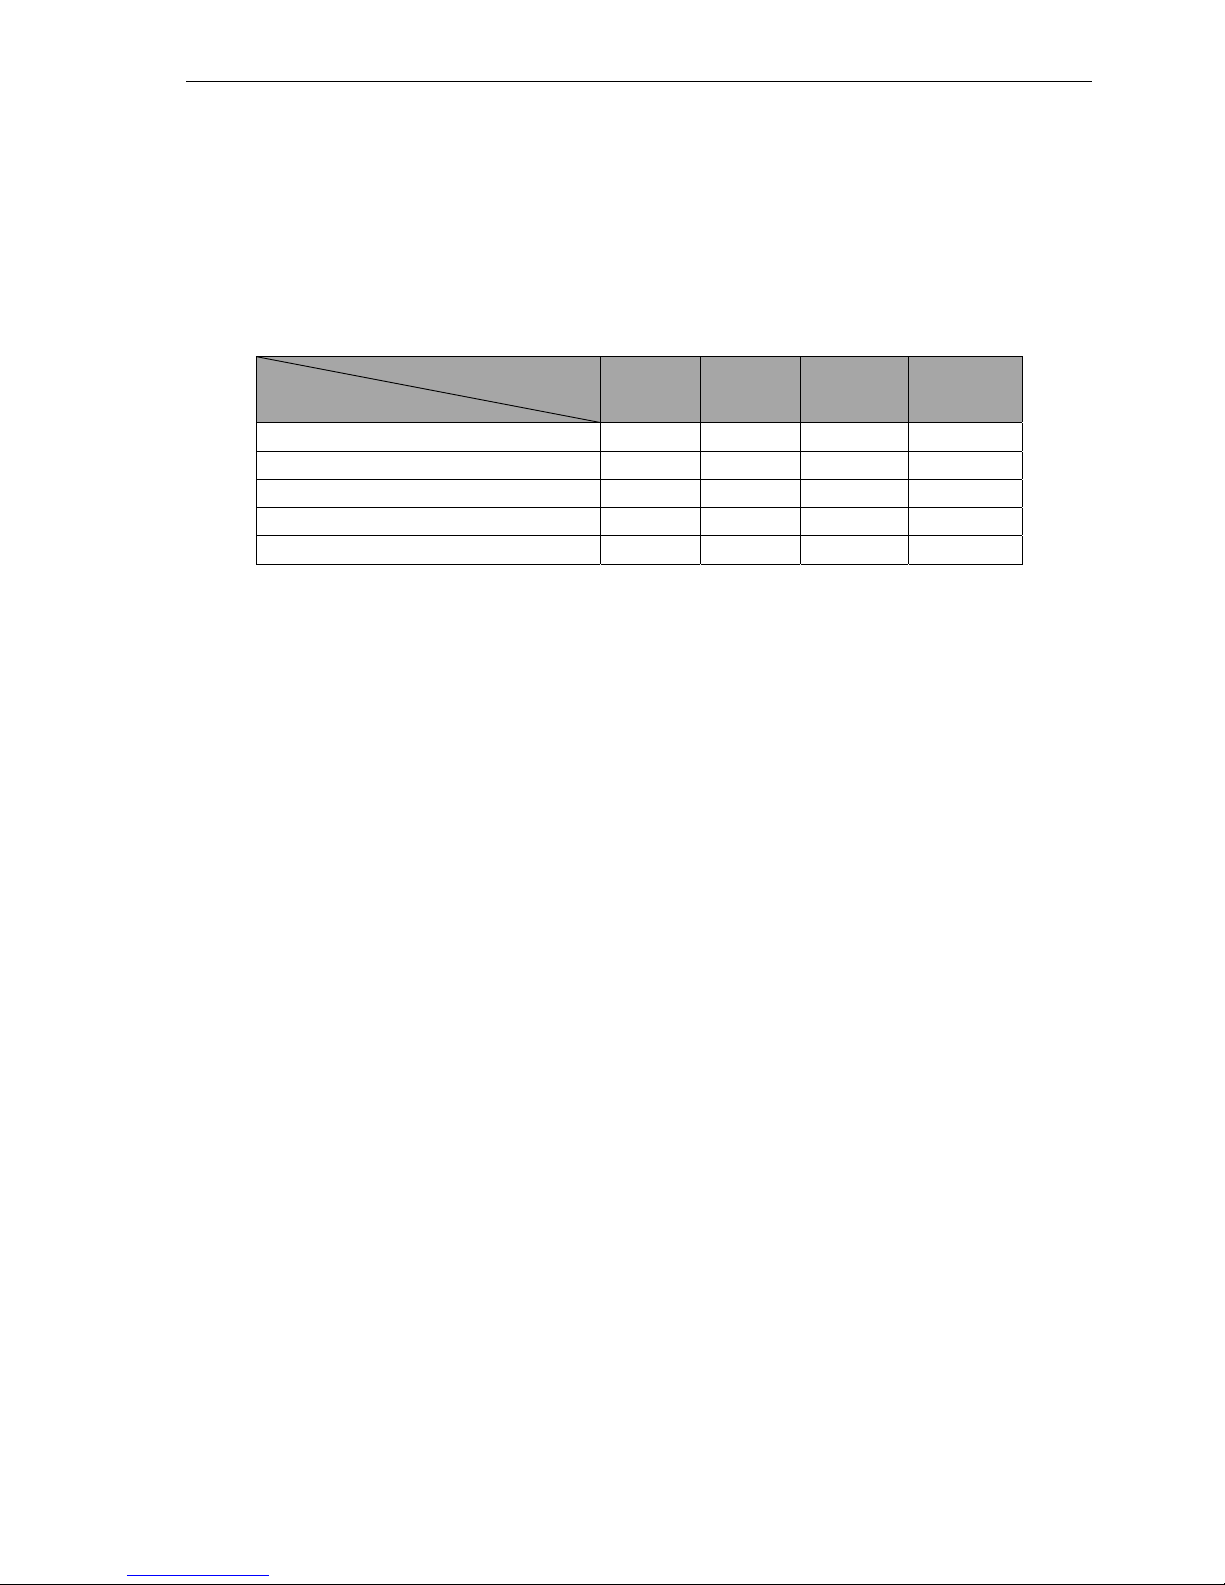
The logging depth of the load profile depends on the configuration of energy type and integration period for the
meter.
Integration period
Energy type
5 min.
Days
15 min.
Days
30 min.
Days
60 min.
Days
A+ 199
597
1194 2388
A+/A- 113
341
682 1364
A+/R+ 113
341
682 1364
A+/R1 113
341
682 1364
A+/A-/R+/R- 61
183
367 734
Table 5: Logging depth of load profile logger.
The logging depth of the load profile logger is pre-configured to 130 days when the integration period is 15, 30 or
60 min. The logging depth of 130 days is, however, a default setting which subsequently can be changed via
system upgrade. The remaining part of the memory is dedicated to an integrated analysis logger. Furthermore, the
load profile logger can be read out on the meter display as described in section 4.11.

TECHNICAL DESCRIPTION Kamstrup 162M/382M
5512-1040 GB/05.2012/Rev. C1
21
3.6.4 Analysis logger
The analysis logger allows the client to configure the registers to log and the log interval. Up to 16 simultaneous
registers can be chosen. The log interval can be configured to 5, 15, 30 or 60 min. or 1 day. The logging depth of
the analysis logger varies from 7 days to approx. 520 days, depending on the number of registers, which registers
to log and the chosen log interval. Table 6 shows the registers that can be chosen for the analysis logger.
Description
Active energy A+ Reactive energy R+ Tariff 7
RTC status
Active energy A- Reactive energy R+ Tariff 8
VCOPCO status
Active energy A1423
Reactive energy R- Tariff 1
Voltage L1
Reactive energy R+
Reactive energy R- Tariff 2
Voltage L2
Reactive energy R- Reactive energy R- Tariff 3
Voltage L3
Reactive energy R1
Reactive energy R- Tariff 4
Current L1
Reactive energy R4
Reactive energy R- Tariff 5
Current L2
Active energy A+ Tariff 1 Reactive energy R- Tariff 6
Current L3
Active energy A+ Tariff 2 Reactive energy R- Tariff 7
Actual power P+ L1
Active energy A+ Tariff 3 Reactive energy R- Tariff 8
Actual power P+ L2
Active energy A+ Tariff 4 Peak power P+
Actual power P+ L3
Active energy A+ Tariff 5 Peak power P-
Power extreme value
Active energy A+ Tariff 6 Peak power Q+
Power event
Active energy A+ Tariff 7 Peak power Q-
Logger status
Active energy A+ Tariff 8 Actual power P+
Cut-off state
Active energy A- Tariff 1 Actual power P-
P+ max
Active energy A- Tariff 2 Actual power Q+
P+
min.
Active energy A- Tariff 3 Actual power Q-
P+
max – Clock
Active energy A- Tariff 4 Acc. peak power P+
P+
max – Date
Active energy A- Tariff 5 Acc. peak power P-
P+
max – RTC
Active energy A- Tariff 6 Acc. peak power Q+
P-
min. – Clock
Active energy A- Tariff 7 Acc. peak power Q-
P-
min. – Date
Active energy A- Tariff 8 Pulse input
P-
min. – RTC
Reactive energy R+ Tariff 1 Hour counter
Average voltage L1
Reactive energy R+ Tariff 2 Active tariff
Average voltage L2
Reactive energy R+ Tariff 3 Peak power P+ Tariff 1
Average voltage L3
Reactive energy R+ Tariff 4 Peak power P+ Tariff 2
Average current L1
Reactive energy R+ Tariff 5 Power threshold value
Average current L2
Reactive energy R+ Tariff 6 Power threshold counter
Average current L3
Table 6: Registers available for analysis logger.

TECHNICAL DESCRIPTION Kamstrup 162M/382M
5512-1040 GB/05.2012/Rev. C1
22
The analysis logger can be configured and read out via METERTOOL. It is not possible to configure the analysis
logger from the factory. The meter is supplied with a default configuration as shown for each meter type in the
following table.
The log interval of the analysis logger is default set to 15 min. This can be changed via METERTOOL. The default
setup of the analysis logger can be seen in Table 7.
Meter Type Single-phase Poly-phase
Registers in the load
profile logger
Default
registers in the
analysis logger
1
register
2 registers
4 registers
1
register
2 registers 4 registers
A+ (A+, A-
)
(A+, R+) (A+, A-, R+, R-
)
A+
(A+, A-) (A+, R+) (A+, A-, R+, R-
)
Actual power P+
X X X X X X X X
Actual power P-
X X X X
Actual power Q+
X X X X
Actual powerQ-
X X
Average voltage L1
X X X X X X X X
Average voltage L2
X X X X
Average voltage L3
X X X X
Average current L1
X X X X X X X X
Average current L2
X X X X
Average current L3
X X X X
Logging depth of
analysis logger
1
*
[Days]
77 50 5o 17 41 29 29 11
Table 7: Default setup for analysis logger.
Average phase voltage and phase current are calculated as the mean value during the integration period
configured for the analysis logger.
Phase currents are show as abolute values, i.e. with no sign to indicate the direction of the current.
3.6.5 Event logger for status
The status logger registers internal errors and can thus be used as an analytical tool to show the meter’s
condition.
The RAM is tested during start-up writing and reading, and both EEPROM and ROM are tested by checksum
calculation. Internal errors are indicated by a warning triangle in the display and cannot be reset without the
meter being returned to Kamstrup A/S.
The status logger registers with time stamp whether the meter has been exposed to magnetic influence or the
meter over has been dismounted (access control).
The status logger has a depth of 200 loggings.
3.6.6 Event logger for RTC
A logger in the meter stores information about changes/adjustments of the clock in the form of date/time before
and date/time after adjustment. Only adjustments of a specific size will be registered in the lock. The minimum
time for an adjustment to be logged is configurable, and the default value is 7 seconds. The value range is
between 0 and 255 seconds.
The RTC logger has a depth of 200 loggings.
1
The logging depth of the analysis logger depends on the integration period of the load profile logger. The stated
logging depths are calculated on the basis of an integration period of 15 min.

TECHNICAL DESCRIPTION Kamstrup 162M/382M
5512-1040 GB/05.2012/Rev. C1
23
3.6.7 Event logger for voltage quality
Voltage failures are possible on one or two independent phases or on all three phases. The lmeter registers
voltage failures that last longer than minimum 1 second. No matter how many phases the voltage failure applies
to, the time of the voltage dropout will be registrered, and it will also be registered when the voltage returns, as
described in Figure 6. The logger stores the phases that the failure applies to and during which period.
Voltage failure is defined as voltage below 160 VAC 5 %. The voltage failure logger has a depth of 200 loggings.
3.6.8 Event logger for the load profile logger
The logger registers all changes in the legal logger. A change in the configuration of the legal logger will, as
mentioned in a previous section, mean that all data in this legal logger are deleted. Therefore, every change in the
legal logger is registered with a timestamp. The event logger has a logging depth of 10 loggings.
3.6.9 Event logger for Cut off
A meter with breaker includes a logger that registers all events related to the disconnect functionality. For each
event, that be a disconnection, a release or a reconnection, the meter logs an ID, a timestamp, the disconnect
state (according to Figure 18) and the connection feedback.
3.6.10 Event logger for neutral fault
The logger registers errors in the supply network. The purpose with this logger is to register if the attached
electronic equipment is exposed to overvoltage, which can damage the equipment and/or cause injury to person
due to fire.
In meters with build in breakers, there is furthermore a possibility to switch off the supply out of the meter in case
of neutral fault detection.
Neutral fault detection only applies to the three-phase, 4-wire metertype.
Figure 8 illustrates when a missing or faulty neutral is detected.
Figure 8: Neutral fault detection.
This means it is only possible to detect missing or faulty neutral before the meter(marked green), not after the
meter(marked red).
The neutral fault detection is based on voltage measurements and voltage thresholds.

TECHNICAL DESCRIPTION Kamstrup 162M/382M
5512-1040 GB/05.2012/Rev. C1
24
Figure 9: Neutral fault measurement principle.
Figure 9 shows a situation without neutral fault and one with neutral fault. When the netraul fault is present the
load is asymmetric and the neutral fault voltage VN occurs.
The green vectors indicate the phase voltages on the grid. The yellow vectors indicate the phase voltages
measured by the meter.
The neutral fault is detected, when the following conditions are present:
Two of the phase voltages VL1, VL2 and VL3 must be above the threshold voltage VLHiTh.
One of the phase voltages VL1, VL2 and VL3 must be below the threshold voltage VLLoTh.
Condition 1 and 2 must be present in a time period longer than the period Time.
VLLoTh = 230V - VNTh
Figure 10: Neutral fault detection range.

TECHNICAL DESCRIPTION Kamstrup 162M/382M
5512-1040 GB/05.2012/Rev. C1
25
In Figure 10 to the left, the yellow areas indicate when the neutral fault will detected.
Figure 10 to the right shows a situation where the neutral fault is detected, where the conditions are:
VL1 < VLLoTh
VL2 > VLHiTh
VL3 > VLHiTh
The parameters VNTh, VLHiTh and Time can be configured with the registers: (shown with default values)
NeutralFaultVNTh = 40 VAC
NeutralFaultVLHiTh = 253 VAC
NeutralFaultTime = 60 s
Under some conditions a neutral fault is not detected. In Figure 10, fault is not detected in the white areas.
In conditions with symmetric load the neutral fault voltage VN will theoretically be zero volts and neutral fault will
not be detected, even if the neutral is missing. Table 8 lists the parameters that are logged in the neutral fault
logger.
Various Event registers
Date and time
Neutral Fault
Hour counter
Table 8: Neutral fault detection parameters.
The Neutral Fault Logger has a depth of 45 loggings.

TECHNICAL DESCRIPTION Kamstrup 162M/382M
5512-1040 GB/05.2012/Rev. C1
26
3.7 Pulse inputs/outputs
As default the meter has an S0 pulse output (described in section 3.7.5) and two available I/O (input/output)
ports in the module interface. The use of one or both I/O ports in the module area requires that the meter is
equiped with a primary module that supports the wanted functionality.
The S0 output provides 1000 pulses/kWh permanently, whereas the I/O module is configurable as to length and
number of pulses. The S0 output always follows the blinks from the LED light-emitting diode.
3.7.1 Pulse inputs in the module area
The pulse inputs in the module area (module I/O) can be configured for the following functions depending on the
meter’s configuration:
- Tariff control, see also Table 2.
- Pulse input from other units.
- Alarm input for the registration of an external alarm.
The pulse input accumulates pulses in the pulse input register. If this reigister is shown in the display, it is
updated every 10 seconds. It is possible to scale the reading of the pulse input by a ”pulse division factor” in the
range from 0.100 to 1000.000 units per pulse. The maximum permissible frequency for input pulses is 25 Hz.
In connection with the pulse input register, the following units can be selected: kWh, m
3
, l,”none”.
3.7.2 Water meters
A water meter emits 1 imp/25 l. The required reading in the electricity meter’s display is m
3
without decimals.
1000 l = 1 m
3
, 1000 / 25 = 40 Pulse division factor to be set to 40.
The electricity meter count will be incremented by one every 40 pulses, i.e. indication in m3 without decimals.
The most frequently used pulse values appear from Table 9.
Pulse value
l/Imp
Pulse value
Imp/m3
Pulse division factor
Display indication in ”m3 ”
Pulse division factor
Display indication in ”l”
100 10 10
-
50 20 20
-
25 40 40
-
10 100 100
0.1
5.0 200 200
5
2.5 400 400
2.5
1.0 1000 1000
1
1000 1 1
1000
Table 9: Pulse values for water meters.

TECHNICAL DESCRIPTION Kamstrup 162M/382M
5512-1040 GB/05.2012/Rev. C1
27
3.7.3 Electricity meters
Table 10 shows a similar list of pulse values for electricity meters.
Pulse value
Wh/imp
Pulse value
Imp/kWh
Pulse division factor
Display indication in ”
kWh ”
100000 0,01
-
10000 0,1
0.1
1000 1
1
16.67 60
60
13.33 75
75
8.333 120
120
4.167 240
240
2.941 340
340
2.083 480
480
1.667 600
600
1.000 1000
1000
0.100 10000
-
Table 10: Pulse values for electricity meters.
3.7.4 Pulse outputs in module area
The pulse outputs in the module area can be configured for pulse outputs for both active and reactive energy.
As standard, the pulse outputs send 1000 pulses/kWh, but can be configured for a pulse division factor between
1 – 1000. In addition, the pulse width can be configured for 30 or 80 msecs.
When selecting pulse division factor and pulse width, please be aware that the number of pulses at max load is
not exceeding the number which the meter is able to send via the pulse output.
Pulse value
Imp/kWh, Imp/kvar
Pulse duration /
pulse pause
30 msecs. 80 msecs.
1 100A
100A
10
100A
100A
100
100A
100A
1000
86A
32A
10000
8.6A
3.2A
Table 11: Maximum load current at different pulse values.
3.7.5 S0 output
The S0 output provides 1000 pulses/kWh permanently and the pulses are synchronized with the S0-LED.
The SO output is specified according to the standard DIN 43864 and Figure 11 shows the placement of the S0
ouput connector.
The maximum voltage that can be connected to the SO output is 27 V DC (at 1 k), and the maximum current
which can be drawn through the output is 27 mA.

TECHNICAL DESCRIPTION Kamstrup 162M/382M
5512-1040 GB/05.2012/Rev. C1
28
S0
S0-LED
Figure 11: The S0 output on a three-phase meter.
Table 12 lists the technical specification for the S0 output.
The status of
the pulse sensor
Test conditions Test data
Supply voltage
UB
Internal resistance
RV
Current through the
SO output
On (active) 18 V DC
1 k
i
> 10 mA
Off (inactive) 27 V DC
1 k
i
< 2 mA
Table 12: S0 technical specification.
On the three-phase meter with APS (Auxillary Power Supply) the S0-output is not available. S0 output can then
only be achieved as a module interface.
3.8 Auxillary Power Supply
The meter can optional be configured with an Auxillary Power Supply (APS) functionality. The function allows to
supply the meter with 230VAC on a separate input as shown in Figure 12. The functionality is usefull when a
external breaker is installed before the meter in an installation.
L1
L3
L2
N
APS
Figure 12: APS functionality.
When the meter is configured for APS functionality it doesn’t have a S0 output, as the connector is used for the
230 V APS input.

TECHNICAL DESCRIPTION Kamstrup 162M/382M
5512-1040 GB/05.2012/Rev. C1
29
3.9 Alarm handling/Push alarms
The meter can be configured to give alarms when specific events are registered by the meter. Events that can be
configured to generate push alarms are:
- Magnetic detection
- Tamper detection
- Internal meter error
- Under and over voltage detection
- Missing phase voltage detection
The alarms will be transmitted via Kamstrup radio communication (if the meter is with Radio) for use in Kamstrup
AMR systems, or on the module port. For further details about alarms and configuration, please contact Kamstrup.
3.10 Load control
As an option it is possible to mount a two relay load control module in the meter. The relays can be used to
control (On/Off) external installations. The control of the relays can be done by:
- Predefined (configurable) Load control tables - managed by the meter.
- By remote command – managed by system.
See more about configuration of the load control in section 10.4.

TECHNICAL DESCRIPTION Kamstrup 162M/382M
5512-1040 GB/05.2012/Rev. C1
30
4 Display
The display makes it possible to read out the meter’s registers. Which registers depends on the current
configuration. It is possible for customers to select individual display configurations.
The display is composed by segments as shown in Figure 13 and includes the following readings:
Value field
Unit field
Mains voltage readings of phases L1, L2 and L3
Phase current direction
Phase sequence (For future use)
Module indication (For future use)
Radio-symbol (For future use)
Readings of tariffs T1-T8
Quadrant reading, which states current quadrant(s) and thereby the actual power type P+, P-, Q+, Q-
Status reading
Breaker status
Tamper indication (For future use)
Prepayment indication (For future use)
7-digit identification field
4-digit text-field
The display function depends on the current configuration. The required configuration can be preprogrammed
from the factory or configured by means of the configuration tool METERTOOL for kWh meter. Display
configuration is described in section 4.10.
Quadrant
reading
7-digit identification field
OBIS-field
Value field
Unit
field
Text field
RF-
symbol
Breakersymbols
Tamper
symbol
Error-
symbol
prepayment-
symbol
Tariff
reading
Phase
sequence
symbol
Mains voltage
reading
Phase current
indication
Module
indication
Figure 13: Display layout.

TECHNICAL DESCRIPTION Kamstrup 162M/382M
5512-1040 GB/05.2012/Rev. C1
31
4.1 Value field
This field is used for displaying register values. The number of register values depends on the meter's
configuration. The value field reading depends on the value stated as well as the meter’s set-up. Meter numbers,
special data etc. are indicated by 8 digits, energy is stated in [6.1], or [7.0] format kWh/kvar, and power in [2.3]
format (00.000) kW/kvar. Date/time is stated according to the format YY:MM:DD and HH:MM:SS.
The value field can be configured to display leading zeroes of energy readings.
4.2 Unit field
The unit field is used for displaying the units of registers in the value field.
4.3 Text field
The text field can be used either for additional information to the unit field regarding values in the value field or
for text information. In the latter case, text messages are shown as sliding letters in the field.
4.4 Mains voltage reading
The mains voltage readings per phase L1, L2 and L3 indicates whether voltage is applied to the individually
phase input terminal or not.
Indications L1, L2, L3 Indicate
On The voltage is above minimum limit (160V).
Off The voltage is below minimum limit (160V).
Table 13: Main voltage indication.
The minimum voltage limit is 160 VAC 5 %. If the voltage remains below minimum limit for more than 1 second
in all phases, the meter is reset and the processor shuts down. Subsequently, the meter carries out a normal
start.
4.5 Phase current indication
The direction of the current for each phase is shown with these indicators. It can be useful when checking of
correct input/output installation.
Indications - + Indicate
On The load is above minimum limit (2.3W).
Off The load is below minimum limit (2.3W).
Table 14: Phase current indication.
The minimum load limit is approx. 10 mA. If the phase current is lower than this value, energy registration stops
and the phase current indication turn off in the display.

TECHNICAL DESCRIPTION Kamstrup 162M/382M
5512-1040 GB/05.2012/Rev. C1
32
4.6 Tariff indication
The tariff indicator can show T1, T2, T3, T4, T5, T6, T7 and T8 to indicate the currently active tariff. The tariff
reading is updated every 10 sec., i.e. it may take up to 10 seconds from a tariff shift until the current reading is
displayed.
The tariff indication are switched off if a display configuration without tariff reading has been selected.
4.7 Current quadrant reading
The total load is indicated by the arrows for imported active power, exported active power, inductive reactive
power and capacitive reactive power, respectively.
The current quadrant reading is an instantaneous total value for all three phases. The reading is not active when
the load is below the minimum limit of 10 mA RMS.
This reading is On/Off-configurable.
4.8 Breaker status
If the meter is configured with an internal breaker, the position of the breaker is indicated as either connected or
disconnected.
4.9 Object identification field
Field for identification of the value in the value field. Uses OBIS codes in connection with identification.
This reading can be opted out.
The identification field is constructed as CC.DD.E.FF.
CC represents the quadrant in which the registration is made.
DD The physical size.
E Tariffings.
FF Debiting data (historical data).
The most frequently used values are stated in the table below.
CC (energy types) DD (physical sizes) E (tariffings) FF (debiting data)
1 – active + quadrants 1+4 _2 – accumulated peak
power
0 – No tariff
99 – latest
historical value
2 – active – quadrants 2+3 _6 – peak power
1 – Tariff 1
98 – latest
historical value + 1
3 – reactive + quadrants
1+2
_8 – Energy
2 – Tariff 2
4 – reactive – quadrants
3+4
3 – Tariff 3
4 – Tariff 4
Table 15: OBIS table.
Apart from these values, there are several others. For a complete list, see Error! Reference source not found. Error!
Reference source not found..
TECHNICAL DESCRIPTION Kamstrup 162M/382M
5512-1040 GB/05.2012/Rev. C1
33
4.10 Display configuration
The display configuration is composed by three reading lists which can be configured as required. However, legal
readings are mandatory and cannot be deselected of the lists.
The automatic shift function (scroll) changes every 10 seconds between the selected readings in the required
order. Up to 16 readings can be selected.
At the manual shift function, the shift is effected when activating the push button. The shift is effected when you
release the push button. Again, the order is configurable and up to 30 readings can be selected.
If the meter is configured with battery backup unit, it is possible to select a battery-operated shift function, which
makes it possible to read the display without the meter being mains supplied. The shift is effected by activating
the push button. Up to 8 readings can be selected.
The meter automatically returns from manual shift function to automatic scroll function two minutes after the last
activation of the push button.
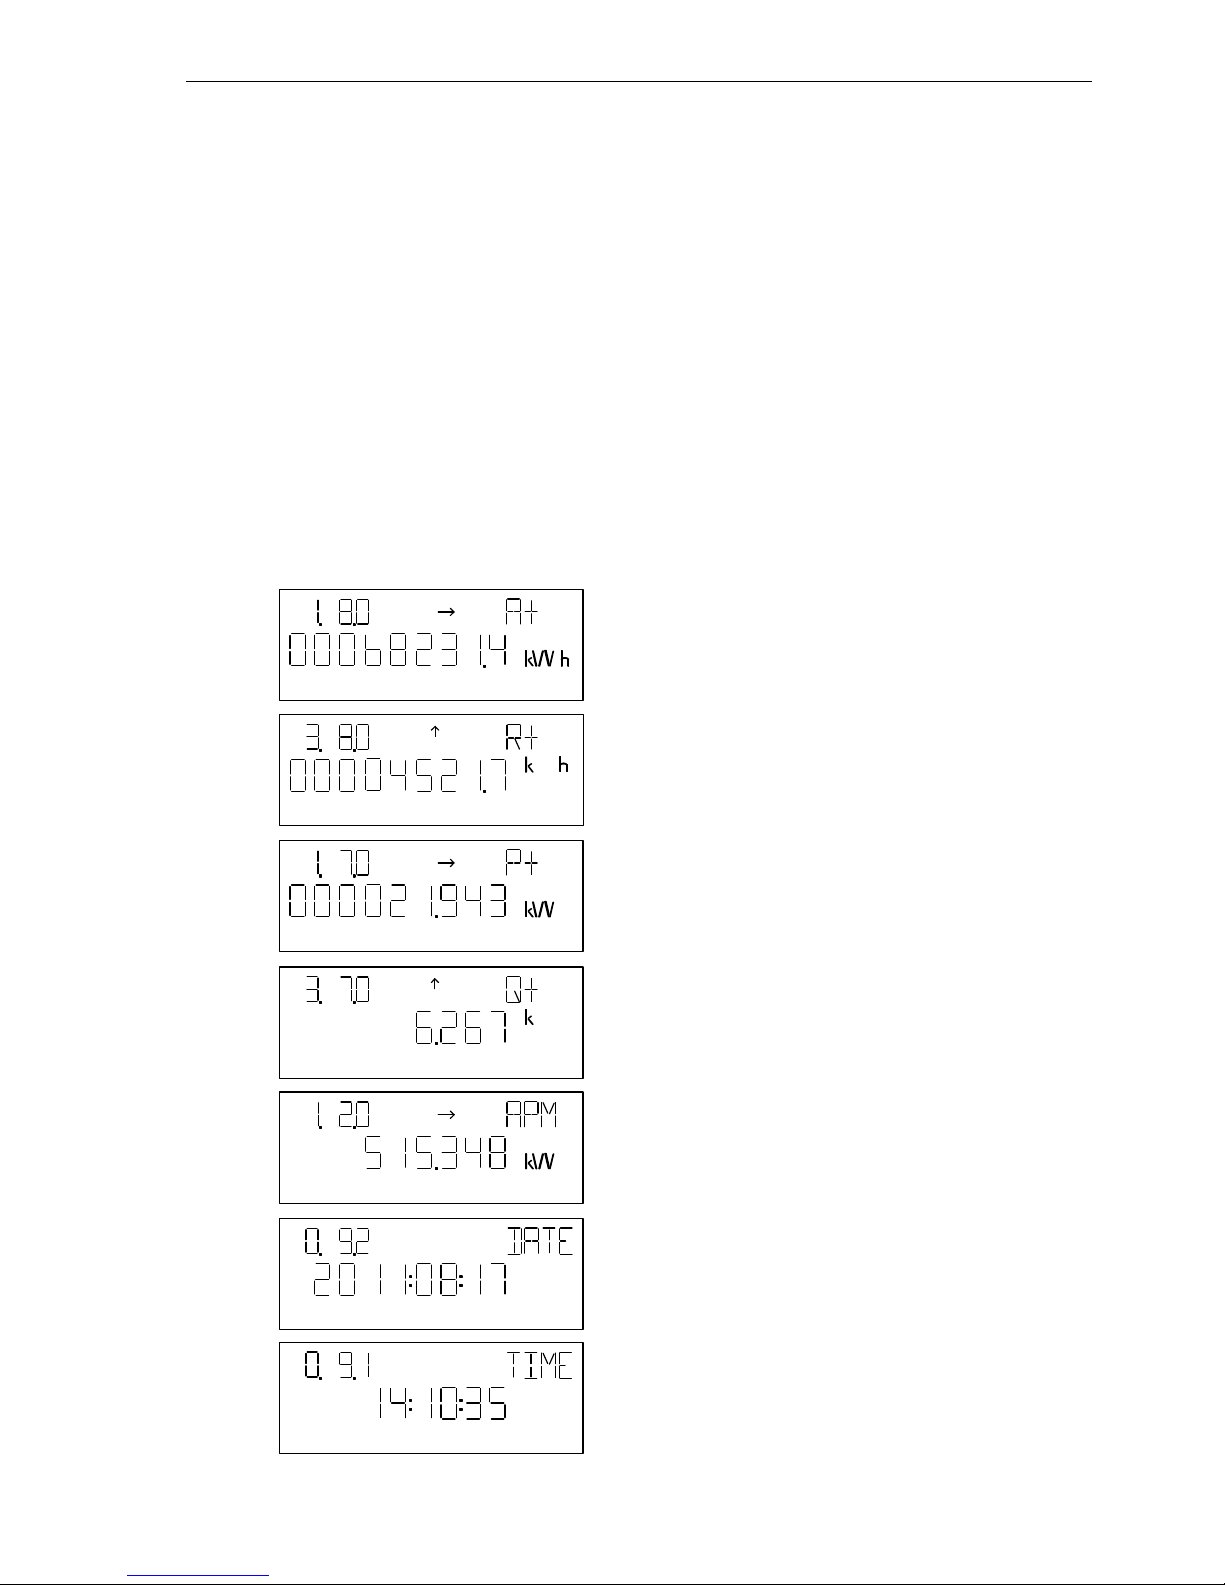
The display reading can be composed e.g. as shown in the example below. To view a complete list of possible
display readings, see 10.3 Display readings.
Automatic scroll
Active energy A+ in 6.1 format,
OBIS code/power arrow, leading zeros.
Reactive energy R+ in 6.1 format,
OBIS code/power arrow, leading zeros.
Active instantaneous power P+ , in 4.3 format,
OBIS code/power arrow, leading zeros.
Reactive instantaneous power Q+, in 4.3
format, OBIS code/power arrow.
Accumulated peak power P+ in 4.3 format,
OBIS code/power arrow.
Date, OBIS code.
Time, OBIS code.
+P
L1
L2 L3
+Q
var
+P
+Q
var
+P
L1
L2 L3
L1
L2
L3
L1
L2 L3
L1
L2 L3
L1
L2 L3
L1
L2 L3
TECHNICAL DESCRIPTION Kamstrup 162M/382M
5512-1040 GB/05.2012/Rev. C1
34
Manual scroll
In manual scroll there is the same list of available registers. Additional, two registers are only available for
manual scroll; Historical values and load profile.
Historical values (Debiting logger)
Load profile logger
From these display readings, it is possible to go to read out the register values in the meter’s memory by
activating the push button.
In the debiting logger it is possible to step through the values by a short push on the left pushbutton. For every
registration in the debiting logger, the following historical values are displayed:
OBIS code Register
0. 9.2. XX Date
0. 9.1. XX Hour
96. 8.0. XX Hour counter
1. 8.0. XX Active energy A+
1. 8.1. XX Active energy A+ Tariff 1
1. 8.2. XX Active energy A+ Tariff 2
1. 8.3. XX Active energy A+ Tariff 3
1. 8.4. XX Active energy A+ Tariff 4
2. 8.0. XX Active energy A-
3. 8.0. XX Reactive energy R+
4. 8.0. XX Reactive energy R-
1. 6.0. XX Peak power P+ ma
x
1. 6.0. XX Peak power P+ max date
1. 6.0. XX Peak power P+ max hour
1. 6.1. XX Peak power P+ max Tariff 1
1. 6.1. XX Peak power P+ max Tariff 1 date
1. 6.1. XX Peak power P+ max Tariff 1 hour
1. 6.2. XX Peak power P+ max Tariff 2
1. 6.2. XX Peak power P+ max Tariff 2 date
1. 6.2. XX Peak power P+ max Tariff 2 time hour
1. 2.0. XX Accumulated peak power P+ acc. ma
x
0. 1.0. XX Number of debiting periods
0.128.1. XX Pulse input
Table 16: Historical values shown in the display when reading out debiting logger.
It is possible to go to the next registration period by activating the push button approx. 2 seconds. “XX” indicates
from which period the data is. The latest (newest) log period has number 00 and the last (oldest) period can be
number 35.
L1
L2 L3
L1
L2 L3
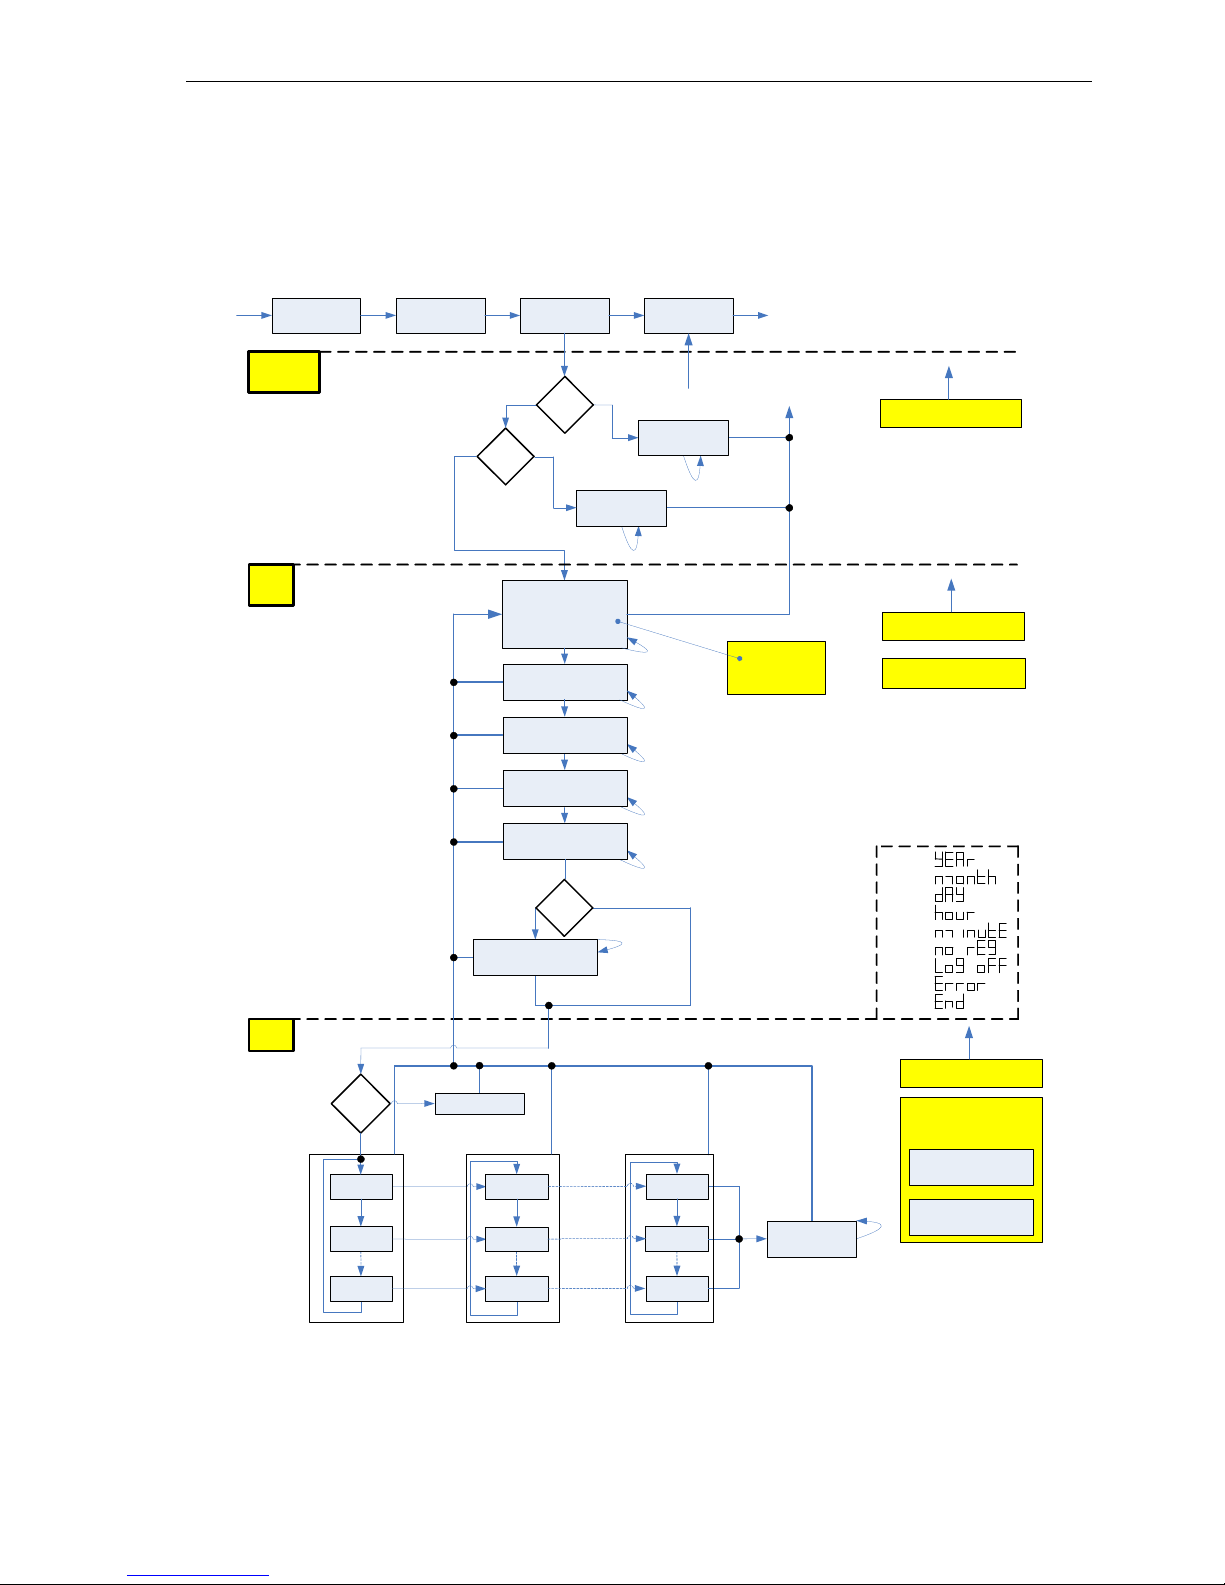
TECHNICAL DESCRIPTION Kamstrup 162M/382M
5512-1040 GB/05.2012/Rev. C1
35
4.11 Display read-out of load profile logger
The meters enable readout of the load profile logger on the display via a push button on the meter. Figure 14
shows a block diagram of the read-out. ”S” means a short push, ”L” means a long push, and ”LL” means an extra
long push.
”Last profil”
Obis = ”P.01"
Reg BReg A Reg C
SSS
L
S
Logger
readout
Set time
and
date
Flash
Info = 1 sec
Reg = 3 sec
No flash
L
Timeout = 2 min
Step out
of DCT
Reg 1
L
L
L
L/LL
Log ID
S
Obis = time
If ”hour log” hh.00.00, else
hh.mm.00
Value = date (YY-MM-DD)
LL
L
S
Obis = ”Year”
Value: date (YY-
MM-DD)
S
Year (YY) --
L
S
Month (MM) --
L
S
Day (DD) --
L
S
Hour (hh) --
S
Minute(mm) -=
delta log time
”hour log”?
TrueFalse
LL
LL
LL
LL
LL
Obis = ”Month”
Value: date (
YY-MM-DD)
Obis = ”Day”
Value: date (
YY-MM-DD)
Obis = time (hh.mm.00)
Value: ”Hour”
LL
LL
LL
Display: ”End”
Read time and date
Minute -= %delta log
time
Obis = hh.mm.00
Value: YY-MM-DD
Info
Obis = Obis code
Value: Reg value
Reg
Reg 2
Reg n
S
S
Reg 1
L
L
L
Reg 2
Reg n
S
Reg 1
L
L
L
Reg 2
Reg n
S
S
Log ID -”1 log”
Log ID – ”n log”
L
Obis = time (hh.mm.00)
Value: ”Minute”
Timeout = 2 min
Step out
of DCT
Configuration
check
Step out
of DCT
True False
Config
registers to
log != 0
LoadProfileLogger on?
Step out
of DCT
L/LL
S
Display: ”Log off”
True
False
L/LL
S
Display: ”No reg”
Timeout = 2 min
Step out
of DCT
Log
found?
True
False
S
S
S
Display: ”Error”
L/LL
End:
Year:
Month:
Day:
Hour:
Minute:
No reg:
Error:
Log off:
Display words:
Figure 14: Block diagram of the display read-out.
See the following page for an example of a display read-out of an A+-meter.
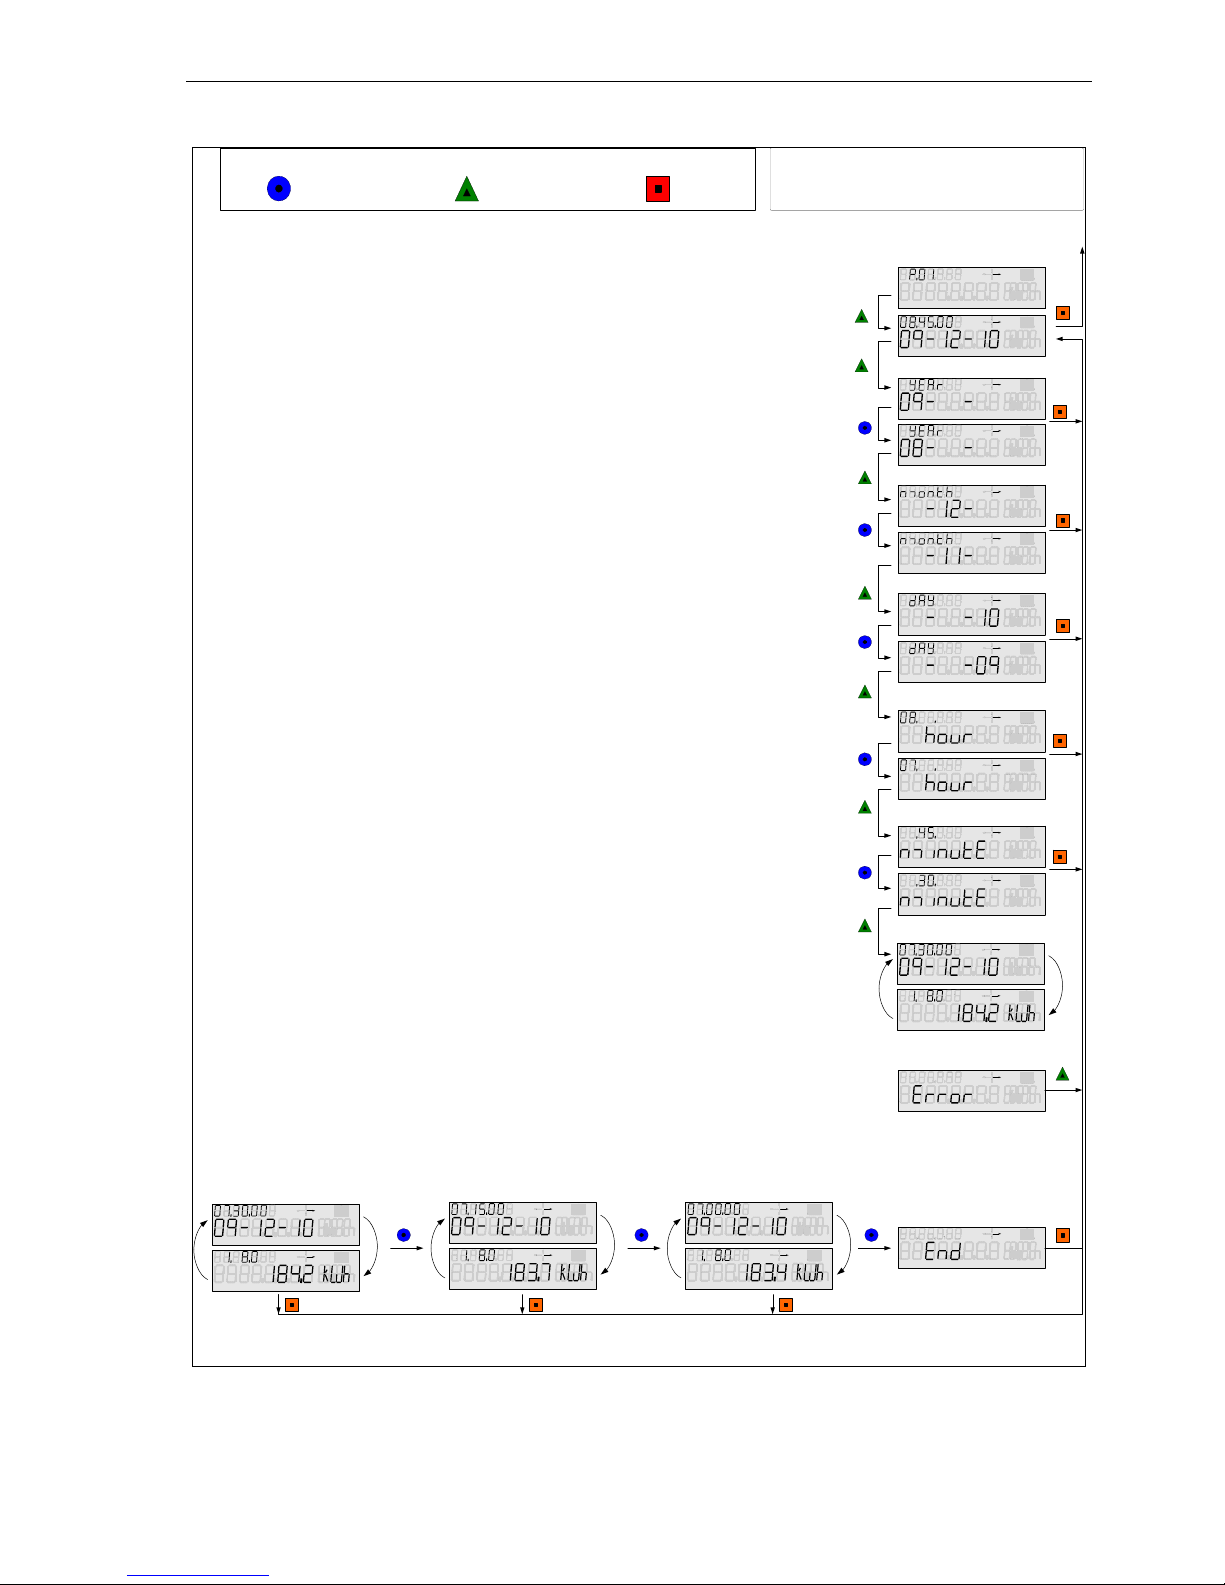
TECHNICAL DESCRIPTION Kamstrup 162M/382M
5512-1040 GB/05.2012/Rev. C1
36
L1 L2 L3
T1 T2 T3 T4
Q
Q
+P
-P
+
-
!
L1 L2 L3
T1 T2 T3 T4
Q
Q
+P-P
+
-
!
L1 L2 L3
T1 T2 T3 T4
Q
Q
+P-P
+
-
!
L1 L2 L3
T1 T2 T3 T4
Q
Q
+P-P
+
-
!
L1 L2 L3
T1 T2 T3 T4
Q
Q
+P-P
+
-
!
L1 L2 L3
T1 T2 T3 T4
Q
Q
+P-P
+
-
!
L1 L2 L3
T1 T2 T3 T4
Q
Q
+P-P
+
-
!
L1 L2 L3
T1 T2 T3 T4
Q
Q
+P-P
+
-
!
L1 L2 L3
T1 T2 T3 T4
Q
Q
+P-P
+
-
!
L1 L2 L3
T1 T2 T3 T4
Q
Q
+P-P
+
-
!
L1 L2 L3
T1 T2 T3 T4
Q
Q
+P-P
+
-
!
L1 L2 L3
T1 T2 T3 T4
Q
Q
+P-P
+
-
!
L1 L2 L3
T1 T2 T3 T4
Q
Q
+P-P
+
-
!
L1 L2 L3
T1 T2 T3 T4
Q
Q
+P-P
+
-
!
L1 L2 L3
T1 T2 T3 T4
Q
Q
+P-P
+
-
!
L1 L2 L3
T1 T2 T3 T4
Q
Q
+P-P
+
-
!
L1 L2 L3
T1 T2 T3 T4
Q
Q
+P-P
+
-
!
L1 L2 L3
T1 T2 T3 T4
Q
Q
+P-P
+
-
!
L1 L2 L3
T1 T2 T3 T4
Q
Q
+P-P
+
-
!
L1 L2 L3
T1 T2 T3 T4
Q
Q
+P-P
+
-
!
L1 L2 L3
T1 T2 T3 T4
Q
Q
+P-P
+
-
!
L1 L2 L3
T1 T2 T3 T4
Q
Q
+P-P
+
-
!
The shown example is made the 10/10-2009 and the latest
record is taken 08:45.
The meter records the energy consumption every 15 min.
Press ”Short Push” until ”P.01” in the upper left corner of the display…………………………………………..
Press one time ”Long Push” and the following display shows the latest date and time for a data record.
If you press a ”Extra Long Push” you will return to the main menu…...……………………………….
It is now possible to choose the exact date and time for the record you want to read out in the display.
Press ”Long Push” to go to the choice of year……...……………………………..…………………….
Then press ”Short Push” until the display shows the year you want to read out………………………..
When the year is shown, press ”Long push” to continue to choice of month …..……………………….
Similar, press ”Short Push” for choosing the month you want to read out …………….…………...
When the month is shown in the display, press ”Long Push” to continue to choice of day………. …....
Press ”Short Push” until the day you want to read is shown in the display...…………………………….
When the desired day is shown, press ”Long Push” to continue to the choice of hour.…..…………….
Press ”Short Push” until the desired hour is showed in the display …..………………………………...
When the desired hour is shown, press ”Long Push” and continue with the choice of minute…..……...
1
2
3
9
8
7
6
5
4
10
13
12
11 The minute is chosen with intervals similar to the meters log interval for every ”Short Push”…..…….
When the desired minute is shown in the display, the sequence is terminated with a ”Short Push”. The
display shows then alternately the chosen time (approx. 1 sec.) and the recorded data value for the
chosen (approx.. 3 sec.)………………………………………………………………………………….
”Short Push” (<1 sec.) ”Long Push” (2-4 sec.) ”Extra Long Push” (>5 sec.)
When the time is valid, it is possible to step backward in time and see all recorded values for each
”Short Push”. In the example the data is recorded with intervals of 15 min.
14
No matter where in the above sequence you are, it is always possible to return to the beginning of the
sequence by pressing ”Extra Long Push”.
If the chosen time lies before the time of the first recorded data, the display show the following errormessage. One ”Long Push” returns the user to the beginning of the time-selecting sequence……………..
Figure 15: Read out of load profile logger in display.

TECHNICAL DESCRIPTION Kamstrup 162M/382M
5512-1040 GB/05.2012/Rev. C1
37
5 Integrated radio
This applies to meters with integrated radio.
5.1 Communication via radio
The meter can be ordered as a variant with an integrated radio “module”. It is used for the establishment of
remote reading in a Kamstrup AMR system.
If the meter is supplied with integrated radio, the meter will automatically try to connect to a radio network.
The integrated radio is equipped with an internal antenna. The radio signal strength can be read by hand-held
terminal. If the radio signal is too suppressed, an external antenna must be connected to increase the signal
strength. Connect the external antenna to the antenna plug that is located to the left of the display.
By using a hand-held terminal, it is possible to read the meter and thereby ascertain that the integrated radio is
running.
Mounting a communication module in the module area may influence communication. Please contact Kamstrup
A/S to obtain additional information.
5.2 Software upload
It is possible to upload new radio software remotely via en AMR system. Please contact Kamstrup for further
information regarding the radio software upload functionality.

TECHNICAL DESCRIPTION Kamstrup 162M/382M
5512-1040 GB/05.2012/Rev. C1
38
6 Integrated disconnection
This applies to meters with integrated breaker.
The breaker function is controlled by the meter’s main processor and consists of bistable relays that maintain
their disconnection status independently of the supply to the meter.
The breaker disconnects the phases of the meter. The neutral connection is not disconnected.
6.1 Disconnect function in the meter
Meters with integrated disconnection brakers can cut off/disconnect the consumer’s supply.
Do not use the function as safety cut-off.
It is possible to disconnect the meter in 4 ways:
- Manually by activating the push button
- Remotely controlled via a communication command in the reading software
- Intelligent disconnection via current or power (smart disconnect)
- Prepayment.
It is possible to reconnect the meter in 4 ways:
- Manually by activating the push button
- Remotely controlled via a communication command and activating the push button
- Remotely controlled via a communication command and an additional communication command
- Automatically after smart disconnect or prepayment.

TECHNICAL DESCRIPTION Kamstrup 162M/382M
5512-1040 GB/05.2012/Rev. C1
39
6.2 Manual disconnection and connection
It is possible to disconnect the meter manually. This is done in the following way:
1a) On the meter, select the below display reading by activating the left push button:
L1
L2 L3
1b) Activate the left push button for approx. 6 secs. This will disconnect the relays, and the red diode turns on.
Manual reconnection is done in the following way:
2a) On the meter, select a display reading that is different from the reading selected in 1a).
2b) Reconnection is possible when the diode emits green light and 1 minutes after disconnection.
Activate the left push button for 6 secs. until the relays are connected and the green diode is turned off. If
the relays are not connected after 6 secs., wait 1 min. and reactivate the left push button for 6 secs.
6.3 Disconnection by means of communication commands
Meters with breakers can also disconnect remotely via commands. Both the DLMS and KMP protocols permit to
disconnect, release and reconnect the supply to the consumer remotely via a communication network or locally
be means of e.g. the configuration tool METERTOOL.
There is a predefined 60 seconds hardware timer for the disconnection/connection function, meaning that you
must wait 60 seconds after a disconnection before the relays can be reconnected. The time is configurable, but
has to be 60 seconds as a minimum.
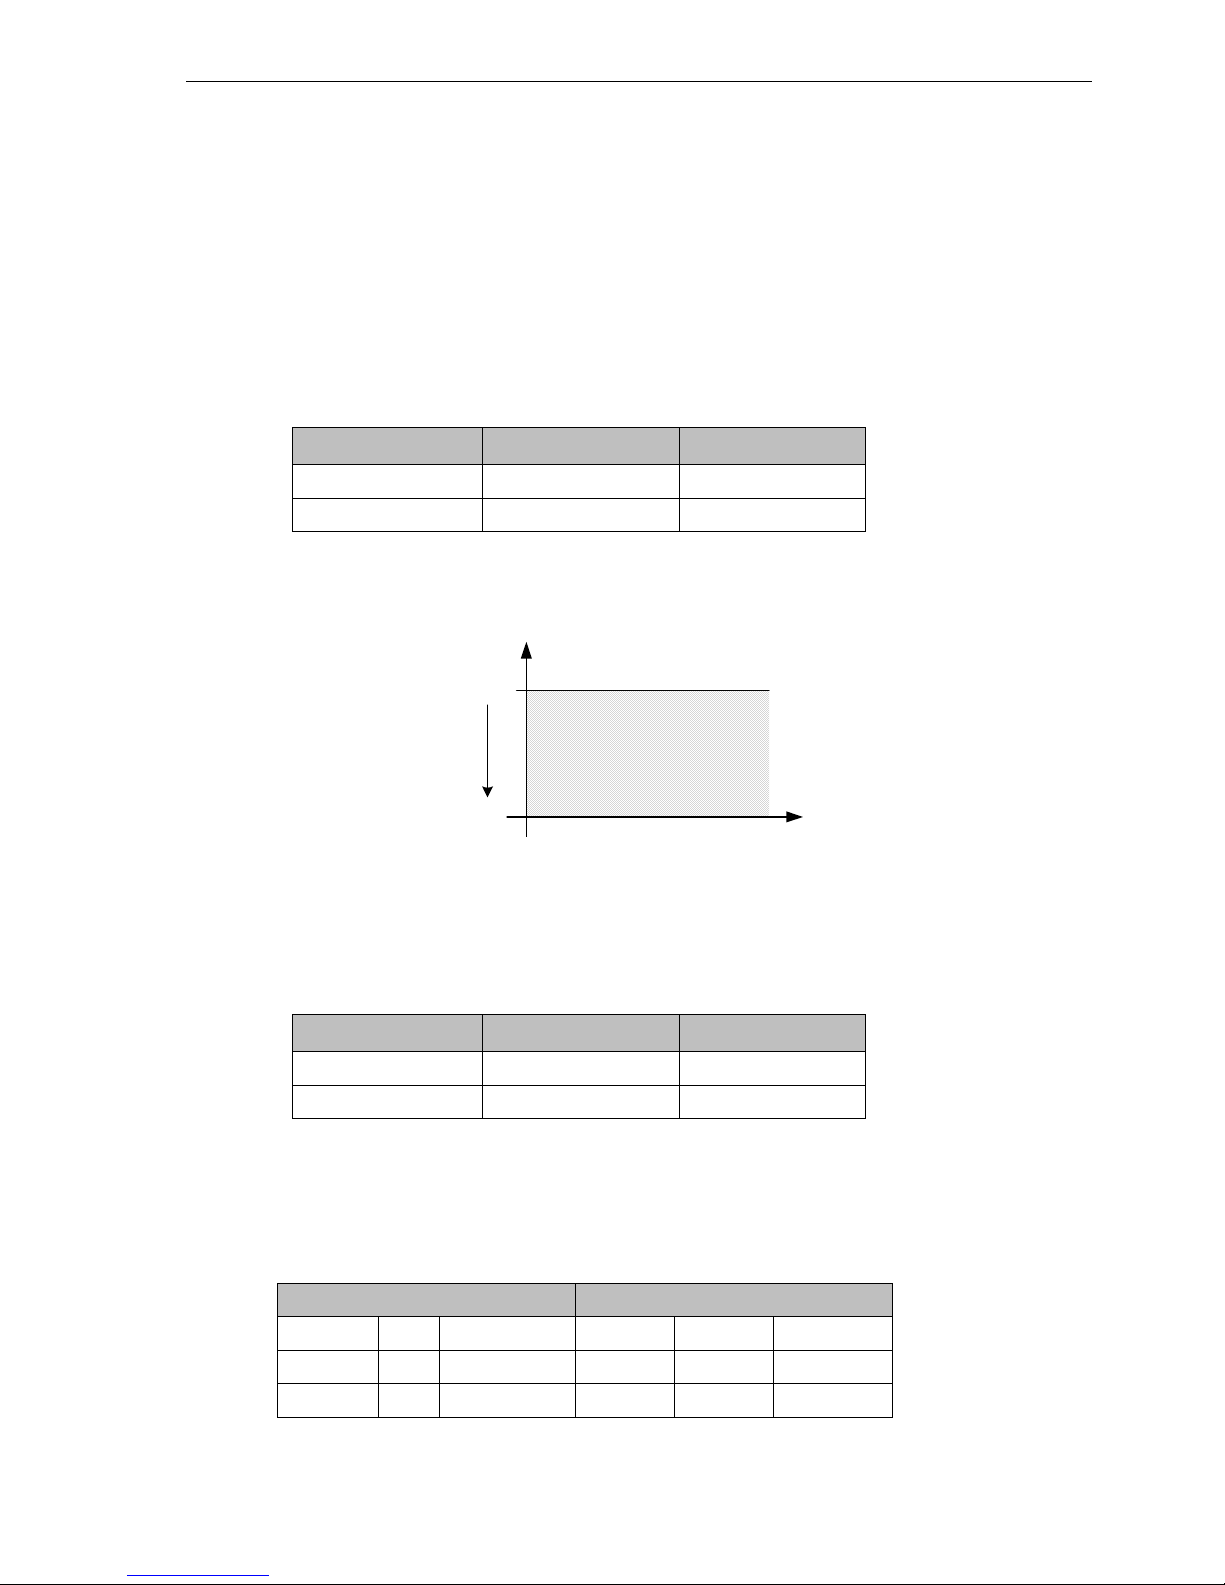
TECHNICAL DESCRIPTION Kamstrup 162M/382M
5512-1040 GB/05.2012/Rev. C1
40
6.4 Smart disconnect
Smart disconnect activates the internal relays when exceeding a preprogrammed limit. The meters can be
programmed with a current or power limit that, when it is exceeded, will disconnect the supply to the consumer.
As default, the meter is provided with the smart disconnect function. If the function is to be used, it must be
activated from the factory at delivery, or it can be activated with METERTOOL.
Be aware that the JJ code can only be changed via the module port, not via the optical head.
At configuration, the cut-off current I
disconnect
(Id) or the cut-off power P
disconnect
(Pd) is programmed, and the cutt-off
configuration (JJ, see 10.2.3 Configuration 3 ( JJ-K-LL-M-NN )) is configured to cut off at either current or power.
The meter will disconnect the consumer when I
d
or Pd is exceeded.
Register Min. value Max. value
I
disconnect
0 A
80 A
P
disconnect
0 kW
80 kW
Table 17: Configuration limits for smart disconnect.
P (kW), I (A)
80
t
Figure 16: Configuration limits for smart disconnect.
6.4.1 Delayed disconnection
The meter can be configured for delayed disconnection or for having a disconnection characteristic. The meter is
configured via configuration set-up with multiplication factors for both time : t
1
, t2, t3 and current/power: k1, k2, k3.
Register Min. value Max. value
k
1
,
k
2
,
k
3
0 9.9
t1, t2, t3 [sec.] 0 65535
Table 18: Multiplication factors for smart disconnect.
The following conditions for the factors must be met at configuration:
t
1
=< t2 =< t3 and k3 =< k2 =< k1
The meter will disconnect the consumer when one of the below conditions is met for current and power,
respectively:
Current Power
I > Id *
k
3
and t > t1 + t2 + t
3
P > P
d
* k3
and
t > t
1
+ t2 + t3
I > Id *
k
2
and t > t1 + t2 P > P
d
* k2
and
t > t
1
+ t2
I > Id *
k
1
and t > t1 P > P
d
* k1
and
t > t
1
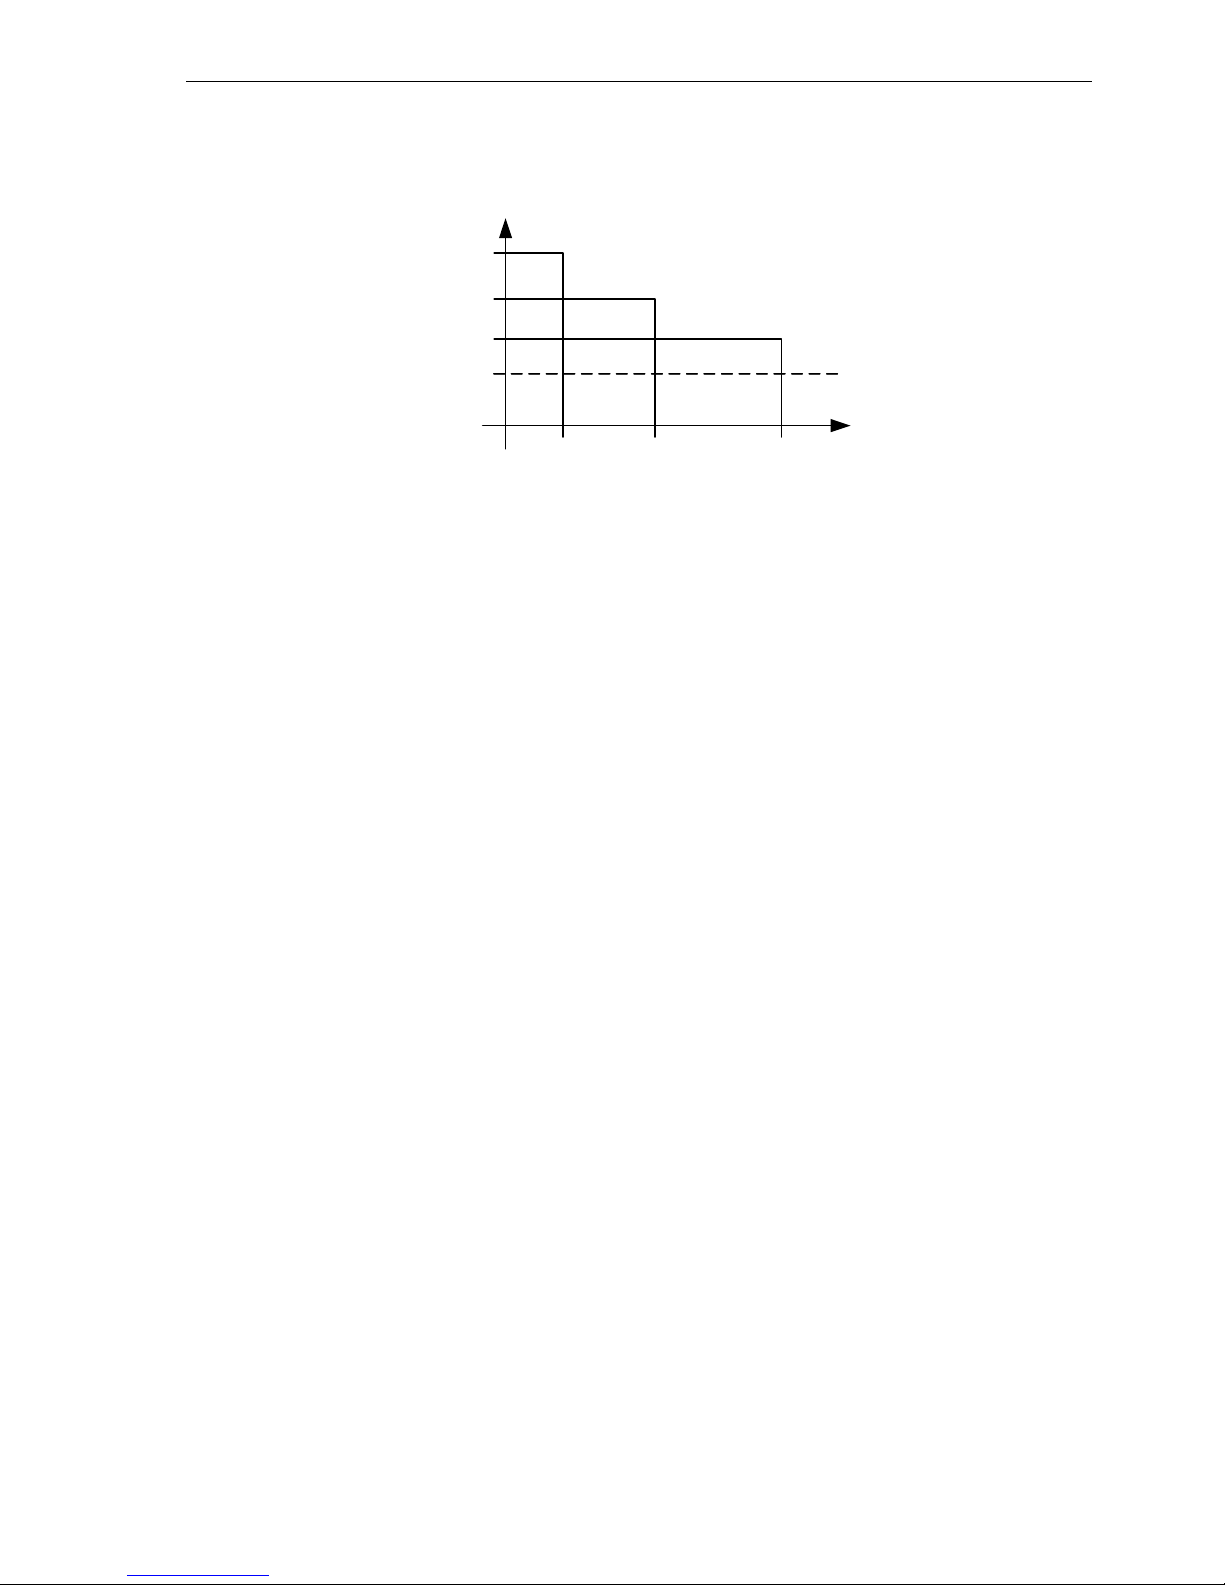
TECHNICAL DESCRIPTION Kamstrup 162M/382M
5512-1040 GB/05.2012/Rev. C1
41
P (kW), I (A)
P
d, Id
t
K1*P
d,
K1*I
d
K3*P
d,
K3*I
d
K2*P
d,
K2*I
d
t
1
t1+ t
2
t1+ t2+ t
3
Figure 17: Differentiation of Smart Disconnection.
6.4.2 Overcurrent protection
To secure the breaker against overcurrent e.g. at short circuits, the meter has an upper limit, the short circuit
current I
k
. If the current exceeds this limit, the breaker does not disconnect. Thus, the risk of defects is minimized.
6.4.3 Current-controlled disconnection
Current-controlled disconnection is based on RMS current with average determination every 1 sec. Disconnection
is effected if one of the phase currents I
L1
, IL2, IL3 exceeds the limit Id*kx for a configured time period; t1, t1+t2 or
t
1+t2+t3
.
6.4.4 Power-controlled disconnection
Power-controlled disconnection is based on the total power. Disconnection is effected if the total phase power
exceeds the limit I
d*kx
for a configured time period; t1, t1+t2 or t1+t2+t3.
6.4.5 Reconnection
Reconnection can be configured to be either manual or automatic. No matter if manual or automatic reconnection
is selected, reconnection cannot be effected until after the wait time, t
reconnect
since reconnection, has expired.
6.4.6 Disconnection basis
Disconnection basis decides if smart disconnect or prepayment is active and on which basis the disconnection is
effected. It is possible to select:
- No function: The smart disconnect function is deactivated.
- Power-controlled: Disconnection is effected when a programmed power limit is exceeded.
- Current-controlled: Disconnection is effected when a programmed current limit is exceeded.
- Prepayment: The prepayment function controls the disconnection. See section 6.5.
Disconnection basis is selected as part of the disconnection configuration, see section 10.8.
6.4.7 Disconnection status
It is possible to read the status of the output voltage per phase to verify that disconnection has been effected
and, otherwise, to ensure that all phases are connected.

TECHNICAL DESCRIPTION Kamstrup 162M/382M
5512-1040 GB/05.2012/Rev. C1
42
6.5 Prepayment
The prepayment function is to be used with a reading system prepared for communication with Kamstrup
electricity meters or with an external unit prepared for payment control. Prepayment is only possible for meters
with internal breaker, and will not work together with tariffs.
Be aware that the JJ code and A
14prepayment
can only be changed via the module port, not via the optical head.
The prepayment function is as standard integrated in meters with breakers and can be activated and deactived as
required. When A
14prepayment
has reached 0 kWh, the supply to the consumer is disconnected, and a new value for
the register must be programmed.
When prepayment is activated, the countdown register A
14prepayment
is not automatically activated in the display
settings. This has to be done manually by using a display setup that includes the prepayment register. When a
display setting with the A
14prepayment
register is activated, the register is only shown when prepayment is enabled.
The unit in the display is “kWh” and “PAY” is shown in the text field. The prepayment is based on the total A+
register, and therefore, it is disregarded if the meter is configured for tariffs.
When prepayment is deactivated, the A
14prepayment
is reset. The A
14prepayment
-register cannot be reset in other ways.
The minimum and the maximum values for the prepayment-register depend on the formatting of the energy
display.
Display format Min. value Max. value
7.0 0 9 999 999
6.1 0 999 999.9
A
14prepayment
disconnects only on workingdays, not on non-workingdays or exceptionsdays. If the register reach zero
on a non-workingday or exceptionsday, the disconnection will happen at the firstcoming workingday.
When A
14prepayment
has reached 0 kWh, and the relays are disconnecting, it will be possible to decrease the load,
reconnect the meter and by that still be able use a minimum of current or power. The limits, called I
exception
or
P
exception
, are configurable within following range.
Register Min. value Max. value
I
exception
0 A
80 A
P
exception
0 kW
80 kW
The minimum limit secures that the consumer, who has been disconnected, can reduce his consumption and
hereafter reconnect in order to maintain energy for e.g. essential appliances.
At configuration of disconnect values, the following applies:
- I
exception
< I
disconnect
- P
exception
< P
disconnect
t
prepayment
is a time limit for the duration in which the exception for current and power, respectively, can be active.
When the limit is exceeded, the consumer is disconnected. When A
14prepayment
differs from 0, or the consumer is
disconnected, the time restarts at zero.
Register Min. value Max. value
t
prepayment
0 255 days
If the limit for t
prepayment
is exceeded, the supply to the consumer must be reconnected by means of a command.

TECHNICAL DESCRIPTION Kamstrup 162M/382M
5512-1040 GB/05.2012/Rev. C1
43
6.6 Status chart of the disconnect function
Figure 18 shows the state-diagram for the disconnect functionality.
State 0
Relays – IN
LED – OFF
State 5
Relays – IN
LED – OFF
State 3 (4)
Relays – IN
LED – OFF
State 9
Relays – OUT
LED – RED
State 1
Relays – OUT
LED – RED
State 12
Relays – O UT
LED – RED
State 6
Relays – OUT
LED – RED
State 7
Relays – OUT
LED – RED
State 11
Relays – OUT
LED – RED
State 2 (8)
Relays – OUT
LED – GREEN
State 13
Relays – IN
LED – OFF
P/I > I
disconnect
P/I < I
disconnect
Pre Cut-off warningNormal opration
Disconnected
Push button
Disconnected
Prepayment
Disconnected
T
prepayment
Disconnected
Commando
Disconnected
Neutral fault
Disconnected
Current/Power
Only log
Automatic reconnect
- Push button
- Command
Manual
reconnect
Ready to reconnect
Figure 18: State diagram of disconnect functionality.

TECHNICAL DESCRIPTION Kamstrup 162M/382M
5512-1040 GB/05.2012/Rev. C1
44
6.7 Disconnection on meters with APS
On meters with APS (Auxiliary Power Supply), the disconnection functionality is slightly different from mentioned
in the previous chapters.
When the APS meter is supplied with the mains as well as APS the functionality is the same as above.
The reason that the meter operates different is that the coil that activates the breakers only has power for one
operation when supplied by APS.
6.7.1 Using the push button
The meter is supplied with mains and APS. The main switch is switched off, means the meter is only supplied
from APS. In the display reading “dCon”, pressing the left push button for approx. 6 seconds, the meter
disconnects and the diode turns to red for one minute and after one minute is turns to green.
It is not possible to reconnect the meter as long as it is only supplied from APS.
6.7.2 Using commands (remote)
Meter is only supplied by APS.
Relays in state 04, connected, diode off.
Command send for disconnect.
- Relays in state 01, disconnected, diode turns to red.
Command sends for disconnect – ready to reconnect.
- Relays in state 08, disconnected, diode turn to green.
Command sends for reconnect.
- Relays in state 04, diode off, BUT relays NOT connected.
Mains supplied to the meter.
- Relays in state 04, diode off, BUT relays NOT connected. After connection the mains to the meter, it can take
up to one hour before the meter reconnects the relays and provide supply to the consumer.

TECHNICAL DESCRIPTION Kamstrup 162M/382M
5512-1040 GB/05.2012/Rev. C1
45
7 Meter communication
Kamstrup’s electricity meters have internal communication protocols for communicating both via the optical head
and the module connector placed in the module area. The meters enable communication via Kamstrup’s own
optimized protocol KMP.
It is possible for a third party to use the module area of the meter, described in section 8.2.2, for specific
developed modules, and in this connection to use one of the internal protocols implemented in the meter.
7.1 Requirements for third party modules
Below, the minimum requirements for developing modules for Kamstrup’s electricity meters are described.
In general, the design of the module must conform to written and unwritten rules of electrical constructions.
Requirements:
- Optocouplers must be applied in all connections between module and module connector to avoid
external noise influencing the meter.
- The module must use the powerful current supply of the meter.
- It is the responsibility of the third party to secure that the module mounted in a Kamstrup electricity
meter conforms to relevant standards for both meter and module. Kamstrup must accept the results of
these tests. Please contact Kamstrup A/S for further information.
- The module must be CE labelled.
- Kamstrup must have two modules for testing purposes before the first delivery is made to the
customer.
7.2 KMP
The KMP protocol gives access to all registers in the meter and enables programming and set-up. Please contact
Kamstrup A/S for requesting a copy of the protocol.

TECHNICAL DESCRIPTION Kamstrup 162M/382M
5512-1040 GB/05.2012/Rev. C1
46
8 Technical specifications
8.1 Approvals and standards
The meter is type approved according to the Measuring Instrument Directive (MID) for active positive energy and
according to national requirements for other energy sizes.
Type test according to
Active positive energy
Reactive energy and
active negative energy
EN 50470-1 (MID)
IEC 62052-11
EN 50470-3 (MID)
IEC 62053-21
IEC 62053-23
Terminal according to DIN 43857
S0 pulse output according to DIN 43864
Optical reading according to IEC 62056-21 (IEC 61107)
OBIS codes according to IEC 62056-61
Interface classes IEC 62056-62
Data link layer IEC 62056-72
8.2 Technical data
Measuring principle:
- Current: One-phase current measurement by current shunt
- Voltage: One-phase voltage measurement by voltage divider
Nominal voltage Un:
230VAC -20 - +15 %
3x230VAC -20 - +15 % (only applies to Aron meter)
3x230/400VAC -20 - +15 % (does not apply to Kamstrup 1-phase and Aron meter)
Current
I
tr
- Ib(I
max
):
3-phase without breaker 3-phase with breaker
0,25-5(100) A 0,25-5(85) A
Class: A, B (active energy)
1, 2 (Reactive nergy)
1-phase without breaker 1-phase with breaker
0,25-5(100) A 0,25-5(85) A

TECHNICAL DESCRIPTION Kamstrup 162M/382M
5512-1040 GB/05.2012/Rev. C1
47
Nominal frequency f
n
: 50Hz 5 %
Phase displacement: Unlimited, however not for Aron-meters
Operating temperature: -40C - +70C
Storage temperature: -40C - +85C
Protection class: IP54
Protection class: II
Relative humidity: <75 % year’s average at 21C
< 95 % less than 30 days/year, at 25C
Weight:
3-phase without breaker 3-phase with breaker
Approx. 1000
g
Approx. 1300
g
1-phase without breaker 1-phase with breaker
Approx. 800
g
Approx. 1100
g
Application area: Indoor or outdoor in suitable meter cabinet
Internal ownconsumption:
- Current Circuit: 0.01 VA
- Voltage circuit:
1-phase TBD
1-phase with breaker
TBD
3-phase without breaker
TBD
3-phase with breaker
TBD
Material: Cover: Glass reinforced polycarbonate
Base: Glass reinforced polycarbonate
Data storage: EEPROM
> 10 years without voltage
Display: LCD, 7 mm digit height (for value and unit fields)
LCD, 5 mm digit height for identification readings
LCD, 3 mm digit height for voltage and tariff readings
Meter constant: 1000 imp/kWh, 1000 imp/kvarh

TECHNICAL DESCRIPTION Kamstrup 162M/382M
5512-1040 GB/05.2012/Rev. C1
48
Real-time clock, accuracy: typical 5 ppm at 23 C.
Real-time clock, backup:
- Battery lifetime > 10 years at normal operation
- Supercap lifetime > 10 years at normal operation
- Supercap operating hours 4 days fully charged
- Recharge time < 24 hours
8.2.1 Connections
Terminals: 2.5 – 35 mm2 elevating connections when using 7 cores or massive cable.
Screws PZ 2 or straight-slotted
Tightening 2.5 – 3 Nm
Voltage output: 0.25 – 1.5 mm2, 5 mm fork terminal
Screws TORX Tx 10
Tightening 1Nm
Short circuit level: 4500 A
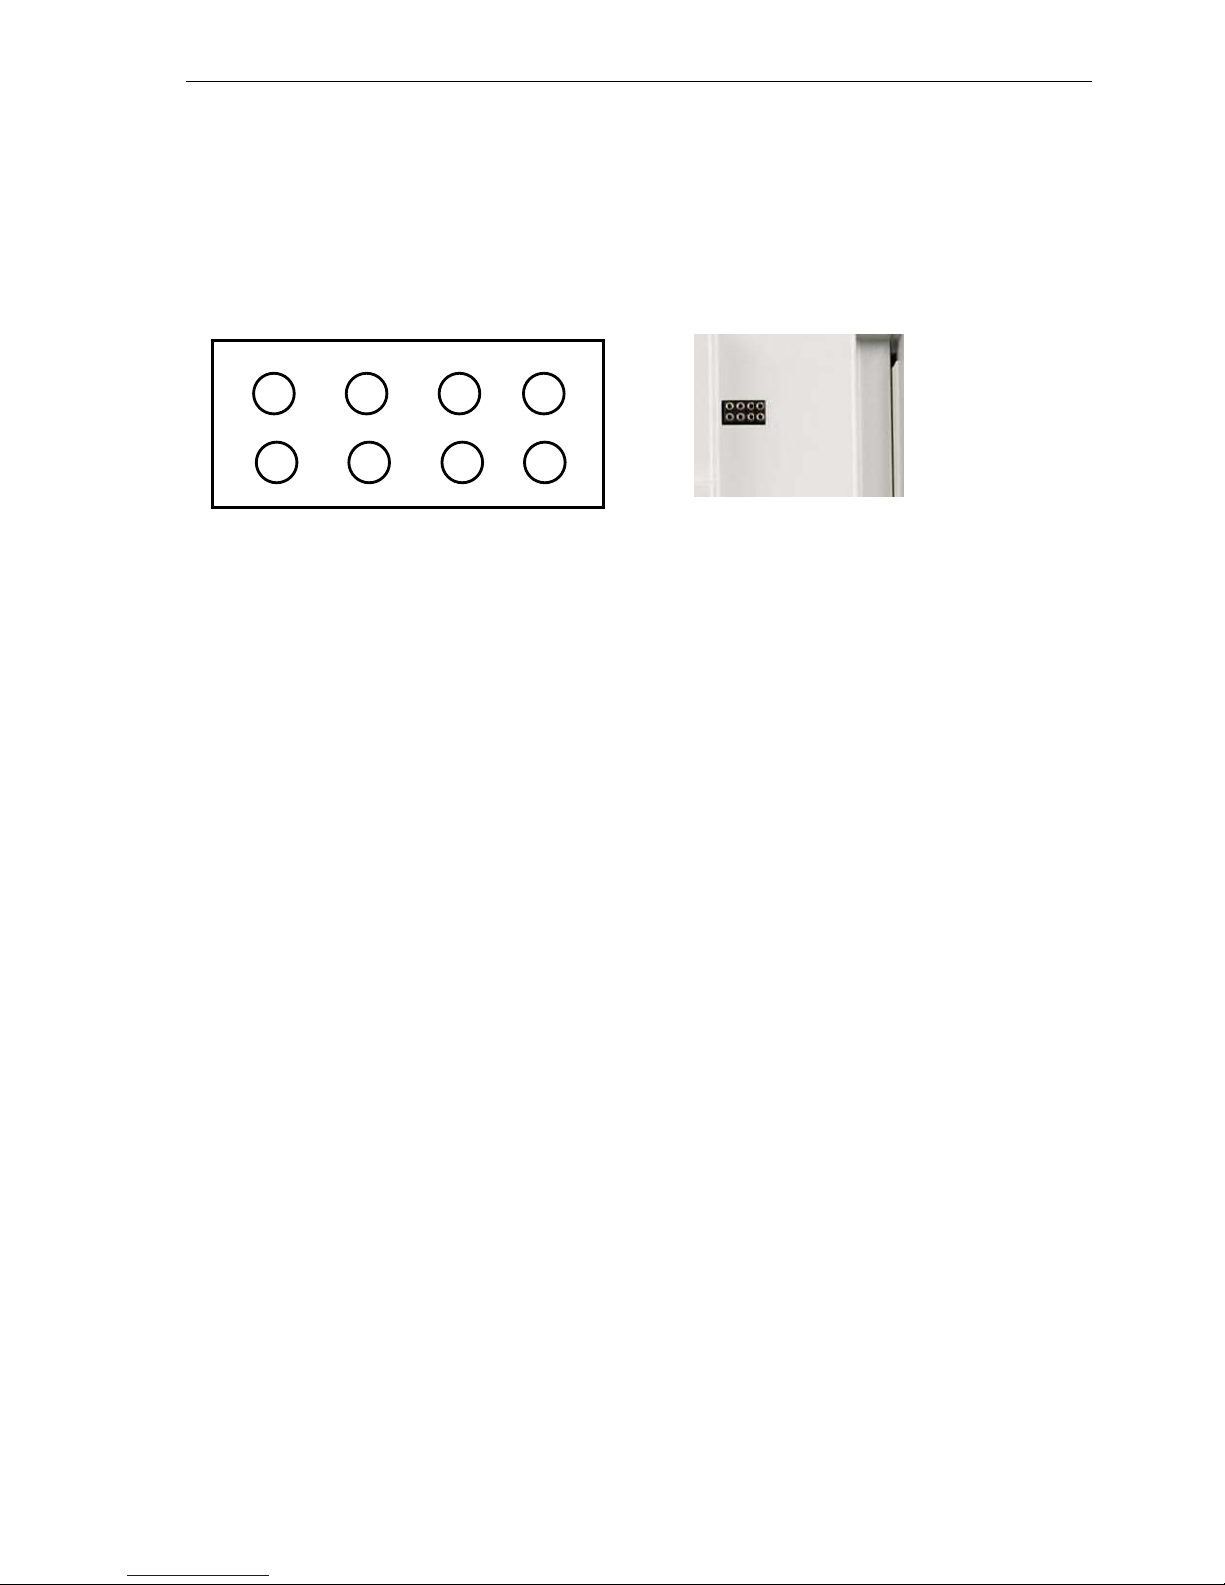
TECHNICAL DESCRIPTION Kamstrup 162M/382M
5512-1040 GB/05.2012/Rev. C1
49
8.2.2 2W module supply
The meter is equppied with a primary module area. The output connectors enable a current draw of up to 640 mA
as peak current and 150 mA as average. The meter has a limiter securing that the maximum current draw is not
exceeded.
NOTE: Be aware to mount the module correctly. It must be kept as far to the left as possible.
8.2.3 Module interface
Pin 1 GND
Pin 2 Data out
For serial communication of data from the meter.
The port type is “open drain”, 2.2nF capacitor for GND and 10K Ohm for supply
Output, high: 10K Ohm pull-up for supply
Output, low: Minimum voltage: 0V, Maximum voltage: 0.4V
Pin 3 Pulse in/out (Port 2)
For pulse transmission.
The port type is “open drain”, 10nF capacitor for GND and 1M Ohm for supply
Input, high: Minimum voltage 2.6V, Maximum voltage 5.5V
Input, low: Minimum voltage 0V, Maximum voltage 0.6V
Output, high: 1M Ohm pull-up for supply
Output, low: Minimum voltage: 0V, Maximum voltage: 0.4V
Pin 4 Pulse in/out (Port 1)
For pulse transmission.
The port type is “open drain”, 10nF capacitor for GND and 1M Ohm for supply
Input, high: Minimum voltage 2.6V, Maximum voltage 5.5V
Input, low: Minimum voltage 0V, Maximum voltage 0.6V
Output, high: 1M Ohm pull-up for supply
Output, low: Minimum voltage: 0V, Maximum voltage: 0.4V
Pin 5 Data in
For serial communication of data to the meter.
Internal 10K Ohm pull-up for supply, and 2.2nF capacitor for GND.
Input, high: Minimum voltage 2.6V, Maximum voltage 5.5V
Input, low: Minimum voltage 0V, Maximum voltage 0.6V
Pin 6 Supply
Nominal voltage 4.0 V in series with 100 ohm
Maximum current: 5 mA (@3.5 V)
Pin 7 High Power Supply
Rout < 0.6
Nominal voltage: 4.3 V ± 0.2 V (no load)
Maximum average current: 150 mA
Maximum peak current: 600 mA
Pin 8 GND (High Power )
7
6
5 4
3 2
1
8
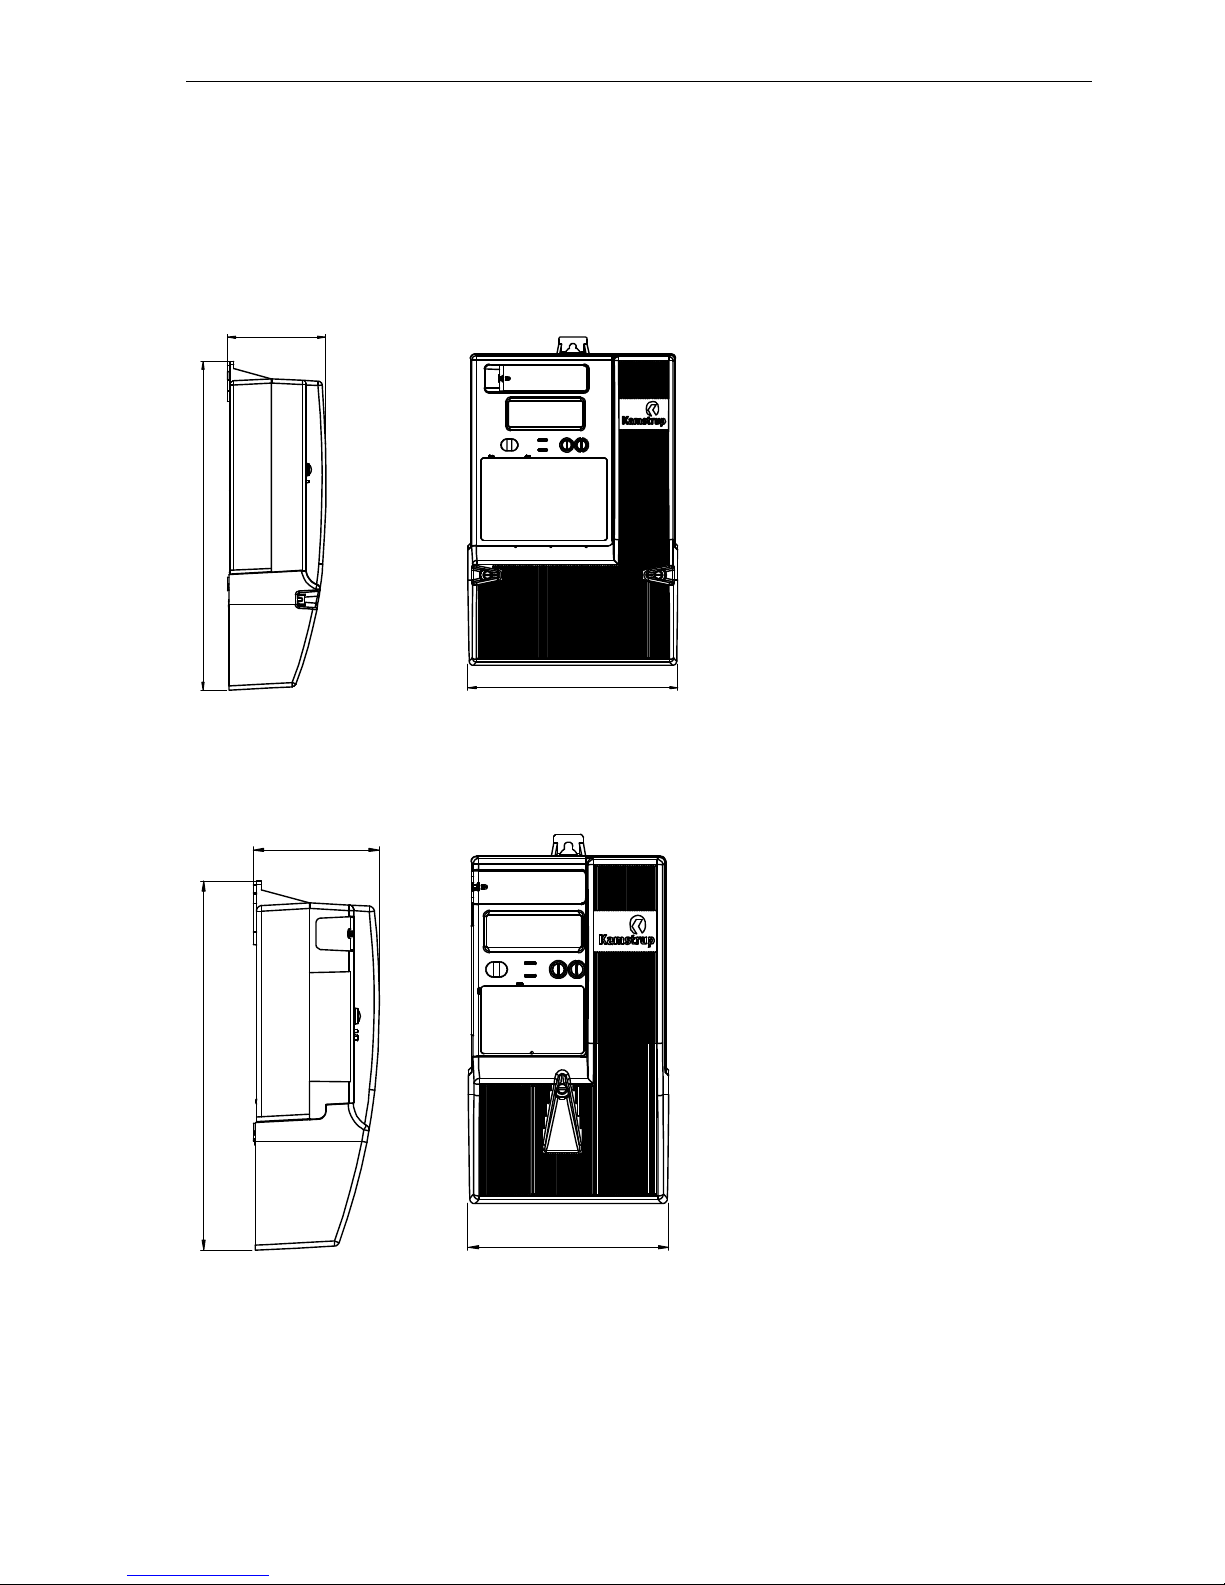
TECHNICAL DESCRIPTION Kamstrup 162M/382M
5512-1040 GB/05.2012/Rev. C1
50
8.3 Diagrams/charts
8.3.1 Dimensional sketch for 3-phase and Aron meter with/without breaker
269,2
80,3
171,7
8.3.2 Dimensional sketch for 1-phase meter with/without breaker
237,7
80,8
128,7

TECHNICAL DESCRIPTION Kamstrup 162M/382M
5512-1040 GB/05.2012/Rev. C1
51
9 Modules
The meter provides two slots for additional modules. One for modules to be mounted in the primary module area,
described in section 8.2.2, and one for secondary modules.
9.1 Primary modules
Description Article number
S0 supply module 68 50 001
Data/pulse module, relay output 68 50 003
Tariff module, 4 tariffs, 230VAC, current loop 68 50 018
S0 impulse module 68 50 021
IP101i, TCP/IP module 68 50 040
GSM6i; GSM6i/RF; GSM7i; GSM8i 68 50 053
Nuri ZigBee module 68 50 056
LON module 68 50 057
5A load control module 68 50 058
Nuri GPRS module 68 50 060
Z-wave module 68 50 063
Wireless M-Bus module, OMS 68 50 064
M-Bus module 68 50 068
2*5A load control module 68 50 069
Radio module, router, high power 68 50 070
RS-485 module 68 50 072
Please see www.kamstrup.com
for more information (datasheet) about the specific module.
For modules with integrated input/out functionalities, a complete list of pin numbering can be found in document
no. 5511-446.
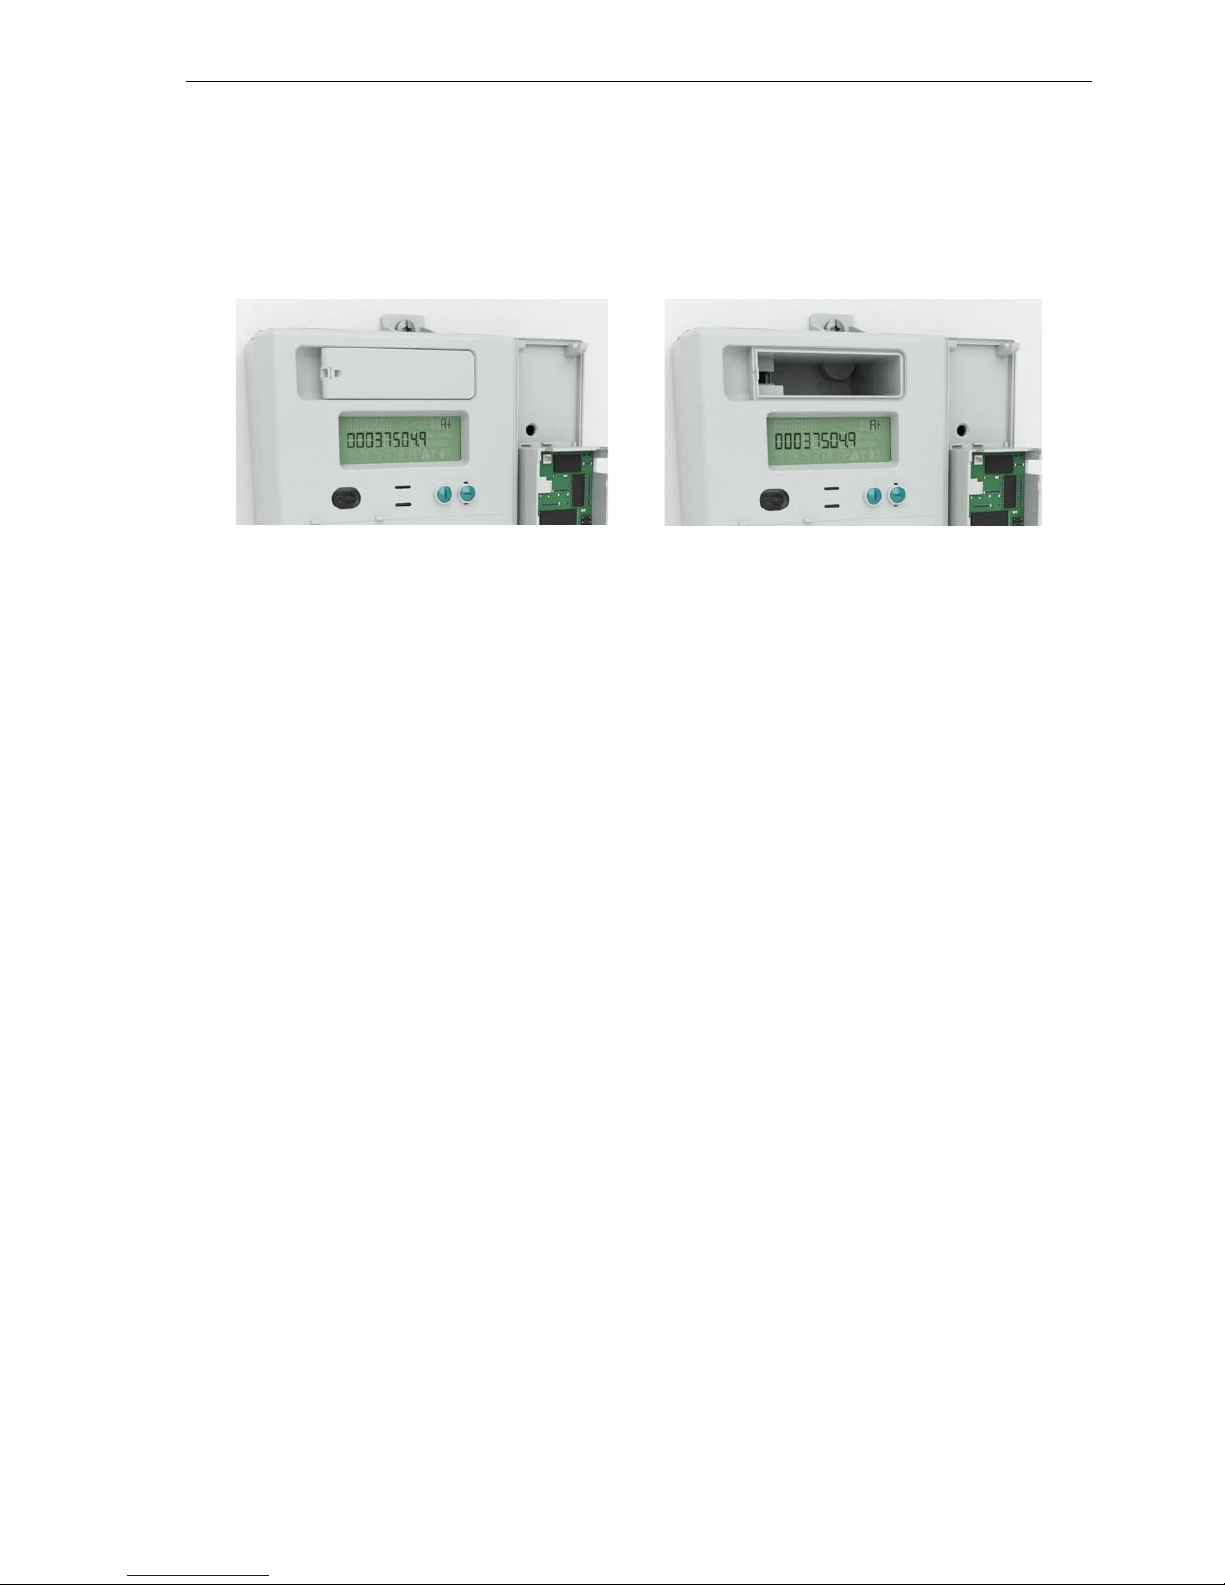
TECHNICAL DESCRIPTION Kamstrup 162M/382M
5512-1040 GB/05.2012/Rev. C1
52
9.2 Secondary communication modules
It is possible to implement an additional secondary modul to the meter. The module can be mounted in the area
indicated on Figure 19.
Figure 19: Slot for secondary module.
9.2.1 Variants of the secondary communication module
Description Article number
No modules released yet

TECHNICAL DESCRIPTION Kamstrup 162M/382M
5512-1040 GB/05.2012/Rev. C1
53
10 Ordering details
NOTE: Not all combinations are possible.
10.1 Type number
1-phase, 2-wire
686- 1
- X2 - X3 - X4 - X5 - X6 - X7 - X8 X9 X
10
3-phase, 3-wire Aron
684- 2 - X
2
- X3 - X4 - X5 - X6 - X7 - X8 X9 X
10
3-phase, 4-wire
684- 3
- X2 - X3 - X4 - X5 - X6 - X7 - X8 X9 X
10
X1 Phases
1x230V 1
3x230V 2
3x230/400V 3
X2 Current
0.25 - 5(100)A 35 mm2 1
0.25 - 5(85)A 8
X3 Class
Class A
A
Class B
B
X4 Generation
Generation M
M
X5 Energy type
A+
1
A+/A-
2
A+/R+
3
A+/A-/R+/R-
4
A+/R1
5
X6 Hardware option
Basis (battery) 2
Basis (supercap) 3
RF S + battery (Senea) 4
RF K + battery (Kamstrup) 5
RF S + supercap (Senea)
6
RF K + supercap (Kamstrup) 7
Breaker, battery, B
Breaker, supercap, C
Breaker, battery RF S D
Breaker, battery, RF K E
Breaker, supercap, RF S
F
Breaker, supercap, RF
K
G
X7 Tariff configuration
No tariff
1
Configurable
3
X8X9X10 Country code
Denmark D
K
DNK
010
Russian Federation RU
RUS
025
Spain ES
ESP
031
Croatia HR
HRV
036
Norway NO
NOR
040
Slovak Republic S
K
SVK
042
Latvia LV
LVA
045
Lithuania L
T
LTU
049
Great Britain GB
GBR
050
Austria A
T AUT
055
Switzerland (Italy) CH-I
T
CHE-ITA
059
Estonia EE
EST
061

TECHNICAL DESCRIPTION Kamstrup 162M/382M
5512-1040 GB/05.2012/Rev. C1
54
Switzerland (Germany)
CH-DE CHE-DEU
063
Poland PL
POL
064
Switzerland (France) CH-FR CHE-FRA
065
Iceland IS
ISL
067
Germany DE
DEU
070
Belgium BE
BEL
078
Netherland NL
NLD
080
Finland FI
FIN
084
Finland (APS) FI (APS) FIN (APS)
085
Sweden SE
SWE
090
Saudi Arabia SA
SAU
110
South Africa ZA
ZAF
120
Chile CL
CHL
151

TECHNICAL DESCRIPTION Kamstrup 162M/382M
5512-1040 GB/05.2012/Rev. C1
55
10.2 Configuration numbers
By and large the configuration numbers reflect the meter’s configuration.
Variables A and B are locked from the factory, i.e. they cannot be changed after verification.
10.2.1 Configuration 1 ( A-B-CCC-DD-E )
A Decimals displayed (locked)
B LED configuration (locked)
CCC Primary module
DD Input/output configuration of the primary module port
E Integration period
The DD code describes the function of the two module ports. The ports can be configured for inputs and outputs if
required. The choices are described shortly in the below table under DD.
A
- B -
CCC
- DD - E
A Decimals in display
7.0 1
6.1 2
B LED configuration
LED switched off without consumption
1
LED switched on without consumption
2
CCC Module
No module
000
S0 supply module
001
Data/pulse module
003
T
ariff module, 4-tariff, 230V, CS
018
Senea input/output
021
IP101i, TCP/IP module
040
GSM6i, GSM6i/RF, GSM7i, GSM8i
053
NURI ZigBee
056
LON module
057
Load control module 5A
058
NURI GPRS
060
Z-wave
063
Wireless M-Bus module, OMS
064
M-Bus
068
Load control module 2*5A
069
Radio module, high power
070
RS-485
072

TECHNICAL DESCRIPTION Kamstrup 162M/382M
5512-1040 GB/05.2012/Rev. C1
56
DD Input/output configuration on Module port
DD
E
Description Port 1
Port 2
Tariff control
No function -
-
Communication 00
4-tariff Input
Input
Module 01
4-tariff inverted Input
Input
Module 02
Pulse in/alarm in Input
Input
Communication 03
Pulse in/inverted alarm in Input
Input
Communication 04
Pulse in/A+ out Input
Output
Communication 05
R+ out/A+ out Output Output
Communication 06
2-tariff/alarm in Input
Input
Module 07
2-tariff inverted/alarm in
Input Input
Module 08
2-tariff/alarm in inverted
Input Input
Module 09
2-tariff inverted/alarm in inverted Input
Input
Module 10
2-tariff/A+ out Input
Output
Module 11
2-tariff inverted/A+ out Input
Output
Module 12
Pulse in/2-tariff Input
Input
Module 13
Pulse in/2-tariff inverted
Input Input
Module 14
Debiting stop/- -
-
Communication 15
A- out/A+ out Output Output
Communication 16
Load control status/load control Input
Output
Communication 17
Pulse in/Load tariff sync
Input
Output
Internal 18
Pulse in inv./Load tariff sync Input
Output
Internal 19
Pulse in/Load tariff sync inv. Input
Output
Internal 20
Pulse in inv./Load tariff sync inv. Input
Output
Internal 21
4-tariff sync load control
Output Output
Internal 22
4-tariff sync load control inv. Output Output
Internal 23
External breaker control – no feedback Input
Output
Internal 24
External breaker control - feedback Input
Output
Internal 25
Load control 1 / Load control 2 Output Output
Internal 26
E Integration period
5 min.
1
15 min.
2
30 min.
3
60 min.
4

TECHNICAL DESCRIPTION Kamstrup 162M/382M
5512-1040 GB/05.2012/Rev. C1
57
10.2.2 Configuration 2 ( FFF-GG-HH-I )
FFF Display configuration
GG Target date
HH Debiting logger interval
I
Pulse output lenght / alarm input on module port
For creating display configuration (FFF), complete document no. 5811-549 GB, see 10.7 Display configuration. For
information about optional display configurations, please contact Kamstrup A/S.
The below table gives examples of released display readings.
GG Target date GG HH I
Controlled externally 00
1. 01
2. 02
3. 03
: :
: :
: :
27 27
28 28
HH Debiting logger interval
None (controlled externally) 00
Monthly 01
Every second month, January 02
Every second month, February 03
Every third month, January 04
Every third month, February 05
Every third month, March 06
Half-yearly, January 07
Half-yearly, February 08
Half-yearly, March 09
Half-yearly, April 10
Half-yearly, May 11
Half-yearly, June 12
Y
early, January 13
Y
early, February 14
Y
early, March 15
Y
early, April 16
Y
early, May 17
Y
early, June 18
Y
early, July 19
Y
early, August 20
Y
early, September 21
Y
early, October 22
Y
early, November 23
Y
early, December 24
I Pulse output lenght / alarm input on module port I
30 msecs. pulse length / no alarm input 1
30 msecs. pulse length / alarm input 2
80 msecs. pulse length / no alarm input 3
80 msecs. pulse length / alarm input 4

TECHNICAL DESCRIPTION Kamstrup 162M/382M
5512-1040 GB/05.2012/Rev. C1
58
10.2.3 Configuration 3 ( JJ-K-LL-M-NN )
JJ Disconnect set-up
K Peak power
LL GMT
M Available
NN Unit pulse input
For creation of disconnect configuration (JJ), complete the form under 10.7 Display configuration.
JJ K LL
M NN
JJ
Disconnect set-up
None 00
K Peak power
Peak power standard
0
Peak power for tariff 1
1
Peak power for tariff 2
2
LL GMT
0 GMT London
00
1 DK - DE - FR - ES
01
2 FI
02
3
03
4
04
5
05
6
06
7
07
8
08
9
09
10
10
11
11
12
12
-11
13
-10
14
-9
15
-8
16
-7
17
-6
18
-5
19
-4
20
-3
21
-2
22
-1
23
M
A
vailable
None
0
NN Unit pulse input
None
00
kWh
01
m3
02
L
03

TECHNICAL DESCRIPTION Kamstrup 162M/382M
5512-1040 GB/05.2012/Rev. C1
59
10.2.4 Configuration 4 ( OOO-PPP-QQ )
OOO Periode plan: (Tariff table/Load control table/Working – Non Workings days etc.) Kamstrup provides
customer specific configuration. Please contact Kamstrup fur further details.
PPP Daylight saving plan
QQ Protocol
OOO PPP QQ
OOO Tariff control table
None
101
Customer specific
xxx
…
…
PPP Daylight saving plan
None
000
EU
001
QQ Protocol
None
00
10.2.5 Configuration 5 (RRR)
RRR Frequency – transmitting power
RRR
RRR Frequency – transmitting power
None
000
EU 310 RF SENEA
310
EU 311 RF SENEA
311
EU 312 RF SENEA
312
CH 318 RF
318
EU 319 RF
319
SE 320 RF SENEA
320
SE 321 RF SENEA
321
SE 322 RF SENEA
322
SE 329 RF
329
NO 330 RF SENEA
330
NO 339 RF
339
DK 340 RF SENEA
340
DK 349 RF
349
FI 358 RF
358

TECHNICAL DESCRIPTION Kamstrup 162M/382M
5512-1040 GB/05.2012/Rev. C1
60
10.3 Display readings
The possible display readings depend on the chosen energy type(s). In addition, it must be considered if leading
zeroes should be indicated in the energy display and if OBIS/EDIS and actual quadrant indication is required.
Display readings are shown with OBIS codes.
No OBIS Description Unit Text-field
1 1. 8.0
A+, Active positive energy
kWh A+
2 2. 8.0
A-, Active negative energy
kWh A-
3 3. 8.0
R+, Reactive positive energy
kVarh R+
4 4. 8.0
R-, Reactive negative energy
KVarh R-
5 15. 8.0
A+, A- Active energy numerical
kWh
6 5. 8.0
Ri+, Reactive energy Quadrant 1
kVarh R1
7 8. 8.0
Rc, Reactive energy Quadrant 4
kVarh R4
8 1. 8.1
A+T1, Active positive energy in T1
kWh A+/T1
9 1. 8.2
A+T2, Active positive energy in T2
kWh A+/T2
10 1. 8.3
A+T3, Active positive energy in T3
kWh A+/T3
11 1. 8.4
A+T4, Active positive energy in T4
kWh A+/T4
12 1. 8.5
A+T5, Active positive energy in T5
kWh A+/T5
13 1. 8.6
A+T6, Active positive energy in T6
kWh A+/T6
14 1. 8.7
A+T7, Active positive energy in T7
kWh A+/T7
15 1. 8.8
A+T8, Active positive energy in T8
kWh A+/T8
16 2. 8.1
A-T1, Active negative energy in T1
kWh A-/T1
17 2. 8.2
A-T2, Active negative energy in T2
kWh A-/T2
18 2. 8.3
A-T3, Active negative energy in T3
kWh A-/T3
19 2. 8.4
A-T4, Active negative energy in T4
kWh A-/T4
20 2. 8.5
A-T5, Active negative energy in T5
kWh A-/T5
21 2. 8.6
A-T6, Active negative energy in T6
kWh A-/T6
22 2. 8.7
A-T7, Active negative energy in T7
kWh A-/T7
23 2. 8.8
A-T8, Active negative energy in T8
kWh A-/T8
24 3. 8.1
R+T1, Reactive positive energy in T1
kvarh R+/T1
25 3. 8.2
R+T2, Reactive positive energy in T2
kvarh R+/T2
26 3. 8.3
R+T3, Reactive positive energy in T3
kvarh R+/T3
27 3. 8.4
R+T4, Reactive positive energy in T4
kvarh R+/T4
28 3. 8.5
R+T5, Reactive positive energy in T5
kvarh R+/T5
29 3. 8.6
R+T6, Reactive positive energy in T6
kvarh R+/T6
30 3. 8.7
R+T7, Reactive
p
ositive energy in T7
kvarh R+/T7
31 3. 8.8
R+T8, Reactive
p
ositive energy in T8
kvarh R+/T8
32 4. 8.1
R-T1, Reactive negative energy in T1
kvarh R-/T1
33 4. 8.2
R-T2, Reactive negative energy in T2
kvarh R-/T2
34 4. 8.3
R-T3, Reactive negative energy in T3
kvarh R-/T3
35 4. 8.4
R-T4, Reactive negative energy in T4
kvarh R-/T4
36 4. 8.5
R-T5, Reactive negative energy in T5
kvarh R-/T5
37 4. 8.6
R-T6, Reactive negative energy in T6
kvarh R-/T6
38 4. 8.7
R-T7, Reactive negative energy in T7
kvarh R-/T7
39 4. 8.8
R-T8, Reactive negative energy in T8
kvarh R-/T8
40 1.58.0
Resettable counter, active positive energy
kWh A+/TRIP
41 2.58.0
Resettable counter, active negative energy
kWh A-/TRIP
42 1. 7.0
Actual active positive power
kW P+
43 2. 7.0
Actual active negative power
kW P-
44 3. 7.0
Actual reactive positive power
kvar Q+
45 4. 7.0
Actual reactive negative power
kvar Q-
46 1. 6.0
Active positive peak power
kW PM
47 2. 6.0
Active negative
p
eak power
kW PM
48 3. 6.0
Reactive positive peak power
kvar PM
49 4. 6.0
Reactive negative peak power
kvar PM
50 1. 6.0
Clock active
p
ositive peak power
PM/TIME
51 1. 6.0
Date active positive peak power
PM/DATE
52 1. 6.1
Active positive peak power T1
kW PM/T1
53 1. 6.1
Clock active
p
ositive peak power T1
TIME/T1
54 1. 6.1
Date active positive peak power T1
DATE/T1
55 1. 6.2
Active positive peak power T2
kW PM/T2

TECHNICAL DESCRIPTION Kamstrup 162M/382M
5512-1040 GB/05.2012/Rev. C1
61
No OBIS Description Unit Text-field
56 1. 6.2
Clock active positive peak power T2
57 1. 6.2
Date active positive peak power T2
58 1. 2.0
Accumulated active positive peak power
kW APM
59 2. 2.0
Accumulated active negative peak power
kW APM
60 3. 2.0
Accumulated reactive positive peak power
kvar APM
61 4. 2.0
Accumulated reactive negative peak power
kvar APM
62 1.128.0
Pulse input
63
Display test
64
Manual disconnect (of supply)
DCON
65 0. 0.1
Meter number 1
NUM/1
66 0. 0.2
Meter number 2
NUM/2
67 0. 0.3
Meter number 3
NUM/3
68 96. 1.0
Meter serial number
SER/NUM
69 0.130.1
Special data 1
SPC/1
70 0.130.2
Special data 2
SPC/2
71 32.25
Actual voltage phase L1
V U-L1
72 52.25
Actual voltage
p
hase L2
V U-L2
73 72.25
Actual voltage phase L3
V U-L3
74 31.25
Actual current phase L1
A I-L1
75 51.25
Actual current phase L2
A I-L2
76 71.25
Actual current phase L3
A I-L3
77 0. 9.1
Hour
TIME
78 0. 9.2
Date
DATE
79 0. 1.0
Number of debiting periods
RST
80 21.25
Actual power phase L1
kW P+/L1
81 41.25
Actual power phase L2
kW P+/L2
82 61.25
Actual power phase L3
kW P+/L3
83 98.1
Historical data
84 96.51.1
Power threshold value
kW PTH
85 96.51.2
Power threshold counter
PTH/CNT
86 96. 8.0
Hour counter
HRS
87 0.129.1
Configuration number 1
KF/1
88 0.129.2
Configuration number 2
KF/2
89 0.129.3
Configuration number 3
KF/3
90 0.129.4
Configuration number 4
KF/4
91 0.129.5
Configuration number5
KF/5
92
Call (forced call modem)
CALL
93 F. F
Information register
INFO
94 96.54.1
ROM checksum
CSUM
95 0. 2.0
Software revision
SW/REV
96
SET mode (Delivery code 081)
97 130.0.0
Active positive energy prepayment
kWh PAY
98 0. 6.9
Config 4 code 000
INFO/TAF
99 1. 6.9
Max. daily
p
ower P14
kW MAX
100 1. 3.9 Min. daily power P14 kW MIN
101 1. 6.9 Max daily power P14 clock MAX/TIME
102 1. 6.9 Max daily power P14 Date MAX/DATE
103 1. 3.9 Min. daily power P14 clock MIN/TIME
104 1. 3.9 Min. daily power P14 Date MIN/DATE
105 32. 5.0
Average voltage L1
V AVG/U-L1
106 52. 5.0
Average voltage L2
V AVG/U-L2
107 72. 5.0
Average voltage L3
V AVG/U-L3
108 31. 5.0 Average current L1 A AVG/I-L1
109 51. 5.0 Average current L2 A AVG/I-L2
110 71. 5.0 Average current L3 A AVG/I-L3
111 Voltage quality, log, Low V U-LO
112 Voltage quality, log, High V U-HI
113
Threshold time for voltage quality
114 P.01 Legal logger profile
*1, depends on the chosen unit

TECHNICAL DESCRIPTION Kamstrup 162M/382M
5512-1040 GB/05.2012/Rev. C1
62
10.4 Period plan - Tariff and load control table
The period plan contains tariff control table and plans for control of one or two load output, independently from
the tariffs.
In the following is shown an example of a setup of the tariff plans by use of METERTOOL.
Making a period plan, the following has to be considered:
Working days – Non working days
Period change time (often same as summer time – normal time, also called Period A and Period B in
METRTOOL. This with a resolution of 1 minute)
Tariff changes (up to 8 changes per day is possible. This with a resolution of 1 minute)
Exception days
Load control 1
Load control 2
Below show an example of a tariff plan.
10.4.1 Setup working days and non-working days
Each day of the week can be set to either a working or a non-working day.
10.4.2 Setup period A and B and tariff switch for each period.
A calendar year can be split in two periods – period A and period B. Each period is set with a start date and a
number of tariff changes (each containing a time for change and the tariff to be entered) for both working-days
and non-working days.

TECHNICAL DESCRIPTION Kamstrup 162M/382M
5512-1040 GB/05.2012/Rev. C1
63
10.4.3 Setup plan for load control 1 and 2
If the meter is installed with a load control module, it can be configured to include a plan for the switching
between active and inactive. A separate plan can be made for both relays.
The load control can also be configured to follow the tariff. For each tariff that are defined in the tariff plan, it shall
be defined whether the relay shall be active or inactive.

TECHNICAL DESCRIPTION Kamstrup 162M/382M
5512-1040 GB/05.2012/Rev. C1
64
10.4.4 Setup calender for exception days
Also it is possible to define a number of exception days that will be as the non-working regarding tariff changes. A
number of up to 100 exception days can be configured separately for tariff plan and for both load control plan 1
and 2.
10.4.5 On Demand tariff
By the system it is possible to to overrule the internal tariff plan by a OnDemand command. This command force
the meter into a specific tariff for a time period.
10.4.6 Load control delay
The load control works together with a random delay. The delay is variable and calculated individual in every
meter.
The delay can be between 0 – 10800 seconds.
The delay is only added when the relay changes from inactive to active. When changing from active to inactive,
the delay is not added.

TECHNICAL DESCRIPTION Kamstrup 162M/382M
5512-1040 GB/05.2012/Rev. C1
65
10.5 Daylight saving table
This table indicates on which dates the meter’s clock (RTC) is to change between daylight saving and normal time
if the meter has been configured to do so.
It is possible by system to update this table. An example of a daylight saving table is shown below.
When Daylight saving time is aneabled, it is taking into account when the meter is using the tariff and load control
functionality described in section 10.4.
Also all timestamps that are read out in the display, e.g. the load profile as shown in Figure 15 and the read out of
historical data, is taking the daylight saving time into account.
However, all event loggers, i.e. voltage quality logger, status logger, RTC logger, cut off logger and neutral fault
logger does not take the daylight saving time into account when a time stamp is made to an event for one of the
mentioned loggers. Also time stamps related to peak values doesn’t take daylight saving time into account.
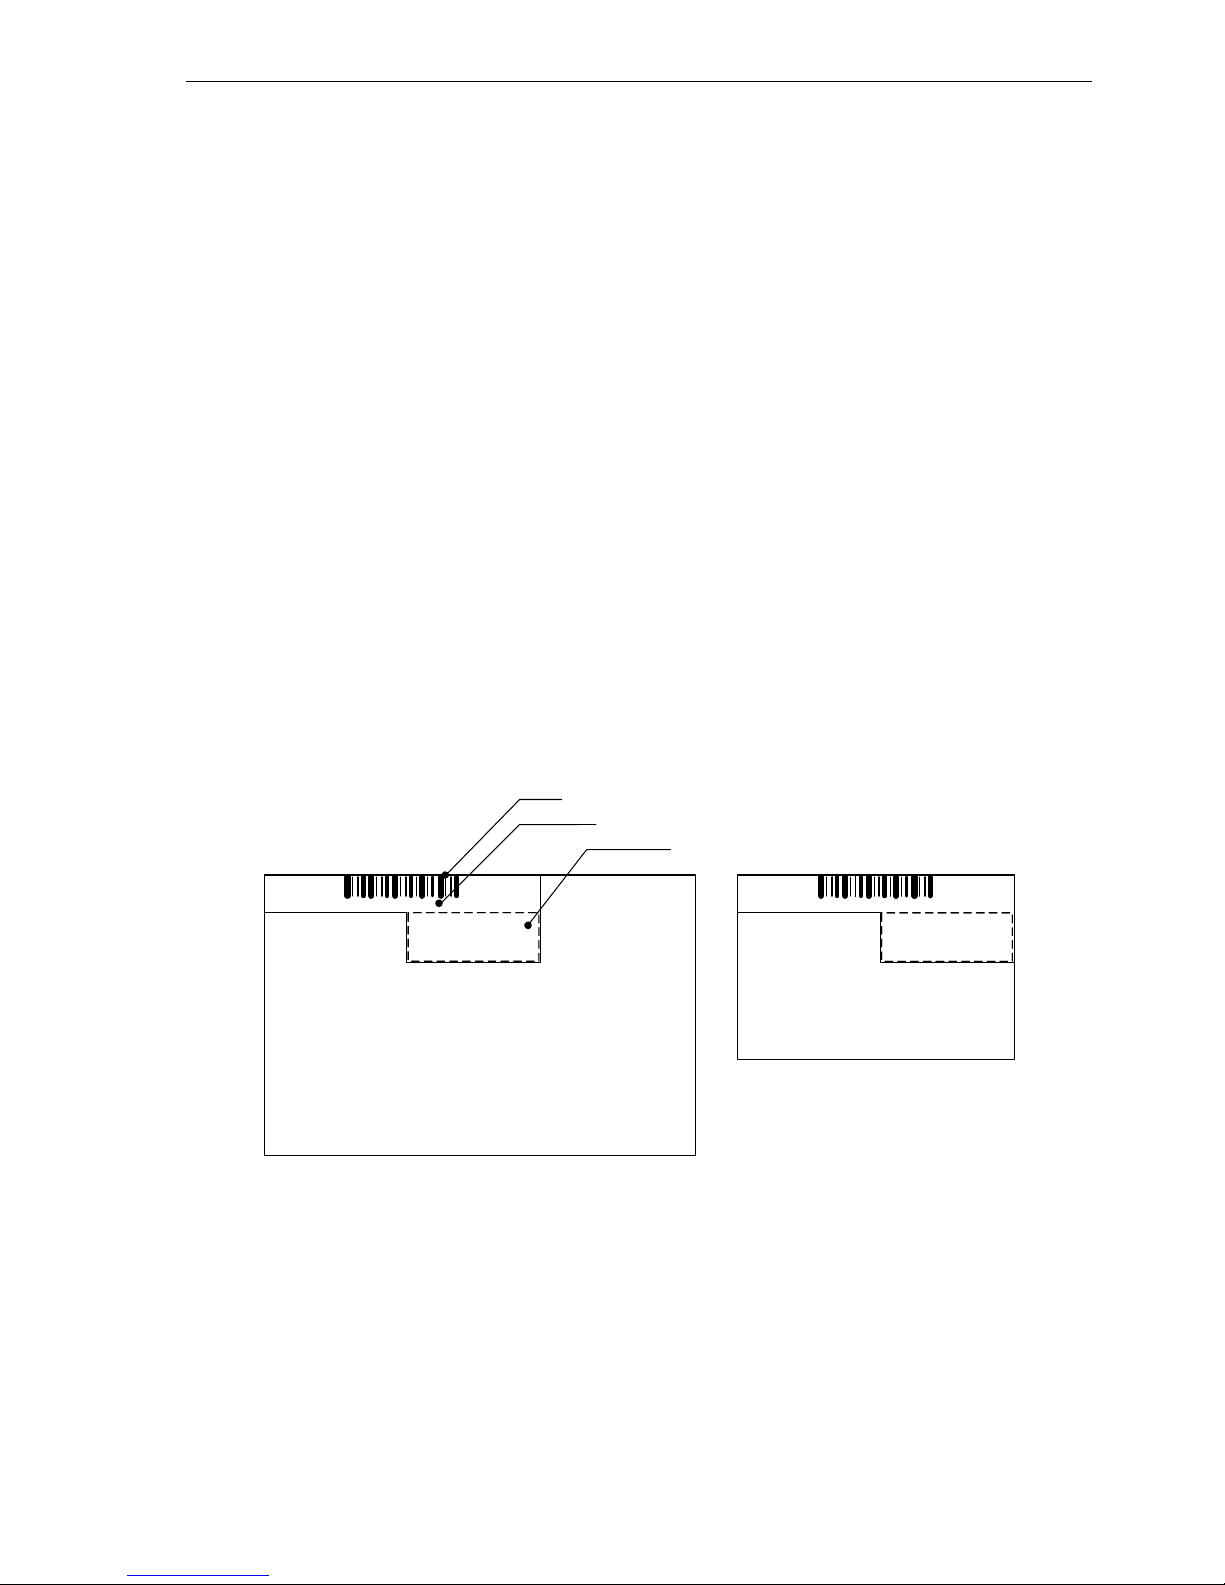
TECHNICAL DESCRIPTION Kamstrup 162M/382M
5512-1040 GB/05.2012/Rev. C1
66
10.6 Label
The label consists of two labels: a meter label describing the choices made under type number, and a customer
label created on basis of the customer's wishes, and which the customer must approve before an order can be
created to the customer.
Four standard customer labels without customer logo are available.
These standard customer labels are:
2019000 No bar code No meter number
2019001 Code 128 Meter number = serial number
2019002 2 of 5 interleaved Meter number = serial number
2019003 Code 39 Meter number = serial number
The following information is required for the creation of a new customer label:
Customer logo must be provided to the Electricity Product Group. The logo must be in black/white and in one of
the following formats: JPG, WMF.
Information about the bar code type to use and its content, serial number, meter number, installation number,
and the position of numbers and bar code must also be provided.
When all information is available, a draft is prepared, which must be approved by the customer. The bar code
should also be read by the customer in order to secure that his/her bar code reading device can read the bar
code.
After approval, a customer label no. 2019XXX is selected, and the number is released in Kamstrup ordering
systems.
123450000
123450000
Standard logo size position
Customer specified
Bar code type and size position
Customer specified
Text size and type position
Customer specified
Label for 3-phase and Aron meter
Label for 1-phase meter
Figure 20: The customer label 2019xxx for three-phase and one-phse meters.
The customer label 2019xxx, is the same size on all metertypes. This means that the same customer label can be
used both on the single-phase and the poly-phase meter.
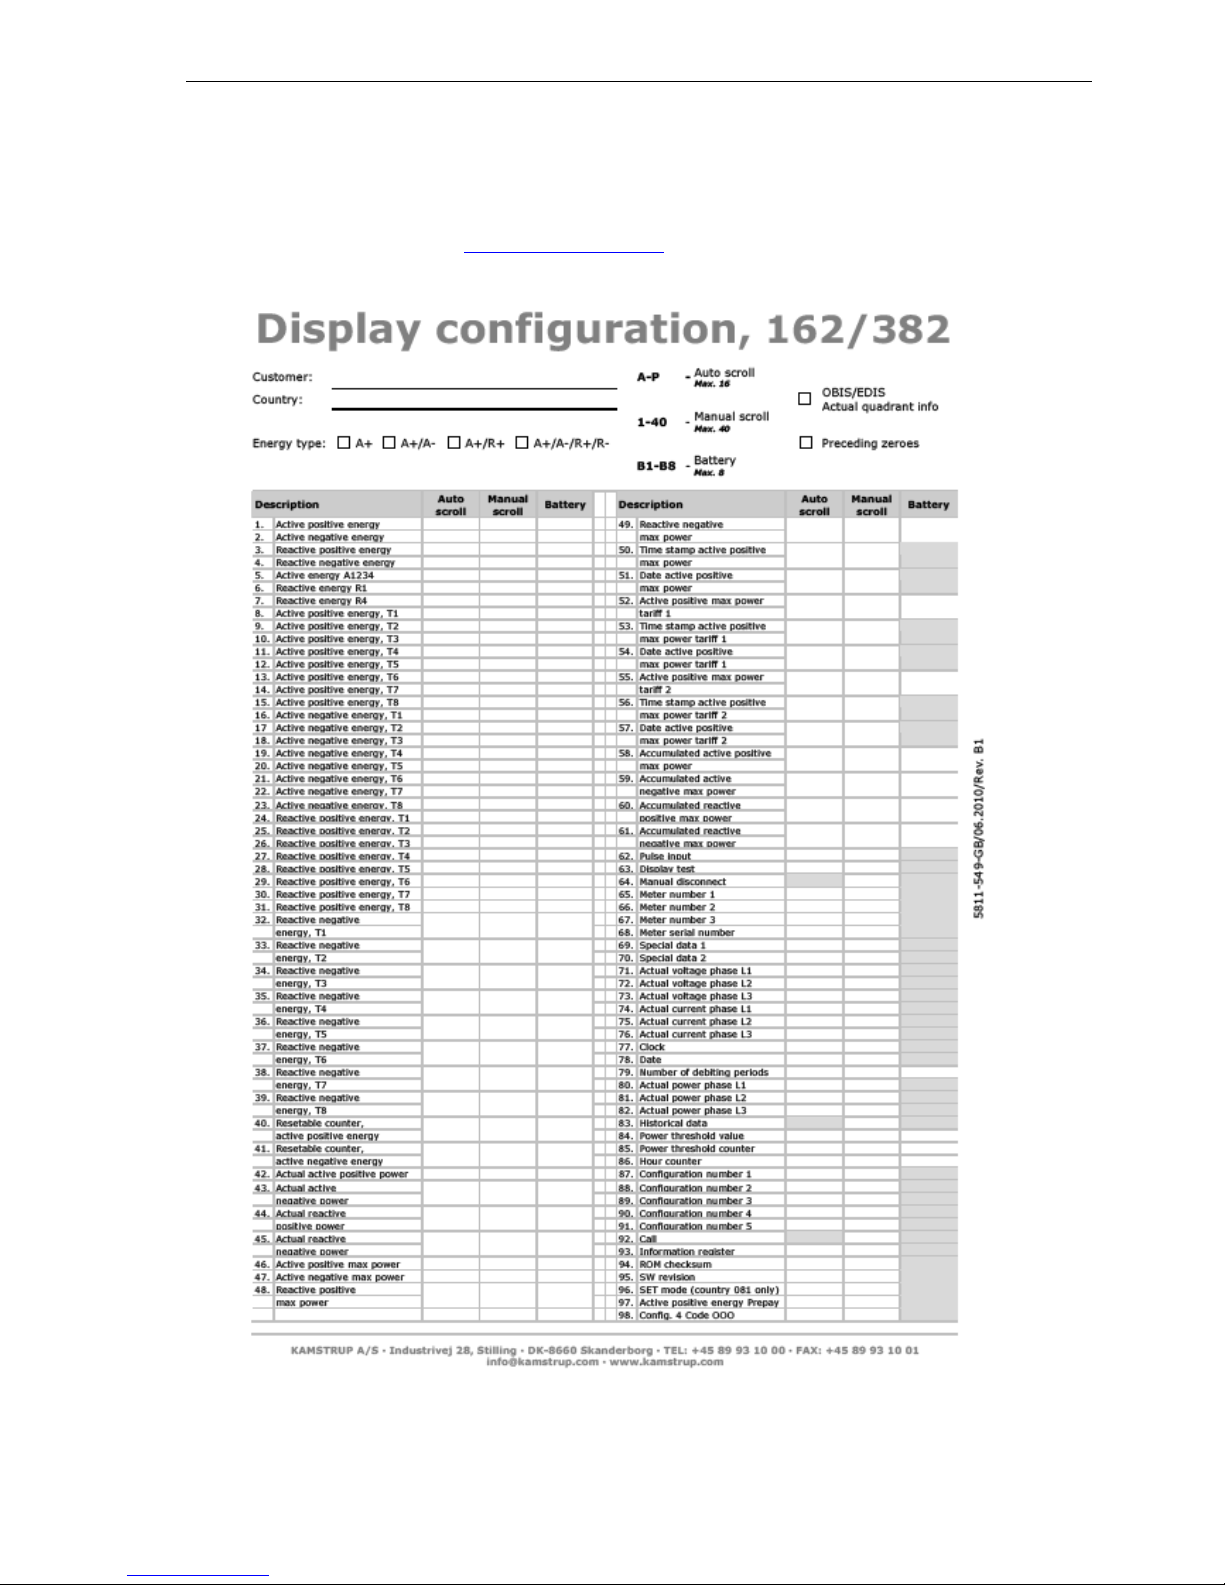
TECHNICAL DESCRIPTION Kamstrup 162M/382M
5512-1040 GB/05.2012/Rev. C1
67
10.7 Display configuration
The below form can be completed with the required display reading and sent to the Kamstrup Electricity Product
Group, with following contact info: El-Produkt@kamstrup.dk
.

TECHNICAL DESCRIPTION Kamstrup 162M/382M
5512-1040 GB/05.2012/Rev. C1
68

TECHNICAL DESCRIPTION Kamstrup 162M/382M
5512-1040 GB/05.2012/Rev. C1
69
10.8 Disconnect configuration
The required configuration for disconnect is ordered by completing the below form and sending it to Kamstrup
Electricity Product Group, El-Produkt@kamstrup.dk
. See also section 6 for a description of the disconnect
functionality.
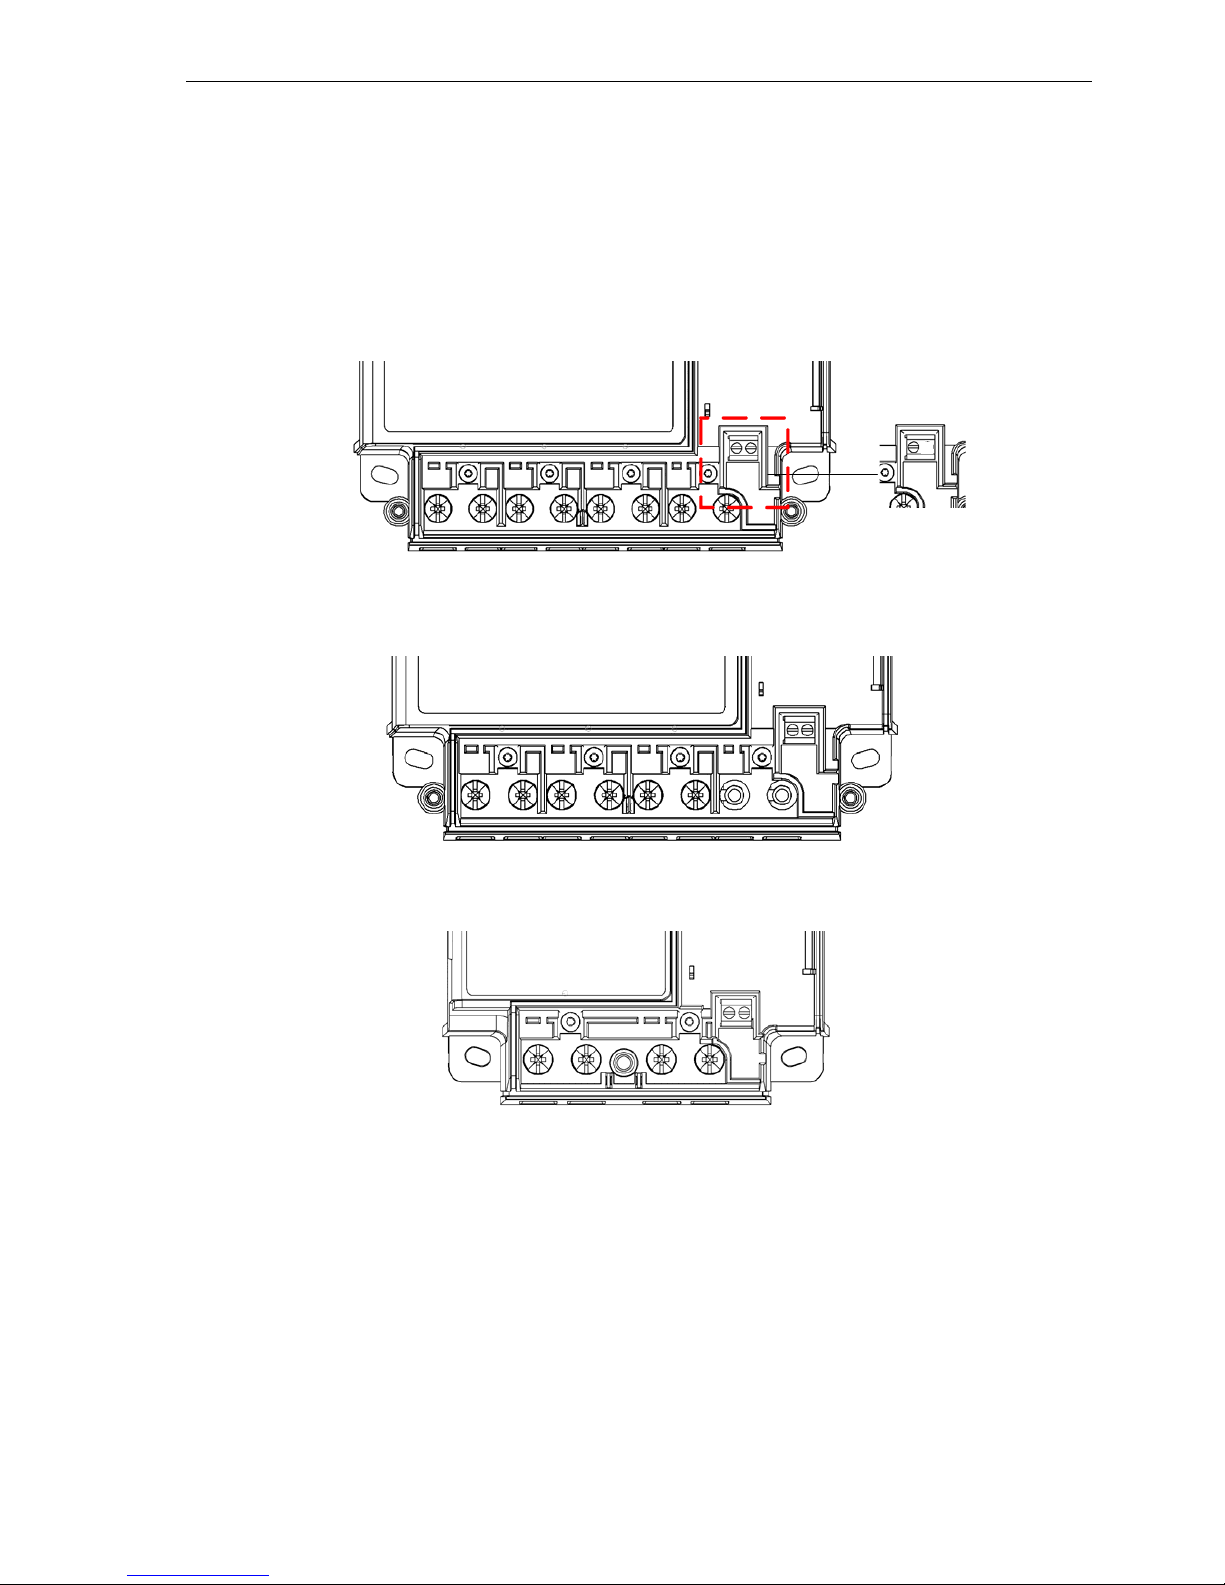
TECHNICAL DESCRIPTION Kamstrup 162M/382M
5512-1040 GB/05.2012/Rev. C1
70
11 Installation manual
Connect the meter in accordance with the installation diagram on the meter’s type label.
11.1 Terminal numbering
1234
5
6
109
8
7
11
12
S0
2120
APS
28
Figure 21: Terminal numbering for 382 meter with S0 or APS.
1234
5
6
109
8
7
11
12
S0
2120
Figure 22: Terminal numbering for Aron meter with S0.
123
4
5
6
S0
2120
Figure 23: Terminal numbering for 162 meter with S0.

TECHNICAL DESCRIPTION Kamstrup 162M/382M
5512-1040 GB/05.2012/Rev. C1
71
11.2 Connection diagrams
The valid connection diagram appears from the type label on the front of the meter.
3-phase, 4-wire (S0)
1 2 3 4 5 6 7 8 9 10 11 12
L1
L2
L3
N
S0
+20-
21
P+
3-phase, 4-wire (APS version)
1 2 3 4 5 6 7 8 9 10 11 12
L1
L2
L3
N
APS
+
28
3-phase, 3-wire (Aron)
1 2 3 4 5 6 7 8 9 10 11 12
L1
L2
L3
N
S0
+20-
21
P+
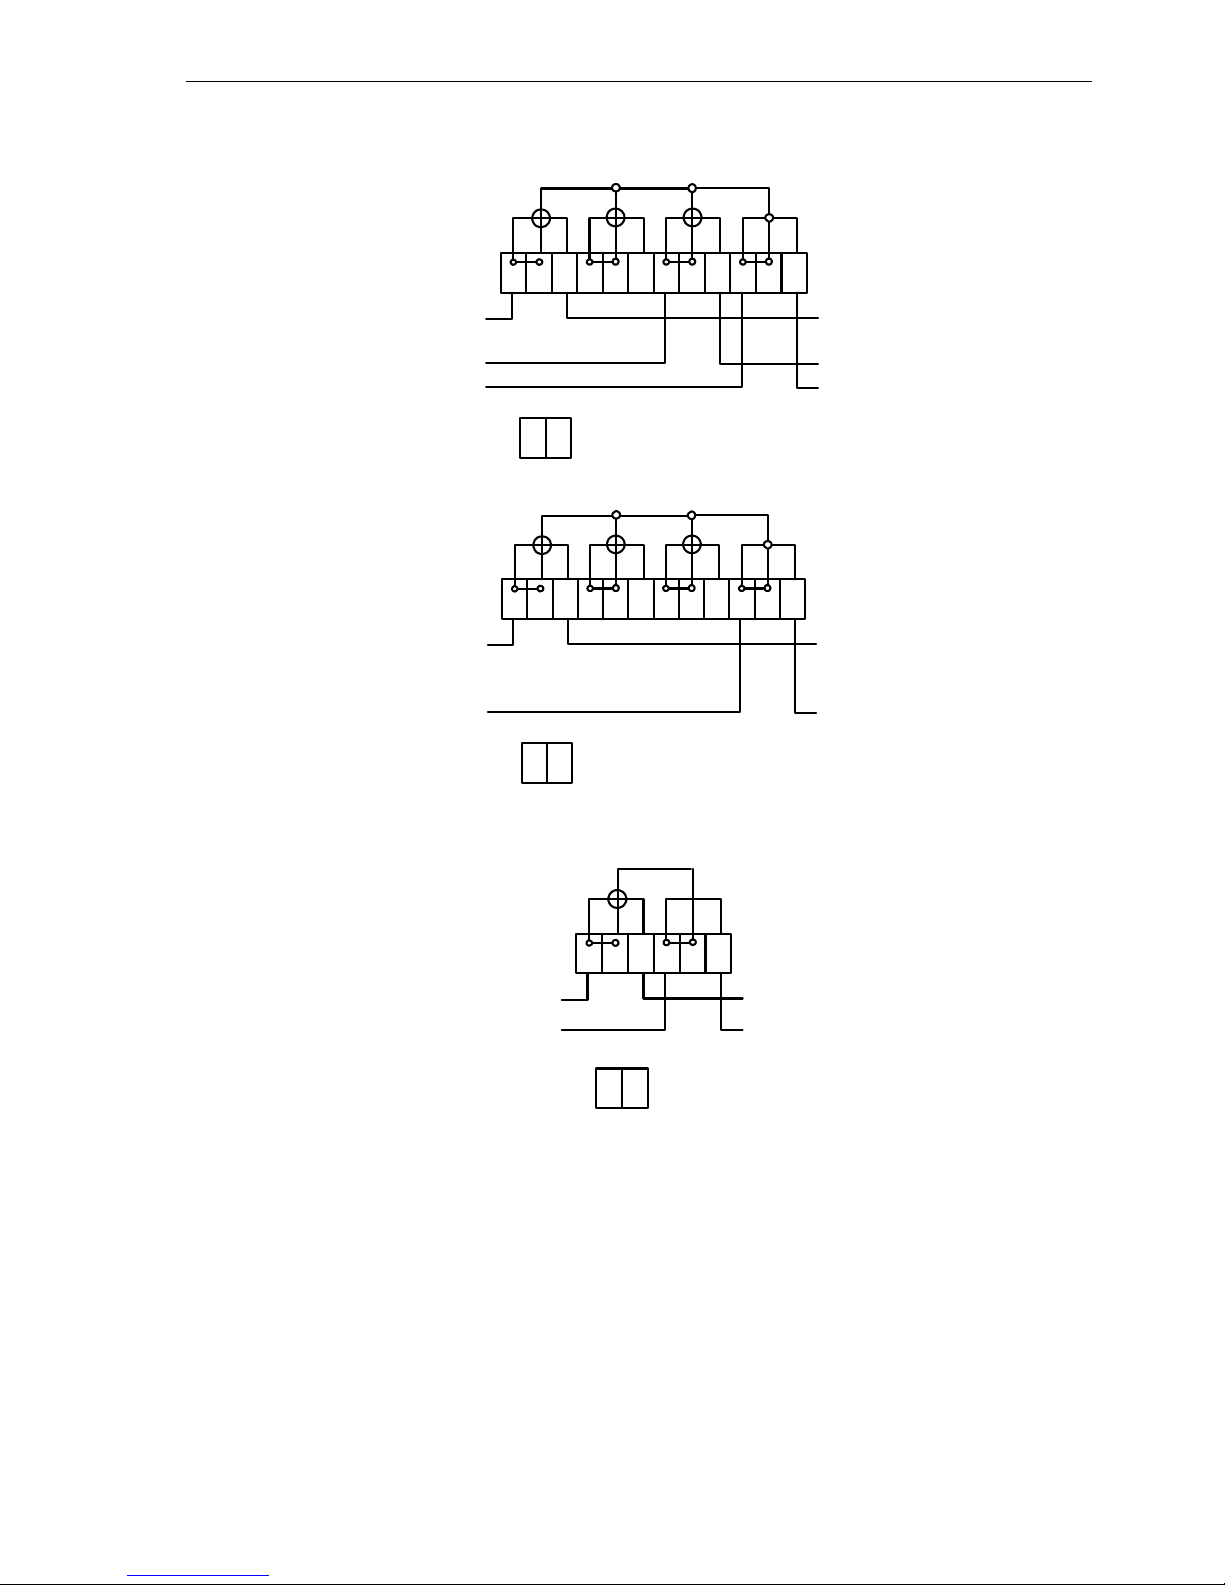
TECHNICAL DESCRIPTION Kamstrup 162M/382M
5512-1040 GB/05.2012/Rev. C1
72
2-phase, 3-wire
1 2 3 4 5 6 7 8 9 10 11 12
L1
L3
N
S0
+20-
21
P+
1-phase, 2-wire
1 2 3 4 5 6 7 8 9 10 11 12
L1
N
S0
+20-
21
P+
1-phase, 2-wire
1 2 3 4 5 6
L1
N
S0
+20-
21
P+
11.3 Guidelines for safety and installation
The meter shall only be used for measuring electrical energy and shall operate within the specified values only.
The meter must be disconnected from mains when working on it. It can be highly dangerous to touch the meter
parts when the meter is supplied from mains.
Therefore, the relevant security must be removed and kept in a place where it cannot be inserted in the meter by
unauthorized persons.
Current local standards, guidelines, regulations and instructions must be observed. Only authorized personnel is
permitted to install electricity meters.
Meters for direct connection must be protected against short circuit by a security in accordance with the
maximum current stated on the meter.
The meter constant LED flashes proportionally to the consumed active energy.

TECHNICAL DESCRIPTION Kamstrup 162M/382M
5512-1040 GB/05.2012/Rev. C1
73
11.4 Sealing
The meter is or can be sealed on different levels. The verification cover is “lifetime” sealed, i.e. the cover cannot
be unsealed without making damage on the cover and meter. The meter cover can be sealed by the utility, as can
the secondary module slot. Finally the right pushbutton also offers sealing of its pushaction. Only authorized
personnel can break the utility sealing.
Secondary module
Push button
Meter cover
Figure 24: Sealing options for 162M and 382M

TECHNICAL DESCRIPTION Kamstrup 162M/382M
5512-1040 GB/05.2012/Rev. C1
74
12 Test specifications
Standard test of the meter must be carried out according to the specifications described below. Depending on the
selected configuration such as energy type, class etc., the specification will change.
Test
-
ID
Name Duration
[kWh]/[sec]
Phase
angle [°]
Voltage
[V]
Current
phase 1 [A]
Current
phase 2
[A]
Current
phase 3
[A]
Kamstrup-
MPE [±%]
Standard
MPE [±%]
1 Pre-heat 0 230 100 100 100 - -
2 No-load 0 264.5 0 0 0 1 pulse 1 pulse
3 Pre-heat 0 230 100 100 100 - -
4 Imin 0 230 0.025 0.025 0.025 1 pulse 1 pulse
5 Itr 0 230 0.5 0.5 0.5 2.5 3.5
6 10xItr 0 230 5 5 5 1.5 2.5
7 10xItr cos=0.5 60 230 5 5 5 2 3
8 10xItr Phase 1 0 230 5 0 0 2.5 3.5
9 10xItr Phase 3 0 230 0 0 5 2.5 3.5
10 100% Imax 0 230 100 100 100 1.5 2.5
11 Display 0 230 0 0 0 1.5 1.5

TECHNICAL DESCRIPTION Kamstrup 162M/382M
5512-1040 GB/05.2012/Rev. C1
75
13 Packing
To be followed…
14 Accessories
SOFTWARE
Configuration software, METERTOOL 68 99 570
VARIOUS
Standard terminal cover (for poly-phase meters) 59 60 315
Long terminal cover 60 mm (for poly-phase meters) 59 60 316
Extra long terminal cover 100 mm (for poly-phase meters) xx xx xxx (Not available yet)
Standard terminal cover (for single-phase meters) 59 60 322
Long terminal cover 60 mm (for single-phase meters)) 59 60 323
Extra long terminal cover 100 mm (for poly-phase meters) xx xx xxx (Not available yet)
59 60 315 59 60 316 59 60 xxx
Optical reading head with USB connector 66 99 099
Optical reading head with 9-pole D. sub connector 66 99 102
Metertool kit (RS232 module with USB connector) 68 30 017
Pins, 50 pcs. 68 50 102
Cable sockets, 50 pcs. 68 50 103
 Loading...