

Juniper SECURITY THREAT RESPONSE MANAGER 2008.2 R2 - REV1, Security Threat Response Manager 2008.2 R2 User Manual
Page 1

Security Threat Response Manager
STRM Users Guide
Release 2008.2 R2
Juniper Networks, Inc.
1194 North Mathilda Avenue
Sunnyvale, CA 94089
USA
408-745-2000
www.juniper.net
Part Number: 530-027294-01, Revision 1
Page 2

Copyright Notice
Copyright © 2008 Juniper Networks, Inc. All rights reserved. Juniper Networks and the Juniper Networks logo are registered trademarks of Juniper
Networks Inc. in the United States and other countries. All other trademarks, service marks, registered trademarks, or registered service marks in this
document are the property of Juniper Networks or their respective owners. All specifications are subject to change without notice. Juniper Networks
assumes no responsibility for any inaccuracies in this document or for any obligation to update information in this document. Juniper Networks reserves
the right to change, modify, transfer, or otherwise revise this publication without notice.
FCC Statement
The following information is for FCC compliance of Class A devices: This equipment has been tested and found to comply with the limits for a Class A
digital device, pursuant to part 15 of the FCC rules. These limits are designed to provide reasonable protection against harmful interference when the
equipment is operated in a commercial environment. The equipment generates, uses, and can radiate radio-frequency energy and, if not installed and
used in accordance with the instruction manual, may cause harmful interference to radio communications. Operation of this equipment in a residential
area is likely to cause harmful interference, in which case users will be required to correct the interference at their own expense. The following
information is for FCC compliance of Class B devices: The equipment described in this manual generates and may radiate radio-frequency energy. If it
is not installed in accordance with NetScreen’s installation instructions, it may cause interference with radio and television reception. This equipment has
been tested and found to comply with the limits for a Class B digital device in accordance with the specifications in part 15 of the FCC rules. These
specifications are designed to provide reasonable protection against such interference in a residential installation. However, there is no guarantee that
interference will not occur in a particular installation. If this equipment does cause harmful interference to radio or television reception, which can be
determined by turning the equipment off and on, the user is encouraged to try to correct the interference by one or more of the following measures:
Reorient or relocate the receiving antenna. Increase the separation between the equipment and receiver. Consult the dealer or an experienced radio/TV
technician for help. Connect the equipment to an outlet on a circuit different from that to which the receiver is connected.
Caution: Changes or modifications to this product could void the user's warranty and authority to operate this device.
Disclaimer
THE SOFTWARE LICENSE AND LIMITED WARRANTY FOR THE ACCOMPANYING PRODUCT ARE SET FORTH IN THE INFORMATION PACKET
THAT SHIPPED WITH THE PRODUCT AND ARE INCORPORATED HEREIN BY THIS REFERENCE. IF YOU ARE UNABLE TO LOCATE THE
SOFTWARE LICENSE OR LIMITED WARRANTY, CONTACT YOUR JUNIPER NETWORKS REPRESENTATIVE FOR A COPY.
STRM Users Guide
Release 2008.2 R2
Copyright © 2008, Juniper Networks, Inc.
All rights reserved. Printed in USA.
Revision History
September 2008—Revision 1
The information in this document is current as of the date listed in the revision history.
2
Page 3

CONTENTS
ABOUT THIS GUIDE
Conventions 1
Technical Documentation 1
Contacting Customer Support 2
1 ABOUT STRM
Logging In to STRM 3
Dashboard 4
Offense Manager 5
Event Viewer 5
Flow Viewer 6
Assets 6
Network Surveillance 8
Reports 9
Using STRM 9
Sorting Results 9
Refreshing the Interface 10
Pausing the Interface 10
Investigating IP Addresses 10
Viewing STRM Time 11
Accessing On-line Help 11
STRM Administration Console 11
2 USING THE DASHBOARD
About the Dashboard 13
Using the Dashboard 15
Network Surveillance 16
Traffic 16
TopN 17
Offense Manager 18
Offenses 18
Attackers and Targets 19
Categories 19
Event Viewer 20
Events Over Time 20
Events By Severity 20
Top Devices 21
Page 4

Reports 22
Enterprise Security State 22
Enterprise Vulnerability State 23
System Summary 24
Adding Items 24
3 MANAGING YOUR NETWORK ACTIVITY
Using the Network Surveillance Menu 25
Global Views 25
Asset Map 26
Bookmarks 27
QRL Options 27
Viewing Network Activity 28
Interpreting the Graphs 28
Changing the View 30
Changing Flow Attributes 32
Changing Traffic Location 33
Investigating Traffic Using TopN 34
Viewing the TopN Information 34
Investigating Traffic 35
Investigating Flows 36
4 MANAGING SENTRIES
About Sentries 40
Types of Sentries 40
Viewing Sentries 42
Creating a Sentry 43
Creating a Security/Policy Sentry 44
Creating a Behavior Sentry 49
Creating an Anomaly Sentry 56
Creating a Threshold Sentry 61
Creating a Custom Sentry 66
Editing a Sentry 72
5 INVESTIGATING OFFENSES
Using the Offense Manager 78
Managing My Offenses 78
Managing Offenses 79
Viewing Offenses 79
Searching Offenses 88
Removing Offenses 90
Assigning Offenses to Users 92
Viewing Offense By Category 93
Managing Offenses By Attacker 97
Viewing Offenses by Attacker 97
Searching Attackers 104
Page 5

Managing Offenses By Targets 106
Viewing Offenses By Targets 106
Searching Targets 112
Managing Offenses By Networks 114
Viewing Offenses By Networks 114
Searching Networks 124
Marking an Item For Follow-Up 125
Adding Notes 125
Configuring Notification 126
Managing Network Anomalies 127
Viewing Network Anomaly Offenses 127
Closing Offenses 129
Forwarding Network Anomaly Offenses 130
Exporting Offenses 131
6 USING THE EVENT VIEWER
Using the Event Viewer Interface 134
Using the Toolbar 134
Using the Right-Click Menu Options 134
Viewing Events 135
Viewing Normalized Events 135
Viewing Raw Events 139
Viewing Aggregate Normalized Events 140
Searching Events 145
Searching Events 145
Deleting Saved Searches 148
Viewing the Associated Offense 148
Modifying Event Mapping 149
Tuning False Positives 151
Exporting Events 152
7 USING THE FLOW VIEWER
Using the Flow Viewer Interface 154
Using the Toolbar 154
Using the Right-Click Menu Options 154
Viewing Flows 155
Viewing Flows 155
Viewing Aggregated Flows 158
Using the Search 164
Searching Flows 164
Deleting Saved Searches 167
Exporting Flows 167
8 MANAGING ASSETS
Searching Asset Profiles 169
Adding an Asset Profile 175
Page 6

Editing an Asset 176
Deleting Assets 178
Deleting an Asset 178
Deleting All Assets 178
Importing Asset Profiles 179
Exporting Assets 180
9 MANAGING REPORTS
Using the Reports Interface 182
Using the Navigation Menu 182
Using the Toolbar 183
Viewing Reports 183
Grouping Reports 184
Creating a Group 185
Editing a Group 186
Copying a Template to Another Group 186
Deleting a Template From a Group 187
Assigning a Report to a Group 188
Creating a Report 188
Creating a Template 189
Configuring Charts 196
Selecting a Graph Type 214
Using Default Report Templates 216
Generating a Report 217
Duplicating a Report 217
Sharing a Report 218
Branding Your Report 218
10 USING TNC RECOMMENDATIONS
Configuring TNC Recommendations 221
Removing TNC Recommendations 223
A GLOSSARY
INDEX
Page 7
ABOUT THIS GUIDE
The STRM Users Guide provides information on managing STRM including the
Dashboard, Offense Manager, Reports, Event Viewer, and Network Surveillance
interfaces.
Conventions Table 1 lists conventions that are used throughout this guide.
Table 1 Icons
Icon Type Description
Information note Information that describes important features or
instructions.
Caution Information that alerts you to potential loss of
data or potential damage to an application,
system, device, or network.
Warning Information that alerts you to potential personal
injury.
Technical
Documentation
You can access technical documentation, technical notes, and release notes
directly from the Juniper Networks support web site at https://juniper.net/support.
Once you access the Juniper Networks support web site, locate the product and
software release for which you require documentation.
Your comments are important to us. Please send your e-mail comments about this
guide or any of the Juniper Networks documentation to:
Include the following information with your comments:
• Document title
• Page number
STRM Users Guide
Page 8

2 ABOUT THIS GUIDE
Contacting
Customer Support
To help you resolve any issues that you may encounter when installing or
maintaining STRM, you can contact Customer Support as follows:
• Log a support request 24/7: https://juniper.net/support/
For access to the Juniper Networks support web site, please contact Customer
Support.
• Access Juniper Networks support and Self-Service support using e-mail:
• Telephone assistance: 1-800-638-8296.
STRM Users Guide
Page 9

1
ABOUT STRM
STRM is a network security management platform that provides situational
awareness and compliance support through the combination of flow-based
network knowledge, security event correlation, and asset-based vulnerability
assessment. This chapter provides an overview of the STRM interface including:
• Logging In to STRM
• Dashboard
• Offense Manager
• Event Viewer
• Flow Viewer
• Assets
• Network Surveillance
• Network Surveillance
• Reports
• Using STRM
• STRM Administration Console
Note: When navigating STRM, do not use the browser Back button. Use the
navigation options available with STRM to navigate the interface.
Logging In to STRM To login to STRM:
Step 1 Open your web browser.
Step 2 Log in to STRM:
https://<
Where <
are:
Username: admin
Password: <root password>
Where
installation process. For more information, see the STRM Installation Guide.
IP Address>
IP Address> is the IP address of the STRM system. The default values
<root password> is the password assigned to STRM during the
STRM Users Guide
Page 10
4 ABOUT STRM
Step 3 Click Login To STRM.
For your STRM Console, a default license key provides you access to the interface
for 5 weeks. A window appears providing the date that the temporary license key
will expire. For information on installing a permanent license key, see the STRM
Administration Guide.
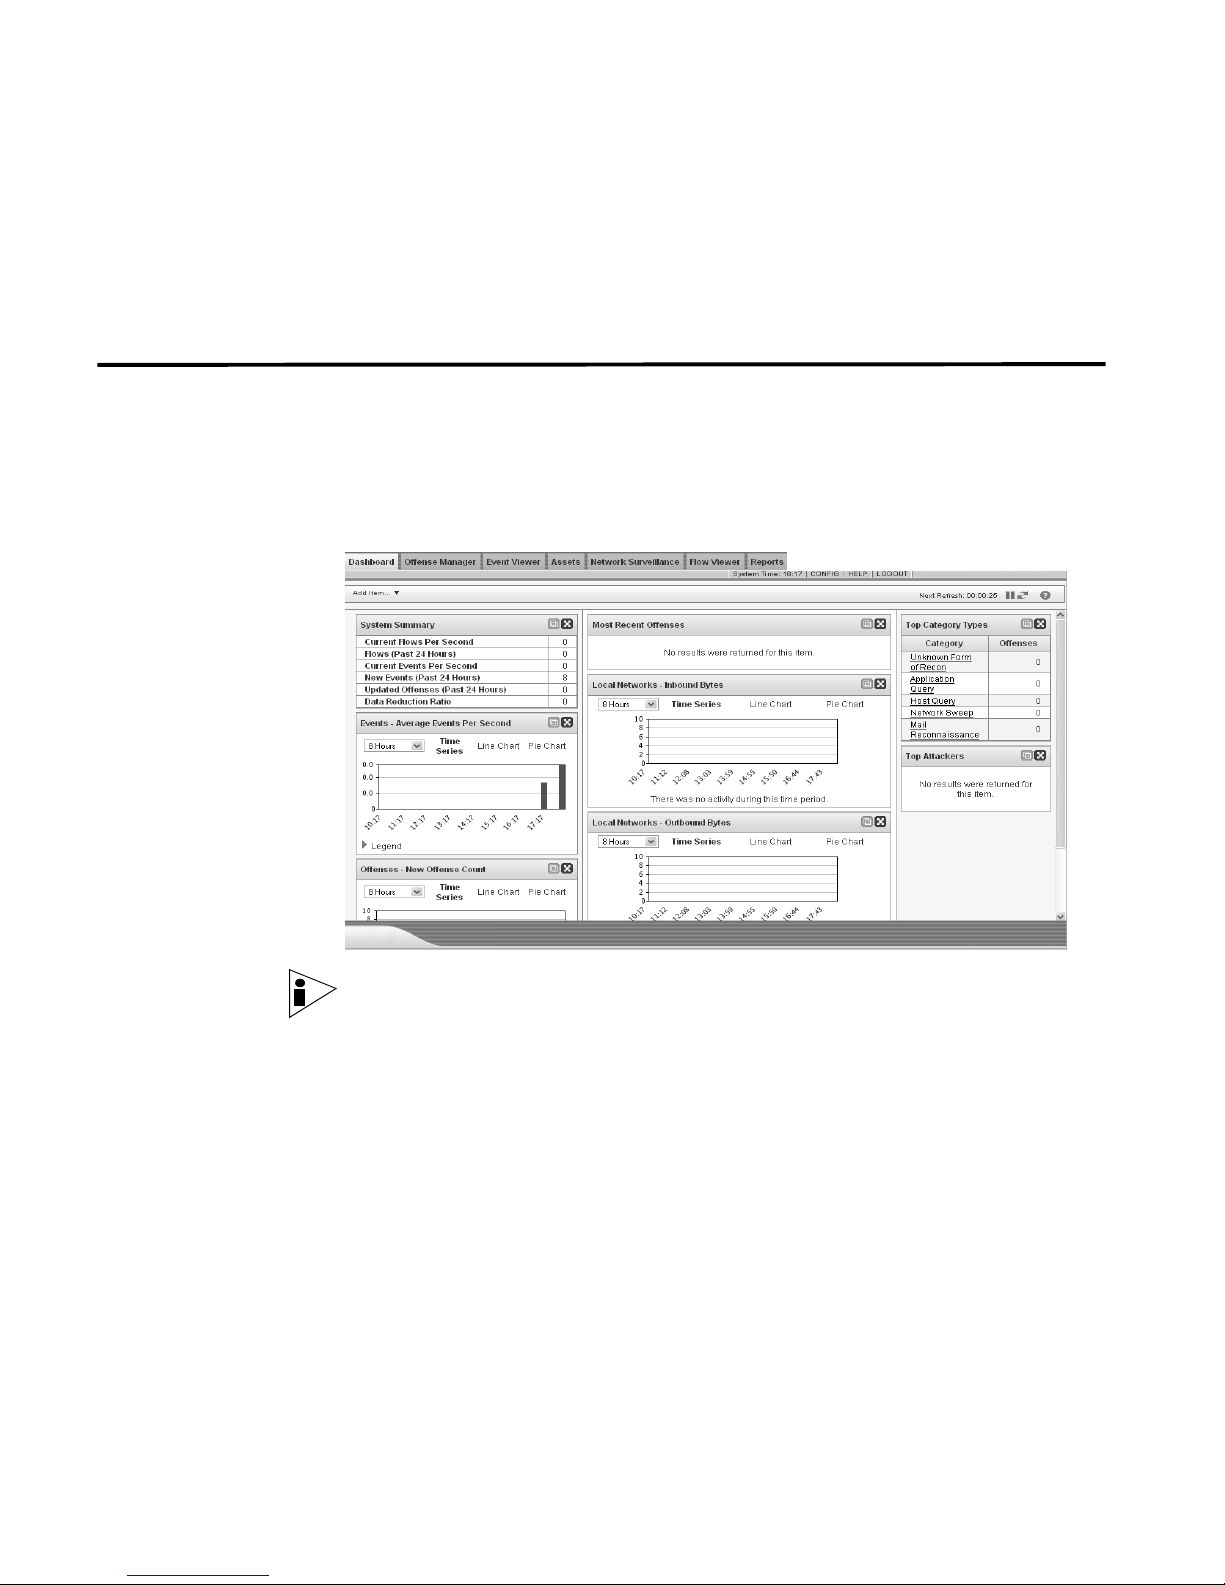
Dashboard The Dashboard tab is the default interface that appears when you log in to STRM.
The Dashboard tab provides summary and detailed information on offenses
occurring on your network, your network overall security and vulnerability state, as
well as in depth views into your network traffic behavior. The Dashboard is
customizable on a per user basis to focus on individual user’s security or network
operations responsibilities.
Note: For more information on using the Dashboard, see Chapter 2 Using the
Dashboard.
STRM Users Guide
Page 11
Offense Manager 5
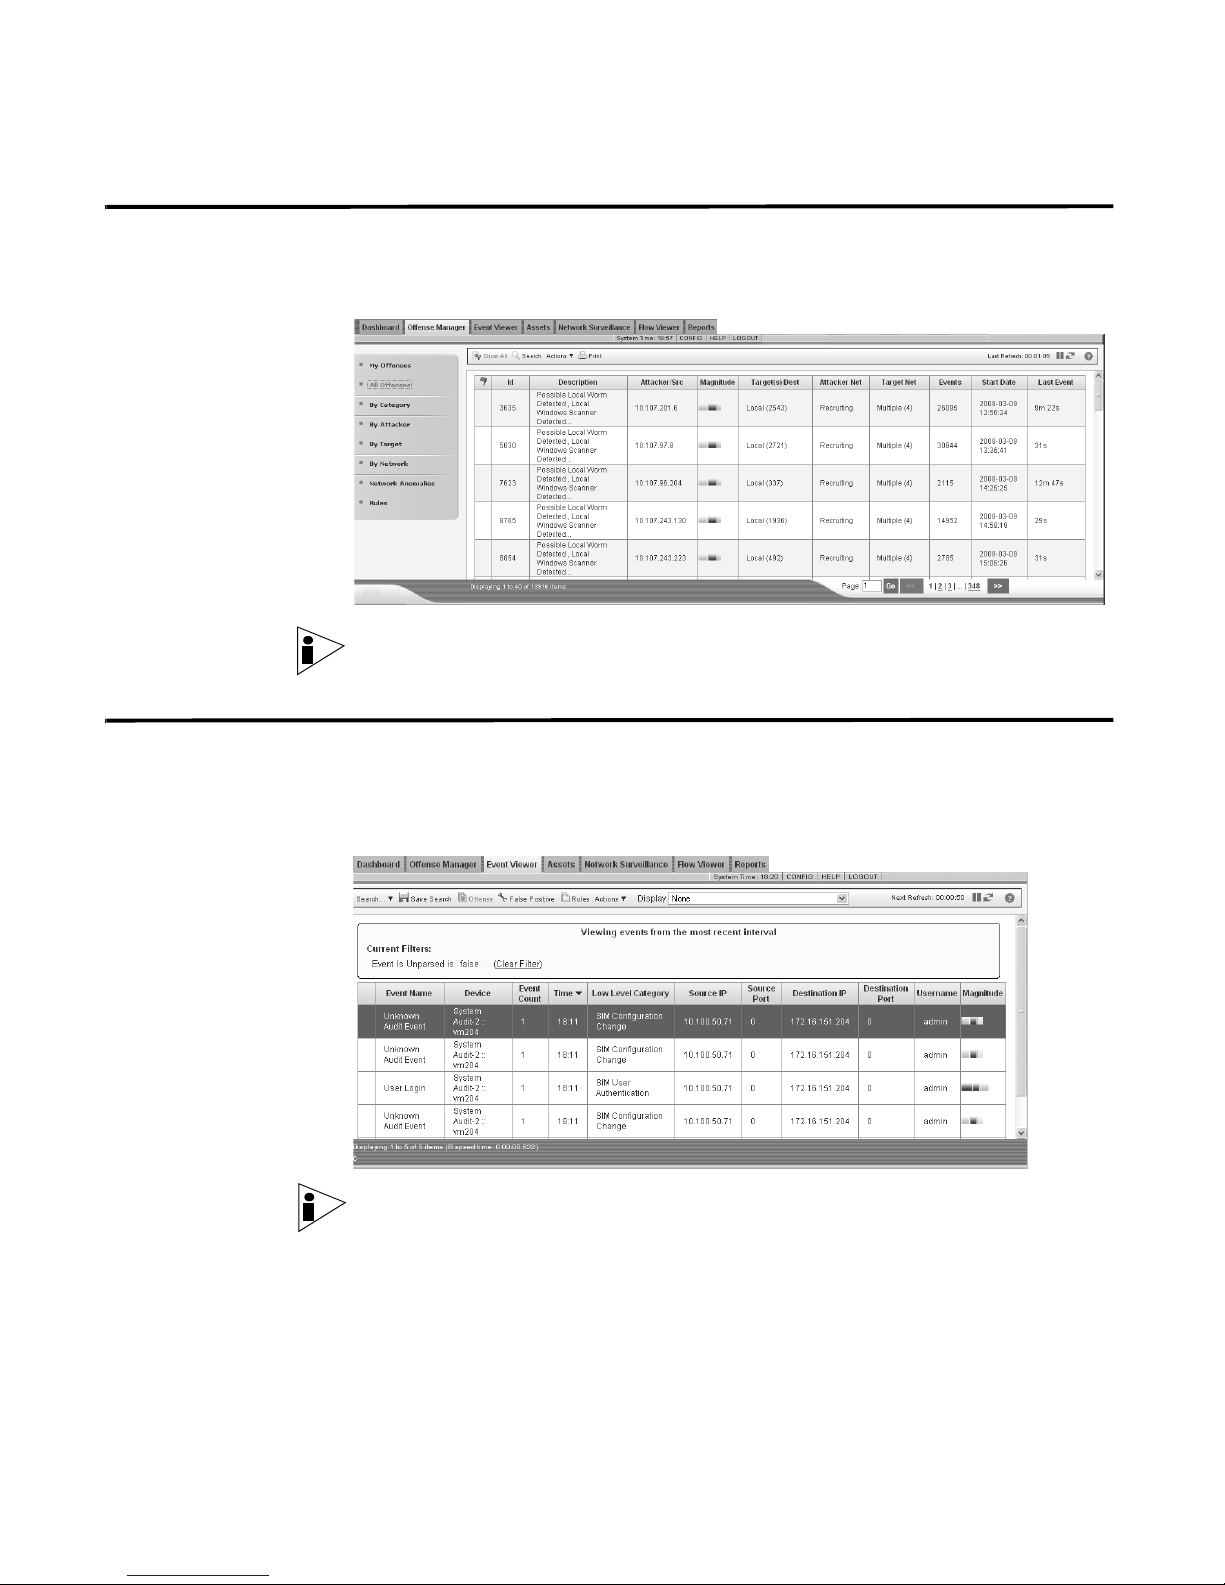
Offense Manager The Offense Manager tab provides a view into all offenses occurring on your
network. From the Offense Manager, you can investigate an offense to determine
the root cause of an issue. You can also resolve the issue.
Note: For more information on Offense Manager, see Chapter 5 Investigating
Offenses.
Event Viewer The Event Viewer allows you to view event logs being sent to STRM in real-time,
or through powerful searches. The Event Viewer is a powerful tool for performing
in-depth investigations on event data. It is also useful for quickly identifying false
positives and tuning STRM.
Note: For more information, see Chapter 6 Using the Event Viewer.
STRM Users Guide
Page 12
6 ABOUT STRM
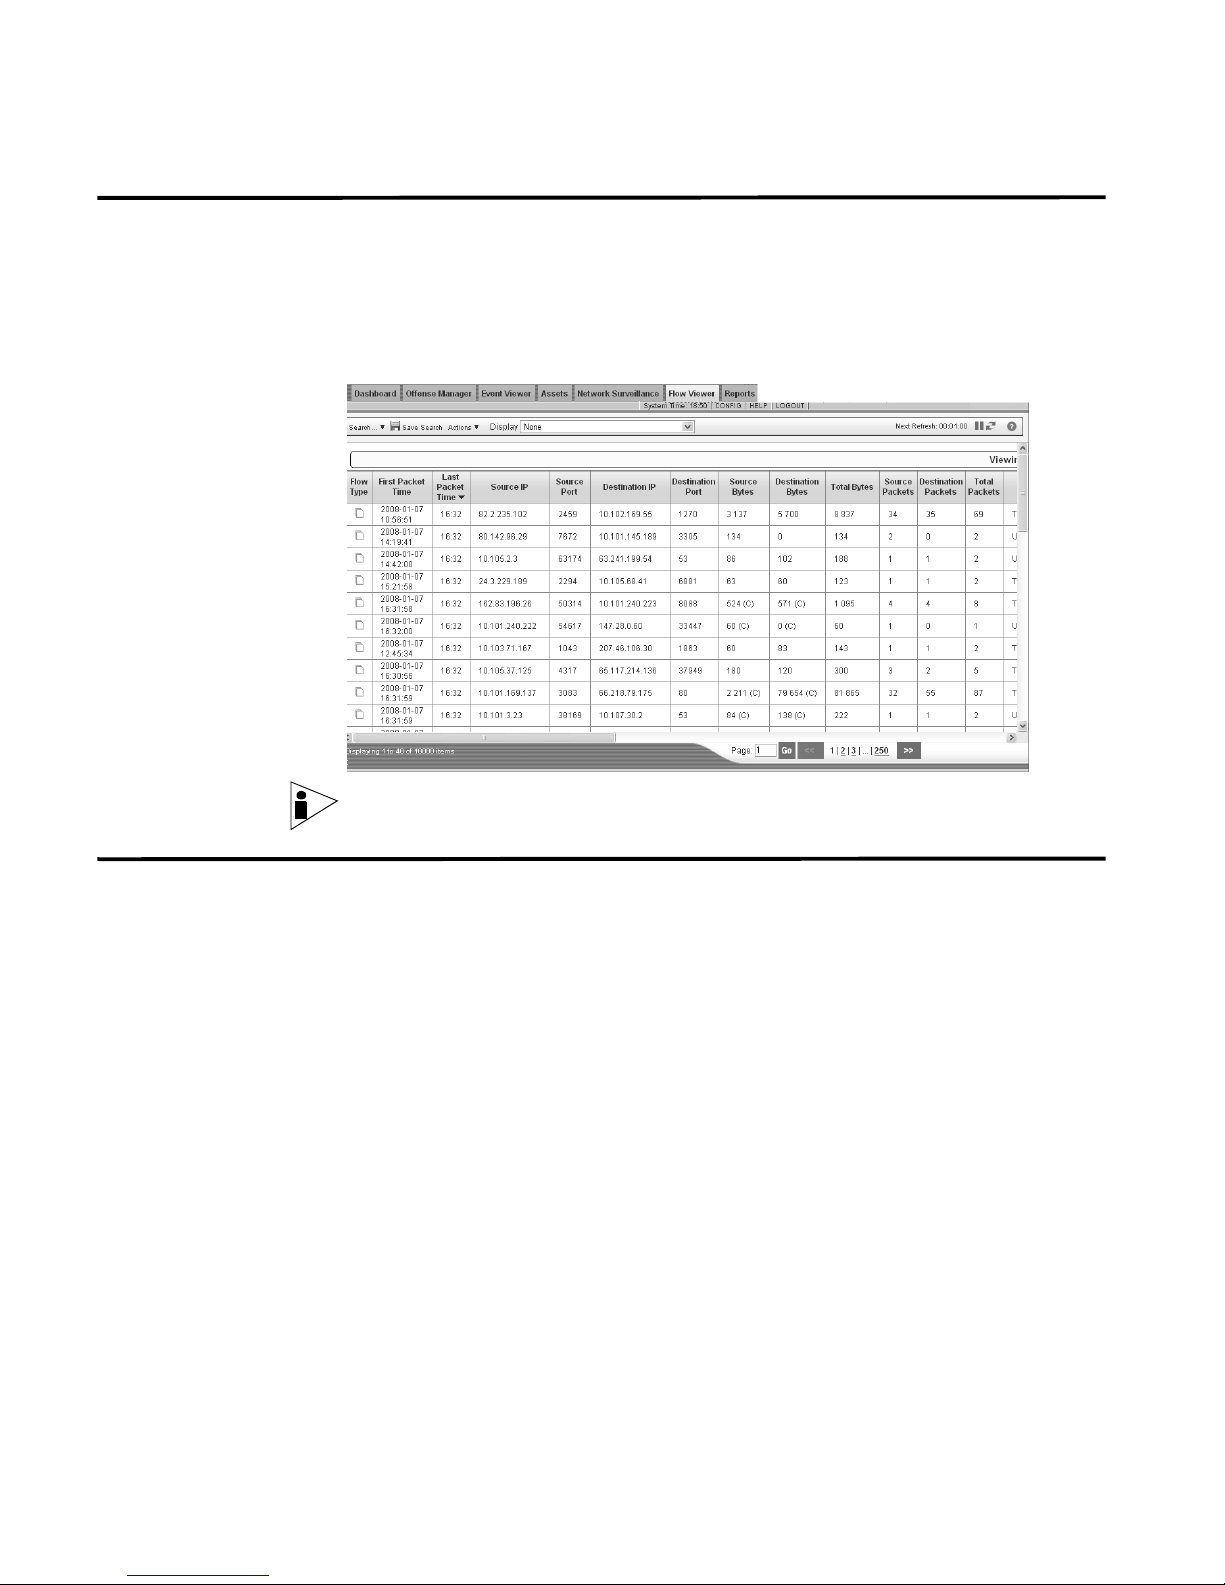
Flow Viewer The Flow Viewer tab allows you to monitor and investigate flow data in real-time or
perform advanced searches. A flow is a communication session between two
hosts. Viewing flow information allows you to determine how the traffic is
communicated, what was communicated (if the content capture option is enabled),
and includes such details as when, who, how much, protocols, ASN values, IfIndex
values, or priorities.
Note: For more information, see Chapter 7 Using the Flow Viewer.
Assets STRM automatically discovers assets (servers and hosts) operating on your
network, based on passive QFlow data as well as vulnerability data allowing STRM
to build an asset profile. Asset profiles display what services are running on each
asset. This profile data is used for correlation purposes to help reduce false
positives, for example, if an attack occurs trying to exploit a specific service
running on a specific asset, STRM can determine if the asset is vulnerable to this
attack by correlating the attack to the asset profile. Using the Assets tab, you can
view all the learned assets or search for specific assets to view there profiles.
STRM Users Guide
Page 13
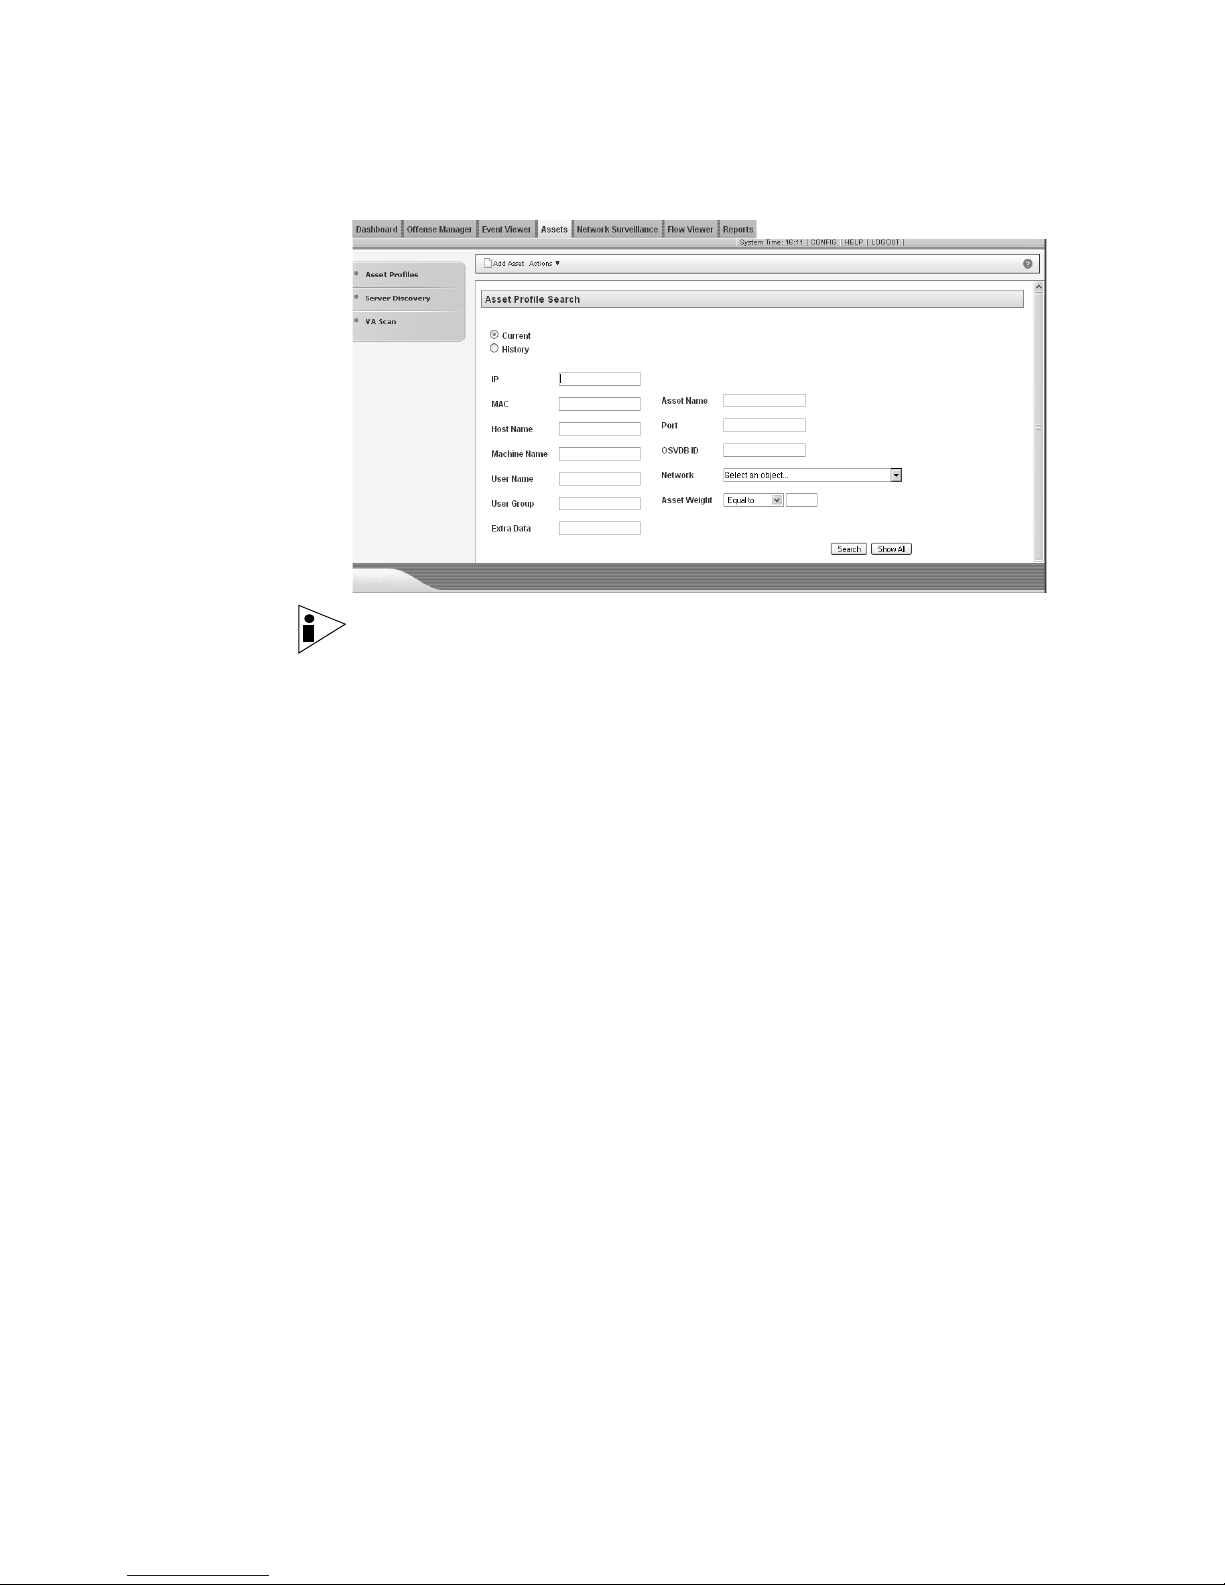
Note: For more information, see Chapter 8 Managing Assets.
Assets 7
STRM Users Guide
Page 14
8 ABOUT STRM
Network
Surveillance
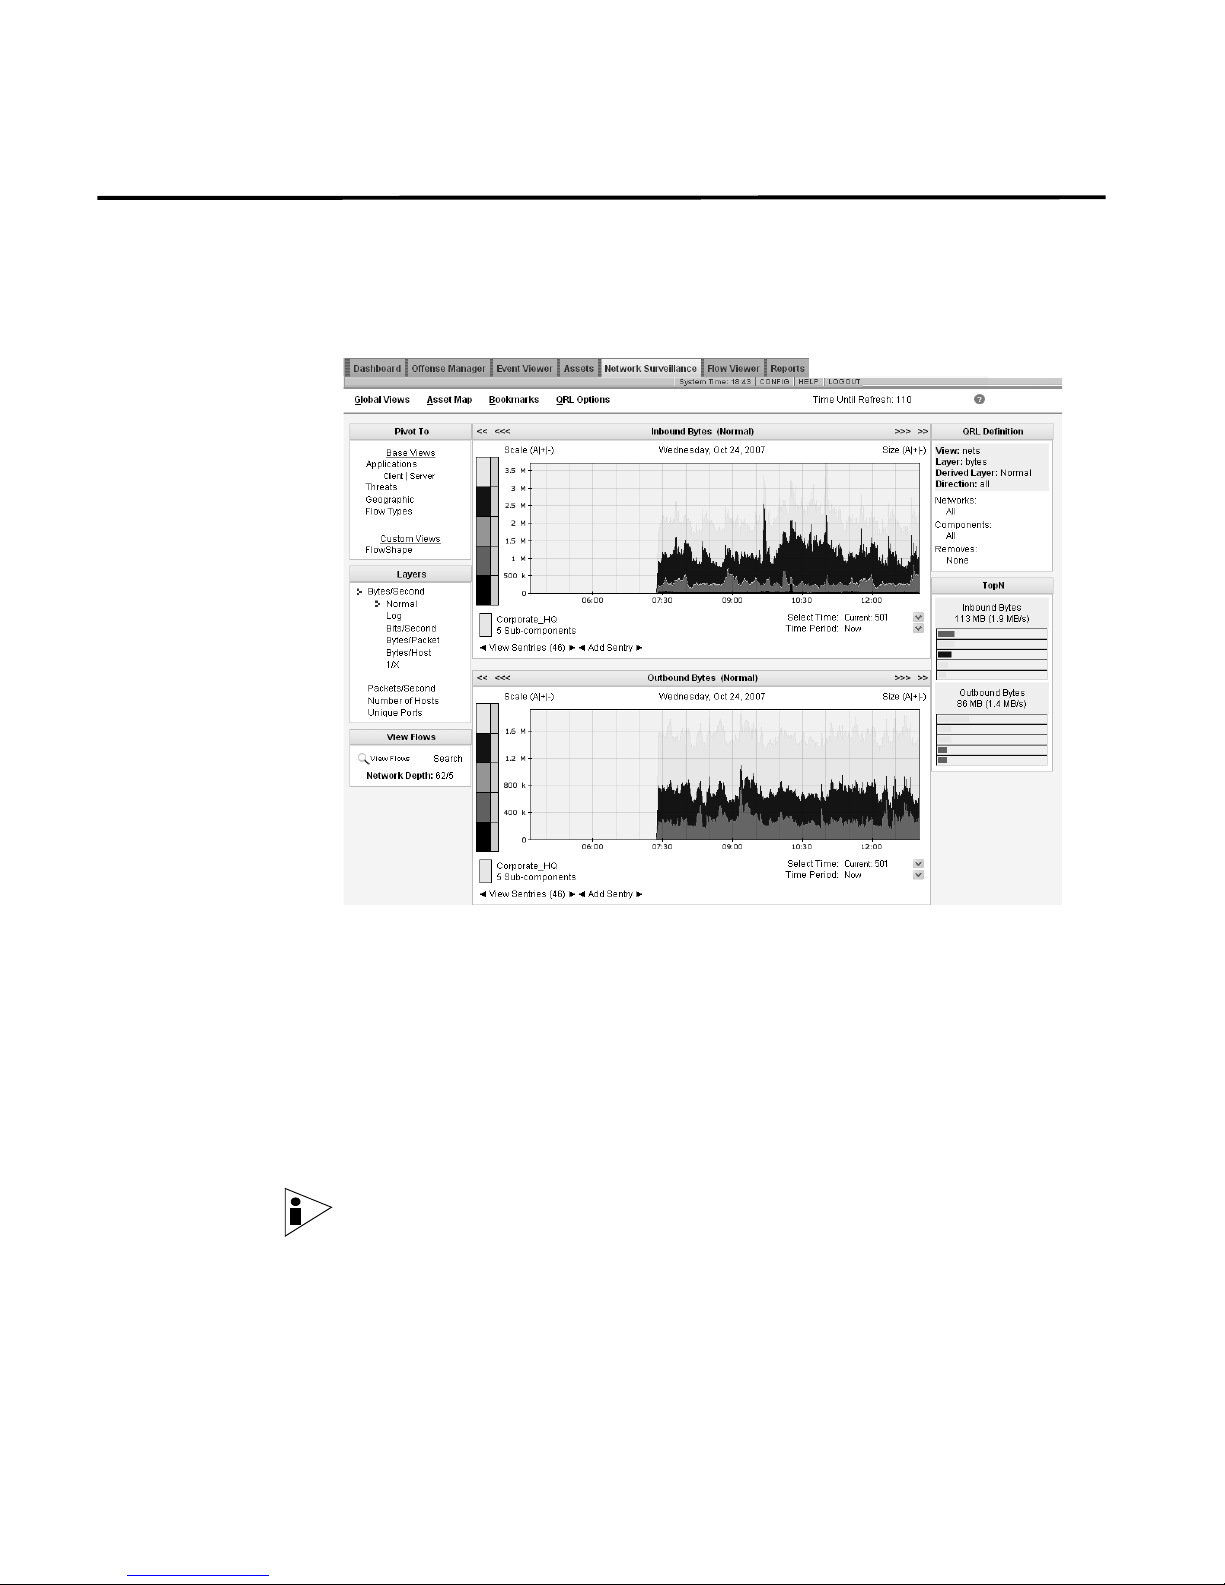
The Network Surveillance tab is a real-time network behavioral and anomaly
monitoring interface that allows you to monitor the traffic on your network and how
your network is behaving. The Network Surveillance tab displays what areas of
your network are producing the most traffic, what applications are running, and
what types of threatening or out of policy traffic are present on your network.
Using the Network Surveillance interface, you can:
• Sentries are a technology that monitors traffic seen in any Network Surveillance
view, such as apps, network , asset groups and geographies, and alert on
normal behavior. Using the Network Surveillance interface, you can add
sentries to any view you are monitoring. The alerts that sentries create can be
correlated with events sent from other security and infrastructure devices to
create offenses, viewed within the Offense Manager.
• View and investigate your network activity. For more information, see Chapter 3
Managing Your Network Activity.
Note: For more information on using the Network Surveillance interface, see
Chapter 3 Managing Your Network Activity.
STRM Users Guide
Page 15
Reports 9
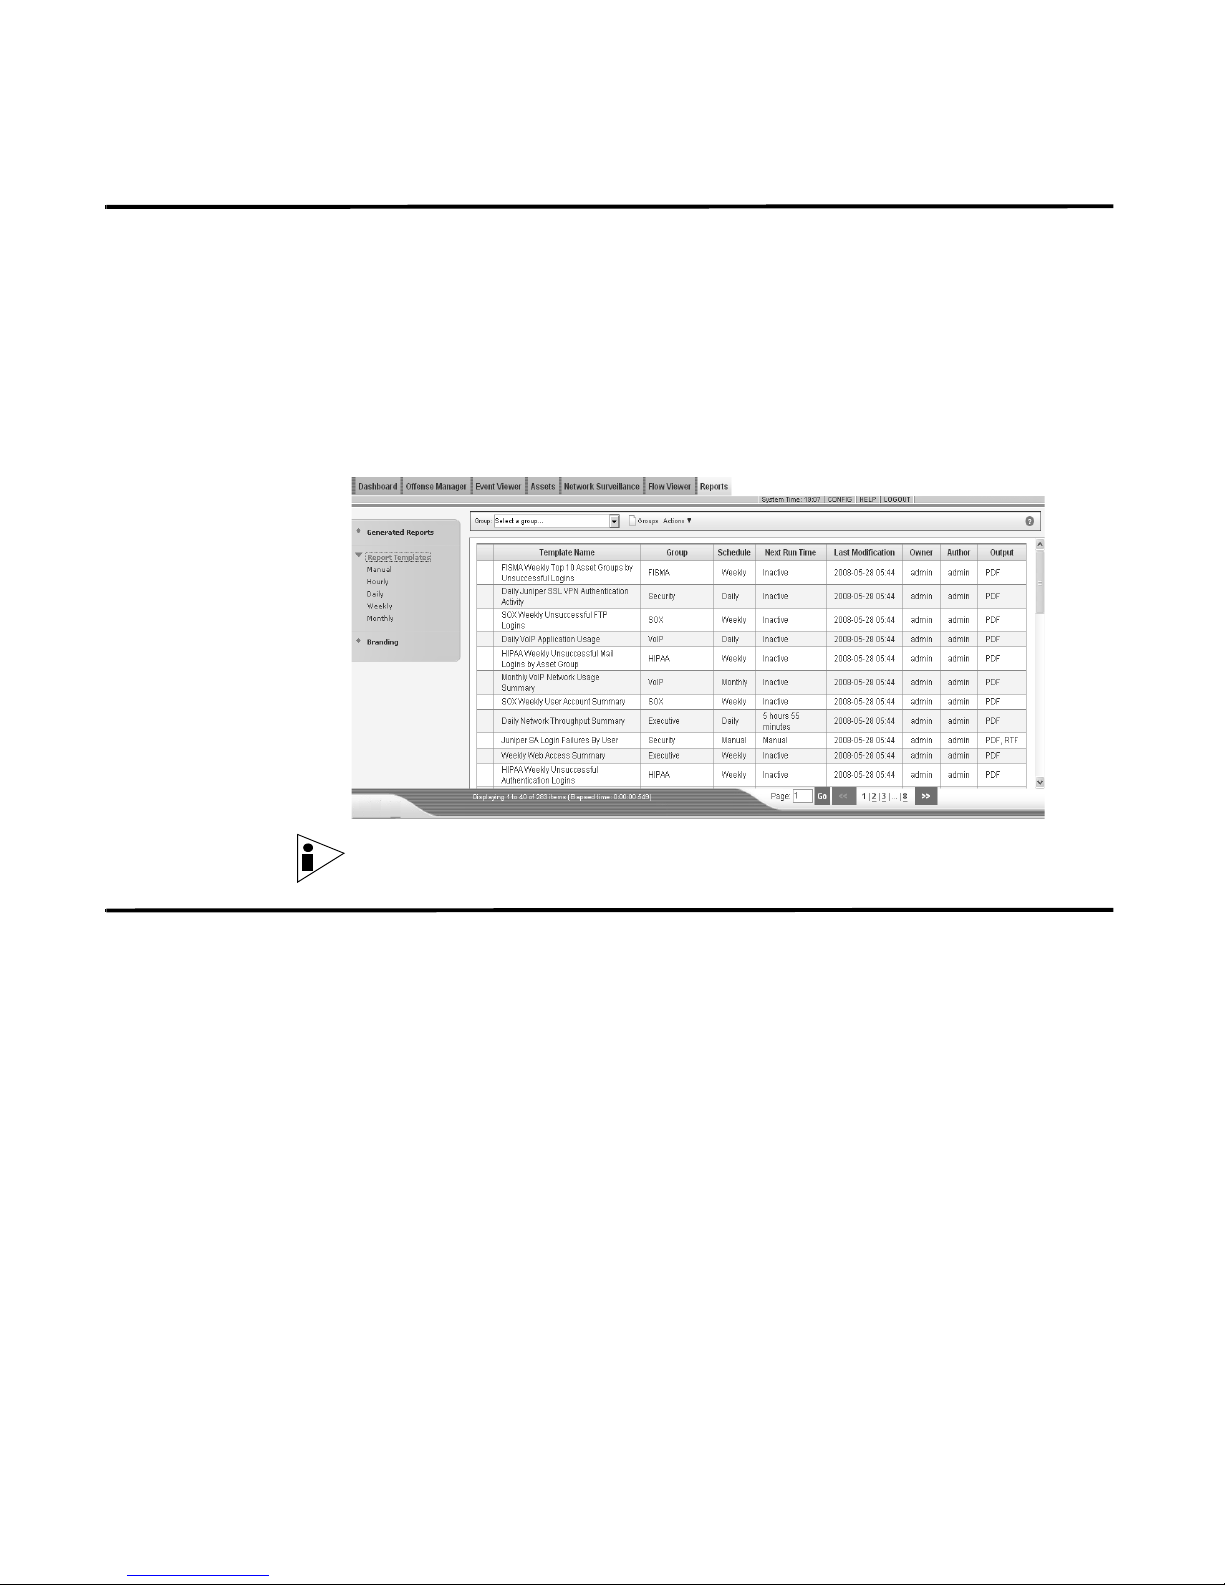
Reports Reports is a flexible and robust reporting package that allows you to create,
distribute, and manage reports for any data within STRM. Reports allows you to
create customized reports for operational and executive use by combining any
combination of information (such as, security or network) into a single report. You
can also use the many pre-installed report templates included with STRM.
The Reports tab also allows you to brand your reports with your customized logos
enabling you to support various unique logos for each report. This is beneficial for
distributing reporting to different audiences.
Note: For more information on Reports, see Chapter 9 Managing Reports.
Using STRM Using STRM, you can:
• Sort the results. See Sorting Results.
• Refresh the interface. See Refreshing the Interface.
• Pause the current display. See Pausing the Interface.
• Further investigate an IP address. See Investigating IP Addresses.
• View the time of the STRM Console. See Viewing STRM Time.
• Access the on-line Help. See Accessing On-line Help.
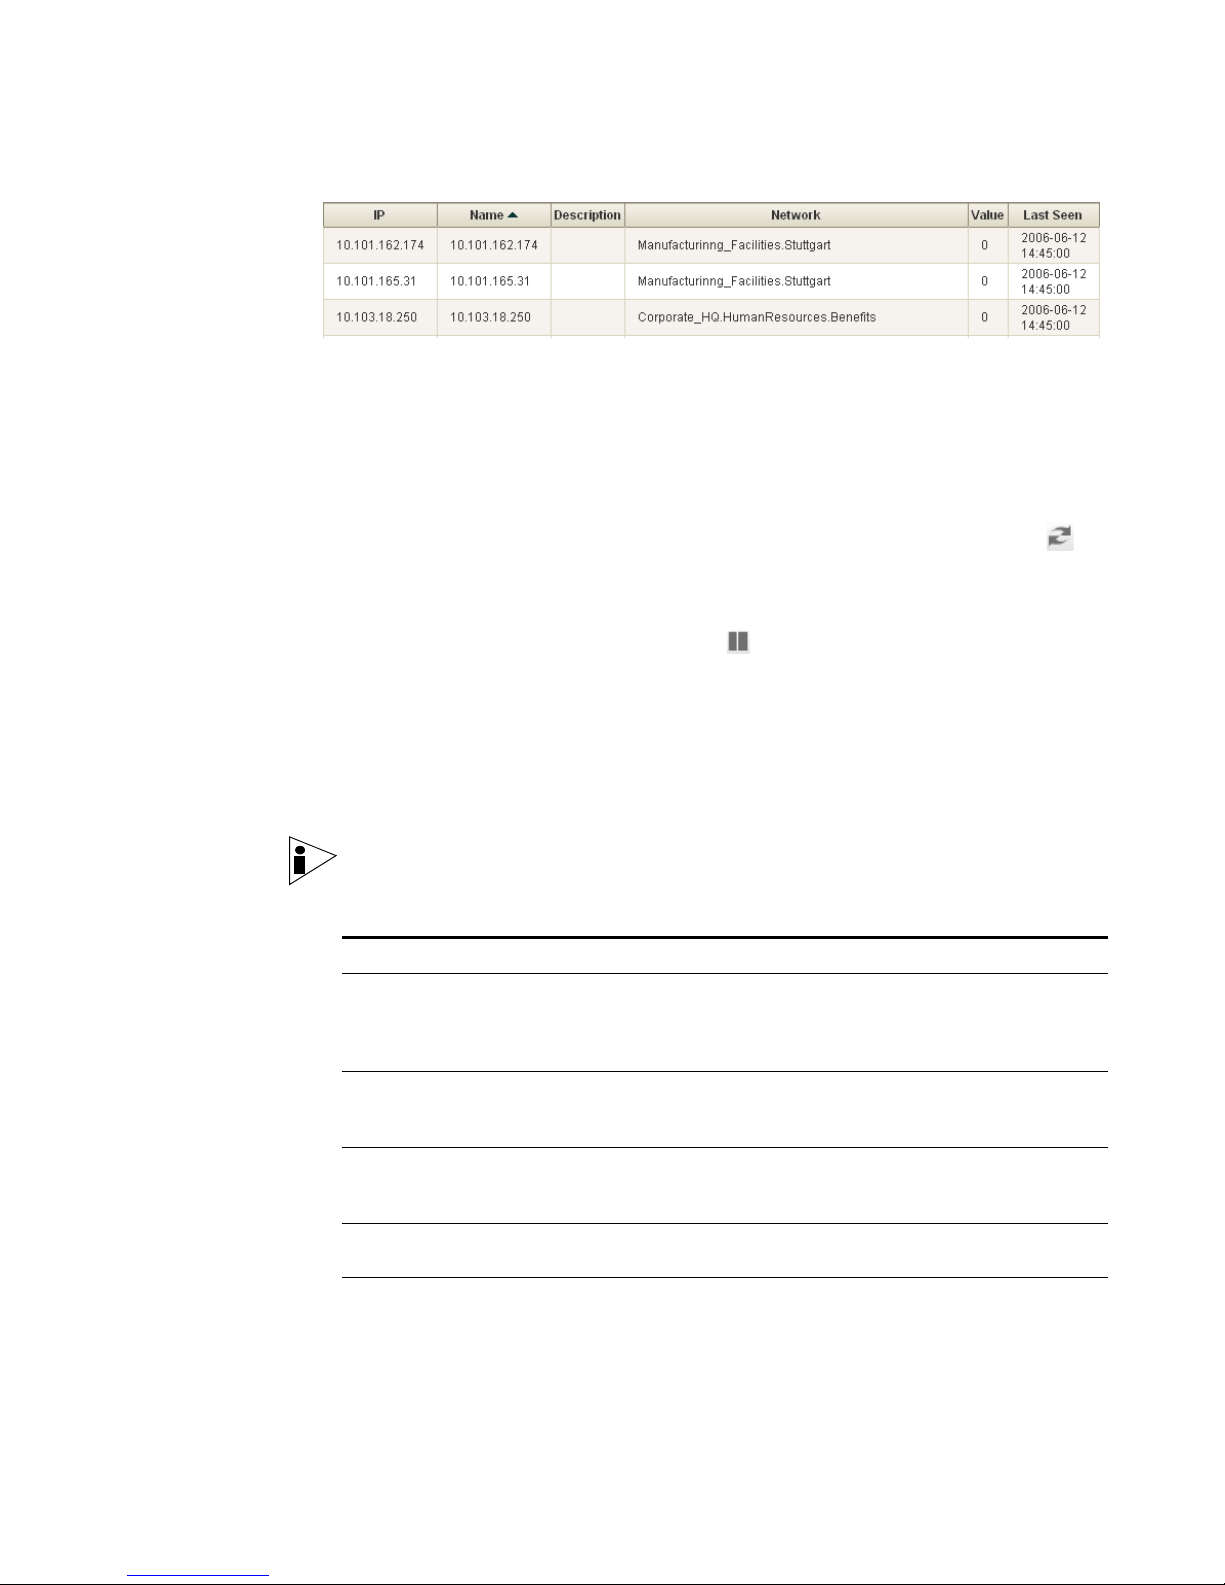
Sorting Results In the Event Viewer, Offense Manager, Flow Viewer, and Reports interfaces, you
can sort the resulting tables by clicking on a column heading. A single click of the
desired column sorts the results in descending order and a second click on the
heading sorts the results in ascending order. An arrow at the top of the column
indicates the direction of the sort.
For example, if you wish to sort the events by Name, click the Name heading. An
arrow appears in the column heading to indicate the results are sorted in
descending order.
STRM Users Guide
Page 16
10 ABOUT STRM
Click the Name column heading again if you wish to sort the information in
ascending order.
Refreshing the
Interface
Several STRM interfaces, including the Event Viewer, Offense Manager, Flow
Viewer, and the Dashboard allow you to refresh the interface. This refresh option is
located in the right corner of the interface. The timer indicates the amount of time
since the interface was refreshed. To refresh the interface, click the refresh
icon.
Pausing the Interface You can use the refresh timer, located on the right, to pause the current display. To
pause the interface, click the pause icon . The timer flashes red to indicate the
current display is paused. Click the icon again to restart the timer.
Investigating IP
Addresses
You can use the right-mouse button (right-click) on any IP address or asset name
to access additional menus, which allow you to further investigate that IP address
or asset. For more information on assets, see the STRM Administration Guide.
The menu options include:
Note: For information on customizing the right-click menu, see the Customizing
the Right-Click Menu Technical Note.
Table 1-1 Additional Options
Menu Sub-Menu Description
Navigate View Network
Location
View Attacker
Summary
View Target
Summary
Information DNS Lookup Searches for DNS entries based on the IP
WHOIS Lookup Searches for the registered owner of a
Opens the Network Surveillance interface
displaying the network activity for the
network that the selected IP address is
associated with.
Displays the attacker summary window that
displays all offenses associated with the
selected attacker.
Displays the target summary window that
displays all offenses associated to the
selected target.
address.
remote IP address (Default system server:
whois.crsnic.net.)
STRM Users Guide
Page 17

Table 1-1 Additional Options (continued)
Menu Sub-Menu Description
Port Scan Performs a NMAP scan of the selected IP
address. This option is only available if
NMAP is installed on your system. For more
information on installing NMAP, see your
vendor documentation.
Asset Profile Displays asset profile information. This menu
option is only available when profile data has
been acquired either actively (through a
scan) or passively (through flow sources).
For information, see the STRM
Administration Guide.
Search Flows Allows you search for flows. For information,
see
Chapter 7 Using the Flow Viewer.
Resolver Actions View Resolver
Actions
Add Resolver
Action
TNC
Recommendations
Displays the Resolver Actions applied to this
IP address.
Executes the Add Resolver process. This
option is available when a Resolver is online
and able to resolve any protocol. However,
since a TCP Reset Resolver is effective for
TCP-based communications only, you
cannot execute a TCP Reset Resolver from
Allows you to restrict or deny network access
to users based on user name or other
credentials.
For more information, see
TNC Recommendations
STRM Administration Console 11
Chapter 10 Using
.
Viewing STRM Time The right corner of the STRM interface displays STRM time, which is the time of
the STRM Console. The STRM Console time synchronizes all STRM appliances
within the STRM deployment, and is used to determine the time events were
received from other devices for proper time sync correlation.
Accessing On-line
Help
STRM
Administration
Console
You can access the STRM on-line Help through the main STRM interface. To
access the on-line Help, click Help > Help Contents. The Help interface appears.
The STRM Administration Console is a client-based application that provides
administrative users access to administrative functionality including:
• System Configuration - Allows you configure system wide STRM settings
including, users, thresholds, system settings, network hierarchy, authentication,
sentries, or automatic updates.
• Access the deployment editor - Allows you to manage the individual
components of your STRM and SIM deployment.
• Configure views - Allows you to manage your views.
STRM Users Guide
Page 18

12 ABOUT STRM
• Managing vulnerability assessment and scanners - Allows you to schedule
scans to keep your vulnerability assessment data up-to-date.
• Configure sensor devices - Allows you to configure sensor devices, which
provide events to your deployment through DSMs.
• Configure flow sources - Allows you to configure flow sources, such as,
NetFlow or Packeteer.
All configuration updates using the Administration Console are saved to a staging
area. Once all changes are complete, you can deploy the configuration changes or
all configuration settings to the remainder of your deployment.
For more information regarding the STRM Administration Console, see the STRM
Administration Guide.
STRM Users Guide
Page 19

2
USING THE DASHBOARD
The Dashboard allows you to create a customized portal to monitor any data
STRM collects, to which you have access. The Dashboard is the default view
when you log in to STRM and allows you to monitor several areas of your network
at the same time. Normal activity, vulnerabilities, and suspicious behaviors can be
investigated directly from the Dashboard. All information displayed on the
Dashboard is current and provides you with a real-time portal into the status of
your network traffic and assets. You can detach an item and monitor the item
directly from your desktop.
This chapter includes:
• About the Dashboard
• Network Surveillance
• Offense Manager
• Event Viewer
About the
Dashboard
• Reports
• Enterprise Security State
• Enterprise Security State
• Enterprise Vulnerability State
• System Summary
• Adding Items
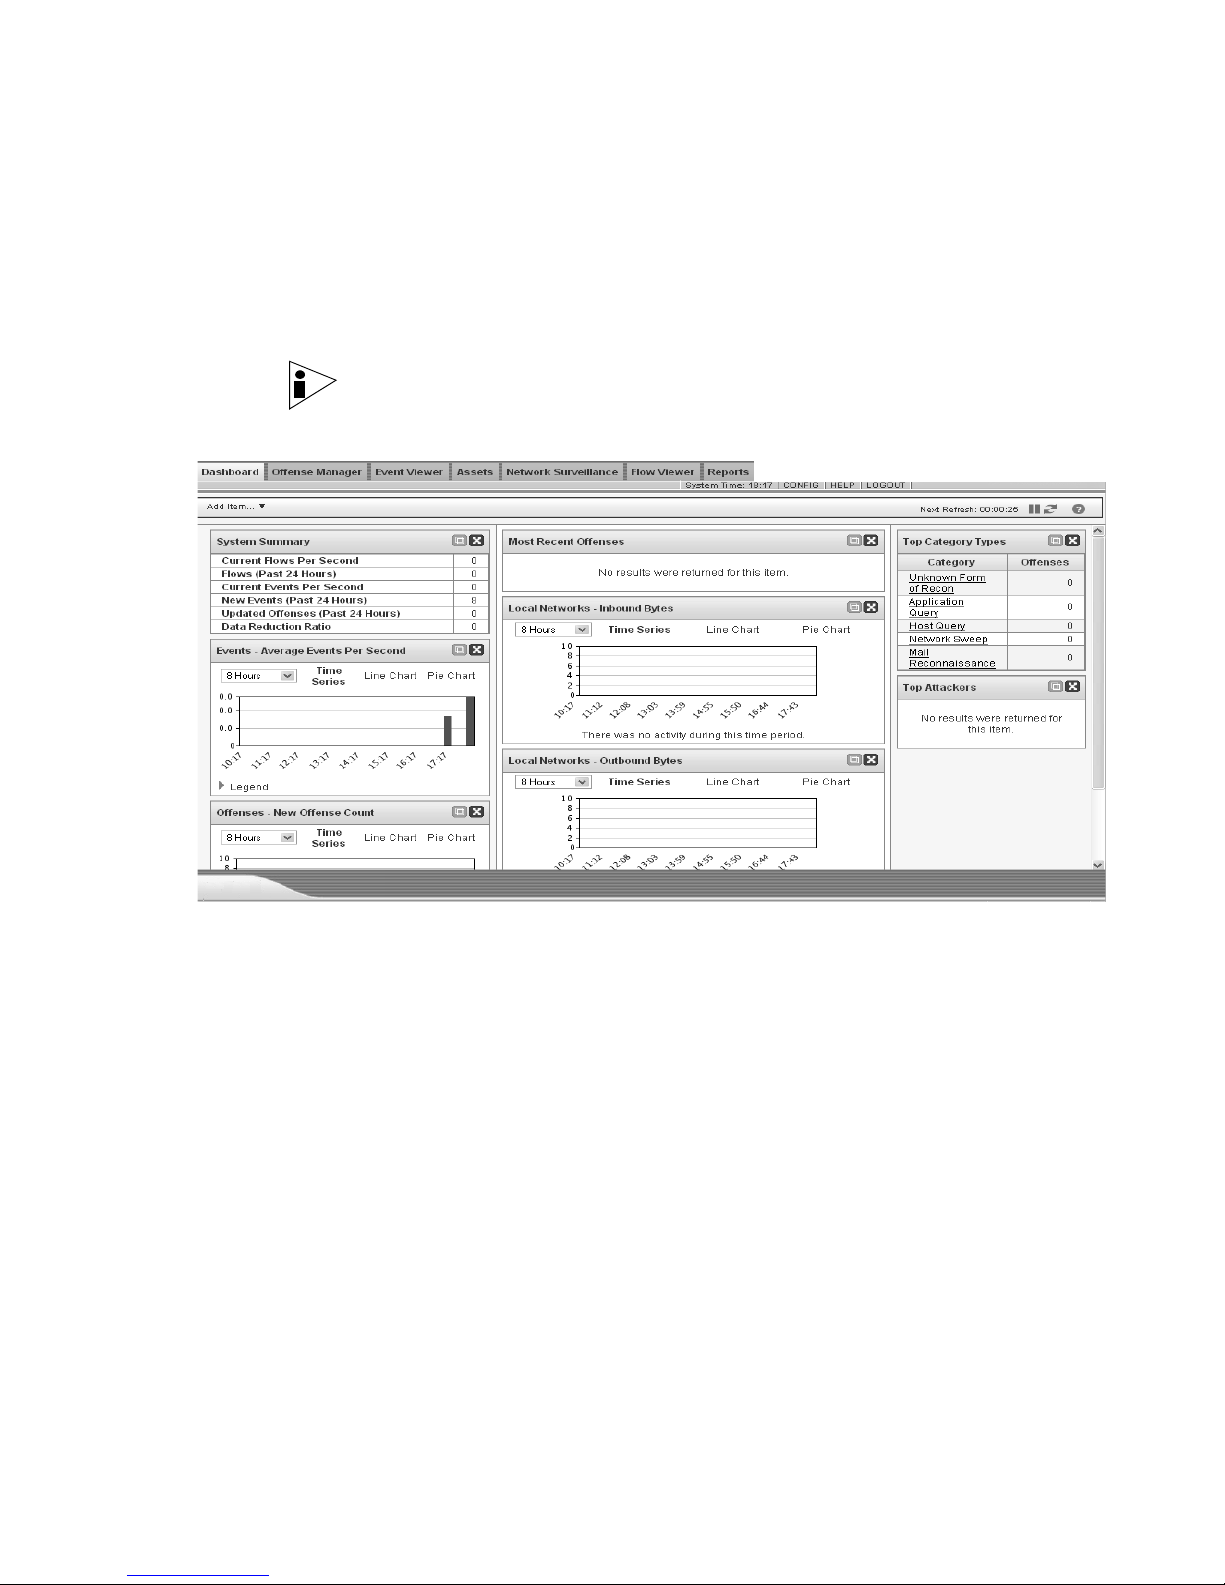
The Dashboard allows you to monitor your overall network behavior, security and
vulnerability posture, top targeted assets, top attackers, and worst and most recent
security offenses - all from one window.
By default, for non-administrative users, the Dashboard is empty. For
administrative users, the Dashboard displays the following:
• System Summary
• Events - Average Events Per Second
• Offenses - New Offense Count
• Most Severe Offenses
STRM Users Guide
Page 20
14 USING THE DASHBOARD
• Most Recent Offenses
• Local Networks - Inbound Bytes
• Local Networks - Outbound Bytes
• Top Category Types
• Top Attackers
Note: The items that appear on your Dashboard depends on the access you have
been granted. For more information on user roles, see the STRM Administration
Guide.
The content that appears on the Dashboard is user-specific. You can design the
Dashboard as you wish, as the changes made within a STRM session affect only
your system. The next time you log in, STRM reflects your last Dashboard
configuration.
You can move and position items to meet your requirements. You can stack items
in one panel or distribute them evenly within the three panels. When positioning
items, each item automatically resizes in proportion to the panel. The Dashboard
interface refreshes regularly to display the most recent information.
STRM Users Guide
Page 21

About the Dashboard 15
Using the Dashboard You can add, remove, or detach items on the Dashboard. Once added, each item
appears with a titlebar. Using the Dashboard, you can:
• Adding Items - Provides the list of items that you can add to your Dashboard.
You can monitor the following items:
- Network Surveillance
- Offense Manager
- Event Viewer
- Enterprise Security State
- Reports
- Enterprise Security State
- Enterprise Vulnerability State
- System Summary
• Removing an Item - To remove an item from the Dashboard, click the red icon
located in the upper right corner of the item.
A confirmation window appears before an item is removed. Removing an item
does not remove the item from STRM. Removing an item clears the item from
the Dashboard. You can add the item again at any time.
• Detaching an Item - To detach an item from the Dashboard, click the green
icon located in the upper right of the item. Detaching an item does not
remove the item from STRM; detaching an item duplicates the data in a new
window.
Detaching an item allows you to temporarily monitor one or more particular
items on your desktop. You can detach the item then remove the item from the
Dashboard - the detached window remains open and refreshes during
scheduled intervals. If you close the STRM application, the detached window
remains open for monitoring and continues to refresh until you manually close
the window or shut down your computer system.
Note: STRM does not save the status of a detached Dashboard item when you
end your STRM session.
STRM Users Guide
Page 22

16 USING THE DASHBOARD
Network
Surveillance
You can add several Network Surveillance items to your Dashboard to display your
current network traffic activity. You can choose to display traffic data and TopN
data. Traffic data is displayed by graphs, complete with legends; TopN data is
displayed in bar charts, and allows you to investigate your traffic from the
Dashboard.
Network Surveillance options include:
• Traffic
• TopN
Within the TopN and Traffic options, you can add the following items to your
Dashboard.
• Threats
• Local Networks
• Client Applications
• Server Applications
• Geographic
• Flow Types
• Custom Views
• Bookmarks - This menu option only appears if you have configured bookmarks
using the Network Surveillance interface. For more information on bookmarks,
see Chapter 3 Managing Your Network Activity.
Note: The available views are dependent on the Global or Custom Views your
Network Administrator has enabled/disabled. If enabled, you can add any custom
view to your Dashboard.
Traffic Traffic is a graphical representation of bytes, packets, or hosts from a selected
view. Traffic data appears with a legend and identifies the traffic you are viewing.
STRM Users Guide
Page 23

Network Surveillance 17
Note: You can click any area of the graph, or click the dynamic legend to
immediately access the Network Surveillance interface.
To customize your Threats display:
• Period of Time - Using the drop-down list box, select the period of time you
wish the Dashboard graph to display.
• Chart Type - You can display the data using a Time Series (default), Line
Chart, or Pie Chart. To change the chart type, click Time Series, Line Chart or
Pie Chart at the top of the graph.
TopN TopN data displays the most active objects from the top of your network providing
you with information from the most active network objects. Active objects can
include threats, applications, protocols, etc. The active object appears as a bar
chart and displays the highest level of activity by the number of assets, bytes,
packets, active ports, and number of flows. This is determined by the current view
displayed on the STRM graphs.
Note: You can double-click the bars to immediately navigate to the Network
Surveillance interface and display the traffic on the STRM graphs.
STRM Users Guide
Page 24
18 USING THE DASHBOARD
Offense Manager You can add several Offense Manager items to your Dashboard. The Offense
Manager displays data for offenses, attackers, and local targets detected on your
network. Offense Manager options include:
• Offenses
• Attackers and Targets
• Categories
Note: Hidden or closed offenses are not included in the values that appear in the
Dashboard.
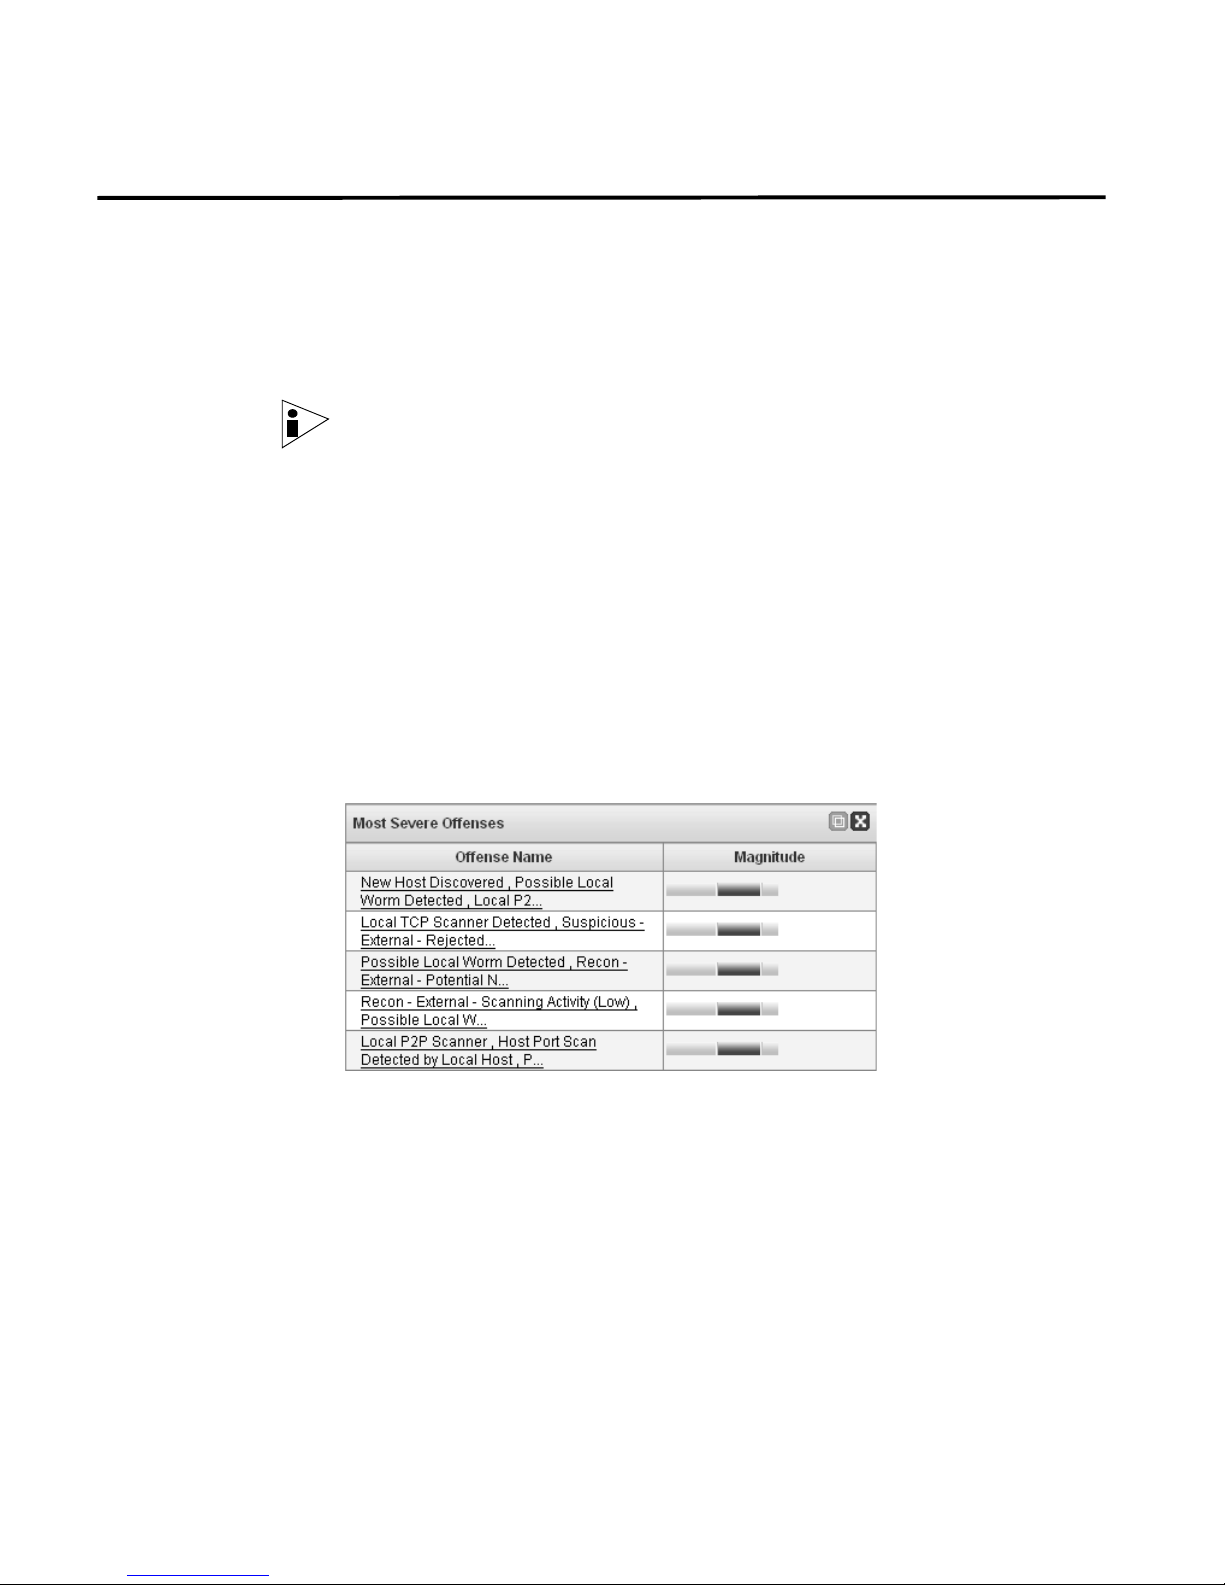
Offenses The Offenses option displays the five most recent offenses, severe offenses, or
the new offenses over time including:
• Most Severe and Most Recent Offenses
• My Offenses
• New Offense Over Time
Most Severe and Most Recent Offenses
The most recent and severe offenses are identified and classed with a magnitude
bar to inform you of the importance of the offense. Point your mouse to the IP
address to view detailed information for the IP address.
My Offenses
The My Offenses item displays all offenses assigned to you. The offenses are
identified and classed with a magnitude bar to inform you of the importance of the
offense. Point your mouse to the IP address to view detailed information for the IP
address.
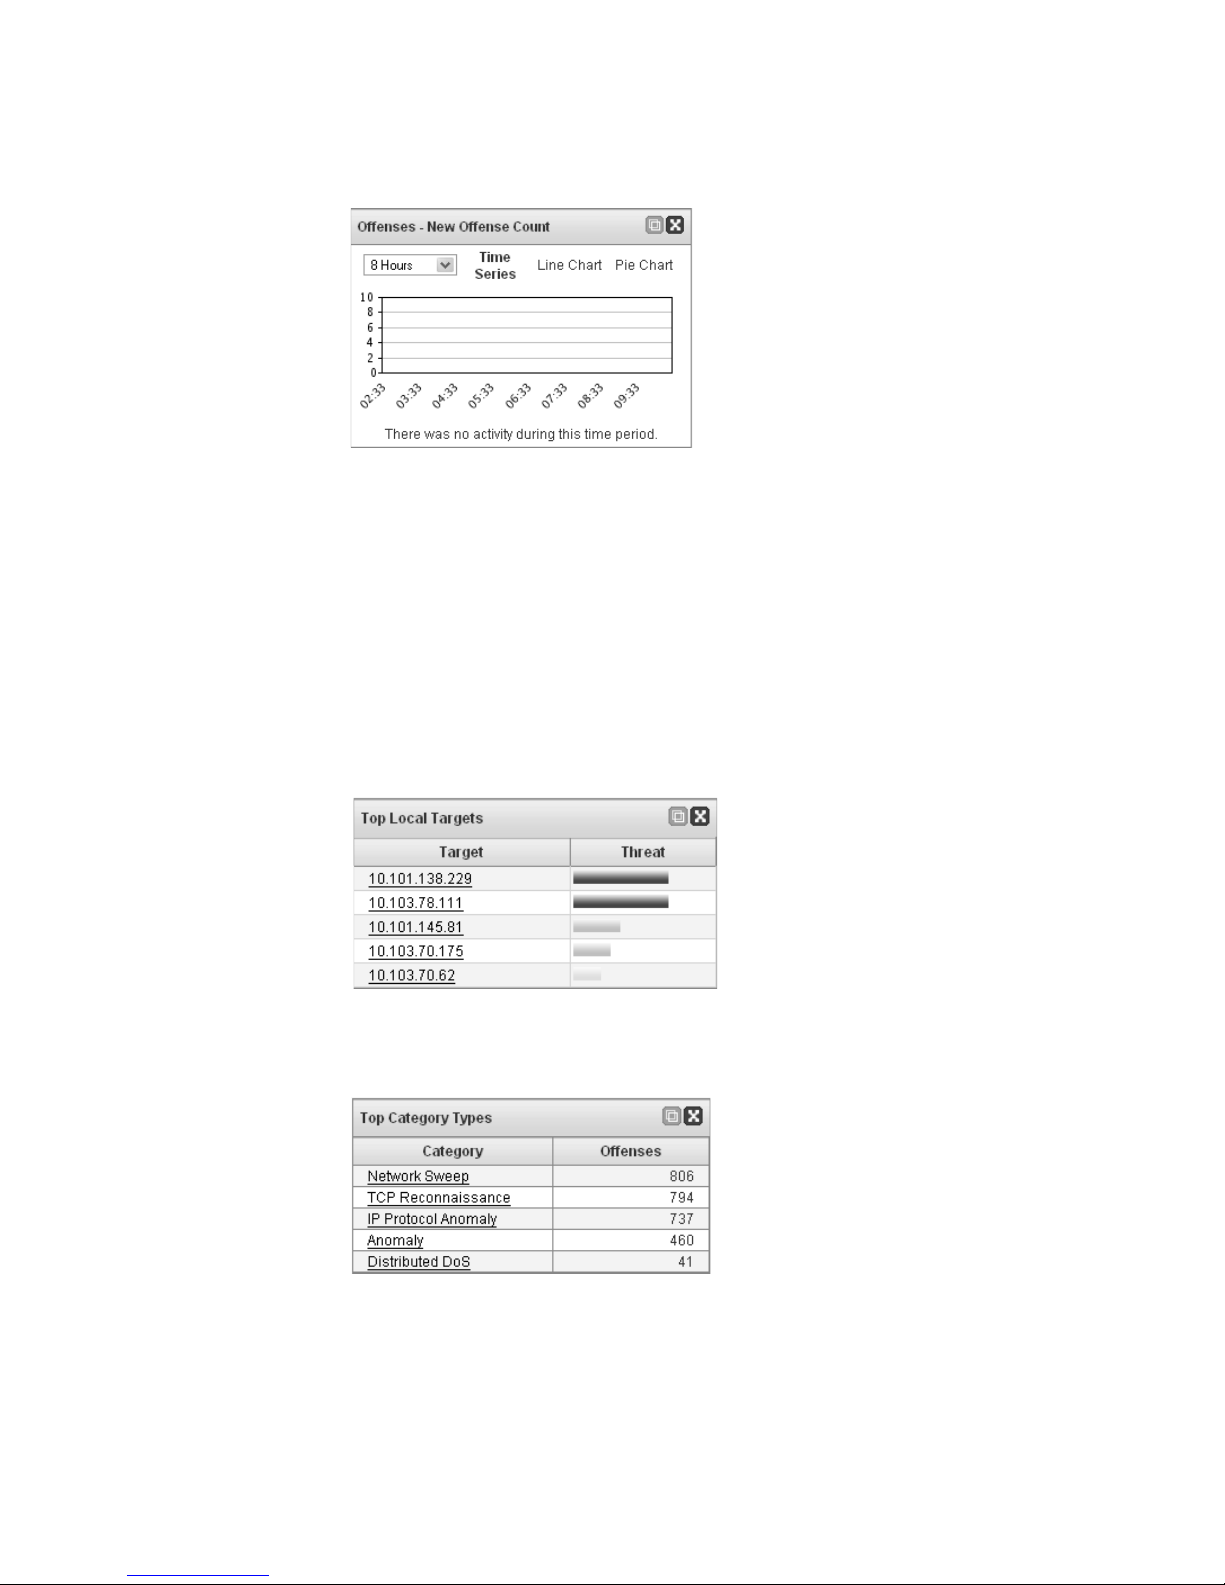
New Offense Over Time
The new offenses over time appears as a graph displaying the total number of new
offenses over the past 8 hours in 15 minute intervals. The chart differentiates
between policy and security events similar to the Offense Manager.
STRM Users Guide
Page 25
Offense Manager 19
To customize your display:
• Period of Time - Using the drop-down list box, select the period of time you
wish the Dashboard graph to display.
• Chart Type - You can display the data using a Time Series (default), Line
Chart, or Pie Chart. To change the chart type, click Time Series, Line Chart or
Pie Chart at the top of the graph.
Attackers and
Targets
The Attackers and Targets option displays the top five attackers or top five local
targets. Each target is identified with a magnitude bar to inform you of the
importance of the target. Point your mouse to the IP address to view detailed
information for the IP address.
Categories The Categories option displays the top five categories associated with the highest
number of offenses.
STRM Users Guide
Page 26
20 USING THE DASHBOARD
Event Viewer The Event Viewer items allow you to monitor and investigate events in real-time.
Event Viewer options include:
• Events Over Time
• Events By Severity
• Top Devices
Note: Hidden or closed events are not included in the values that appear in the
Dashboard.
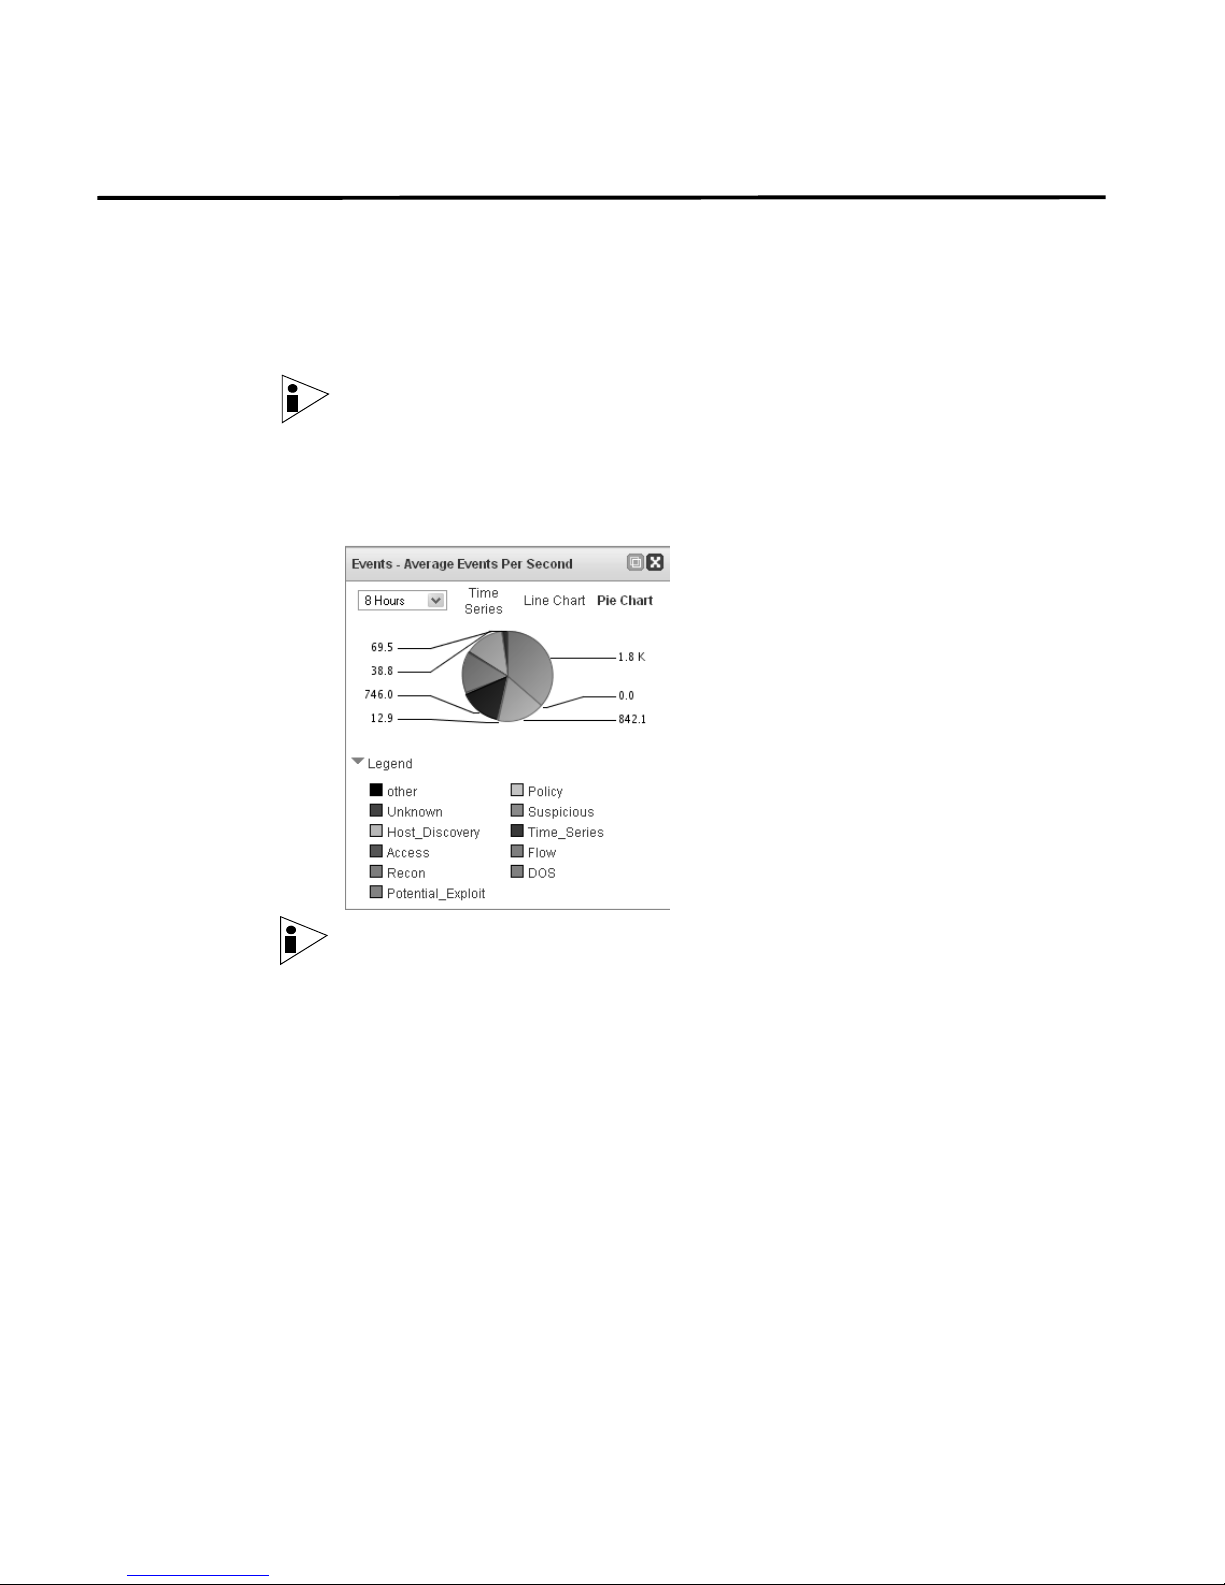
Events Over Time The Events Over Time option displays events received over the last 8 hours in 15
minute intervals, categorized by the event category.
Note: You must have the required permissions to access Event Viewer items.
To customize your display:
• Period of Time - Using the drop-down list box, select the period of time you
wish the Dashboard graph to display.
• Chart Type - You can display the data using a Time Series (default), Line
Chart, or Pie Chart. To change the chart type, click Time Series, Line Chart, or
Pie Chart at the top of the graph.
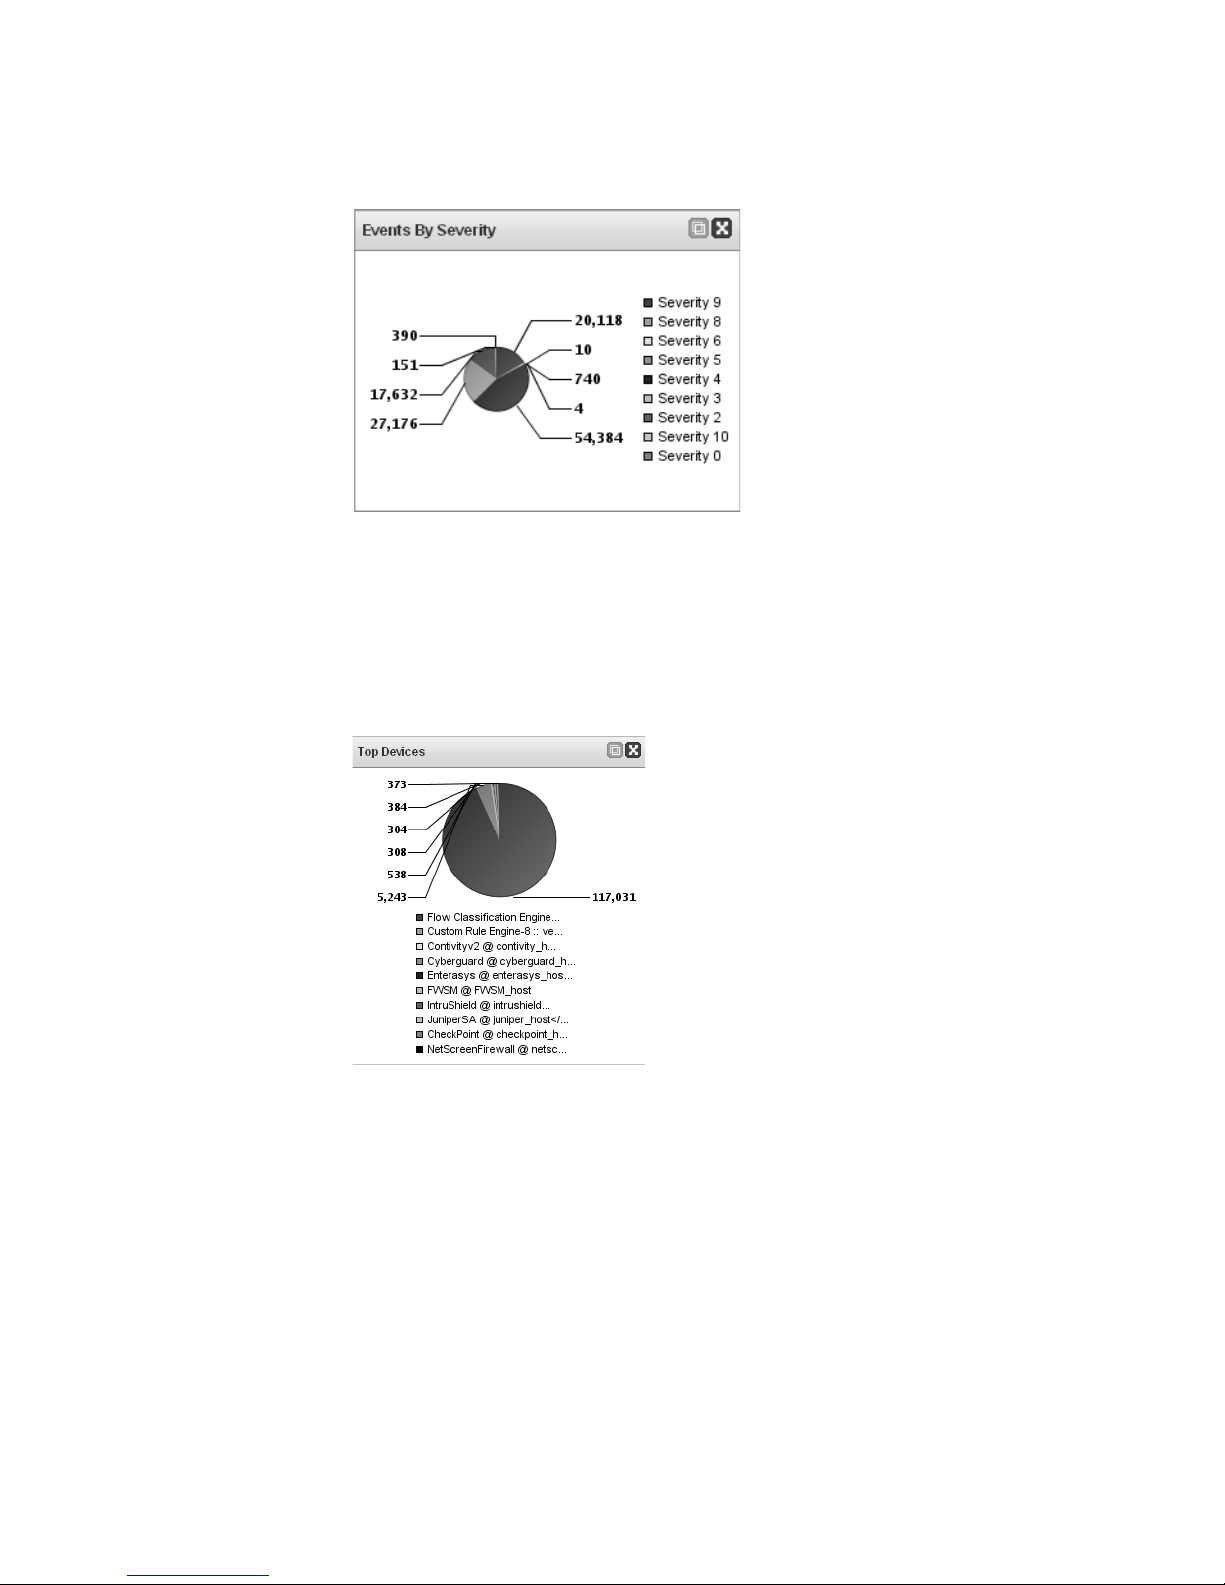
Events By Severity The Events By Severity item displays a pie chart that specifies the number of
active events grouped by severity. This item allows you to see the number of
events that are being received by the level of severity that has been assigned.
Severity indicates the amount of threat an attacker poses in relation to how
prepared the target is for the attack. The range of severity is 0 (low) to 10 (high).
STRM Users Guide
Page 27
Event Viewer 21
Top Devices The Top Devices item displays a pie chart that specifies the top 10 devices that
sent events to STRM within the last 15 minutes. The number of events sent from
the specified device is indicated in the pie chart. This item allows you to view
potential changes in behavior, for example, if a firewall device that is typically not in
the top 10 list is now contributing to a large percentage of the overall message
count, you should investigate this occurrence.
STRM Users Guide
Page 28
22 USING THE DASHBOARD
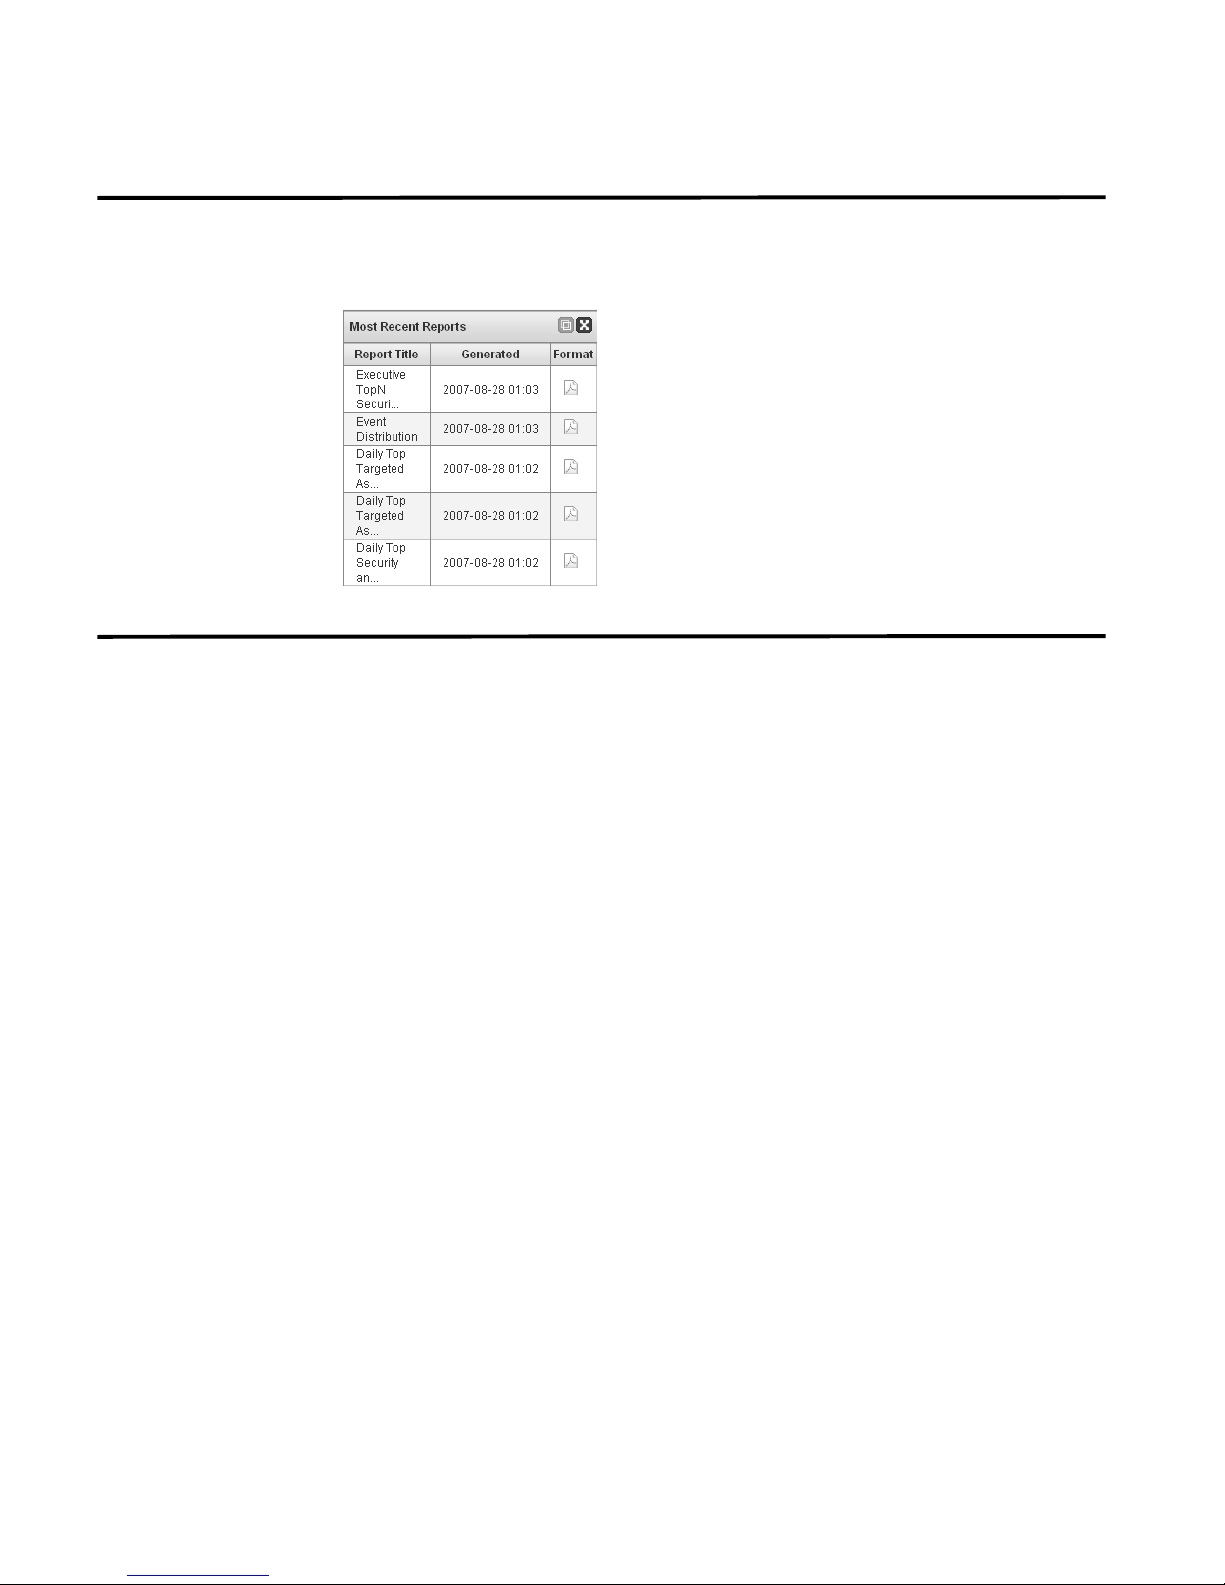
Reports The Reports option allows you to display the top recently generated reports. The
display provides the report title, the time and date the report was generated, and
the format of the report.
Enterprise Security
State
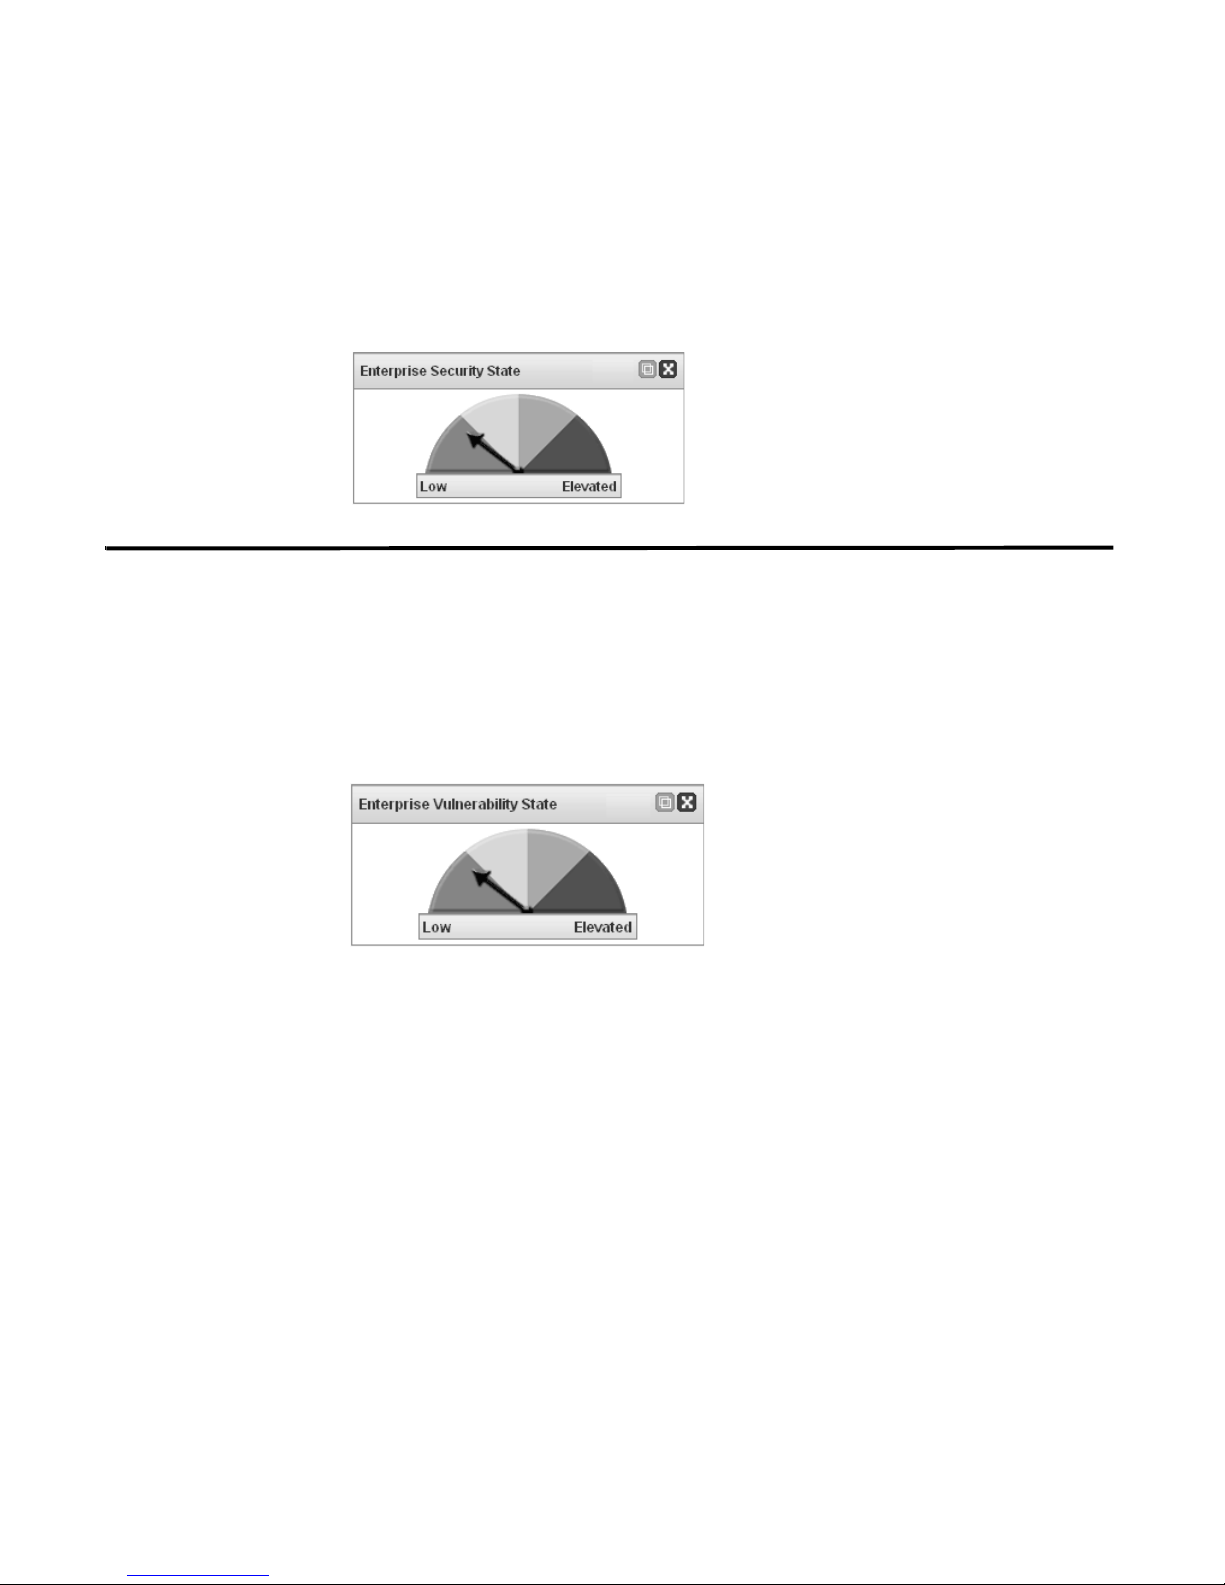
The Enterprise Security State represents your network’s current security posture.
The security state is formulated from monitoring the security data from flows,
external events, and security data to create a single metric that reveals the security
health of your network. The Enterprise Security State is a graphical representation
of the following calculated weighted averages:
• Attacker Threat Posing - The value applied to the threat that an attacker
poses over time.
The magnitudes of all offenses that involved the attacker
during the interval are added together. This value is then added to the value of
the previous interval and stored as the new threat posed by the attacker. STRM
then scales this value based on the maximum threat posing in the database to a
weight value (0 to 10). This value is reported by the Magistrate component and
is calculated each interval.
• Target Threat Under - The value applied to the threat a target is under over
time. For each offense in which the target is involved during the interval, an
average of the offense category is accumulated and added together to obtain a
value. This value is then added to the previous interval value and stored as the
new threat under for the target. STRM then scales this value based on the
maximum threat under in the database to a weight value (0 to 10). This value is
reported by the Magistrate component and is calculated each interval.
• Network Threat Posing - The value applied to the threat a network poses
during a 15 minute interval. This is calculated by summing the threat posing for
all attackers seen on that network during an interval and then calculating an
averaged weighted value (0 to 10). This value is calculated each interval.
• Network Threat Under - The value applied to the threat a network is under
during a 15 minute interval. This is calculated by summing the threat under for
all attackers seen on that network during an interval and then calculating an
averaged weighted value (0 to 10). This value is calculated each interval.
STRM Users Guide
Page 29
Enterprise Vulnerability State 23
• Vulnerability Risk - The vulnerability risk level (0 to 10) applied to an asset.
This is a weighted value applied by calculating the average of the risks of each
asset in your network.
• Network Weight - The numerical value applied to the importance of each
network. The network weight is user defined.
Enterprise
Vulnerability State
The Enterprise Vulnerability State represents the network’s current vulnerability
posture. The vulnerability state is formulated from monitoring all vulnerability data
across the entire network to create a single metric that reveals the vulnerability
state of your network. For each leaf in your asset map, the vulnerability value is
calculated by averaging the risk level of all hosts in that leaf. Once that value is
obtained, a scaled average (0 to 10) is calculated for that leaf node. This value is
averaged with all other leaf node values in your asset map and one vulnerability
state average is displayed in the Dashboard.
STRM Users Guide
Page 30
24 USING THE DASHBOARD
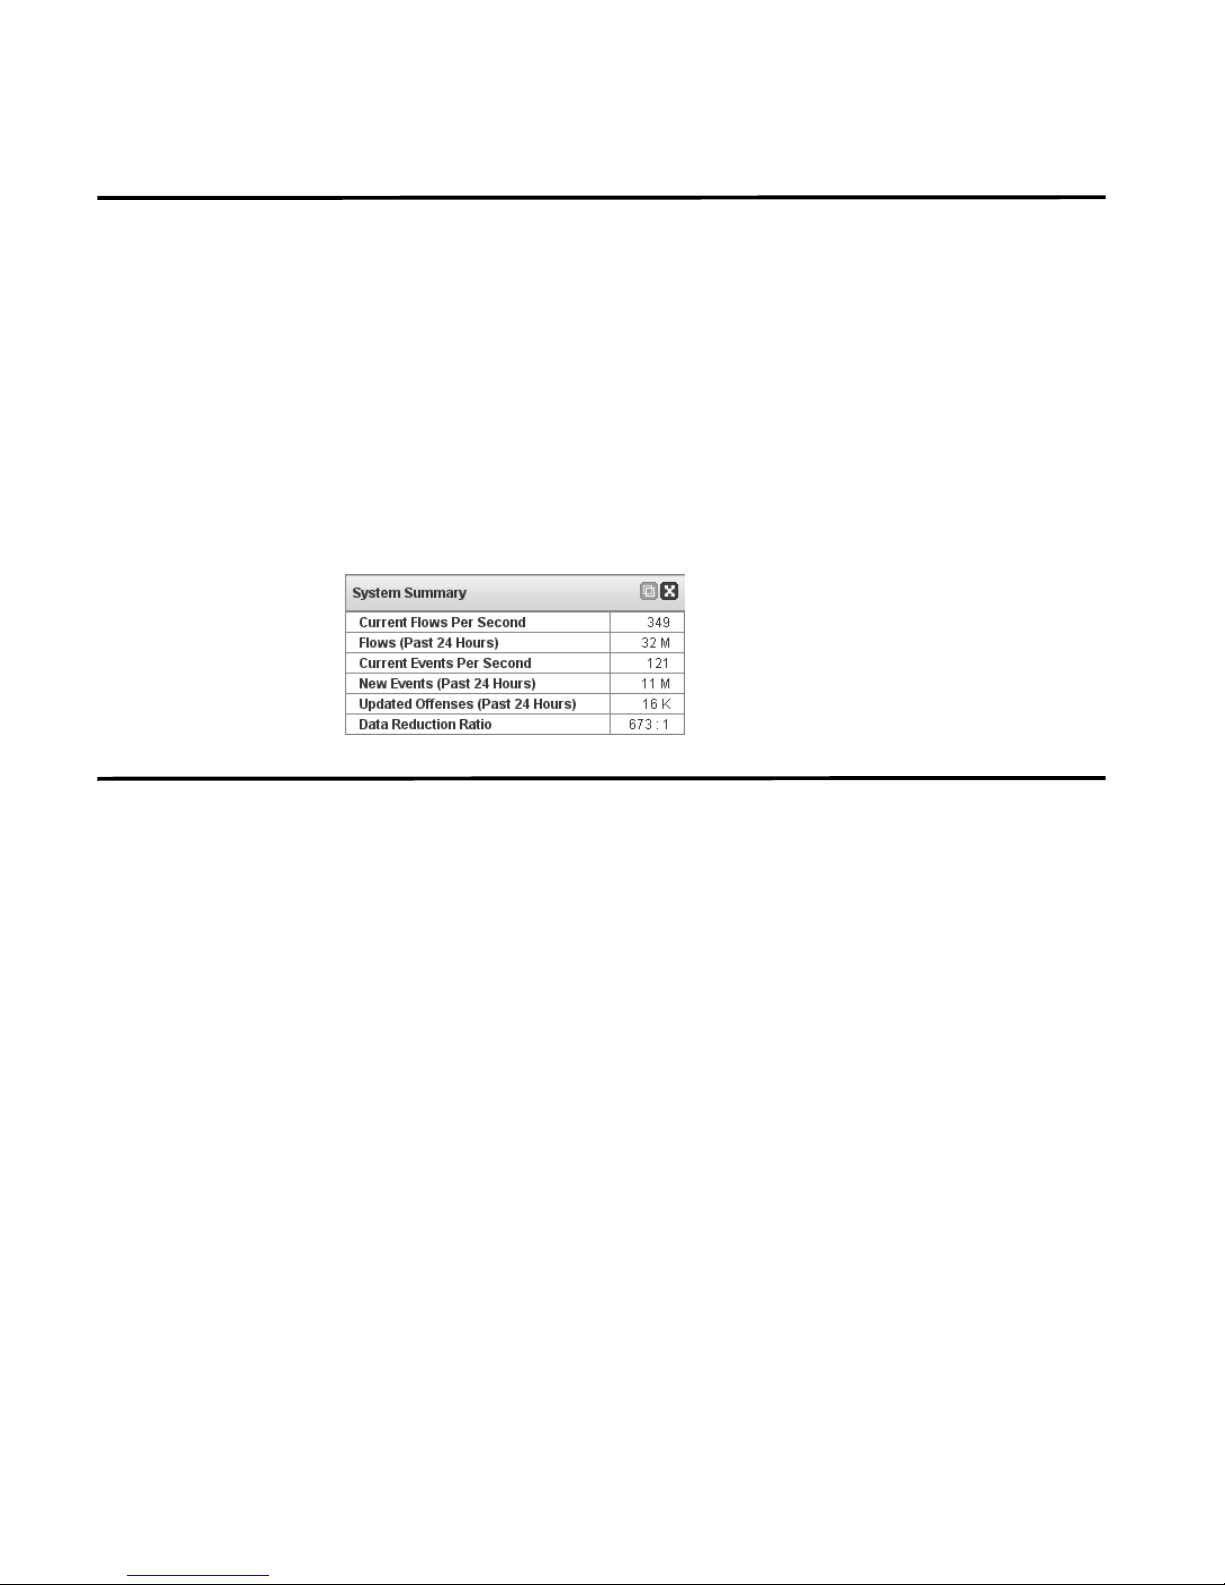
System Summary The Summary item provides a high-level summary of activity within the past 24
hours. Within the summary item, you can view the following information:
• Flows (Past 24 Hours) - Specifies the total number of active flows seen within
the last 24 hours.
• Events (Past 24 Hours) - Specifies the total number of new events received
within the last 24 hours.
• Modified Offenses (Past 24 Hours) - Specifies the total number of offenses
that have been either created or modified with new evidence within the last 24
hours.
• Data Reduction Ratio - Specifies the ratio of data reduced based on the total
events detected within the last 24 hours and the number of modified offenses
within the last 24 hours.
Adding Items You can add multiple displays to the Dashboard interface. To add an item to the
Dashboard:
Step 1 Click the Dashboard tab.
The Dashboard interface appears.
Step 2 From the toolbar, click Add Item.
A list of menu items appears.
Step 3 Navigate through the categories, options include:
• Network Surveillance
• Offense Manager
• Event Viewer
• Reports
• Enterprise Security State
• Enterprise Security State
• Enterprise Vulnerability State
• System Summary
STRM Users Guide
Page 31

3
MANAGING YOUR NETWORK
A
CTIVITY
The Network Surveillance interface allows you to monitor behavioral profiles of
systems and applications when security breaches or other behavior is suspected.
You can investigate and scrutinize your network traffic from all available STRM
views.
This chapter provides information on using the Network Surveillance interface
including:
• Using the Network Surveillance Menu
• Viewing Network Activity
• Investigating Traffic Using TopN
• Investigating Flows
Using the Network
Surveillance Menu
Global Views By default, Global Views display aggregated network traffic at the top of your
Using the Network Surveillance menu, you can access, navigate, and investigate
network traffic from various views and perspectives. The menu options include:
• Global Views
• Asset Map
• Bookmarks
• QRL Options
network hierarchy. You can use the options available in the Pivot To box to view
the traffic from a different perspective and navigate between the views from the
QRL Definition box.
The default Global Views menu provides the following options:
• Local Networks - The default view displays n-levels of depth, depending on
your network tree structure. This information is derived from your asset map.
• Threats - Displays traffic identified as potential threats.
• Applications - Displays client and server application traffic.
• Geographic - Displays traffic by geographic regions.
• Protocol - Displays traffic by the type of protocol group.
STRM Users Guide
Page 32
26 MANAGING YOUR NETWORK ACTIVITY
• Flow Types - Displays traffic by specific flow types.
• Custom Views - Displays traffic for any Custom Views. By default, the Custom
Views includes the following ASN and IfIndex views. These views are
populated when STRM detects Autonomous System Number (ASN) and
IfIndex values from network flows. When STRM detects ASN or IFIndex values
in a flow, STRM creates a new object in the respective group. For example, if
STRM detects a ASN 238 within the source traffic, the object ASN238 is
created in the ASNSource group.
- ASNSource - Displays traffic for source ASN traffic.
- IFIndexOut - Displays traffic for outbound IfIndex traffic.
- IFIndexIn - Displays traffic for inbound IfIndex traffic.
- ASNDestination - Displays traffic for destination ASN traffic.
- QoS - Displays traffic for Quality of Service (QoS) traffic.
Global Views displays your traffic from many perspectives. Each Global View has
a pre-defined set of properties that identifies traffic flows as it appears on your
network. Each view selected displays only the traffic that corresponds with the
property-set.
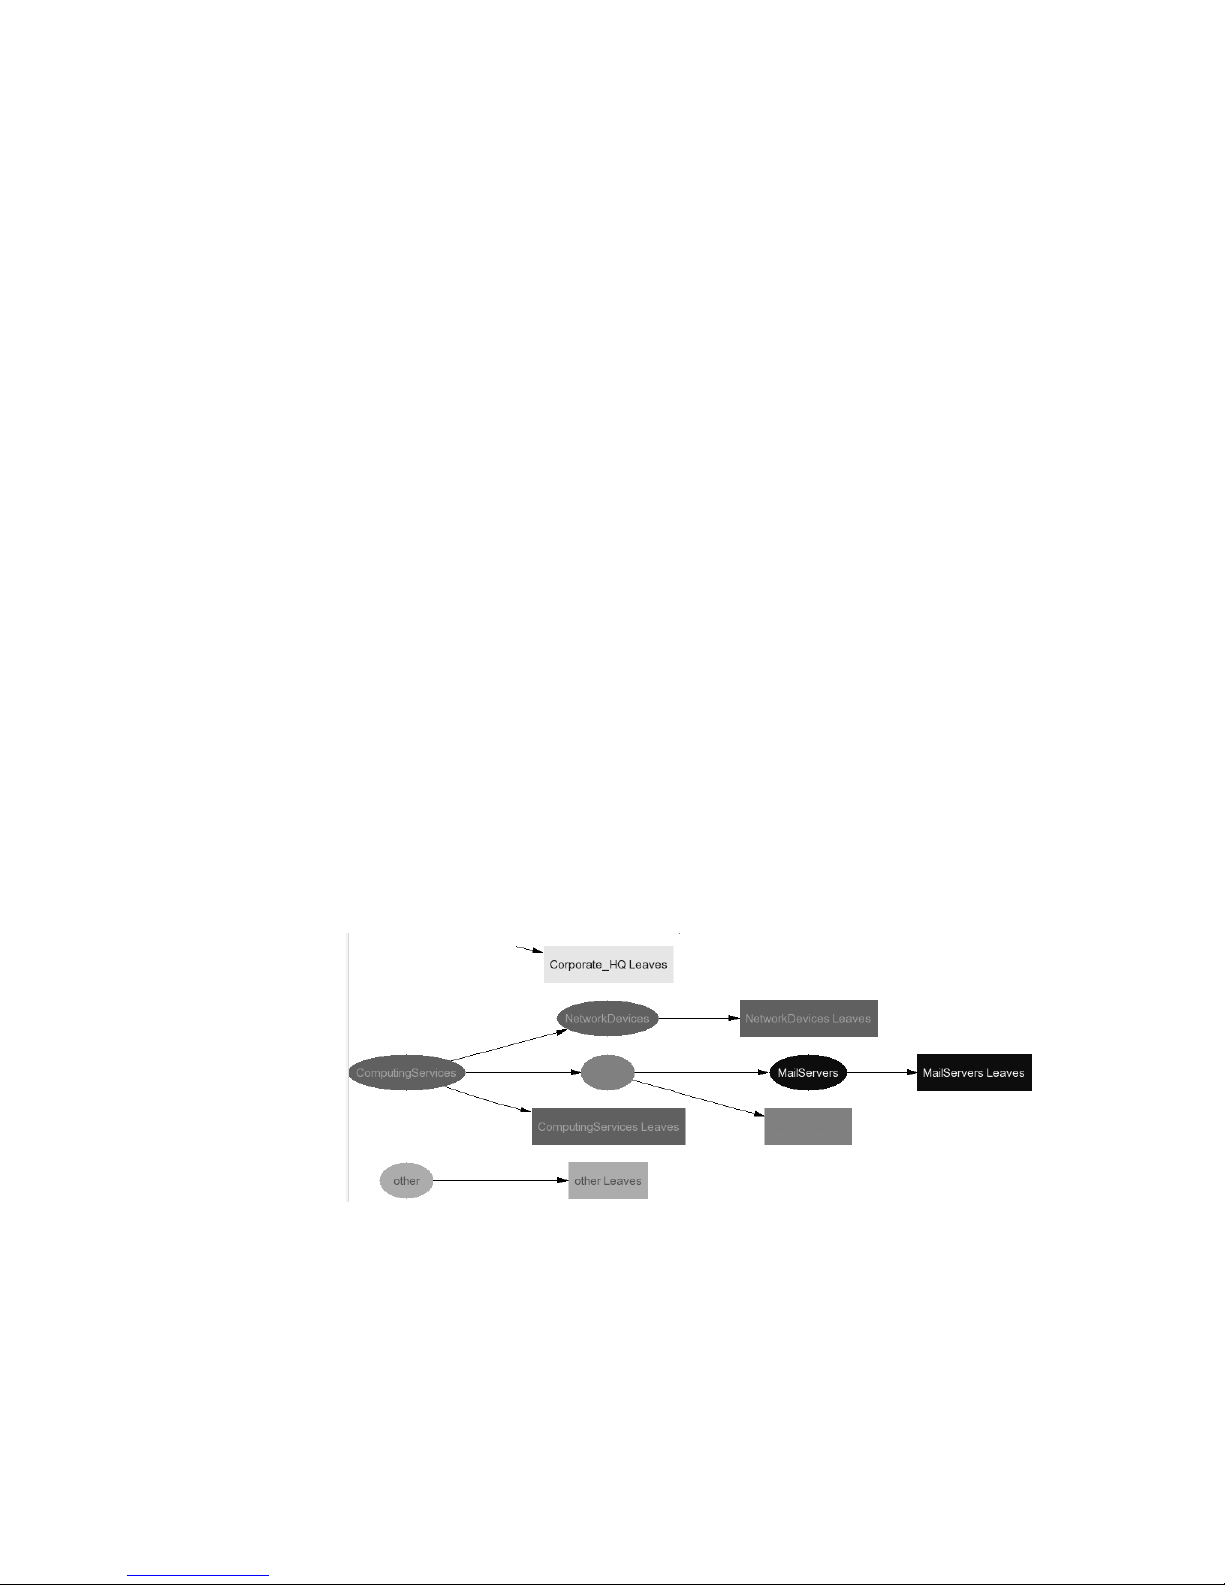
Asset Map The Asset Map is a graphical representation of your logical network hierarchy.
Each component represents a specific area of your network. The map displays
each network root; each root displays groups within the root; and, each group
displays the leaves within the group.
The Asset Map is an alternate method of displaying specific network traffic. Click
on any map component to display the associated traffic on your graphs.
STRM Users Guide
Page 33
Using the Network Surveillance Menu 27
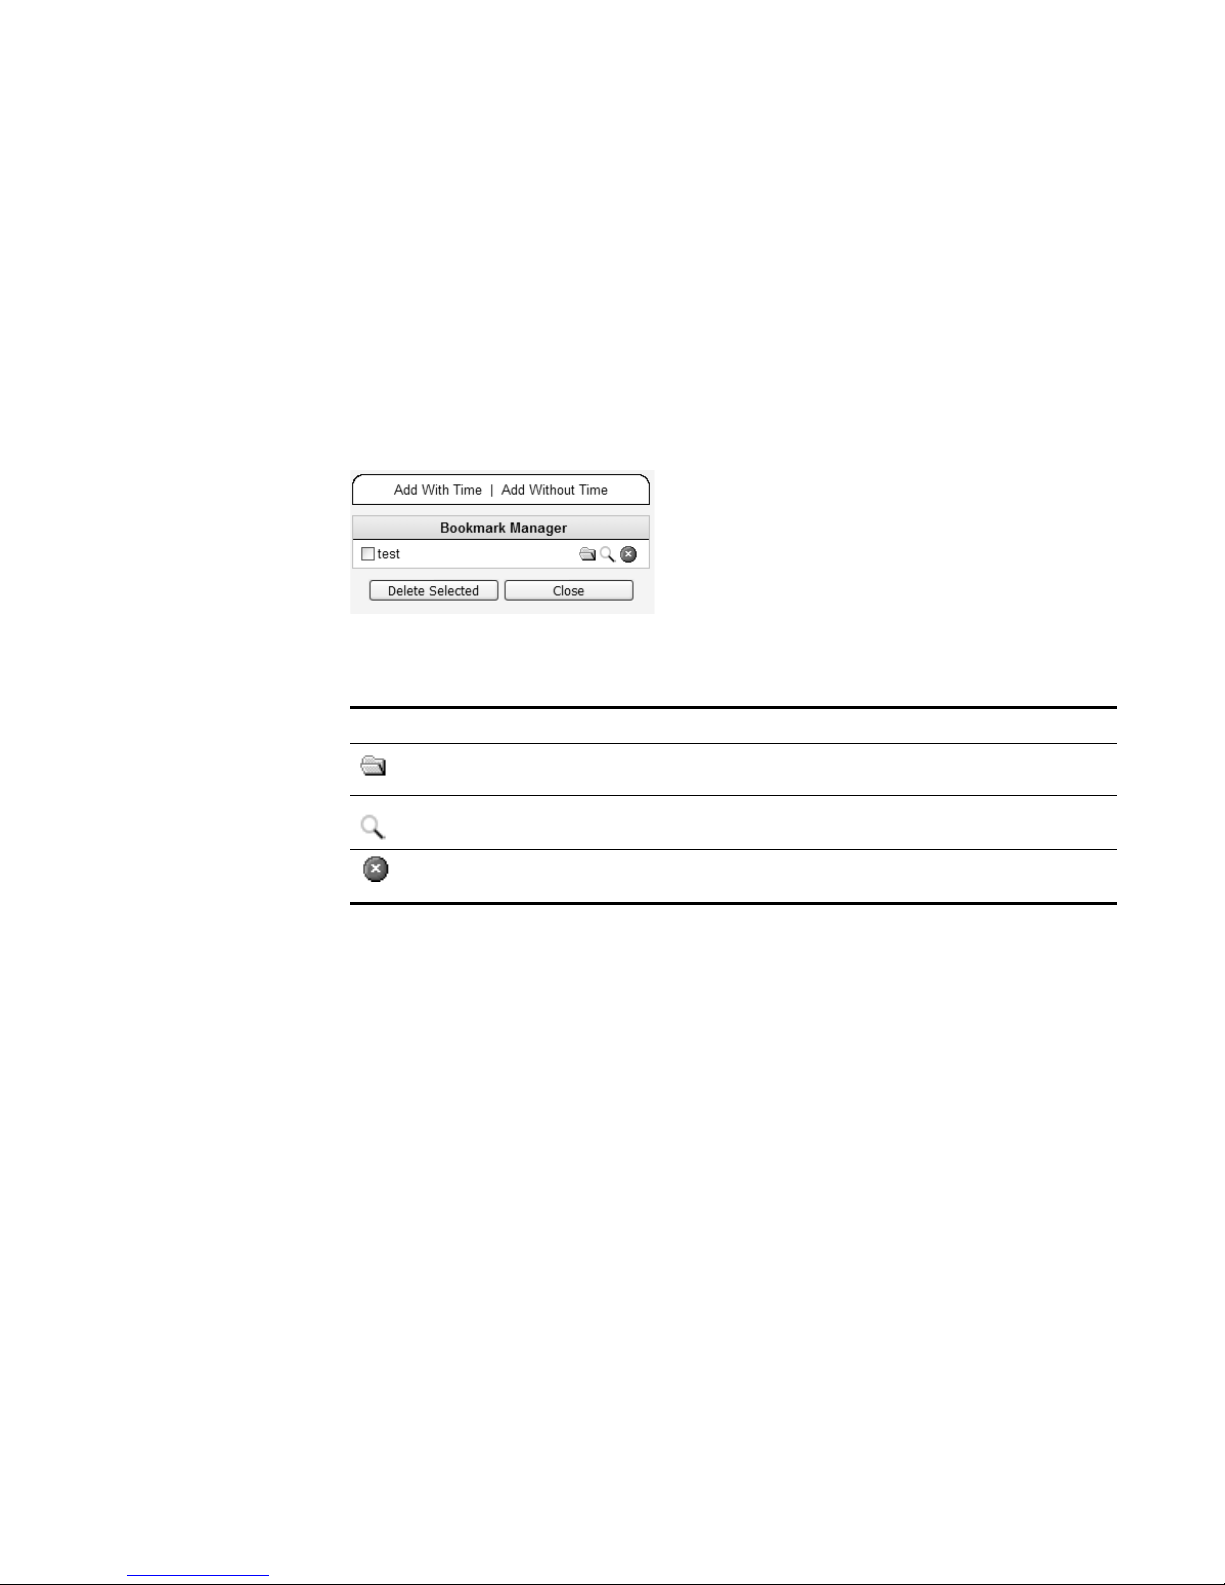
Bookmarks You can create a bookmark from any area on the STRM graphs. This allows you to
access your bookmarks at any time to revisit a specific network location or specific
time frame.
When creating a bookmark, the following options are available:
• Add With Time - Saves the QRL with the time period that is displayed on the
graphs.
• Add Without Time - Saves the QRL without preserving the time period.
• Manage Bookmarks - Executes the Bookmark Manager.
You can navigate through bookmarks from the following icons:
Table 3-1 Icons
Icon Description
View the bookmarked information on the STRM graphs.
Click the search icon to view the bookmarked view. For more information
on bookmarks, see
Click the delete icon to delete the bookmark. To delete multiple bookmarks,
select all the bookmarks you wish to delete and click Delete Selected.
Chapter 3, Managing Your Network Activity.
QRL Options QRL (STRM Request Language) provides the tools required to distribute QRL
information. The QRL also provides options on how STRM displays your network
traffic including:
• Email QRL - Allows you to e-mail other STRM users with your current view’s
QRL.
• Expand Legend - STRM hides inactive components with no current traffic
activity. This option displays all legend objects and items.
• No Scales - Allows you to change the graph appearance and remove the
scales from the graphs. When accessed, the menu option changes to scales
and allows you to reapply the scales to the graphs.
• Graph By Lines - Allows you to change the traffic appearance to lines or
stacks. When accessed, the menu option changes to Graph By Stacks and
displays the traffic in stacked format. Graphing by stacked bars displays the
exact values from the database. Graphing by lines creates a consecutive line
from the top of one value on the X axis to the tops of the subsequent values that
appear on the graphs.
STRM Users Guide
Page 34

28 MANAGING YOUR NETWORK ACTIVITY
• Toggle Auto Refresh - Allows you to enable or disable the automatic graph
refresh. When disabled, the count down timer is not displayed on the graphs.
By default, the automatic refresh is enabled.
Viewing Network
Activity
Interpreting the
Graphs
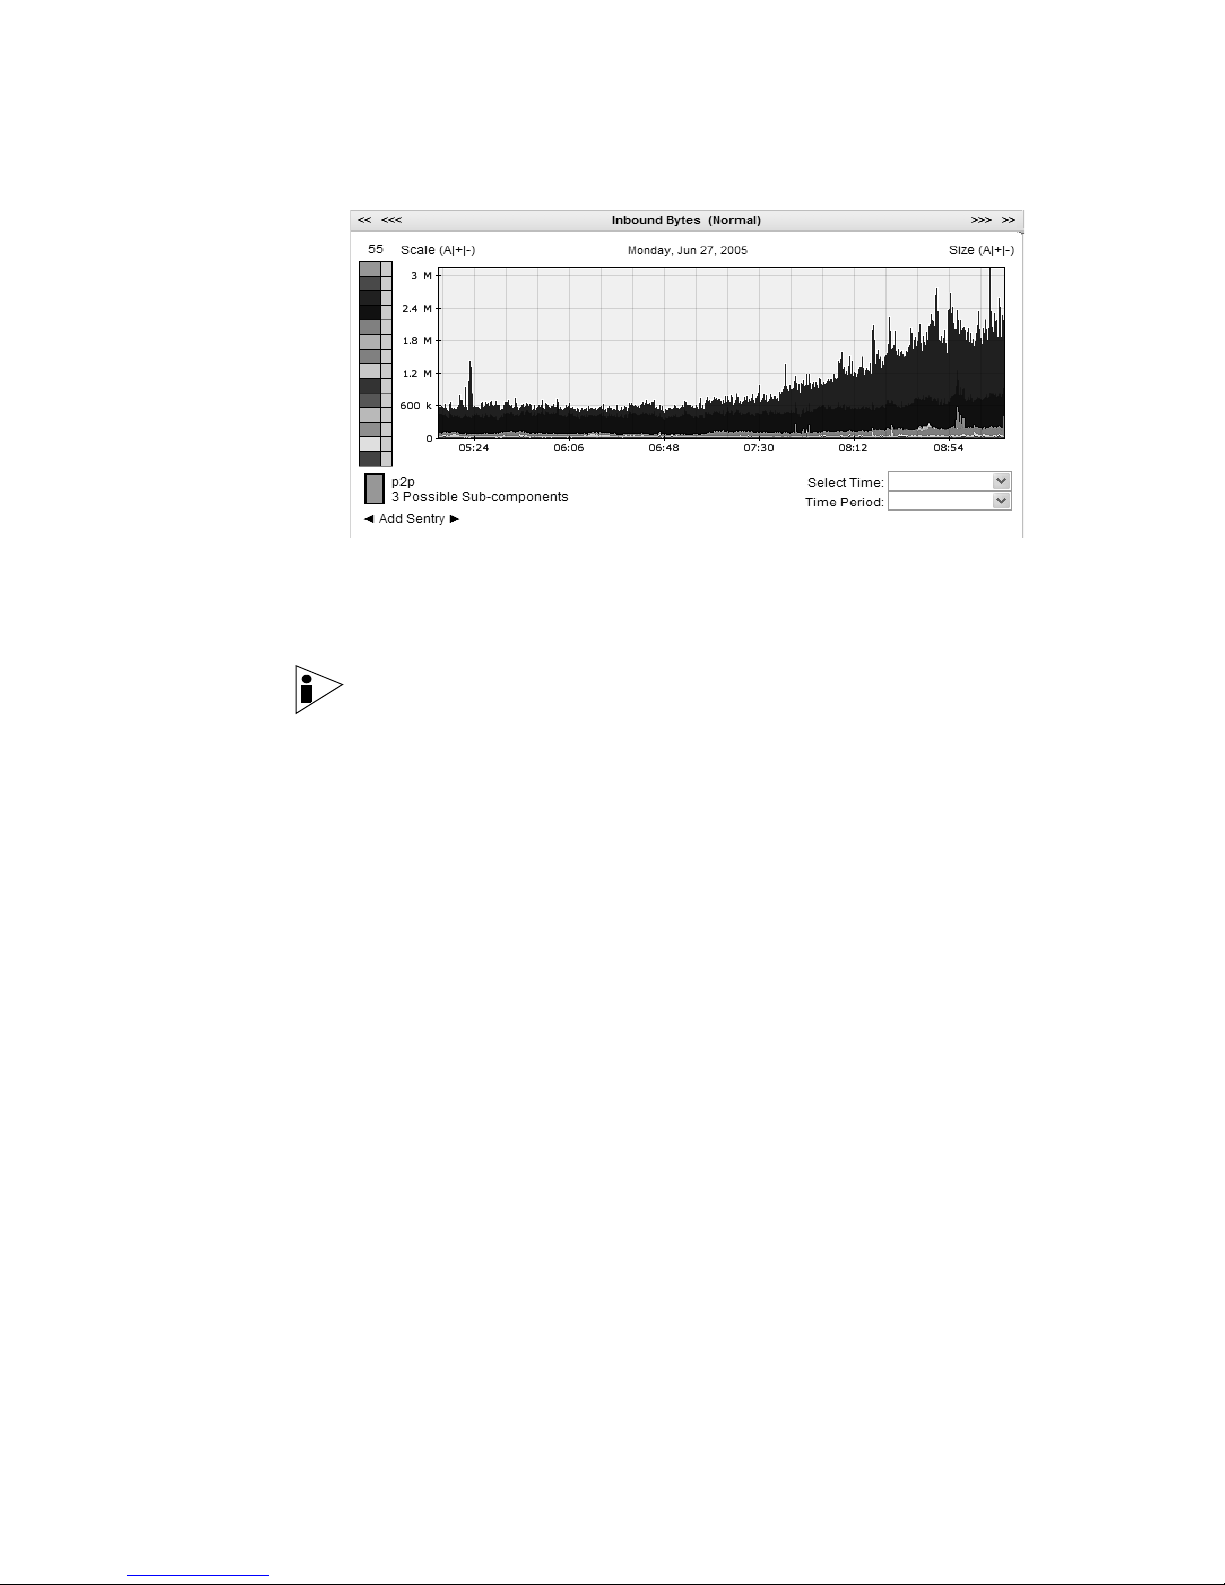
The graphs are the main components on the Network Surveillance interface. The
graphs are a graphical representation of your network objects; peak and valleys
that appear depict high and low volume traffic.
This section provides information on viewing network activity including:
• Interpreting the Graphs
• Changing the View
• Investigating Traffic Using TopN
• Investigating Flows
Whether monitoring or investigating specific traffic using the Network Surveillance
interface, the type of traffic you wish to monitor or investigate must always appear
on the graphs. For example, if you wish to investigate traffic that was presently
active during the 3 a.m. time frame, you must adjust your graph to visually
represent the traffic from that time frame to continue your investigation.
The network activity that is displayed on the STRM graphs is determined by the
Global View that is currently selected. Global Views are configurable views that
capture and display your network activity. Each view filters traffic and displays the
data from many perspectives. You can display your network activity from any
Global View and navigate to the Full Networks View to show the same data from
the network perspective. When viewing the network perspective, you can navigate
to another view.
Note: By default, the Network Surveillance interface refreshes every 3 minutes
(180 seconds). The counter on the top right of the interface indicates the time to
refresh.
When selecting a view, only the traffic that matches the pre-defined view
properties is visible on the STRM graphs. You can determine your network’s
activity by the colors that appear on the inbound and outbound graphs. Network
traffic is divided and classed into sub-components; each sub-component is
assigned a color. Network activity is identified by the colored layers that appear on
your graphs.
The traffic layer often has peaks and valleys depicting the behavior of high and low
volume traffic. If more than one type of traffic is currently active, such as
Peer-to-Peer (P2P) and File Transfer Protocol (FTP), both layers appear on the
graphs in stacked formation. Normal traffic is easily identified and abnormal activity
becomes obvious by the stacked colored layers that appear on your graphs.
STRM Users Guide
Page 35
Viewing Network Activity 29
Your network administrator can enable or disable any Global View. Disabling
views saves processing power on large structured networks. Depending on your
current network activity or the type of traffic you are monitoring, some views may
be of more value than others.
Note: You must have administrative permissions to enable/disable views. For
more information, see the STRM Administrator Guide.
Network Surveillance graphs provides the following:
• X-Axis Grid - The X-axis displays the time. You can also pan the graphs to
display the traffic for another time
• Y-Axis Grid - The Y-axis measures the amount of traffic displayed on the
graph. This can represent the volume of traffic based on the selected layer such
as packets, bytes, or number of hosts. The measured increments change as
you zoom in on the graph.
• Inbound - Inbound (selected layer such as bytes, packets, or hosts) displays
the inbound traffic activity.
• Outbound - Outbound (selected layer such as bytes, packets, or hosts)
displays the outbound traffic activity.
• Double Arrows - The double arrows, located at the top of each graph allow you
to navigate through time and display previous activity. Click the arrows on the
top left to move back the same time increment as currently displayed on the
graphs. Click the arrows on the right to move ahead the same time increment
as currently displayed on the graphs.
• Triple Arrows - The triple-arrows located at the top of each graph allow you to
navigate between screens that you previously displayed. Click the arrows on
the top left to move back to the previously displayed graph. Click the arrows on
the right to return.
• Count-Down Timer - The count down timer counts down, in seconds, and
displays the time before STRM refreshes your network information.
STRM Users Guide
Page 36

30 MANAGING YOUR NETWORK ACTIVITY
• Scale - The scale option, located on the top left above the graph, allows you to
adjust the graph view. The plus and minus signs allow you to zoom in or zoom
out to change the appearance of the traffic. When zooming in on the traffic, the
measured increment reduces in size. Select the letter A to return to actual
scale.
• Date - The date, displayed over the center of the graph, displays the date of the
traffic activity currently displayed on the graph.
• Size - The size option, located on the top right above the graph, allows you to
adjust the size of the graph panels. The plus and minus signs allow you to
enlarge or shrink the appearance of the graph. Select the letter A to return to
actual size.
• Legend - The legend lists the groups of traffic associated with the view
currently displayed. Click any sub-component in the legend to isolate and
display the traffic.
• Component - The component box, located under the legend, identifies the
currently highlighted traffic view. The component also reveals the number of
sub-components that are grouped within the view. Point your mouse to any
component to reveal the groups within the view. Select a component to isolate
and display the traffic.
• Select Time - The select time option, located beneath the graph, allows you to
select traffic for a specific time frame. For example, if you select 15 using the
Select Time drop-down list box and click an area of the graph, 15 minutes of
data appears on the graph.
• Time Period - The select time option, located beneath Select Time, displays
the current time frame. Using the drop-down list box, select a new time frame.
You can use the right mouse button (right-click) on any area of the graph and
perform one of the following:
• Bookmark This Graph - Creates a bookmark for this graph time and location.
• View Flows - Searches flows for either local or remote traffic.
• Graph Scale - Increases or decreases the size of the graph.
• Save This Graph As - Save a graphical image of the current graph.
Changing the View When displaying a specific view, only the legend sub-components with current
active network traffic appear.
The procedure below describes how to change the graph view using the Network
Surveillance menu options. However, you can also change the graph view using
the Pivot To box, which allows you to alter the current view and display the view
from several perspectives or angles. For example, if you select the Local Networks
view, then select Threats from the Pivot To option, the Threats traffic (from the
Local Network view) only appears. Or, if you have previously selected Applications
View, and selected P2P applications, then chose to navigate to Networks, your
graphs now display a view of total volume of P2P traffic over each of your local
STRM Users Guide
Page 37
Viewing Network Activity 31
networks. When you select a Global or Custom View, the Pivot To box displays the
available navigation options for that view.
To change the view:
Step 1 From the main STRM interface, click the Network Surveillance tab.
The Network Surveillance window appears.
Step 2 From the main menu, select Global Views.
Step 3 Using the drop-down list, select a view.
The selected view displays the corresponding traffic on the STRM graphs. Views
may include the following, depending on the views enabled on your system:
Note: For more information on views, see the STRM Administration Guide.
• Local Networks View - Displays traffic to and from your local networks. This
information is derived from your network hierarchy and displays all activity from
internal IP addresses and CIDR ranges. When displayed on the graphs, this
view provides a graphical representation based on each department or group
residing in your network.
• Threats View - Displays traffic originating from possible threats to your
network. Threat View is a security-based view that displays potential Denial of
Service (DoS) attacks, worms, and stealth activity. When displayed on the
graphs, this view provides a graphical representation for this type of traffic.
• Applications View - Displays traffic originating from client and server
applications. This is determined when either the client or the server initiates
communication. When displayed on the graph, each of these views provides a
graphical representation of this type of traffic.
Note: Applications default view groups are automatically updated using Automatic
Updates. For more information on Automatic Updates, see the STRM
Administration Guide.
• Geographic Views - Displays traffic originating from several geographic
locations. These are identifiable by the legend that appears beside the STRM
graphs when this view is displayed. When displayed on the graph, this view
provides a graphical representation of this type of traffic.
Note: Geographic default view groups are automatically updated using Automatic
Updates. For more information on Automatic Updates, see the STRM
Administration Guide.
• Flow Types View - Displays traffic originating from flow types. Flow types are
measured by the ratio of incoming activity to outgoing activity. When displayed
on the graph, this view provides a graphical representation of this type of traffic.
Note: You must have administrative permissions to create Custom Views. For
more information, see STRM Administration Guide.
STRM Users Guide
Page 38
32 MANAGING YOUR NETWORK ACTIVITY
Changing Flow
Attributes
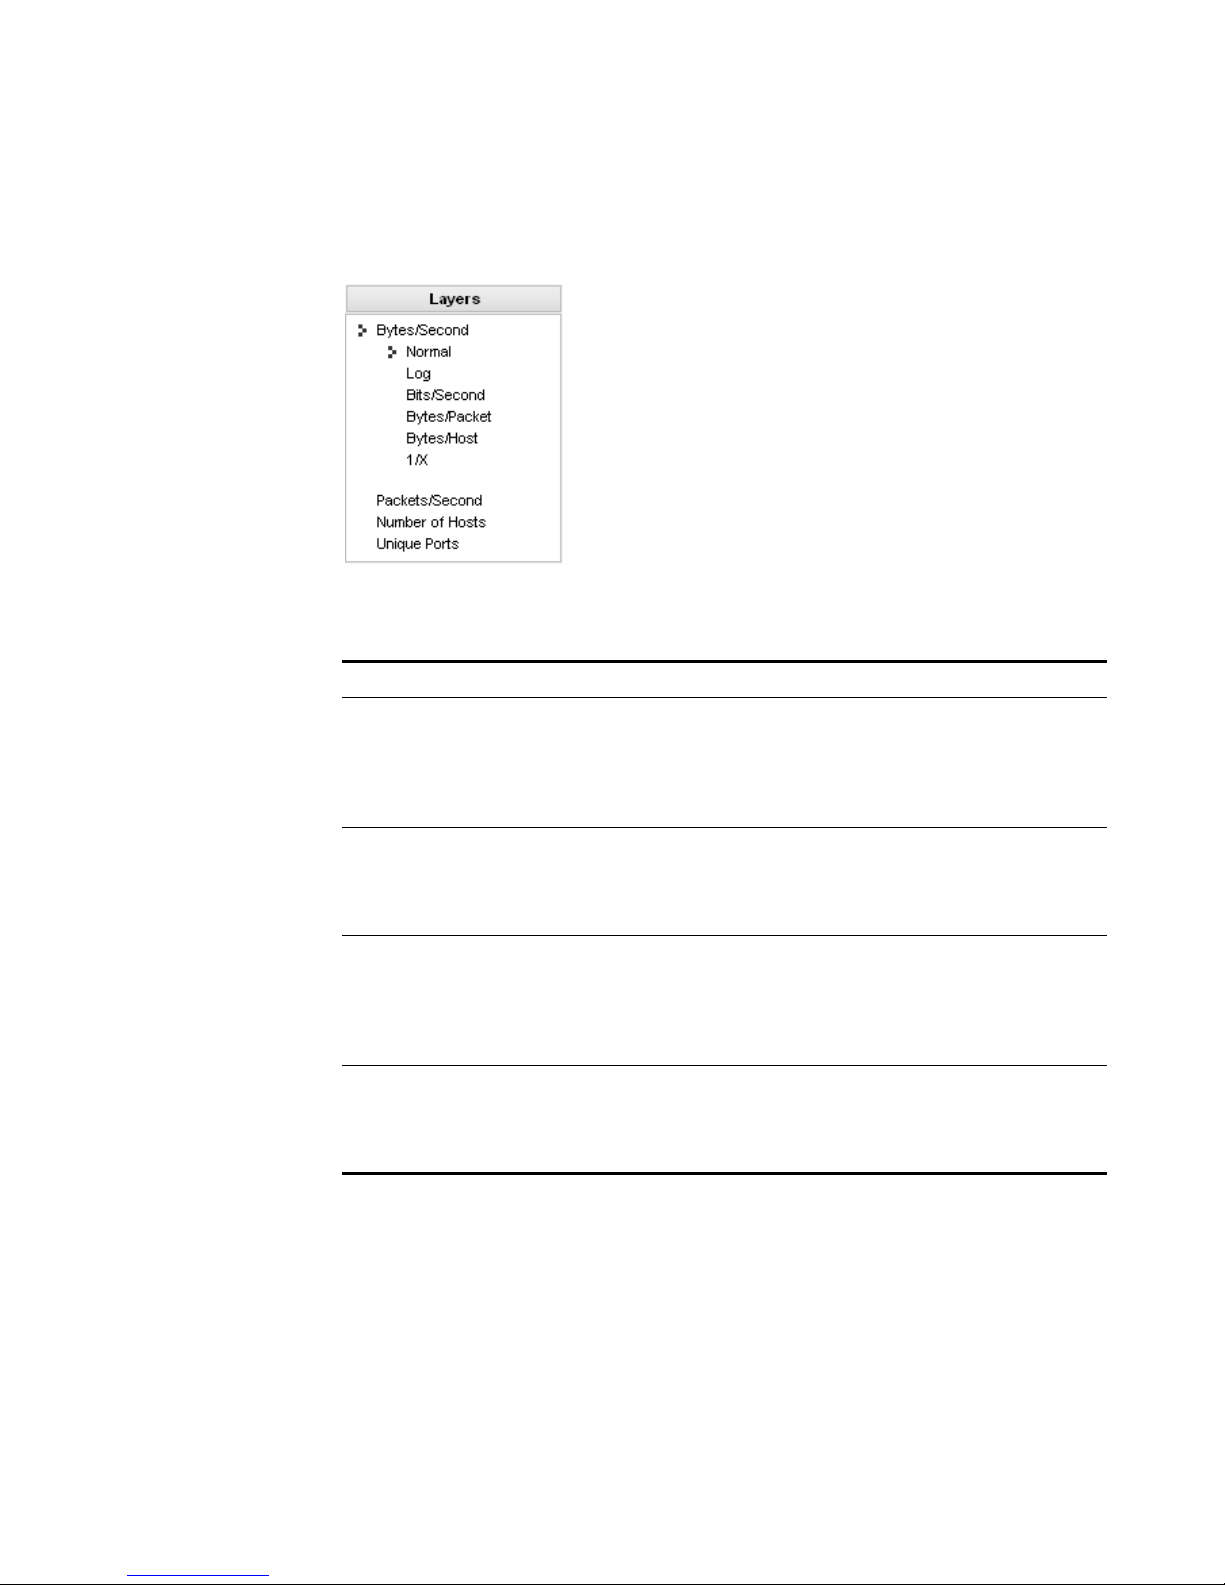
You can change the flow attributes on the graphs using the options available in the
Layers box. You can display bytes per second, packets per second, and hosts per
interval.
Each option has a series of items to display specific details of your current view.
Table 3-2 Layers Box
Parameter Description
Bytes/Second Specifies the traffic layer as the number of bytes per second for
the interval. Options include: Normal, Log, Bits/Second,
Bytes/Packet, Bytes/Host, and 1/x.
When this option is selected, details on the highest volume
networks are displayed in the TopN box.
Packets/Second Specifies the traffic layer as the number of averaged packets per
second. Options include: Normal, Log Packets/Hosts, and 1/X.
When this option is selected, details on the highest volume
networks are displayed in the TopN box.
Number of Hosts Specifies the traffic layer by the total number of active hosts seen
during the interval. Options include: Normal, Log Packets/Hosts,
and 1/X.
When this option is selected, details on the highest volume
networks are displayed in the TopN box.
Unique Ports Specifies the traffic layer as the number of ports in use. Options
include: Normal, Log, and 1/X.
When this option is selected, details on the highest volume
networks are displayed in the TopN box.
STRM Users Guide
Page 39
Viewing Network Activity 33
Changing Traffic
Location
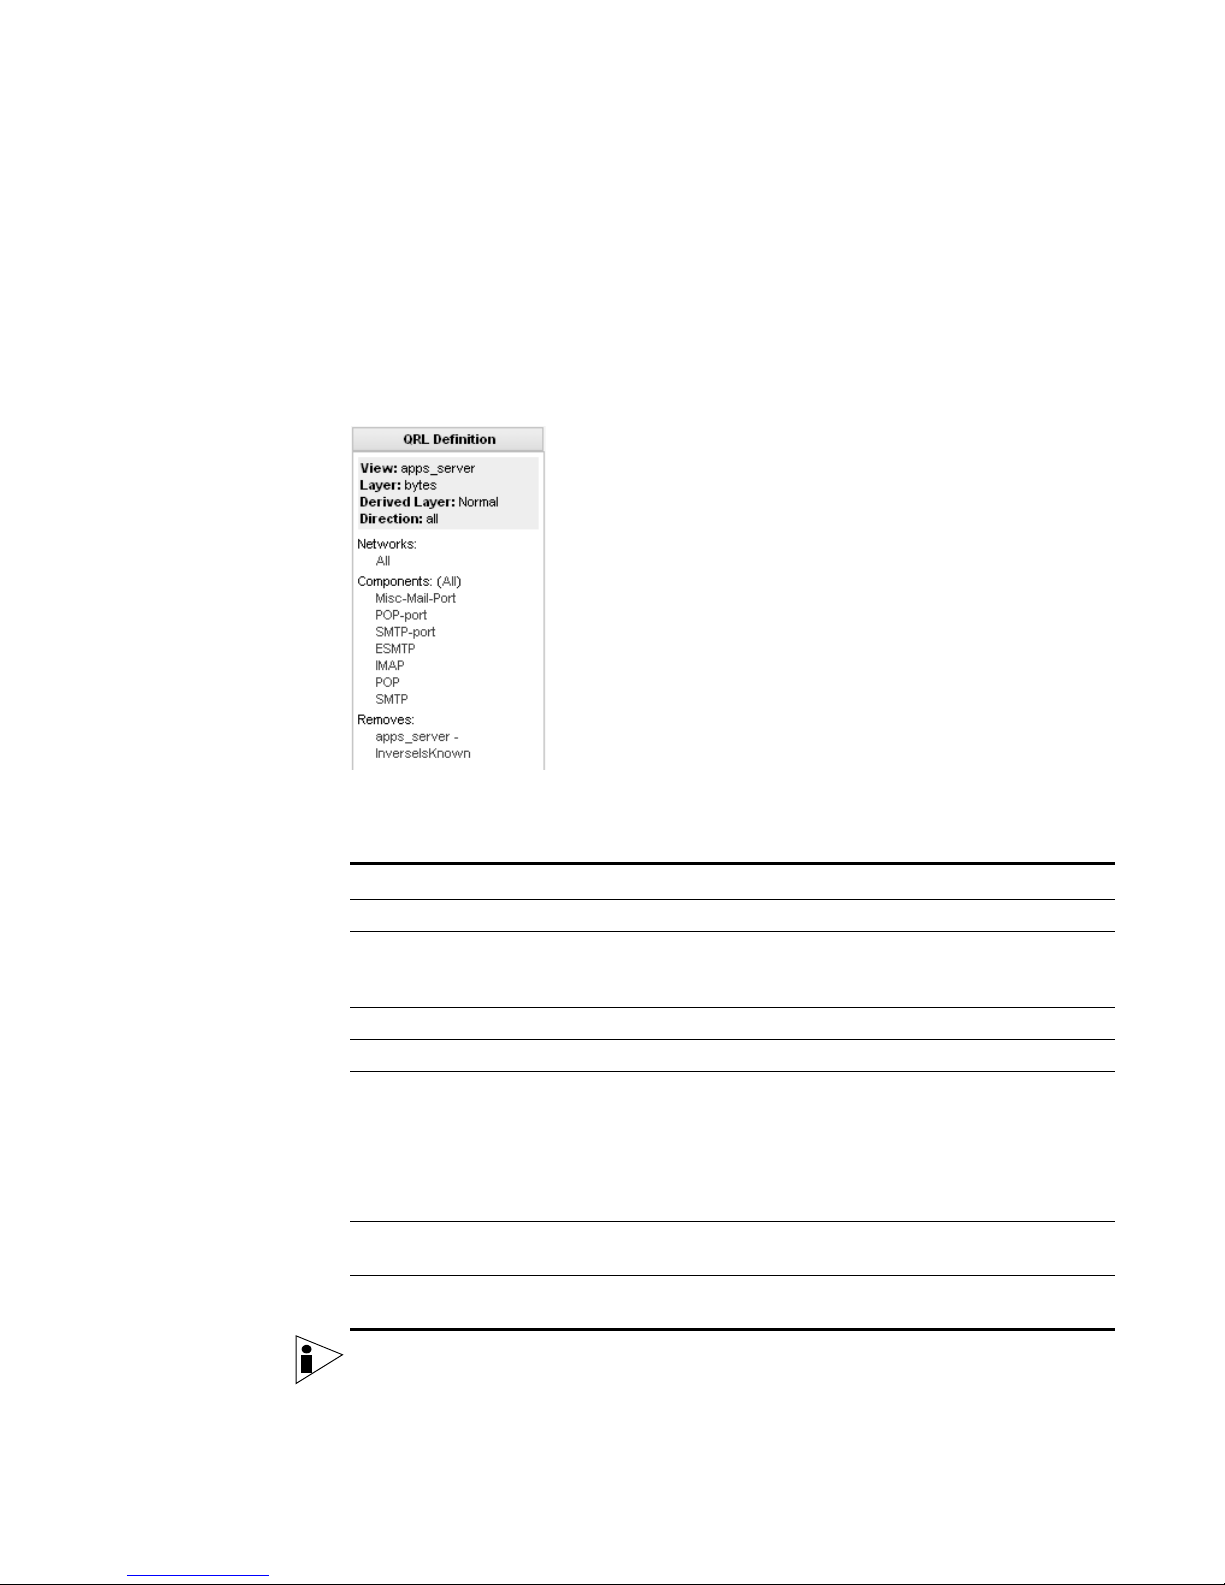
You can change the location of traffic that the graphs display using the QRL
Definition box. Used with the Pivot To function, the QRL Definition allows you to
navigate between views. The QRL Definition lists the components that are
displayed or removed from your traffic that is displayed on the graphs.
QRL Definition also provides other options. Use the right mouse button (right-click)
QRL Definition to access the bookmark options and to display traffic for the
current time.
Table 3-3 provides information on the QRL Definition box:
Table 3-3 QRL Definition Box
Parameter Description
View Specifies the current view.
Layer Specifies bytes, packets, hostcount, unique ports, normal, log,
bits/second, utilization, bytes/packet, bytes/host, and 1/X (bytes
not on port-only when viewing flows).
Derived Layer Specifies the layer displayed.
Direction Specifies the direction of the flow.
Networks Click the area of the network you wish to view:
• all - Displays all top level networks selected.
• grp – Displays the group of objects making up the network
location on the tree specified by the networkSelect field.
• single - Defines a single leaf node.
Components Specifies the components or sub-components that have been
selected to be displayed on the graphs.
Removes Specifies the components or sub-components removed from the
graph.
Note: Due to the dynamic nature of STRM, only objects that are currently active on
your network appear on your legend and in the QRL Definition box. To display the
STRM Users Guide
Page 40

34 MANAGING YOUR NETWORK ACTIVITY
entire list of legend components, select QRL Options > Expand Legend from the
menu.
Investigating
Traffic Using TopN
Viewing the TopN
Information
You can determine which areas of your network are generating the highest level of
activity. The TopN box reveals details the view that is currently displayed on your
graphs.
TopN can display:
• The top (up to five) network objects generating the highest level of traffic
appearing on your network.
• The top (up to five) IP addresses generating the highest level of traffic for a
specific area of your network.
• Details for each layer selection.
• Resolver Actions assigned to IP addresses.
• Access options to view flows and Adding Resolver Actions.
This section provides information on using TopN for investigating your network
traffic including:
• Viewing the TopN Information
• Investigating Traffic
TopN monitors the activity of the current network location, current view and
selected objects, and captures the activity of the top five network objects. TopN
displays data with horizontal bars, which depicts the amount of activity for each
object.
TopN changes each time a new view is selected. Each time the refresh timer
refreshes the data, TopN information changes to reflect the new data.
TopN displays data based on layers. When accessing the options found in the
Layers box, TopN displays the details for each selection. For example, if you select
the Number of Hosts from the Layers box, TopN displays details for the five most
active hosts, or networks, with the most active hosts. Each selection from the
Layers box changes the graphs for visualization.
TopN displays data for the five most active objects from the following layers:
• Bytes/Second - Specifies the layer value as the number of bytes per second
for the interval. Options include: Normal, Log, Bits/Second, Bytes/Packet,
Bytes/Host, and 1/x.
• Packets/Second - Specifies the layer as the number of averaged packets per
second. Options include: Normal, Log Packets/Hosts, and 1/X.
• Number of Hosts - Specifies the traffic layer by the total number of active hosts
seen during the interval. Options include: Normal, Log Packets/Hosts, and 1/X.
STRM Users Guide
Page 41
• Unique Ports - Available only when viewing the Local Networks View.
Specifies the traffic layer as the number of ports in use. Options include:
Normal, Log, and 1/X.
Investigating Traffic To investigate traffic using TopN:
Step 1 Click the Network Surveillance tab.
Investigating Traffic Using TopN 35
Step 2 Select the desired view to display traffic activity.
Step 3 Select the desired layer from the Layers box.
TopN changes to display the activity for the top five network objects based on the
selected layer.
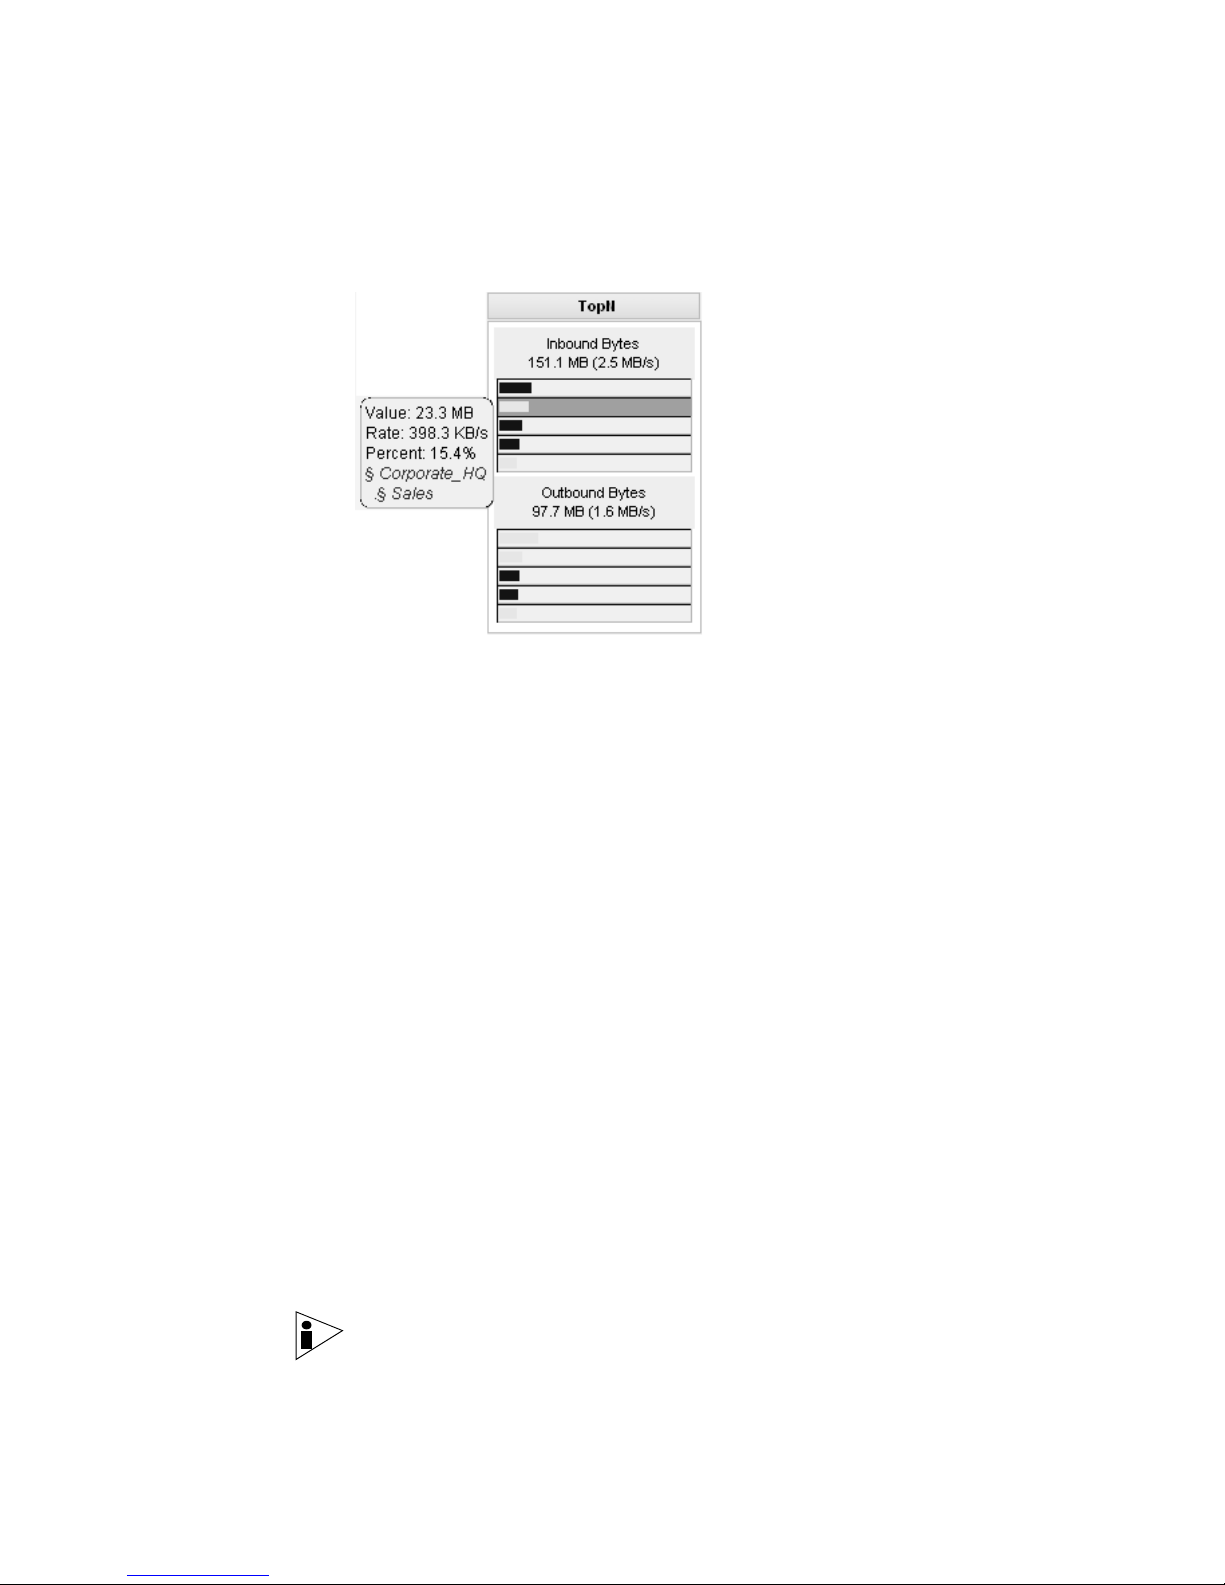
Step 4 Point your mouse to the colored horizontal bar that corresponds to the color of
traffic on your graph.
The area becomes highlighted and the following appears:
• Value - Depending on the layer you have selected, can display number of
bytes, packets, hosts per interval, or unique ports for the most active networks
in the last 60 seconds.
• Rate - Depending on the layer you have selected, can display the rate of
transfer for bytes, packets, hosts per interval, or unique ports for the most
active networks in the last 60 seconds.
• Percent - Displays the percentage of network traffic the network object
produced in the last 60 seconds.
• Network Location - Displays the physical location for the networks associated
with the TopN information and is derived from your asset map.
Step 5 Click the horizontal bar to freeze the information.
Step 6 Click the network location from the Network Location section.
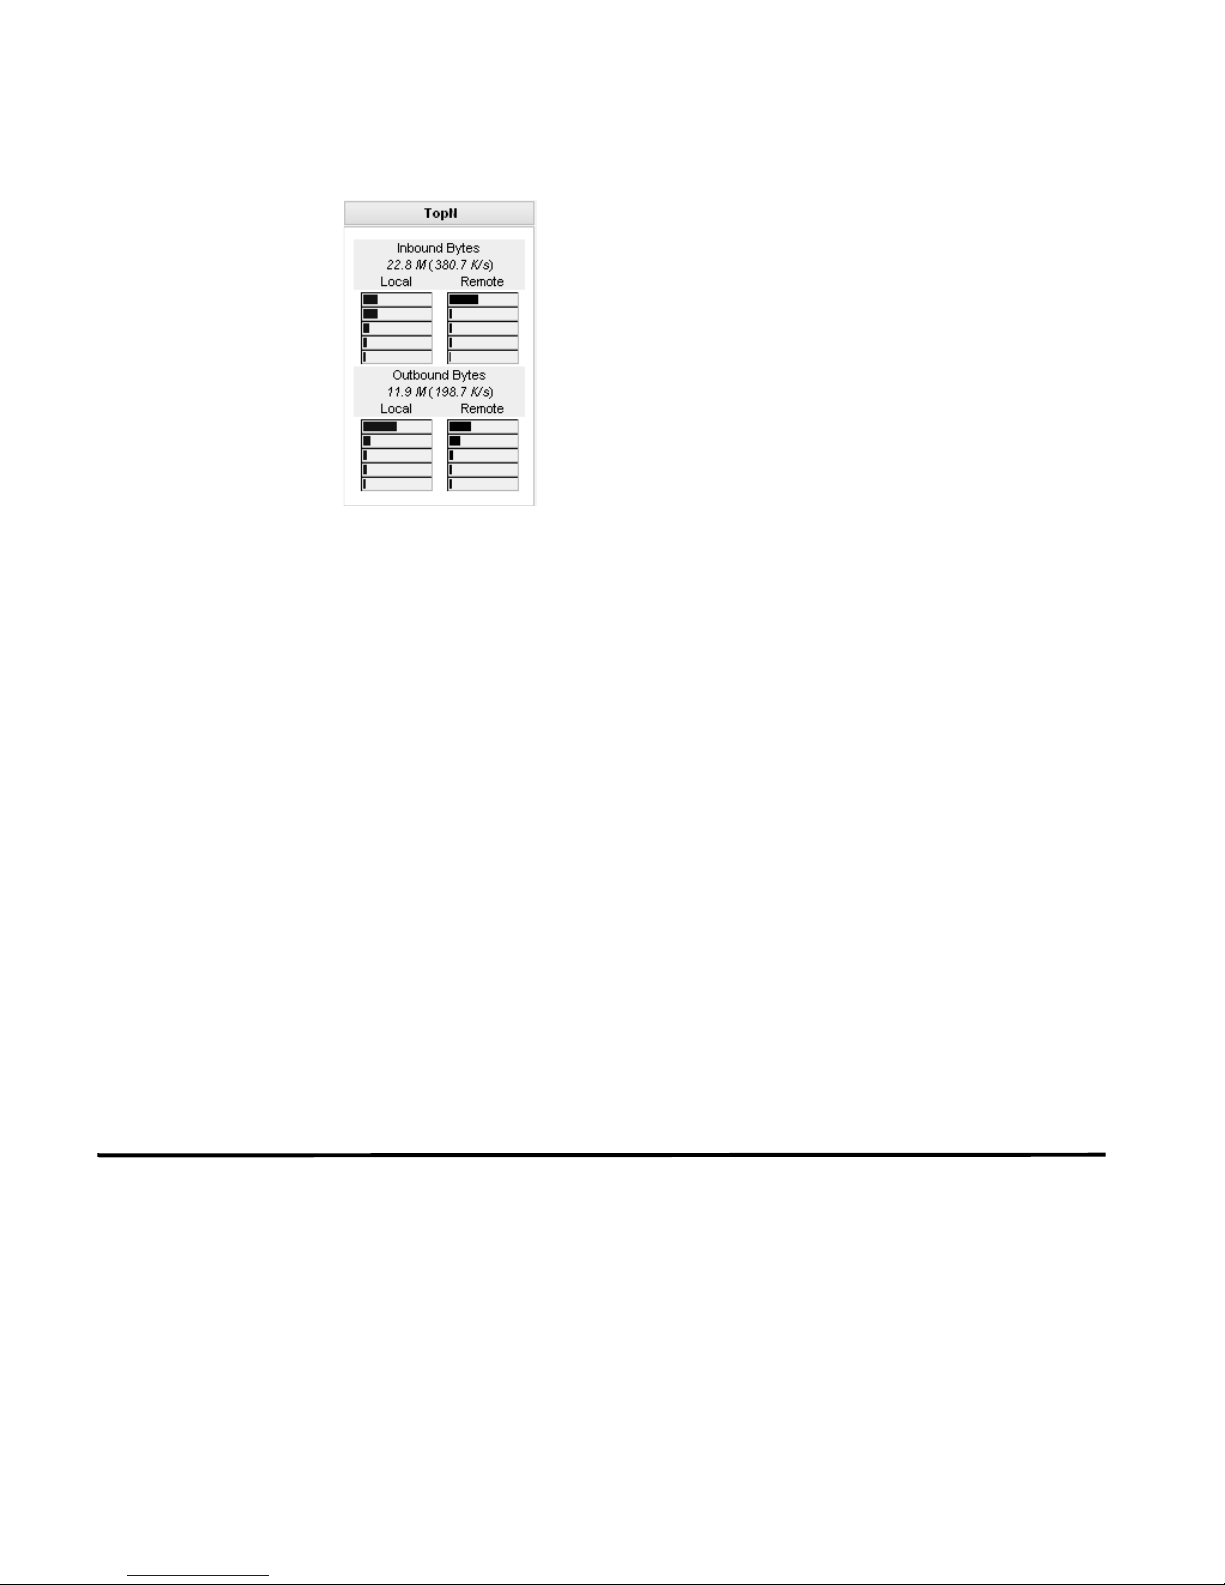
Note: The chosen layer determines the information displayed in the TopN box.
For example: If you have selected Bytes/Second from the Layer box, TopN
displays the following:
STRM Users Guide
Page 42
36 MANAGING YOUR NETWORK ACTIVITY
• Inbound Local -The highest level of activity for inbound local bytes.
• Inbound Remote -The highest level of activity for inbound remote bytes.
• Outbound Local - The highest level of activity for outbound local bytes.
• Outbound Remote - The highest level of activity for outbound remote bytes.
Step 7 To continue investigating or to search flows, point your mouse to a TopN horizontal
bar and click the bar to freeze the information.
The bar becomes highlighted and the following appears:
• Value - Displays the numeric value of network activity.
• Rate - Displays the rate of transfer for the network object.
• Percent - Displays the percentage of network traffic the object is producing.
Step 8 To further investigate, select one of the following:
a Point your mouse to the IP address to reveal the following details:
- Country - Identifies the country of origin.
- Network - Identifies the network location.
- Offenses - Identifies any previous offenses.
- Resolver Actions - Identifies Resolver Actions assigned to the IP address.
b Double-click the horizontal bar to use the search flow function to investigate the
data.
Investigating Flows You can investigate flows that were processed to generate the views. STRM
visually profiles and displays network traffic activity on color-coded graphs based
on time of day, traffic type, and network depth. STRM uses traffic profiles to
analyze the activity. It reveals details between local and remote activity allowing
you to analyze traffic and extract vital information on network communications. The
View Flows function connects you to the Flow Viewer tab functionality to assist you
in the discovery of communicating hosts, servers, ports, corresponding IP
addresses, and user identification for the selected traffic. This function also reveals
STRM Users Guide
Page 43
Investigating Flows 37
byte sizes, packet lengths, and flow counts for both sending and receiving
transmissions.
The types of traffic for your network appear in the dynamic legend located beside
your graphs. This includes all traffic types found on your network. Also, STRM
identifies your network location by visually displaying a marker on the lower left
corner of your graph. The network traffic data that appears on your STRM graphs
is dependant on the current view selected, the layer selected, and the
sub-component traffic selected from the legend.
To investigate flows:
Step 1 The dynamic legend displays the traffic that is currently active on your network.
Point your mouse to each section on the legend; the traffic name and the number
of traffic sub-components associated with the traffic, is displayed directly below the
legend. You can search and investigate flows on any network traffic; however, the
traffic must be showing on the current graphs. If you wish to investigate traffic that
does not currently appear on the graph, you can use any of the following methods
to gain access to a specific traffic type:
• From the main menu, select Global Views and choose a designated view to
display traffic by a specific view.
• In the Pivot To box, choose from the available Base Views for the Global or
Custom View you have displayed.
• Click on the panning arrows above the graphs to display traffic from another
time frame.
• Point your mouse to the legend to reveal traffic by name, then click the area of
the legend.
• Make a selection in the Select Time or Time Period drop-down list boxes and
select a new time frame.
• In the QRL Definition box, click on the available Networks or Components to
display this type of traffic.
• In the TopN box, click on any horizontal bar to access the traffic.
• To access the lowest network in your hierarchy, you can use the Asset map to
navigate. For more information, see Asset Map.
Step 2 Choose one of the following options:
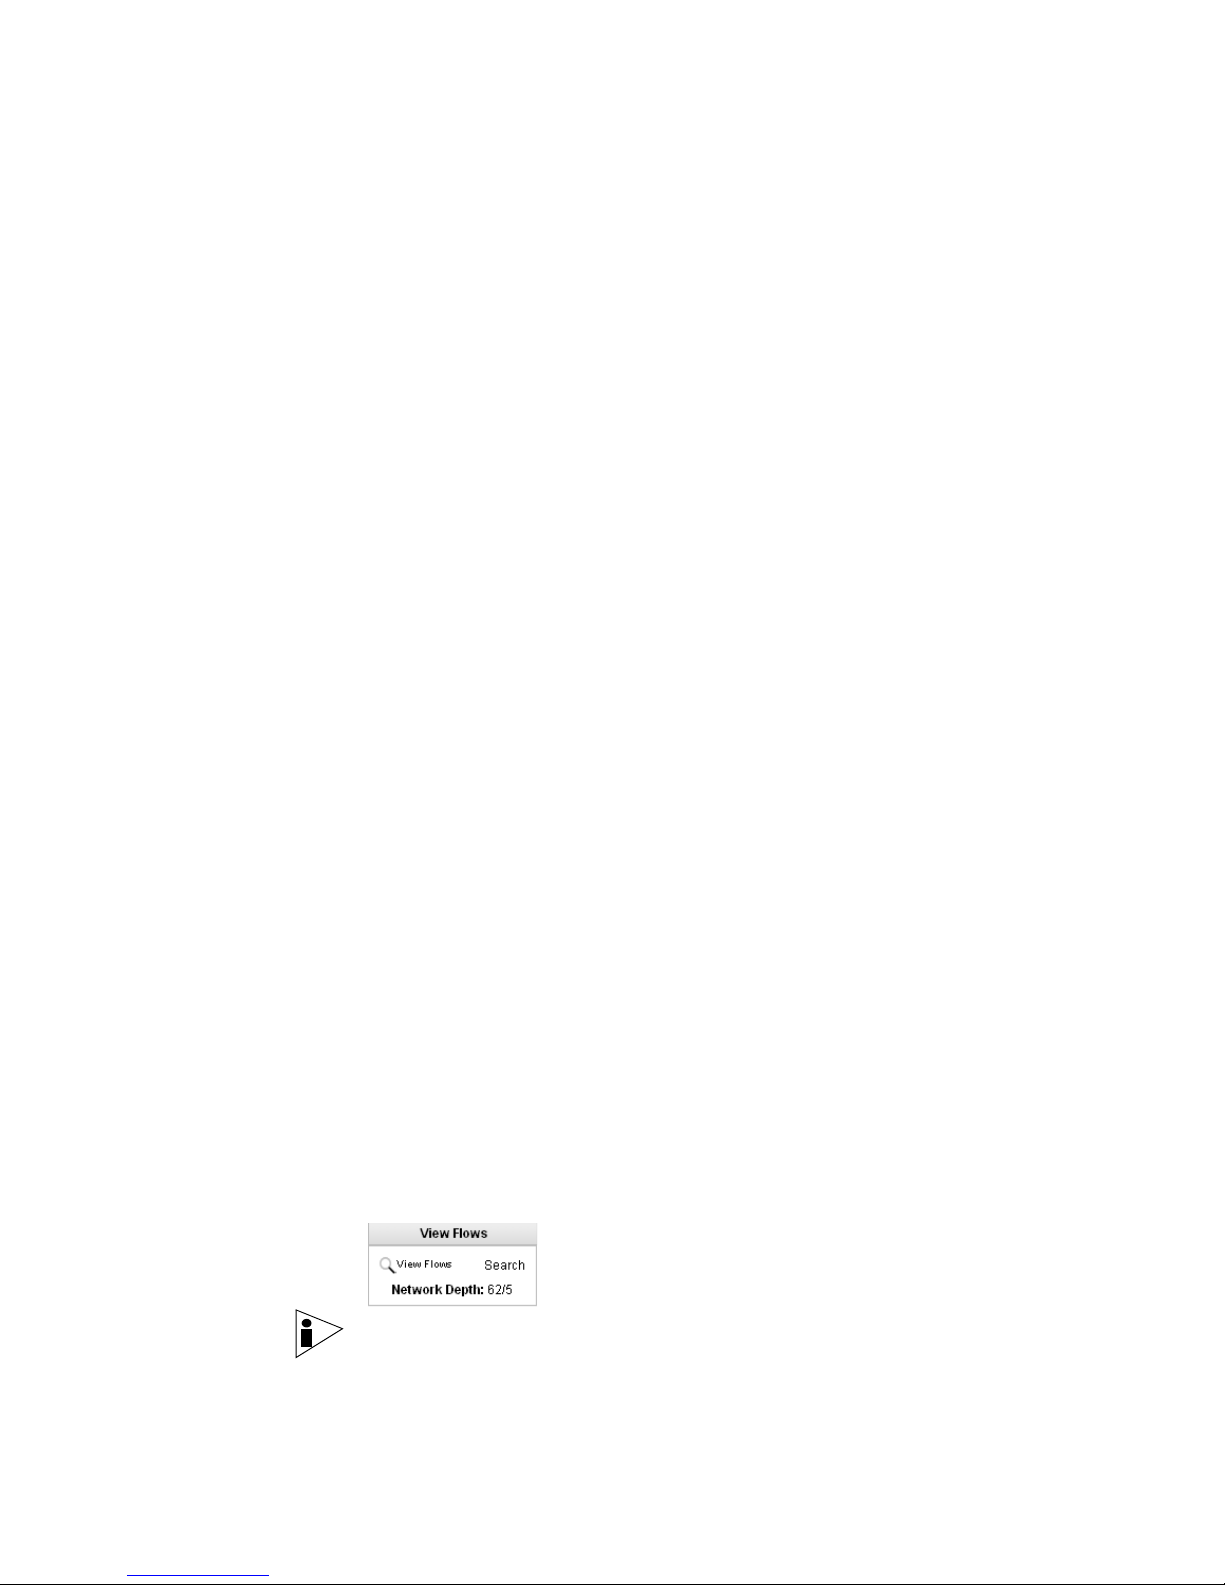
a To investigate flows that currently appears on your graph, click View Flows in
the View Flows box.
Note: To investigate traffic that currently appears on your graph, you can also use
the right mouse button (right-click) on an area of the graph and select View Flows.
STRM Users Guide
Page 44

38 MANAGING YOUR NETWORK ACTIVITY
The results appear. For more information on interpreting results, see Chapter 7
Using the Flow Viewer.
b To search for a single IP address, click Search.
The Flow Search window appears. For more information, see Chapter 7 Using
the Flow Viewer.
Note: If you have upgraded your system to STRM 6.1 and you attempt to search
for flows recorded before the upgrade, the pre-STRM 6.1 View Flows search
interface appears. For more information regarding this interface, see the STRM
Users Guide, STRM 6.0.
STRM Users Guide
Page 45

4
MANAGING SENTRIES
Sentries provide an alerting function for your network. A sentry can monitor any
number of views and generate an alert when traffic in one of the monitored views
meets the specified criteria. A non-administrative user can create sentries,
however, only an administrative user can configure advanced sentries on a
system-wide basis.
Note: For information on creating system-wide sentries, see the STRM
Administration Guide.
Alert details appear in the appropriate location of the Offense Manager as follows:
• If you create a Threshold, Anomaly, or Behavioral sentry that generates an
alert, the details appear in the Network Anomalies interface as these type of
alerts are monitoring time series event data. You can also distribute alert
notifications to a syslog file, e-mail, or run a custom script.
• If you create a Security/Policy sentry with the auto learn option selected, the
alerts appear in the Network Anomalies interface. You can also distribute alert
notifications to a syslog file, e-mail, or run a custom script.
• If you create a Security/Policy sentry without the auto learn option selected, the
generated alerts appear in the offenses portion of the Offense Manager,
depending on the chosen event categories. If you wish to configure notifications
for this sentry type, you must use the custom rules wizard. For more
information, see the STRM Administration Guide.
This chapter provides information on managing sentries including:
• About Sentries
• Viewing Sentries
• Creating a Sentry
• Editing a Sentry
STRM Users Guide
Page 46

40 MANAGING SENTRIES
About Sentries You can create sentries that perform actions when certain specified conditions are
met. These actions can include sending an e-mail notification or storing sentry
event information. You can also add sentry alerts for a specific traffic type.
You can save Packages for use with other sentries. For example, if you create a
DDoS Package, you can create sentries at different locations in your network using
the DDoS Package.
Note: For more information on the Offense Manager, see Chapter 5 Investigating
Offenses.
Sentries contain the following components:
• Logic Unit - Includes specific algorithms used to test objects. The Logic Unit
contains the default variables for the sentry.
• Package - Contains the view objects (default variables) that are forwarded to
the Logic Unit and default variables to be used by the sentry. All variables in the
Package configuration have priority over the Logic Unit variables. The objects
are created from any defined view, with the exception of the main network view.
For example, a package may contain all applications that you wish to monitor
for inappropriate use.
• Sentry - Specifies which network location you wish the sentry to apply. The
network location component of the sentry can also specify any restrictions that
you wish to enforce. The variables in the sentry component have priority over
the Package and Logic Unit variables. For example, you can configure a sentry
to monitor the accounting department network location between 8 am and 5
pm. However, you can also specify that you only wish to be notified of any
misuse if the activity continues for more than 10 minutes.
Types of Sentries You can create the following types of sentries:
• Behavior
• Anomaly
• Security/Policy
• Threshold
• Custom
Behavior
A Behavior sentry monitors your deployment for volume changes in behavior that
occurs in regular seasonal patterns. STRM learns how a particular object typically
behaves over a period of time and then records the number of hosts
communicating with your network at different points of the day. This allows STRM
to develop an accurate profile of seasonal behavior. For example, if a mail server
typically communicates with 100 hosts per second in the middle of the night and
then suddenly starts communicating with 1000 hosts a second, STRM generates
an alert.
STRM Users Guide
Page 47

About Sentries 41
You can also specify that any undesirable actions must occur for a particular
period of time before an alert generates. For example, you can configure a sentry
indicating that a mail server must communicate with a large number of additional
hosts for several minutes before an alert generates. This type of sentry generates
an alert when the activity ceases.
A behavior sentry is useful if your graph displays a consistent or repetitive amount
of traffic. For example, if your graph displays the number of hosts accessing a busy
server, you can monitor the number of non-responsive flows across the entire
network or the number of hosts communicating at the top level of the network.
Anomaly
An Anomaly sentry monitors your deployment for abnormal activity. The algorithm
detects the existence of new or unknown traffic, which is traffic that suddenly
ceases or a percentage change in the amount of time an object is active. For
example, if an area of your network never communicates with Asia starts
communicating with hosts in that country, an alert generates. An Anomaly sentry is
activity-based and not volume-based. For example, a host that communicates for 6
minutes out of 1 hour would be active for 16% of the time.
An Anomaly sentry is useful in the following situations:
• Monitoring traffic for users who are configuring access to network equipment
such as switches and routers.
• Monitoring remote access to servers to test for uncommon protocols.
• Monitoring internal flow and failure from devices.
Security/Policy
A Security/Policy sentry monitors your deployment for security/policy violations. A
Security/Policy sentry monitors your network for policy compliance at the network
or application level. This sentry type also monitors violations on usage-based
policies, which restricts or allows use of specific applications or network areas. A
Security/Policy sentry can also specify situations when application usage is
allowed. For example, if you create a sentry that allows only web traffic to the web
server group and other groups generate web traffic, the sentry generates an alert.
The Security/Policy sentry is a derivative of the Threshold sentry but with a
threshold of one. If any traffic is detected that meets the sentry criteria, an alert
generates. For example, if you apply a Security/Policy sentry to the threats view for
a worm object, and a single packet/flow is classified for that worm object, an event
generates. The events that are generated from Security/Policy sentries are sent to
the Event Processor, which correlates the sentry event with asset profile data and
with the events received from external sources (if applicable).
The Security/Policy sentry also allows you to select an auto learn option, which
enables STRM to learn system activity until a configured time. Once the time has
expired, the sentry generates an alert when any object that was not present during
the learning time becomes active.
STRM Users Guide
Page 48

42 MANAGING SENTRIES
A Security/Policy sentry is useful for detecting undesirable policy issues such as
remote access to client networks, Peer-to-Peer (P2P)/Instant Messaging (IM) or
other misuse applications, or inappropriate use of business applications.
Threshold
A Threshold sentry monitors your deployment for activity that exceeds the
configured threshold of the sentry. STRM monitors relevant network objects and
identifies whenever a threshold is exceeded. Thresholds can be based on any
data collected by STRM, not just packet count or bandwidth. For example, if you
create a sentry indicating that no more than 220 clients can log into the server
between 8 am and 5 pm, an alert generates if the 221st client attempts to login.
A Threshold sentry is useful for monitoring utilized bandwidth, monitoring above
noise for specific activity on your network, or monitoring for device failure.
Custom
You can create a custom sentry to your network has specific monitoring
requirements. A custom sentry can monitor for any combination of properties you
customer requires.
Viewing Sentries Using the Network Surveillance interface, you can view any sentries you created or
another user has configured to share with you for the area of the network you are
currently viewing.
To view sentries:
Step 1 Click the Network Surveillance tab.
The Network Surveillance interface appears.
Step 2 Navigate to the area of the network for which you wish to view sentries.
Note: To view all sentries, see the STRM Administration Guide.
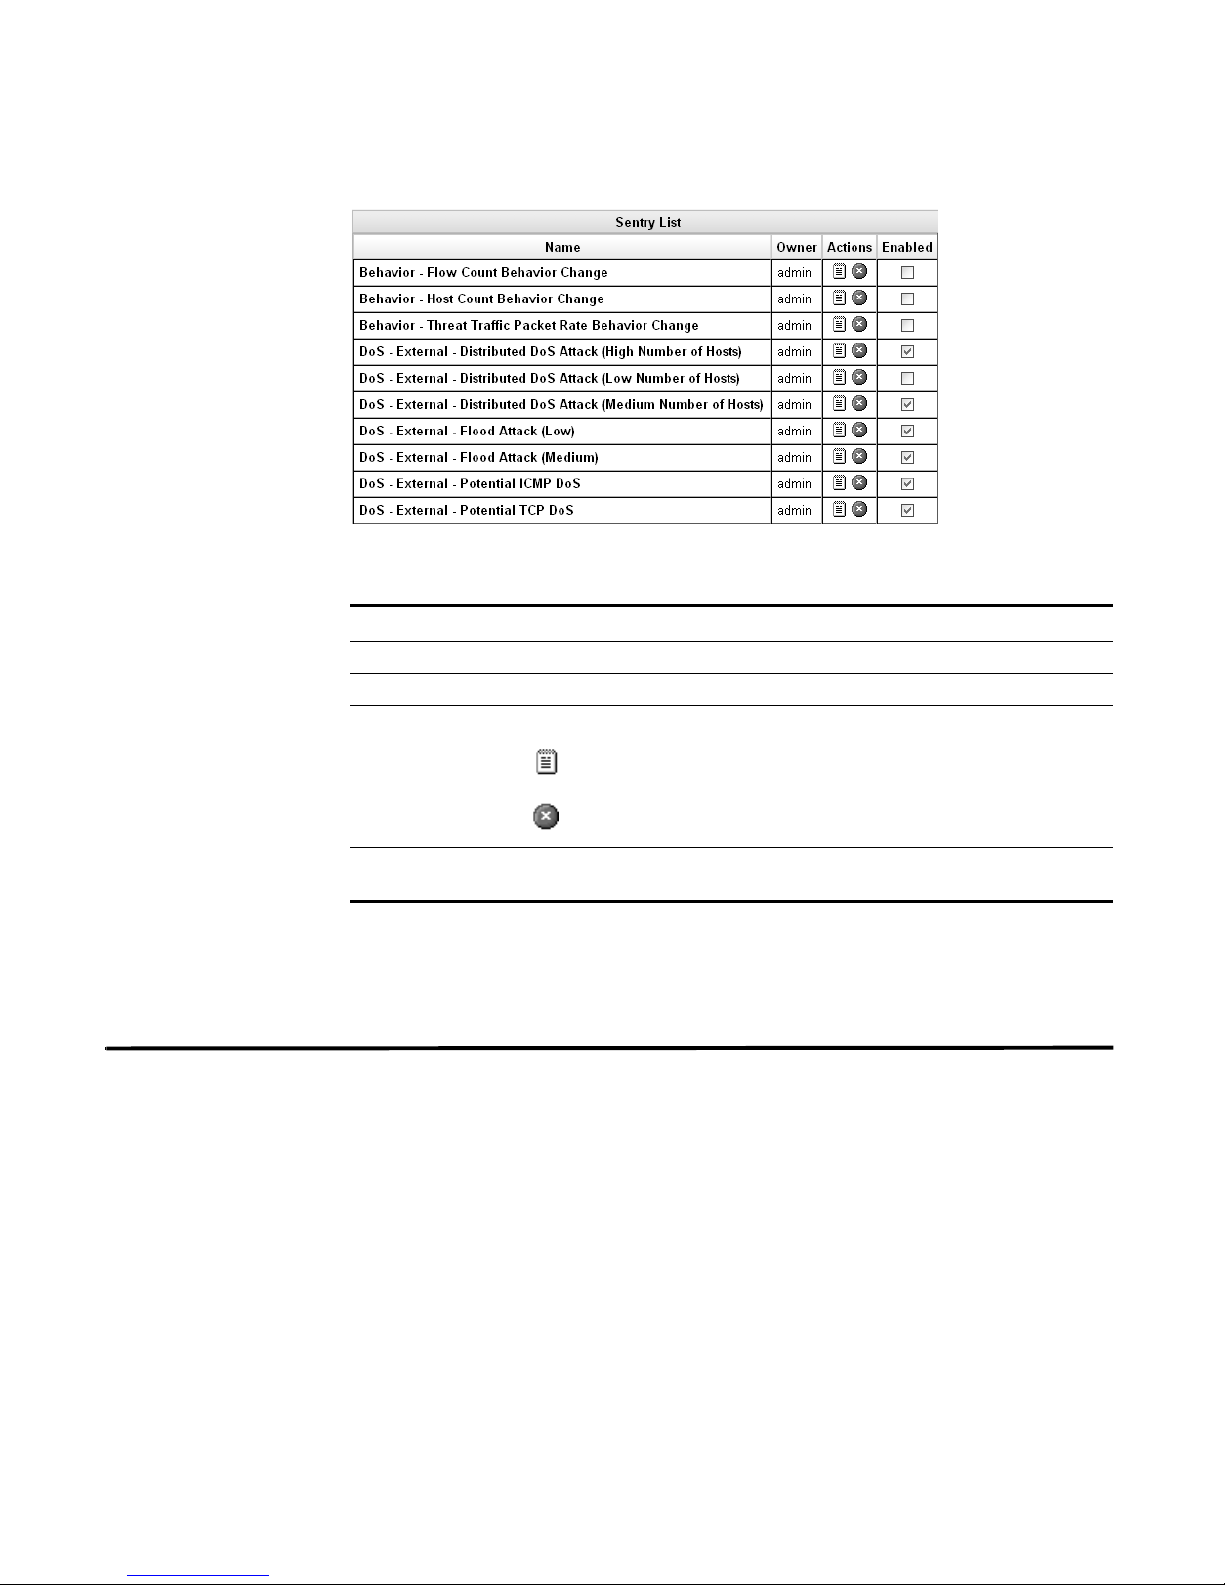
Step 3 Below the graph, click View Sentries.
The Sentry List window appears.
STRM Users Guide
Page 49
Creating a Sentry 43
Table 4-1 provides the details of the Sentry List window:
Table 4-1 Sentry List Window
Parameter Description
Name Specifies the name of the configured item.
Owner Specifies the name of the user who created the sentry.
Action Provides one of the following options:
Allows you to edit the details. You can only edit sentries
that you have created.
Allows you delete the selected item. You can only delete
sentries that you have created.
Enabled Select the check box to enable this sentry. Clear the check box to
disable the sentry.
Step 4 Click the sentry you wish to view.
The sentry details appears. For more information on sentry details, see Editing a
Sentry.
Creating a Sentry You can apply a sentry to any object in your network. STRM automatically
generates an alert whenever the defined monitoring criteria is not within the
expected observed behavior.
This section provides information on creating sentries including:
• Creating a Security/Policy Sentry
• Creating a Behavior Sentry
• Creating an Anomaly Sentry
• Creating a Threshold Sentry
• Creating a Custom Sentry
STRM Users Guide
Page 50
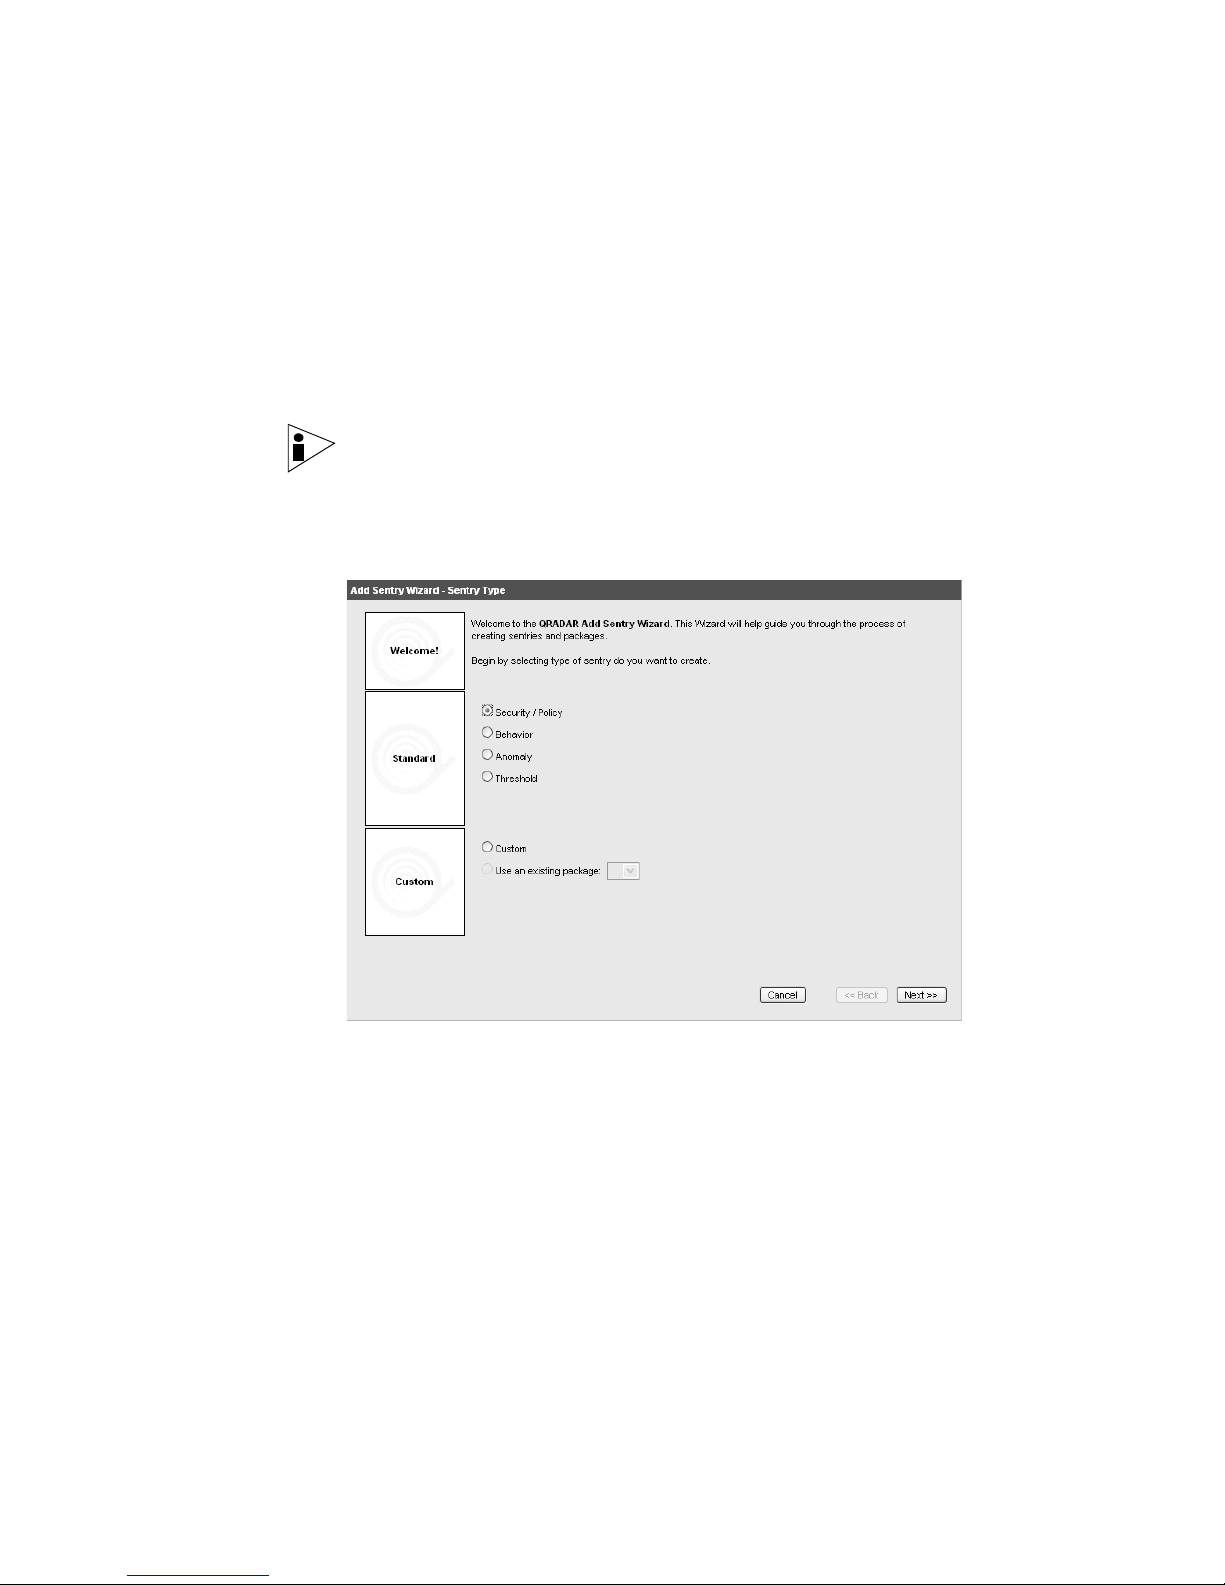
44 MANAGING SENTRIES
Creating a
Security/Policy
Sentry
Step 1 Click the Network Surveillance tab.
Step 2 Navigate to the appropriate view you wish the sentry to apply.
Step 3 Below the graph, click Add Sentry.
A Security/Policy sentry monitors your deployment for any security or policy
offense. To create a Security/Policy sentry:
The Network Surveillance interface appears.
For information on navigating views, see Chapter 3 Managing Your Network
Activity.
Note: You cannot create a sentry in the ByNets view. You must navigate to a
non-related view to create a sentry.
The Add Sentry Wizard appears.
Step 4 Select the Security/Policy option.
The Policy Sentry Parameters window appears.
STRM Users Guide
Page 51
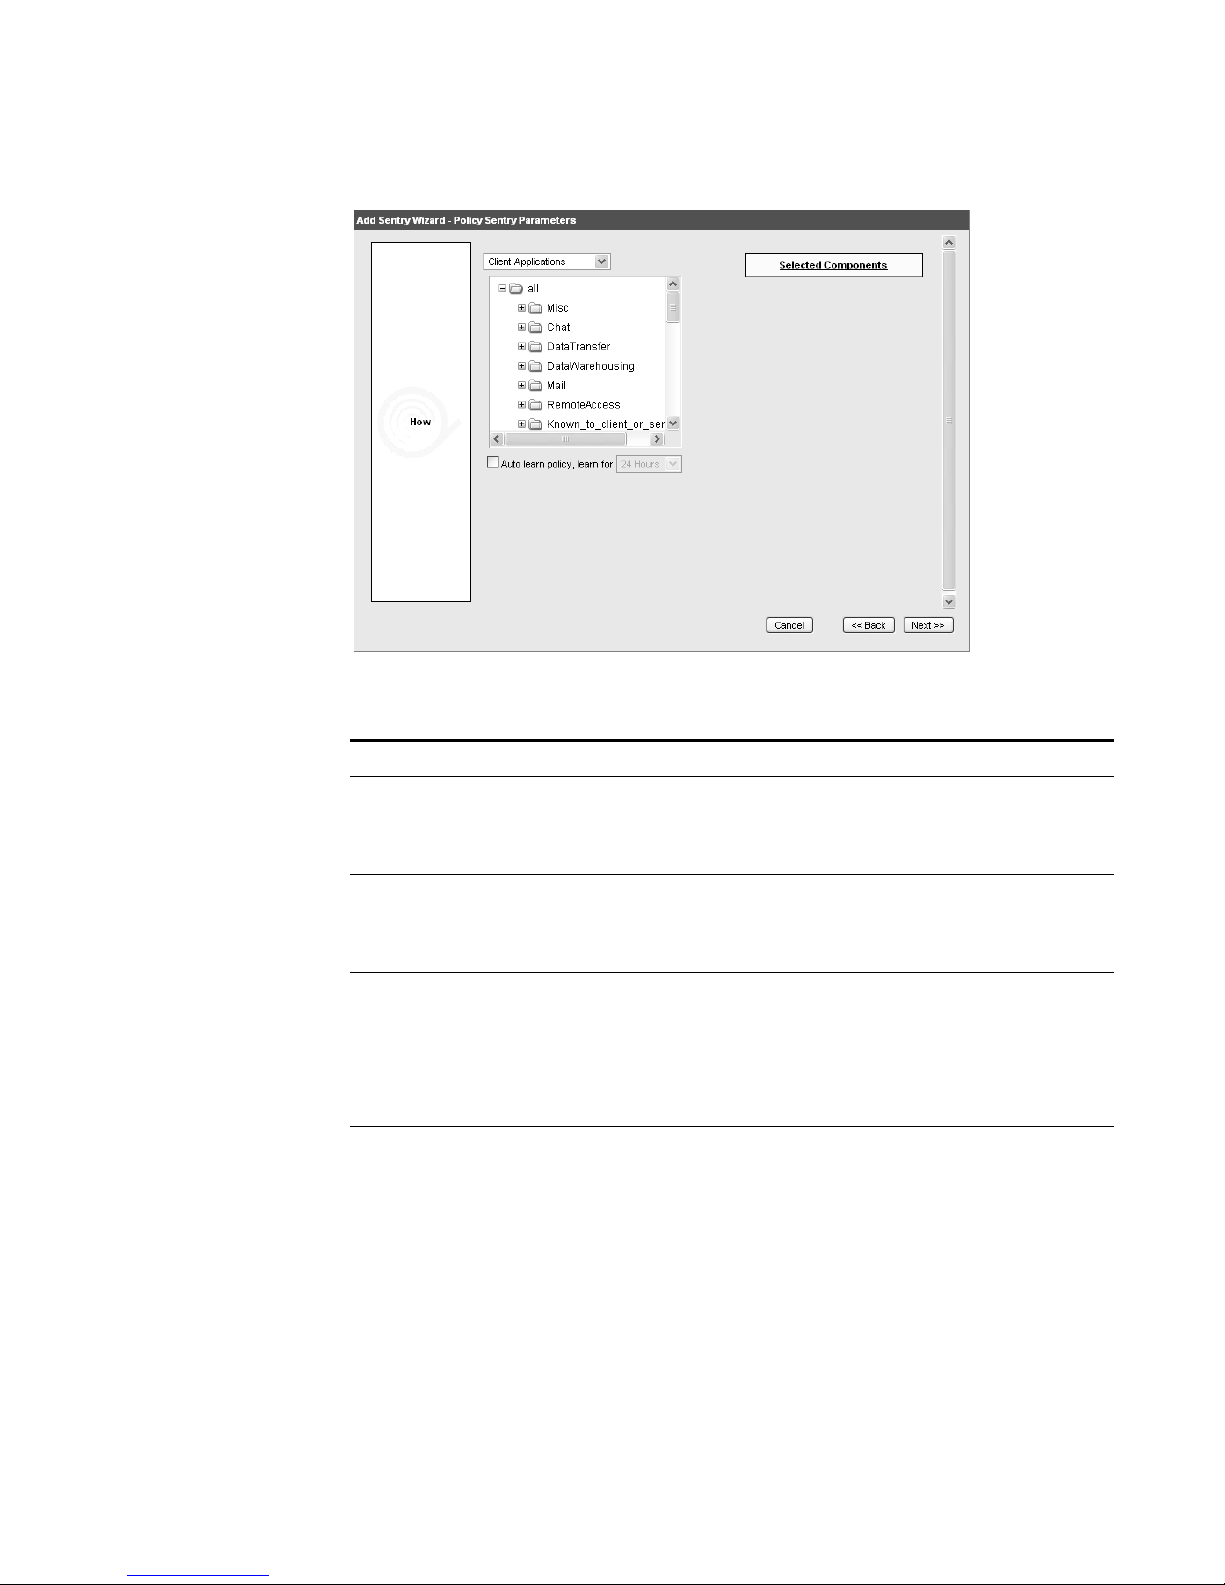
Creating a Sentry 45
Step 5
Enter Values for the Parameters:
Table 4-2 Security/Policy Sentry Parameters
Parameter Action
Objects Using the menu tree, select the view object you wish this
sentry to monitor. This list includes the objects in your
network. All selected objects appear under Selected
Components.
Auto learn policy, learn
for
Select the check box if you wish this sentry to automatically
learn until the configured time. Once the time has expired,
the sentry generates an alert when any object that was not
present during the learning time becomes active.
Date is relevant Select the check box if you wish this sentry to consider the
date. When selected, date fields appear. Enter the relevant
dates you wish this sentry to monitor. By default, the check
box is clear.
Note: This option is only available when the Auto learn
policy, learn for check box is selected.
Day of the week is
relevant
Select the check box if you wish this sentry to consider the
day of the week. When selected, day of the week fields
appear. Using the drop-down list boxes, select the relevant
days you wish this sentry to consider. By default, the check
box is clear.
Note: This option is only available when the Auto learn
policy, learn for check box is selected.
STRM Users Guide
Page 52
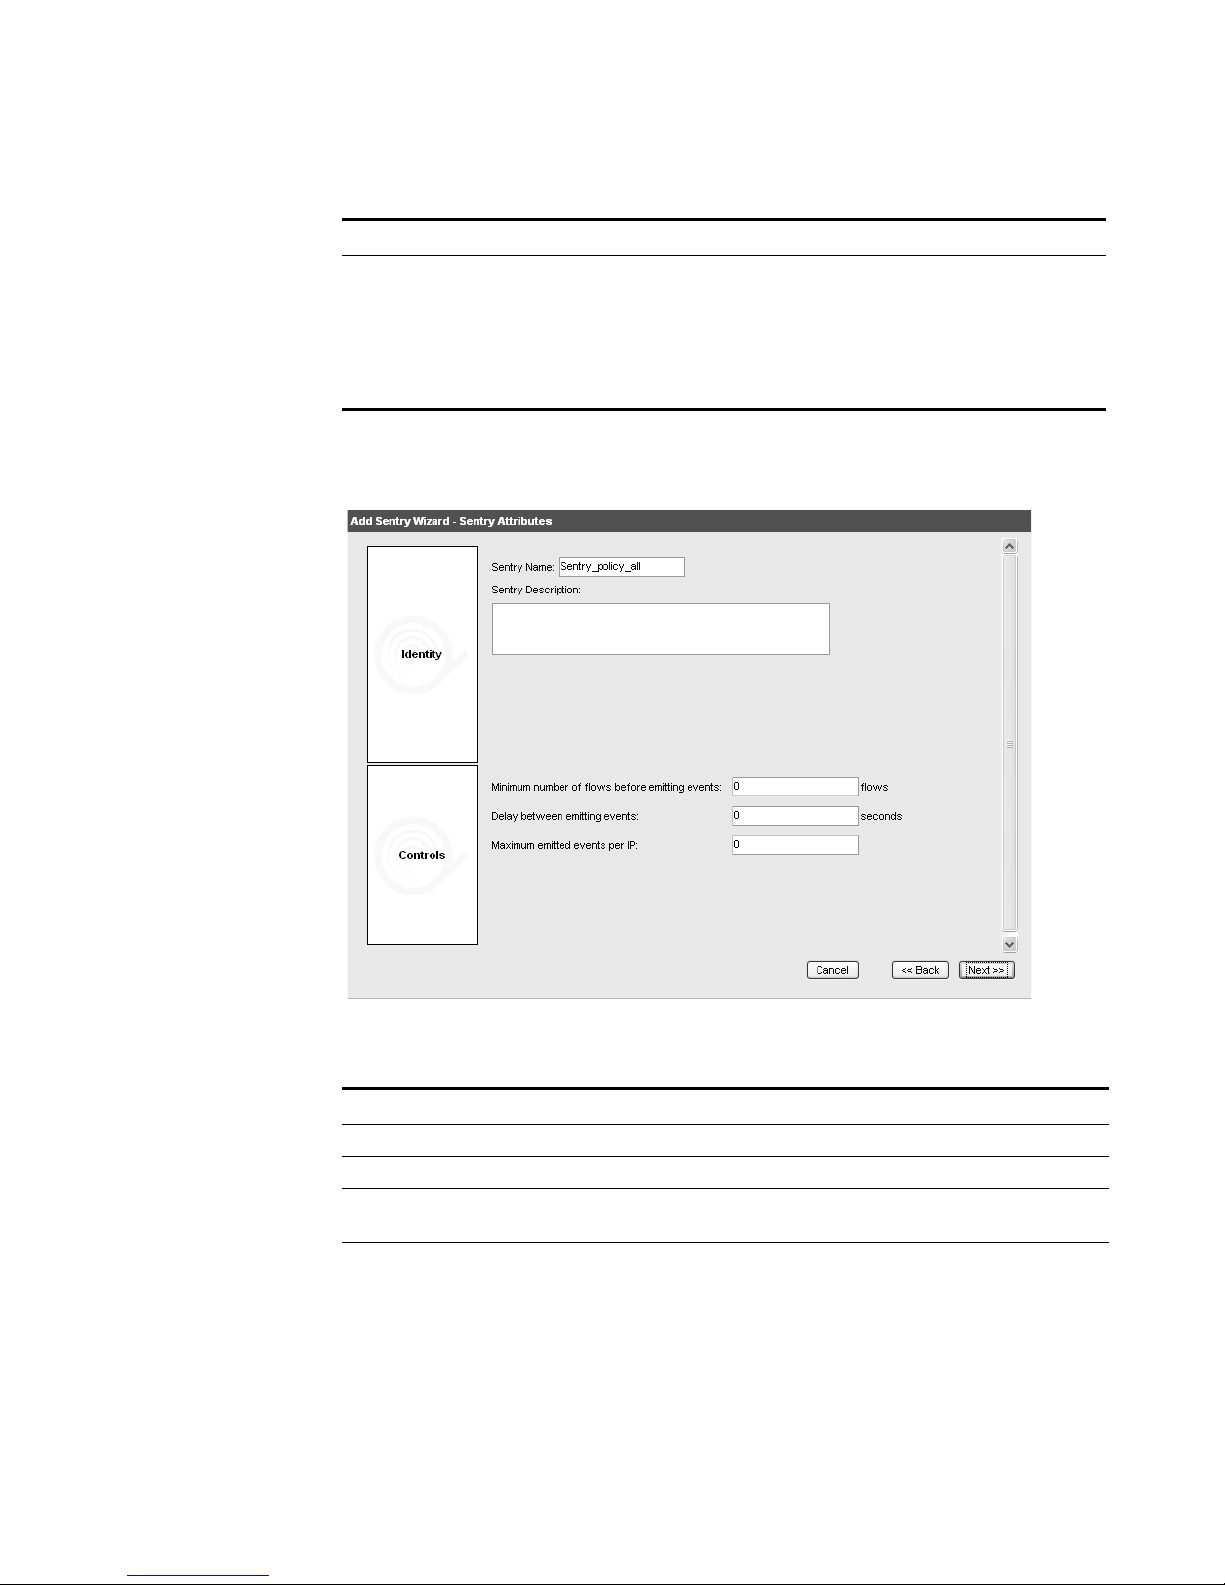
46 MANAGING SENTRIES
Step 6 Click Next.
Table 4-2 Security/Policy Sentry Parameters (continued)
Parameter Action
Time of day is relevant Select the check box if you wish this sentry to consider the
time of day. When selected, the time of day fields appear.
Using the drop-down list box, select the time of day you
wish this sentry to consider.
Note: This option is only available when the Auto learn
policy, learn for check box is selected.
The Sentry Attributes window appears.
Step 7 Enter values for the parameters:
Table 4-3 Sentry Attributes Parameters
Parameter Action
Sentry Name Specify a name you wish to assign this sentry.
Sentry Description Specify a description for this sentry.
Minimum number of flows
before emitting events
Delay between emitting
events
Specify the minimum number of times, in flows, this
activity must occur before an event generates.
Specify the number of seconds, after the first occurrence
of this event, before the next occurrence of this event. For
example, if you set the value to 3, an event generates
after three seconds of the first instance of the event.
STRM Users Guide
Page 53

Table 4-3 Sentry Attributes Parameters (continued)
Parameter Action
Maximum emitted events
per IP
Specify the maximum number of times you wish this event
to generate per IP address. For example, if you set the
maximum alerts to 2, only two events are generated per
attacker IP address.
Sharing Click Share Sentry to access the Select Users window,
which allows you to indicate any users you wish to share
this sentry.
Note: This option is only available when the Auto learn
policy, learn for check box is selected.
Step 8 Click Next.
The Sentry Responses window appears.
Step 9 Choose one of the following options:
a If you selected the auto learn option:
Table 4-4 Sentry Response Parameters
Parameter Sub-Parameter Action
Email Email Subject Specify a subject for the notification e-mail sent by the
sentry engine.
Email
Recipient(s)
Specify the recipient(s) of the notification e-mail sent
by the sentry engine. Separate multiple entries with a
comma.
Format Specify the amount of text included in the e-mail.
Options include: Subject Only, Brief, Detailed - Text,
Detailed - HTML
Creating a Sentry 47
STRM Users Guide
Page 54

48 MANAGING SENTRIES
Table 4-4 Sentry Response Parameters (continued)
Parameter Sub-Parameter Action
Trigger Trigger Script Using the drop-down list box, specify the action you
wish the sentry engine to perform. The options include:
• Trigger Script - Specify if you wish this sentry to
use the following:
SNMP traps - Sentry engine sends an SNMP Trap
notification.
Block IPs - Sentry engine blocks specific IP
addresses.
• Parameters - Specify the parameters required to
trigger either the SNMP trap or to block IP
addresses. Enter parameters in the following
format:
If you are using SNMP version 1:
1 <community> <IP address>
1.3.6.1.4.1. 20212
If you are using SNMP version 2:
2 <community> <IP address>
1.3.6.1.4.1.20212.200.3
Note: These default scripts need to be customized for
proper use in your environment. To edit the script, use
SSH to login to your STRM Console and edit the
scripts in the /opt/qradar/triggerbin directory. For
assistance, contact your local administrator.
Syslog Select the check box if you wish to save the sentry
event log file to the syslog server.
b If you did not select the auto learn option:
Table 4-5 Security/Policy Sentry Response Parameters
Parameter Action
High-Level Category Using the drop-down list box, specify the high-level event
category.
Low-Level Category Using the drop-down list box, specify the low-level event
category.
Ensure the dispatched
event is part of an offense
Address to mark as the
target
Select the check box if you wish this event to be included
with other events to create an offense.
Using the drop-down list box, identify if you wish the
destination or source IP address to be used as the target.
Note: For detailed information on high-level and low-level categories, see the
Event Category Correlation Reference Guide.
Step 10 Click Next.
Step 11 Review the sentry details. Click Finish.
STRM Users Guide
Page 55
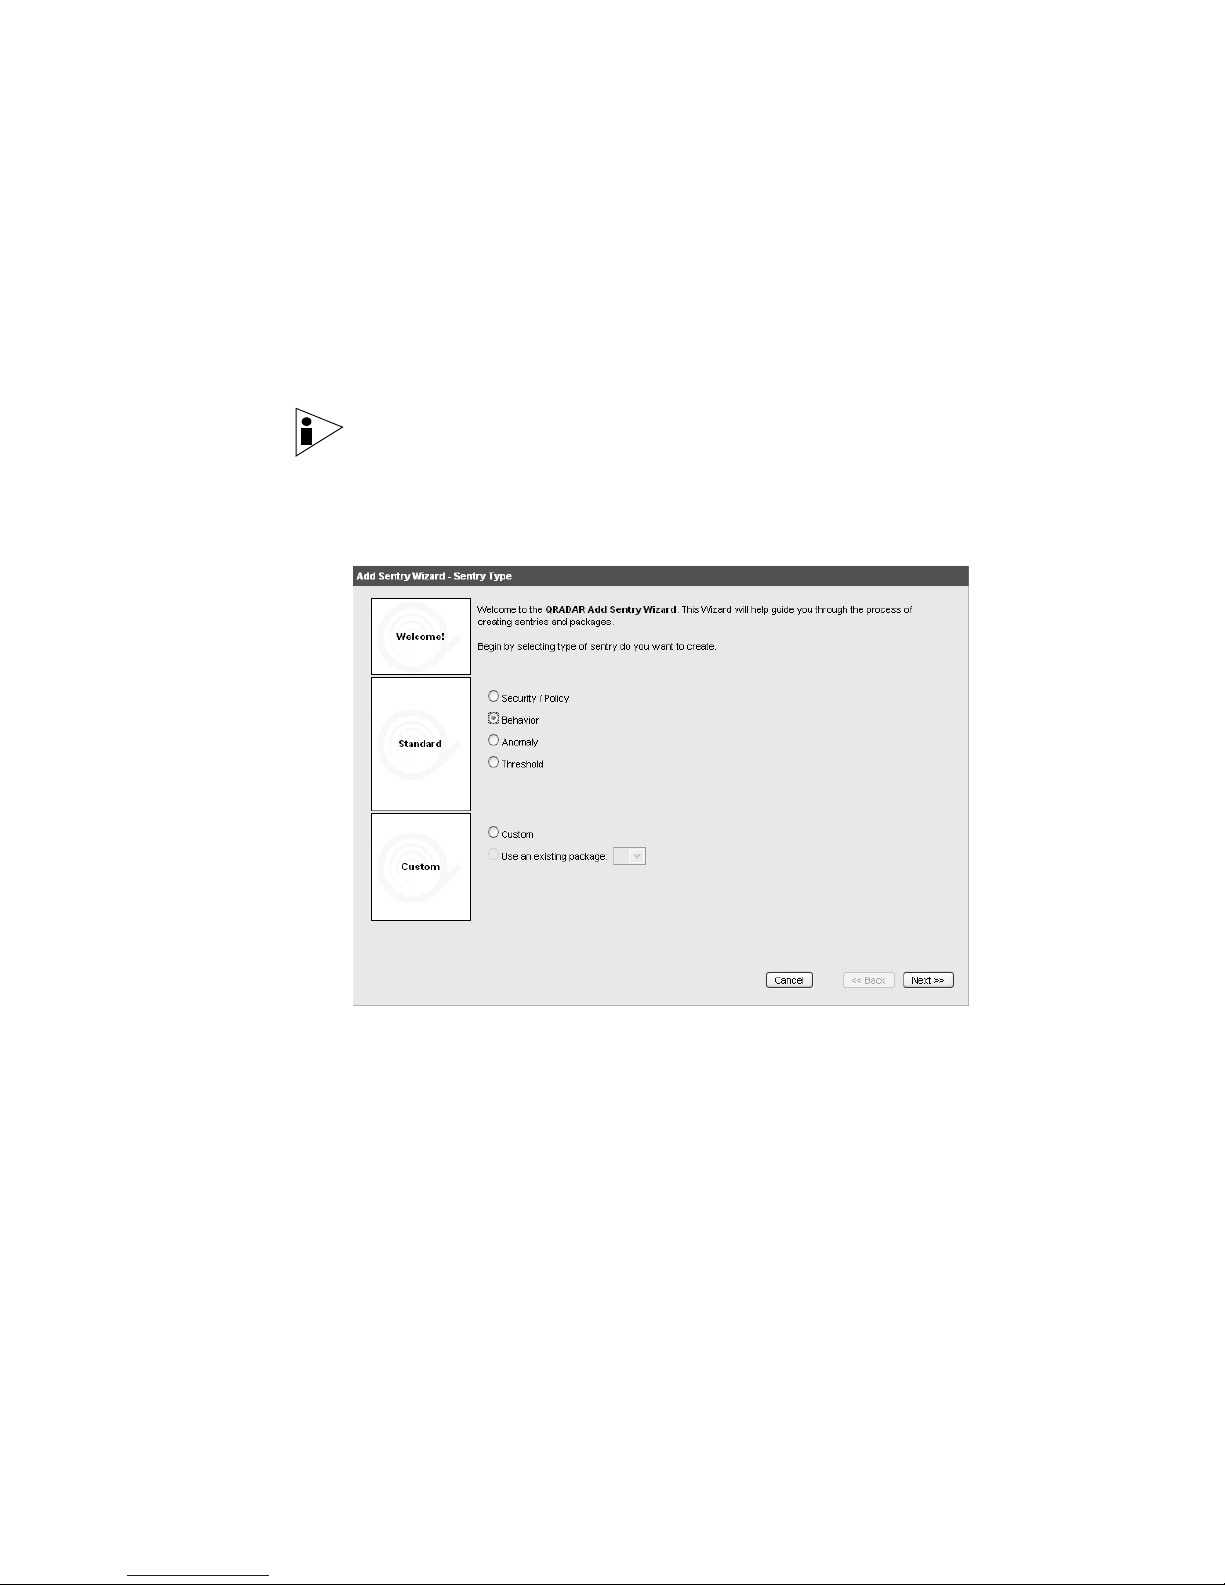
Creating a Sentry 49
Creating a Behavior
Sentry
Step 1 Click the Network Surveillance tab.
Step 2 Navigate to the appropriate view you wish the sentry to apply.
Step 3 Below the graph, click Add Sentry.
A Behavior sentry monitors your network to detect changes in behavior. To create
a behavior sentry:
The Network Surveillance interface appears.
For information on navigating views, see Chapter 3 Managing Your Network
Activity.
Note: You cannot create a sentry in the ByNets view. You must navigate to a
non-related view to create a sentry.
The Add Sentry Wizard appears.
Step 4 Select the Behavior option.
The Sentry Parameters window appears.
STRM Users Guide
Page 56
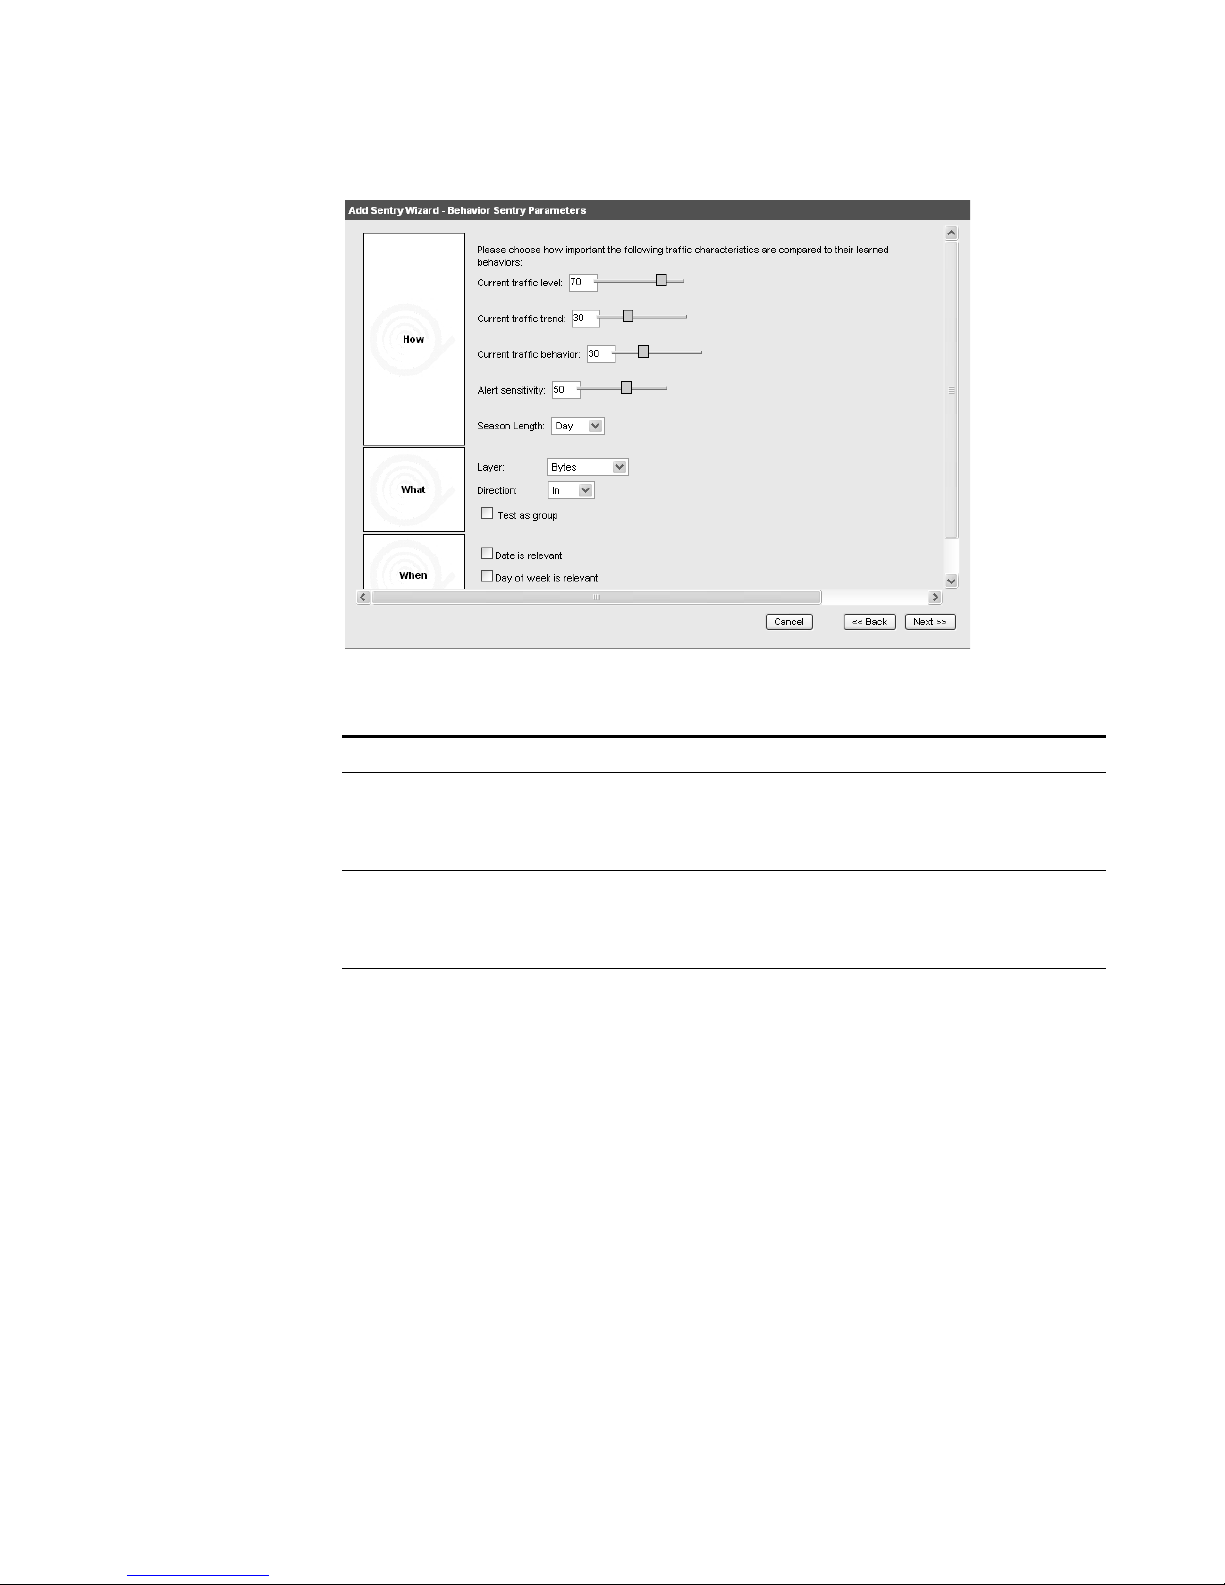
50 MANAGING SENTRIES
Step 5 Enter values for the parameters:
Table 4-6 Behavior Sentry Parameters
Parameter Action
Current traffic level Specify the weight (1 to 100) that you wish to assign to the
current traffic levels against the learned behaviors and the
current trend. The higher the value indicates more weight
on the previously recorded value.
Current traffic trend Specify the weight (1 to 100) that you wish to assign to
current traffic trends against the calculated behavior. The
higher the value indicates more weight on traffic trends
than the calculated behavior.
Current traffic behavior Specify the weight (1 to 100) that you wish to assign to
current traffic behavior against the learned behaviors. The
higher the value indicates more weight on the learned
behavior
STRM Users Guide
Page 57
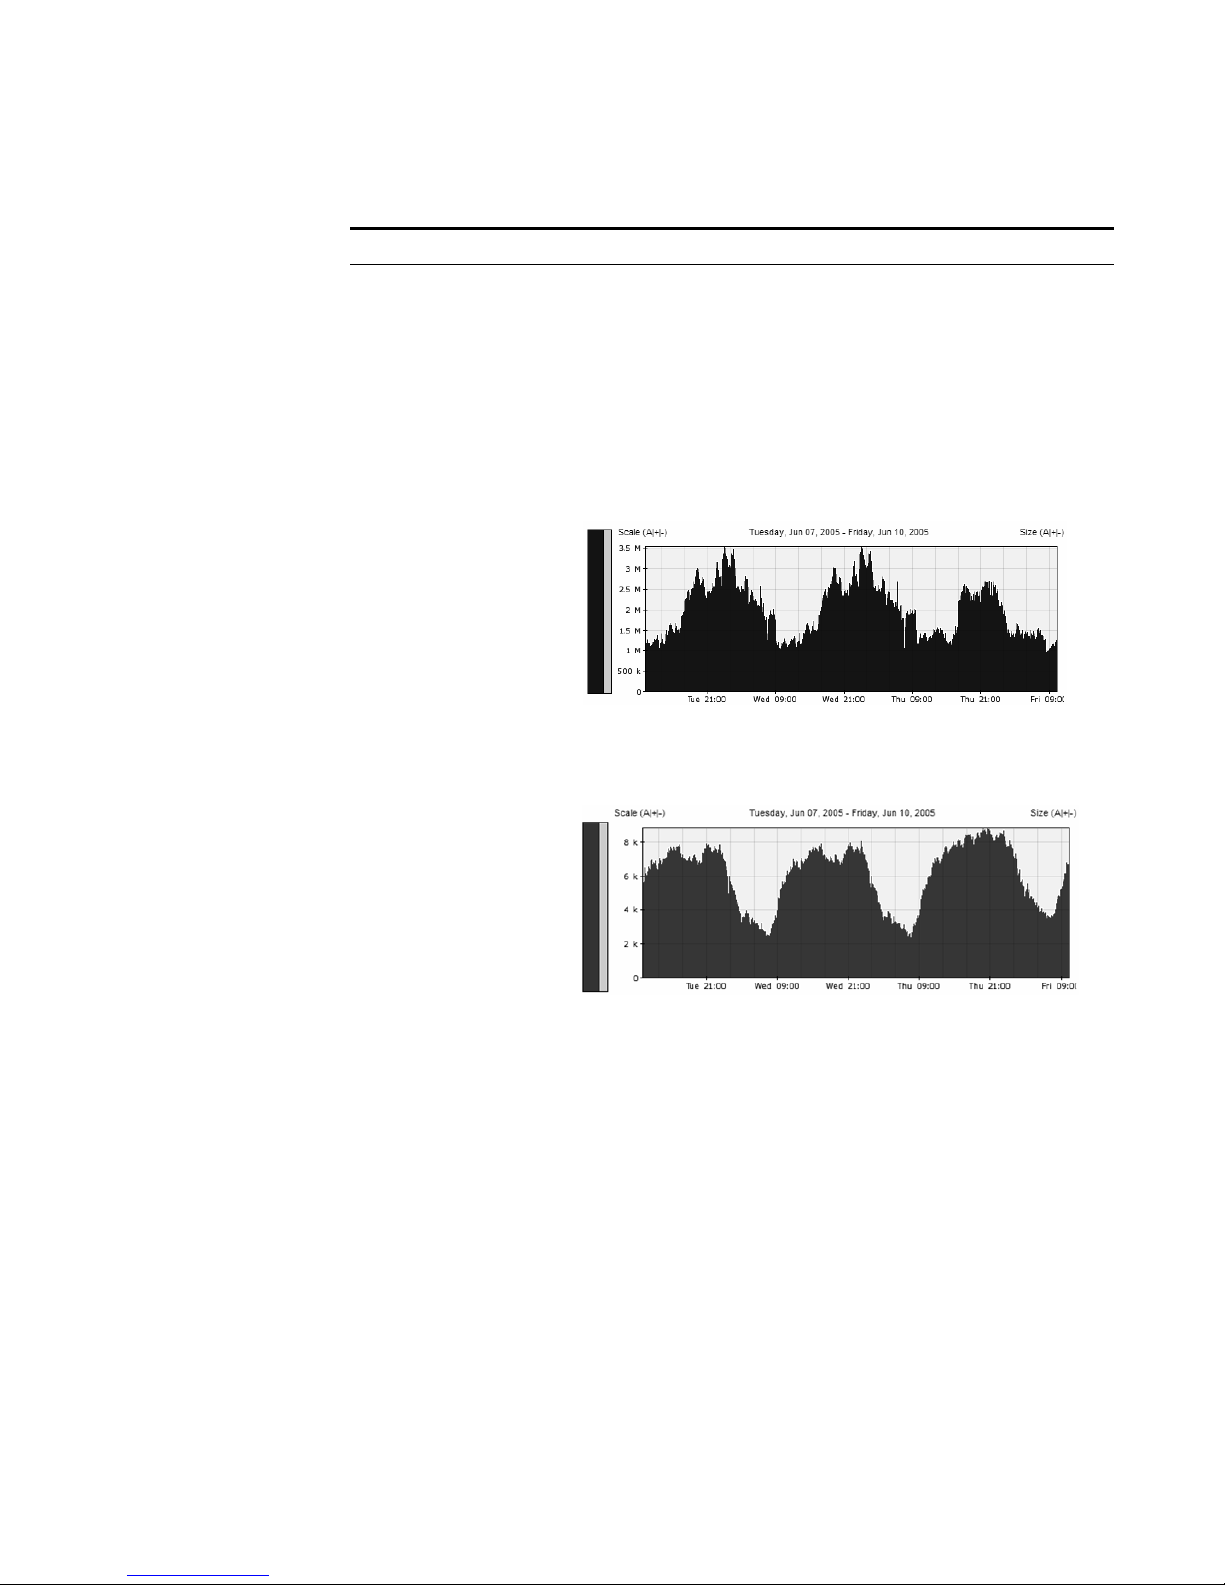
Creating a Sentry 51
Table 4-6 Behavior Sentry Parameters (continued)
Parameter Action
Alert sensitivity Specify the sensitivity (1 to 100) level for this alert. This
level indicates how far outside the predicted values before
a violation generates. A value of 1 indicates the measured
value cannot be outside the predicted value and a value of
100 indicates the traffic is more than four times larger than
the predicted value.
For example, the level of alert sensitivity depends on the
traffic experienced by your network. If your network is
noisy, as shown in the graph below, you may wish to set
your sensitivity to a higher level.
If your network displays consistent traffic, as shown below,
you may wish to configure the alert sensitivity to a lower
level.
STRM Users Guide
Page 58
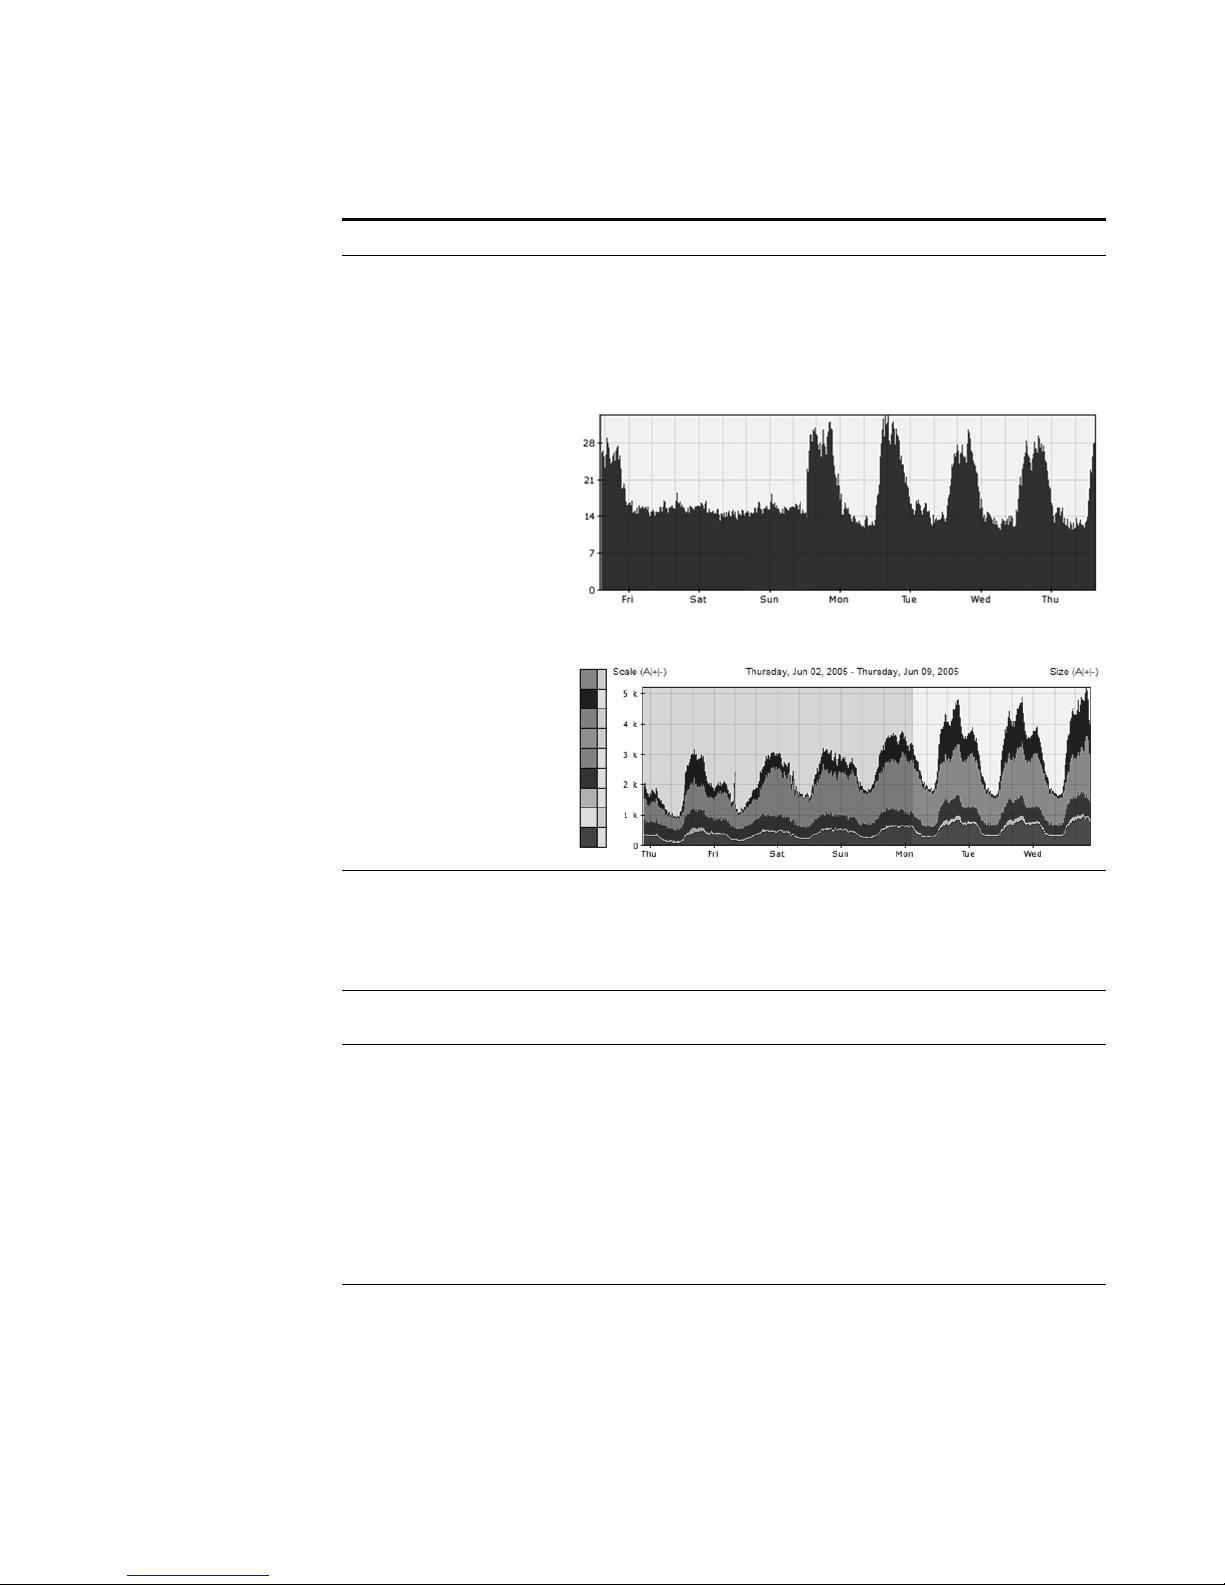
52 MANAGING SENTRIES
Table 4-6 Behavior Sentry Parameters (continued)
Parameter Action
Season length Specify the length of time you wish this sentry to consider a
season. A season indicates the cycle of data, which STRM
uses to determine future data flow.
For example, the below graph shows that traffic is low on
the weekend but peaks regularly during the week.
The below graph shows traffic that cycles on a daily basis.
Layer Specifies the property and measurement used in the Y-axis
of the Network Surveillance graph. The current value being
used to draw the graphs is displayed in red in the Layers
console. The values that can be used include bytes,
packets, number of hosts, and others.
Direction Specify the direction of traffic you wish this sentry to
monitor. The options are In, Out, or Both.
Test as group Select the check box if you wish all objects to add together
to be tested. Clear the check box if you wish each object to
be evaluated seperately.
For a Behavior sentry, your network may include seasonal
and non-seasonal objects. We recommend that you
remove all non-seasonal traffic if you wish all objects to be
tested independently. If the amounts of non-seasonal traffic
in your network is very small (less than 1%) compared to
the seasonal traffic, you do not have to remove the
non-seasonal traffic.
Date is relevant Select the check box if you wish this sentry to consider
date. When selected, date fields appear. Enter the relevant
dates you wish this sentry to monitor. By default, the check
box is clear.
STRM Users Guide
Page 59
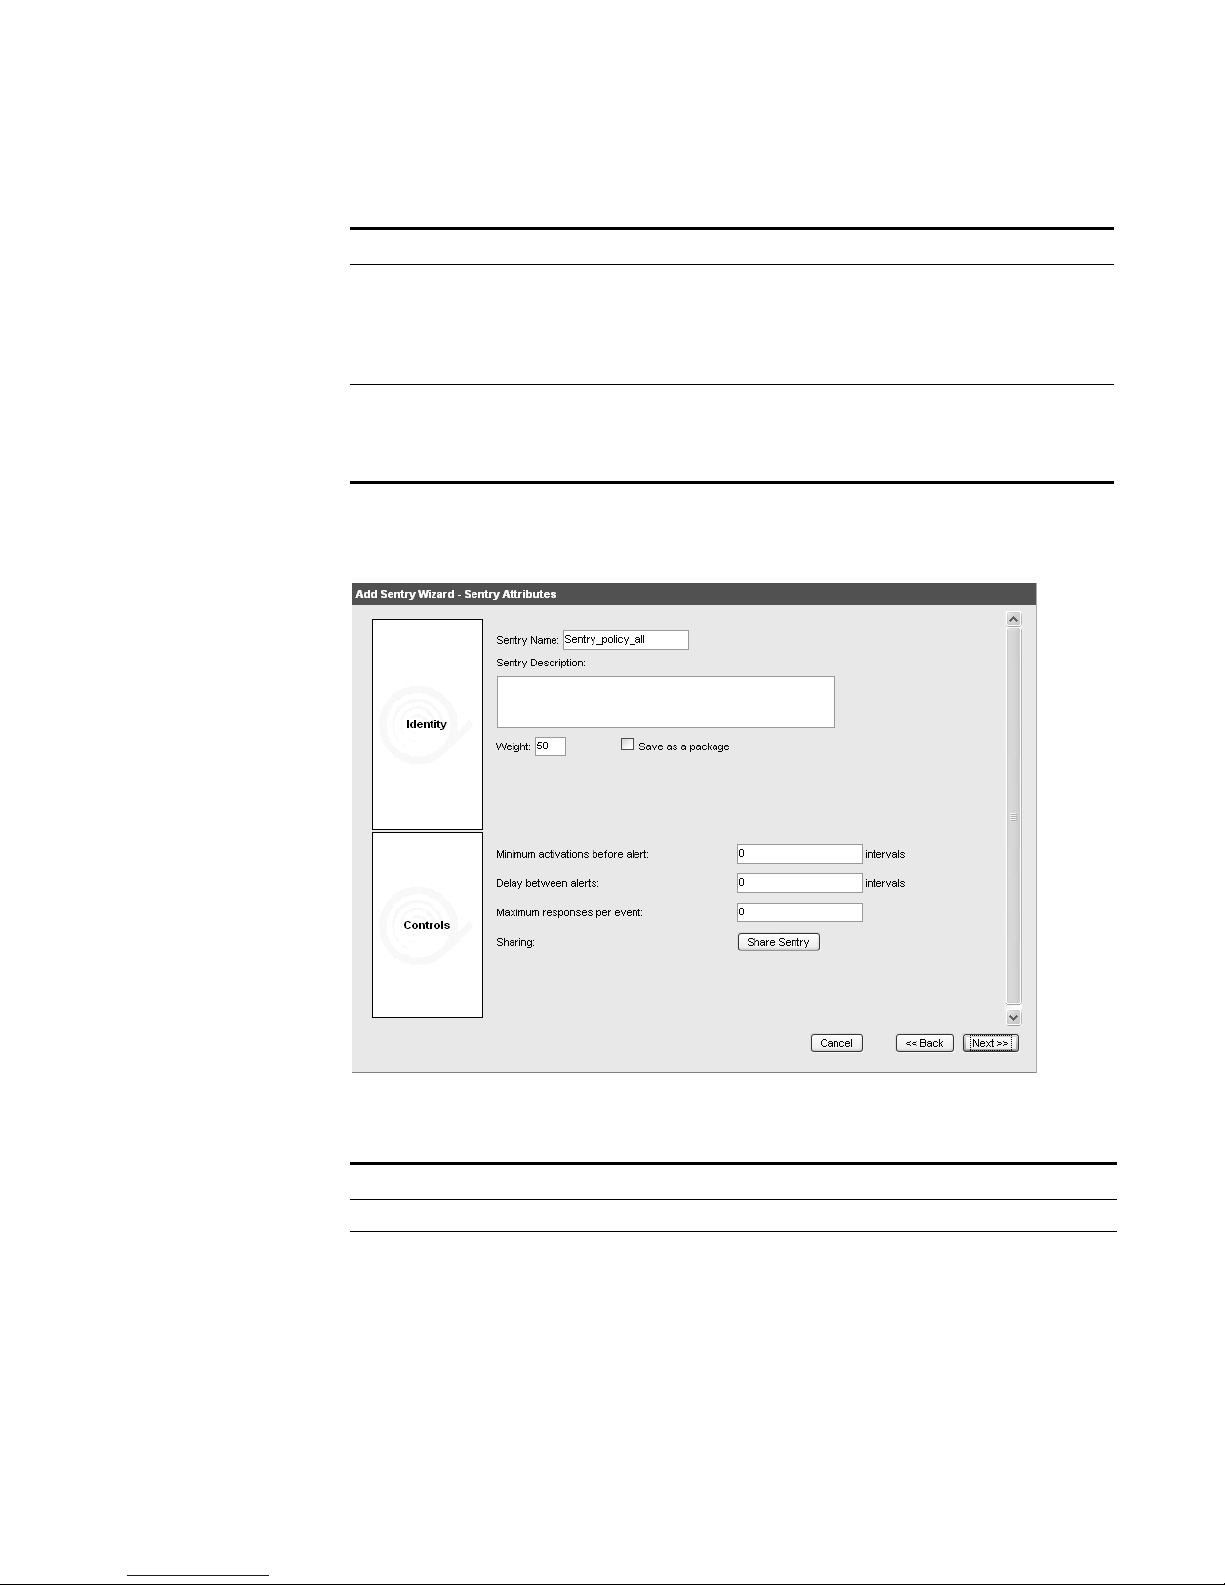
Creating a Sentry 53
Table 4-6 Behavior Sentry Parameters (continued)
Parameter Action
Day of the week is
relevant
Select the check box if you wish this sentry to consider the
day of the week. When selected, day of the week fields
appear. Using the drop-down list boxes, select the relevant
days you wish this sentry to consider. By default, the check
box is clear.
Time of day is relevant Select the check box if you wish this sentry to consider the
time of day. When selected, the time of day fields appear.
Using the drop-down list box, select the time of day you
wish this sentry to consider.
Step 6
Click Next.
The Sentry Attributes window appears.
Step 7 Enter values for the parameters:
Table 4-7 Sentry Attributes Parameters
Parameter Action
Sentry Name Specify a name you wish to assign this sentry.
Sentry Description Specify a description for this sentry.
STRM Users Guide
Page 60

54 MANAGING SENTRIES
Table 4-7 Sentry Attributes Parameters (continued)
Parameter Action
Weight Specify the relative importance of this sentry. This
determines the ranking that the generated event displays
in the Offense Manager.
STRM uses the following formula to calculate the weight:
((sentry weight + network weight + object weight)/3/time
difference
Where time difference is:
1 + (second since the sentry alerted / 10,000,000,000)
Save as package Select the check box if you wish to save this sentry as a
package to use with other sentries. By default, the check
box is clear. Specify the following:
• Package Name - Specify the name you wish to assign
to this package.
• Package Description - Specify a description for the
package.
• Share Package - Click Share Package to share this
package with other STRM users.
Minimum Activations
Before Alert
Specify the minimum number of times you wish this
activity to occur before an alert generates.
We recommend that you specify at least six activations
before alert.
Delay Between Alerts Specify the number of intervals, after of the first
occurrence of this alert, before the next occurrence of this
event.
Maximum responses per
event
Specify the maximum number of times you wish this event
to generate.
If you set the Delay Between Alerts parameter to 0 and
the Maximum responses per event to 1, only one alert
generates per event.
Sharing Click Share Sentry to access the Select Users window,
which allows you to indicate any users you wish to share
this sentry.
Step 8 Click Next.
The Sentry Responses window appears.
Step 9 Enter values for the parameters:
Table 4-8 Sentry Response Parameters
Parameter Sub-Parameter Action
Email Email Subject Specify a subject for the notification e-mail sent by the
sentry engine.
STRM Users Guide
Page 61

Creating a Sentry 55
Table 4-8 Sentry Response Parameters (continued)
Parameter Sub-Parameter Action
Email
Recipient(s)
Specify the recipient(s) of the notification e-mail sent
by the sentry engine. Separate multiple entries with a
comma.
Format Specify the amount of text included in the e-mail.
Options include: Subject Only, Brief, Detailed - Text,
Detailed - HTML.
Trigger Trigger Script Using the drop-down list box, specify the action you
wish the sentry engine to perform. The options include:
• Trigger Script - Specify if you wish this sentry to
use the following:
SNMP traps - Sentry engine sends an SNMP Trap
notification.
Block IPs - Sentry engine blocks specific IP
addresses.
• Parameters - Specify the parameters required to
trigger either the SNMP trap or to block IP
addresses. Enter parameters in the following
format:
If you are using SNMP version 1:
1 <community> <IP address>
1.3.6.1.4.1. 20212
If you are using SNMP version 2:
2 <community> <IP address>
1.3.6.1.4.1.20212.200.3
Note: These default scripts need to be customized for
proper use in your environment. To edit the script, use
SSH to login to your STRM Console and edit the
scripts in the /opt/qradar/triggerbin directory. For
assistance, contact your local administrator.
Syslog Select the check box if you wish to save the sentry
event log file to the syslog server.
Step 10
Step 11 Review the sentry details. Click Finish.
Click Next.
STRM Users Guide
Page 62
56 MANAGING SENTRIES
Creating an Anomaly
Sentry
Step 1 Click the Network Surveillance tab.
Step 2 Navigate to the appropriate view you wish the sentry to apply.
An anomaly sentry monitors your deployment for any abnormal activity. This sentry
generates an alert in one of the following situations:
• If a consistently inactive object becomes active.
• If a consistently active object becomes inactive.
• If an object is consistently active, a certain percentage of the time experiences
a change in activity.
For example, if you configure an Anomaly sentry with the following values:
• Large Window: 1 Day
• Small Window: 1 Hour
• Percent change required to alert: 50
• Condition for alert: 25% + 12.5% = 37.5%
If the SSH server is typically used for 15 minutes out of every hour and the server
becomes active for more than 22.5 minutes in an hour, an alert generates.
To create an anomaly sentry:
The Network Surveillance interface appears.
For information on navigating views, see Chapter 3 Managing Your Network
Activity.
Note: You cannot create a sentry in the ByNets view. You must navigate to a
non-related view to create a sentry.
Step 3 Below the graph, click Add Sentry.
The Add Sentry Wizard appears.
STRM Users Guide
Page 63
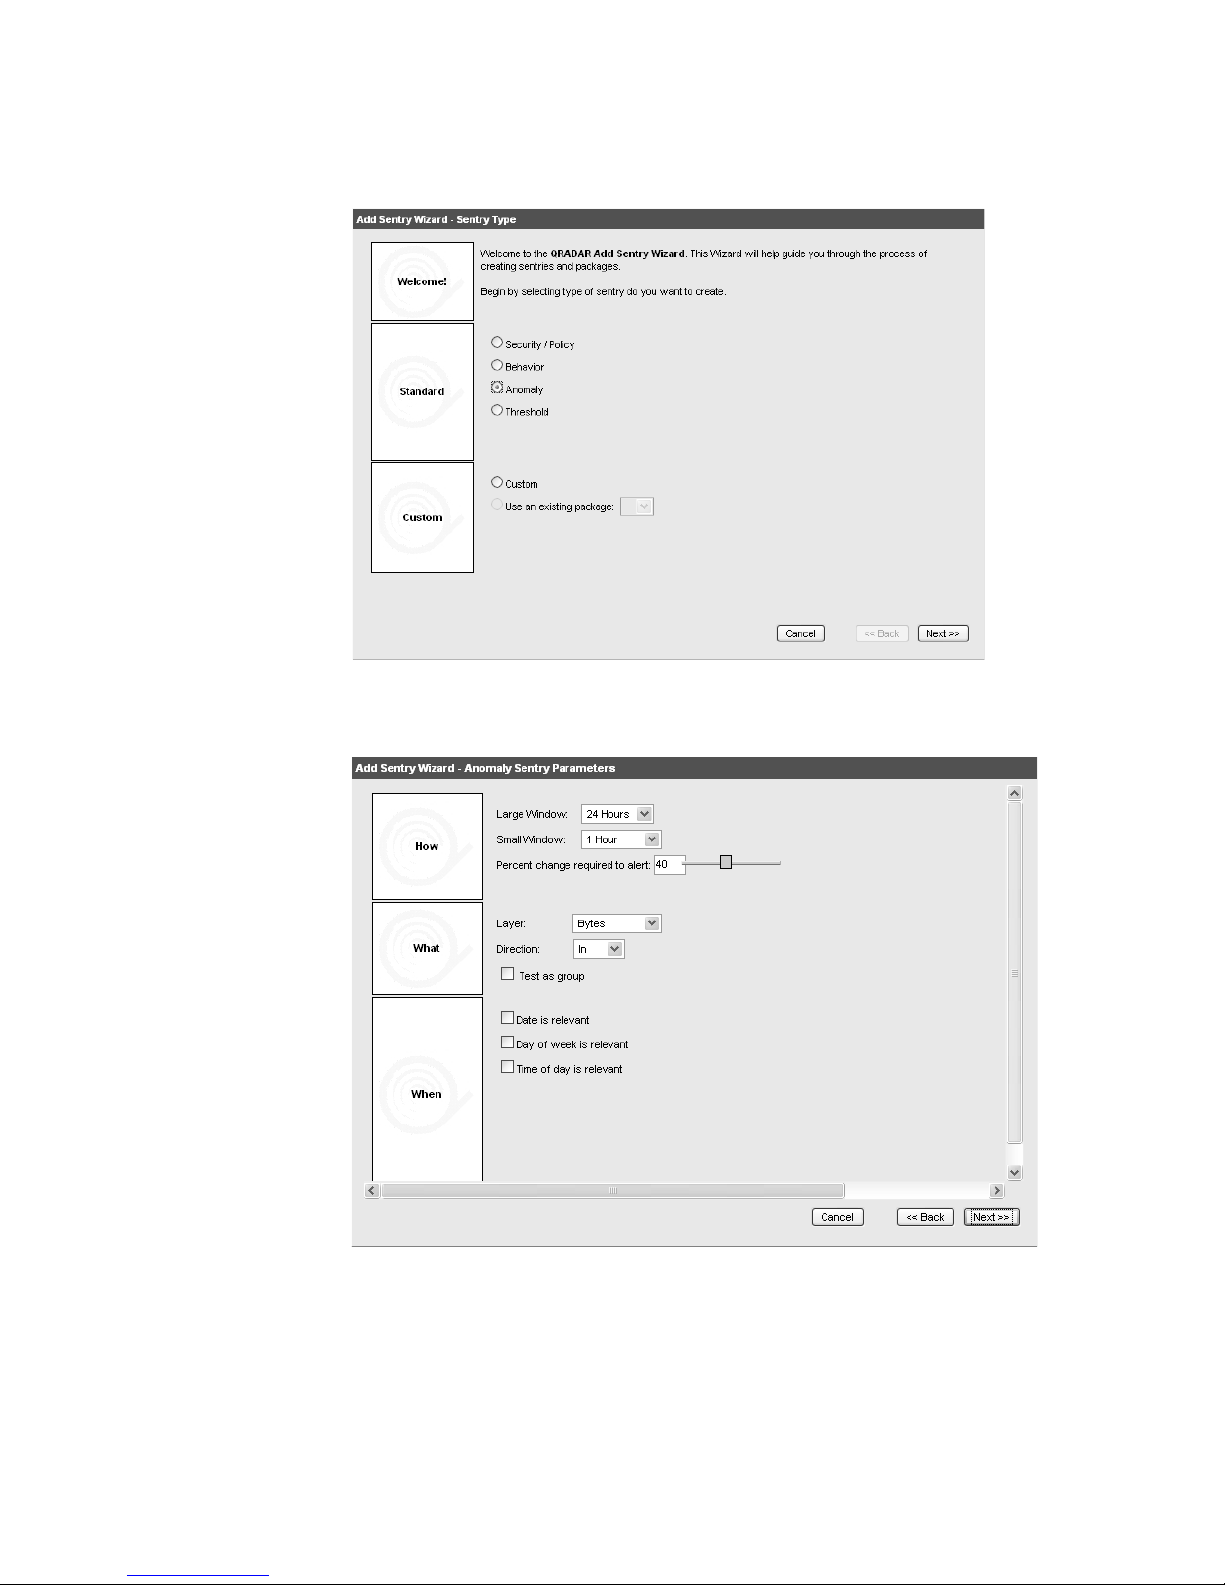
Creating a Sentry 57
Step 4
Select the Anomaly option. Click Next.
The Sentry Parameters window appears.
Step 5 Enter values for the parameters:
STRM Users Guide
Page 64

58 MANAGING SENTRIES
Table 4-9 Anomaly Sentry Parameters
Parameter Action
Large Window Specify an extended period of time you wish the system to
monitor flows in your network. This allows the system a
basis of comparison for traffic over an extended period of
time. If the large window and small window values exceed
a certain threshold, the sentry generates an alert.
We recommend that you include at least two cycles for
comparison. For example, if your network is experiences
high traffic volume during the day but less traffic at night,
you should set this parameter to at least two cycles for
comparison.
Small Window Specify a period of time you wish the system to monitor
flows in your network. This allows the system a basis of
comparison for traffic over an smaller period of time. If the
large window and small window values exceed a certain
threshold, the sentry generates an alert.
We recommend that you set the small window to at least
twice as large as a typical burst of traffic. For example, if
your network experiences bursts of traffic that exist for 30
minutes, set this value to at least 1 hour.
Percent change
required to alert
Specify the percentage change in behavior this view must
experience before the sentry generates an alert. For a low
activity network, set this value to a high value. For a high
activity network, set this to a low percentage value.
Layer Specifies the property and measurement used in the Y-axis
of the Network Surveillance graphs. The current value
being used to draw the graphs is displayed in red in the
Layers console. The values that can be used include bytes,
packets, number of hosts, and others.
Direction Specify the direction of traffic you wish this sentry to
monitor. The options are In, Out, or Both.
Test as group Select the check box if you wish all objects to add together
to be tested. For example, when selected, the top line of
the graph is evaluated as a group. If the check box is clear,
you wish all objects to be tested independently.
Date is relevant Select the check box if you wish this sentry to consider
date. When selected, date fields appear. Enter the relevant
dates you wish this sentry to monitor. By default, the check
box is clear.
Day of week is relevant Select the check box if you wish this sentry to consider the
day of the week. When selected, the day of the week fields
appear. Using the drop-down list boxes, select the relevant
days you wish this sentry to consider. By default, the check
box is clear.
Time of day is relevant Select the check box if you wish this sentry to consider the
time of day. When selected, the time of day fields appear.
Using the drop-down list box, select the time of day you
wish this sentry to consider.
STRM Users Guide
Page 65
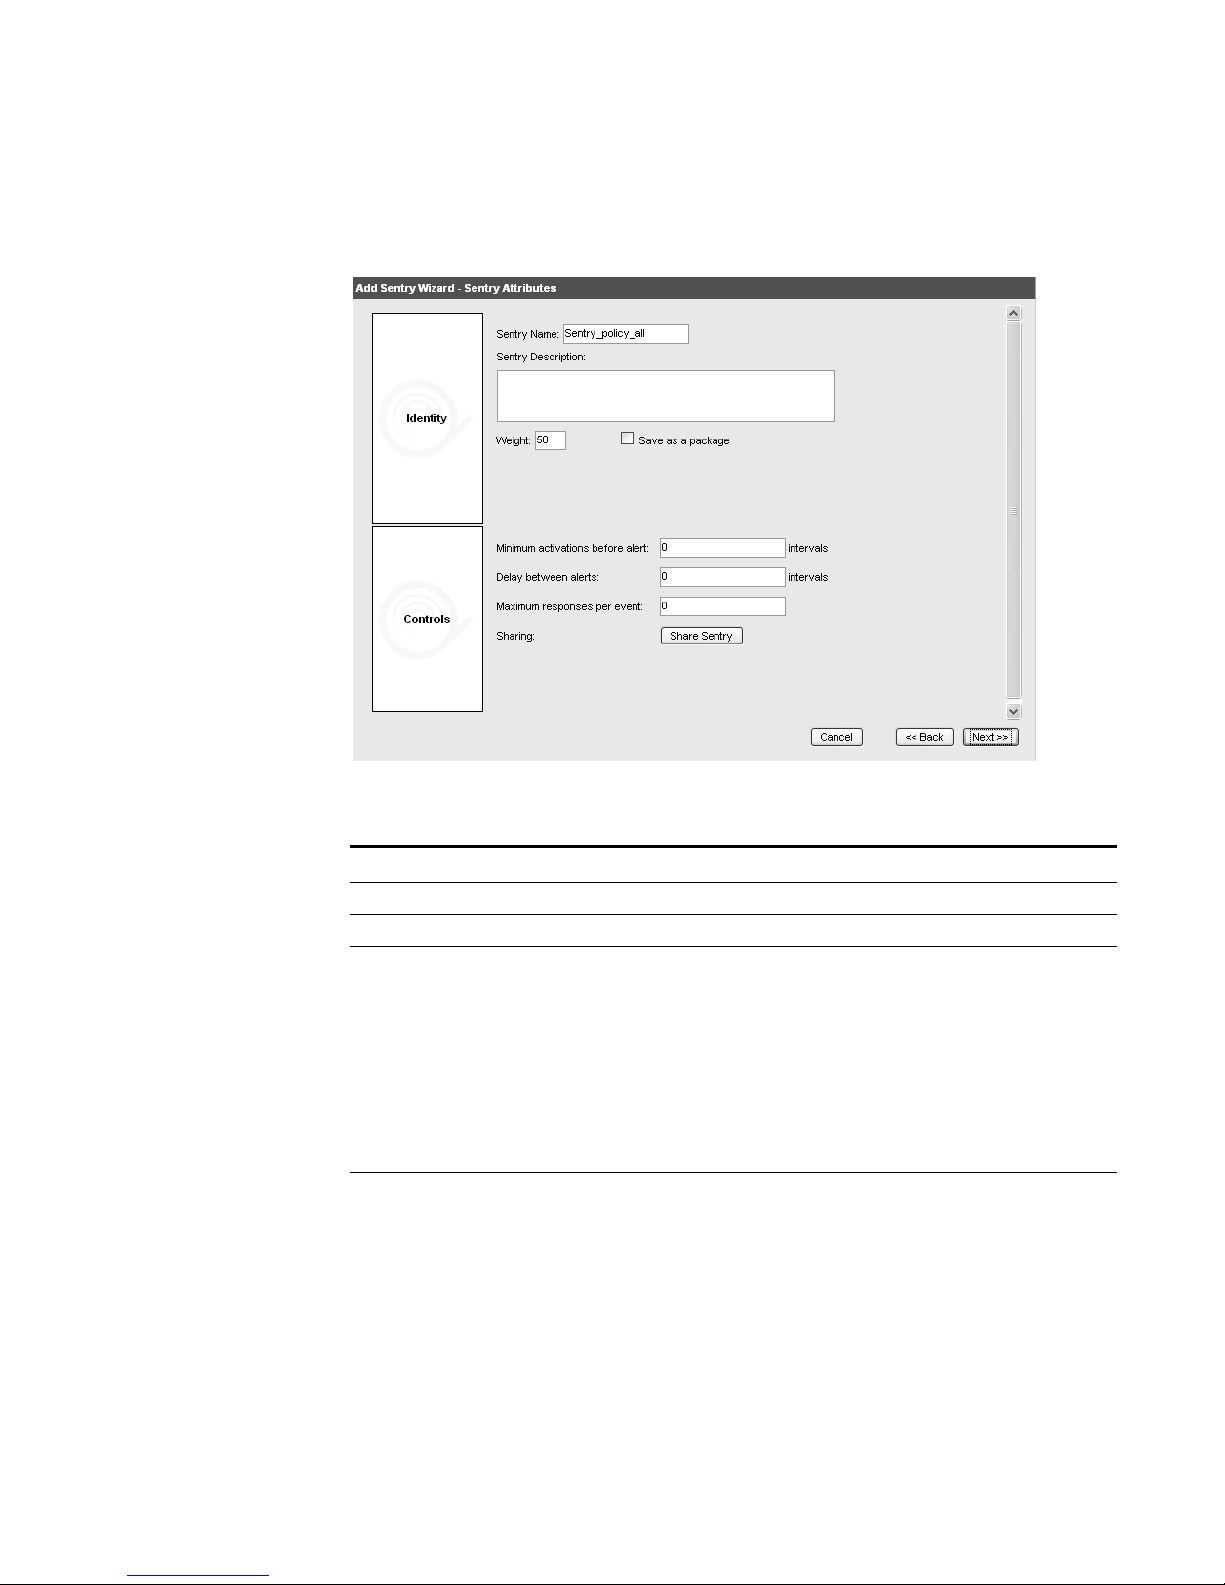
Creating a Sentry 59
Step 6
Click Next.
The Sentry Attributes window appears.
Step 7 Enter values for the parameters:
Table 4-10 Sentry Attributes Parameters
Parameter Action
Sentry Name Specify a name you wish to assign this sentry.
Sentry Description Specify a description for this sentry.
Weight Specify the relative importance of this sentry. This
determines the ranking that the generated event displays
in the Offense Manager.
STRM uses the following formula to calculate the weight:
((sentry weight + network weight + object weight)/3/time
difference
Where time difference is:
1 + (second since the sentry alerted / 10,000,000,000)
Save as package Select the check box if you wish to save this sentry as a
package to use with other sentries. By default, the check
box is clear. Specify the following:
• Package Name - Specify the name you wish to assign
to this package.
• Package Description - Specify a description for the
package.
• Share Package - Click Share Package to share this
package with other STRM users.
STRM Users Guide
Page 66

60 MANAGING SENTRIES
Step 8 Click Next.
Table 4-10 Sentry Attributes Parameters (continued)
Parameter Action
Minimum Activations
Before Alert
Specify the minimum number of times you wish this
activity to occur before an alert generates.
We recommend that you specify at least four activations
before alert.
Delay Between Alerts Specify the number of intervals, after of the first
occurrence of this alert, before the next occurrence of this
event.
Maximum responses per
event
Specify the maximum number of times you wish this event
to generate.
If you set the Delay Between Alerts parameter to 0 and
the Maximum responses per event to 1, only one alert
generates per event.
Sharing Click Share Sentry to access the Select Users window,
which allows you to indicate any users you wish to share
this sentry.
The Sentry Responses window appears.
Step 9 Enter values for the parameters:
Table 4-11 Sentry Response Parameters
Parameter Sub-Parameter Action
Email Email Subject Specify a subject for the notification e-mail sent by the
sentry engine.
Email
Recipient(s)
Specify the recipient(s) of the notification e-mail sent
by the sentry engine. Separate multiple entries with a
comma.
Format Specify the amount of text included in the e-mail.
Options include: Subject Only, Brief, Detailed - Text,
Detailed - HTML
STRM Users Guide
Page 67

Creating a Sentry 61
Table 4-11 Sentry Response Parameters (continued)
Parameter Sub-Parameter Action
Trigger Trigger Script Using the drop-down list box, specify the action you
wish the sentry engine to perform. The options include:
• Trigger Script - Specify if you wish this sentry to
use the following:
SNMP traps - Sentry engine sends an SNMP Trap
notification.
Block IPs - Sentry engine blocks specific IP
addresses.
• Parameters - Specify the parameters required to
trigger either the SNMP trap or to block IP
addresses. Enter parameters in the following
format:
If you are using SNMP version 1:
1 <community> <IP address>
1.3.6.1.4.1. 20212
If you are using SNMP version 2:
2 <community> <IP address>
1.3.6.1.4.1.20212.200.3
Note: These default scripts need to be customized for
proper use in your environment. To edit the script, use
SSH to login to your STRM Console and edit the
scripts in the /opt/qradar/triggerbin directory. For
assistance, contact your local administrator.
Syslog Select the check box if you wish to save the sentry
event log file to the syslog server.
Step 10
Step 11 Review the sentry details. Click Finish.
Creating a Threshold
Sentry
Step 1 Click the Network Surveillance tab.
Step 2 Navigate to the appropriate view you wish the sentry to apply.
Click Next.
A Threshold sentry monitors your deployment for activity that exceeds the
configured threshold of the sentry.
To create a threshold sentry:
The Network Surveillance interface appears.
For information on navigating views, see Chapter 3 Managing Your Network
Activity.
Note: You cannot create a sentry in the ByNets view. You must navigate to a
non-related view to create a sentry.
STRM Users Guide
Page 68
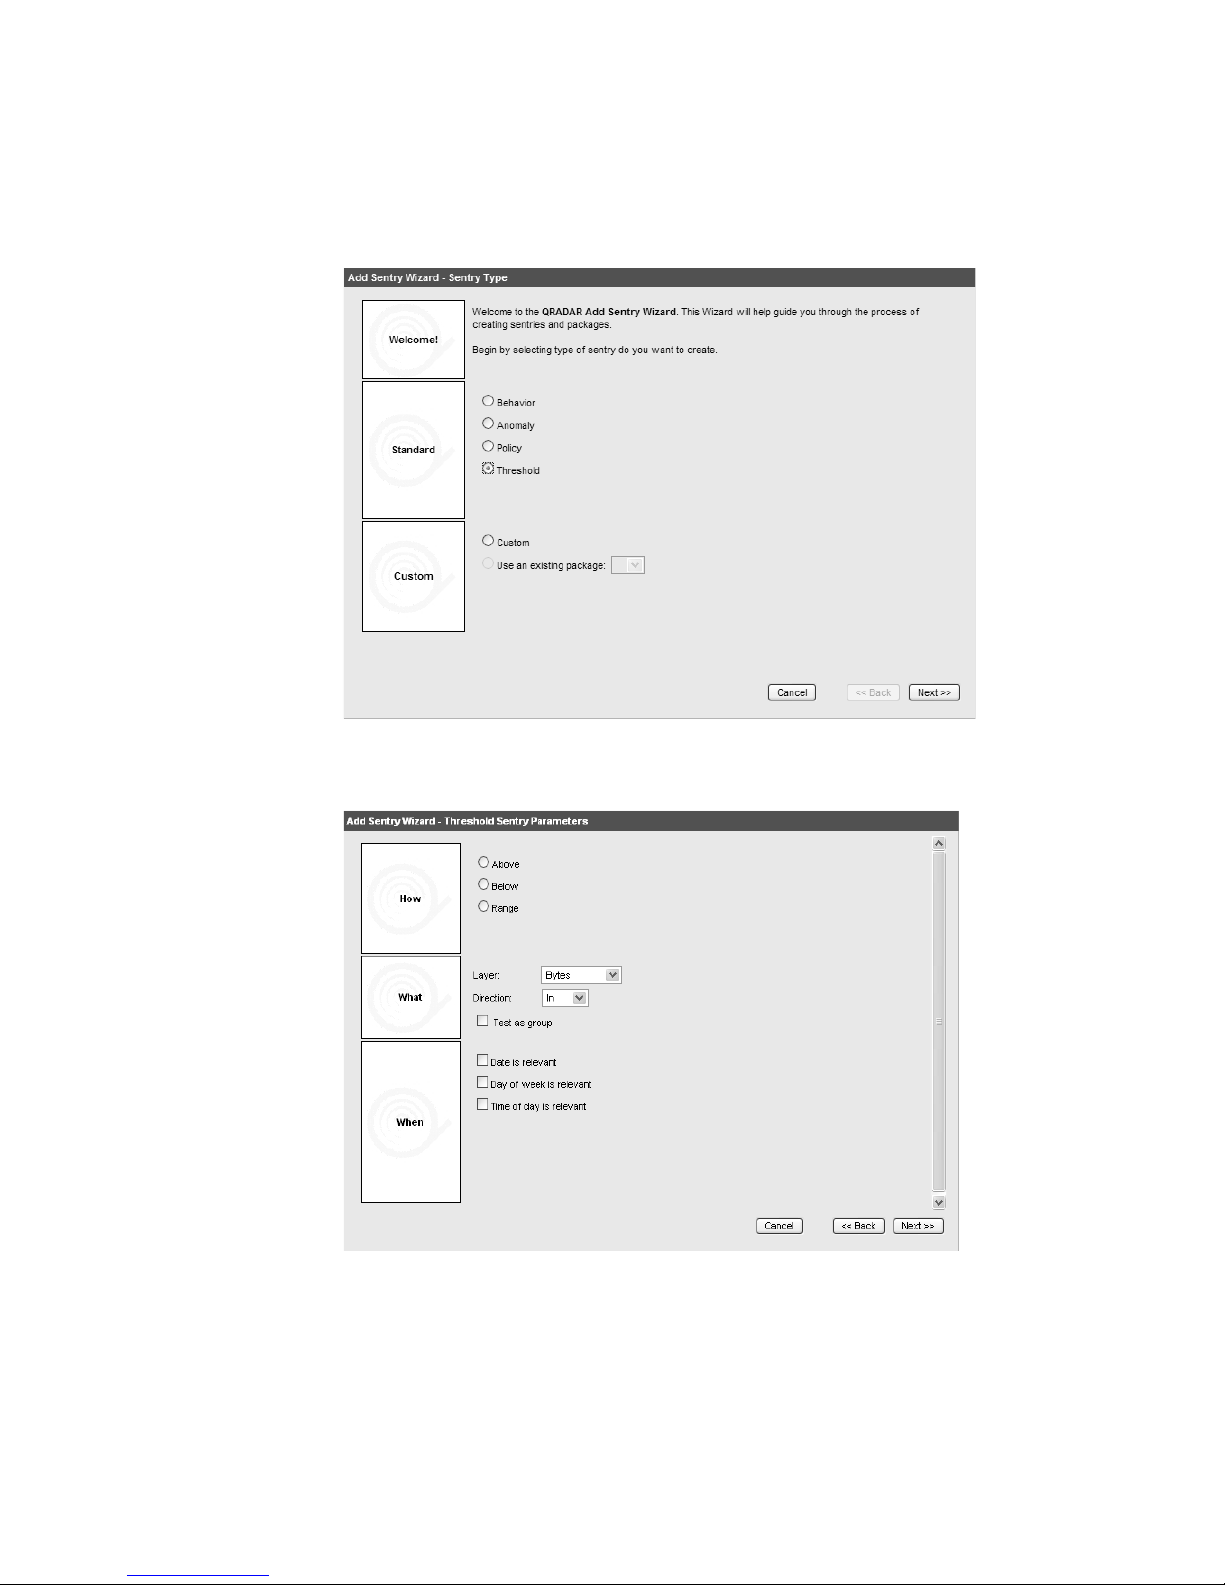
62 MANAGING SENTRIES
Step 3 Below the graph, click Add Sentry.
The Add Sentry Wizard appears.
Step 4 Specify the Threshold option.
The Sentry Parameters window appears.
Step 5 Enter values for the parameters:
STRM Users Guide
Page 69

Creating a Sentry 63
Table 4-12 Threshold Sentry Parameters
Parameter Action
Above Select the option if you wish to this sentry to monitor activity
above a threshold value. When selected, the Alert if data
rate is above field appears. Specify the threshold value.
Below Select the option if you wish to this sentry to monitor activity
below a threshold value. When selected, the Alert if data
rate is below field appears. Specify the threshold value.
Range Select the option if you wish to this sentry to monitor activity
within a certain range of values. When selected, the Alert if
data rate is from fields appear. Specify the range of values
you wish to monitor.
Layer Specifies the property and measurement used in the Y-axis
of the Network Surveillance graphs. The current value
being used to draw the graphs is displayed in red in the
Layers console. The values that can be used include bytes,
packets, number of hosts, and others.
Direction Specify the direction of traffic you wish this sentry to
monitor. The options are In, Out, or Both.
Test as group Select the check box if you wish all objects to add together
to be tested. For example, when selected, the top line of
the graph is evaluated as a group. If the check box is clear,
you wish all objects to be tested independently.
Date is relevant Select the check box if you wish this sentry to consider
date. When selected, date fields appear. Enter the relevant
dates you wish this sentry to monitor. By default, the check
box is clear.
Day of week is relevant Select the check box if you wish this sentry to consider the
day of the week. When selected, day of the week fields
appear. Using the drop-down list boxes, select the relevant
days you wish this sentry to consider. By default, the check
box is clear.
Time of day is relevant Select the check box if you wish this sentry to consider the
time of day. When selected, the time of day fields appear.
Using the drop-down list box, select the time of day you
wish this sentry to consider.
Step 6 Click Next.
The Sentry Attributes window appears.
STRM Users Guide
Page 70
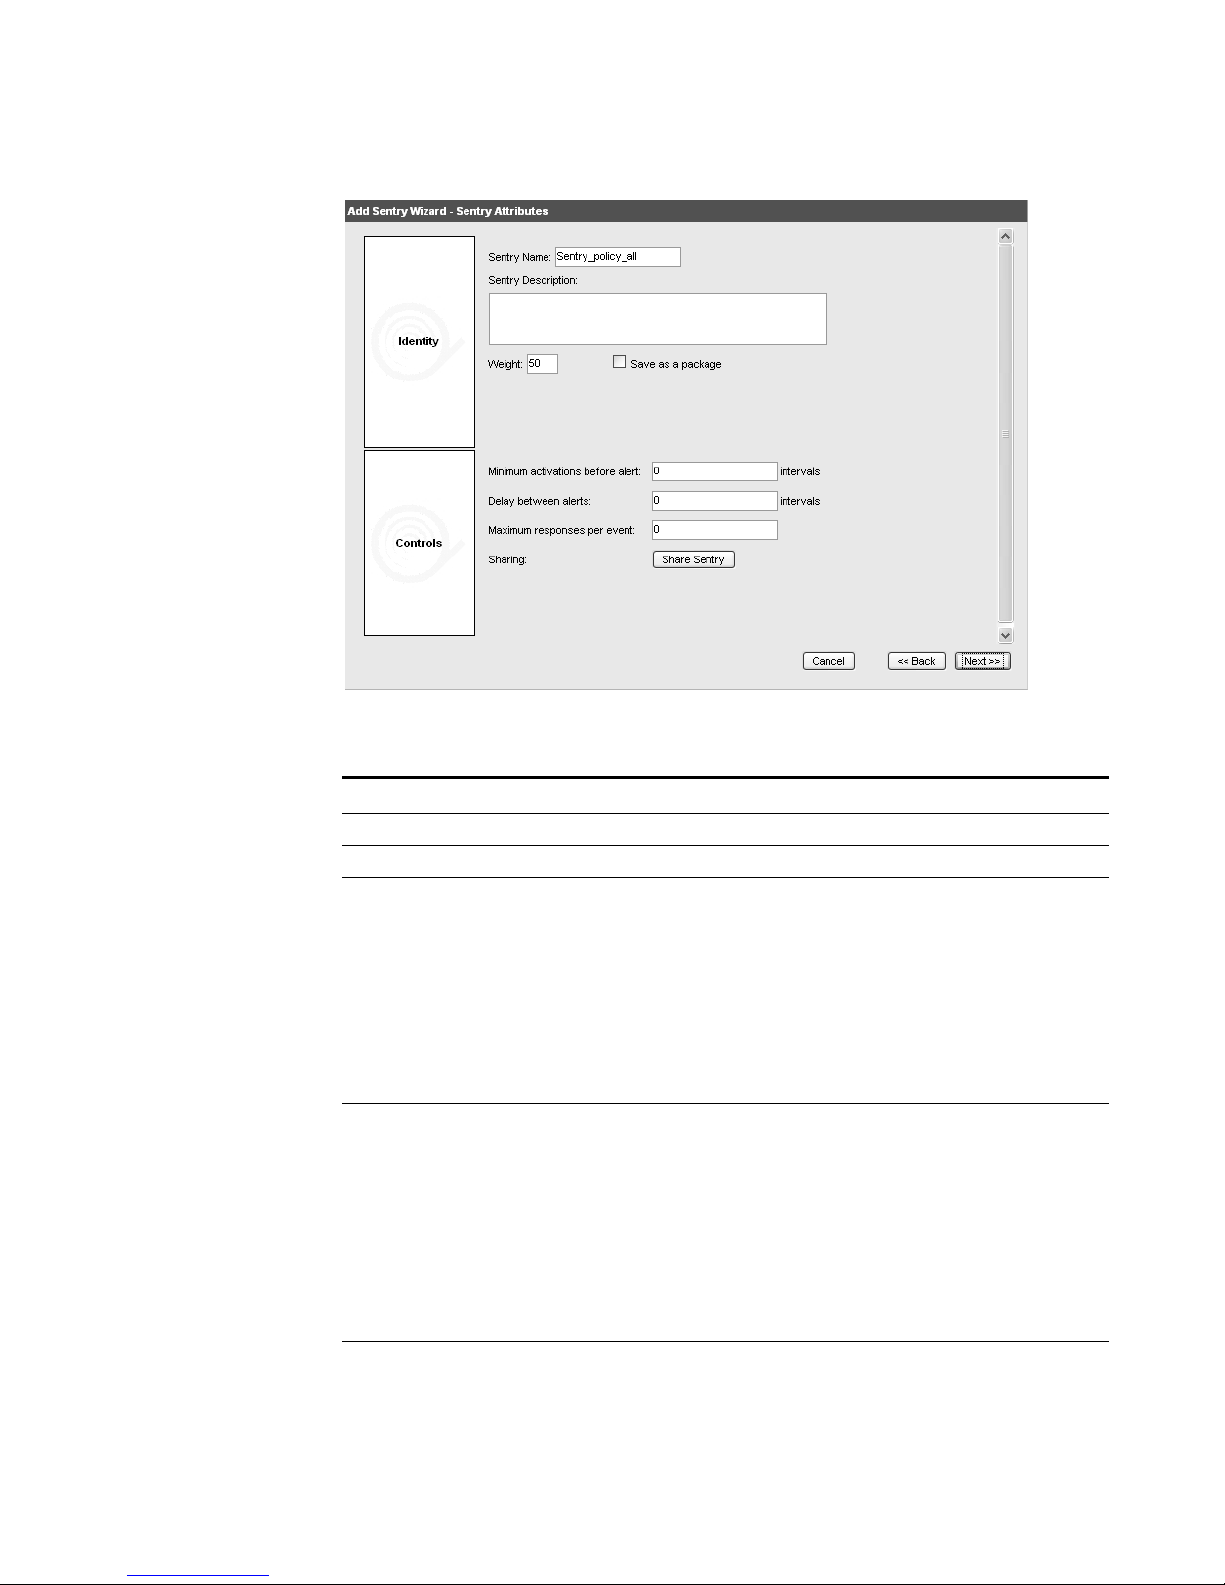
64 MANAGING SENTRIES
Step 7 Enter values for the parameters:
Table 4-13 Sentry Attributes Parameters
Parameter Action
Sentry Name Specify a name you wish to assign this sentry.
Sentry Description Specify a description for this sentry.
Weight Specify the relative importance of this sentry. This
determines the ranking that the generated event displays
in the Offense Manager.
STRM uses the following formula to calculate the weight:
(sentry weight + network weight + object weight)/3/time
difference
Where time difference is:
1 + (second since the sentry alerted / 10,000,000,000)
Save as package Select the check box if you wish to save this sentry as a
package to use with other sentries. By default, the check
box is clear. Specify the following:
• Package Name - Specify the name you wish to assign
to this package.
• Package Description - Specify a description for the
package.
• Share Package - Click Share Package to share this
package with other STRM users.
Minimum Activations
Before Alert
Specify the minimum number of times you wish this
activity to occur before an alert generates.
STRM Users Guide
Page 71

Creating a Sentry 65
Table 4-13 Sentry Attributes Parameters (continued)
Parameter Action
Delay Between Alerts Specify the number of intervals, after of the first
occurrence of this alert, before the next occurrence of this
event.
Maximum responses per
event
Specify the maximum number of times you wish this event
to generate.
If you set the Delay Between Alerts parameter to 0 and
the Maximum responses per event to 1, only one alert
generates per event.
Sharing Click Share Sentry to access the Select Users window,
which allows you to indicate any users you wish to share
this sentry.
Step 8
Click Next.
The Sentry Responses window appears.
Step 9 Enter values for the parameters:
Table 4-14 Threshold Sentry Response Parameters
Parameter Sub-Parameter Action
Email Email Subject Specify a subject for the notification e-mail sent by the
sentry engine.
Email
Recipient(s)
Specify the recipient(s) of the notification e-mail sent
by the sentry engine. Separate multiple entries with a
comma.
Format Specify the amount of text included in the e-mail.
Options include: Subject Only, Brief, Detailed - Text,
Detailed - HTML
STRM Users Guide
Page 72

66 MANAGING SENTRIES
Table 4-14 Threshold Sentry Response Parameters (continued)
Parameter Sub-Parameter Action
Trigger Trigger Script Using the drop-down list box, specify the action you
wish the sentry engine to perform. The options include:
• Trigger Script - Specify if you wish this sentry to
use the following:
SNMP traps - Sentry engine sends an SNMP Trap
notification.
Block IPs - Sentry engine blocks specific IP
addresses.
• Parameters - Specify the parameters required to
trigger either the SNMP trap or to block IP
addresses. Enter parameters in the following
format:
If you are using SNMP version 1:
1 <community> <IP address>
1.3.6.1.4.1. 20212
If you are using SNMP version 2:
2 <community> <IP address>
1.3.6.1.4.1.20212.200.3
Note: These default scripts need to be customized for
proper use in your environment. To edit the script, use
SSH to login to your STRM Console and edit the
scripts in the /opt/qradar/triggerbin directory. For
assistance, contact your local administrator.
Syslog Select the check box if you wish to save the sentry
event log file to the syslog server.
Step 10 Click Next.
Step 11 Review the sentry details. Click Finish.
Creating a Custom
Sentry
Step 1 Click the Network Surveillance tab.
Step 2 Navigate to the appropriate view you wish the sentry to apply.
Step 3 Below the graph, click Add Sentry.
You can create a custom sentry if your network has specific monitoring
requirements.
To create a custom sentry:
The Network Surveillance interface appears.
For information on navigating views, see Chapter 3 Managing Your Network
Activity.
The Add Sentry Wizard window appears.
STRM Users Guide
Page 73
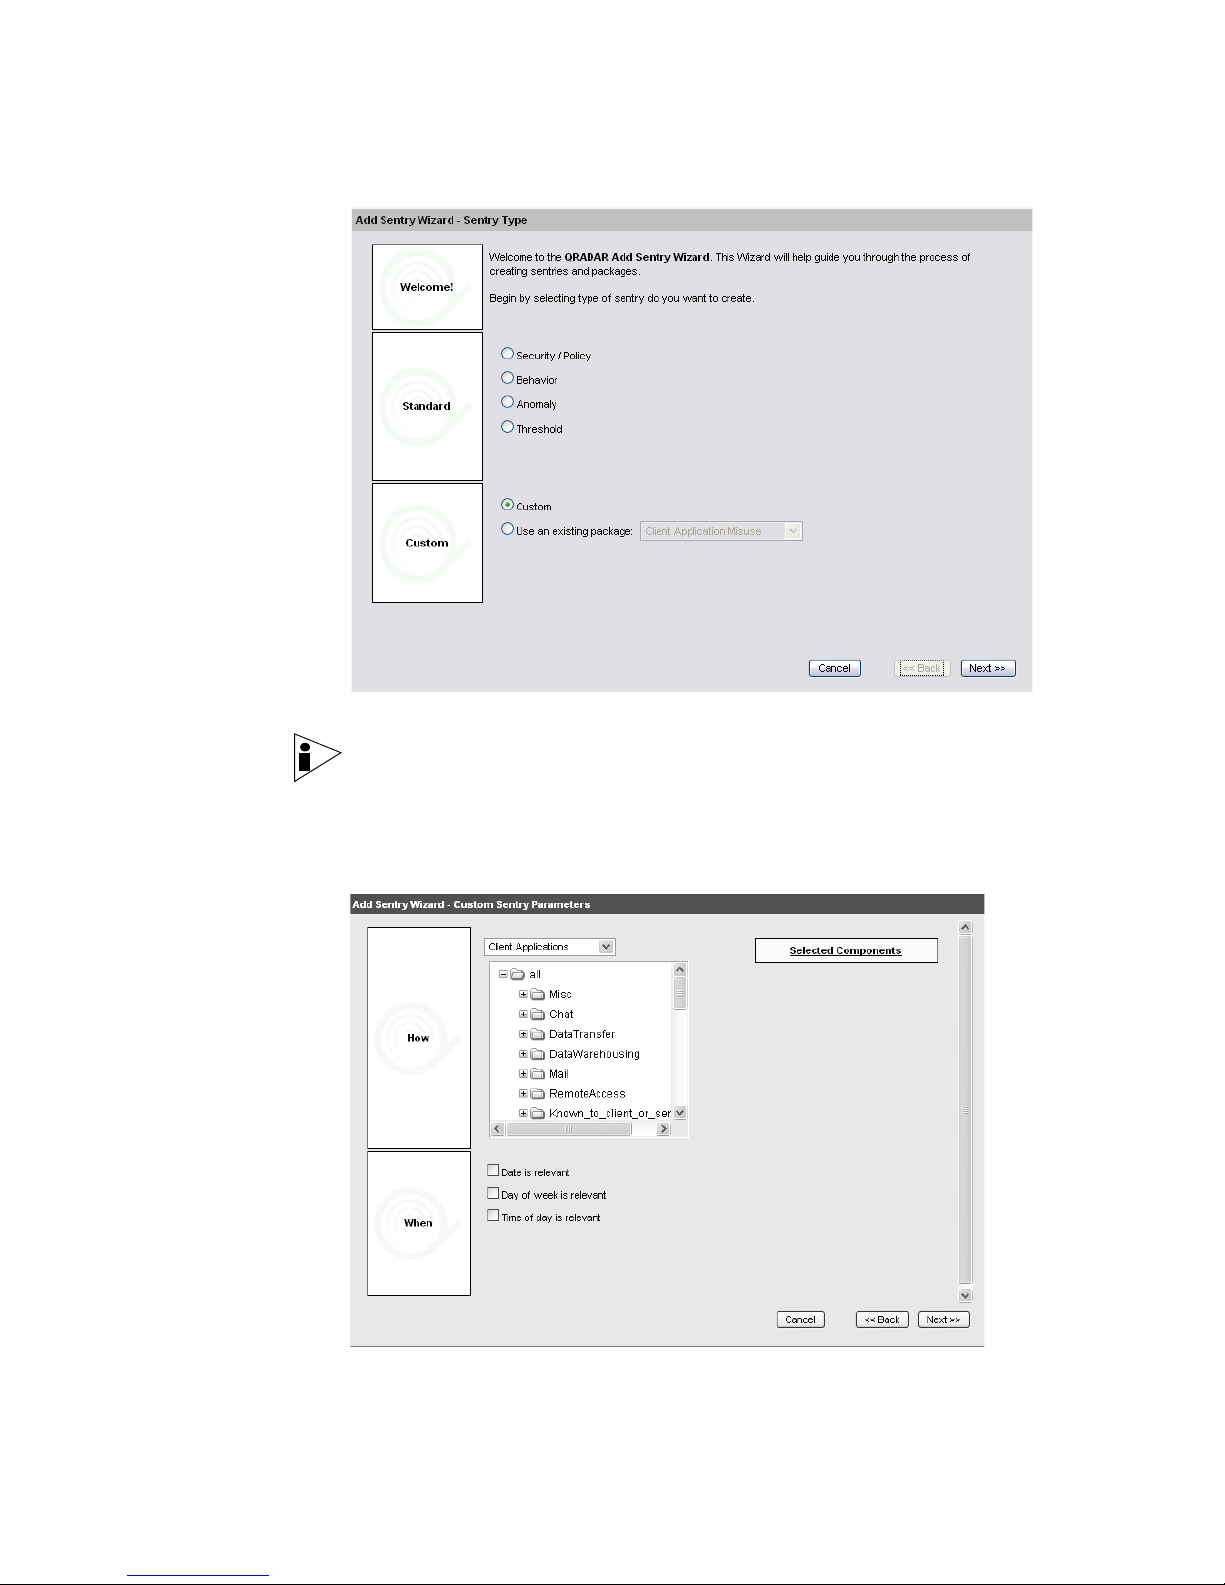
Creating a Sentry 67
Step 4
Select Custom. Click Next.
Note: You can also create a sentry using an existing Package, select the Use an
existing Package option and use the drop-down list box to select the desired
Package. This option allows you to edit the values of the Package but not the Logic
Unit.
The Custom Sentry Parameters window appears.
Step 5 Enter values for the parameters:
STRM Users Guide
Page 74
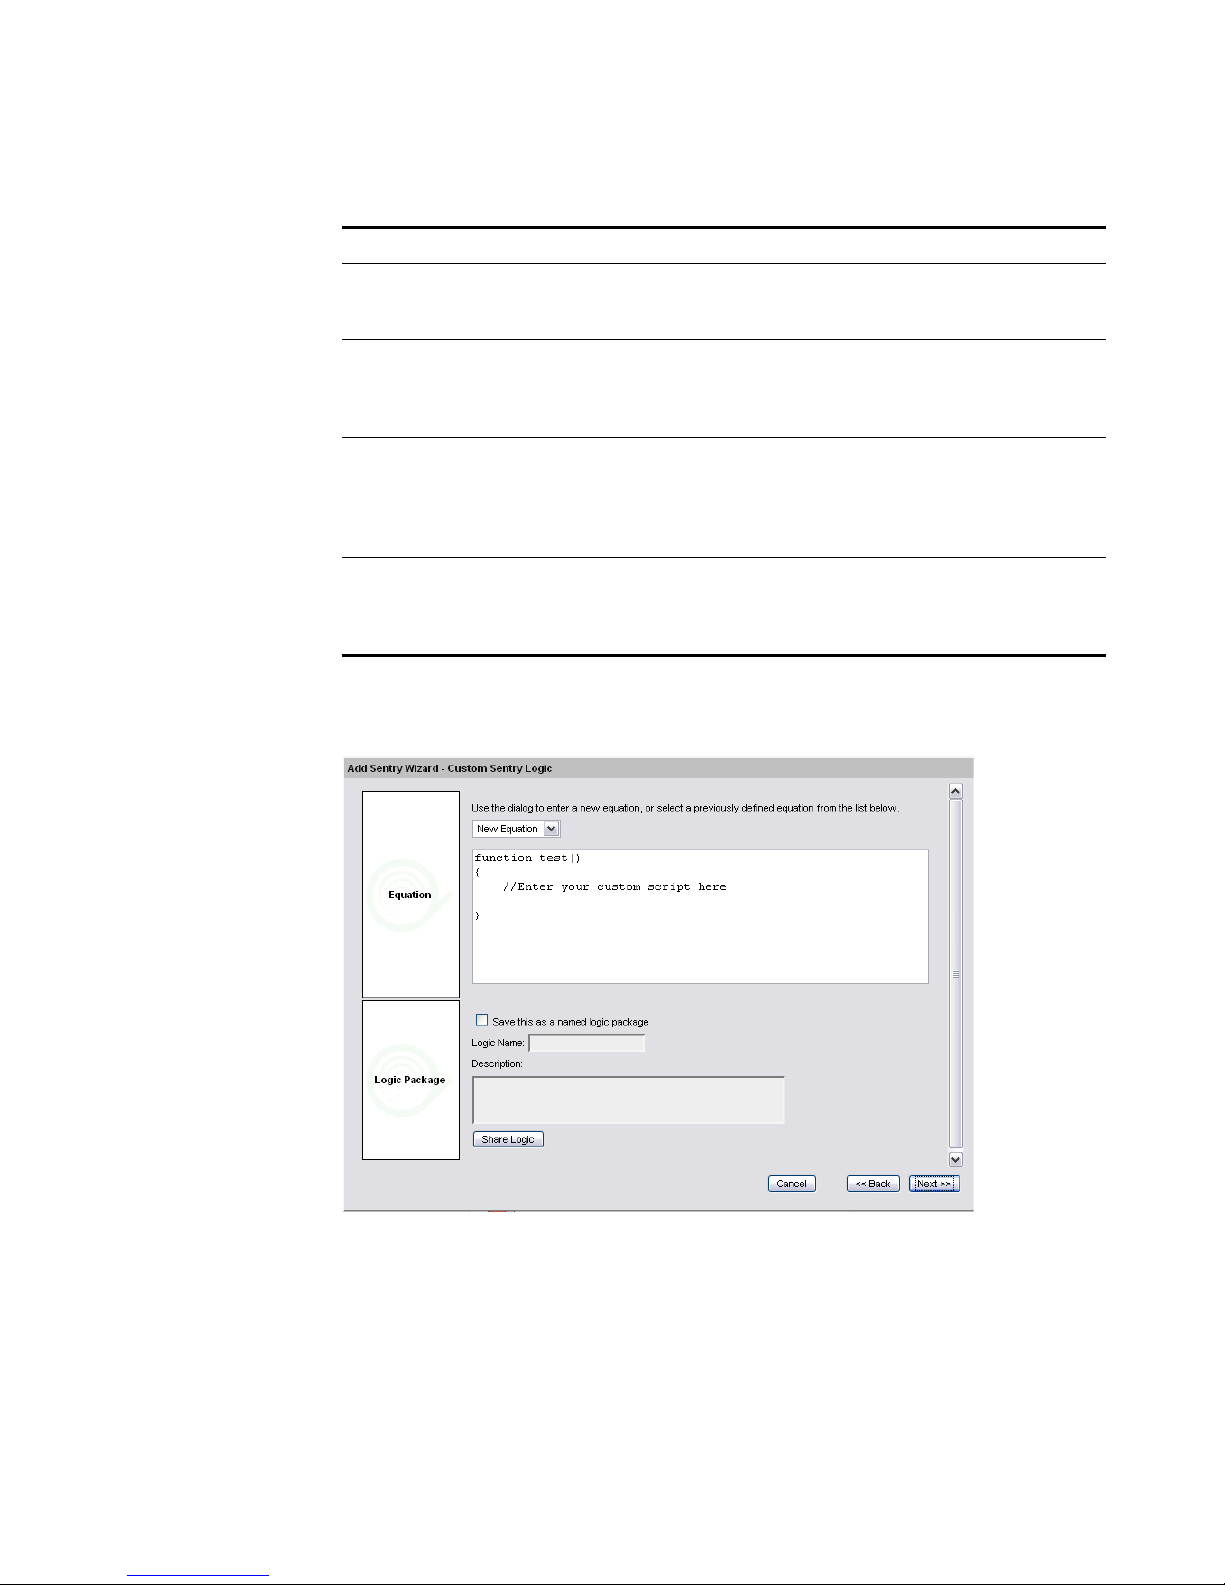
68 MANAGING SENTRIES
Step 6 Click Next.
Table 4-15 Custom Sentry Parameters
Parameter Action
Applications Using the menu tree, select all applications you wish this
sentry to monitor. All selected applications appear under
Selected Components.
Date is relevant Select the check box if you wish this sentry to consider
date. When selected, date fields appear. Enter the relevant
dates you wish this sentry to monitor. By default, the check
box is clear.
Day of the week is
relevant
Select the check box if you wish this sentry to consider the
day of the week. When selected, day of the week fields
appear. Using the drop-down list boxes, select the relevant
days you wish this sentry to consider. By default, the check
box is clear.
Time of day is relevant Select the check box if you wish this sentry to consider the
time of day. When selected, the time of day fields appear.
Using the drop-down list box, select the time of day you
wish this sentry to consider.
The Custom Sentry Logic window appears.
Step 7 Using the drop down list box, choose one of the following options:
a If you wish to use an existing Package, specify the Package you wish to use
and go to Step 8.
b If you wish to create a custom sentry, select New Equation and create your
own equation in the provided field using JavaScript code. The entry must
include the following format:
STRM Users Guide
Page 75

Creating a Sentry 69
var testObj = new CustomFunction( $$Counter,
other_custom_vars);
function test()
{
return testObj.test();
}
You can use all the functions available with JavaScript functionality as well as
the following functions:
Table 4-16 JavaScript Functions
Function Description
thresholdCheck Monitors policy and threshold objects. By default, this value
monitors each object separately. If you wish to test objects as
group, you must add the value set. This function includes:
• components - String of component names from one or more
layers, separated by colons. For example, in:out.
• funcT - Instance of comparison object including above,
greatThanEq, below, lessThanEq, Eq, notEq, and range.
• isTotal - Set this function to 0 if you wish to test objects
seperately. Set this function to 1 if you wish to test all objects
as a group.
• time - Indicates time to make a comparison. If no time is
supplied, current time is used.
learnPolicy During the learning period, this function selects only object that
did not include traffic. The sentry then generates an alert on
those objects. This function includes:
• components - String of component names from one or more
layers, separated by colons. For example, in:out.
• lockTime - Indicates the time in which you wish to stop the
learning process.
activityAnomaly Detects changes in the activity level for selected databases. This
function includes:
• largewindowsize - Specifies the time range for the large
observation window.
• smallwindowsize - Specifies the time range for small
observation window.
• percentrequired - Specifies the required percentage change
required before the sentry generates an alert.
• layer - Specifies the layer you wish to monitor.
• type - Specifies the test objects as a group.
• intervalsize - Specifies the interval size, in seconds.
Step 8 Enter values for the parameters:
STRM Users Guide
Page 76
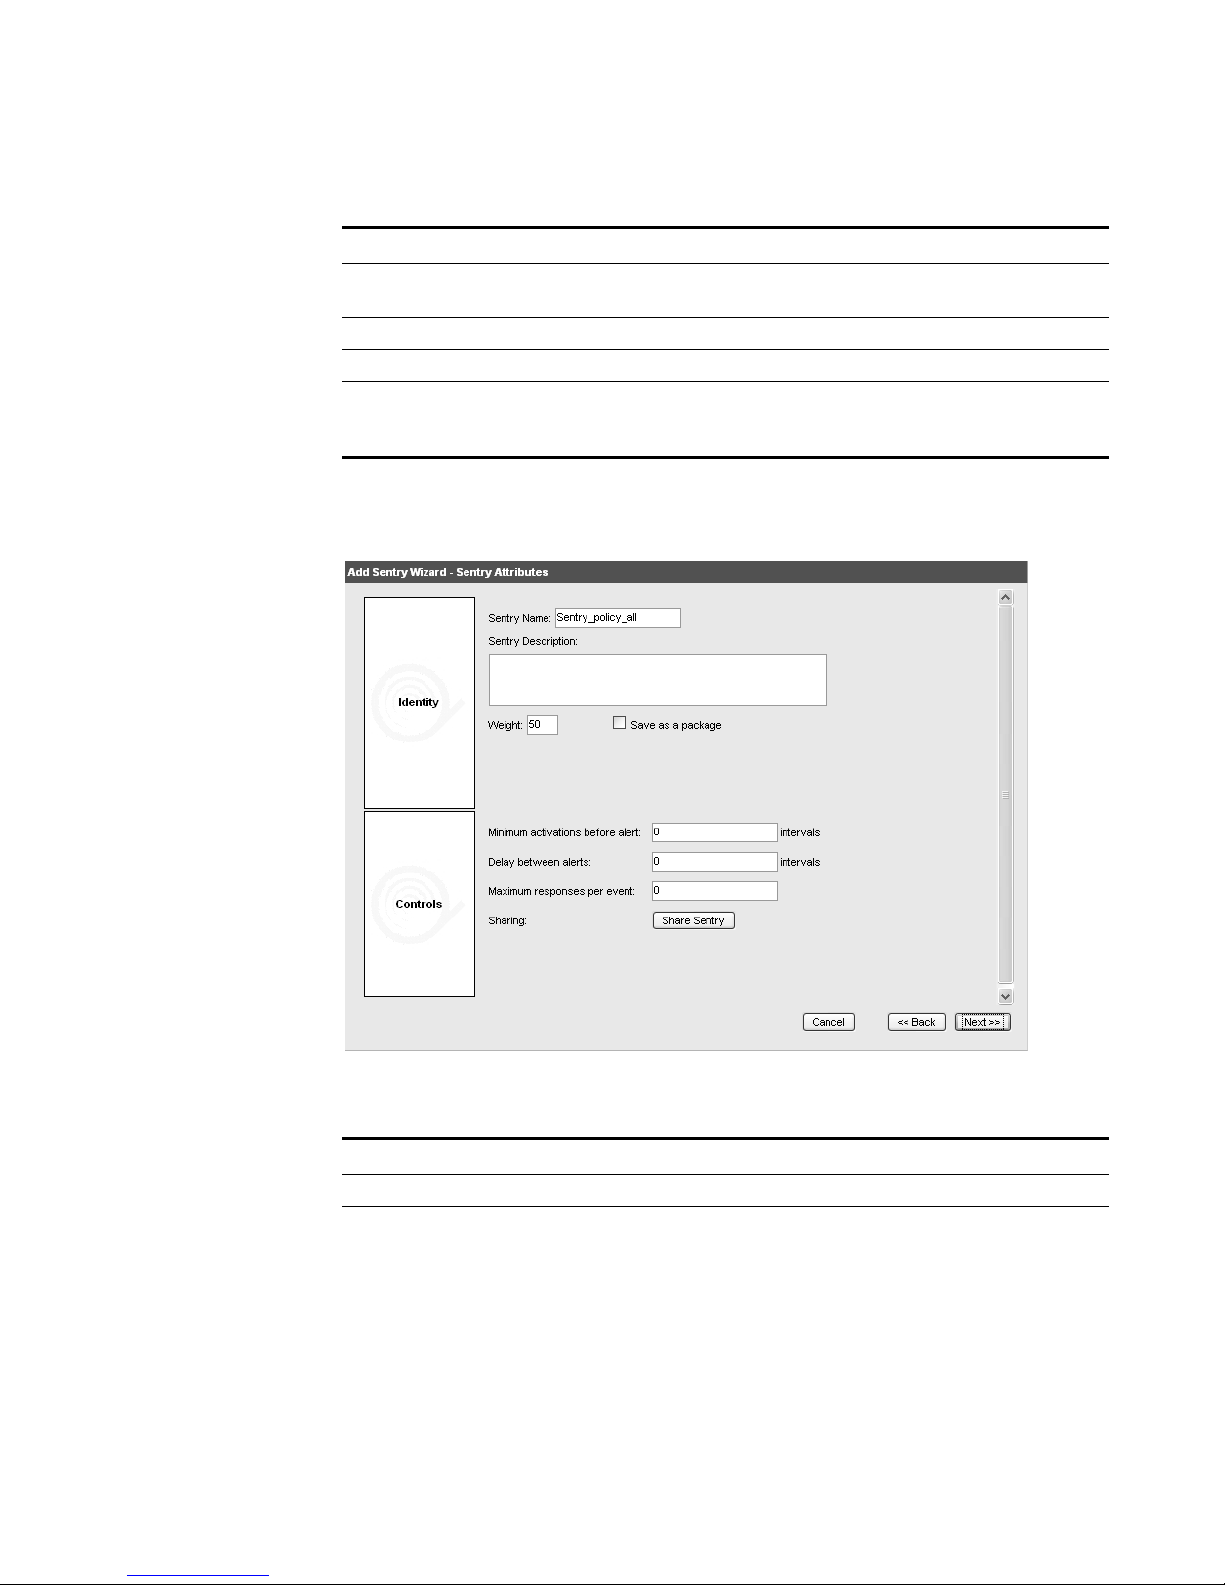
70 MANAGING SENTRIES
Step 9 Click Next.
Table 4-17 Sentry Attributes Parameters
Parameter Action
Save this as a named
logic package
Select the check box if you wish to save this information
as a sentry Package.
Logic Name Specify a name you wish to assign to this Package.
Description Specify a description for this Package.
Share Logic Click Share Logic to access the Select Users window.
This window allows you to specify users you wish to share
this logic.
The Sentry Attributes window appears.
Step 10 Enter values for the following parameters:
Table 4-18 Sentry Attributes Parameters
Parameter Action
Sentry Name Specify a name you wish to assign this sentry.
Sentry Description Specify a description for this sentry.
STRM Users Guide
Page 77

Creating a Sentry 71
Table 4-18 Sentry Attributes Parameters (continued)
Parameter Action
Weight Specify the relative importance of this sentry. This
determines the ranking that the generated event displays
in the Offense Manager.
STRM uses the following formula to calculate the weight:
(sentry weight + network weight + object weight)/3/time
difference
Where time difference is:
1 + (second since the sentry alerted / 10,000,000,000)
Save as package Select the check box if you wish to save this sentry as a
package to use with other sentries. By default, the check
box is clear. Specify the following:
• Package Name - Specify the name you wish to assign
to this package.
• Package Description - Specify a description for the
package.
• Share Package - Click Share Package to share this
package with other STRM users.
Minimum Activations
Before Alert
Specify the minimum number of times you wish this
activity to occur before an alert generates.
Delay Between Alerts Specify the number of intervals, after of the first
occurrence of this alert, before the next occurrence of this
event.
Maximum responses per
event
Specify the maximum number of times you wish this event
to generate.
Sharing Click Share Sentry to access the Select Users window,
which allows you to indicate any users you wish to share
this sentry.
Step 11
Click Next.
The Sentry Response window appears.
Step 12 Enter values for the following parameters:
Table 4-19 Sentry Response Parameters
Parameter Sub-Parameter Action
Email Email Subject Specify a subject for the notification e-mail sent by the
sentry engine.
Email
Recipient(s)
Specify the recipient(s) of the notification e-mail sent
by the sentry engine. Separate multiple entries with a
comma.
Format Specify the amount of text included in the e-mail.
Options include: Subject Only, Brief, Detailed - Text,
Detailed - HTML.
STRM Users Guide
Page 78
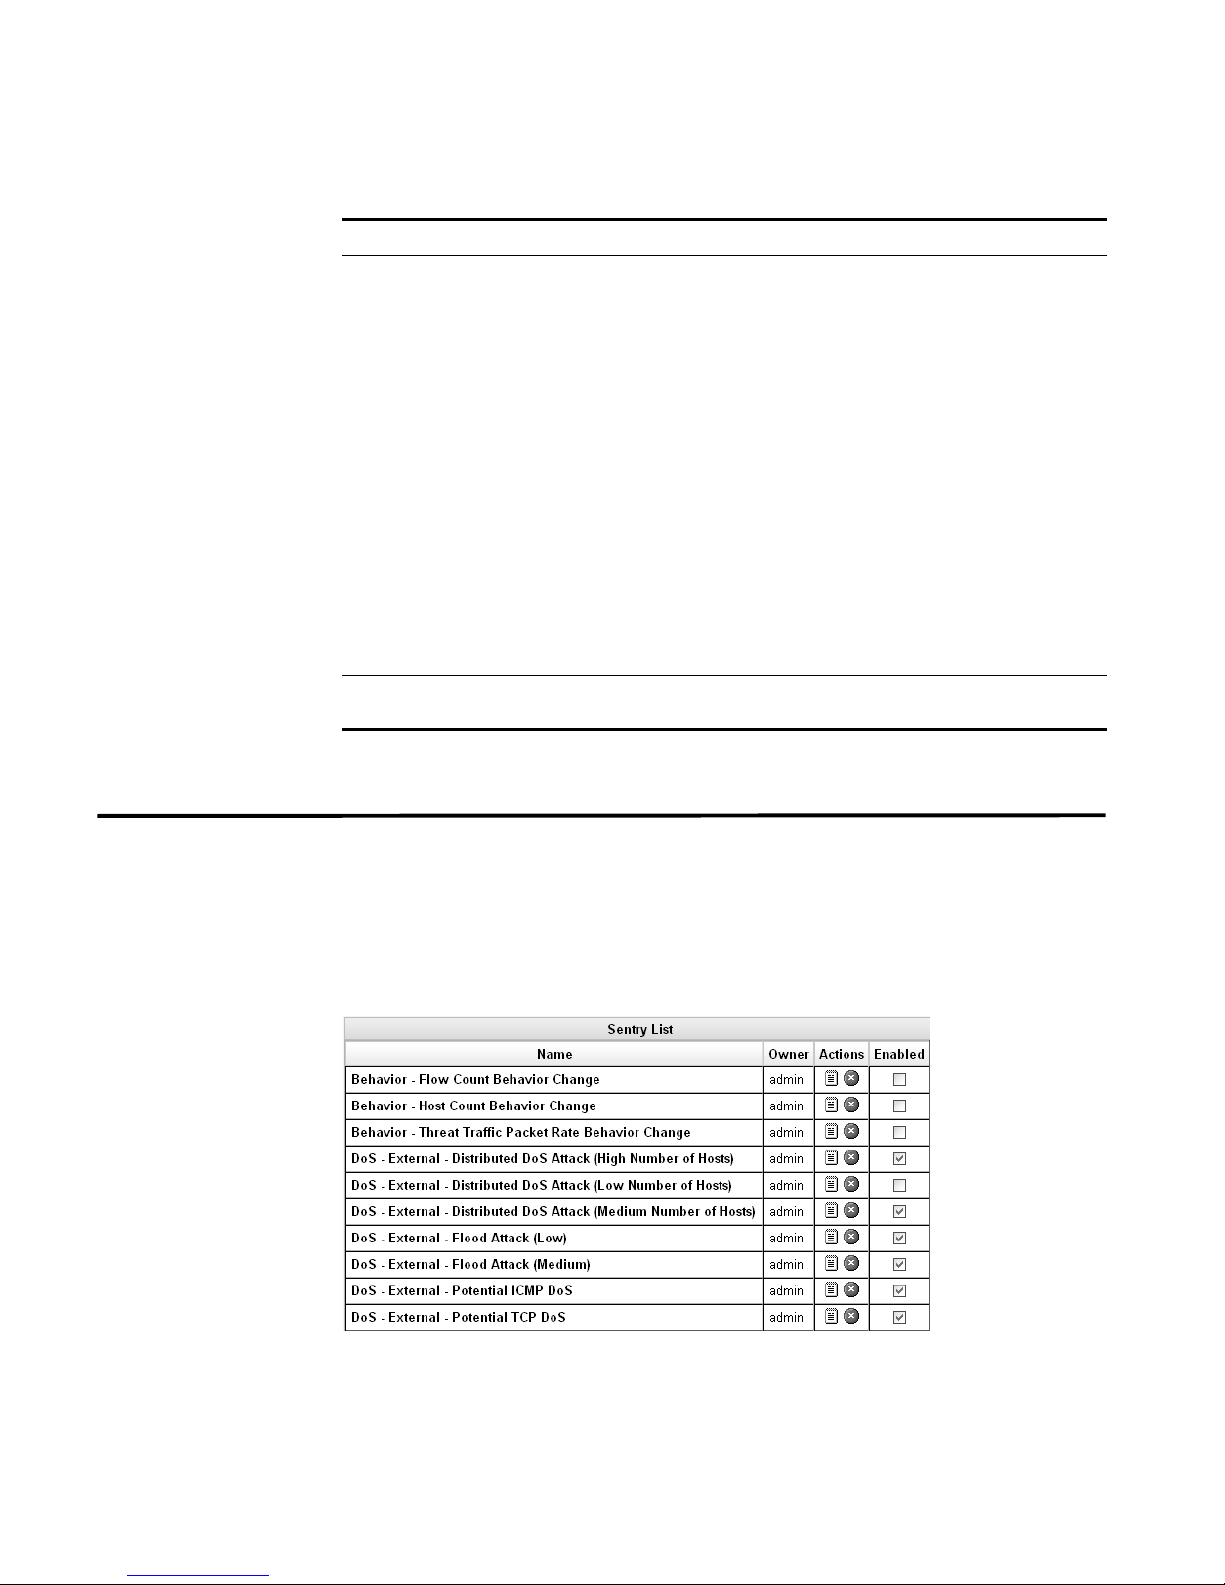
72 MANAGING SENTRIES
Table 4-19 Sentry Response Parameters (continued)
Parameter Sub-Parameter Action
Trigger Trigger Script Using the drop-down list box, specify the action you
wish the sentry engine to perform. The options include:
• Trigger Script - Specify if you wish this sentry to
use the following:
SNMP traps - Sentry engine sends an SNMP Trap
notification.
Block IPs - Sentry engine blocks specific IP
addresses.
• Parameters - Specify the parameters required to
trigger either the SNMP trap, or to block IP
addresses.
Note: These default scripts need to be customized for
proper use in your environment. To edit the script, use
SSH to login to your STRM Console and edit the
scripts in the /opt/qradar/triggerbin directory. For
assistance, contact your local administrator.
Syslog Select the check box if you wish to save the sentry
event log file to the syslog server.
Step 13 Review the sentry details. Click Finish.
Editing a Sentry You can only edit sentries that you have created. To edit a sentry:
Step 1 Click the Network Surveillance tab.
The Network Surveillance interface appears.
Step 2 Below the graph, click View Sentries.
The Sentry List window appears.
Step 3 Click the sentry you wish to edit.
The sentry details appear.
STRM Users Guide
Page 79

Editing a Sentry 73
Step 4
Update values for the parameters, as necessary:
a If you are editing a Security/Policy sentry:
Table 4-20 Edit Security/Policy Sentry
Parameter Description
Name Specify a name for this sentry.
Description Specify a description for this sentry. This description appears as
an annotation in the Offense Manager if this sentry causes an
offense to generate.
Minimum number
of flows before
Specify the minimum number of times, in flows, this activity must
occur before an event generates.
emitting events
Delay between
emitting events
Specify the number of seconds, after the first occurrence of this
event, before the next occurrence of this event. For example, if
you set the value to 3, an event generates after three seconds of
the first instance of the event.
Maximum emitted
events per IP
Specify the maximum number of times you wish this event to
generate per IP address. For example, if you set the maximum
alerts to 2, only two alerts generate per event.
Is Enabled Select the check box to enable this sentry. Clear the check box to
disable the sentry.
Options Select the check box if you wish this event to be included with
other events to create an offense. Use the Address to mark as
the target drop-down list box to identify if you wish the destination
or source IP address to be used as the target.
Note: This option only appears for a Security/Policy sentry.
Permissions Specify the users you wish to allow access to edit this sentry.
Package Using the drop-down list box, select the sentry package you wish
to apply to this sentry. To edit an existing package, click Edit or
to create a new package, click Create New.
QRL Specifies the details of the current view for this sentry.
b If you are editing a Behavior, Anomaly, or Threshold sentry:
Table 4-21 Edit Behavior, Anomaly, or Threshold Sentry
Parameter Description
Name Specify a name for this sentry.
Description Specify a description for this sentry. This description appears as
Minimum number
of flows before
alert
Delay between
alerts
an annotation in the Offense Manager if this sentry causes an
offense to generate.
Specify the minimum number intervals this activity must occur
before an alert generates.
Specify the number of intervals after the first occurrence of this
event, before the next occurrence of this event.
STRM Users Guide
Page 80

74 MANAGING SENTRIES
Table 4-21 Edit Behavior, Anomaly, or Threshold Sentry (continued)
Parameter Description
Maximum
responses per
Specify the maximum number of number of times you wish this
event to generate a response.
events
Is Enabled Select the check box to enable this sentry. Clear the check box to
disable the sentry.
Test as group Select the check box is you wish all objects to add together to be
tested. Clear the check box if you wish each object to be
evaluated separately.
Restrictions Select the check box for one or more restrictions you wish to
enforce for an active sentry including:
• Date is relevant - Select the check box to indicate that this
sentry must consider the date. When selected, date fields
appear. Enter the relevant dates you wish this sentry to
monitor.
• Day of week is relevant - Select the check box to indicate
that this sentry must consider the day of the week. When
selected, day of the week fields appear. Using the drop-down
list boxes, select the relevant days you wish this sentry to
consider.
• Time of day is relevant - Select the check box to indicate that
this sentry must consider time of day. When selected, time of
day fields appear. Using the drop-down list box, select the
time of day you wish this sentry to consider.
Permissions Specify the users you wish to allow access to edit this sentry.
Package Using the drop-down list box, select the sentry package you wish
to apply to this sentry. To edit an existing package, click Edit or
to create a new package, click Create New.
Responses Specify the method you wish to be notified if this sentry
generates an event. The options are:
• Email
• Log - Sends event information to standard syslog on STRM
Console.
QRL Specifies the details of the current view for this sentry.
Step 5 Edit the variables, as necessary. The list of variables includes all configured values
for this sentry. Only the variables that apply to this sentry appear.
STRM Users Guide
Page 81

Editing a Sentry 75
Table 4-22 Default Variables
Parameter Description
$$Base Specify the current traffic level weight that you wish to assign to
the current traffic levels against the learned behaviors and the
current trend. This variable is for behavioral sentries. The higher
the value indicates more weight on the previously recorded
value. When you configure a sentry, you must enter a value
between 0 to 100, however, when you view a sentry, this value
appears in decimal format as 0.01 to 1.
$$Trend Specify the current traffic trend weight that you wish to assign to
current traffic trends against the calculated behavior. This
variable is for behavioral sentries. The higher the value indicates
more weight on traffic trends than the calculated behavior. When
you configure a sentry, you must enter a value between 1 to 100,
however, when you view a sentry, this value appears in decimal
format as 0.01 to 1.
$$Season Specify the weight applied to the seasonal component of the
behavior sentry. The range is 1 to 100. This variable is for
behavioral sentries. When you configure a sentry, you must enter
a value between 1 to 100, however, when you view a sentry, this
value appears in decimal format as 0.01 to 1.
$$SeasonTime Specify the length of time, in seconds, you wish this sentry to
consider a season. A season indicates the cycle of data, which
STRM uses to determine future data flow. This variable is for
behavioral sentries.
$$Scale Specify the alert sensitivity level for this alert. This level indicates
how far outside the predicted values before a violation generates.
A value of zero indicates the measured value cannot be outside
the predicted value and a value of 100 indicates the traffic is
more than four times larger than the predicted value. When you
configure a sentry, you must enter a value between 1 to 100,
however, when you view a sentry, this value appears in decimal
format as 0.01 to 1.
$$Counter Specify the layers you wish this sentry to consider. This variable
is for all sentry types. The options include: in (bytes in), out (bytes
out), pin (packet in), pount (packet count), hlocal (host local),
hremote (host remote), plocal (packet local), premote (packet
remote), and count. Separate each entry with a colon.
$$AsSet Specify 0 if you wish all objects to add together to be tested.
Specify 1 if you wish each object to be evaluated seperately. This
variable is for all sentry types.
$$Value For each threshold, specify the number that must be exceeded
for this sentry to generate an alert. This variable is for all sentry
types.
$$Percent Specify the percentage change in behavior this view must
experience before the sentry generates an alert. This variable is
for anomaly sentries.
STRM Users Guide
Page 82

76 MANAGING SENTRIES
Step 6 Click Save.
Table 4-22 Default Variables (continued)
Parameter Description
$$SmallWindow Specify an extended period of time you wish to the system to
monitor flows in your network. This allows the system a basis of
comparison for traffic over an extended period of time. If the large
window and small window values exceed a certain threshold, the
sentry generates an alert. This variable is for anomaly sentries.
$$LargeWindow Specify a period of time you wish to the system to monitor flows
in your network. This allows the system a basis of comparison for
traffic over an smaller period of time. If the large window and
small window values exceed a certain threshold, the sentry
generates an alert.
$$Upperbound/
Lowerbound
For each threshold, specify the number that must be exceeded
for this sentry to generate an alert. This variable is for threshold
sentries.
$$AutoLearnTime Specify the time stamp of the time when you wish the system to
stop learning. This variable is for threshold sentries.
STRM Users Guide
Page 83

5
INVESTIGATING OFFENSES
The Offense Manager allows you to investigate offenses, behaviors, anomalies,
targets, and attackers on your network. STRM can correlate events and network
activity with targets located across multiple networks in the same offense, and
ultimately the same network incident. This allows you to effectively investigate
each offense in your network. You can navigate the interface to investigate the
event details to determine the unique events that caused the offense.
Using the Offense Manager, you can access and analyze the following:
• Offenses - An offense includes multiple events originating from one host. The
Offense Manager displays offenses that include traffic and vulnerabilities that
collaborate and validate the magnitude of an offense. The magnitude of an
offense is determined by several tests that performed on an offense every time
it has been scheduled for re-evaluation, usually because a events have been
added or the minimum time for scheduling has occurred.
• Attackers - A device that is attempting to breach the security of a component
on your network. An attacker may be attempting unauthorized access actively
or passively using various methods of attack, such as reconnaissance or Denial
of Service (DoS) attacks.
• Targets - A device that an attacker is attempting to access.
You can also use the Offense Manager to manage your offenses by adding notes,
marking an offense for follow-up, assigning offenses to users, or closing resolved
offenses. The Offense Manager allows you to investigate flows associated to
specific offenses for forensic analysis.
This chapter provides information on using the Offense Manager including:
• Using the Offense Manager
• Managing My Offenses
• Managing Offenses
• Viewing Offense By Category
• Managing Offenses By Attacker
• Managing Offenses By Targets
• Managing Offenses By Networks
STRM Users Guide
Page 84

78 INVESTIGATING OFFENSES
• Marking an Item For Follow-Up
• Configuring Notification
• Managing Network Anomalies
• Exporting Offenses
Using the Offense
Manager
Using the Offense Manager interface, you can access the following options for
managing security and policy events, behaviors, anomalies, targets, and attackers
on your network:
Table 5-1 Offense Manager Interface Options
Menu Description
My Offenses Includes a list of all offenses that have been assigned to you by the
administrator.
All Offenses Includes all global offenses on the network.
By Category Includes a summary view of all offenses based on the high and
low-level category. For more information on high and low-level
categories, see the Event Category Correlation Reference Guide.
For information on investigating category offenses, see the
Category Offense Investigation Guide.
By Attacker Includes all offenses by attacker or source. Each offense includes
both security and policy issues, where source relates to policy
issues. For more information, see
Attacker
By Target Includes all offenses by local targets or destination. For more
information, see
By Network Includes all offenses by networks. For more information, see
.
Managing Offenses By Targets.
Managing Offenses By
Managing Offenses By Networks.
Network
Anomalies
Rules Allows you to create custom rules. For more information, see the
Includes information on offenses generated from sentries. For
more information, see Managing Network Anomalies.
STRM Administration Guide.
Managing My
Offenses
Users with the appropriate privileges can assign offenses to users. All offenses
assigned to you will appear in the My Offenses Interface. By default, the My
Offenses interface appears when you click the Offense Manager tab, however, if
no offenses are assigned to you, the All Offenses interface appears.
To view offenses assigned to you:
Step 1 Click the Offense Manager tab.
The Offense Manager window appears.
Step 2 Click My Offenses from the navigation menu.
STRM Users Guide
Page 85
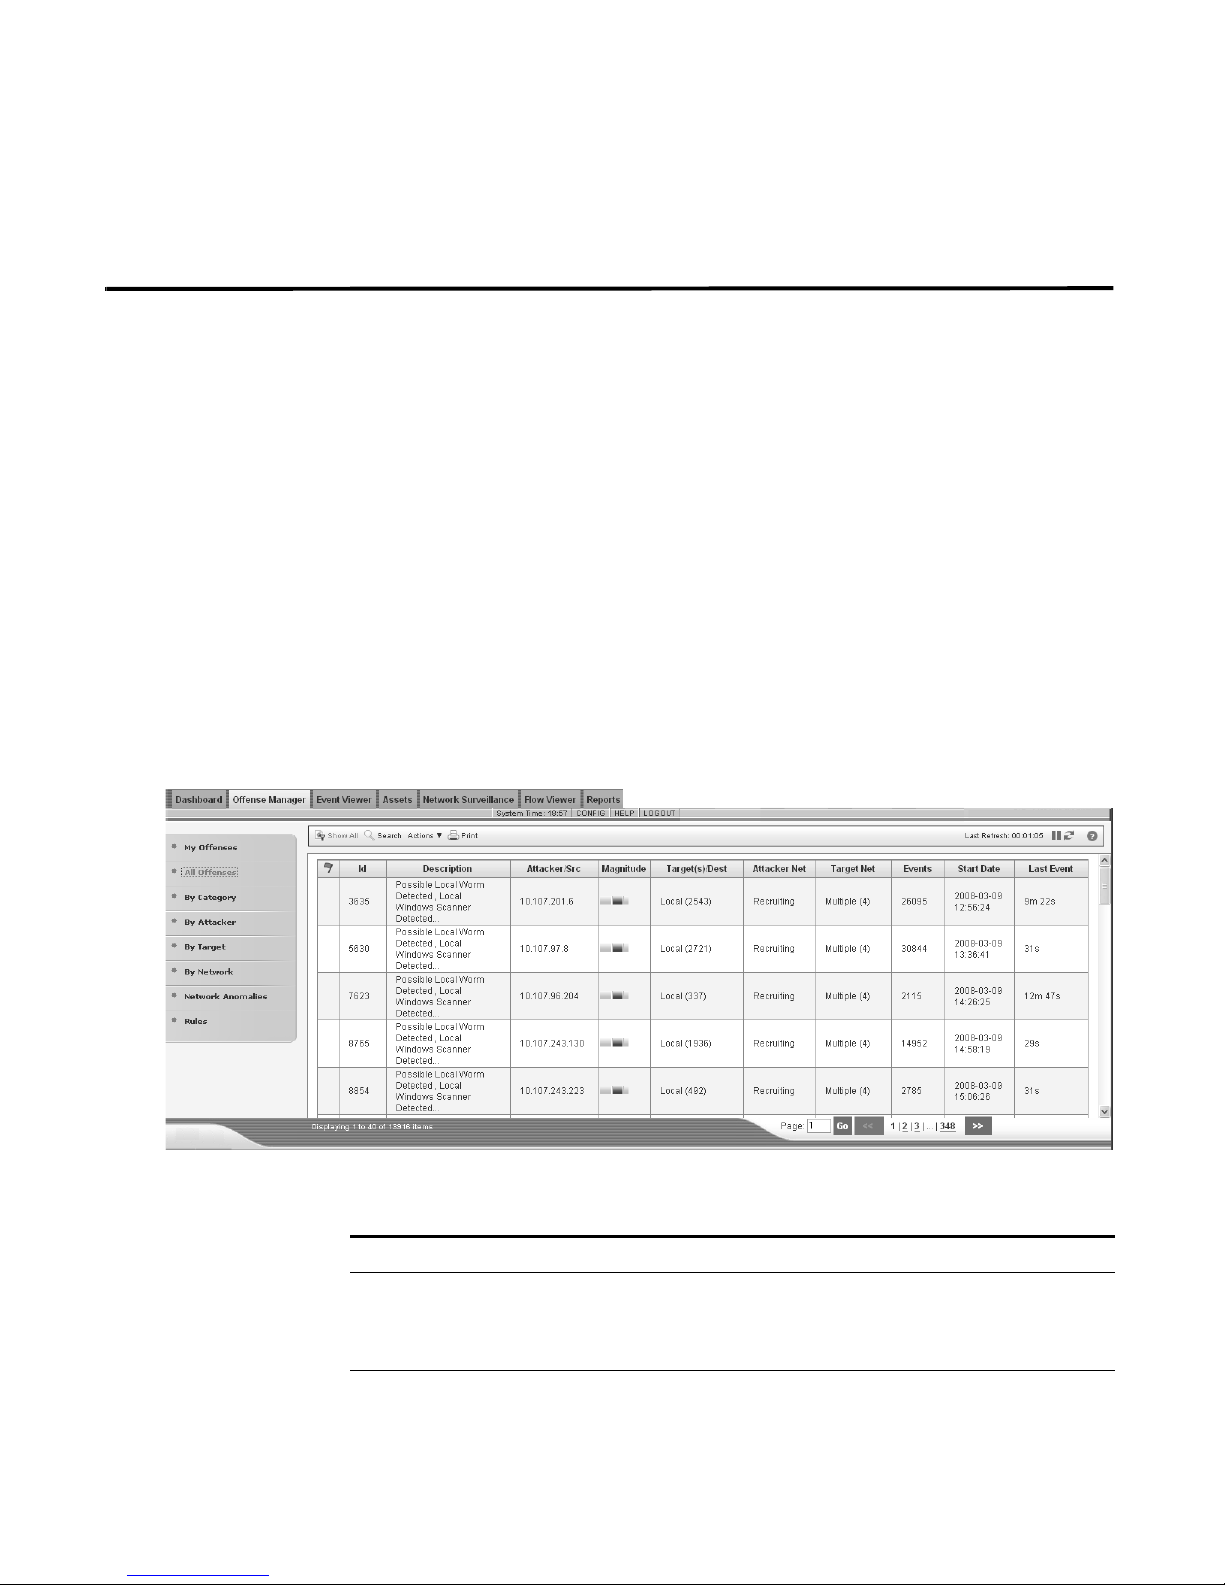
Managing Offenses 79
The My Offenses interface appears. For information on managing your offenses,
see Managing Offenses.
Managing Offenses You can use the Offense Manager to view a list of offenses that have been
identified by STRM on your network. All offenses are listed with the highest
magnitude first.
This section provides information on:
• Viewing Offenses
• Searching Offenses
• Removing Offenses
• Assigning Offenses to Users
Viewing Offenses To view offenses:
Step 1 Click the Offense Manager tab.
The Offense Manager window appears.
Step 2 Click All Offenses from the navigation menu.
The selected list of offenses appears and includes all offenses.
The panel provides the following information:
Table 5-2 Viewing Offenses Parameters
Parameter Description
Follow-up Flag Specifies action taken on the offense, for example, if a flag
appears, the offense is marked for follow-up or if a user icon
appears, the offense has been assigned to a user. Point your
mouse over the icon to display additional information.
Id Specifies the STRM unique identifier for this offense.
STRM Users Guide
Page 86

80 INVESTIGATING OFFENSES
Table 5-2 Viewing Offenses Parameters (continued)
Parameter Description
Description Specifies the details for the offense.
Attacker/Src Specifies the IP address of the attacker or source of the attack.
Magnitude Specifies the relative importance of the offense. The magnitude
bar provides a visual representation of all the correlated variables
of the offense, attacker, target, or network. Variables include
Relevance, Severity, and Credibility. Point your mouse to the
magnitude bar to display values and the calculated magnitude.
Using the STRM Console Management window, you can
configure the minimum magnitude for offenses you wish to
display. For example, if you configure the Minimum Offense
Magnitude to Display parameter as 4, only offenses with a
magnitude of 4 and above appear in the Offense Manager. For
more information, see the STRM Administration Guide.
Target(s)/Dest Specifies the IP address(es) of local and remote targets.
If the term multiple appears, more than one target is associated
with this offense.
If the term remote appears, this offense includes remote targets.
Attacker Net Specifies the attacker network for this offense.
Target Net Specifies the network on which the offense occurred.
If the term multiple appears, more than one target is associated
with this offense.
Events Specifies the number of events for this offense.
Start Date Specifies the date and time of the event associated with this
offense.
Last Event Specifies the date and time since the last event occurred.
Hint: If you wish to view an offense in a new window, press CTRL+double-click on
an offense.
Step 3 Double-click the offense you wish to view.
The Offense details panel appears.
STRM Users Guide
Page 87
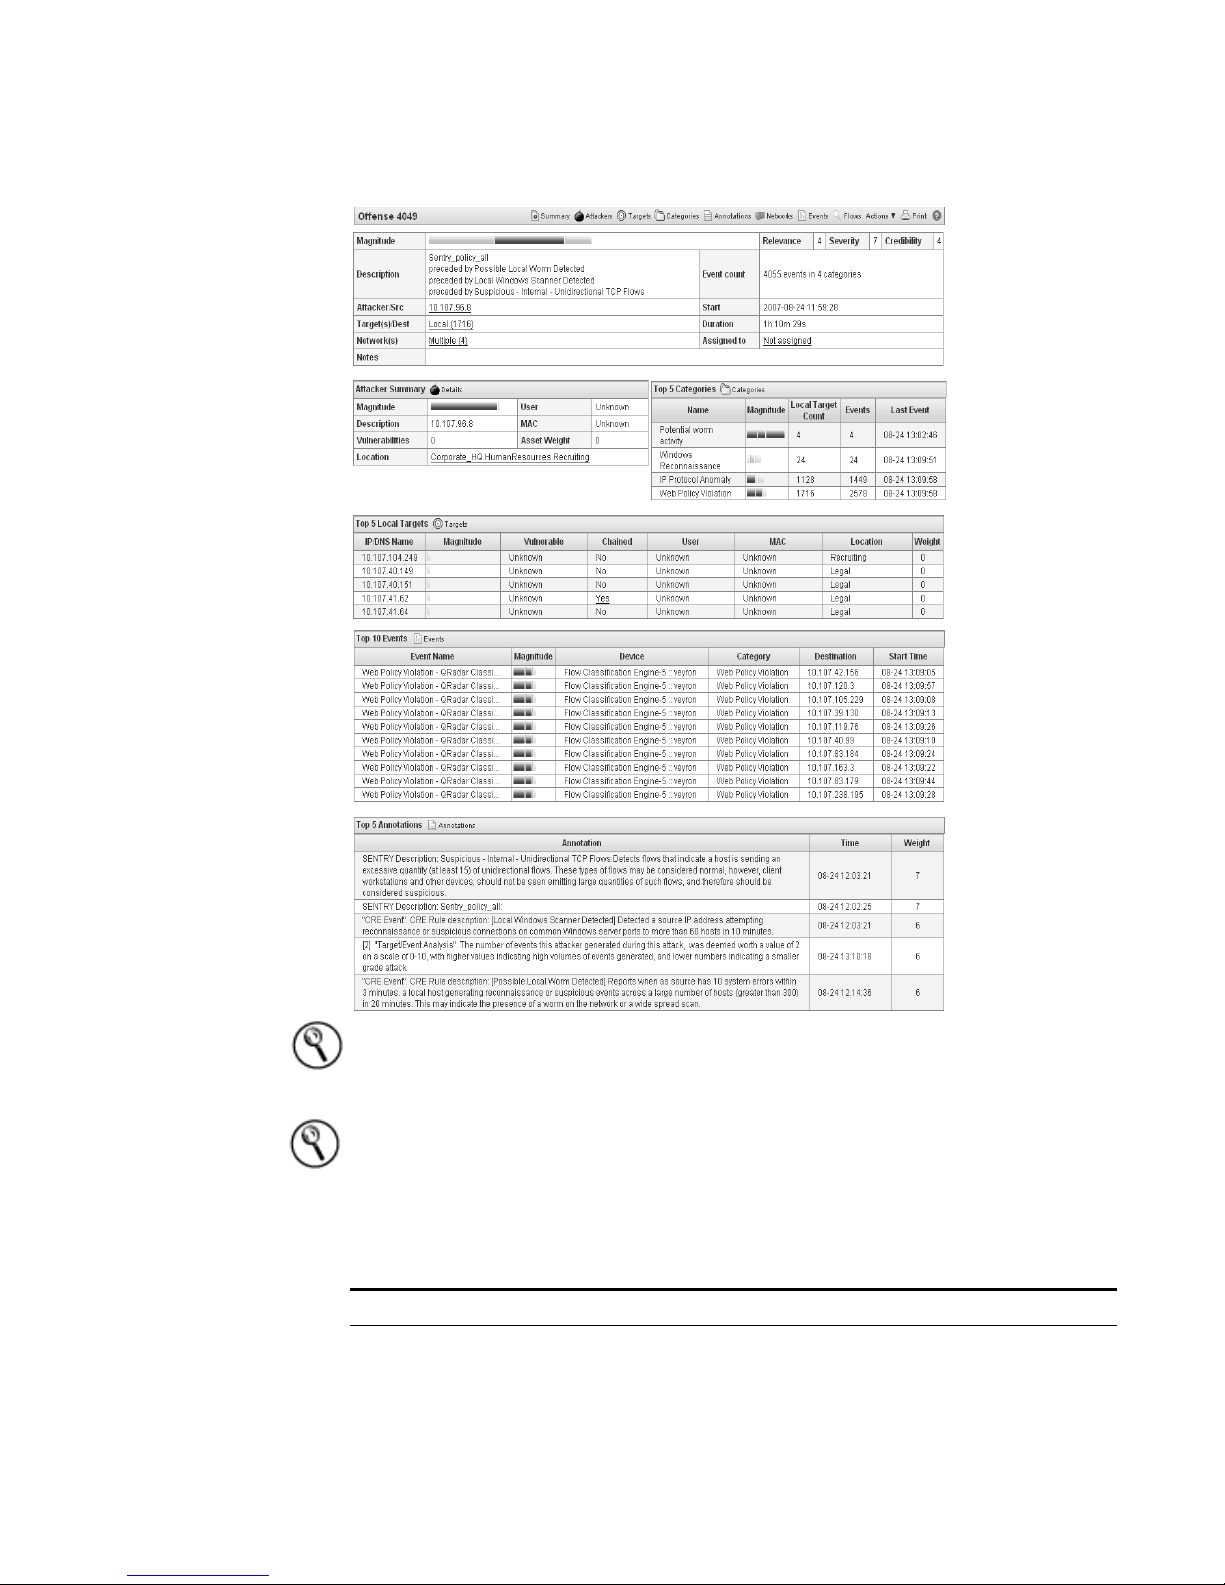
Managing Offenses 81
Hint: The top of the panel displays the navigation trail to the current view. If you
wish to return to a previously viewed panel, click the panel name on the navigation
trail.
Hint: To view any section of the summary panel is greater details, click the
associated toolbar option. For example, if you wish to view the details of the
Attacker Summary information, click Details.
The details panel provides the following information:
Table 5-3 Offense Details Panel
Parameter Description
Offense Provides overview details for the offense.
STRM Users Guide
Page 88

82 INVESTIGATING OFFENSES
Table 5-3 Offense Details Panel (continued)
Parameter Description
Magnitude Specifies the relative importance of the offense. The magnitude
bar provides a visual representation of all the correlated
variables of the offense, attacker, target, or network. Variables
include Relevance, Severity, and Credibility. Point your mouse
to the magnitude bar to display the values and the calculated
magnitude.
Description Specifies a description of the offense.
Attacker/Src Specifies the IP address of the attacker. To view additional
information on the attacker, click the IP address.
For more information on attackers, see
Attacker
.
Managing Offenses By
Target(s)/Dest Specifies the local or remote target of the offense. To view
additional information on the target, click the IP address or term
that appears.
If the term local appears, click the term to view the local targets.
If the term remote appears, click the term to view the remote
targets.
For more information on targets, see
Managing Offenses By
Targets
Network(s) Specifies the targeted network for this offense. If the offense has
one targeted network, this field displays the network leaf. Click
the link to view the network information. If the offense has more
than one targeted network, the term Multiple appears. Click the
link to view additional details.
Notes Specifies any user notes on this offense. You can include up to
255 characters.
Relevance Specifies the relative importance of the offense.
Severity Specifies the severity of the offense. Severity indicates the
amount of threat than an attacker poses in relation to how
prepared the target is for the attack. This value is directly
mapped to the event category that is correlated to the offense.
For example, a Denial of Service (DoS) attack is always
considered a 10, which indicates a very severe occurrence.
Credibility Specifies the credibility of an offense, as determined by the
credibility rating from source devices. For example, credibility is
increased when multiple sources report the same event.
Event count Specifies the number of events that have occurred for this
offense in the number of event categories.
Start Specifies the date in which the first event occurred for this
offense.
Duration Specifies the amount of time since this offense was first
detected.
STRM Users Guide
Page 89

Managing Offenses 83
Table 5-3 Offense Details Panel (continued)
Parameter Description
Assigned to Specifies the user assigned to this offense.
If not user is assigned, this field indicates Not Assigned. Click
Not Assigned to assign this offense to a user.
Attacker
Summary
Specifies information on details of the attacker that created this
offense. Click Details to view additional information.
Magnitude Specifies the relative importance of the attacker. The magnitude
bar provides a visual representation of all the correlated
variables of the attacker. Variables include the vulnerability
assessment risk and the amount of threat posed.
• Threat Posed - The calculated value for this attacker over
time, that indicates how severe the attacker is compared to all
other attackers in your network.
• Vulnerability Risk - The vulnerability assessment risk level
(0 to 10) for the asset where 0 is the lowest and 10 is the
highest. This is a weighted value against all other hosts in
your deployment.
Point your mouse to the magnitude bar to display values and the
calculated magnitude.
Description Specifies the name or IP address of the attacker.
Vulnerabilities Specifies the number of identified vulnerabilities associated with
this attacker. This value also includes the number of active and
passive vulnerabilities.
Location Specifies the network location where this attacker is located. If
the location is local, you can click the link to view the networks.
User Specifies the user associated to this attacker when the attack
began. If no user is identified, the field indicates unknown.
MAC Specifies the MAC address of the IP address when the offense
began. If the MAC address is unknown, this field is unknown.
Asset Weight Specifies the asset weight, as assigned using the Asset Profile
function.
Top 5 Categories Specifies the top 5 global categories, which are part of this
offense, organized by magnitude. Click Categories to view
additional information.
Name Specifies the name of the category.
Magnitude Specifies the relative importance of the offense. The magnitude
bar provides a visual representation of all the correlated
variables of the attacker. Variables include Relevance, Severity,
and Credibility. Point your mouse to the magnitude bar to values
for the offense and the calculated magnitude.
Local Target Count Specifies the number of local targets associated with this
offense.
Events Specifies the number of events in this offense that are
associated with this category.
STRM Users Guide
Page 90

84 INVESTIGATING OFFENSES
Table 5-3 Offense Details Panel (continued)
Parameter Description
Last Events Specifies the date and time that this event was detected for this
category in this offense.
Top 5 Targets Specifies the top 5 local targets, organized by magnitude, which
are part of this offense. If no local targets exist for this offense,
no link appears. Click Targets to view additional information.
IP/DNS Name Specifies the IP address or DNS name of the asset.
Magnitude Specifies the relative importance of the target. The magnitude
bar provides a visual representation of all the correlated
variables of the target. Variables include the vulnerability
assessment risk and threat under.
• Vulnerability Risk - The vulnerability assessment risk level
(0 to 10) for the asset where 0 is the lowest and 10 is the
highest. This is a weighted value against all other hosts in
your deployment.
• Threat Under - The value applied to the threat a target is
under over time. This is calculated based on the average
weighted value of the threat under over time.
Point your mouse to the magnitude bar to display values and the
calculated magnitude.
Vulnerable Specifies if this target is known to be vulnerable to this offense. If
this target is vulnerable, this field indicates Yes. Otherwise, this
field indicates Unknown.
Chained Specifies if this target has attacked since the offense was first
detected. If this target has attacked, the term Yes appears. Click
Yes to view the attacker summary for the IP address at the time
that IP address became a part of the offense.
User Specifies the user associated to this target when the IP address
was targeted by this offense.
MAC Specifies the MAC address of this IP address. If unknown, this
field indicates Unknown.
Location Specifies the location of this target.
Weight Specifies the weight of the asset.
Top 10 Events Specifies the top 10 events, in the last hour, organized by
magnitude, which are part of this offense. Click Events to view
additional information.
Event Name Specifies a name for this event.
Magnitude Specifies the relative importance of the offense. The magnitude
bar provides a visual representation of all the correlated
variables of the attacker. Variables include Relevance, Severity,
and Credibility. Point your mouse to the magnitude bar to values
for the offense and the calculated magnitude.
Device Specifies the devices that detected this event.
Category Specifies the category of this event.
STRM Users Guide
Page 91
Managing Offenses 85
Table 5-3 Offense Details Panel (continued)
Parameter Description
Destination Specifies the destination IP address or name of this event.
Start Time Specifies the date and time when the first event was detected in
this normalized event.
Top 5 Annotations Specifies the top 5 annotations for this offense. Click
Annotations to view additional information. The last annotation
in the list is the first annotation created for this offense.
Annotation Specifies the details for this offense.
Date Specifies the date and time that this annotation was created.
Weight Specifies the weight of this annotation.
The Offense details toolbar provides the following functions:
Table 5-4 Offense Panel Toolbar
Icon Function
Allows you to return to the detailed summary view for an offense.
Allows you to view all attackers for this offense including:
• Flag - Specifies action taken on the attacker, for example, if a flag
appears, the attacker is marked for follow-up. Point your mouse over
the icon to display additional information.
• Identity - Specifies the IP address of the attacker.
• Location - Specifies the location of the attacker.
• Magnitude - Specifies the relative importance of this attacker. The
magnitude bar provides a visual representation of all the correlated
variables of the attacker. Variables include the vulnerability
assessment risk and the amount of threat posed. Point your mouse
to the magnitude bar to values for the offense and the calculated
magnitude.
Threat Posed - The calculated value for this attacker over time that
indicates how severe the attacker is compared to all other attackers
in your network.
Vulnerability Risk - The vulnerability assessment risk level (0 to 10)
for the asset where 0 is the lowest and 10 is the highest. This is a
weighted value against all other hosts in your deployment.
• Offenses -Specifies the number of offenses associated with this
attacker.
• Local Target(s)/Dest - Specifies the number of targets associated
with this attacker.
• Events - Specifies the number of events associated with this
attacker.
For more information on attackers, see
Attacker
.
Managing Offenses By
STRM Users Guide
Page 92

86 INVESTIGATING OFFENSES
Table 5-4 Offense Panel Toolbar (continued)
Icon Function
Allows you to view all local targets for this offense including:
• Flag - Specifies action taken on the offense, for example, if a flag
appears, the offense is marked for follow-up or if a user icon
appears, the offense has been assigned to a user. Point your mouse
over the icon to display additional information.
• IP/DNS Name - Specifies the IP address of the local target. If DNS
lookups is enabled in the STRM Administration Console, you can
view the DNS name by pointing your mouse over the IP address or
asset name. For more information, see the STRM Administration
Guide.
• Magnitude - Specifies the relative importance of the target. The
magnitude bar provides a visual representation of all the correlated
variables of the target. Variables include the vulnerability
assessment risk and threat under.
Threat Under - The value applied to the threat a target is under over
time. This is calculated based on the average weighted value of the
threat under over time.
Vulnerability Risk - The vulnerability assessment risk level (0 to 10)
for the asset where 0 is the lowest and 10 is the highest. This is a
weighted value against all other hosts in your deployment.
Point your mouse to the magnitude bar to display values and the
calculated magnitude.
• Location - Specifies the network location of the target.
• Offenses - Specifies the number of offenses associated with this
target. This parameter does not appear for remote targets.
• Attackers/Src - Specifies the number of attackers associated with
this target. This parameter does not appear for remote targets.
• Events - Specifies the number of events associated with this
offense.
• Last Event - Specifies the date of the last event.
• Weight - Specifies the weight of this target.
If the targets associated with this offense are remote, a seperate
window opens providing information for the remote targets. For more
information on targets, see
Managing Offenses By Targets.
STRM Users Guide
Page 93
Table 5-4 Offense Panel Toolbar (continued)
Icon Function
Allows you to view category information for this offense including:
Hint: You can also further investigate the events relating to a specific
category by using the right mouse button (right-click) and select
Events.
• Name - Specifies the name of the category associated with this
offense.
• Magnitude - Specifies the relative importance of the offense. The
magnitude bar provides a visual representation of all the correlated
variables of the attacker. Variables include Relevance, Severity, and
Credibility. Point your mouse to the magnitude bar to values for the
offense and the calculated magnitude.
• Local Target Count - Specifies the number of targets associated
with this category.
• Events - Specifies the number of events associated with this
category.
• Last Event - Specifies the date of the last event.
For more information on categories, see the Event Category
Correlation Reference Guide.
Allows you to view all annotations for this offense including:
• Annotation - Specifies the details for this offense.
• Time - Specifies the date and time of the offense.
• Weight - Specifies the weight of this annotation.
Allows you to view all remote targets for this offense including:
• Flag - Specifies action taken on the offense, for example, if a flag
appears, the offense is marked for follow-up or if a user icon
appears, the offense has been assigned to a user. Point your mouse
over the icon to display additional information.
• Name - Specifies the name of the targeted network.
• Magnitude - Specifies the relative importance of this target to the
offense. The magnitude bar provides a visual representation of all
the correlated variables of the target. Variables include Threat
Under, Threat Posed, and Vulnerability Assessment. Point your
mouse to the magnitude bar to display values and the calculated
magnitude.
• Attackers/Src - Specifies the number of attackers associated with
this target.
• Offenses Targeted - Specifies the number of offenses targeted at
this network.
• Offenses Launched - Specifies the number of offenses launched
by this network.
• Events - Specifies the number of events associated with this
offense.
Managing Offenses 87
STRM Users Guide
Page 94

88 INVESTIGATING OFFENSES
Table 5-4 Offense Panel Toolbar (continued)
Icon Function
Allows you to search for all events for this offense. For information on
searching events, see
Chapter 6 Using the Event Viewer.
The number of events results displayed is determined by the Web Max
Matched Results parameter in the System Settings. For more
information, see the STRM Administration Guide.
Allows you to further investigate the flows associated with this offense.
See
Chapter 7 Using the Flow Viewer.
The number of flow results displayed is determined by the Web Max
Matched Results parameter in the System Settings. For more
information, see the STRM Administration Guide.
Actions Using the Actions drop-down list box, you can choose one of the
following actions:
• Follow up - Allows you to mark this offense for further follow-up.
See
Marking an Item For Follow-Up.
• Hide - Allows you to hide this offense. For more information on
hiding offenses, see
• Close - Allows you to close this offense. For more information on
closing offenses, see
• Email - Allows you to be notified through e-mail in the event this
offense changes. See
• Notes - Allows you to add notes to the offense. See Adding Notes.
• Assign - Allows you to assign this offense to a user. See Assigning
Offenses to Users
Hiding Offenses.
Closing an Offense.
Configuring Notification.
.
Allows you to print the offense.
Searching Offenses To search offenses:
Step 1 Click the Offense Manager tab.
The Offense Manager window appears.
Step 2 Click All Offenses.
The Offenses summary window appears.
Step 3 Click Search.
The Search window appears.
STRM Users Guide
Page 95
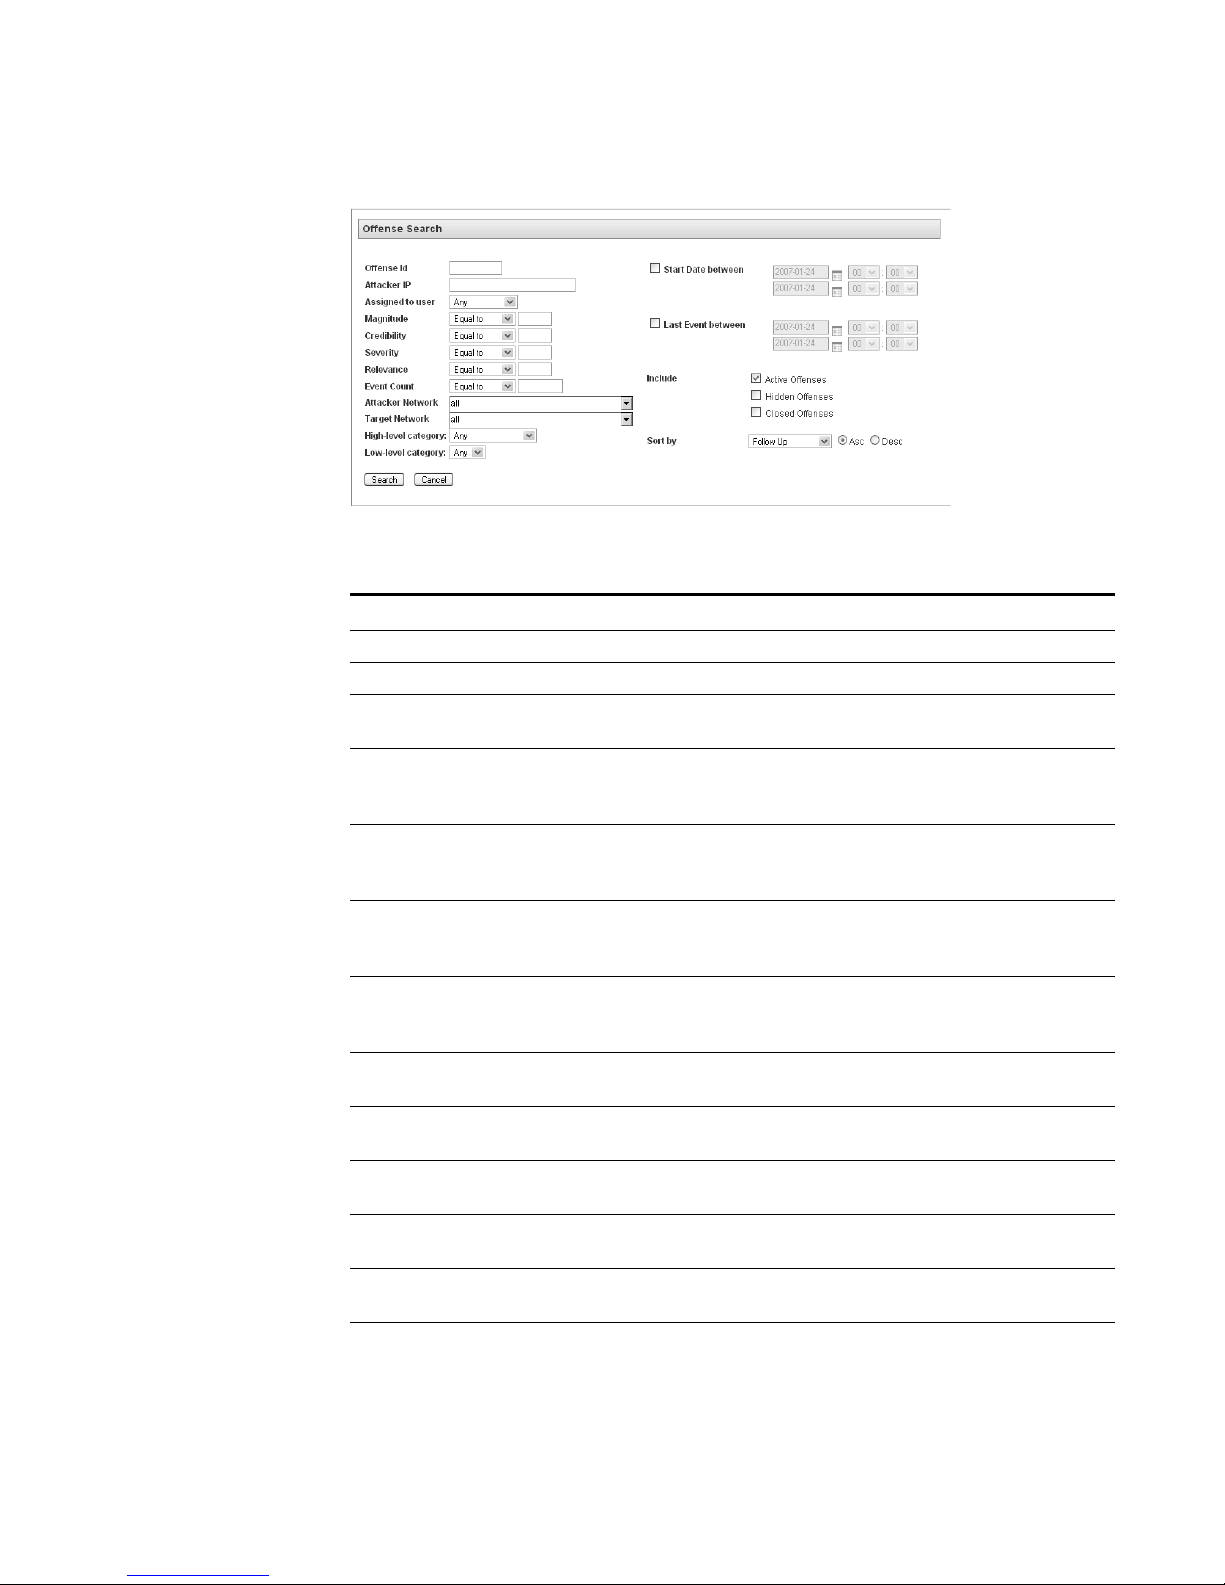
Managing Offenses 89
Step 4
Enter values for the parameters:
Table 5-5 Offense Search Parameters
Item Description
Offense Id Specify the offense identifier you wish to search.
Attacker IP Specify the IP address or CIDR range of the attacker.
Assigned to
user
Using the drop-down list box, select for an offense assigned to a
specific user. If you wish to search all users, select Any.
Magnitude Using the drop-down list box, select if you wish to search magnitude
equal to, less than, or greater than the configured value. The range is
0 to 10.
Credibility Using the drop-down list box, select if you wish to search credibility
equal to, less than, or greater than the configured value. The range is
0 to 10.
Severity Using the drop-down list box, select if you wish to search severity
equal to, less than, or greater than the configured value. The range is
0 to 10.
Relevance Using the drop-down list box, select if you wish to search relevance
equal to, less than, or greater than the configured value. The range is
0 to 10.
Event Count Using the drop-down list box, select if you wish to search the event
count equal to, less than, or greater than the configured value.
Attacker
Network
Target
Network
High-Level
Category
Low-Level
Category
Start Date
Between
Using the drop-down list box, select the attacker network you wish to
search. To search all networks, select all.
Using the drop-down list box, select the target network you wish to
search. To search all networks, select all.
Using the drop-down list box, select the high-level category you wish
to search. To search all categories, select Any.
Using the drop-down list box, select the low-level category you wish
to search. To search all categories, select Any.
Select the check box if you wish to search offenses that started
during a certain time period. Once you select the check box, use the
calendar to select the dates you wish to search.
STRM Users Guide
Page 96

90 INVESTIGATING OFFENSES
Table 5-5 Offense Search Parameters (continued)
Step 5 Click Search.
The search results appear.
Step 6 If you wish to view offenses for all magnitudes, click Clear Filter.
Item Description
Last Event
Between
Select the check box if you wish to search offenses that the last
detected event occurred within a certain time period. Once you select
the check box, use the calendar to select the dates you wish to
search.
Include Select the check box(es) for each option you wish this search to
include. The options are:
• Active Offenses
• Hidden Offenses
• Closed Offenses
Sort by Using the drop-down list box, select the parameter you wish to use to
sort the search results. Also, select the Asc (Ascending) or Desc
(Descending) parameters to determine how the search results
appear in the list.
Removing Offenses You can remove an offense from the Offense Manager using one of the following
options:
• Hiding an offense - Once you hide an offense, the offense no longer appears
in the Offense Manager, however, if you perform a search that includes the
hidden offenses, the item appears in the search results.
• Closing an offense - You can close (delete) an offense from either the
summary or offense details panels. Closing an offense removes the offense
from the database. If any additional events occur for that offense, a new offense
is created.
• Closing all filtered offenses - The offenses that appear in the summary
window include all offenses with a magnitude above the configured value. You
can close (delete) all filtered offenses from the summary panel. Closing these
offenses removes the offenses from the database. If any additional events
occur for that offense, a new offense is created.
You can hide or close an offense from either summary or detail panels. The
procedures below provides information for hiding and closing offenses from the
summary panel.
This section includes:
• Hiding Offenses
• Viewing Hidden Offenses
• Closing an Offense
STRM Users Guide
Page 97

• Closing Filtered Offenses
Hiding Offenses
To hide an offense:
Step 1 Click the Offense Manager tab.
The Offense Manager window appears.
Step 2 Click All Offenses.
The Offenses panel appears.
Step 3 Select the offense you wish to hide.
Hint: To hide multiple offenses, hold the CTRL key while you select each offense
you wish to hide.
Step 4 Using the Actions drop-down list box, select Hide.
A confirmation window appears.
Step 5 Click Ok.
The Offense Summary window appears with the original option selected in the
navigation menu.
Managing Offenses 91
Note: Hiding an offense does not affect the offense counts that appear in the By
Category section of the Offense Manager.
Viewing Hidden Offenses
To view hidden offenses:
Step 1 Click the Offense Manager tab.
The Offense Manager window appears.
Step 2 Click All Offenses.
The Offenses panel appears.
Step 3 Using the Actions drop-down list box, select Show.
Closing an Offense
To close an offense:
Step 1 Click the Offense Manager tab.
The Offense Manager window appears.
Step 2 Click All Offenses.
The Offenses panel appears.
Step 3 Select the offense you wish to close.
Hint: To delete multiple offenses, hold the CTRL key while you select each offense
you wish to close.
STRM Users Guide
Page 98

92 INVESTIGATING OFFENSES
Step 4 From the Actions drop-down list box, select Close.
A confirmation window appears.
Step 5 Click Ok.
The Offense Summary window appears with the original option selected in the
navigation menu.
Note: Once you close an offense, the counts that appear in the By Category
section of the Offense Manager may take several minutes to reflect the closed
offense.
Closing Filtered Offenses
To close filtered offenses:
Step 1 Click the Offense Manager tab.
The Offense Manager window appears.
Step 2 Click All Offenses.
The Offenses panel appears.
Step 3 Using the Actions drop-down list box, select Close Listed.
A confirmation window appears.
Step 4 Click Ok.
Assigning Offenses
to Users
Step 1 Click the Offense Manager tab.
Step 2 Click All Offenses.
Step 3 Select the offense you wish to assign.
The Offense Summary window appears.
Using the Offense Manager, you can assign offenses to STRM users. You must
have appropriate privileges to assign offenses to users. For more information on
user roles, see the STRM Administration Guide.
You can assign offenses to users from either summary or detail panels. The
procedures below provides information for assigning offenses from the summary
panel. However, you must have appropriate permissions to assign offenses to
users. For more information on user roles, see the STRM Administration Guide.
To assign an offense to a user:
The Offense Manager window appears.
The Offenses summary window appears.
Hint: To assign multiple offenses, hold the CTRL key while you select each
offense you wish to assign.
Step 4 From the Actions drop-down list box, select Assign.
The Assign User window appears.
STRM Users Guide
Page 99
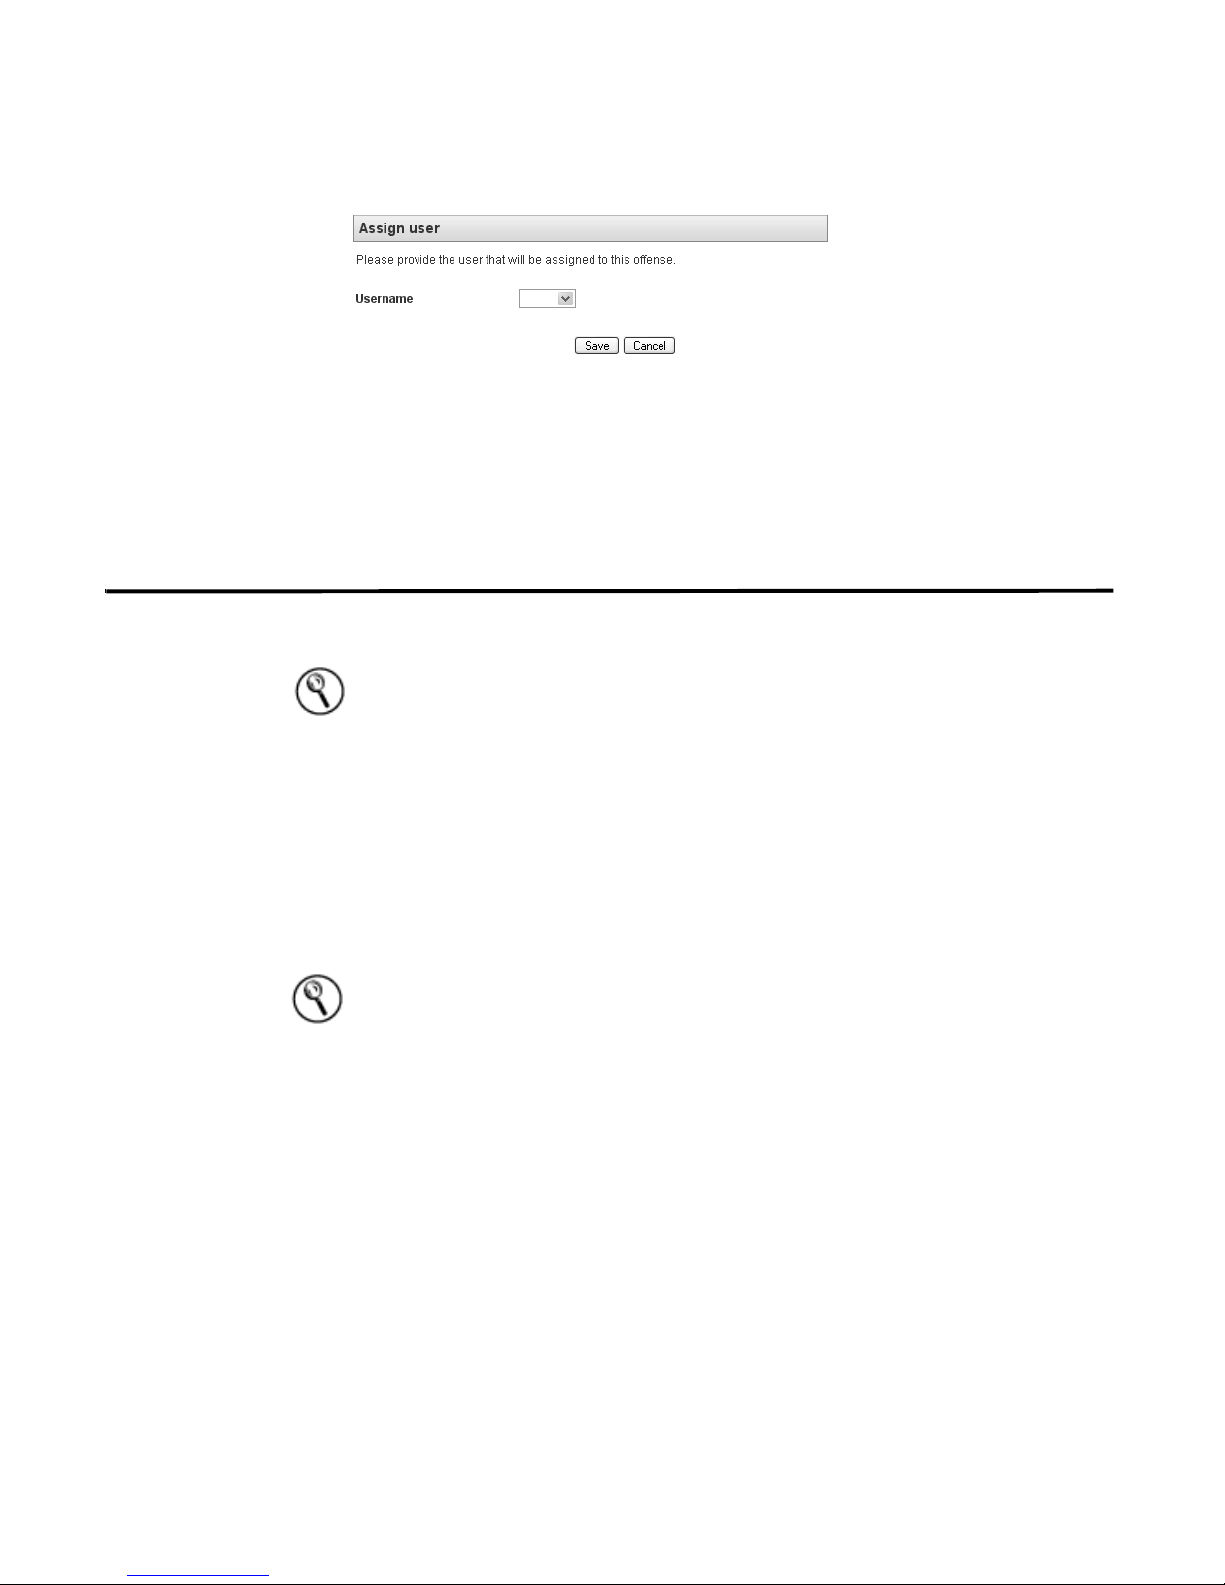
Viewing Offense By Category 93
Step 5 From the Username drop-down list box, select the user you wish to assign this
offense.
Step 6 Click Save.
The offense is assigned to the selected user. The user icon appears in the Flag
column of the offenses indicating the offense is assigned. The user can also see
this offense in the My Offenses interface.
Viewing Offense By
Category
Step 1 Click the Offense Manager tab.
Step 2 Click By Category from the navigation menu.
The By Category panel provides you with a view of all offenses based on the
high-level category.
Hint: By default, the By Category view is organized offense count. Click Save
Layout at any time to save the current display as your default view. The next time
you log in to the Offense Manager, the saved layout appears.
To view offenses using the by category view:
The Offense Manager window appears.
The By Category view appears displaying high-level categories. The counts for
each category are accumulated from the values in the low-level categories.
Hint: Only low-level categories with associated offenses appear with an arrow.
You can click the arrow to view the associated low-level categories. If you wish to
view all categories, click Show Inactive Categories.
STRM Users Guide
Page 100
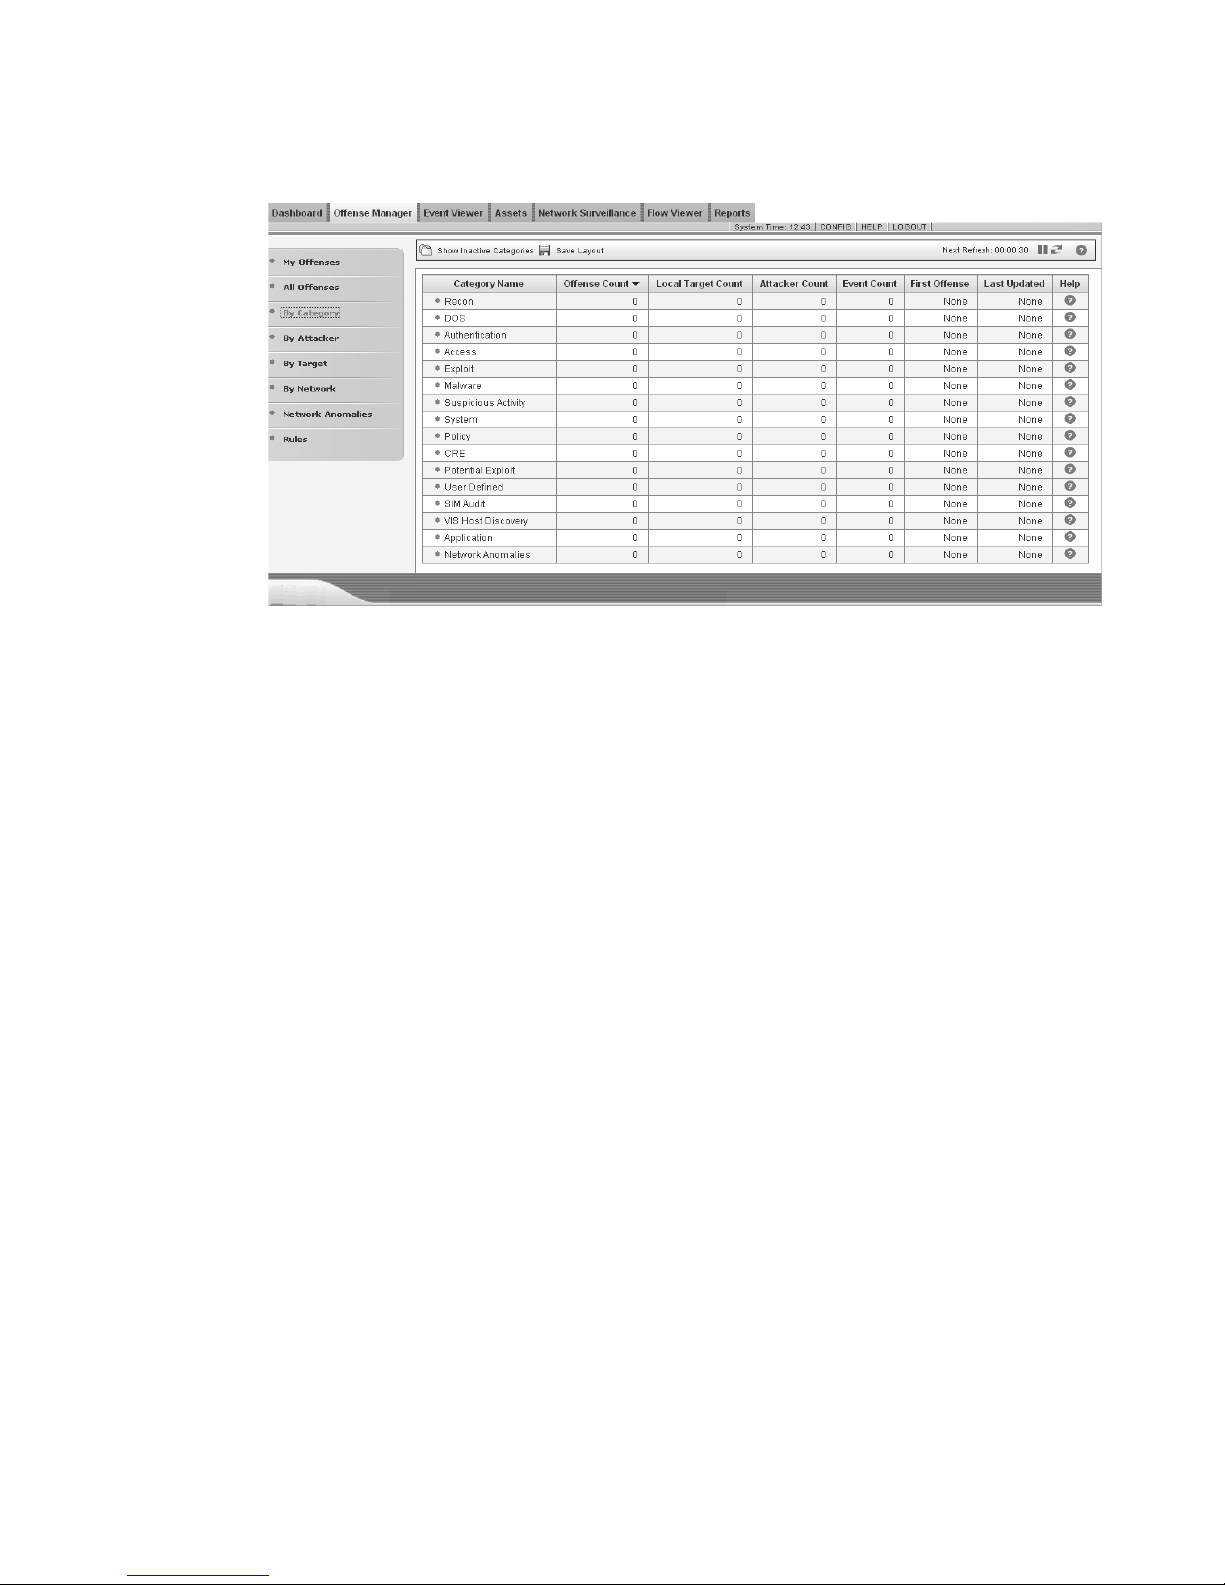
94 INVESTIGATING OFFENSES
STRM Users Guide
 Loading...