

Page 1

J-Web User Guide for SRX Series Devices
Published
2020-11-13
Page 2

Juniper Networks, Inc.
1133 Innovation Way
Sunnyvale, California 94089
USA
408-745-2000
www.juniper.net
Juniper Networks, the Juniper Networks logo, Juniper, and Junos are registered trademarks of Juniper Networks, Inc. in
the United States and other countries. All other trademarks, service marks, registered marks, or registered service marks
are the property of their respective owners.
Juniper Networks assumes no responsibility for any inaccuracies in this document. Juniper Networks reserves the right
to change, modify, transfer, or otherwise revise this publication without notice.
J-Web User Guide for SRX Series Devices
Copyright © 2020 Juniper Networks, Inc. All rights reserved.
The information in this document is current as of the date on the title page.
ii
YEAR 2000 NOTICE
Juniper Networks hardware and software products are Year 2000 compliant. Junos OS has no known time-related
limitations through the year 2038. However, the NTP application is known to have some difficulty in the year 2036.
END USER LICENSE AGREEMENT
The Juniper Networks product that is the subject of this technical documentation consists of (or is intended for use with)
Juniper Networks software. Use of such software is subject to the terms and conditions of the End User License Agreement
(“EULA”) posted at https://support.juniper.net/support/eula/. By downloading, installing or using such software, you
agree to the terms and conditions of that EULA.
Page 3

Table of Contents
1
2
About the Documentation | xxxi
Documentation and Release Notes | xxxi
Documentation Conventions | xxxi
Documentation Feedback | xxxiv
Requesting Technical Support | xxxiv
Self-Help Online Tools and Resources | xxxv
Creating a Service Request with JTAC | xxxv
Juniper Web Device Manager
Getting Started | 2
iii
Juniper Web Device Manager Overview | 2
What is J-Web? | 2
Benefits of J-Web | 2
Start J-Web | 3
Prerequisites for Using J-Web | 3
Log On to J-Web | 4
Configure SRX Devices Using the J-Web Setup Wizard | 5
J-Web First Look | 26
Explore J-Web | 27
J-Web Launch Pad | 27
J-Web Top Pane | 28
J-Web Side Pane | 30
J-Web Main Pane | 33
J-Web Workflow Wizards | 36
Summary | 36
Dashboard
J-Web Dashboard | 38
Dashboard Overview | 38
What is J-Web Dashboard | 38
Chassis View | 39
Page 4

Work with Widgets | 40
3
Monitor
Interfaces | 48
Monitor Ports | 48
Monitor PPPoE | 51
Access | 55
Monitor Address Pools | 55
Multi Tenancy | 57
Monitor Logical Systems | 57
Monitor Tenants | 60
Alarms | 64
iv
Monitor Alarms | 64
Monitor Policy Log | 65
Events | 67
Monitor All Events | 67
Monitor Firewall Events | 72
Monitor Web Filtering Events | 77
Monitor IPSec VPNs Events | 81
Monitor Content Filtering Events | 85
Monitor Antispam Events | 89
Monitor Antivirus Events | 93
Monitor IPS Events | 97
Monitor Screen Events | 101
Monitor Security Intelligence Events | 103
Monitor ATP Events | 105
Monitor System Events | 107
Users | 110
Monitor Users | 110
Page 5

Device | 112
Monitor Chassis Information | 112
Monitor Cluster Status | 114
Monitor Cluster Statistics | 115
Monitor Ethernet Switching | 118
Monitor Voice ALGs—Summary | 119
Monitor Voice ALGs—H323 | 120
Monitor Voice ALGs—MGCP | 122
Monitor Voice ALGs—SCCP | 125
Monitor Voice ALGs—SIP | 127
Monitor DS-Lite | 131
Routing | 133
Monitor Route Information | 133
v
Monitor RIP Information | 136
Monitor OSPF Information | 137
Monitor BGP Information | 140
Class of Service | 142
Monitor CoS Interfaces | 142
Monitor Classifiers | 143
Monitor CoS Value Aliases | 144
Monitor RED Drop Profiles | 144
Monitor Forwarding Classes | 145
Monitor Rewrite Rules | 146
Monitor Scheduler Maps | 147
MPLS | 150
Monitor MPLS Interfaces | 150
Monitor LSP Information | 151
Monitor LSP Statistics | 152
Monitor RSVP Sessions | 153
Monitor RSVP Interfaces | 155
Page 6

DHCP | 156
Monitor DHCP Server | 156
Monitor DHCP Relay | 158
NAT | 160
Monitor Source NAT | 160
Monitor Destination NAT | 166
Monitor Static NAT | 168
Monitor Interface NAT Ports | 170
Authentication | 172
Monitor Firewall Authentication | 172
Monitor Local Authentication | 173
Monitor UAC Authentication | 174
vi
Security Services | 176
Monitor Policy Activities | 176
Monitor Shadow Policies | 179
Monitor Screen Counters | 182
Monitor UTM—Antivirus | 183
Monitor UTM—Web Filtering | 185
Monitor UTM—Antispam | 186
Monitor UTM—Content Filtering | 187
Monitor ICAP Redirect | 188
Monitor IPS Attacks | 189
Monitor IPS Status | 192
Monitor Application Firewalls | 193
Monitor Applications | 194
Monitor Application Tracking | 196
Monitor AppQoS | 199
Monitor Threat Prevention—Diagnostics | 201
Monitor Threat Prevention—Statistics | 202
Page 7

IPsec VPN | 204
4
Monitor IPsec VPN—Phase I | 204
Monitor IPsec VPN—Phase II | 205
Flow Session | 208
Monitor Flow Session | 208
Flow Gate | 211
Monitor Flow Gate | 211
VLAN | 213
Monitor VLAN | 213
Wireless LAN | 215
vii
Monitor Wireless LAN | 215
Threats Map (Live) | 219
Monitor Threats Map (Live) | 219
Field Descriptions | 220
Threat Types | 221
Tasks You Can Perform | 222
Configure
Device Settings | 229
Configure Basic Settings | 229
Configure Chassis Cluster | 244
Configure Cluster (HA) Setup | 250
Configure PPPoE | 262
Configure VPN | 263
Configure NAT | 264
Setup Wizard | 266
Configure Setup Wizard | 266
Page 8

Interfaces—Ports | 289
About the Ports Page | 289
Tasks You Can Perform | 289
Field Descriptions | 289
Add a Logical Interface | 292
Edit a Logical Interface | 298
Delete Logical Interface | 299
Interfaces—Interconnecting Ports | 300
About the Interconnecting Ports Page | 300
Tasks You Can Perform | 300
Field Descriptions | 301
Add a LT Logical Interface | 302
Edit a LT Logical Interface | 308
viii
Delete Logical Interface | 308
Search for Text in an Interconnect Ports Table | 309
Interfaces—VLAN | 310
About the VLAN Page | 310
Tasks You Can Perform | 310
Field Descriptions | 311
Add a VLAN | 311
Edit a VLAN | 313
Delete VLAN | 314
Assign an Interface to VLAN | 314
Search for Text in VLAN Table | 315
Interfaces—Link Aggregation | 316
About the Link Aggregation Page | 316
Tasks You Can Perform | 316
Field Descriptions | 317
Link Aggregation Global Settings | 317
Add a Logical Interface to Link Aggregation | 318
Add a Link Aggregation | 320
Page 9

Edit an Aggregated Interface | 321
Delete Link Aggregation | 322
Network— DHCP Client | 323
About the DHCP Client Page | 323
Tasks You Can Perform | 323
Field Descriptions | 323
Add DHCP Client Information | 324
Delete DHCP Client Information | 325
Network—DHCP Server | 327
About the DHCP Server Page | 327
Tasks You Can Perform | 327
Field Descriptions | 328
ix
Add a DHCP Pool | 329
Edit a DHCP Pool | 332
Delete DHCP Pool | 333
DHCP Groups Global Settings | 333
Add a DHCP Group | 334
Edit a DHCP Group | 334
Delete DHCP Group | 335
Network—Routing Instances | 336
About the Routing Instances Page | 336
Tasks You Can Perform | 336
Field Descriptions | 337
Add a Routing Instance | 337
Edit a Routing Instance | 338
Delete Routing Instance | 339
Page 10

Network—Static Routing | 340
About the Static Routing Page | 340
Tasks You Can Perform | 340
Field Descriptions | 340
Add a Static Route | 341
Edit a Static Route | 342
Delete Static Route | 343
Network—RIP Routing | 344
About the RIP Page | 344
Tasks You Can Perform | 344
Field Descriptions | 344
Add a RIP Instance | 345
Edit a RIP Instance | 347
x
Delete RIP Instance | 348
Edit RIP Global Settings | 348
Delete RIP Global Settings | 351
Network—OSPF Routing | 352
About the OSPF Page | 352
Tasks You Can Perform | 352
Field Descriptions | 352
Add an OSPF | 353
Edit an OSPF | 360
Delete OSPF | 361
Search for Text in an OSPF Table | 361
Network—BGP Routing | 363
About the BGP Page | 363
Tasks You Can Perform | 363
Field Descriptions | 363
Add a BGP Group | 365
Edit a BGP Group | 370
Delete a BGP Group | 371
Page 11

Edit Global Information | 371
Network—ALG | 376
About the ALG Page | 376
Field Descriptions | 376
Network—Forwarding Mode | 385
About the Forwarding Mode Page | 385
Field Descriptions | 385
Network—Policies | 387
About the Policies Page | 387
Tasks You Can Perform | 387
Field Descriptions | 387
xi
Global Options | 388
Add a Policy | 390
Clone a Policy | 398
Edit a Policy | 399
Delete Policy | 399
Test a Policy | 400
Network—DS-Lite | 401
About the DS-Lite Page | 401
Tasks You Can Perform | 401
Field Descriptions | 401
Add a DS-Lite | 402
Edit a DS-Lite | 403
Delete DS-Lite | 403
Network—CoS Value Alias | 404
About the Value Alias Configuration Page | 404
Tasks You Can Perform | 404
Field Descriptions | 404
Add a Code Point Alias | 405
Edit a Code Point Alias | 406
Page 12

Delete Code Point Alias | 406
Network—CoS Forwarding Classes | 408
About the Forwarding Classes Page | 408
Tasks You Can Perform | 408
Field Descriptions | 408
Add a Forwarding Class | 409
Edit a Forwarding Class | 410
Delete Forwarding Class | 410
Network—CoS Classifiers | 411
About the Classifiers Page | 411
Tasks You Can Perform | 411
Field Descriptions | 411
xii
Add a Classifier | 412
Edit a Classifier | 414
Delete Classifier | 414
Network—CoS Rewrite Rules | 416
About the Rewrite Rules Page | 416
Tasks You Can Perform | 416
Field Descriptions | 416
Add a Rewrite Rule | 417
Edit a Rewrite Rule | 419
Delete Rewrite Rule | 419
Network—CoS Schedulers | 420
About the Schedulers Page | 420
Tasks You Can Perform | 420
Field Descriptions | 420
Add a Scheduler | 421
Edit a Scheduler | 423
Delete Scheduler | 423
Page 13

Network—CoS Scheduler Maps | 424
About the Scheduler Maps Page | 424
Tasks You Can Perform | 424
Field Descriptions | 424
Add a Scheduler Map | 425
Edit a Scheduler Map | 426
Delete Scheduler Map | 427
Network—CoS Drop Profile | 428
About the Drop Profile Page | 428
Tasks You Can Perform | 428
Field Descriptions | 428
Add a Drop Profile | 429
Edit a Drop Profile | 430
xiii
Delete Drop Profile | 431
Network—CoS Virtual Channel Groups | 432
About the Virtual Channel Groups Page | 432
Tasks You Can Perform | 432
Field Descriptions | 432
Add a Virtual Channel | 433
Edit a Virtual Channel | 434
Delete Virtual Channel | 435
Network—CoS Assign To Interface | 436
About the Assign To Interface Page | 436
Tasks You Can Perform | 436
Field Descriptions | 436
Edit a Port | 437
Add a Logical Interface | 438
Edit a Logical Interface | 440
Delete Logical Interface | 440
Page 14

User Management | 442
About the User Management Page | 442
Tasks You Can Perform | 442
Field Descriptions | 442
Add an User | 446
Edit an User | 447
Delete User | 448
Search for Text in an User Management Table | 448
Users—Access Profile | 450
About the Access Profile Page | 450
Tasks You Can Perform | 450
Field Descriptions | 451
Add an Access Profile | 452
xiv
Edit an Access Profile | 455
Delete an Access Profile | 455
Users—Firewall Authentication | 457
About the Firewall Authentication Page | 457
Field Description | 457
Users—UAC Settings | 460
About the UAC Settings Page | 460
Field Description | 460
Security Objects—Application Tracking | 463
About the Application Tracking Page | 463
Field Description | 463
Security Objects—Address Pools | 465
About the Address Pools Page | 465
Tasks You Can Perform | 465
Field Descriptions | 466
Add an Address Pool | 466
Edit an Address Pool | 468
Page 15

Delete Address Pool | 468
Search for Text in an Address Pools Table | 469
Security Services—Policy Rules | 470
About the Rules Page | 470
Tasks You Can Perform | 470
Field Descriptions | 472
Global Options | 473
Add a Rule | 478
Clone a Rule | 486
Edit a Rule | 487
Delete Rules | 487
Search for Text in a Rules Table | 488
xv
Security Services—Policy Objects Zones/Screens | 489
About the Zones/Screens Page | 489
Tasks You Can Perform | 489
Field Descriptions | 489
Add a Zone | 490
Edit a Zone | 493
Delete Zone | 493
Add a Screen | 494
Edit a Screen | 502
Delete Screen | 502
Security Services—Policy Objects Services | 503
About the Services Page | 503
Tasks You Can Perform | 503
Field Descriptions | 503
Add a Custom Application | 505
Edit a Custom Application | 507
Delete Custom Application | 507
Add an Application Group | 508
Edit an Application Group | 509
Delete Application Group | 510
Page 16

Security Services—Policy Objects Zone Addresses | 511
About the Zone Addresses Page | 511
Tasks You Can Perform | 511
Field Descriptions | 512
Add Zone Addresses | 513
Edit Zone Addresses | 514
Delete Zone Addresses | 515
Search Text in a Zone Addresses Table | 515
Security Services—Policy Objects Global Addresses | 517
About the Global Addresses Page | 517
Tasks You Can Perform | 517
Field Descriptions | 517
Add an Address Book | 518
xvi
Edit an Address Book | 521
Delete Address Book | 521
Security Services—Policy Objects Proxy Profiles | 522
About the Proxy Profiles Page | 522
Tasks You Can Perform | 522
Field Descriptions | 523
Add a Proxy Profile | 523
Edit a Proxy Profile | 524
Delete Proxy Profile | 525
Security Services—Policy Objects Schedules | 526
About the Schedules Page | 526
Tasks You Can Perform | 526
Field Descriptions | 527
Add a Schedule | 527
Clone a Schedule | 529
Edit a Schedule | 530
Delete Schedule | 530
Search Text in Schedules Table | 531
Page 17

Security Services—IPv4 Firewall Filters | 532
About the IPv4 Page | 532
Tasks You Can Perform | 532
Field Descriptions | 532
Add IPv4 Firewall Filters | 533
Security Services—IPv6 Firewall Filters | 547
About the IPv6 Page | 547
Tasks You Can Perform | 547
Field Descriptions | 547
Add IPv6 Firewall Filters | 548
Security Services—Firewall Filters—Assign to Interfaces | 560
About the Assign to Interfaces Page | 560
xvii
Field Descriptions | 560
Security Services—Source NAT | 562
About the Source Page | 562
Tasks You Can Perform | 562
Field Descriptions | 563
Global Settings | 565
Add a Source Rule Set | 566
Edit a Source Rule Set | 569
Delete Source Rule Set | 570
Add a Source NAT Pool | 570
Edit a Source NAT Pool | 572
Delete Source NAT Pool | 572
Security Services—Destination NAT | 574
About the Destination Page | 574
Tasks You Can Perform | 574
Field Descriptions | 574
Add a Destination Rule Set | 576
Edit a Destination Rule Set | 579
Delete Destination Rule Set | 579
Page 18

Add a Destination NAT Pool | 580
Edit a Destination NAT Pool | 582
Delete Destination NAT Pool | 583
Security Services—Static NAT | 584
About the Static Page | 584
Tasks You Can Perform | 584
Field Descriptions | 585
Add a Static Rule Set | 586
Edit a Static Rule Set | 589
Delete Static Rule Set | 590
Security Services—NAT Proxy ARP/ND | 591
About the Proxy ARP/ND Page | 591
xviii
Tasks You Can Perform | 591
Field Descriptions | 591
Add a Proxy ARP | 592
Edit a Proxy ARP | 593
Delete a Proxy ARP | 594
Add a Proxy ND | 595
Edit a Proxy ND | 596
Delete Proxy ND | 596
Security Services—App Secure Application Signatures | 598
About the Application Signatures Page | 598
Tasks You Can Perform | 599
Field Descriptions | 600
Global Settings | 601
Add Application Signatures | 603
Clone Application Signatures | 605
Add Application Signatures Group | 606
Edit Application Signatures | 607
Delete Application Signatures | 608
Search Text in an Application Signatures Table | 608
Page 19

Security Services—UTM Default Configuration | 610
About the Default Configuration Page | 610
Tasks You Can Perform | 610
Field Descriptions | 611
Edit a Default Configuration | 611
Delete Default Configuration | 612
Security Services—UTM Antivirus | 614
About the Antivirus Page | 614
Tasks You Can Perform | 614
Field Descriptions | 615
Add an Antivirus Profile | 616
Clone an Antivirus Profile | 620
Edit an Antivirus Profile | 621
xix
Delete Antivirus Profile | 621
Security Services—UTM Web Filtering | 623
About the Web Filtering Page | 623
Tasks You Can Perform | 623
Field Descriptions | 624
Add a Web Filtering Profile | 625
Clone a Web Filtering Profile | 631
Edit a Web Filtering Profile | 632
Delete Web Filtering Profile | 632
Allow or Block Websites by Using J-Web Integrated UTM Web Filtering | 633
Benefits of UTM Web Filtering | 634
Why URL Filtering | 635
Web Filtering Workflow | 635
Scope | 635
Before You Begin | 636
Topology | 636
Sneak Peek – J-Web UTM Web Filtering Steps | 637
Step 1: List URLs That You Want to Allow or Block | 637
Step 2: Categorize the URLs That You Want to Allow or Block | 638
Page 20

Step 3: Add a Web Filtering Profile | 641
Step 4: Reference a Web Filtering Profile in a UTM Policy | 643
Step 5: Assign a UTM Policy to a Security Policy | 644
Step 6: Verify That the URLs Are Allowed or Blocked from the Server | 647
What’s Next | 647
Sample Configuration Output | 647
Security Services—UTM Category Update | 650
About the Category Update Page | 650
Tasks You Can Perform | 650
Field Descriptions | 651
Category Update Settings | 652
Download and Install Settings | 655
xx
Security Services—UTM Antispam Profiles | 656
About the Antispam Page | 656
Tasks You Can Perform | 656
Field Descriptions | 657
Add an Antispam Profile | 658
Clone an Antispam Profile | 659
Edit an Antispam Profile | 660
Delete Antispam Profile | 660
Security Services—UTM Content Filtering | 662
About the Content Filtering Page | 662
Tasks You Can Perform | 662
Field Descriptions | 663
Add a Content Filtering Profile | 664
Clone a Content Filtering Profile | 667
Edit a Content Filtering Profile | 668
Delete Content Filtering Profile | 668
Page 21

Security Services—UTM Custom Objects | 670
About the Custom Objects Page | 670
Tasks You Can Perform | 670
Field Descriptions | 671
Add a MIME Pattern List | 673
Add a File Extension List | 674
Add a Protocol Command List | 675
Add a URL Pattern List | 676
Add a URL Category List | 677
Add a Custom Message List | 679
Clone Custom Objects | 680
Edit Custom Objects | 681
Delete Custom Objects | 681
xxi
Security Services—UTM Policy | 683
About the Policy Page | 683
Tasks You Can Perform | 683
Field Descriptions | 684
Add a UTM Policy | 685
Clone a UTM Policy | 687
Edit a UTM Policy | 688
Delete UTM Policy | 689
Security Services—IPS Signature Update | 690
About the Signature Update Page | 690
Tasks You Can Perform | 690
Field Descriptions | 690
Download an IPS Signature | 691
Install an IPS Signature | 692
Check Status of the IPS Signature | 693
IPS Signature Download Setting | 694
Page 22

Security Services—IPS Sensor | 696
About the Sensor Page | 696
Field Descriptions | 696
Security Services—IPS Policy | 703
About the Policy Page | 703
Tasks You Can Perform | 703
Field Descriptions | 704
IDP Policy Template | 705
Check Status of the IDP Policy | 706
Add an IDP Policy | 706
Clone an IDP Policy | 709
Edit an IDP Policy | 710
Delete IDP Policy | 710
xxii
Security Services—Threat Prevention Policies | 712
About the Threat Prevention Policies Page | 712
Tasks You Can Perform | 712
Field Descriptions | 712
Add a Threat Prevention Policy | 713
Edit a Threat Prevention Policy | 714
Delete Threat Prevention Policy | 715
Search for Text in Threat Prevention Policies Table | 716
Security Services—IPSec VPN Global Settings | 717
About the Global Settings Page | 717
Field Descriptions | 717
Security Services—IPSec VPN IKE (Phase I) | 720
About the IKE (Phase I) Page | 720
Tasks You Can Perform | 720
Field Descriptions | 720
Add a Gateway | 722
Add an IPSec Policy | 726
Add a Proposal | 729
Page 23

Edit an IKE (Phase I) Configuration | 733
Delete IKE (Phase I) Configuration | 734
Security Services—IPSec VPN (Phase II) | 736
About the IKE (Phase II) Page | 736
Tasks You Can Perform | 736
Field Descriptions | 736
Add a VPN | 738
Add an IPSec Policy | 742
Add a Proposal | 745
Edit an IKE (Phase II) Configuration | 747
Delete IKE (Phase II) Configuration | 748
Security Services—IPSec Manual Key VPN | 749
xxiii
About the Manual Key VPN Page | 749
Tasks You Can Perform | 749
Field Descriptions | 749
Add a Manual Key VPN | 750
Edit a Manual Key VPN | 752
Delete Manual Key VPN | 753
Security Services—IPSec Dynamic VPN Global Settings | 754
About the Dynamic VPN Global Settings Page | 754
Tasks You Can Perform | 754
Field Descriptions | 754
Add a Dynamic VPN Global Settings | 755
Edit a Dynamic VPN Global Settings | 756
Delete Dynamic VPN Global Settings | 757
Security Services—User Firewall Active Directory | 758
About the Active Directory Page | 758
Security Services—User Firewall Authentication Priority | 763
About the Auth Priority Page | 763
Page 24

Security Services—User Firewall Local Authentication | 765
About the Local Auth Page | 765
Tasks You Can Perform | 765
Field Descriptions | 765
Add a Local Auth Entry | 766
Delete a Local Auth Entry | 767
Security Services—User Firewall Identity Management | 768
About the Identity Management Page | 768
Tasks You Can Perform | 768
Add an Identity Management Profile | 768
Edit an Identity Management Profile | 772
Delete Identity Management Profile | 773
xxiv
Security Services—SSL Initiation Profiles | 774
About the SSL Initiation Profile Page | 774
Tasks You Can Perform | 774
Field Descriptions | 775
Add a SSL Initiation Profile | 776
Edit a SSL Initiation Profile | 778
Delete SSL Initiation Profile | 779
Security Services—SSL Proxy Profiles | 780
About the SSL Proxy Page | 780
Tasks You Can Perform | 780
Field Descriptions | 781
Add a SSL Proxy Profile | 782
Clone a SSL Proxy Profile | 789
Edit a SSL Proxy Profile | 790
Delete SSL Proxy Profile | 790
Page 25

Security Services—ICAP Redirect | 792
About the ICAP Redirect Profile Page | 792
Tasks You Can Perform | 792
Field Descriptions | 793
Add an ICAP Redirect Profile | 794
Edit an ICAP Redirect Profile | 796
Delete ICAP Redirect Profile | 796
Wireless LAN—Settings | 798
About the Settings Page | 798
Tasks You Can Perform | 798
Field Descriptions | 798
Create an Access Point | 799
Edit an Access Point | 800
xxv
Delete Access Point | 801
Create an Access Point Radio Settings | 801
Edit an Access Point Radio Settings | 804
Delete Access Point Radio Settings | 805
Multi Tenancy—Logical Systems | 806
About the Logical Systems Page | 806
Tasks You Can Perform | 806
Field Descriptions | 807
Add a Logical System | 808
Edit a Logical System | 818
Delete Logical System | 818
Search Text in Logical Systems Table | 819
Multi Tenancy—Resource Profiles | 820
About the Resource Profiles Page | 820
Tasks You Can Perform | 820
Field Descriptions | 821
Global Settings | 822
Add a Resource Profile | 823
Page 26

Edit a Resource Profile | 826
5
Delete Resource Profile | 826
Multi Tenancy—Tenants | 828
About the Tenants Page | 828
Tasks You Can Perform | 828
Field Descriptions | 829
Add a Tenant | 830
Edit a Tenant | 837
Delete Tenant | 837
Search Text in Tenants Table | 838
Reports
Reports | 840
xxvi
About Reports Page | 840
Overview | 841
Generate Reports | 843
Threat Assessment Report | 845
Application and User Usage | 845
Top Talkers | 845
IPS Threat Environment | 846
Viruses Blocked | 846
URL Report | 846
Virus: Top Blocked | 847
Top Firewall Events | 847
Top Firewall Deny Destinations | 847
Top Firewall Service Deny | 847
Top Firewall Denies | 847
Top IPS Events | 847
Top Anti-spam Detected | 848
Top Screen Attackers | 848
Top Screen Victims | 848
Top Screen Hits | 848
Top Firewall Rules | 848
Page 27

Top Firewall Deny Sources | 848
6
Top IPS Attack Sources | 848
Top IPS Attack Destinations | 848
Top IPS Rules | 849
TopWeb Apps | 849
Top Roles | 849
Top Applications Blocked | 849
Top URLs by User | 849
Top Source Zone by Volume | 850
Top Applications by User | 850
Top Botnet Threats By Source Address via IDP Logs | 850
Top Botnet Threats by Destination Address via IDP Logs | 850
Top Botnet Threats by Threat Severity via IDP Logs | 850
Top Malware Threats by Source Address via IDP Logs | 851
xxvii
Top Malware Threats by Destination Address via IDP Logs | 851
Top Malware Threats by Threat Severity via IDP Logs | 851
Top Blocked Applications via Webfilter Logs | 851
Top Permitted Application Subcategories by Volume via Webfilter Logs | 851
Top Permitted Application Subcategories by Count via Webfilter Logs | 852
Administration
Devices | 854
Maintain Files | 854
About Files Page | 854
Clean Up Files | 855
Download and Delete Files | 855
Delete Backup JUNOS Package | 856
Maintain Reboot Schedule | 857
Maintain System Snapshots | 859
Upload Software Packages | 860
Install Software Packages | 861
Rollback Software Package Version | 862
Manage Upload Configuration Files | 863
Manage Configuration History | 864
Page 28

Manage Rescue Configuration | 867
License Management | 868
Manage Your Licenses | 868
About License Management Page | 868
Add License | 869
Delete Installed Licenses | 870
Update Installed Licenses | 870
Update Trial Licenses | 870
Display License Keys | 870
Download License Keys | 871
Software Feature Licenses | 871
Certificate Management | 873
xxviii
Manage Device Certificates | 873
About Device Certificates Page | 873
Import Certificate | 875
Export Certificate | 876
Viewing the Details of a Certificate | 876
Add a Certificate | 879
Delete Certificate | 881
Search Text in Device Certificates Table | 882
Manage Trusted Certificate Authority | 882
About Trusted Certificate Authority Page | 883
Generate Default Trusted CAs | 884
Enroll CA Certificate | 884
Import CA Certificate | 885
Add a CA Profile | 886
Edit a CA Profile | 889
Delete CA Profile | 890
Search Text in Trusted Certificate Authority Table | 890
Page 29

Manage Certificate Authority Group | 891
About Certificate Authority Group Page | 891
Import Trusted CA Group | 892
Add a CA Group | 893
Edit a CA Group | 894
Delete CA Group | 894
Search Text in Certificate Authority Group Table | 894
Network Monitoring | 896
Monitor Chassis Alarm | 896
About Chassis Alarm Page | 896
Create Chassis Alarm Definition | 896
Edit Chassis Alarm Definition | 900
Monitor System Alarm | 901
xxix
About System Alarm Page | 901
Create System Alarm Configuration | 901
Edit System Alarm Configuration | 904
RPM | 905
Setup RPM | 905
View RPM | 912
Tools | 917
Troubleshoot Ping Host | 917
About Ping Host Page | 917
Troubleshoot Ping MPLS | 920
About Ping MPLS Page | 921
Troubleshoot Traceroute | 925
About Traceroute Page | 925
Troubleshoot Packet Capture | 928
About Packet Capture Page | 928
Access CLI | 934
About CLI Terminal Page | 934
CLI Terminal Requirements | 934
CLI Overview | 934
Page 30

View CLI Configuration | 936
About CLI Viewer Page | 936
Edit CLI Configuration | 937
About CLI Editor Page | 937
Configure CLI | 938
About Point and Click CLI Page | 938
Sky ATP Enrollment | 944
Enroll Your Device with Juniper Sky ATP | 944
xxx
Page 31

About the Documentation
IN THIS SECTION
Documentation and Release Notes | xxxi
Documentation Conventions | xxxi
Documentation Feedback | xxxiv
Requesting Technical Support | xxxiv
Use this guide to understand the Junos Web Device Manager, its capabilities, and features.
xxxi
Documentation and Release Notes
To obtain the most current version of all Juniper Networks®technical documentation, see the product
documentation page on the Juniper Networks website at https://www.juniper.net/documentation/.
If the information in the latest release notes differs from the information in the documentation, follow the
product Release Notes.
Juniper Networks Books publishes books by Juniper Networks engineers and subject matter experts.
These books go beyond the technical documentation to explore the nuances of network architecture,
deployment, and administration. The current list can be viewed at https://www.juniper.net/books.
Documentation Conventions
Table 1 on page xxxii defines notice icons used in this guide.
Page 32

Table 1: Notice Icons
xxxii
DescriptionMeaningIcon
Indicates important features or instructions.Informational note
Caution
Indicates a situation that might result in loss of data or hardware
damage.
Alerts you to the risk of personal injury or death.Warning
Alerts you to the risk of personal injury from a laser.Laser warning
Indicates helpful information.Tip
Alerts you to a recommended use or implementation.Best practice
Table 2 on page xxxii defines the text and syntax conventions used in this guide.
Table 2: Text and Syntax Conventions
ExamplesDescriptionConvention
Fixed-width text like this
Italic text like this
Represents text that you type.Bold text like this
Represents output that appears on
the terminal screen.
Introduces or emphasizes important
•
new terms.
Identifies guide names.
•
Identifies RFC and Internet draft
•
titles.
To enter configuration mode, type
the configure command:
user@host> configure
user@host> show chassis alarms
No alarms currently active
A policy term is a named structure
•
that defines match conditions and
actions.
Junos OS CLI User Guide
•
RFC 1997, BGP Communities
•
Attribute
Page 33

Table 2: Text and Syntax Conventions (continued)
xxxiii
ExamplesDescriptionConvention
Italic text like this
Text like this
< > (angle brackets)
| (pipe symbol)
Represents variables (options for
which you substitute a value) in
commands or configuration
statements.
Represents names of configuration
statements, commands, files, and
directories; configuration hierarchy
levels; or labels on routing platform
components.
variables.
Indicates a choice between the
mutually exclusive keywords or
variables on either side of the symbol.
The set of choices is often enclosed
in parentheses for clarity.
Configure the machine’s domain
name:
[edit]
root@# set system domain-name
domain-name
To configure a stub area, include
•
the stub statement at the [edit
protocols ospf area area-id]
hierarchy level.
The console port is labeled
•
CONSOLE.
stub <default-metric metric>;Encloses optional keywords or
broadcast | multicast
(string1 | string2 | string3)
# (pound sign)
[ ] (square brackets)
Indention and braces ( { } )
; (semicolon)
GUI Conventions
Indicates a comment specified on the
same line as the configuration
statement to which it applies.
Encloses a variable for which you can
substitute one or more values.
Identifies a level in the configuration
hierarchy.
Identifies a leaf statement at a
configuration hierarchy level.
rsvp { # Required for dynamic MPLS
only
community name members [
community-ids ]
[edit]
routing-options {
static {
route default {
nexthop address;
retain;
}
}
}
Page 34

Table 2: Text and Syntax Conventions (continued)
xxxiv
ExamplesDescriptionConvention
Bold text like this
> (bold right angle bracket)
Represents graphical user interface
(GUI) items you click or select.
Separates levels in a hierarchy of
menu selections.
In the Logical Interfaces box, select
•
All Interfaces.
To cancel the configuration, click
•
Cancel.
In the configuration editor hierarchy,
select Protocols>Ospf.
Documentation Feedback
We encourage you to provide feedback so that we can improve our documentation. You can use either
of the following methods:
Online feedback system—Click TechLibrary Feedback, on the lower right of any page on the Juniper
•
Networks TechLibrary site, and do one of the following:
Click the thumbs-up icon if the information on the page was helpful to you.
•
Click the thumbs-down icon if the information on the page was not helpful to you or if you have
•
suggestions for improvement, and use the pop-up form to provide feedback.
E-mail—Send your comments to techpubs-comments@juniper.net. Include the document or topic name,
•
URL or page number, and software version (if applicable).
Requesting Technical Support
Technical product support is available through the Juniper Networks Technical Assistance Center (JTAC).
If you are a customer with an active Juniper Care or Partner Support Services support contract, or are
Page 35

covered under warranty, and need post-sales technical support, you can access our tools and resources
online or open a case with JTAC.
JTAC policies—For a complete understanding of our JTAC procedures and policies, review the JTAC User
•
Guide located at https://www.juniper.net/us/en/local/pdf/resource-guides/7100059-en.pdf.
Product warranties—For product warranty information, visit https://www.juniper.net/support/warranty/.
•
JTAC hours of operation—The JTAC centers have resources available 24 hours a day, 7 days a week,
•
365 days a year.
Self-Help Online Tools and Resources
For quick and easy problem resolution, Juniper Networks has designed an online self-service portal called
the Customer Support Center (CSC) that provides you with the following features:
Find CSC offerings: https://www.juniper.net/customers/support/
•
Search for known bugs: https://prsearch.juniper.net/
•
xxxv
Find product documentation: https://www.juniper.net/documentation/
•
Find solutions and answer questions using our Knowledge Base: https://kb.juniper.net/
•
Download the latest versions of software and review release notes:
•
https://www.juniper.net/customers/csc/software/
Search technical bulletins for relevant hardware and software notifications:
•
https://kb.juniper.net/InfoCenter/
Join and participate in the Juniper Networks Community Forum:
•
https://www.juniper.net/company/communities/
Create a service request online: https://myjuniper.juniper.net
•
To verify service entitlement by product serial number, use our Serial Number Entitlement (SNE) Tool:
https://entitlementsearch.juniper.net/entitlementsearch/
Creating a Service Request with JTAC
You can create a service request with JTAC on the Web or by telephone.
Visit https://myjuniper.juniper.net.
•
Call 1-888-314-JTAC (1-888-314-5822 toll-free in the USA, Canada, and Mexico).
•
For international or direct-dial options in countries without toll-free numbers, see
https://support.juniper.net/support/requesting-support/.
Page 36

1
PART
Juniper Web Device Manager
Getting Started | 2
Page 37

CHAPTER 1
Getting Started
IN THIS CHAPTER
Juniper Web Device Manager Overview | 2
Start J-Web | 3
Explore J-Web | 27
Juniper Web Device Manager Overview
2
IN THIS SECTION
What is J-Web? | 2
Benefits of J-Web | 2
What is J-Web?
Juniper Networks SRX Series Services Gateways are shipped with the Juniper Networks Junos operating
system (Junos OS) preinstalled.
Junos OS has the following primary user interfaces:
Juniper Web Device Manager (J-Web) GUI
•
Junos OS CLI
•
The J-Web interface allows you to monitor, configure, troubleshoot, and manage your device by means
of a Web browser enabled with HTTP over Secure Sockets Layer (HTTPS) by default. You can also use
Hypertext Transfer Protocol (HTTP) to access J-Web.
Benefits of J-Web
Provides a simple user interface that enables new users to quickly become proficient.
•
Page 38

Enables effective threat management while producing detailed data access and user activity reports. An
•
action-oriented design enables the network administrator to detect threats across the network as they
occur, quickly block the traffic going to or coming from a specific region, and apply immediate remedial
action with a single click.
Enables administrators to assess the effectiveness of each firewall rule and quickly identify the unused
•
rules, which results in better management of the firewall environment.
RELATED DOCUMENTATION
Start J-Web | 3
Explore J-Web | 27
Start J-Web
3
IN THIS SECTION
Prerequisites for Using J-Web | 3
Log On to J-Web | 4
Configure SRX Devices Using the J-Web Setup Wizard | 5
J-Web First Look | 26
Prerequisites for Using J-Web
To access the J-Web interface for all platforms, your management device requires the following software:
Supported browsers—Mozilla Firefox, Google Chrome, and Microsoft Internet Explorer.
•
NOTE: By default, you establish a J-Web session through an HTTPS-enabled Web browser.
Language support— English-version browsers.
•
Page 39

Log On to J-Web
To log into the J-Web interface:
1. Connect the network port of your device to the Ethernet port on the management device (laptop or
PC), using an RJ-45 cable.
NOTE: Following are the networks that you can use for your respective device:
For SRX300 and SRX320 devices, use network ports numbered 0/1 through 0/6.
•
For SRX550M, use network ports numbered 0/1 through 0/5.
•
For other SRX devices, use the management port labelled MGMT.
•
2. Ensure that the management device acquires an IP address from the device.
4
NOTE: The services gateway functions as a DHCP server and will assign an IP address to the
management device. This is applicable only for SRX300 line of devices and SRX550M devices.
If an IP address is not assigned to the management device, manually configure an IP address.
3. Open a browser, and enter https://<IP address> in the address bar.
Where, <IP address> is the IP address of the SRX Series device.
The J-Web Setup Wizard page opens. See Figure 1 on page 5.
Page 40

Figure 1: Setup Wizard Page
5
Configure SRX Devices Using the J-Web Setup Wizard
Using the Setup wizard, you can perform step-by-step configuration of a services gateway that can securely
pass traffic.
You can choose one of the following setup modes to configure the services gateway:
Standard mode—Configure your SRX Series device to operate in a standard mode. In this mode, you can
•
configure basic settings such as device and users, time and DNS Servers, also management interface,
zones and interfaces, and security policies.
Cluster (HA) mode—Configure your SRX Series device to operate in a cluster (HA) mode. In the cluster
•
mode, a pair of devices are connected together and configured to operate like a single node, providing
device, interface, and service level redundancy.
NOTE: You cannot configure Standard or Passive mode when your device is in the HA mode.
Passive mode—Configure your SRX Series device to operate in a TAP mode. TAP mode allows you to
•
passively monitor traffic flows across a network. If IDP is enabled, then the TAP mode inspects the
incoming and outgoing traffic to detect the number of threats.
NOTE: SRX5000 line of devices, SRX4600, and vSRX devices does not support the passive
mode configuration.
Page 41

To help guide you through the process, the wizard:
Determines which configuration tasks to present to you based on your selections.
•
Flags any missing required configuration when you attempt to leave a page.
•
To configure SRX Devices using the J-Web Setup wizard:
1. Click on the configuration mode that you want to setup.
The Setup Wizard page appears.
6
Page 42

NOTE:
If you do not want to perform the initial configuration, then:
a. Click Skip.
The J-Web Device Password screen appears. See Figure 2 on page 7
Figure 2: Device Password
7
b. Enter the root password and reenter it to confirm.
c. Click OK.
The password is committed to the device and the J-Web login page appears.
d. Enter the username and password again and click Log In.
The J-Web application window appears.
NOTE: You can choose Configure > Setup Wizard through the J-Web menu to
configure the wizard.
2. For standard mode and passive mode, complete the configuration according to the guidelines provided
in Table 3 on page 8.
Page 43

NOTE:
If you select Cluster (HA) Mode, for the configuration information see “Configure Cluster
•
(HA) Setup” on page 250.
In the Setup wizard, root password is mandatory and all the other options are optional. In
•
the passive mode, management interface, Tap interface, and services are mandatory.
3. Click Finish.
A successful message appears and the device configuration mode of your choice is set up.
NOTE:
Once the configuration is complete, the entire configuration is committed to the device
•
and a successful message appears. If the commit fails, the CLI displays an error message
and you remain at the wizard’s last page. If required, you can change the configuration until
the commit is successful.
8
If the connectivity is lost during commit or if commit takes more than a minute, a message
•
will be displayed with configured IP address to access J-Web again.
For SRX300 line of devices and SRX550M devices, an additional message will be displayed
•
about the device reboot if you have enabled Juniper Sky ATP or Security Intelligence
services. For other SRX devices, the device will not reboot.
Table 3: Setup Wizard Configuration
Device & Users
System Identity
Hostname
ActionField
Enter a hostname.
You can use alphanumeric characters, special characters such as
the underscore (_), the hyphen (-), or the period (.); the maximum
length is 255 characters.
Allow root user SSH login
Device Password
Enable this option to allow the root login (to the device) using
SSH.
Page 44

Table 3: Setup Wizard Configuration (continued)
9
ActionField
Username
Password
User Management
Displays the root user.
NOTE: We recommend that you do not use root user account
as a best practise to manage your devices.
Enter a password.
You can use alphanumeric characters and special characters; the
minimum length is six characters.
Reenter the password.Confirm Password
You can create additional user accounts in addition to root user
account.
NOTE: We recommend that you do not use root user account
as a best practise to manage your devices.
To add additional user accounts and to assign them a role:
Click +.
1.
Enter the details in the following fields:
2.
Time & DNS Servers
Set Date & Time
Username—Enter a username. Do not use space or symbols.
•
Password—Enter a password.
•
You can use alphanumeric characters and special
characters; the minimum length is six characters.
Confirm Password—Reenter the password.
•
Role—Select a role from the list.
•
Available options are: Super User, Operator, Read-Only,
and Unauthorized.
Click the tick mark.
3.
You can edit the user details using the pencil icon or select the
existing user and delete it using the delete icon.
Select either NTP server or Manual to configure the system time.Set system time
Page 45

Table 3: Setup Wizard Configuration (continued)
10
ActionField
Date and Time
NTP Server
Time zone
DNS Servers
DNS Server 1
Select the date and time (in DD-MM-YYYY and HH:MM:SS
24-hour or AM/PM formats) to configure the system time
manually.
Enter a hostname or IP address of the NTP server.
Once the system is connected to the network, the system time
is synced with the NTP server time.
NOTE: If you want to add more NTP servers, go to Configure >
Device Settings > Basic Settings > Date & Time Details through
the J-Web menu.
Select an option from the list. By default, device current time
(UTC) is selected.
By default, 8.8.8.8 is displayed.
NOTE: Entering a new IP address for the DNS server will remove
the default IP address.
DNS Server 2
Enter an IP address for the DNS server. By default, 8.8.4.4 is
displayed.
NOTE: Entering a new IP address for the DNS server will remove
the default IP address.
Management Interface
Management Interface
NOTE: If you change the management IP address and click Next, a warning message appears on the Management
Interface page that you need to use the new management IP address to log in to J-Web because you may lose the
connectivity to J-Web.
Page 46

Table 3: Setup Wizard Configuration (continued)
11
ActionField
Management Port
Select an option from the list.
If fxp0 port is your device’s management port, then the fxp0 port
is displayed. You can change it as required or you can select
None and proceed to the next page.
NOTE:
You can choose the revenue port as management port if your
•
device does not support the fxp0 port. Revenue ports are all
ports except fxp0 and em0.
If you are in Tap mode, it is mandatory to configure a
•
management port. J-Web needs a management port for
viewing generated report.
IPv4
NOTE: Click Email it to self to get the newly configured IPv4 address to your inbox. This is useful if you lose connectivity
when you change the management IP address to another network.
Management Address
Enter a valid IPv4 address for the management interface.
NOTE: If fxp0 port is your device’s management port, then the
fxp0 port’s default IP address is displayed. You can change it if
required.
Static Route
IPv6
Static Route
Enter a subnet mask for the IPv4 address.Management Subnet Mask
Enter an IPv4 address for the static route to route to the other
network devices.
Enter a subnet mask for the static route IPv4 address.Static Route Subnet Mask
Enter a valid IPv4 address for the next hop.Next Hop Gateway
Enter a valid IPv6 address for the management interface.Management Access
Enter a subnet prefix length for the IPv6 address.Management Subnet Prefix
Enter an IPv6 address for the static route to route to the other
network devices.
Page 47

Table 3: Setup Wizard Configuration (continued)
ActionField
Enter a subnet prefix length for the static route IPv6 address.Static Route Subnet Prefix
Enter a valid IPv6 address for the next hop.Next Hop Gateway
Access Protocols
NOTE:
This option is not available if the management port is fxp0. If the management port is not fxp0, a new dedicated
•
functional management zone is created and the configures access protocols are added to the zone.
In the Setup wizard, you cannot add any additional protocols.
•
12
HTTPS
SSH
Ping
Zones & Interfaces—For Standard Mode
Zones & Interfaces
Zone Name
Select this option for the web management using HTTP secured
by SSL.
NOTE: By default, this option is selected.
Select this option for the SSH service.
NOTE: By default, this option is selected.
Select this option for the internet control message protocol.
NOTE: By default, this option is selected.
Select this option for the Dynamic Host Configuration Protocol.DHCP
Select this option for the NETCONF Service.Netconf
View the zone name populated from your device factory default
settings.
Interfaces
NOTE: For Standard mode, trust and untrust zones are created
by default even if these zones are not available in the factory
default settings.
View the interfaces name populated from your device factory
default settings.
Enter the description for zone and interfaces.Description
Page 48

Table 3: Setup Wizard Configuration (continued)
13
ActionField
Edit
Search
Detailed View
Zones & Interfaces—For Passive Mode
TAP Interface
Physical Interface
Select a zone and click the pencil icon at the right corner of the
table to modify the configuration.
For more information on editing zones, see Table 4 on page 16
and Table 5 on page 22.
Click the search icon at the right corner of the table to quickly
locate a zone or an interface.
Hover over the zone name and click the Detailed View icon to
view the zone and interface details.
You can also click More and select Detailed View for the selected
zone.
Select an interface from the list.
For Passive mode, untrust zone will be displayed.
Internet Connectivity
NOTE: Your device must have internet connectivity to use IPS, AppSec, Web filtering, Juniper Sky ATP, and Security
threat intelligence services.
Name
Interfaces
Edit
View the zone name populated from your device factory default
settings.
NOTE: For Passive mode, untrust zone is created by default.
View the interfaces name populated from your device factory
default settings.
Enter the description for zone and interfaces.Description
Select a zone and click the pencil icon at the right corner of the
table to modify the configuration.
For more information on editing zones, see Table 4 on page 16
and Table 5 on page 22.
Page 49

Table 3: Setup Wizard Configuration (continued)
14
ActionField
Search
Detailed View
Default Gateway
Security Policies
Reporting
On-Box Reporting
Click the search icon at the right corner of the table to quickly
locate a zone or an interface.
Hover over the zone name and click the Detailed View icon to
view the zone and interface details.
You can also click More and select Detailed View for the selected
zone.
Enter the IPv4 address of the default gateway.Default Gateway (IPv4)
Enter the IPv6 address of the default gateway.Default Gateway (IPv6)
Enable this option to generate on-box reports.
NOTE: We recommend you to use Stream mode logging to
syslog server.
Services
License
UTM Type
Enable this option for configuring UTM services.UTM
Enter UTM license key and click Install License to add a new
license.
NOTE:
Use a blank line to separate multiple license keys.
•
To use UTM services, your device must have internet
•
connectivity from a revenue interface.
Select an option to configure UTM features:
Web Filtering
•
Anti Virus
•
Anti Spam
•
Page 50

Table 3: Setup Wizard Configuration (continued)
15
ActionField
Web Filtering Type
IPS
Select an option:
Enhanced—Specifies that the Juniper Enhanced Web filtering
•
intercepts the HTTP and the HTTPS requests and sends the
HTTP URL or the HTTPS source IP to the Websense
ThreatSeeker Cloud (TSC).
Local—Specifies the local profile type.
•
Enable this option to install the IPS signatures.
IPS Policy—Displays the IPS policy wizard name.
•
License—Enter the license key and click Install License to add
•
a new license.
NOTE: The installation process may take few minutes.
IPS Signature—Click Browse to navigate to the IPS signature
•
package folder and select it. Click Install to install the selected
IPS signature package.
NOTE: You can download the IPS signature offline package
at https://support.juniper.net/support/downloads/.
Sky ATP
Security Intelligence
User Firewall
Enable this option to use Juniper Sky ATP services.
NOTE: After the Juniper Sky ATP configuration is pushed, only
the SRX300 line of devices and SRX550M devices are rebooted.
Your device must have internet connectivity to enable Juniper
Sky ATP enrollment process through J-Web.
Enable this option to use Security Intelligence services.
NOTE: After the Security Intelligence configuration is pushed,
only the SRX300 line of devices and SRX550M devices are
rebooted. Your device must have internet connectivity to enable
Juniper Sky ATP enrollment process through J-Web.
Enable this option to use user firewall services.
Domain Name—Enter a domain name for Active Directory.
•
Domain Controller—Enter domain controller IP address.
•
Username—Enter a username for administrator privilege.
•
Password—Enter a password for administrator privilege.
•
Page 51

Table 3: Setup Wizard Configuration (continued)
ActionField
Security Policy
NOTE: The table lists the security policy along with the selected advanced security settings.
16
Policy Name
From Zone
To Zone
Name of the policy.
NOTE:
If you are in Standard mode, trust-to-untrust policy is created
•
by default.
If you are in Tap mode, tap-policy is created by default.
•
Name of the source zone.
NOTE:
If you are in Standard mode, permits all traffic from the trust
•
zone.
If you are in Tap mode, permits all traffic from the tap zone.
•
Name of the destination zone.
If you are in Standard mode, permits all traffic from the trust
•
zone to the untrust zone.
If you are in Tap mode, permits all traffic from the tap zone to
•
the tap zone.
Name of the source address (not the IP address) of a policy.Source Address
Application
Table 4: Edit Trust Zone
General Information
Name of the destination address.Destination Address
Name of a preconfigured or custom application of the policy
match.
Action taken when a match occurs as specified in the policy.Action
Name of the configured advanced security settings.Advanced Security
ActionField
Displays the zone name.Name
Page 52

Table 4: Edit Trust Zone (continued)
17
ActionField
Enter the description for the zone.Description
Enables this option to provide application tracking support to the zone.Application Tracking
Source Identity Log
Services
Protocols
Interfaces
Enables this option to trigger user identity logging when that zone is used
as the source zone in a security policy.
By default, this option is enabled. You can disable if required.
all—Specifies all system services.
By default, this option is enabled. You can disable if required.
all—Specifies all protocol.
Displays the name of the interfaceName
Displays the description of the interface.Description
Displays the IP address of the interface.IP Address
Displays the VLAN name.VLAN
Displays the system service option selected.Services
Displays the protocol option selected.Protocols
Page 53

Table 4: Edit Trust Zone (continued)
18
ActionField
Add
To add a switching or a routing interface:
Click +.
1.
The Add Interface page appears.
Enter the following details:
2.
General (fields for switching interface):
•
Type (family)—Select Switching.
•
NOTE: This option will be available for only SRX300 line of devices,
SRX550M, and SRX1500 devices. For SRX5000 line of devices,
SRX4100, SRX4200, SRX4600, and vSRX devices, the Type (family)
field is not available.
Routing Interface (IRB) Unit—Enter the IRB unit.
•
Description—Enter the description for the interface.
•
General (fields for routing interface):
•
Type (family)—Select Routing.
•
For SRX5000 line of devices, SRX4100, SRX4200, SRX4600, and
vSRX devices, the Type (family) field is not available.
Interface Name—Select an option from list.
•
Interface Unit—Enter the Inet unit.
•
NOTE: VLAN tagging is enabled automatically if the interface unit
is higher than zero.
Description—Enter the description for the interface.
•
VLAN ID—Enter the VLAN ID.
•
NOTE: VLAN ID is mandatory if the interface unit is higher than
zero.
Page 54

Table 4: Edit Trust Zone (continued)
ActionField
Interfaces—Select an interface from the Available column and move
•
it to the Selected column.
NOTE: This option is available only for the Switching family type.
IPv4:
•
IPv4 Address—Enter a valid IPv4 address for the switching or the
•
routing interface.
Subnet Mask—Enter a subnet mask for the IPv4 address.
•
IPv6:
•
IPv6 Address—Enter a valid IPv6 address for the switching or the
•
routing interface.
Subnet Prefix—Enter a subnet prefix for the IPv6 address.
•
VLAN Details:
•
19
NOTE: This option is available only for the Switching family type.
VLAN Name—Enter an unique name for the VLAN.
•
VLAN ID—Enter the VLAN ID.
•
DHCP Local Server:
•
DHCP Local Server—Enable this option to configure the switch to
•
function as an extended DHCP local server.
DHCP Pool Name—Enter the DHCP pool name.
•
DHCP Pool Range (Low)—Enter an IP address that is the lowest
•
address in the IP address pool range.
DHCP Pool Range (High)—Enter an IP address that is the highest
•
address in the IP address pool range.
NOTE: This address must be greater than the address specified in
DHCP Pool Range (Low).
Propagate Settings from—Select an interface on the router through
•
which the resolved DHCP queries are propagated to the DHCP
pool.
Page 55

Table 4: Edit Trust Zone (continued)
ActionField
System Services—Select system services from the list in the Available
•
column and then click the right arrow to move it to the Selected
column.
The available options are:
all—Specify all system services.
•
any-service—Specify services on entire port range.
•
appqoe—Specify the APPQOE active probe service.
•
bootp—Specify the Bootp and dhcp relay agent service.
•
dhcp—Specify the Dynamic Host Configuration Protocol.
•
dhcpv6—Enable Dynamic Host Configuration Protocol for IPV6.
•
dns—Specify the DNS service.
•
finger—Specify the finger service.
•
ftp—Specify the FTP protocol.
•
http—Specify the Web management using HTTP.
•
https—Specify the Web management using HTTP secured by SSL.
•
ident-reset—Specify the send back TCP RST IDENT request for
•
port 113.
ike—Specify the Internet key exchange.
•
lsping—Specify the Label Switched Path ping service.
•
netconf—Specify the NETCONF Service.
•
ntp—Specify the network time protocol.
•
ping—Specify the internet control message protocol.
•
r2cp—Enable Radio-Router Control Protocol.
•
reverse-ssh—Specify the reverse SSH Service.
•
reverse-telnet—Specify the reverse telnet Service.
•
rlogin—Specify the Rlogin service
•
rpm—Specify the Real-time performance monitoring.
•
rsh—Specify the Rsh service.
•
snmp—Specify the Simple Network Management Protocol.
•
snmp-trap—Specify the Simple Network Management Protocol
•
trap.
20
Page 56

Table 4: Edit Trust Zone (continued)
ActionField
ssh—Specify the SSH service.
•
tcp—encap-Specify the TCP encapsulation service.
•
telnet—Specify the Telnet service.
•
tftp—Specify the TFTP
•
traceroute—Specify the traceroute service.
•
webapi-clear-text—Specify the Webapi service using http.
•
webapi-ssl—Specify the Webapi service using HTTP secured by
•
SSL.
xnm-clear-text—Specify the JUNOScript API for unencrypted traffic
•
over TCP.
xnm-ssl—Specify the JUNOScript API Service over SSL.
•
Protocols—Select protocols from the list in the Available column and
•
then click the right arrow to move it to the Selected column.
The available options are:
21
all—Specifies all protocol.
•
bfd—Bidirectional Forwarding Detection.
•
bgp—Border Gateway Protocol.
•
dvmrp—Distance Vector Multicast Routing Protocol.
•
igmp—Internet Group Management Protocol.
•
ldp—Label Distribution Protocol.
•
msdp—Multicast Source Discovery Protocol.
•
nhrp- Next Hop Resolution Protocol.
•
ospf—Open shortest path first.
•
ospf3—Open shortest path first version 3.
•
pgm—Pragmatic General Multicast.
•
pim—Protocol Independent Multicast.
•
rip—Routing Information Protocol.
•
ripng—Routing Information Protocol next generation.
•
router-discovery—Router Discovery.
•
rsvp—Resource Reservation Protocol.
•
sap—Session Announcement Protocol.
•
vrrp—Virtual Router Redundancy Protocol.
•
Page 57

Table 4: Edit Trust Zone (continued)
22
ActionField
Edit
Delete
Search
Table 5: Edit Untrust Zone
General Information
Select an interface and click the edit icon at the top right corner of the table.
The Edit Interface page appears with editable fields.
NOTE: As interface name is prepopulated, you cannot edit it.
Select an interface and click the delete icon at the top right corner of the
table.
A confirmation window appears. Click Yes to delete the selected interface
or click No to discard.
Click the search icon at the top right corner of the table and enter partial
text or full text of the keyword in the search bar.
The search results are displayed.
ActionField
Application Tracking
Interfaces
Displays the zone name as untrust.Name
Enter the description for the zone.Description
Enables this option to provide application tracking support
to the zone.
Enables this option for system services.Source Identity Log
Displays the name of the physical interfaceName
Displays the description of the interface.Description
Displays the type of address mode.Address Mode
Displays the IP address of the interface.IP Address
Displays the system service option selected.Services
Page 58

Table 5: Edit Untrust Zone (continued)
23
ActionField
Displays the protocol option selected.Protocols
Page 59

Table 5: Edit Untrust Zone (continued)
Add
24
ActionField
Page 60

Table 5: Edit Untrust Zone (continued)
ActionField
To add an interface to the untrust zone:
Click +.
1.
The Add Interface page appears.
Enter the following details:
2.
General:
•
Interface Name—Select an interface from the list.
•
Interface Unit—By default 0 will be populated.
•
You can change the unit value if required.
Description—Enter the description for the
•
interface.
Address Mode—Select an address mode for the
•
interface. The available options are DHCP Client,
PPPoE (PAP), PPPoE (CHAP) and Static IP.
25
NOTE: PPPoE (PAP) and PPPoE (CHAP) are not
supported for SRX5000 line of devices and if any
of the devices are in passive mode.
Username—Enter a username for PPPoE (PAP) or
•
PPPoE (CHAP) authentication.
Password—Enter a password for PPPoE (PAP) or
•
PPPoE (CHAP) authentication.
IPv4:
•
NOTE: This option is available only for the Static IP
address mode.
IPv4 Address—Enter a valid IPv4 address for the
•
interface.
Subnet Mask—Enter a subnet mask for the IPv4
•
address.
IPv6:
•
NOTE: This option is available only for the Static IP
address mode.
IPv6 Address—Enter a valid IPv6 address for the
•
interface.
Subnet Prefix—Enter a subnet prefix for the IPv6
•
address.
Page 61

Table 5: Edit Untrust Zone (continued)
ActionField
System Services—Select system services from the
•
list in the Available column and then click the right
arrow to move it to the Selected column.
Protocols—Select protocols from the list in the
•
Available column and then click the right arrow to
move it to the Selected column.
26
Edit
Delete
Search
J-Web First Look
Select an interface and click the edit icon at the top right
corner of the table.
The Edit Interface page appears with editable fields.
NOTE: As interface name is prepopulated, you cannot
edit it.
Select an interface and click the delete icon at the top
right corner of the table.
A confirmation window appears. Click Yes to delete the
selected interface or click No to discard.
Click the search icon at the top right corner of the table
and enter partial text or full text of the keyword in the
search bar.
The search results are displayed.
Each page of the J-Web interface is divided into the following panes (see Figure 3 on page 27):
Launch pad—Displays high level details of the system identification, active users, and interface status.
•
Top pane—Displays identifying information and links.
•
Side pane—Displays subtasks of the Monitor, Configure, Reports, and Administration task currently
•
displayed in the main pane. Click an item to access it in the main pane.
Main pane—Location where you monitor, configure, view or generate reports, and administrate the
•
Juniper Networks device by entering information in text boxes, making selections, and clicking buttons.
Page 62

Figure 3: J-Web First Look
27
Explore J-Web
IN THIS SECTION
J-Web Launch Pad | 27
J-Web Top Pane | 28
J-Web Side Pane | 30
J-Web Main Pane | 33
J-Web Workflow Wizards | 36
Summary | 36
J-Web Launch Pad
Starting in Junos OS Release 19.3R1, after you successfully login to J-Web GUI, J-Web launch pad appears.
The launch pad provides a quick view of system identification details, active users, and interface status.
NOTE:
Launch pad is not displayed in the factory default settings.
•
Launch pad is displayed for all users.
•
Page 63

Table 6 on page 28 provides the details of the launch pad screen elements.
Table 6: J-Web Launch Pad Screen Elements
DescriptionElement
28
System Identification
Interface Status
Close
X
Displays information about the device such as model number, serial number, hostname,
software version, system time, and system up time.
You can click the arrow button on the top right of the widget to navigate to the Configure >
Device Settings > Basic Settings page to view or configure the system settings.
Displays the number of active users using the device.Active Users
Displays the state of the device physical interfaces: Up or Down.
You can click the arrow button on the top right of the widget to navigate to the Monitor >
Interfaces > Ports page to monitor the interfaces.
Click Close to close the launch pad and to navigate to the Basic Settings page in J-Web.
NOTE:
The Close button is enabled only after J-Web is loaded.
•
•
You can access launch pad anytime by clicking the icon on the J-Web banner.
Click the X icon on the top right of the page to close the launch pad and to navigate to the
Basic Settings page in J-Web.
NOTE: The X icon is enabled only after J-Web is loaded.
Refresh
Click the refresh icon available beside the close icon (X) on the top right of the page to fetch
the latest system data.
NOTE: The refresh icon is enabled only after J-Web is loaded.
J-Web Top Pane
For a more personal, helpful, and user experience, Juniper Networks has provided some aids within the
J-Web GUI. Table 7 on page 29 provides the details of the J-Web top pane elements.
Page 64

Table 7: J-Web Top Pane Elements
29
DescriptionElement
Banner
Device details
Feedback Button
Commit Configuration Menu
Location—The dark gray bar at the top of
the screen.
You can access device details, feedback
button, commit options, a profile
management access menu, and a help
button.
Location—To the upper right of the banner.
Provides details of the device you have
accessed.
Location—To the right of the device details.
You can provide feedback
(jweb-feedback@juniper.net) if you are
having an issue with the product.
Location—To the right of the Feedback
Button.
Launch pad
User Functions Menu
Provides options to commit, compare,
confirm, discard, or commit the changes in
your preferred way.
Location—To the right of the Commit
Configuration Menu.
Provides high level details of the system
identification, active users, and interface
status.
Location—To the right of the launch pad
Button.
A head-and-shoulders icon and a field
showing the logged in user type. Clicking
your user name or the down arrow button,
logs you out of J-Web interface.
Page 65

Table 7: J-Web Top Pane Elements (continued)
30
DescriptionElement
Help Button
Mode
Tenant or Logical System User Name
Location—To the right of the User
Functions Menu.
Access to the online Help center and the
Getting Started Guide are available by
clicking the right-most icon on the banner,
shaped like a question mark. The help
center includes access to a list of supported
web browsers, user interface assistance,
as well as links to technical support and full
J-Web documentation.
Location—To the right of the device details.
Provides the setup mode details wether
your device is in the standard, chassis
cluster (HA), or passive mode.
Location—To the left of the device details.
Displays the name of the tenant user or
logical system user when root user enter
as a Tenant or a logical systems. Click on
the user name and select Exit to go back
to the root user role.
J-Web Side Pane
J-Web presents you a security-focused administrator with a tabbed interface.
Page 66
The following tabs across the side pane of the J-Web GUI provide workspaces in which an administrator
can perform specific tasks:
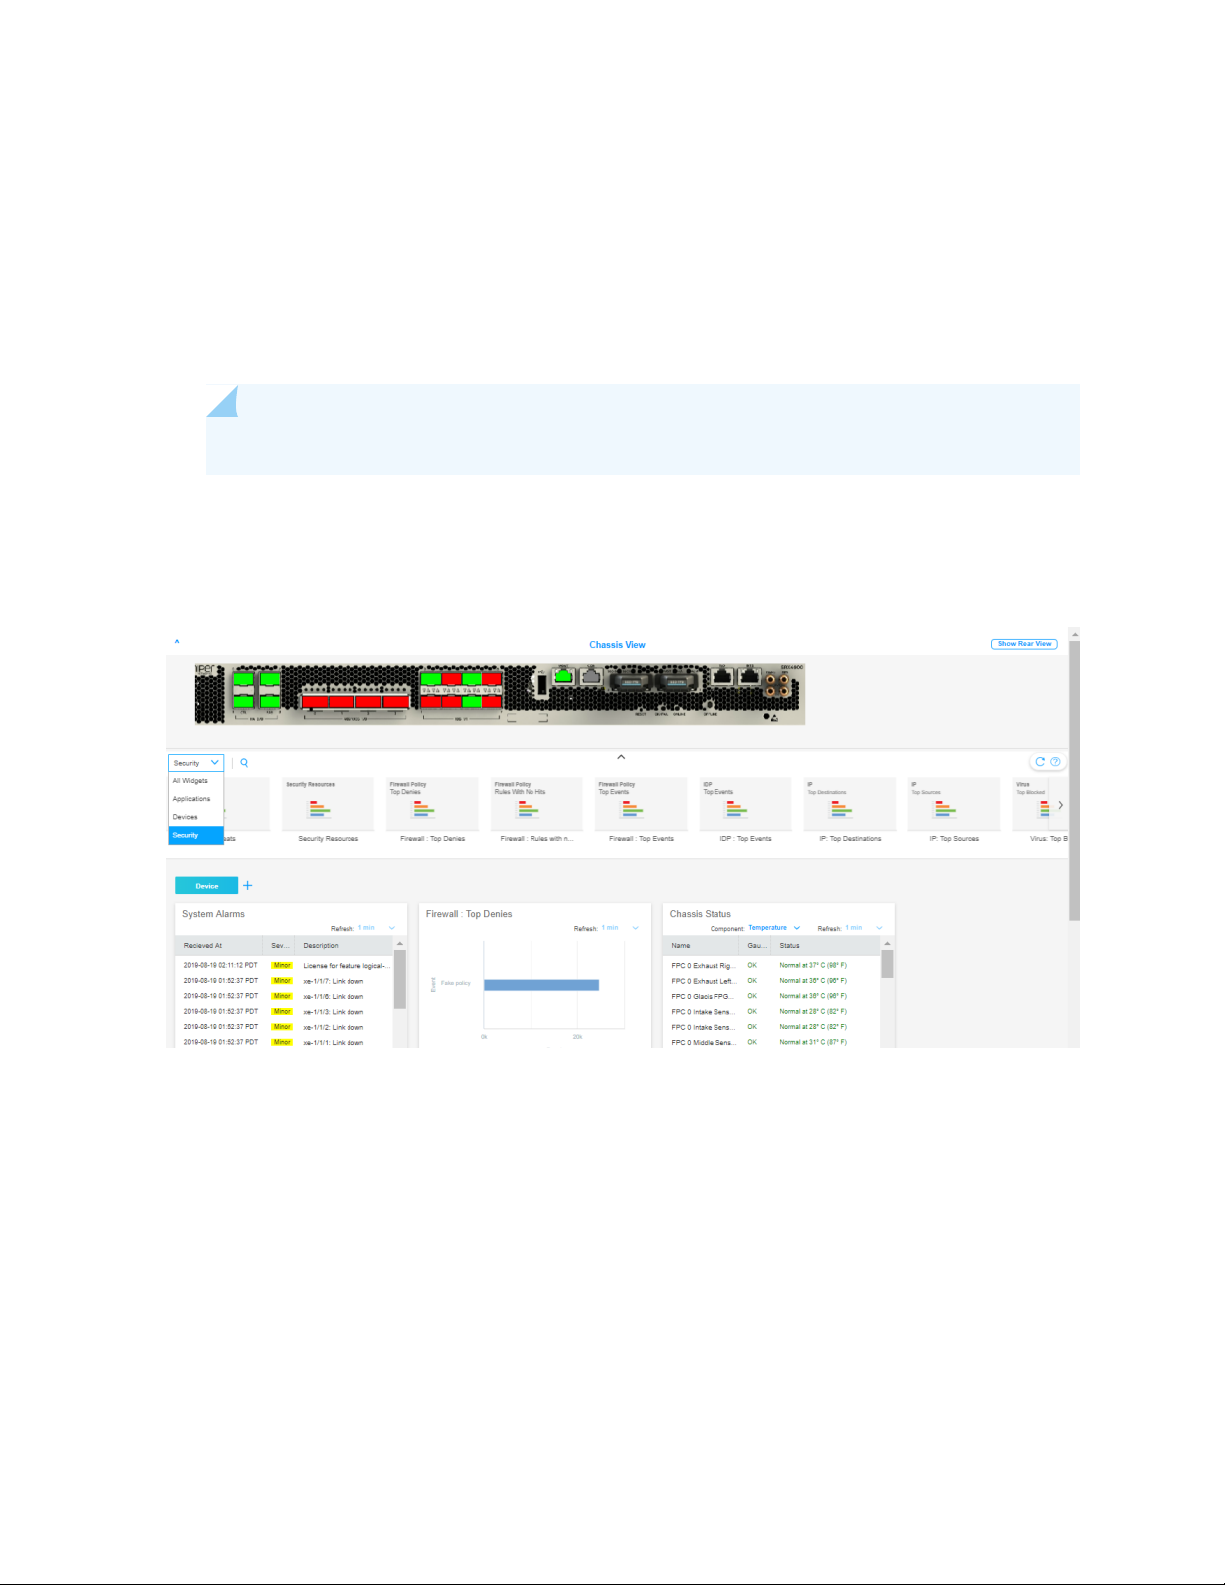
Dashboard—The Dashboard is the main page for J-Web. You can customize the workspace in your
•
Dashboard by adding widgets from the carousel. The placement of, and settings within, widgets are
saved so that anything from device information to firewall event information or from top blocked viruses
to live threat maps can be unique for each user. Once you decide on the widgets that you want to see,
you can minimize the carousel to regain some screen space.
NOTE: By default, the selected widgets are displayed every time you login to J-Web.
Figure 4 on page 31 shows an example of the J-Web Dashboard tab.
Figure 4: J-Web Dashboard Tab
31
Monitor—The Monitor tab provides a workspace in which graphical representations of network traffic,
•
firewall events, live threats, and network user data are available. There is also detailed data for alerts
and alarms information. In this workspace, you can review the detailed information needed to understand
what is happening to the managed security devices and traffic in your network.
Figure 5 on page 32 shows an example of the J-Web Monitor tab.
Page 67

Figure 5: J-Web Monitor Tab
Configure—The Configure tab is the workspace where all of the security configuration happens. You
•
can configure device settings, interfaces, network, users, security services such as firewall, IPS, NAT,
and UTM policies, assign policies to devices, create and apply policy schedules, create and manage VPNs
and create and manage all of the security objects, security services, and multitenancy needed for managing
your network security.
32
Figure 6 on page 32 shows an example of the J-Web Configure tab.
Figure 6: J-Web Configure Tab
Reports—The Reports tab provides a workspace in which you can generate reports on demand. J-Web
•
comes with a predefined set of reports. The generated report is displayed in HTML format. You can
group multiple reports and generate a consolidated report.
Figure 7 on page 33 shows an example of the J-Web Reports tab.
Page 68

Figure 7: J-Web Reports Tab
Administration—The Administration tab provides a workspace in which you can review and manage
•
device log files, reboot schedule, software packages, licenses, certificates, alarms, tools, and Juniper Sky
ATP enrollments.
Figure 8 on page 33 shows an example of the J-Web Administration tab.
Figure 8: J-Web Administration Tab
33
J-Web Main Pane
The main workspace of J-Web takes up the remainder of the browser window just below the Banner and
next to the side pane. Table 8 on page 34 shows a sample of navigation, customization, and help icons in
the main pane of the J-Web GUI.
Page 69

Table 8: J-Web Main Pane Elements
34
DescriptionElement
Breadcrumbs
Info Tips
Show/Hide Columns
Table Search
Location—Upper left part of main screen. Not visible
on the Dashboard.
Trace your location in the GUI. The breadcrumbs
provide a path back to one of the five tabs:
Dashboard, Monitor, Configure, Reports, and
Administration.
Location—Various places around the GUI.
Hover your mouse over any available question mark
icon for quick pop-up guidance.
Location—Upper right corner of some tabular display
windows such as the Address Pools tab, Rules tab,
and so on.
In tabular displays, you can choose which columns
are visible by clicking the icon and then selecting
the check boxes on the menu.
Location—Upper right corner of tabular views.
Item Selector Search
You can click the magnifying glass icon, within large
tabular views, to search for specific text within any
of the visible fields in the display.
Location—Within the fields.
You can use a search text box to select items for
inclusion in a rule or policy.
Page 70

Table 8: J-Web Main Pane Elements (continued)
35
DescriptionElement
Advanced Search
Filter
Success message
Location—Above the table grid.
The search includes the logical operators as part of
the filter string. In the search text box, when you
hover over the icon, it displays an example filter
condition. When you start entering the search string,
the icon indicates whether the filter string is valid
or not.
NOTE: Press Spacebar to add an AND operator or
OR operator to the search string. Press backspace
at any point of time while entering a search criteria,
only one character is deleted.
Location—Upper right corner of tabular views.
You can click the filter icon to select any value from
a list for category and subcategory columns. The
grid is reloaded with the filtered category and
subcategory.
Location—At the top of the main pane.
Information message
Alert message
Warning message
A message is displayed with this icon to state that
your task is successful.
Location—At the top of the main pane.
A message is displayed with this icon to state you
have some pending actions but you can continue
with the task.
Location—At the top of the main pane.
A message is displayed with this icon to state you
have some pending actions which you must
complete to proceed with the required task.
Location—At the top of the main pane.
A message is displayed with this icon to state you
have some pending actions which you must
complete else you cannot proceed with the required
task.
Page 71

J-Web Workflow Wizards
J-Web contains assisting workflow wizards that guide you through some of its security functions. These
include Setup wizard, Chassis Cluster wizard, PPPOE wizard, VPN wizard, and NAT wizard. These wizards
helps you with a guided setup and helps you in performing step-by-step configuration of a services gateway
that can securely pass traffic.
NOTE: PPPOE , VPN , and NAT Wizards are available only in the SRX300 line of devices and
SRX550M devices.
Summary
J-Web is a GUI approach that aims to provide a graphical framework to help you visualize and manage
your SRX Series devices more easily.
36
Release History Table
19.3R1
DescriptionRelease
Starting in Junos OS Release 19.3R1, after you successfully login to J-Web GUI, J-Web
launch pad appears. The launch pad provides a quick view of system identification details,
active users, and interface status.
Page 72

2
PART
Dashboard
J-Web Dashboard | 38
Page 73

CHAPTER 2
J-Web Dashboard
IN THIS CHAPTER
Dashboard Overview | 38
Dashboard Overview
38
IN THIS SECTION
What is J-Web Dashboard | 38
Chassis View | 39
Work with Widgets | 40
What is J-Web Dashboard
The J-Web dashboard provides a unified overview of the system and network status retrieved from SRX
Series devices.
To use the dashboard at the top-level menu, select Dashboard. By default, the Dashboard page displays
the front view of the chassis and all the widget thumbnails.
Figure 9 on page 39 shows an example of the Dashboard page of SRX4600 Services Gateway.
Page 74

Figure 9: SRX4600 Dashboard
39
Chassis View
You can view the image of the chassis and its component parts using the Dashboard. The ports reflect the
most real-time status and are colored to indicate the port link status. For example, the ge port LED is green
when the port is up and red when the port is down. Major or minor alarm indicators appear in red. When
you insert or remove a card, the chassis view reflects the change immediately.
NOTE: To use the Chassis View, you must install a recent version of Adobe Flash that supports
ActionScript and AJAX (Version 9).
Using the chassis view, you can:
Mouse over a port to view the port name and help tips.
•
Use the Show Front View and Show Rear View buttons at the top right corner to toggle between front
•
and rear views of the chassis.
Use the arrow button at the left top corner to hide or show the chassis view.
•
Right-click on each of the component to view the chassis information, switch to front or back view of
•
the chassis, and configure or monitor ports.
Use the zoom option on the left side of the chassis to zoom in or out for SRX5000 line of devices.
•
Page 75

NOTE:
Starting in Junos OS Release 19.3R1, J-Web supports I/O card (IOC4) and Routing Engine
•
(RE3) line cards for SRX5000 line of devices and Switch Control Board (SCB4) line cards for
SRX5600 and SRX5800 devices.
Starting in Junos OS Release 19.4R1, J-Web supports Wi–Fi Mini-Physical Interface Module
•
(Mini-PIM) for SRX320, SRX340, SRX345, and SRX550M devices. The physical interface for
the Wi-Fi Mini-PIM uses the name wl-x/0/0, where x identifies the slot on the services
gateway where the Mini-PIM is installed.
Table 9 on page 40 summarizes the fields in Chassis View.
Table 9: Fields in Dashboard Chassis View
DescriptionField
40
Chassis View
Work with Widgets
Provides a graphical representation of the hardware chassis.
•
Displays the front or rear panel view of the device and shows which slots are occupied.
•
When you insert or remove a card, the Chassis View reflects the change immediately.
Changes color to indicate the port link status. For example, the ge port LED is green and
•
steadily on when the port is up and red when the port is down.
Displays help tips when you hover the mouse over a port.
•
NOTE: You can also view the sub-ports details configured on any or all ports of the
SRX5K-IOC4-MRATE line card.
Displays the front view of the chassis and its components.Show Front View
Displays the rear view of the chassis and its components.Show Rear View
Available on the left side of the chassis to zoom in or zoom out the chassis view.Zoom
Available on the left side of the chassis to set the chassis view for the default size.Reset
Each widget pane acts as a separate frame. You can click + icon to add separate dashboard and name it
as per your ease. You can refresh the display of the Dashboard page by clicking the refresh icon at the top
right-hand corner above the widget pane.
Starting in Junos OS Release 19.3R1, you can choose any one of the categories to view widgets on your
device:
Page 76

All Widgets—Displays all the supported widgets
•
Applications—Displays only the supported application related widgets
•
Devices—Displays only the supported device related widgets
•
Security—Displays only the supported security related widgets
•
NOTE:
The Threat Activity pane is not available on SRX5400, SRX5600, and SRX5800 devices.
•
For SRX Series devices configured for logical systems, the Logical System Identification and
•
Logical System Profile panes are displayed when you log in as a user logical system administrator.
These are the only logical system panes available in Dashboard Preferences.
If the rescue configuration is not set, the set rescue configuration link directs you to the
•
Administration > Devices > Config Management > Rescue page to set the rescue configuration.
To use a widget on the Dashboard:
41
1. Drag the widgets from the palette or thumbnail container to your dashboard.
When you add more widgets on the J-Web Dashboard, you can observe high CPU usage on the Routing
Engine for a short span of time on every refresh. We recommend that you use four widgets for lower
CPU consumption.
2. Mouse over the top of each widget to minimize, refresh, and close by using the respective icons.
NOTE: Starting in Junos OS Release 19.3R1, the dashlet data is refreshed every minute by
default. You cannot manually configure the refresh interval of the dashlet. If the data is not
aged in the cache, data loads from the cache during the dashlet refresh. If the data is aged,
it is retrieved from the device during the next refresh interval cycle.
Table 10 on page 41 provides the dashboard widgets options based on the selected device.
Table 10: Dashboard Widgets Options
DescriptionField
System Alarms
System Identification
Provides the received time, severity, description of the alarms and the
action to be taken.
Provides system details such as serial number of the software, hostname,
software version, BIOS version, system uptime, and system time.
Page 77

Table 10: Dashboard Widgets Options (continued)
DescriptionField
Provides the user credentials, login time, idle time, and host.Login Sessions
42
File Usage
Threats
Resource Utilization
Firewall: Top Denies
Provides current space requirements for log, temporary, crash, and database
files. Click Maintain to download or delete some or all of these files.
NOTE: Starting in Junos OS Release 19.3R1, File Usage widget supports
RE3 line cards for SRX5000 line of devices.
Displays top 10 applications based on sessions or bandwidth.Applications
Displays top 10 IPS sources, antispam sources, and antivirus name, sorted
by count.
Provides a graphical representation of the CPU, memory, and storage used
for both the data and the control planes. The CPU control also shows the
load average value for 1 minute when you mouse over CPU Control.
NOTE: Starting in Junos OS Release 19.3R1, Resource Utilization widget
supports RE3 line cards for SRX5000 line of devices.
Displays top requests denied by the firewall based on their source IP
addresses, sorted by count.
Displays firewall policies with the most rules not hit, sorted by count.Firewall Policy: Rules With No Hits
Interface: Most Dropped Packets
IP: Top Sources
Provides the most current threats received on the device.Threat Activity
Displays all top 10 firewall events of the network traffic, sorted by count.Firewall: Top Events
Displays top 10 IDP events grouped by event-type, sorted by count.IDP: Top Events
Displays the signal strength of the device.Signal Strength
Displays top 5 interfaces based on the CLI response; top-count will increase
to 10.
Displays top 10 interfaces with most sessions.Interface: Most Sessions
Displays top 10 destination-address, sorted by count or volume.IP: Top Destinations
Displays top 10 source-address of the network traffic, sorted by count or
volume.
Page 78

Table 10: Dashboard Widgets Options (continued)
DescriptionField
Displays top 10 blocked viruses, sorted by count.Virus: Top Blocked
Displays top 10 zones with maximum throughput rate in packets.Zones: Top Bandwidth by Packets
Displays top 5 WebBlocked based on the CLI response.Web Filtering: Top Web Blocked
Displays top 4 Source Address Web Filter based on the CLI response.Web Filtering: Top Source Address
Displays top 4 Destination Address Web Filter based on the CLI response.Web Filtering: Top Destination Address
43
Application & Users: High Risk
Applications Blocked Per User
Applications Allowed Per User
Security Resources
Chassis Status
Web Filtering: Top Web Categories
Displays top 4 High Risk Applications Blocked per user based on the CLI
response.
Displays High Risk Applications allowed per user.Application & Users: High Risk
Provides the maximum, configured, and activated number of session,
firewall/VPN policies, and IPsec VPNs.
Provides the component temperature and fan tray details of the system.
Select Monitor > Device > Chassis Information for more information.
NOTE: Starting in Junos OS Release 19.3R1, Chassis Status widget supports
RE3 line cards for SRX5000 line of devices and SCB4 line cards for SRX5600
and SRX5800 devices.
Displays top 10 Protocol, Reason, and Source-address.Content Filtering: Top Content Filters
Displays top 10 Web categories, Security risk, Productivity loss,
Legal-liability and Blocked.
Volume/Count
Application & Users: Top Categories
Displays top Malwares identified, Threats and Infected categories.Threat Monitoring
Displays top users of High Risk Applications by volume.Top Users of High Risk Applications by
Displays top 4 Categories of Application & Users sorted by count and
volume.
Displays top 4 Users sorted by count and volume.Application & Users: Top Users
Displays top 4 IPs of Application & Users sorted by count and volume.Application & Users: Top IPs
Page 79

Table 10: Dashboard Widgets Options (continued)
DescriptionField
Displays top 4 High Risk Applications sorted by risk, count and volume.Application & Users: Top High Risk
Applications
Displays top 4 Antispam group by source address and sorted by count.Anti Spam: Top Source Address
Displays top 5 Application Usage by Category group.Application & Users: Application Usage
by Category/Type
Displays top 5 Users with the Most Critical Application Usage volume.Application & Users: Users with the Most
Critical Application Usage
44
Storage Usage
Logical System Identification
Logical System Profile
Displays used and available storage and usage information about other
system components.
Provides the logical system name, the security profile assigned to the logical
system, the software version, and the system time.
Displays the types of resources that are allocated to the user logical system,
the number of resources used and reserved, and the maximum number of
resources allowed.
Page 80

Release History Table
DescriptionRelease
45
19.4R1
19.3R1
19.3R1
19.3R1
19.3R1
Starting in Junos OS Release 19.4R1, J-Web supports Wi–Fi Mini-Physical Interface Module
(Mini-PIM) for SRX320, SRX340, SRX345, and SRX550M devices. The physical interface for the
Wi-Fi Mini-PIM uses the name wl-x/0/0, where x identifies the slot on the services gateway
where the Mini-PIM is installed.
Starting in Junos OS Release 19.3R1, J-Web supports I/O card (IOC4) and Routing Engine (RE3)
line cards for SRX5000 line of devices and Switch Control Board (SCB4) line cards for SRX5600
and SRX5800 devices.
Starting in Junos OS Release 19.3R1, you can choose any one of the categories to view widgets
on your device:
Starting in Junos OS Release 19.3R1, the dashlet data is refreshed every minute by default. You
cannot manually configure the refresh interval of the dashlet. If the data is not aged in the cache,
data loads from the cache during the dashlet refresh. If the data is aged, it is retrieved from the
device during the next refresh interval cycle.
Starting in Junos OS Release 19.3R1, File Usage widget supports RE3 line cards for SRX5000 line
of devices.
19.3R1
19.3R1
Starting in Junos OS Release 19.3R1, Resource Utilization widget supports RE3 line cards for
SRX5000 line of devices.
Starting in Junos OS Release 19.3R1, Chassis Status widget supports RE3 line cards for SRX5000
line of devices and SCB4 line cards for SRX5600 and SRX5800 devices.
Page 81

3
PART
Monitor
Interfaces | 48
Access | 55
Multi Tenancy | 57
Alarms | 64
Events | 67
Users | 110
Device | 112
Routing | 133
Class of Service | 142
MPLS | 150
DHCP | 156
NAT | 160
Authentication | 172
Security Services | 176
IPsec VPN | 204
Page 82

Flow Session | 208
Flow Gate | 211
VLAN | 213
Wireless LAN | 215
Threats Map (Live) | 219
Page 83

CHAPTER 3
Interfaces
IN THIS CHAPTER
Monitor Ports | 48
Monitor PPPoE | 51
Monitor Ports
48
You are here: Monitor > Interfaces > Ports.
Use this page to view general information about all physical and logical interfaces for a device.
NOTE:
Starting in Junos OS Release 19.3R1, J-Web supports IOC4 line cards for SRX5000 line of
•
devices. You can also view the sub-ports details configured on any or all ports of the
SRX5K-IOC4-MRATE line card.
Starting in Junos OS Release 19.4R1, J-Web supports Wi–Fi Mini-PIM for SRX320, SRX340,
•
SRX345, and SRX550M devices. The physical interface for the Wi-Fi Mini-PIM uses the name
wl-x/0/0, where x identifies the slot on the services gateway where the Mini-PIM is installed.
Table 11 on page 48 describes the fields on the Ports page.
Table 11: Fields on the Ports Page
DescriptionField
Starts or stops monitoring the selected interfaces.Start/Stop button
Admin Status
Displays the interface name.Port
Displays whether the interface is enabled (Up) or disabled
(Down).
Page 84

Table 11: Fields on the Ports Page (continued)
49
DescriptionField
Link Status
Zone
Services
Protocols
Interface Statistics
Input Rate
Output Rate
Displays whether the interface is linked (Up) or not linked
(Down).
Displays the IP address of the interface.Address
Displays whether the zone is an untrust zone or a trust
zone.
Displays services that are enabled on the device, such as
HTTP and SSH.
Displays protocols that are enabled on the device, such
as BGP and IGMP.
Displays interface bandwidth utilization. Input rates are
shown in bytes per second.
Displays interface bandwidth utilization. Output rates are
shown in bytes per second.
Error Counters
Packet Counters
Displays input and output error counters in the form of a
bar chart.
Displays the number of broadcast, unicast, and multicast
packet counters in the form of a pie chart. (Packet counter
charts are supported only for interfaces that support MAC
statistics).
Table 12 on page 49 shows the options to change the Interface display on the Ports page.
Table 12: Options to change the Interface Display
DescriptionField
Controls the member for which information is displayed.Port for FPC
Displays input and output packet counters and error counters in the form of charts.Show Graph
Displays the interface graphs in a separate pop-up window.Pop-up button
Page 85

Table 12: Options to change the Interface Display (continued)
DescriptionField
50
Details
Refresh Interval
Displays extensive statistics about the selected interface, including its general status,
traffic information, IP address, I/O errors, class-of-service data, and statistics.
Indicates the duration of time after which you want the data on the page to be
refreshed.
Clears the statistics for the selected interface.Clear Statistics
Alternatively, you can enter the following show commands in the CLI to view interface status and traffic
statistics:
show interfaces terse
•
NOTE: On SRX Series devices, on configuring identical IPs on a single interface, you will not
see a warning message; instead, you will see a syslog message.
show interfaces detail
•
show interfaces extensive
•
show interfaces interface-name
•
Release History Table
DescriptionRelease
19.4R1
19.3R1
Starting in Junos OS Release 19.4R1, J-Web supports Wi–Fi Mini-PIM for SRX320, SRX340,
SRX345, and SRX550M devices. The physical interface for the Wi-Fi Mini-PIM uses the name
wl-x/0/0, where x identifies the slot on the services gateway where the Mini-PIM is installed.
Starting in Junos OS Release 19.3R1, J-Web supports IOC4 line cards for SRX5000 line of devices.
You can also view the sub-ports details configured on any or all ports of the SRX5K-IOC4-MRATE
line card.
RELATED DOCUMENTATION
Monitor PPPoE | 51
Page 86

Monitor PPPoE
You are here: Monitor > Interfaces > PPPoE.
Use this page to view information on the session status for PPPoE interfaces, cumulative statistics for all
PPPoE interfaces on the device, and the PPPoE version configured on the device.
NOTE: This option is not available in SRX5000 line of devices, SRX4200, and SRX4600 devices.
To view interface-specific properties in the J-Web interface, select the interface name on the PPPoE page.
Table 13 on page 51 describes the fields on the PPPoE page.
Table 13: Fields on the PPPoE Page
DescriptionField
51
Interface
Session ID
Service Name
Name of the PPPoE interface.
Click the interface name to display PPPoE information for the interface.
State of the PPPoE session on the interface.State
Unique session identifier for the PPPoE session.
To establish a PPPoE session, first the device acting as a PPPoE client obtains the Ethernet
address of the PPPoE server or access concentrator, and then the client and the server
negotiate a unique session ID. This process is referred to as PPPoE active discovery and is
made up of four steps:
initiation
•
offer
•
request
•
session confirmation.
•
The access concentrator generates the session ID for session confirmation and sends it to
the PPPoE client in a PPPoE Active Discovery Session-Confirmation (PADS) packet.
Type of service required from the access concentrator.
Service Name identifies the type of service provided by the access concentrator, such as
the name of the Internet service provider (ISP), class, or quality of service.
Configured access concentrator name.Configured AC Name
Page 87

Table 13: Fields on the PPPoE Page (continued)
DescriptionField
Name of the access concentrator.Session AC Names
Media access control (MAC) address of the access concentrator.AC MAC Address
Number of seconds the current PPPoE session has been running.Session Uptime
Number of seconds to wait before reconnecting after a PPPoE session is terminated.Auto-Reconnect
Time-out
Number of seconds a PPPoE session can be idle without disconnecting.Idle Time-out
52
Underlying Interface
PPPoE Statistics
Packet Type
Name of the underlying logical Ethernet or ATM interface on which PPPoE is running—for
example, ge-0/0/0.1.
Total number of active PPPoE sessions.Active PPPoE Sessions
Packets sent and received during the PPPoE session, categorized by packet type and packet
error:
PADI — PPPoE Active Discovery Initiation packets.
•
PADO — PPPoE Active Discovery Offer packets.
•
PADR — PPPoE Active Discovery Request packets.
•
PADS — PPPoE Active Discovery Session - Confirmation packets.
•
PADT — PPPoE Active Discovery Terminate packets.
•
Service Name Error — Packets for which the Service-Name request could not be honored.
•
AC System Error — Packets for which the access concentrator experienced an error in
•
processing the host request. For example, the host had insufficient resources to create
a virtual circuit.
Generic Error — Packets that indicate an unrecoverable error occurred.
•
Malformed Packet — Malformed or short packets that caused the packet handler to
•
disregard the frame as unreadable.
Unknown Packet — Unrecognized packets.
•
Number of the specific type of packet sent from the PPPoE client.Sent
Number of the specific type of packet received by the PPPoE client.Received
Page 88

Table 13: Fields on the PPPoE Page (continued)
DescriptionField
53
Timeout
PPPoE Version
Maximum Sessions
PADI Resend Timeout
Information about the timeouts that occurred during the PPPoE session.
PADI — Number of timeouts that occurred for the PADI packet.
•
PADO — Number of timeouts that occurred for the PADO packet. (This value is always
•
0 and PADO is not supported).
PADR — Number of timeouts that occurred for the PADR packet.
•
Number of the timeouts that occurred for PADI, PADO, and PADR packets.Sent
Maximum number of active PPPoE sessions the device can support. The default is 256
sessions.
Initial time, (in seconds) the device waits to receive a PADO packet for the PADI packet
sent. For example, 2 seconds. This timeout doubles for each successive PADI packet sent.
The PPPoE Active Discovery Initiation (PADI) packet is sent to the access concentrator to
initiate a PPPoE session. Typically, the access concentrator responds to a PADI packet with
a PPPoE Active Discovery Offer (PADO) packet. If the access concentrator does not send
a PADO packet, the device sends the PADI packet again after timeout period is elapsed.
The PADI Resend Timeout doubles for each successive PADI packet sent. For example, if
the PADI Resend Timeout is 2 seconds, the second PADI packet is sent after 2 seconds,
the third after 4 seconds, the fourth after 8 seconds, and so on.
PADR Resend Timeout
Maximum Resend
Timeout
AC Timeout
Initial time (in seconds) the device waits to receive a PADS packet for the PADR packet
sent. This timeout doubles for each successive PADR packet sent.
The PPPoE Active Discovery Request (PADR) packet is sent to the access concentrator in
response to a PADO packet, and to obtain the PPPoE session ID. Typically, the access
concentrator responds to a PADR packet with a PPPoE Active Discovery
Session-Confirmation (PADS) packet, which contains the session ID. If the access
concentrator does not send a PADS packet, the device sends the PADR packet again after
the PADR Resend Timeout period is elapsed. The PADR Resend Timeout doubles for each
successive PADR packet sent.
Maximum value (in seconds) that the PADI or PADR resend timer can accept. For example,
64 seconds. The maximum value is 64.
Time (in seconds), within which the configured access concentrator must respond.Maximum Configured
Alternatively, enter the following CLI commands:
Page 89

show pppoe interfaces
•
show pppoe statistics
•
show pppoe version
•
You can also view status information about the PPPoE interface by entering the show interfaces pp0
command in the CLI editor.
RELATED DOCUMENTATION
Monitor Ports | 48
54
Page 90

CHAPTER 4
Access
IN THIS CHAPTER
Monitor Address Pools | 55
Monitor Address Pools
You are here: Monitor > Access > Address Pools.
55
Use this page to view the properties and assignments of the address pool.
NOTE: This option is not available in SRX5000 line of devices and SRX4000 line of devices.
Table 14 on page 55 describes the fields on the Address Pools page.
Table 14: Fields on the Address Pools Page
DescriptionField
Address Pool Properties
Select an address pool to view its properties and assignments.Address Pool
Refreshes the data of the address pool assignment.Refresh Button
Displays the name of the address pool.Address Pool Name
Displays the IP network address of the address pool.Network Address
Displays the name, the lower limit, and the upper limit of the address range.Address Ranges
Displays the primary-dns IP address.Primary DNS
Displays the secondary-dns IP address.Secondary DNS
Page 91

Table 14: Fields on the Address Pools Page (continued)
DescriptionField
Displays the primary-wins IP address.Primary WINS
Displays the secondary-wins IP address.Secondary WINS
Address Pool Address Assignment
Displays the IP address of the address pool.IP Address
Displays the hardware MAC address of the address pool.Hardware Address
Displays the user name using the address pool.Host/User
56
Type
RELATED DOCUMENTATION
Monitor Ports | 48
Displays the authentication type used by the address pool
NOTE: The authentication types can be extended authentication (XAuth)
or IKE Authentication.
Page 92

CHAPTER 5
Multi Tenancy
IN THIS CHAPTER
Monitor Logical Systems | 57
Monitor Tenants | 60
Monitor Logical Systems
57
You are here: Monitor > Multi Tenancy > Logical System.
An SRX Series device with a multitenant logical systems device, provides various departments, organizations,
customers, and partners a private use of the portion of its resource and a private view of the device.
Table 15 on page 57 describes the fields on the logical system page.
Table 15: Fields on the Logical Systems Page
DescriptionField
Displays the logical systems configured on the device.Name
Displays the logical system profile assigned to each logical system.Resource Profile
Zone Usage
Scheduler Usage
Displays the used and reserved number of zones that user logical system administrators
and primary logical system administrators have configured for their logical systems if
the security profile is bound to the logical systems.
Displays the number of schedulers that user logical system administrators and primary
logical system administrators have configured for their logical systems if the security
profile is bound to the logical systems.
Policy Count Usage
Displays the number of security policies with a count that user logical system
administrators and primary logical system administrators have configured for their logical
systems if the security profile is bound to the logical systems.
Page 93

Table 15: Fields on the Logical Systems Page (continued)
DescriptionField
58
Policy Without Count
Usage
Nat Static Rule Usage
Nat Source Rule Usage
Nat Source Pool Usage
Usage
Nat Port-ol IP Number
Usage
Displays the number of security policies without a count that user logical system
administrators and primary logical system administrators have configured for their logical
systems if the security profile is bound to the logical systems.
Displays the number of NAT static rule configurations that user logical system
administrators and primary logical system administrators have configured for their logical
systems if the security profile is bound to the logical systems.
Displays the NAT source rule configurations that user logical system administrators and
primary logical system administrators have configured for their logical systems if the
security profile is bound to the logical systems.
Displays theNAT source pool configurations that logical system administrators and
primary logical system administrators have configured for their logical systems if the
security profile is bound to the logical systems.
Displays the security NAT rule referenced IP prefix quota of a logical system.Nat Rule Referenced Prefix
Displays the number of NAT port overloading IP number configurations that user logical
system administrators and primary logical system administrators have configured for
their logical systems if the security profile is bound to the logical systems.
Nat Pat Portnum Usage
Nat Pat Address Usage
Nat Address Usage
Usage
Nat Destination Rule Usage
Displays the used quantity and the reserved quantity of ports for the logical system as
part of the security profile.
Displays the number of NAT with port address translation (PAT) configurations that user
logical system administrators and primary logical system administrators have configured
for their logical systems if the security profile is bound to the logical systems.
Displays the number of NAT without port address translation configurations that user
logical system administrators and primary logical system administrators have configured
for their logical systems if the security profile is bound to the logical systems.
Displays the security NAT interface port overloading quota of a logical system.Nat Interface Port-ol IP
Displays the number of NAT destination rule configurations that user logical system
administrators and primary logical system administrators have configured for their logical
systems if the security profile is bound to the logical systems.
Page 94

Table 15: Fields on the Logical Systems Page (continued)
DescriptionField
59
Nat Destination Pool Usage
Nat Cone Binding Usage
Flow Session Usage
Flow Gate Usage
DsLite Softwire Initiator
Usage
Displays the number of NAT destination pools that user logical system administrators
and primary logical system administrators have configured for their logical systems if
the security profile is bound to the logical systems.
Displays the number of NAT cone binding configurations that user logical system
administrators and primary logical system administrators have configured for their logical
systems if the security profile is bound to the logical systems.
Displays the number of flow sessions that user logical system administrators and primary
logical system administrators have configured for their logical systems if the security
profile is bound to the logical systems.
Displays the number of flow gates, also known as pinholes, that user logical system
administrators and primary logical system administrators have configured for their logical
systems if the security profile is bound to the logical systems.
Displays the number of IPv6 dual-stack lite (DS-Lite) softwire initiators that can connect
to the softwire concentrator configured in either a user logical system or the primary
logical system.
NOTE: This statement is configured in the security profile that is bound to the logical
system.
CPU on SPU Usage
Auth Entry Usage
Appfw Rule Set Usage
Appfw Rule Usage
Displays the CPU utilization and average utilization of all SPUs is shown
NOTE: The detail option shows CPU utilization on each SPU.
Displays the number of firewall authentication entries that user logical system
administrators and primary logical system administrators have configured for their logical
systems if the security profile is bound to the logical systems.
Displays the number of application firewall rule set configurations that a primary
administrator has configured for a primary logical system or user logical system when
the security profile is bound to the logical systems.
Displays the number of application firewall rule configurations that a primary
administrator have configured for a primary logical system or user logical system when
the security profile is bound to the logical systems.
Page 95

Table 15: Fields on the Logical Systems Page (continued)
DescriptionField
60
appfw-profile-count
address-book-count
Displays the application firewall profile quota of a logical system
NOTE: As a primary administrator, you can create a security profile and specify the
kinds and amounts of resources to allocate to a logical system to which the security
profile is bound.
Displays the number of address books that user logical system administrators and primary
logical system administrators have configured for their logical systems if the security
profile is bound to the logical systems.
RELATED DOCUMENTATION
Monitor Tenants | 60
Monitor Tenants
You are here: Monitor > Multi Tenancy > Tenants.
An SRX Series device with a multitenant systems device, provides various departments, organizations,
customers, and partners, depending on your environment, private and logically separated use of system
resources and tenant-specific views of security configuration and KPIs.
Table 16 on page 60 describes the fields on the Tenants page.
Table 16: Fields on the Tenants Page
DescriptionField
View Details
Displays the grid view or graph view of all the resources for the tenant you have
selected.
Enables you to search for a tenant system in the grid.Search icon
Enables you to filter and display the list of tenants based on a column in the grid.Filter icon
Enables you to show or hide a column in the grid.Show Hide Column icon
Displays the tenants configured on the device.Name
Page 96

Table 16: Fields on the Tenants Page (continued)
DescriptionField
Displays the resource profile assigned to each tenant.Resource Profile
Displays the used and reserved number of zones for the given tenant.Zone Usage
61
Scheduler Usage
Policy Count Usage
Policy Without Count Usage
Nat Static Rule Usage
Nat Source Rule Usage
Nat Source Pool Usage
Usage
Displays the number of schedulers that primary administrators have configured for
their tenants.
Displays the number of security policies with a count primary administrators have
configured for their tenants if the security profile is bound to the tenants.
Displays the number of security policies without a count that primary administrators
have configured for their tenants if the security profile is bound to the tenants.
Displays the number of NAT static rule configurations that primary administrators
have configured for their tenants if the security profile is bound to the tenants.
Displays the NAT source rule configurations that primary administrators have
configured for their tenants if the security profile is bound to the tenants.
Displays theNAT source pool configurations that primary administrators have
configured for their tenants if the security profile is bound to the tenants.
Displays the security NAT rule referenced IP prefix quota of a tenant.Nat Rule Referenced Prefix
Nat Port-Ol IP Number Usage
Nat Pat Portnum Usage
Nat Pat Address Usage
Nat No Pat Address Usage
Displays the number of NAT port overloading IP number configurations that primary
administrators have configured for their tenants if the security profile is bound to
the tenants.
Displays the used quantity and the reserved quantity of ports for the tenant as part
of the security profile.
Displays the number of NAT with port address translation (PAT) configurations that
primary administrators have configured for their tenants if the security profile is
bound to the tenants.
Displays the number of NAT without port address translation configurations that
primary administrators have configured for their tenants if the security profile is
bound to the tenants.
Displays the security NAT interface port overloading quota of a tenant.Nat Interface Port-Ol IP Usage
Page 97

Table 16: Fields on the Tenants Page (continued)
DescriptionField
62
Nat Destination Rule Usage
Nat Destination Pool Usage
Nat Cone Binding Usage
Flow Session Usage
Flow Gate Usage
DsLite Softwire Initiator Usage
Displays the number of NAT destination rule configurations thatmaster administrators
have configured for their tenants if the security profile is bound to the tenants.
Displays the number of NAT destination pools that primary administrators have
configured for their tenants if the security profile is bound to the tenants.
Displays the number of NAT cone binding configurations that primary administrators
have configured for their tenants if the security profile is bound to the tenants.
Displays the number of flow sessions that primary administrators have configured
for their tenants if the security profile is bound to the tenants.
Displays the number of flow gates, also known as pinholes, that primary
administrators have configured for their tenants if the security profile is bound to
the tenants.
Displays the number of IPv6 dual-stack lite (DS-Lite) softwire initiators that can
connect to the softwire concentrator configured in either a user tenant or the primary
tenant
NOTE: This statement is configured in the security profile that is bound to the
tenant.
CPU on SPU Usage
Auth Entry Usage
Appfw Rule Set Usage
Appfw Rule Usage
appfw-profile-count
Displays the CPU utilization and average utilization of all SPUs
NOTE: The detail option shows CPU utilization on each SPU.
Displays the number of firewall authentication entries that primary administrators
have configured for their tenants if the security profile is bound to the tenants.
Displays the number of application firewall rule set configurations that a primary
administrator has configured for a tenant when the security profile is bound to the
tenants.
Displays the number of application firewall rule configurations that a primary
administrator have configured for a primary tenant or user tenant when the security
profile is bound to the tenants.
Displays the application firewall profile quota of a tenant
NOTE: As a primary administrator, you can create a security profile and specify the
kinds and amount of resources to allocate to a tenant to which the security profile
is bound.
Page 98

Table 16: Fields on the Tenants Page (continued)
DescriptionField
63
address-book-count
RELATED DOCUMENTATION
Monitor Logical Systems | 57
Displays the number of address books that primary administrators have configured
for their tenants if the security profile is bound to the tenants.
Page 99

CHAPTER 6
Alarms
IN THIS CHAPTER
Monitor Alarms | 64
Monitor Policy Log | 65
Monitor Alarms
64
You are here: Monitor > Alarms > Alarms.
Use this page to view the alarms details such as time, severity, type, and descriptions of the alarm.
Table 17 on page 64 describes the fields on the Alarms page.
Table 17: Fields on the Alarms Page
DescriptionField
Alarm Filter
Alarm Type
Severity
Specifies the type of alarm to monitor:
System - System alarms include FRU detection alarms (power supplies removed, for
•
instance).
Chassis - Chassis alarms indicate environmental alarms such as temperature.
•
All - Indicates to display all the types of alarms.
•
Enter a brief synopsis of the alarms you want to monitor.Description
Specifies the alarm severity that you want to monitor
Date From
Major - A major (red) alarm condition requires immediate action.
•
Minor - A minor (yellow) condition requires monitoring and maintenance.
•
All - Indicates to display all the severities.
•
Specifies the beginning of the date range that you want to monitor. Set the date using the
calendar pick tool.
Page 100

Table 17: Fields on the Alarms Page (continued)
DescriptionField
65
To
Alarm Details
Specifies the end of the date range that you want to monitor. Set the date using the calendar
pick tool.
Executes the options that you specified.Search
Displays the following information about each alarm:
Time - Time that the alarm was registered.
•
Type - Type of alarm: System, Chassis, or All.
•
Severity - Severity class of the alarm: Minor or Major.
•
Description - Description of the alarm.
•
RELATED DOCUMENTATION
Monitor Policy Log | 65
Monitor Policy Log
You are here: Monitor > Alarms > Policy Log.
Use the monitoring functionality to view the Policy Log page.
Table 18 on page 65 describes the fields on the Policy Log page.
Table 18: Fields on the Policy Log Page
DescriptionField
Name of the event log files to search.Log file name
Name of the policy of the events to be retrieved.Policy name
Source address of the traffic that triggered the event.Source address
Destination address of the traffic that triggered the event.Destination address
Type of event that was triggered by the traffic.Event type
 Loading...