
HealthBot User Guide
Published
2021-02-17

Juniper Networks, Inc.
1133 Innovation Way
Sunnyvale, California 94089
USA
408-745-2000
www.juniper.net
Juniper Networks, the Juniper Networks logo, Juniper, and Junos are registered trademarks of Juniper Networks, Inc. in
the United States and other countries. All other trademarks, service marks, registered marks, or registered service marks
are the property of their respective owners.
Juniper Networks assumes no responsibility for any inaccuracies in this document. Juniper Networks reserves the right
to change, modify, transfer, or otherwise revise this publication without notice.
HealthBot User Guide
Copyright © 2021 Juniper Networks, Inc. All rights reserved.
The information in this document is current as of the date on the title page.
ii
YEAR 2000 NOTICE
Juniper Networks hardware and software products are Year 2000 compliant. Junos OS has no known time-related
limitations through the year 2038. However, the NTP application is known to have some difficulty in the year 2036.
END USER LICENSE AGREEMENT
The Juniper Networks product that is the subject of this technical documentation consists of (or is intended for use with)
Juniper Networks software. Use of such software is subject to the terms and conditions of the End User License Agreement
(“EULA”) posted at https://support.juniper.net/support/eula/. By downloading, installing or using such software, you
agree to the terms and conditions of that EULA.

Table of Contents
1
About the Documentation | ix
Documentation and Release Notes | ix
Documentation Conventions | ix
Documentation Feedback | xii
Requesting Technical Support | xii
Self-Help Online Tools and Resources | xiii
Creating a Service Request with JTAC | xiii
Introduction to HealthBot
HealthBot Overview | 15
Benefits of HealthBot | 15
iii
Closed-Loop Automation | 16
Main Components of HealthBot | 17
HealthBot Health Monitoring | 17
HealthBot Root Cause Analysis | 18
HealthBot Log File Analysis | 19
HealthBot Concepts | 20
HealthBot Data Collection Methods | 21
Data Collection - ’Push’ Model | 21
Data Collection - ’Pull’ Model | 22
HealthBot Topics | 22
HealthBot Rules - Basics | 23
HealthBot Rules - Deep Dive | 25
Rules | 25
Sensors | 28
Fields | 28
Vectors | 30
Variables | 30
Functions | 31
Triggers | 31

Tagging | 34
Rule Properties | 35
HealthBot Playbooks | 35
Healthbot Tagging | 36
Overview | 36
HealthBot Tagging Terminology | 37
How It Works | 41
Examples | 42
HealthBot Time Series Database (TSDB) | 48
Historical Context | 48
TSDB Improvements | 49
Database Sharding | 50
Database Replication | 51
iv
Database Reads and Writes | 52
Manage TSDB Options in the HealthBot GUI | 53
HealthBot CLI Configuration Options | 55
HealthBot Machine Learning (ML) | 56
HealthBot Machine Learning Overview | 56
Understanding HealthBot Anomaly Detection | 57
Field | 57
Algorithm | 58
Learning period | 58
Pattern periodicity | 59
Understanding HealthBot Outlier Detection | 59
Dataset | 60
Algorithm | 60
Sigma coefficient (k-fold-3sigma only) | 62
Sensitivity | 62
Learning period | 62
Understanding HealthBot Predict | 62
Field | 63
Algorithm | 63
Learning period | 63

Pattern periodicity | 63
2
Prediction offset | 63
HealthBot Rule Examples | 64
HealthBot Anomaly Detection Example | 64
HealthBot Outlier Detection Example | 73
Frequency Profiles and Offset Time | 78
Frequency Profiles | 78
Configuration Using HealthBot GUI | 79
Configuration Using HealthBot CLI | 81
Apply a Frequency Profile Using the HealthBot GUI | 81
Apply a Frequency Profile Using the HealthBot CLI | 83
Offset Time Unit | 83
Offset Used in Formulas | 84
v
Offset Used in References | 85
Offset Used in Vectors | 86
Offset Used in Triggers | 88
Offset Used in Trigger Reference | 89
HealthBot Licensing | 91
HealthBot Licensing Overview | 91
Managing HealthBot Licenses | 94
Add a License to HealthBot | 94
View Licensing Status in HealthBot | 94
Management and Monitoring
Manage HealthBot Users and Groups | 98
User Management | 98
Group Management | 99
Limitations | 104
Manage Devices, Device Groups, and Network Groups | 104
Adding a Device | 106
Editing a Device | 109
Adding a Device Group | 109
Editing a Device Group | 113

Configuring a Retention Policy for the Time Series Database | 113
Adding a Network Group | 114
Editing a Network Group | 117
HealthBot Rules and Playbooks | 118
Add a Pre-Defined Rule | 119
Create a New Rule Using the HealthBot GUI | 119
Rule Filtering | 121
Sensors | 123
Fields | 125
Vectors | 128
Variables | 130
Functions | 131
Triggers | 133
vi
Rule Properties | 136
Edit a Rule | 136
Add a Pre-Defined Playbook | 137
Create a New Playbook Using the HealthBot GUI | 138
Edit a Playbook | 139
Manage Playbook Instances | 140
View Information About Playbook Instances | 141
Create a Playbook Instance | 143
Manually Pause or Play a Playbook Instance | 145
Create a Schedule to Automatically Play/Pause a Playbook Instance | 146
Monitor Device and Network Health | 148
Dashboard | 149
Health | 152
Network Health | 165
Graph Page | 165
Alarms and Notifications | 181
Generate Alarm Notifications | 181
Manage Alarms Using Alarm Manager | 190

Stream Sensor and Field Data from HealthBot | 195
Generate Reports | 200
Configure a Secure Data Connection for HealthBot Devices | 216
Configure Security Profiles for SSL and SSH Authentication | 217
Configure Security Authentication for a Specific Device or Device Group | 218
Configure Data Summarization | 219
Creating a Data Summarization Profile | 220
Applying Data Summarization Profiles to a Device Group | 221
Modify the UDA and UDF Engines | 222
Overview | 222
How it Works | 223
Usage Notes | 224
vii
Configuration | 225
SIMULATE | 225
MODIFY | 226
ROLLBACK | 227
Logs for HealthBot Services | 227
Configure Service Log Levels for a Device Group or Network Group | 228
Download Logs for HealthBot Services | 229
Troubleshooting | 230
HealthBot Self Test | 230
Overview | 230
Other Uses for the Self Test Tool | 231
Usage Notes | 231
How to Use the Self Test Tool | 232
Device Reachability Test | 232
Overview | 232
Usage Notes | 233
How to Use the Device Reachability Tool | 233

Ingest Connectivity Test | 234
Overview | 234
Usage Notes | 235
How to Use the Ingest Connectivity Tool | 235
Debug No-Data | 236
Overview | 236
Usage Notes | 237
How to Use the Debug No-Data Tool | 238
HealthBot Configuration – Backup and Restore | 240
Back Up the Configuration | 240
Restore the Configuration | 240
Backup or Restore the Time Series Database (TSDB) | 241
viii
About the Documentation
IN THIS SECTION
Documentation and Release Notes | ix
Documentation Conventions | ix
Documentation Feedback | xii
Requesting Technical Support | xii
Use this guide to understand the features you can configure and the tasks you can perform from the
HealthBot web UI.
ix
Documentation and Release Notes
To obtain the most current version of all Juniper Networks®technical documentation, see the product
documentation page on the Juniper Networks website at https://www.juniper.net/documentation/.
If the information in the latest release notes differs from the information in the documentation, follow the
product Release Notes.
Juniper Networks Books publishes books by Juniper Networks engineers and subject matter experts.
These books go beyond the technical documentation to explore the nuances of network architecture,
deployment, and administration. The current list can be viewed at https://www.juniper.net/books.
Documentation Conventions
Table 1 on page x defines notice icons used in this guide.
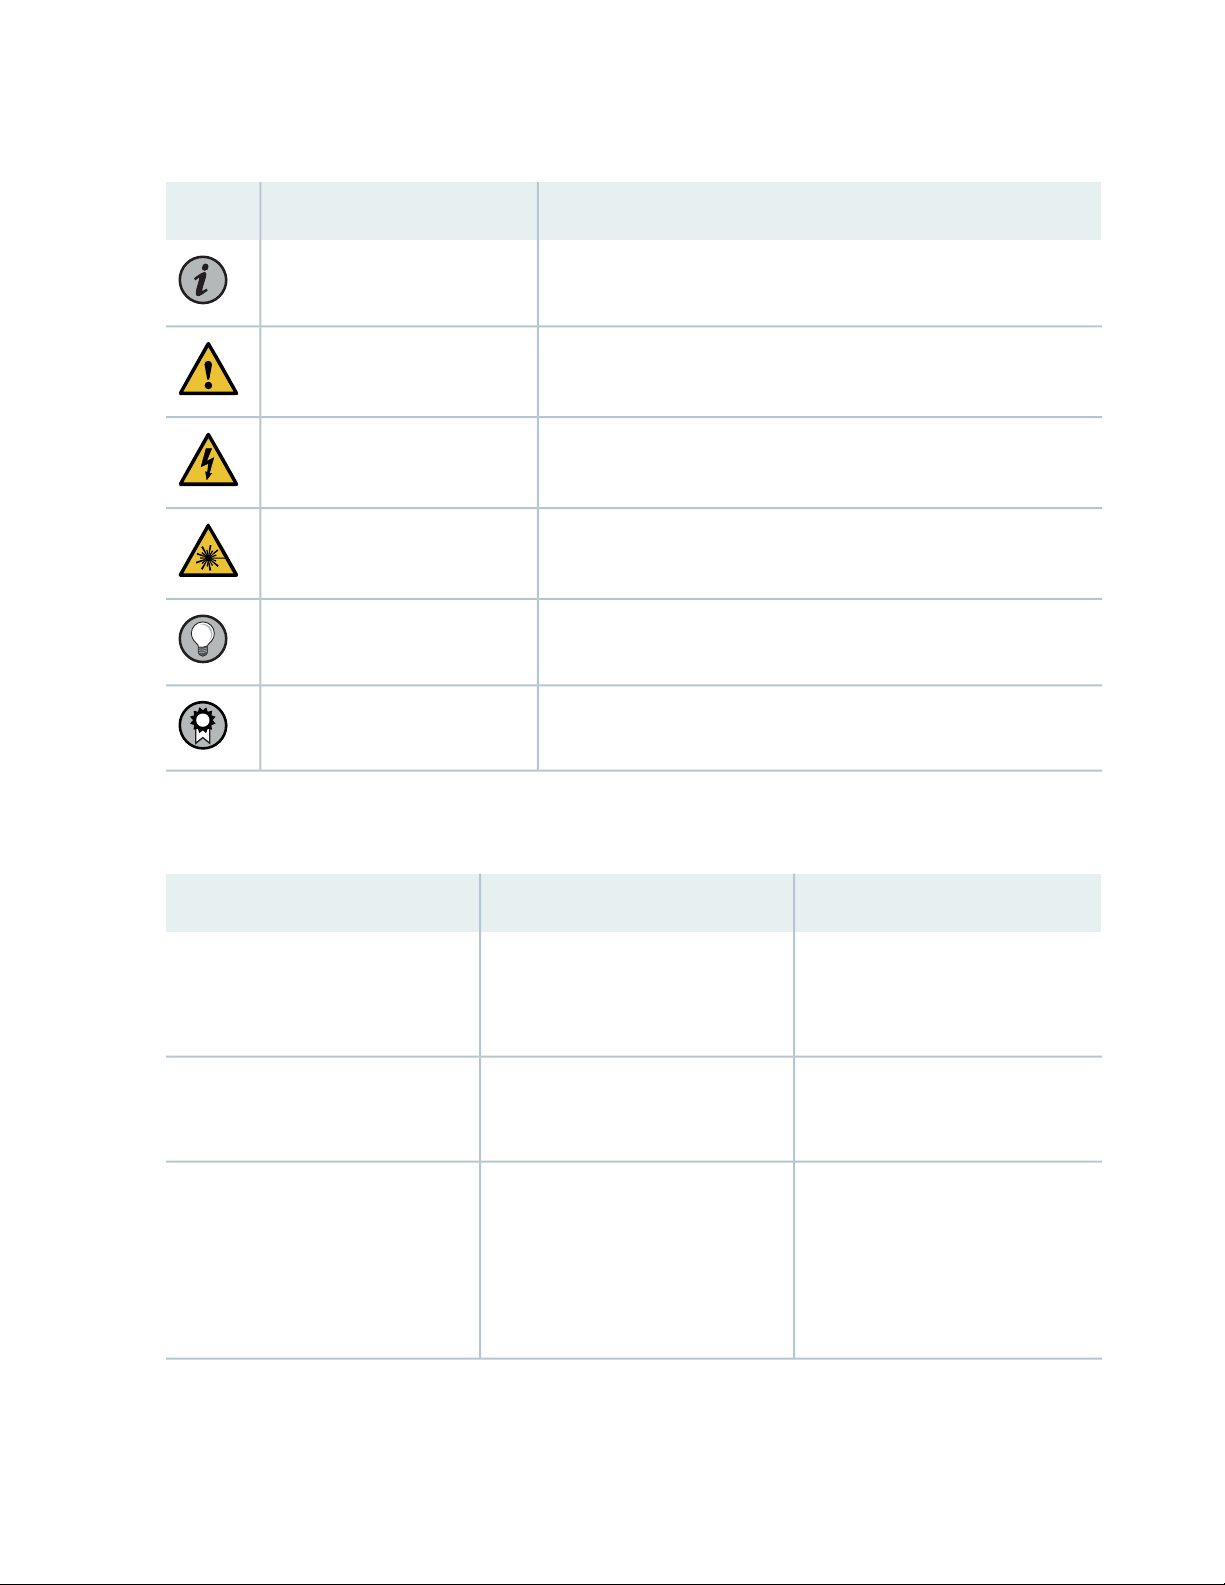
Table 1: Notice Icons
x
DescriptionMeaningIcon
Indicates important features or instructions.Informational note
Caution
Indicates a situation that might result in loss of data or hardware
damage.
Alerts you to the risk of personal injury or death.Warning
Alerts you to the risk of personal injury from a laser.Laser warning
Indicates helpful information.Tip
Alerts you to a recommended use or implementation.Best practice
Table 2 on page x defines the text and syntax conventions used in this guide.
Table 2: Text and Syntax Conventions
ExamplesDescriptionConvention
Fixed-width text like this
Italic text like this
Represents text that you type.Bold text like this
Represents output that appears on
the terminal screen.
Introduces or emphasizes important
•
new terms.
Identifies guide names.
•
Identifies RFC and Internet draft
•
titles.
To enter configuration mode, type
the configure command:
user@host> configure
user@host> show chassis alarms
No alarms currently active
A policy term is a named structure
•
that defines match conditions and
actions.
Junos OS CLI User Guide
•
RFC 1997, BGP Communities
•
Attribute

Table 2: Text and Syntax Conventions (continued)
xi
ExamplesDescriptionConvention
Italic text like this
Text like this
< > (angle brackets)
| (pipe symbol)
Represents variables (options for
which you substitute a value) in
commands or configuration
statements.
Represents names of configuration
statements, commands, files, and
directories; configuration hierarchy
levels; or labels on routing platform
components.
variables.
Indicates a choice between the
mutually exclusive keywords or
variables on either side of the symbol.
The set of choices is often enclosed
in parentheses for clarity.
Configure the machine’s domain
name:
[edit]
root@# set system domain-name
domain-name
To configure a stub area, include
•
the stub statement at the [edit
protocols ospf area area-id]
hierarchy level.
The console port is labeled
•
CONSOLE.
stub <default-metric metric>;Encloses optional keywords or
broadcast | multicast
(string1 | string2 | string3)
# (pound sign)
[ ] (square brackets)
Indention and braces ( { } )
; (semicolon)
GUI Conventions
Indicates a comment specified on the
same line as the configuration
statement to which it applies.
Encloses a variable for which you can
substitute one or more values.
Identifies a level in the configuration
hierarchy.
Identifies a leaf statement at a
configuration hierarchy level.
rsvp { # Required for dynamic MPLS
only
community name members [
community-ids ]
[edit]
routing-options {
static {
route default {
nexthop address;
retain;
}
}
}
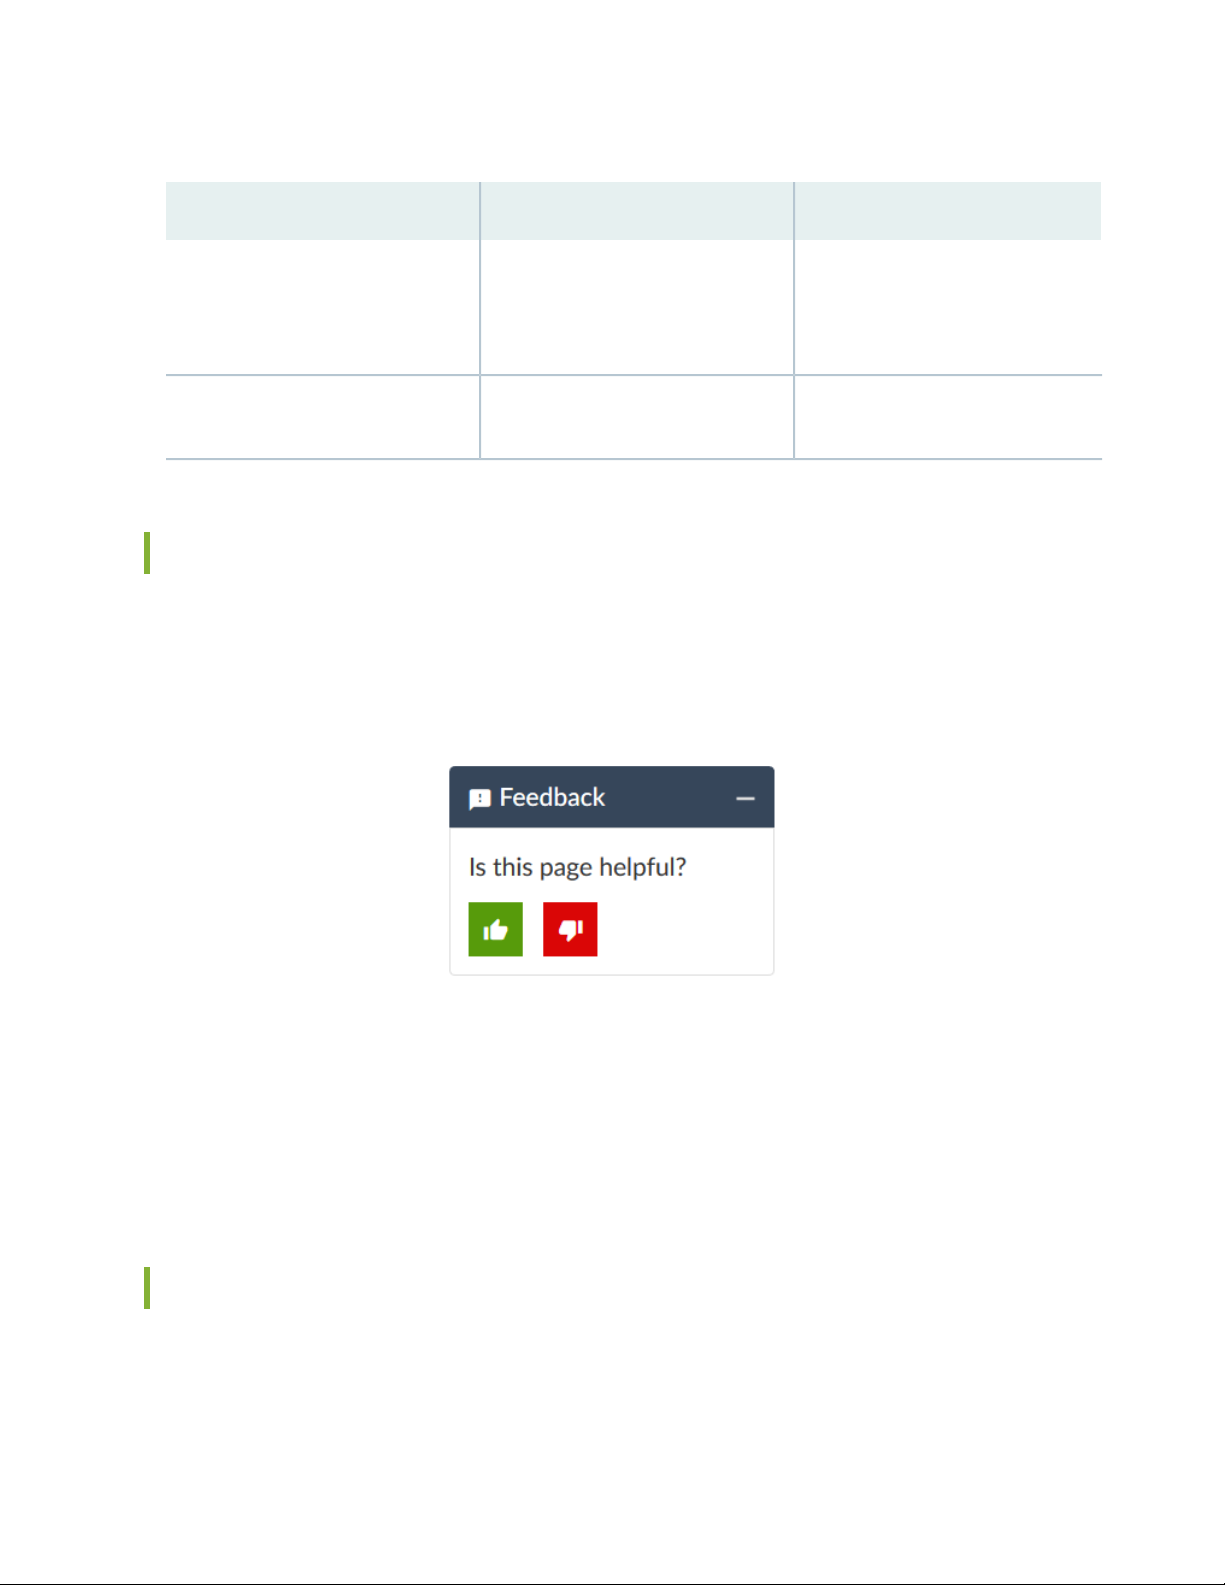
Table 2: Text and Syntax Conventions (continued)
xii
ExamplesDescriptionConvention
Bold text like this
> (bold right angle bracket)
Represents graphical user interface
(GUI) items you click or select.
Separates levels in a hierarchy of
menu selections.
In the Logical Interfaces box, select
•
All Interfaces.
To cancel the configuration, click
•
Cancel.
In the configuration editor hierarchy,
select Protocols>Ospf.
Documentation Feedback
We encourage you to provide feedback so that we can improve our documentation. You can use either
of the following methods:
Online feedback system—Click TechLibrary Feedback, on the lower right of any page on the Juniper
•
Networks TechLibrary site, and do one of the following:
Click the thumbs-up icon if the information on the page was helpful to you.
•
Click the thumbs-down icon if the information on the page was not helpful to you or if you have
•
suggestions for improvement, and use the pop-up form to provide feedback.
E-mail—Send your comments to techpubs-comments@juniper.net. Include the document or topic name,
•
URL or page number, and software version (if applicable).
Requesting Technical Support
Technical product support is available through the Juniper Networks Technical Assistance Center (JTAC).
If you are a customer with an active Juniper Care or Partner Support Services support contract, or are

covered under warranty, and need post-sales technical support, you can access our tools and resources
online or open a case with JTAC.
JTAC policies—For a complete understanding of our JTAC procedures and policies, review the JTAC User
•
Guide located at https://www.juniper.net/us/en/local/pdf/resource-guides/7100059-en.pdf.
Product warranties—For product warranty information, visit https://www.juniper.net/support/warranty/.
•
JTAC hours of operation—The JTAC centers have resources available 24 hours a day, 7 days a week,
•
365 days a year.
Self-Help Online Tools and Resources
For quick and easy problem resolution, Juniper Networks has designed an online self-service portal called
the Customer Support Center (CSC) that provides you with the following features:
Find CSC offerings: https://www.juniper.net/customers/support/
•
Search for known bugs: https://prsearch.juniper.net/
•
xiii
Find product documentation: https://www.juniper.net/documentation/
•
Find solutions and answer questions using our Knowledge Base: https://kb.juniper.net/
•
Download the latest versions of software and review release notes:
•
https://www.juniper.net/customers/csc/software/
Search technical bulletins for relevant hardware and software notifications:
•
https://kb.juniper.net/InfoCenter/
Join and participate in the Juniper Networks Community Forum:
•
https://www.juniper.net/company/communities/
Create a service request online: https://myjuniper.juniper.net
•
To verify service entitlement by product serial number, use our Serial Number Entitlement (SNE) Tool:
https://entitlementsearch.juniper.net/entitlementsearch/
Creating a Service Request with JTAC
You can create a service request with JTAC on the Web or by telephone.
Visit https://myjuniper.juniper.net.
•
Call 1-888-314-JTAC (1-888-314-5822 toll-free in the USA, Canada, and Mexico).
•
For international or direct-dial options in countries without toll-free numbers, see
https://support.juniper.net/support/requesting-support/.

1
CHAPTER
Introduction to HealthBot
HealthBot Overview | 15
HealthBot Concepts | 20
Healthbot Tagging | 36
HealthBot Time Series Database (TSDB) | 48
HealthBot Machine Learning (ML) | 56
Frequency Profiles and Offset Time | 78
HealthBot Licensing | 91
HealthBot Overview
IN THIS SECTION
Benefits of HealthBot | 15
Closed-Loop Automation | 16
Main Components of HealthBot | 17
HealthBot is a highly automated and programmable device-level diagnostics and network analytics tool
that provides consistent and coherent operational intelligence across network deployments. Integrated
with multiple data collection methods (such as Junos Telemetry Interface, NETCONF, syslog, and SNMP),
HealthBot aggregates and correlates large volumes of time-sensitive telemetry data, providing a
multidimensional and predictive view of the network. Additionally, HealthBot translates troubleshooting,
maintenance, and real-time analytics into an intuitive user experience to give network operators actionable
insights into the health of an individual device and the overall network.
15
Benefits of HealthBot
Customization—Provides a framework to define and customize health profiles, allowing truly actionable
•
insights for the specific device or network being monitored.
Automation—Automates root cause analysis and log file analysis, streamlines diagnostic workflows, and
•
provides self-healing and remediation capabilities.
Greater network visibility—Provides advanced multidimensional analytics across network elements,
•
giving you a clearer understanding of network behavior to establish operational benchmarks, improve
resource planning, and minimize service downtime.
Intuitive graphical user interface—Offers an intuitive web-based GUI for policy management and easy
•
data consumption.
Open integration —Lowers the barrier of entry for telemetry and analytics by providing open source
•
data pipelines, notification capabilities, and third-party device support.
Multiple data collection methods—Includes support for Junos Telemetry Interface (JTI), NETCONF,
•
syslog, NetFlow, and SNMP.

Closed-Loop Automation
HealthBot offers closed-loop automation. The automation workflow can be divided into seven main steps
(see Figure 1 on page 17):
1. Define—HealthBot provides tools for the user to define the health parameters of key network elements
through customizable key performance indicators (KPIs), rules, and playbooks.
2. Collect—HealthBot collects rule-based telemetry data from multiple devices using various types of
data transfer methods.
3. Store—HealthBot stores time-sensitive telemetry data in a time-series database (TSDB). This allows
users to query, perform operations on, and write new data back to the database, days, or even
weeks after initial storage.
4. Analyze—HealthBot analyzes telemetry data based on customizable KPIs, rules, and playbooks.
5. Visualize—HealthBot provides multiple ways for you to visualize the aggregated telemetry data through
the HealthBot web UI to gain actionable and predictive insight into the health of your devices and
overall network.
16
6. Notify—HealthBot notifies you through the HealthBot web UI and alarm notifications when problems
in the network are detected.
7. Act—HealthBot performs user-defined actions to help resolve and proactively prevent network problems.
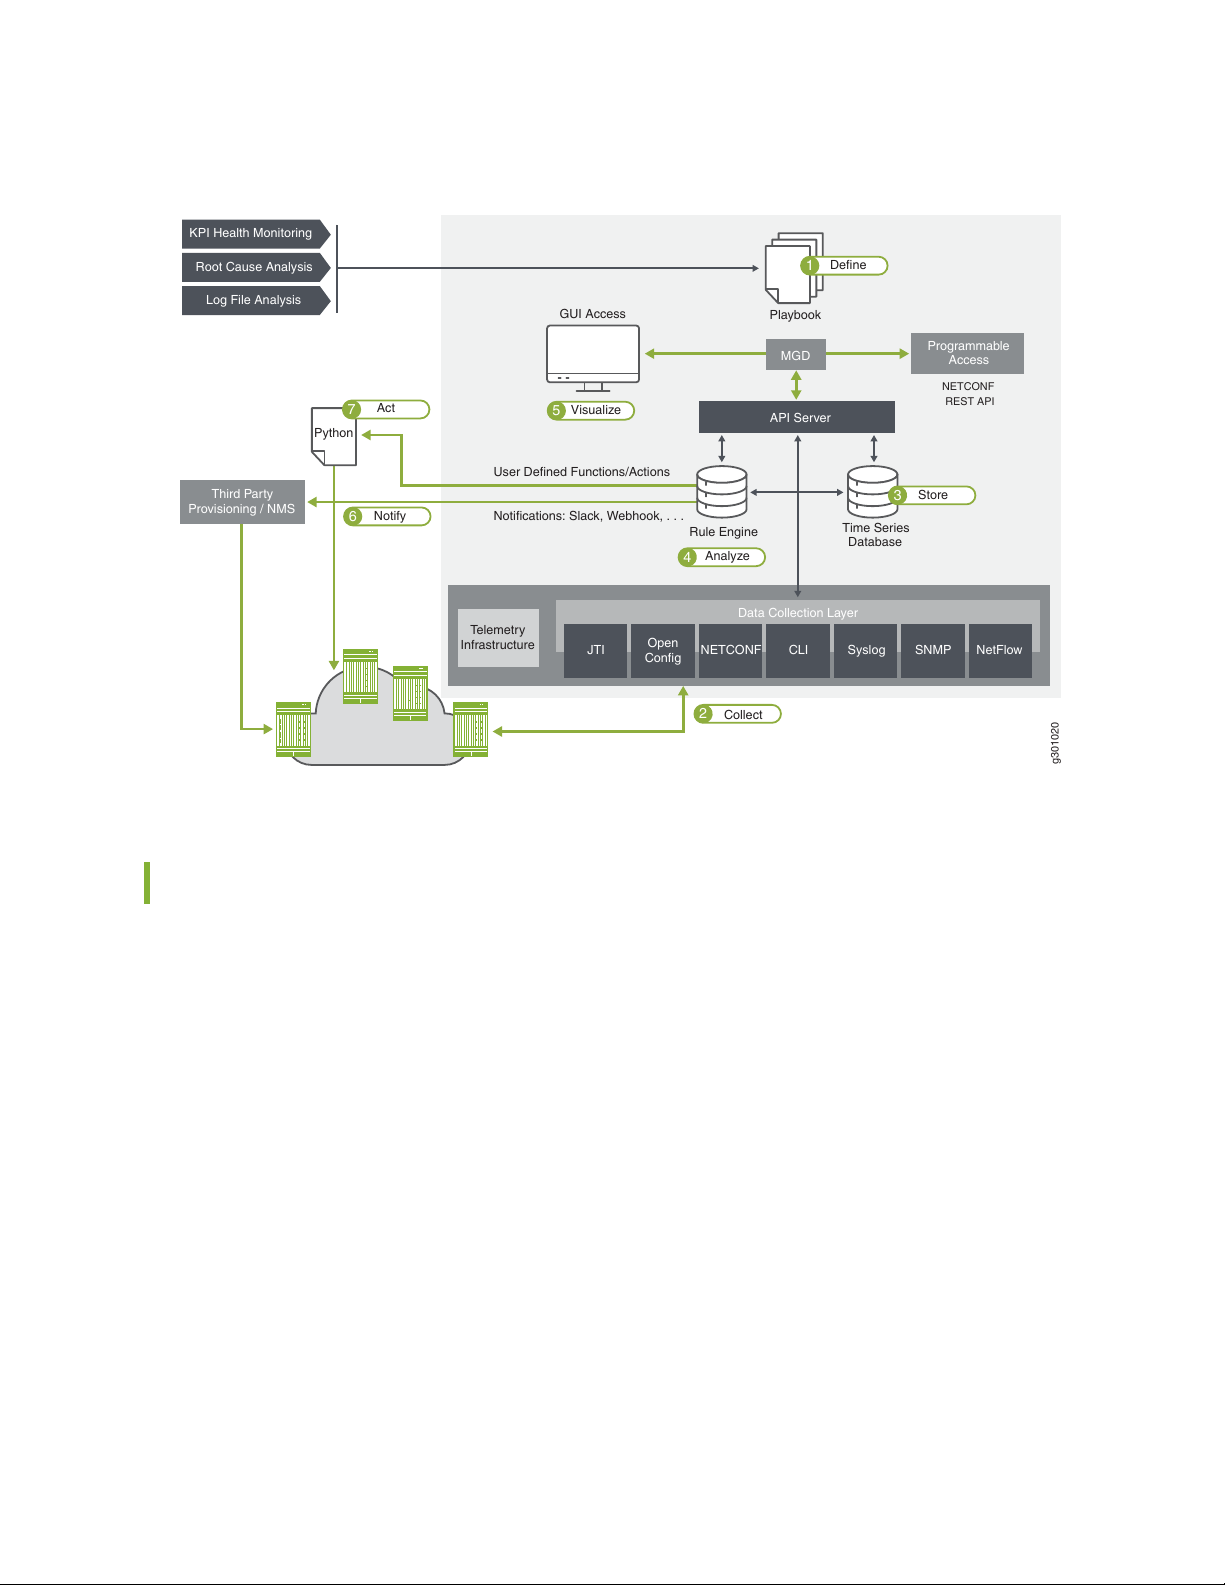
Figure 1: HealthBot Closed-loop Automation Workflow
Rule Engine
g301020
API Server
Programmable
Access
MGD
Playbook
KPI Health Monitoring
Root Cause Analysis
Log File Analysis
Time Series
Database
2
Collect
4
Analyze
Third Party
Provisioning / NMS
NETCONF
REST API
Data Collection Layer
NETCONF
Open
Config
JTI CLI Syslog SNMP NetFlow
Telemetry
Infrastructure
3
Store
Python
7
Act
6
Notify
User Defined Functions/Actions
Notifications: Slack, Webhook, . . .
5
Visualize
1
Define
GUI Access
17
Main Components of HealthBot
HealthBot consists of three main components:
Health Monitoring—View an abstracted, hierarchical representation of device and network-level health,
•
and define the health parameters of key network elements through customizable key performance
indicators (KPIs), rules, and playbooks.
Root Cause Analysis—Find the root cause of a device or network-level issue when HealthBot detects a
•
problem with a network element.
Log File Analysis—Analyze relevant system log messages by filtering out noise.
•
HealthBot Health Monitoring
The Challenge
With increasing data traffic generated by cloud-native applications and emerging technologies, service
providers and enterprises need a network analytics solution to analyze volumes of telemetry data, offer

insights into overall network health, and produce actionable intelligence. While telemetry-based techniques
have existed for years, the growing number of protocols, data formats, and key performance indicators
(KPIs) from diverse networking devices has made data analysis complex and costly. Traditional CLI-based
interfaces require specialized skills to extract business value from telemetry data, creating a barrier to
entry for network analytics
The HealthBot Health Monitoring Solution
By aggregating and correlating raw telemetry data from multiple sources, the HealthBot health monitoring
feature provides a multidimensional view of network health that reports current status, as well as projected
threats to the infrastructure and its workloads.
Health status determination is tightly integrated with the HealthBot root cause analysis (RCA) application,
which can make use of syslog log data received from the network and its devices. HealthBot health
monitoring provides status indicators that alert you when, for example, a network resource is currently
operating outside a user-defined performance policy, as well as risk analysis using historical trends to
predict whether a resource may be unhealthy in the future. HealthBot health monitoring not only offers
a fully customizable view of the current health of network elements, it also automatically initiates remedial
actions based on predefined service level agreements (SLAs).
18
Defining the health of a network element, such as broadband network gateway (BNG), provider edge (PE),
core, and leaf-spine, is highly contextual. Each element plays a different role in a network, with unique key
performance indicators (KPIs) to monitor. Given that there is no single definition for network health across
all use cases, HealthBot provides a highly customizable framework to allow you to define your own health
profiles.
HealthBot Root Cause Analysis
The Challenge
In some cases, it can be challenging for a network operator to figure out what causes a Junos OS networking
device to stop working properly. When this happens, the typical workflow to find the root cause of the
network problem involves contacting a specialist from Juniper Networks, who would then troubleshoot
and triage the unhealthy component based on knowledge built from years of experience. After completing
this time-intensive assessment, the problem would then be reassigned to the relevant engineering team.
The HealthBot RCA Solution
The purpose of the HealthBot root cause analysis (RCA) application is to simplify the process of finding
the root cause of a network issue. HealthBot RCA captures the troubleshooting knowledge of, for example,
the Juniper Networks specialists as part of a knowledge base in the form of HealthBot rules. These rules
are evaluated either on demand by a specific trigger or periodically in the background to ascertain the
health of a networking component, such as routing protocol, system, interface, or chassis, on the device.
To illustrate the benefits of HealthBot RCA, let us consider the problem of OSPF flapping.
Figure 2 on page 19 highlights the workflow sequence involved in debugging OSPF flapping. If a network
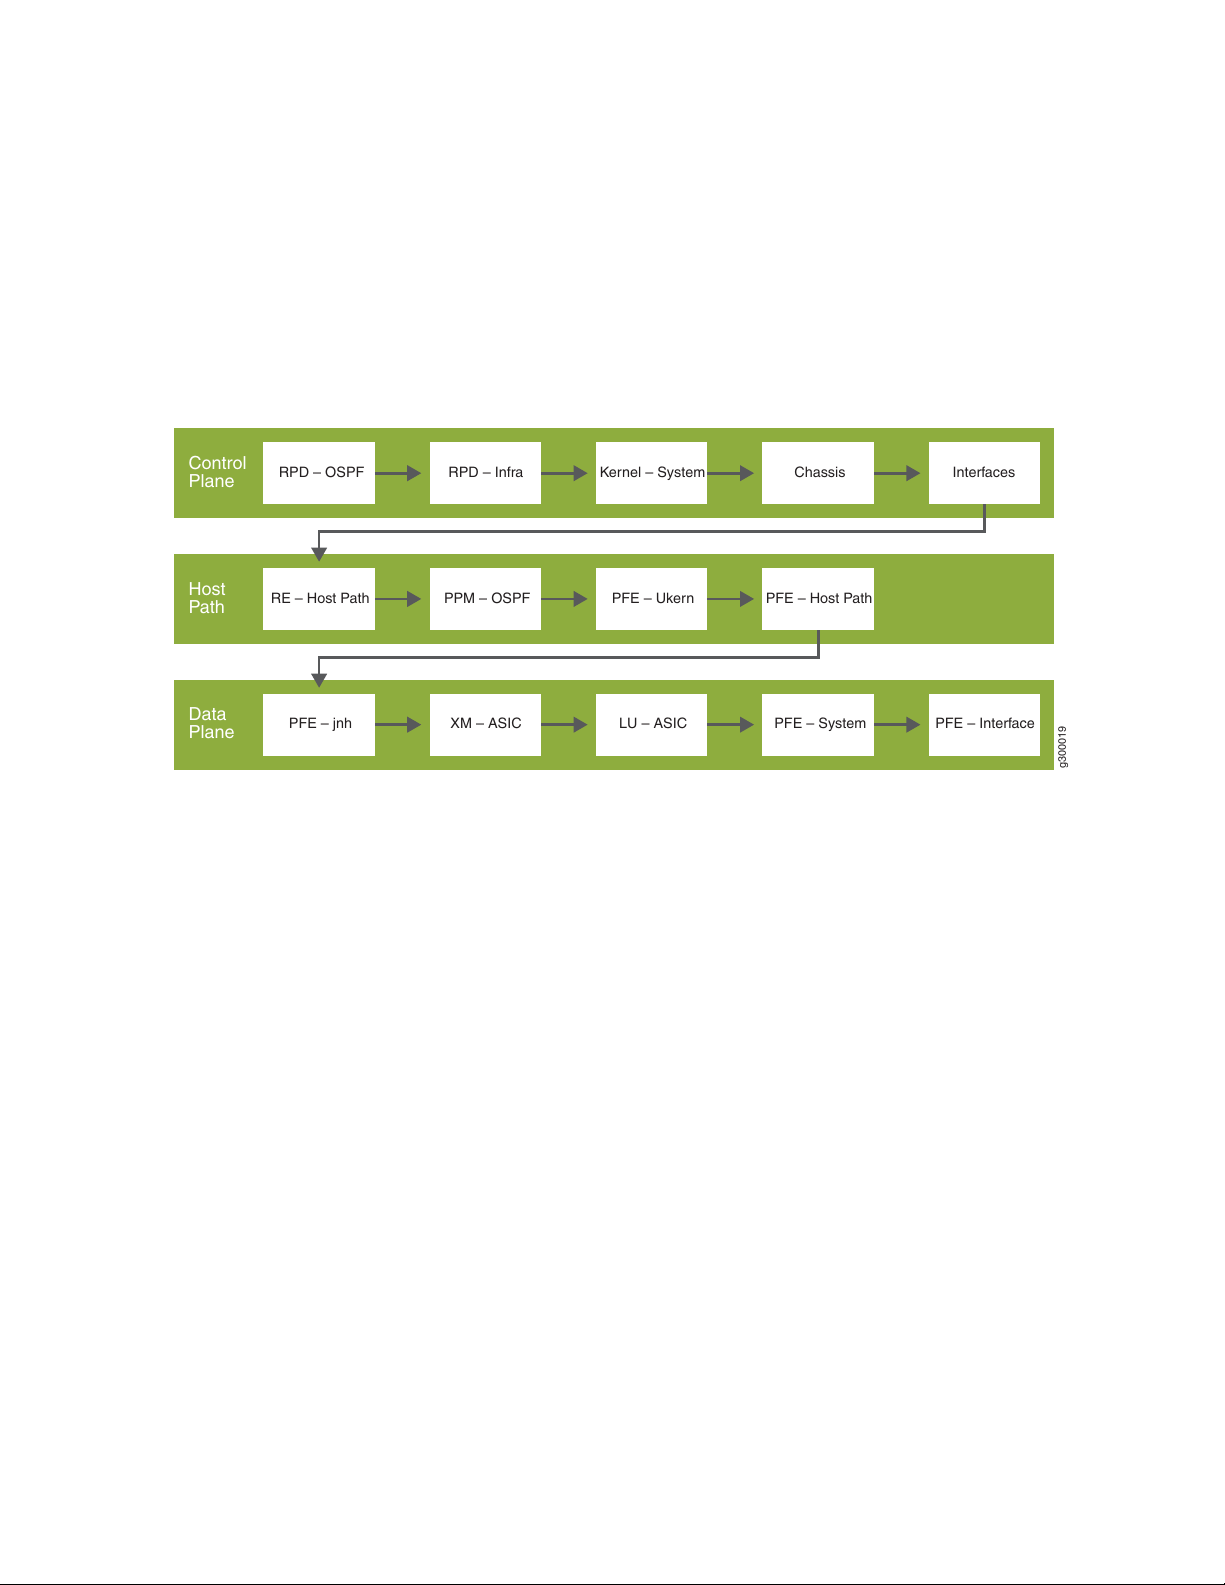
operator or Juniper Networks specialist were assigned this troubleshooting task, he or she would need to
RPD – Infra Kernel – System Chassis Interfaces
PFE – Interface
RPD – OSPF
Control
Plane
Host
Path
Data
Plane
PPM – OSPF PFE – Ukern PFE – Host PathRE – Host Path
XM – ASIC LU – ASIC PFE – System
PFE – jnh
g300019
perform manual debugging steps for each tile of the workflow sequence in order to find the root cause of
the OSPF flapping. The HealthBot RCA application, on the other hand, delivers this expert service to you
automatically as a bot. The RCA bot tracks all of the telemetry data collected by the HealthBot and translates
the information into graphical status indicators (displayed in the HealthBot web UI) that correlate to
different parts of the workflow sequence shown in Figure 2 on page 19.
Figure 2: High-level workflow to debug OSPF-flapping
19
When configuring HealthBot, each tile of the workflow sequence shown in Figure 2 on page 19 can be
defined by one or more rules. For example, the RPD-OSPF tile could be defined as two rule conditions:
one to check if "hello-transmitted" counters are incrementing and the other to check if "hello-received"
counters are incrementing. Based on these user-defined rules, HealthBot provides status indicators, alarm
notifications, and an alarm management tool through the web UI to inform and alert you of specific network
conditions that could, for example, lead to OSPF flapping. By isolating a problem area in the workflow,
HealthBot RCA proactively guides you in determining the appropriate corrective action to take to fix a
pending issue or avoid a potential one.
HealthBot Log File Analysis
The Challenge
Networking devices can generate a lot of log messages, some of these messages are arcane and others
create a lot of noise and clutter that drown out the more significant, meaningful messages. Network
operators need an easy way to sort through and organize all of these log messages, as well as make sense
of the information in order to take action, if necessary.
The HealthBot Log File Analysis Solution
Fully integrated with the HealthBot health monitoring and RCA features, HealthBot log file analysis can
be implemented with the use of log patterns and pattern sets within the syslog ingest settings. The pattern
sets can be applied to Rules to automatically filter out unnecessary log messages and help highlight only
the relevant, actionable messages. Healthbot log file analysis consists of two main components:
1. An ingest engine that lets HealthBot receive syslog messages from networks and devices.
2. Pre-defined and customizable search patterns and pattern sets that can be applied to rules.
See Syslog Ingest for more information about syslog ingest.
RELATED DOCUMENTATION
HealthBot Getting Started Guide
20
HealthBot Concepts
IN THIS SECTION
HealthBot Data Collection Methods | 21
HealthBot Topics | 22
HealthBot Rules - Basics | 23
HealthBot Rules - Deep Dive | 25
HealthBot Playbooks | 35
HealthBot is a highly programmable telemetry-based analytics application. With it, you can diagnose and
root cause network issues, detect network anomalies, predict potential network issues, and create real-time
remedies for any issues that come up.
To accomplish this, network devices and HealthBot have to be configured to send and receive large amounts
of data, respectively. Device configuration is covered throughout this and other sections of the guide.
Configuring HealthBot, or any application, to read and react to incoming telemetry data requires a language
that describes several elements that are specific to the systems and data under analysis. This type of
language is called a Domain Specific Language (DSL), i.e., a language that is specific to one domain. Any
DSL is built to help answer questions. For HealthBot, these questions are:

Q: What components make up the systems that are sending data?
•
A: Network devices are made up of memory, cpu, interfaces, protocols and so on. In HealthBot, these
are called “HealthBot Topics” on page 22.
Q: How do we gather, filter, process, and analyze all of this incoming telemetry data?
•
A: HealthBot uses “HealthBot Rules - Basics” on page 23 that consist of information blocks called sensors,
fields, variables, triggers, and more.
Q: How do we determine what to look for?
•
A: It depends on the problem you want to solve or the question you want to answer. Healthbot uses
“HealthBot Playbooks” on page 35 to create collections of specific rules and apply them to specific
groups of devices in order accomplish specific goals. For example, part of the system-kpis-playbook can
alert a user when system memory usage crosses a user-defined threshold.
This section covers these key concepts and more, which you need to understand before using HealthBot.
21
HealthBot Data Collection Methods
In order to provide visibility into the state of your network devices, HealthBot first needs to collect their
telemetry data and other status information. It does this using sensors.
HealthBot supports sensors that “push” data from the device to HealthBot and sensors that require
HealthBot to “pull” data from the device using periodic polling.
Data Collection - ’Push’ Model
As the number of objects in the network, and the metrics they generate, have grown, gathering operational
statistics for monitoring the health of a network has become an ever-increasing challenge. Traditional ’pull’
data-gathering models, like SNMP and the CLI, require additional processing to periodically poll the network
element, and can directly limit scaling.
The ’push’ model overcomes these limits by delivering data asynchronously, which eliminates polling. With
this model, the HealthBot server can make a single request to a network device to stream periodic updates.
As a result, the ’push’ model is highly scalable and can support the monitoring of thousands of objects in
a network. Junos devices support this model in the form of the Junos Telemetry Interface (JTI).
HealthBot currently supports four ‘push’ ingest types.
Native GPB
•
NetFlow
•

OpenConfig
•
Syslog
•
These push-model data collection—or ingest—methods are explained in detail in the HealthBot Data Ingest
Guide.
Data Collection - ’Pull’ Model
While the ’push’ model is the preferred approach for its efficiency and scalability, there are still cases where
the ’pull’ data collection model is appropriate. With the ’pull’ model, HealthBot requests data from network
devices at periodic intervals.
HealthBot currently supports two ‘pull’ ingest types.
iAgent (CLI/NETCONF)
•
SNMP
•
These pull-model data collection—or ingest—methods are explained in detail in the HealthBot Data Ingest
Guide.
22
HealthBot Topics
Network devices are made up of a number of components and systems from CPUs and memory to interfaces
and protocol stacks and more. In HealthBot, a topic is the construct used to address those different device
components. The Topic block is used to create name spaces that define what needs to be modeled. Each
Topic block is made up of one or more Rule blocks which, in turn, consist of the Field blocks, Function
blocks, Trigger blocks, etc. See “HealthBot Rules - Deep Dive” on page 25 for details. Each rule created
in HealthBot must be part of a topic. Juniper has curated a number of these system components into a list
of Topics such as:
chassis
•
class-of-service
•
external
•
firewall
•
interfaces
•
kernel
•
linecard
•
logical-systems
•
protocol
•
routing-options
•
security
•
service
•
system
•
You can create sub-topics underneath any of the Juniper topic names by appending .<sub-topic> to the
topic name. For example, kernel.tcpip or system.cpu.
Any pre-defined rules provided by Juniper fit within one of the Juniper topics with the exception of external,
The external topic is reserved for user-created rules. In the HealtBot web GUI, when you create a new
rule, the Topics field is automatically populated with the external topic name.
HealthBot Rules - Basics
HealthBot’s primary function is collecting and reacting to telemetry data from network devices. Defining
how to collect the data, and how to react to it, is the role of a rule.
23
HealthBot ships with a set of default rules, which can be seen on the Configuration > Rules page of the
HealthBot GUI, as well as in GitHub in the healthbot-rules repository. You can also create your own rules.
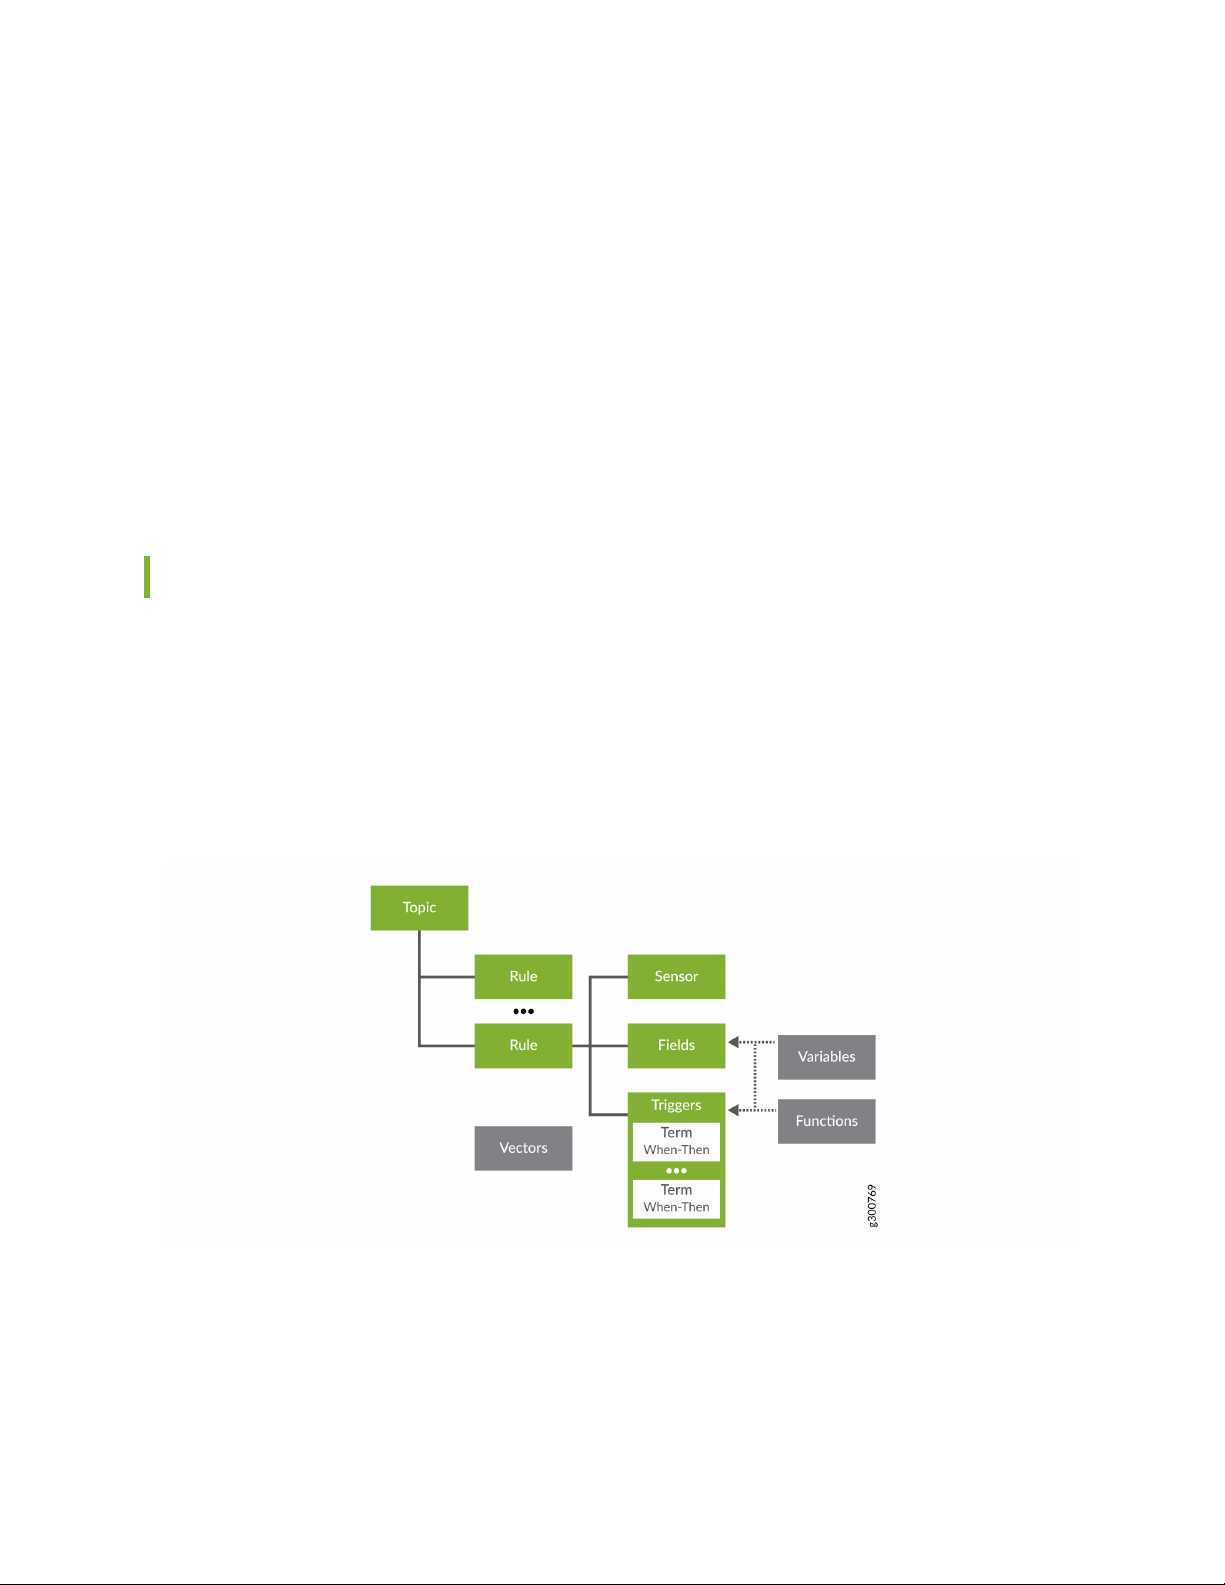
The structure of a HealthBot rule looks like this:
To keep rules organized, HealthBot organizes them into topics. Topics can be very general, like system, or
they can be more granular, like protocol.bgp. Each topic contains one or more rules.
As described above, a rule contains all the details and instructions to define how to collect and handle the
data. Each rule contains the following required elements:

The sensor defines the parameters for collecting the data. This typically includes which data collection
•
method to use (as discussed above in “HealthBot Data Collection Methods” on page 21), some guidance
on which data to ingest, and how often to push or pull the data. In any given rule, a sensor can be defined
directly within the rule or it can be referenced from another rule.
Example: Using the SNMP sensor, poll the network device every 60 seconds to collect all the device
•
data in the Juniper SNMP MIB table jnxOperatingTable.
The sensor typically ingests a large set of data, so fields provide a way to filter or manipulate that data,
•
allowing you to identify and isolate the specific pieces of information you care about. Fields can also act
as placeholder values, like a static threshold value, to help the system perform data analysis.
Example: Extract, isolate, and store the jnxOperating15MinLoadAvg (CPU 15-minute average utilization)
•
value from the SNMP table specified above in the sensor.
Triggers periodically bring together the fields with other elements to compare data and determine current
•
device status. A trigger includes one or more ’when-then’ statements, which include the parameters that
define how device status is visualized on the health pages.
Example: Every 90 seconds, check the CPU 15min average utilization value, and if it goes above a
•
defined threshold, set the device’s status to red on the device health page and display a message
showing the current value.
24
The rule can also contain the following optional elements:
Vectors allow you to leverage existing elements to avoid the need to repeatedly configure the same
•
elements across multiple rules.
Examples: A rule with a configured sensor, plus a vector to a second sensor from another rule; a rule
•
with no sensors, and vectors to fields from other rules
Variables can be used to provide additional supporting parameters needed by the required elements
•
above.
Examples: The string “ge-0/0/0”, used within a field collecting status for all interfaces, to filter the
•
data down to just the one interface; an integer, such as “80”, referenced in a field to use as a static
threshold value
Functions allow you to provide instructions (in the form of a Python script) on how to further interact
•
with data, and how to react to certain events.
Examples: A rule that monitors input and output packet counts, using a function to compare the count
•
values; a rule that monitors system storage, invoking a function to cleanup temp and log files if storage
utilization goes above a defined threshold
NOTE: Rules, on their own, don’t actually do anything. To make use of rules you need to add
them to “HealthBot Playbooks” on page 35.
HealthBot Rules - Deep Dive
IN THIS SECTION
Rules | 25
Sensors | 28
Fields | 28
Vectors | 30
Variables | 30
Functions | 31
Triggers | 31
Tagging | 34
Rule Properties | 35
25
A rule is a package of components, or blocks, needed to extract specific information from the network or
from a Junos device. Rules conform to a specifically tailored domain specific language (DSL) for analytics
applications. The DSL is designed to allow rules to capture:
The minimum set of input data that the rule needs to be able to operate
•
The minimum set of telemetry sensors that need to be configured on the device(s)
•
The fields of interest from the configured sensors
•
The reporting or polling frequency
•
The set of triggers that operate on the collected data
•
The conditions or evaluations needed for triggers to kick in
•
The actions or notifications that need to be performed when a trigger kicks in
•
The details around rules, topics and playbooks are presented in the following sections.
Rules
Rules are meant to be free of any hard coding. Think of threshold values; If a threshold is hard coded, there
is no easy way to customize it for a different customer or device that has different requirements. Therefore,
rules are defined using parameterization to set the default values. This allows the parameters to be left at
default or be customized by the operator at the time of deployment. Customization can be done at the
device group or individual device level while applying the HealthBot Playbooks on page 35 in which the
individual rules are contained.

Rules that are device-centric are called device rules. Device components such as chassis, system, linecards,
and interfaces are all addressed as HealthBot Topics on page 22 in the rule definition. Generally, device
rules make use of sensors on the devices.
Rules that span multiple devices are called network rules. Network rules:
must have a rule-frequency configured
•
must not contain sensors
•
cannot be mixed with device rules in a playbook
•
To deploy either type of rule, include the rule in a playbook and then apply the playbook to a device group
or network group.
NOTE: HealthBot comes with a set of pre-defined rules.
Not all of the blocks that make up a rule are required for every rule. Whether or not a specific block is
required in a rule definition depends on what sort of information you are trying to get to. Additionally,
some rule components are not valid for network rules. Table 3 on page 26 lists the components of a rule
and provides a brief description of each one.
26
Table 3: Rule Components
“Sensors” on
page 28
The Sensors block is like the access method for getting
at the data. There are multiple types of sensors available
in HealthBot: OpenConfig, Native GPB, iAgent, SNMP,
and syslog.
It defines what sensors need to be active on the device
in order to get to the data fields on which the triggers
eventually operate. Sensor names are referenced by the
Fields.
OpenConfig and iAgent sensors require that a frequency
be set for push interval or polling interval respectively.
SNMP sensors also require you to set a frequency.
Required in Device
Rules?What it DoesBlock
that only use a field
reference from another rule
or a vector with references
from another rule. In these
cases, rule-frequency must
be explicitly defined.
Valid for
Network
Rules?
NoNo–Rules can be created

Table 3: Rule Components (continued)
Required in Device
Rules?What it DoesBlock
27
Valid for
Network
Rules?
Fields on
page 28
“Vectors” on
page 30
“Variables” on
page 30
“Functions” on
page 31
The source for the Fields block can be a pointer to a
sensor, a reference to a field defined in another rule, a
constant, or a formula. The field can be a string, integer
or floating point. The default field type is string.
and comparing elements amongst different sets. A vector
is used to hold multiple values from one or more fields.
Invariant rule definitions are achieved through
mustache-style templating like {{<placeholder-variable>
}}. The placeholder-variable value is set in the rule by
default or can be user-defined at deployment time.
and actions by creating prototype methods in external
files written in languages like python. The functions block
includes details on the file path, method to be accessed,
and any arguments, including argument description and
whether it is mandatory.
YesYes-Fields contain the data
on which the triggers
operate. Starting in
HealthBot release 3.1.0,
regular fields and key-fields
can be added to rules based
on conditional tagging
profiles. See the “Tagging”
on page 34 section below.
YesNoThe Vectors block allows handling of lists, creating sets,
NoNoThe Variables block allows you to pass values into rules.
NoNoThe Functions block allows you to extend fields, triggers,
“Triggers” on
page 31
“Rule
Properties” on
page 35
The Triggers block operates on fields and are defined by
one or more Terms. When the conditions of a Term are
met, then the action defined in the Term is taken.
By default, triggers are evaluated every 10 seconds, unless
explicitly configured for a different frequency.
By default, all triggers defined in a rule are evaluated in
parallel.
for a HealthBot rule, such as hardware dependencies,
software dependencies, and version history.
YesYes–Triggers enable rules
to take action.
YesNoThe Rule Properties block allows you to specify metadata

Sensors
When defining a sensor, you must specify information such as sensor name, sensor type and data collection
frequency. As mentioned in Table 3 on page 26, sensors can be one of the following:
OpenConfig—For information on OpenConfig JTI sensors, see the Junos Telemetry Interface User Guide.
•
Native GPB—For information on Native GPB JTI sensors, see the Junos Telemetry Interface User Guide.
•
iAgent—The iAgent sensors use NETCONF and YAML-based PyEZ tables and views to fetch the necessary
•
data. Both structured (XML) and unstructured (VTY commands and CLI output) data are supported.
For information on Junos PyEZ, see the Junos PyEz Documentation.
SNMP—Simple Network Management Protocol.
•
syslog—system log
•
BYOI—Bring your own ingest – Allows you to define your own ingest types.
•
Flow—NetFlow traffic flow analysis protocol
•
28
sFlow—sFlow packet sampling protocol
•
When different rules have the same sensor defined, only one subscription is made per sensor. A key,
consisting of sensor-path for OpenConfig and Native GPB sensors, and the tuple of file and table for iAgent
sensors is used to identify the associated rule.
When multiple sensors with the same sensor-path key have different frequencies defined, the lowest
frequency is chosen for the sensor subscription.
Fields
There are four types of field sources, as listed in Table 3 on page 26. Table 4 on page 29 describes the
four field ingest types in more detail.

Table 4: Field Ingest Type Details
DetailsField Type
29
Sensor
Reference
Subscribing to a sensor typically provides access to multiple columns of data. For instance,
subscribing to the OpenConfig interface sensor provides access to a bunch of information including
counter related information such as:
/interfaces/counters/tx-bytes,
/interfaces/counters/rx-bytes,
/interfaces/counters/tx-packets,
/interfaces/counters/rx-packets,
/interfaces/counters/oper-state, etc.
Given the rather long names of paths in OpenConfig sensors, the Sensor definition within Fields
allows for aliasing, and filtering. For single-sensor rules, the required set of Sensors for the Fields
table are programmatically auto-imported from the raw table based on the triggers defined in
the rule.
Triggers can only operate on Fields defined within that rule. In some cases, a Field might need
to reference another Field or Trigger output defined in another Rule. This is achieved by
referencing the other field or trigger and applying additional filters. The referenced field or trigger
is treated as a stream notification to the referencing field. References aren’t supported within
the same rule.
Constant
Formula
References can also take a time-range option which picks the value, if available, from the
time-range provided. Field references must always be unambiguous, so proper attention must
be given to filtering the result to get just one value. If a reference receives multiple data points,
or values, only the latest one is used. For example, if you are referencing a the values contained
in a field over the last 3 minutes, you might end up with 6 values in that field over that time-range.
HealthBot only uses the latest value in a situation like this.
A field defined as a constant is a fixed value which cannot be altered during the course of
execution. HealthBot Constant types can be strings, integers, and doubles.
Raw sensor fields are the starting point for defining triggers. However, Triggers often work on
derived fields defined through formulas by applying mathematical transformations.
Formulas can be pre-defined or user-defined (UDF). Pre-defined formulas include: Min, Max,
Mean, Sum, Count, Rate of Change, Elapsed Time, Standard Deviation, Microburst, Dynamic
Threshold, Anomaly Detection, Outlier Detection, and Predict.
Some pre-defined formulas can operate on time ranges in order to work with historical data. If
a time range is not specified, then the formula works on current data, specified as now.

Vectors
Vectors are useful in helping to gather multiple elements into a single rule. For example, using a vector
you could gather all of the interface error fields. The syntax for Vector is:
vector <vector-name>{
path [$field-1 $field-2 .. $field-n];
filter <list of specific element(s) to filter out from vector>;
append <list of specific element(s) to be added to vector>;
}
$field-n can be field of type reference.
The fields used in defining vectors can be direct references to fields defined in other rules:
vector <vector-name>{
path [/device-group[device-group-name=<device-group>]\
/device[device-name=<device>]/topic[topic-name=<topic>]\
/rule[rule-name=<rule>]/field[<field-name>=<field-value>\
AND|OR ...]/<field-name> ...];
filter <list of specific element(s) to filter out from vector>;
append <list of specific element(s) to be added to vector>;
}
30
This syntax allows for optional filtering through the <field-name>=<field-value> portion of the construct.
Vectors can also take a time-range option that picks the values from the time-range provided. When
multiple values are returned over the given time-range, they are all selected as an array.
The following pre-defined formulas are supported on vectors:
unique @vector1–Returns the unique set of elements from vector1
•
@vector1 and @vector2–Returns the intersection of unique elements in vector1 and vector2.
•
@vector1 or @vector2–Returns the total set of unique elements in the two vectors.
•
@vector1 unless @vector2–Returns the unique set of elements in vector-1, but not in vector-2
•
Variables
Variables are defined during rule creation on the Variables page. This part of variable definition creates
the default value that gets used if no specific value is set in the device group or on the device during
 Loading...