

Page 1

Page 2

Page 3
J*AM
The Application Manager is the tool to launch Junger Audio PC based GUI applications. Such applications are
the Spectral Signature control GUI, the loudness live plot, the loudness logger, a comprehensive metering tool
etc.
Installation instructions
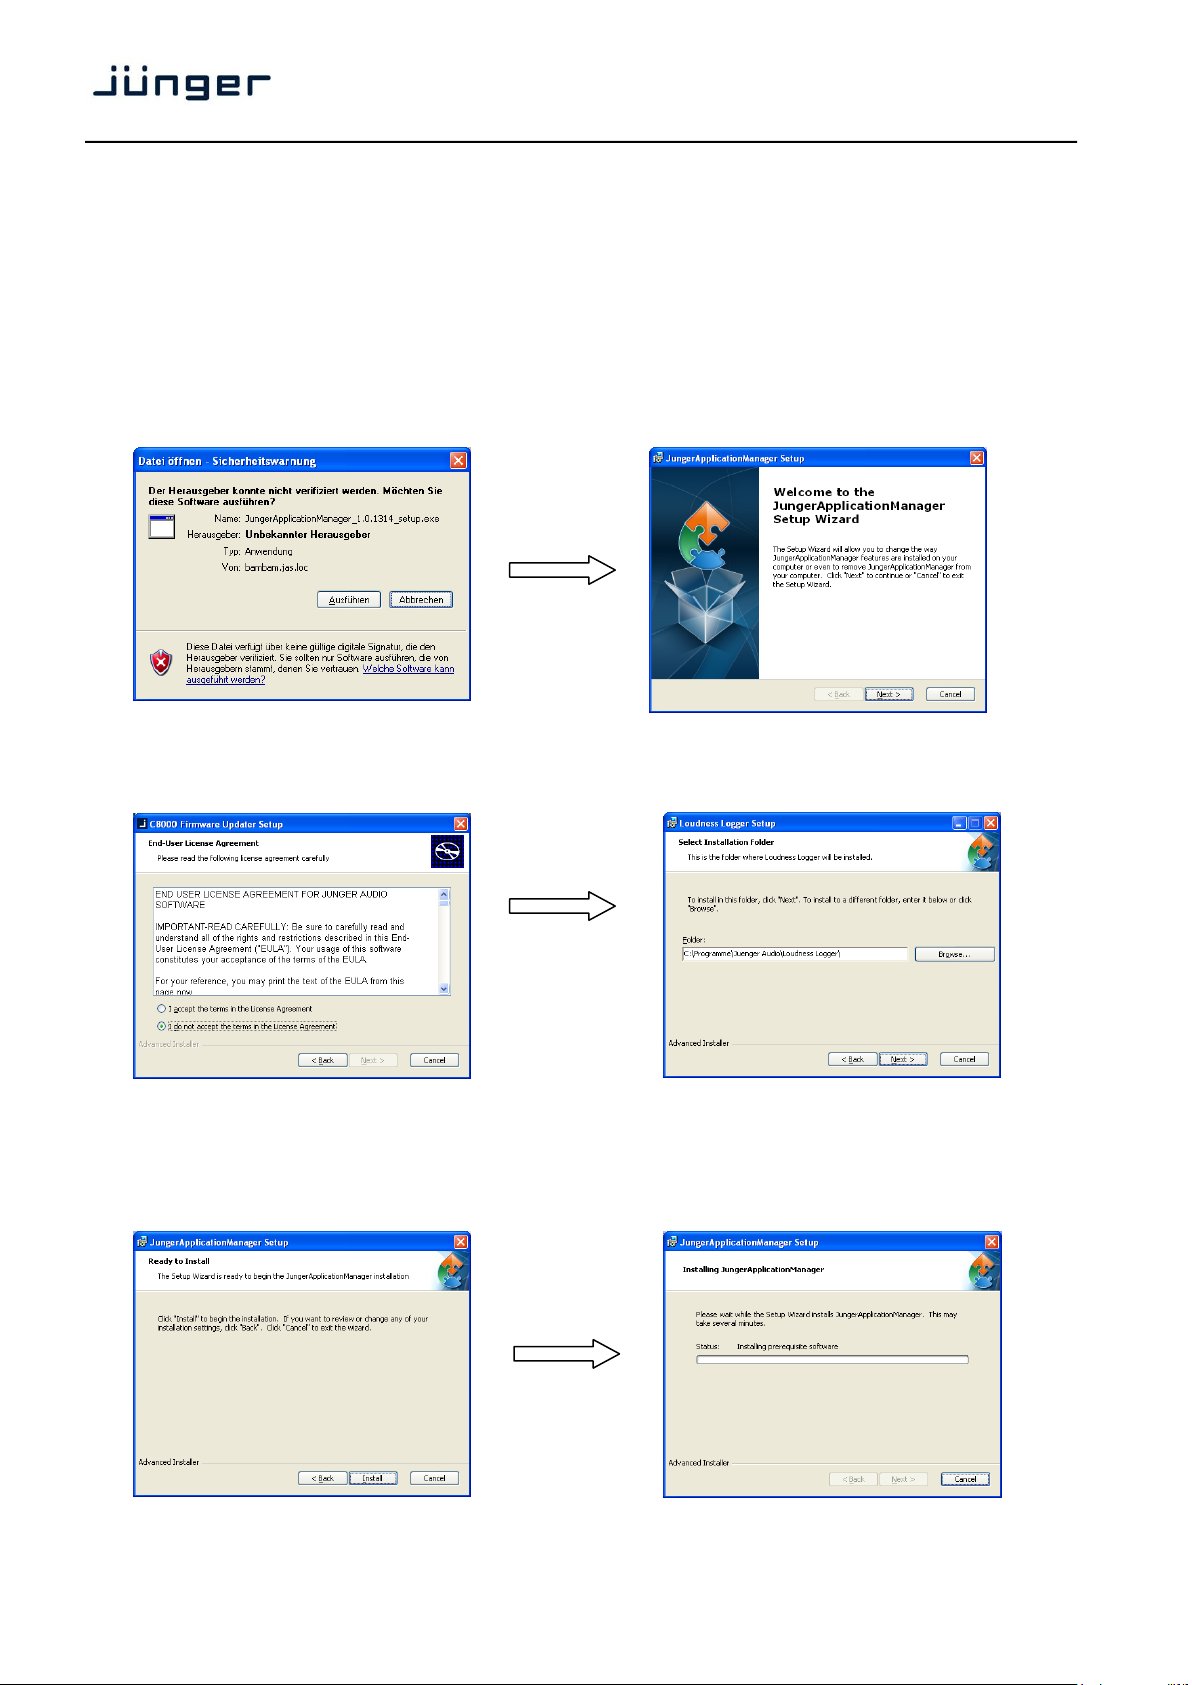
A person with administration rights for the particular PC must install it after unpacking the ZIP. When you
double click on the installer file, e.g. "JungerApplicationManger_x.y.abcd_setup.exe", you may be
warned by the operating system regarding potential security issues because it has no valid signature from
the publisher:
Click on <run> and the welcome screen will appear click on "Next >" to start the process.
As a next step the Junger Audio Now you will be asked for the installation
End User License Agreement appears: folder. You may change it or accept it.
If you accept it you can click on "Next >"
After reading the EULA you may accept it or not.
If you don't accept it you may go "< Back"
and close the update program.
Selection is made by the above radio buttons.
click on "Next >" to start the installation: you will then get a progress bar:
Click on "Install" to start the process you may also cancel the installation ….
Page 4
J*AM
1
Run the Junger Application Manager
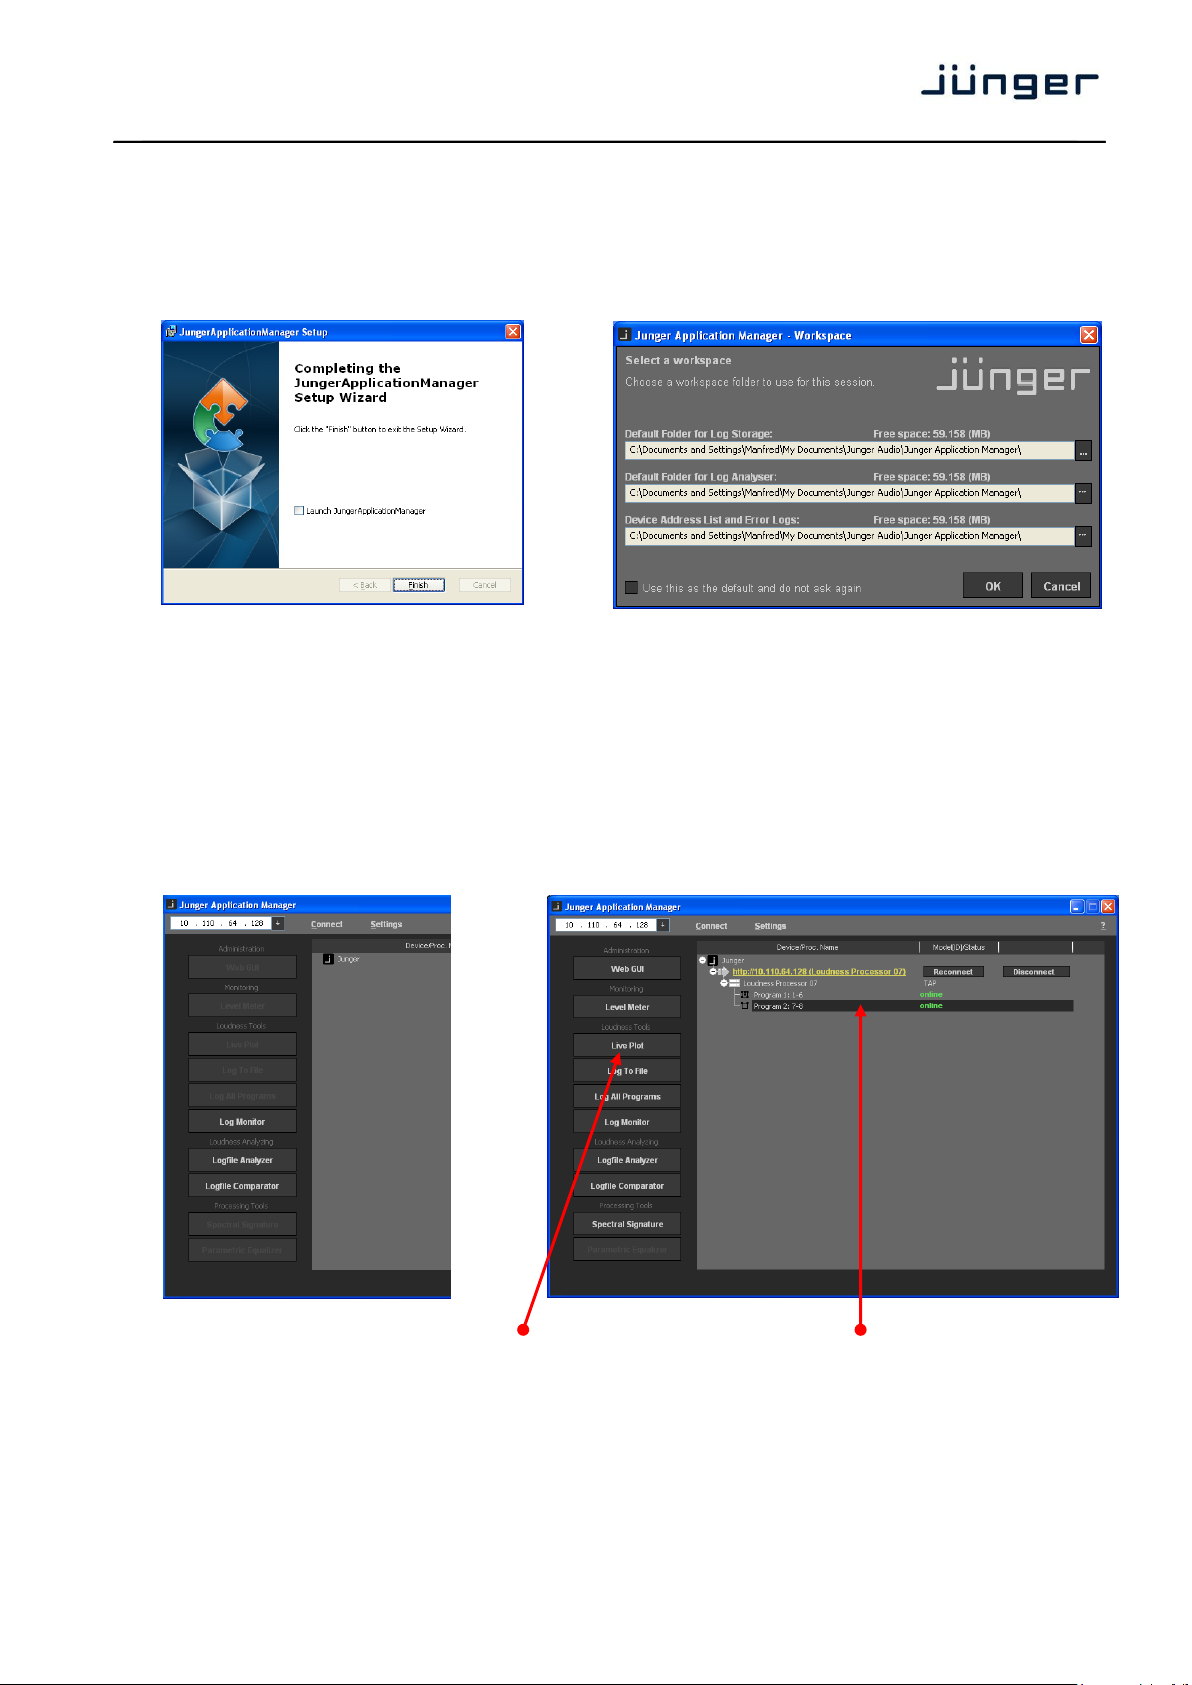
When the installation is finished you You may also start the application from the
will get a notification. You may launch it installation folder:
right away by enabling the check box start > All Programs > Junger Audio >
"Launch ApplicationManager" Junger Application Manager
Press <Finish> to end the installation. Here you may define your working directories.
Press <OK> to run Application Manager. You
can select "Use this as the default and do not
ask again".
These settings may be reached later on from
the Application Manager window.
To connect with a specific device and press <Connect>
you must enter its IP address. The IP Now a tree spans from the device IP address to
address will be stored automatically program(s) processed by that device:
in case you have to use it again:
The associated buttons will be enabled if you select (highlight) a program that is enabled
for the respective functions. Additional information is displayed in the next columns.
Important Note ! The “Loudness Tools” are an option of the J*AM which one must buy. This option is
protected by a USB dongle. If no valid dongle is plugged into the PC, the “Loudness Tools” of the J*AM
are disabled and the respective launch buttons are not highlighted. You can see this status in the "?"
menu > "About" pop up: "No License found for Loudness logging tools" will be displayed in that case.
If you insert such dongle, wait a couple of seconds for J*AM to detect your license before you continue. A
message box will inform you about the detected license.
Page 5
J*AM
2
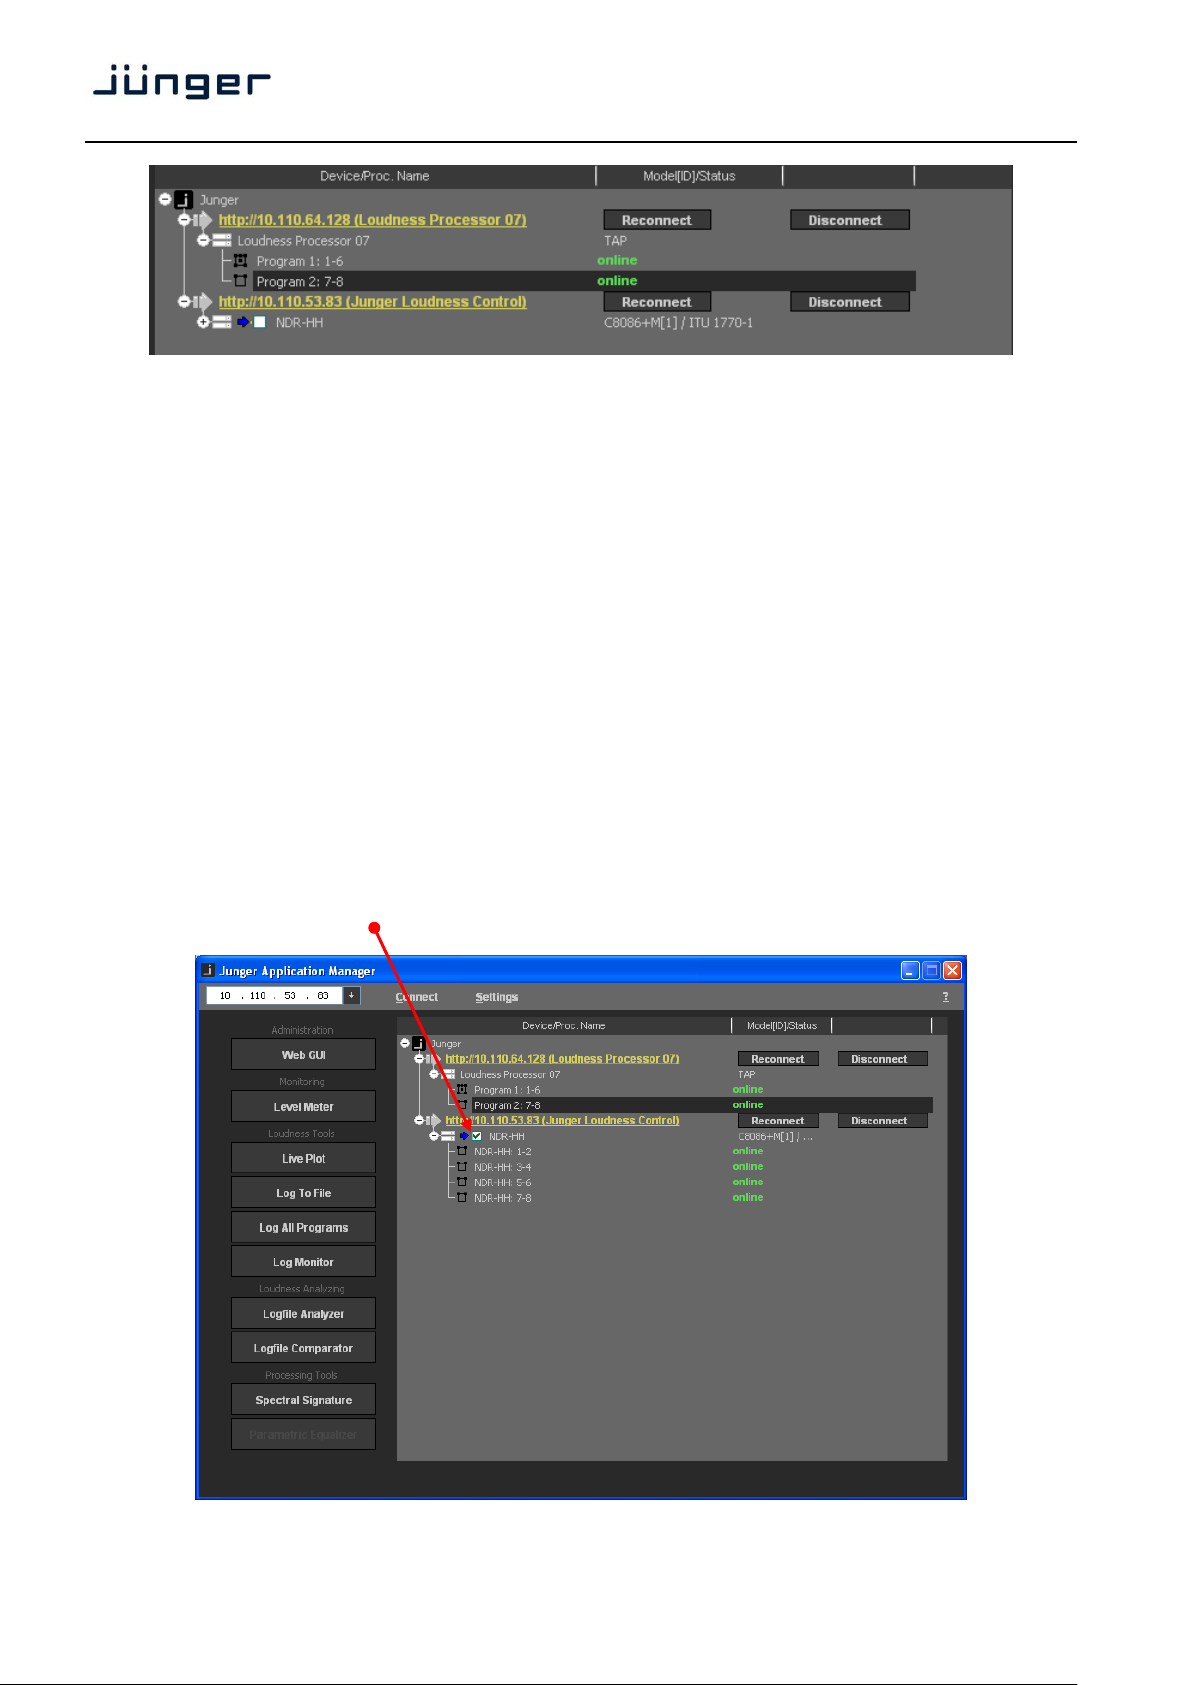
Device/Proc Name for each device you will read the URL [e.g. "http://10.110.64.128] and the
device name [e.g. "Loudness Processor 07"]. You may click on the link to
open a browser that will show the web GUI of the device.
in the case of a c8k system inline with the URL, the display shows the
frame name [e.g. "Junger Loudness Control"] and the processor name
one line below [e.g. "NDR-HH"] and further down the program names
including the channels used by that program, separated by a colon
[e.g. "Program 1:1-6"].
Model[ID]/Status the device model [e.g. "TAP"] or, in the case of a c8k system
the module type and its address [e.g. "C8086+M[1]"] can be read here.
In line with the program names you can see the status [online / offline].
Reconnect if the communication between the J*AM and the device or frame is
interrupted you may reconnect with it from here.
Disconnect you may disconnect the communication between the J*AM
and the device or frame.
For the c8k system one must keep in mind that all modules of a c8k frame communicate internally via the
CAN bus but the bandwidth of the CAN bus is limited so you can not gather an unlimited amount of
measurement data. At the moment we have limited the number of c8k processors which may be
connected with the J*AM to 2 at a time.
Below a J*AM GUI that is connected with a T*AP and a c8k frame that has one LevelMagicII™ processor
C8086+ installed. You must enable the check box beside the c8k processor in order to read measurement
data from that module:
Page 6
J*AM
3
Web GUI a link that contains the IP address of the device to launch the web
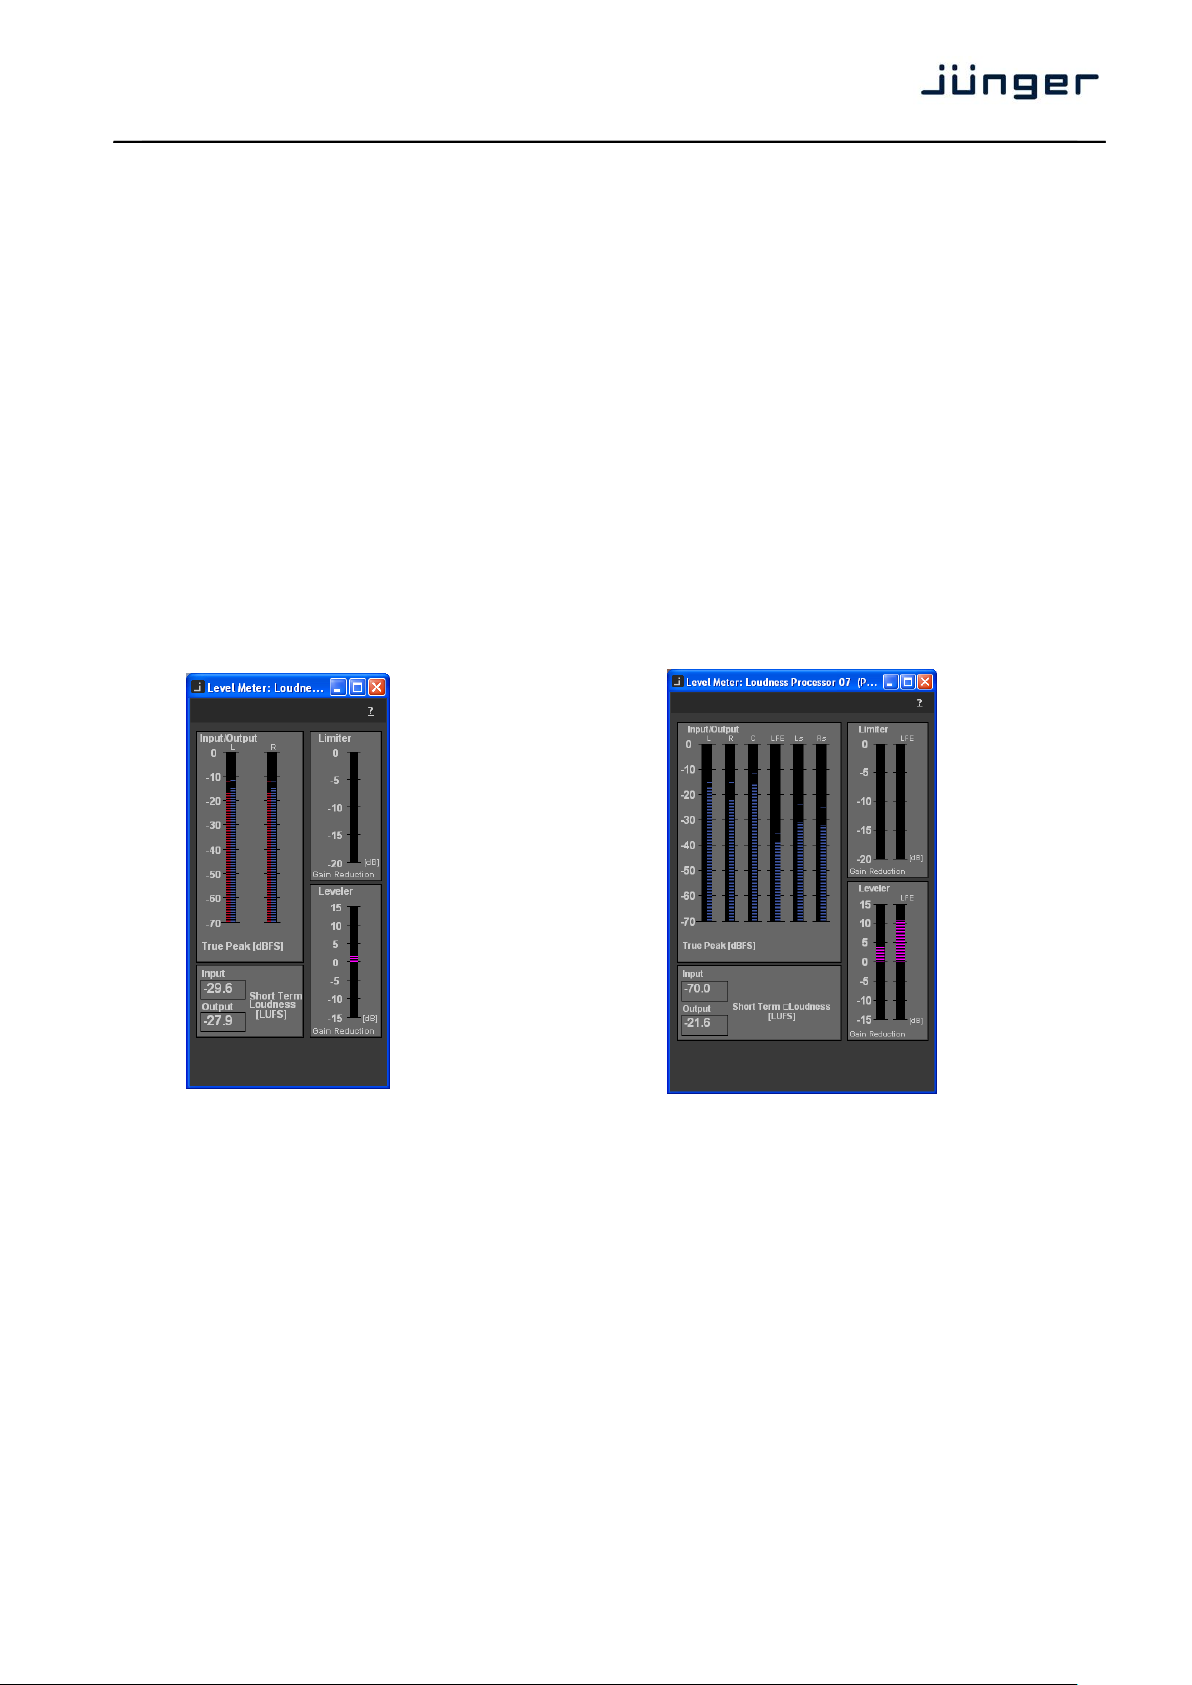
Level Meter you may launch a bar graph meter that shows metering information.
browser. You may also click on the device URL in the main window.
Live Plot this will start a live plot which shows curves over time of input/output
true peak and loudness measurement.
Log to File starts file logging. The letters turn orange and the metering data for
Log All Programs allows you to start file logging for all supported programs.
Log Monitor gives you an overview over programs which have a running log service
Logfile Analyzer recalls a log file stored on the PC and displays it as a screen plot
loudness and true peak measurement will be stored in a dedicated file
Logfile Comparator opens two independent log files stored on the PC and displays it one
above the other.
Spectral Signature starts the display and control tool for the dynamic multiband filter.
Monitoring - Level Meter
Level meter for a 2ch program: and for a surround (6 channel) program
It shows the input vs. output peak level, the limiter as well as the leveller gain reduction.
Page 7
J*AM
4
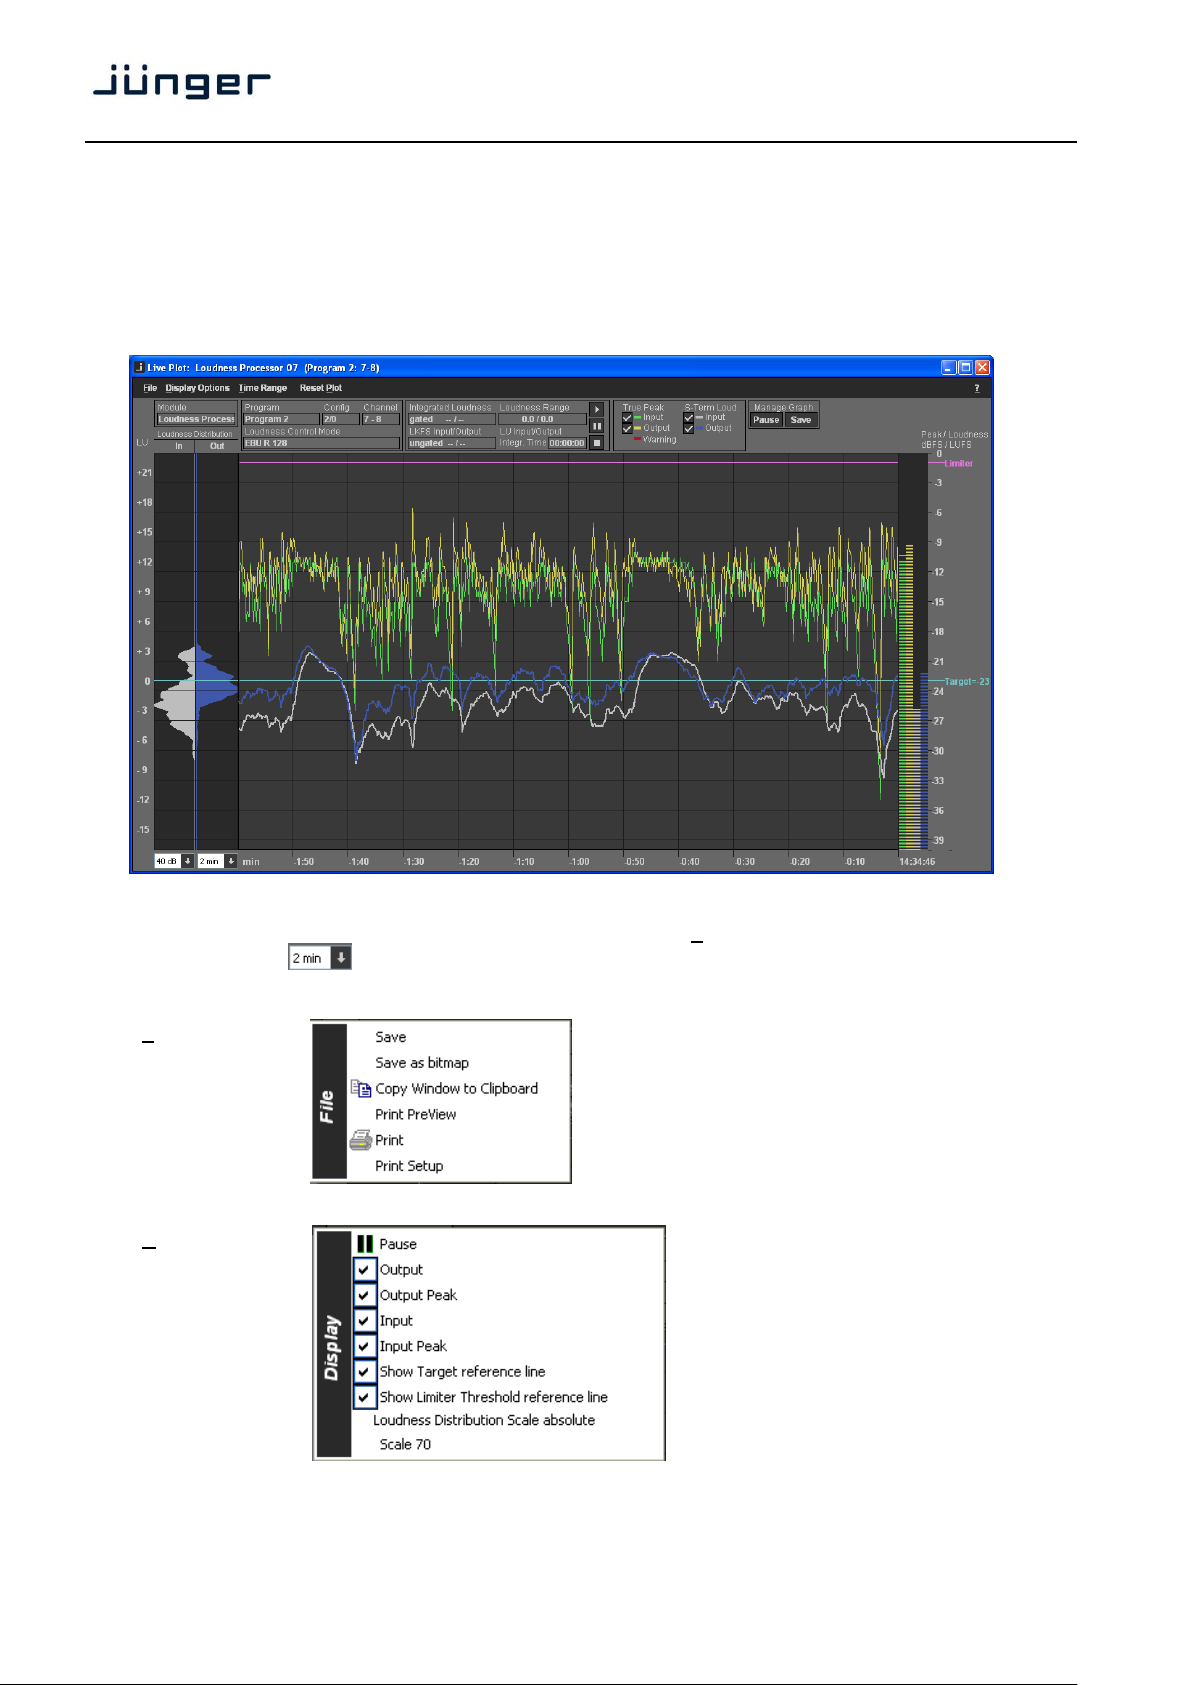
Loudness Tools - Live plot
This tool is meant for live analysis of true peak levels and short term input/output loudness of the pre
selected channel. All relevant information is given at the top of the display. On the right you get a four
column bar graph that shows the true peak values and the short term loudness. These values are
plotted along the time line. On the left hand side you get the statistical distribution of loudness input vs.
output. This unique kind of display is an easy way to see how the loudness processor performs.
The tool keeps all data gathered from the selected processing channel in the PC RAM. This allows you to
change the time scale by selecting it from the pull down menu Time Range or by the pull down box on the
bottom left side: at any time you like. The tool keeps data for 2 hours in the RAM, for both the input
and the output. After that it starts cycling the data in FIFO (first in first out) style.
File: will save the live plot measurement data into
a "*.csv" file.
Display Options: pauses the plot.
disables/enables the respective display for
the short term loudness and true peak plot
for both the input and the output displays.
disables/enables the display of the
change scale between absolute and relative
change peak/loudness scale between
respective reference line.
40 and 70dBFS/LUFS.
Page 8
J*AM
5
Reset Plot: will do what it says – you may reset the
measurement and start it again.
This will be prompted by a pop up.
? : a "Help" menu is not available yet.
The "About … " selection shows the
Junger Audio contact data, the software
version of the J*AM and presence of a valid
license for the Loudness Logging Tools.
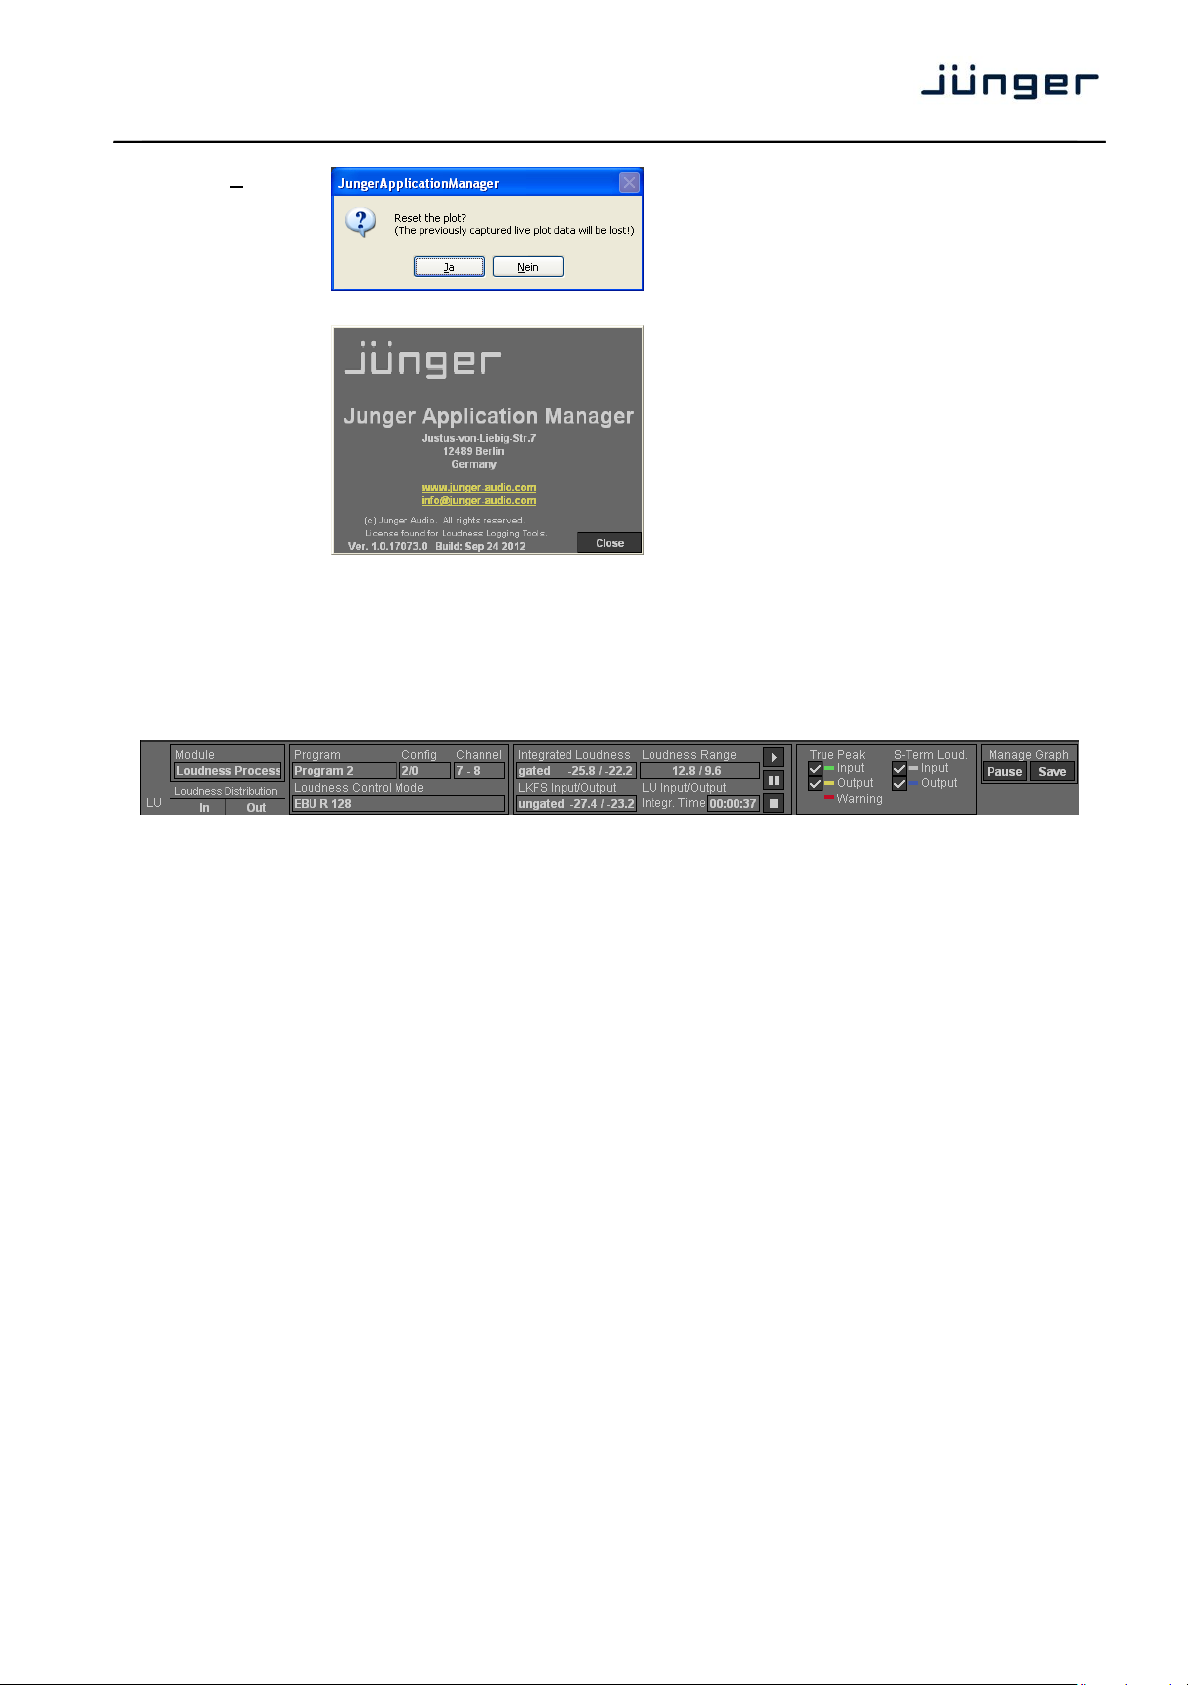
The upper area of the live plot display offers a lot of detailed information and some setups you can also
find in the Display Option menu:
Module: device (single device) or c8k module name
Loudness Distribution: shows the loudness distribution of the short term values. This allows easy
estimation of how the levelling process can manage the desired target
Program: [Program 2] name of the program that is measured by the live plot
Config: [2/0] configuration of the audio channels
compared to the source loudness distribution.
Channel: [7 – 8] audio channels of the device or module used for that
program
Loudness Control Mode: [EBU R128] display of the actual loudness control mode of the
processor. You must not be confused by the loudness
measurement methods.
Integrated Loudness gated: [-25.8 / -22.2] loudness measurement - input vs. output using
LKFS Input/Output: unit of measurement for the integrated loudness
ITU BS.1770-2 (gated)
LKFS Input/Output ungated: [-27.4 / -23.2] loudness measurement – input vs. output using
ITU BS.1770-1 (ungated)
Loudness Range: [12.8 / 9.6]
LU Input/Output: unit of measurement for loudness range
Integr. Time: integration time of the EBU R128 program loudness
measurement
Page 9

J*AM
6
manual control buttons for EBU R128 style integrated
(program) loudness measurement Start / Pause / Stop.
True Peak: enable / disable check boxes for the true peak plot and
the respective bar graph. The color dash indicates
the plot colors.
A red warning may be displayed if measurement data
exceeds an allowed range.
S-Term Loud: enable / disable check boxes for the plot and the
respective bar graph. The color dash indicates
the plot colors.
Manage Graph: you may pause the live plot display and / or save the
measurement data into a *.csv file.
Besides logging loudness values over the course of time, the major application of the tool is loudness
measurement of programs or parts of it. Following the EBU R128 standard, the Loudness Logger may
measure and display the integrated loudness as well as the loudness range.
If you place the mouse pointer into the active area of the live plot,
either in pause or in run mode, you see a vertical line.
If you now do a right click you will get such a pop up:
When you click on "Add Marker" a text input window will appear
and you may input a marker (a text) that will from now travel along
with the vertical line. Those kind of markers are inserted automatically
to signal parameter changes such as Loudness Control Mode etc.
Loudness Tool – Live Plot – mark a region of interest:
You must place the mouse inside the plot window, click the left button and drag the mouse over the region
of interest. When you release the button, the region will be highlighted and a small option pop up opens:
It gives you the choice to add the selected measurement to an integrated
loudness measurement or you may reset the previous integrated
measurement or add a marker.
Page 10

J*AM
7
Loudness Tool – Live Plot – display of measurement values:
As explained in the previous paragraphs, the values of an integrated loudness measurement will be
displayed in the upper area of the plot. In the bottom of the plot you see a horizontal line that represents the
selected time frame for the measurement. If you select multiple time frames or if you pause and continue
the integrated measurement manually, multiple horizontal lines will be displayed to show the areas which
contribute to the overall result.
Loudness Tools – Log To File / Log All Programs
For each program detected by the J*AM you may start an independent log file. You can select the folder
where such file will be stored from the Settings menu. The file is a comma separated (*.csv) file.
You may also log all programs of a device or a c8k module which have the status "online" by pressing
<Log All Programs> after highlighting the respective device or module.
Loudness Tools – Log Monitor
The log monitor window simply shows the individual programs of devices and/or c8k modules which are
currently logged to file.
Page 11

J*AM
8
Loudness Analyzing – Logfile Analyzer
When you press the <Logfile Analyzer> button a file dialog opens up. It directs you to the defined folder
for logging files. Here you may select a file that you can analyze offline :
If you select a file and press <Open> the log analyzer loads that file and opens the graphic display:
This is the display of the whole log file that has been started at 01:00:05 and stopped at 10:20:05.
From the drop down box in the top area of the window you may also display the input measurement:
Page 12

J*AM
9
You can now mark an area of interest and zoom into it to get a better resolution for your measurement :
Click into the graph, hold the left mouse button, drag it over the area of interest and release it. This will
highlight the area. Now move the cursor into it and click to get the option pop up. Select "Zoom In" and
the graph window shows that area. In the overview area at the top you see a magnifier
that indicates the zoom area:
The cursor (if placed into the graph display) shows the respective time stamp from the log file. It also
shows information about current parameter changes such as Loudness Control Mode.
You may repeat the zoom function until the displayed zoom level meets your requirement.
Now you can mark the area where you want to measure the program loudness.
Mark the area and press the right mouse button to get the option display and select
"Add To Integration" :
Page 13

J*AM
10
This will display the integrated loudness and the loudness range as well as the integration time:
At the very bottom of that window you see a soft slider.
This allows you to move the graph forwards and backwards while the magnifier
gives you an indication about where you are while the horizontal line to the left of the magnifier
still shows the area of integrated measurement.
Loudness Analyzing - Logfile Comparator
If you press that button a popup asks you to select two files for comparison. You may either select two
different files or you may use the same file for comparison between input and output :
Page 14

J*AM
11
The Display Options menu offers features to ease navigation for log file comparison :
Both displays have individual controls to move the graphs.
You may link the controls from the top window to the bottom one.
You may link the controls from the bottom window to the top window.
You may unlink the controls.
Changes the level scale from 40dB to 70dB and vice versa.
Processing Tools – Spectral Signature
Module the name of the device [e.g. Levelprocessor 07]
Program the name of the respective program [e.g. Program 2]
Config the channel configuration of that program [e.g. 2/0]
Channel processing channels employed by that program [7 – 8]
Linking the link mode of the processing channels for that program [stereo]
- overwrites device settings Channel selects individual processing channels depending on the link mode
[L, R, L/R]
- overwrites device settings Enable enables / disables the Spectral Signature for the selected channel
- overwrites device settings –
Page 15

J*AM
12
Speed [Slow, Mid, Fast]
Gate [-10, -12, -15, -20dB. OFF]
Max Gain [0 … 12dB]
Response [Soft, Mid, Hard]
Maximum Loudness Boost [0 … 12dB]
Manage Signatures
Load from a file
Record will capture a mask
(press twice to stop recording)
Save to a file
Legend of the curve colors
Input spectral distribution of the input signal
Gain momentary gain applied by the application
Signature the reference curve
Absolute Gate processing threshold for each filter. You must press and hold
the <Ctrl> button of the PC keyboard to display the thresholds.
By use of the mouse wheel you may change it.
You may disable certain processing bands from the process by means of the check boxes :
Important note! A signature and the related parameters of the application will be stored as a preset inside
your Audio Processor. I.e. you may recall preconfigured Spectral Signature settings directly from your
Audio Processor by recalling presets without the need to run the PC application :
See your Audio Processor‟s manual for preset operation.
Page 16

J*AM
13
Settings dialog
To open the settings dialog please click on the “Settings” button in the menu bar in the main window.
Settings – Folders
This dialog provides settings for locations where to store loudness log files, log analyzer files as well as a
error log for J*AM itself and a list of recent used ip addresses.
Settings – Communication
The dialog for communication settings allows making decisions about UDP ports to use and gives a
shortcut to your firewall settings. Make sure to allow J*AM using the desired UDP ports.
Settings – Windows
To make changes to the behavior of J*AM‟s application windows use the Windows settings. There you
may tell J*AM always to stay in the top layer of you desktop or to reset stored window positions.
Page 17

J*AM
14
Settings – Logging
In logging setting, the follow option can be made:
To prevent your hard drive being entirely filled up with logging data, the amount of free disk space left
unassigned for other applications can be defined
The life period of logging data can be defined as well. Each log file has been recorded with a time stamp.
Log files, which are older than the current life period will be deleted automatically on next program start.
Settings – Automation
Selecting the checkbox “Apply the following…” the J*AM application starts up with a predefined setting,
which devices and their programs will be logged automatically. The desired device and program will be
defined selecting “Apply current configuration).
Page 18

J*AM
15
Operating Mode /
Program Configuration
When this Parameter is changed, typically the number of programs is
changing. If this happens J*AM continues logging active programs based
on their index. That means, if „Program 2‟ is being logged while the
Operating Mode / Program Configuration is changed, J*AM keeps logging
this program in the same file despite the fact that the channel indices of this
program may have changed.
Also J*AM is always logging „All Programs‟ once you told it to do so.
After changes on Program Configuration or Operating Mode J*AM will close
application windows of obsolete programs, e.g. when changing from 4x2 to
5.1+2 mode J*AM would close the Level Meter window for Program 4, if it is
open.
Program name, device
names module names
If supported by your device, changes on these parameters will be visible in
the tree view and application windows.
Loudness Control Mode
For all devices the current Loudness Control Mode will be displayed in the
application windows.
For information about the used xml file format, please have a look to section Getting J*AM’s status
programmatically below.
Notes on parameter changes while logging loudness data
J*AM is able to handle changes of all available device parameters. In the following an overview about the
supported parameters and J*AM behavior on their changes is given.
J*AM automatically adds a marker to your program-based log file signaling changes for each parameter.
When analyzing a log file of a program or device whose parameter has been changed, J*AM Analyzer will
show, depending on the time-based mouse cursor position, the parameters changes made in contrast to
the time of the log start.
Getting J*AM’s status programmatically
In order to retrieve J*AM‟s status information such as connection or logging state programmatically you may
parse the XMLfile
%userprofile%\documents\Junger Audio\Junger Application Manager\configuration_backup.xml
The structure of this file is given by the following XML schema definition. This definition can be also found in the
directory next to you installation folder (next to your JungerApplicationManager.exe). Please see the comments
in the XML schema definition for further information.
<xsd:schema xmlns:xsd="http://www.w3.org/2001/XMLSchema">
<xsd:annotation>
<xsd:documentation xml:lang="en">
J*AM configuration schema
</xsd:documentation>
</xsd:annotation>
<!-- Main node -->
<xsd:element name="jam-configuration" type="JamConfiguration"/>
<xsd:complexType name="JamConfiguration">
<xsd:sequence>
<!-- The only node allowed within the main node: "device". Occurence is not limited -->
<xsd:element name="device" type="Device" maxOccurs="unbounded"/>
</xsd:sequence>
<!-- configuration version is mandatory and should be "1" -->
<xsd:attribute name="configuration-version" type="xsd:positiveInteger" use="required"/>
</xsd:complexType>
<!-- A device means a C8000 frame or an *AP device (such as M*AP, T*AP, D*AP,V*AP) -->
<xsd:complexType name="Device">
<xsd:sequence>
<!-- A device has an arbitrary number of modules. *AP devices have only one module at this
time. -->
Page 19

J*AM
16
<xsd:element name="module" type="Module" maxOccurs="unbounded"/>
</xsd:sequence>
<!-- The following attribute signals whether J*AM got a working TCP/HTTP connection to the device.
This should not be set by the user -->
<xsd:attribute name="is-http-connected" type="xsd:boolean"/>
<!-- It's mandatory to give an IP address -->
<xsd:attribute name="ip-address" type="xsd:string" use="required"/>
</xsd:complexType>
<!-- Modules mean to be C8000 cards such as C8086 or C8491. Please note: For *AP devices there always
only one module with the ID "1". -->
<xsd:complexType name="Module">
<xsd:sequence>
<!-- Modules contain an arbitrary number of programs -->
<xsd:element name="program" type="Program" maxOccurs="unbounded"/>
</xsd:sequence>
<!-- This attribute signals the state of the GUI button labelled "Log All Programs". If this
attribute is "true" J*AM is writing log files for all programs of the current module
Please note, you need a license for J*AM's Loudness Tools to use this feature -->
<xsd:attribute name="is-all-logging" type="xsd:boolean"/>
<!-- The following attribute signals the state of the incoming meter stream from the device. If it's
"false" there are some issues with the connection to the device -->
<xsd:attribute name="is-metering-active" type="xsd:boolean"/>
<!-- The following attribute signals whether the user requested a meter subscription for the module.
Since J*AM subscribes metering for *AP device per default, this is mainly interesting for users of the
C8000 system where this flag is representing the state of the check box in the device tree -->
<xsd:attribute name="is-metering-requested" type="xsd:boolean"/>
<!-- For C8000: The following attribute represents the CAN ID as you set it on the modules board or
as you see them in the fame controller's web GUI.
For *AP : The following attribute must be set to "1" always -->
<xsd:attribute name="id" type="xsd:string"/>
</xsd:complexType>
<!-- Programs represent the 'leaves' of the device tree -->
<xsd:complexType name="Program">
<!-- The following attribute signals if a Meter Window is opened for the current program -->
<xsd:attribute name="has-meter-window" type="xsd:boolean"/>
<!-- The following attribute signals if a Liveplot Window is opened for the current program
Please note, you need a license for J*AM's Loudness Tools to use this feature -->
<xsd:attribute name="has-liveplot-window" type="xsd:boolean"/>
<!-- The following attribute signals if a Liveplot Window is opened for the current program -->
<xsd:attribute name="has-spectral-signature-window" type="xsd:boolean"/>
<!-- The following attribute signals if J*AM is writing a logfile for the current program -->
<xsd:attribute name="is-logging" type="xsd:boolean"/>
<!-- The following attribute contains the 1-based 'program index' as you can see it in the device
tree -->
<xsd:attribute name="index" type="xsd:positiveInteger"/>
</xsd:complexType>
</xsd:schema>
Example
An example of the backup file is given below. In this example J*AM has two devices connected devices: A T*AP
with the IP address 10.110.64.209 and a C8000 frame with the IP address 10.110.59.99. In the device nodes
you can see the HTTP connection state as an attribute.
In case of C8000 frames each device node has module nodes representing module cards identified by their CAN
ID. For *AP (such as T*AP, D*AP, M*AP) devices there is always only one module with the ID „1‟. In the module
node the attribute „is-metering-active‟ signals if J*AM is receiving logging data from the device.
The program nodes show if a certain program is being logged. Programs are indexed as they occur in J*AM
device tree.
<?xml version="1.0" encoding="ISO-8859-1"?>
<jam-configuration configuration-version="1">
<device ip-address="10.110.64.209" is-http-connected="true">
<module id="1" is-metering-requested="true" is-metering-active="true" is-all-
logging="false">
<program index="1" is-logging="true" has-meter-window="true"/>
<program index="2" is-logging="false" has-meter-window="true"/>
<program index="3" is-logging="false"/><program index="4" is-logging="false"/>
</module>
</device>
<device ip-address="10.110.59.99" is-http-connected="true">
Page 20

J*AM
17
<module id="4" is-metering-requested="true" is-metering-active="true" is-all-
logging="false">
<program index="1" is-logging="true"/>
<program index="2" is-logging="true"/>
<program index="3" is-logging="false"/>
<program index="4" is-logging="false"/>
</module>
<module id="D" is-metering-requested="true" is-metering-active="true" is-all-
logging="true">
<program index="1" is-logging="true"/>
<program index="2" is-logging="true"/>
<program index="3" is-logging="false"/>
<program index="4" is-logging="false"/>
<program index="5" is-logging="true"/>
<program index="6" is-logging="true"/>
<program index="7" is-logging="true"/>
<program index="8" is-logging="true"/>
</module>
</device>
</jam-configuration>
Page 21

J*AM
18
Controlling J*AM via Event Actions from the device
Using J*AM 2.6.7 and higher it is possible to control file logging, loudness Integration and log file markers by
events triggered by the device. This allows you to take automatically control over the core functions in J*AM
This feature is currently only supported by V*AP devices with firmeware1.0.x and higher.
The image below shows three functions which may be controlled remotely by the device:
1. Loudness logging: “Start” / “Stop” (red highlighting)
2. Integrated Loudness: “Start” / “Pause” / “Reset” (blue highlighting)
3. Liveplot/Logfile Markers: “Add Marker” (yellow highlighting)
How to configure the device to control J*AM functions
In order to control any J*AM function by the device first you need to create a new “Parameter Event”. Therefor
please navigate to the EVENTS menu in the devices web GUI. Choose from the sub menu “Events” and select
the tab “Parameter Events”.
On this page you may create a new empty event by clicking the button labeled “create event”. After entering a
new name for your event please choose “Empty” from the settings dropdown box and click OK. See image
below.
Page 22

J*AM
19
Once you created your new Parameter Event you need to add the desired parameter by clicking “add parameter”
and select the category/subcategory as in the image below.
Page 23

J*AM
20
Parameter Name
Expression / Command
Description
J*AM Marker - Program
Free text
You may submit arbitrary textual
content as a marker to your
Liveplot/Logfile
J*AM Logging - Program
Log To New File
Start/Restart file logging
Stop Logging
Stop file logging
J*AM Integration - Program
Integration Start
Start integration of loudness
Integration Pause
Pause integration of loudness
Integration Reset
Reset integration of loudness
The column labeled Parameter provides three parameters which may be changed. See the table below for all
parameters and possible expressions.
As an example the image below shows a parameter setting a new Marker labeled “My new marker text”.
Page 24

J*AM
21
In order to apply this parameters value you need to trigger its Parameter Event. For this reason you need to
switch to the tab EVENTS > Actions > Event Actions and add a new Action by pressing “add action”:
After entering a name for your action please click “ok”.
The new Action will appear in the action table. To apply your Parameter Event to the new action just choose it
from the dropdown box in the column Parameter Events. This will result in a view as in the following image:
Page 25

J*AM
22
You may test your new parameter action by pressing the “force” button. This would now add the new marker to
J*AM‟s Liveplot:
Instead of manually triggering this action by pressing the “force” button you may automate a trigger for this
action. Please see your V*AP devices manual for further information.
Important notes
Although not all combinations are tested, one may use our USB loudness licensing dongle within
virtualized operation systems
Recommended hardware for machines J*AM is running on: Intel AtomN330 1.6GHz, 2GB RAM, 250GB
HDD, Nvidia ION, Win 7
J*AM requires approximately 65 megabyte per day for each logged program
The EBU integration in J*AM and your Junger devices WebGUI work independently
Page 26

•
•
•
 Loading...