

Page 1

VLA Compact Line Array (VLA-C) Calculator
V1.1.2
INTRODUCTION
Welcome to the JBL VLA Compact (VLA-C) Line Array Calculator. We hope you will find it to be a useful
simulation software tool that will enable you to obtain even higher levels of performance from your VLA
Compact loudspeaker system.
Installing VLA Compact Calculator
Before installing the VLA-C Calculator, uninstall all previous versions using the Windows
to Add/Remove programs. After un-installing older versions, unzip the VLA-C Calculator distribution file
and then run the “setup.exe” program. Your computer will need to have the latest version of Microsoft
.NET 4 (the installer will download this automatically if your computer requires an update). JBL’s VLA-C
Calculator requires a PC with Windows XP or newer. Recommended screen resolution is 1024 x 768
(minimum).
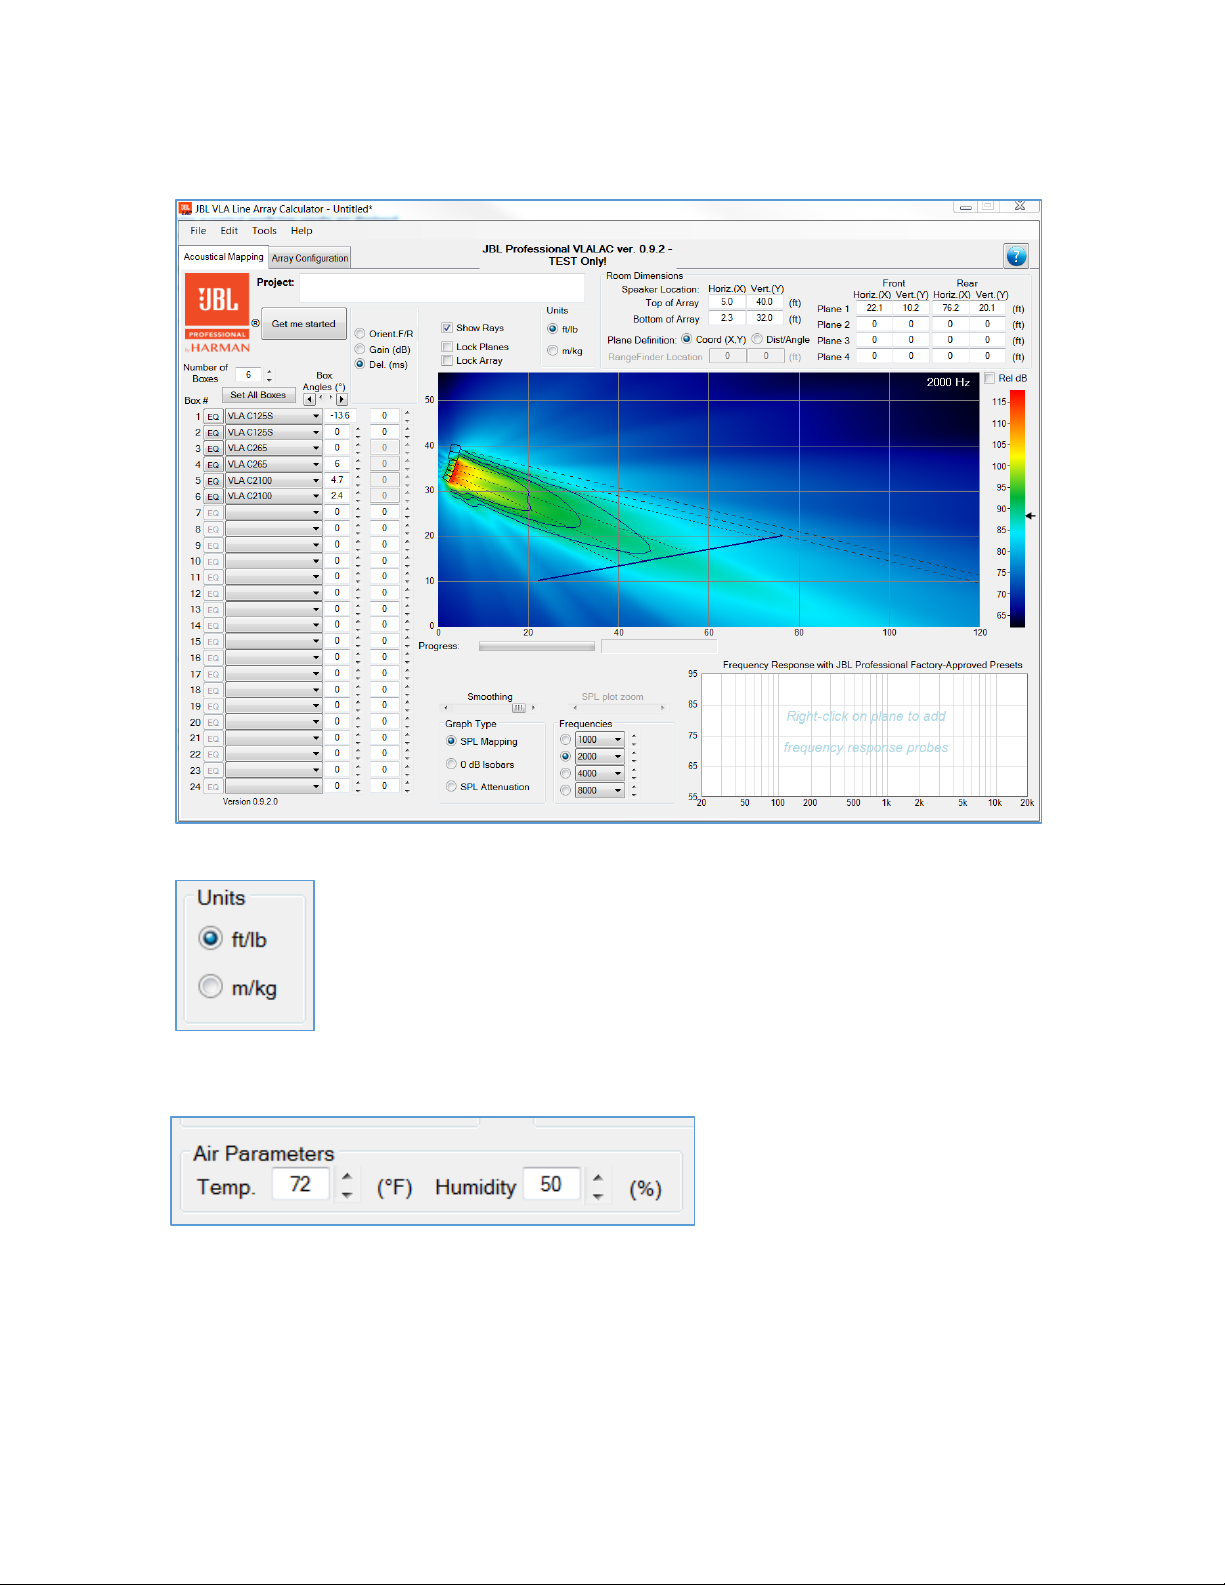
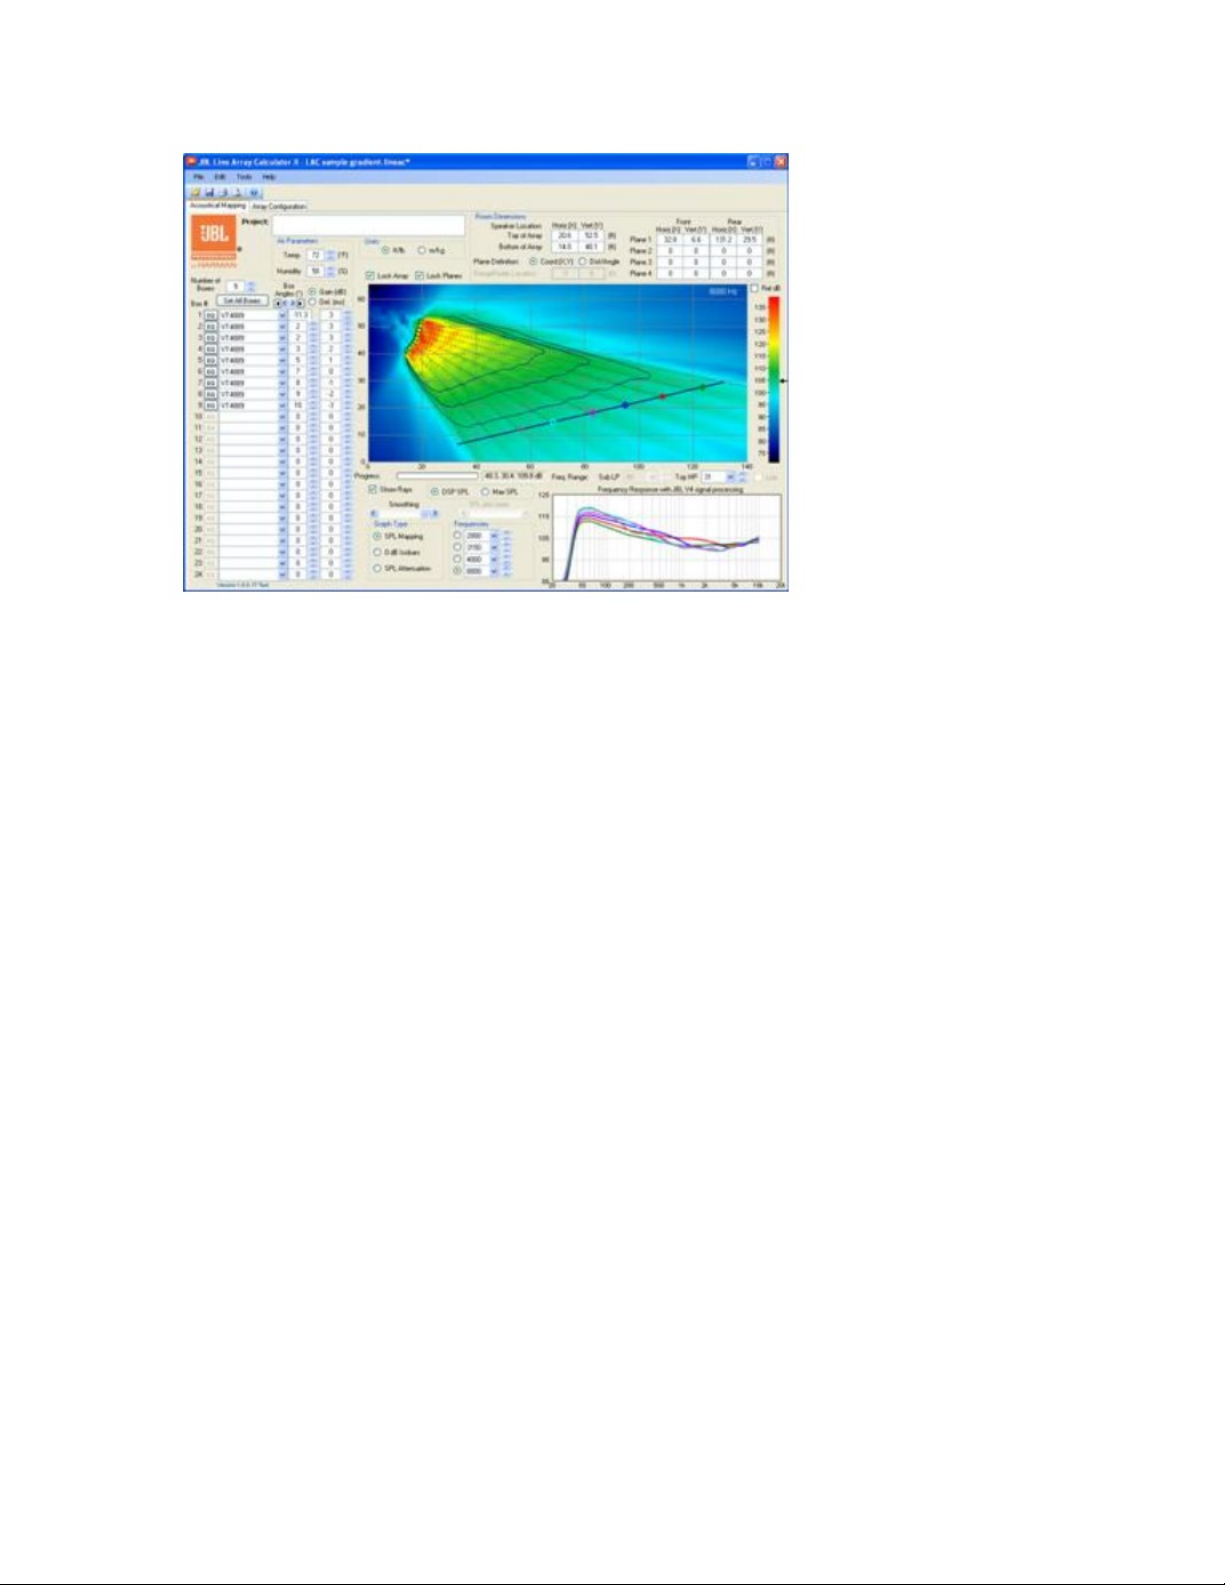
ACOUSTICAL MAPPING TAB
The Acoustical Mapping tab allows for definition of the following parameters:
• Units (metric or imperial)
• Air absorption parameters (temperature and humidity) under “Options”
• Room dimensions in XY coordinates (X = distance, Y=elevation) or distance/angle
• Array location and elevation
• Number of enclosures
• Enclosure type
• Inter-enclosure angles
• Array site angle
• Enclosure: gain, delay, EQ (graphic or parametric, plus whether front or rear facing for VLA-
C125S subwoofers)
The following acoustical prediction results are displayed:
• SPL Mapping (selectable individual frequencies from 20 Hz – 10 kHz)
• 0 dB Isobars (up to 4 frequencies simultaneously)
• SPL Attenuation (up to 4 frequencies simultaneously)
• Frequency response (up to 6 probe locations)
®
Control Panel
Page 2
Parameter definition and acoustical predictions are discussed in more detail in the following.
Units:
Selected the desired units by clicking on either ft/lb or m/kg. Values are updated accordingly.
Air Parameters (through the “Options” tab):
Enter the desired Temperature (°F or °C) and % Humidity. The VLA-C Calculator calculates atmospheric
attenuation based on ISO 9613-1.
Page 3
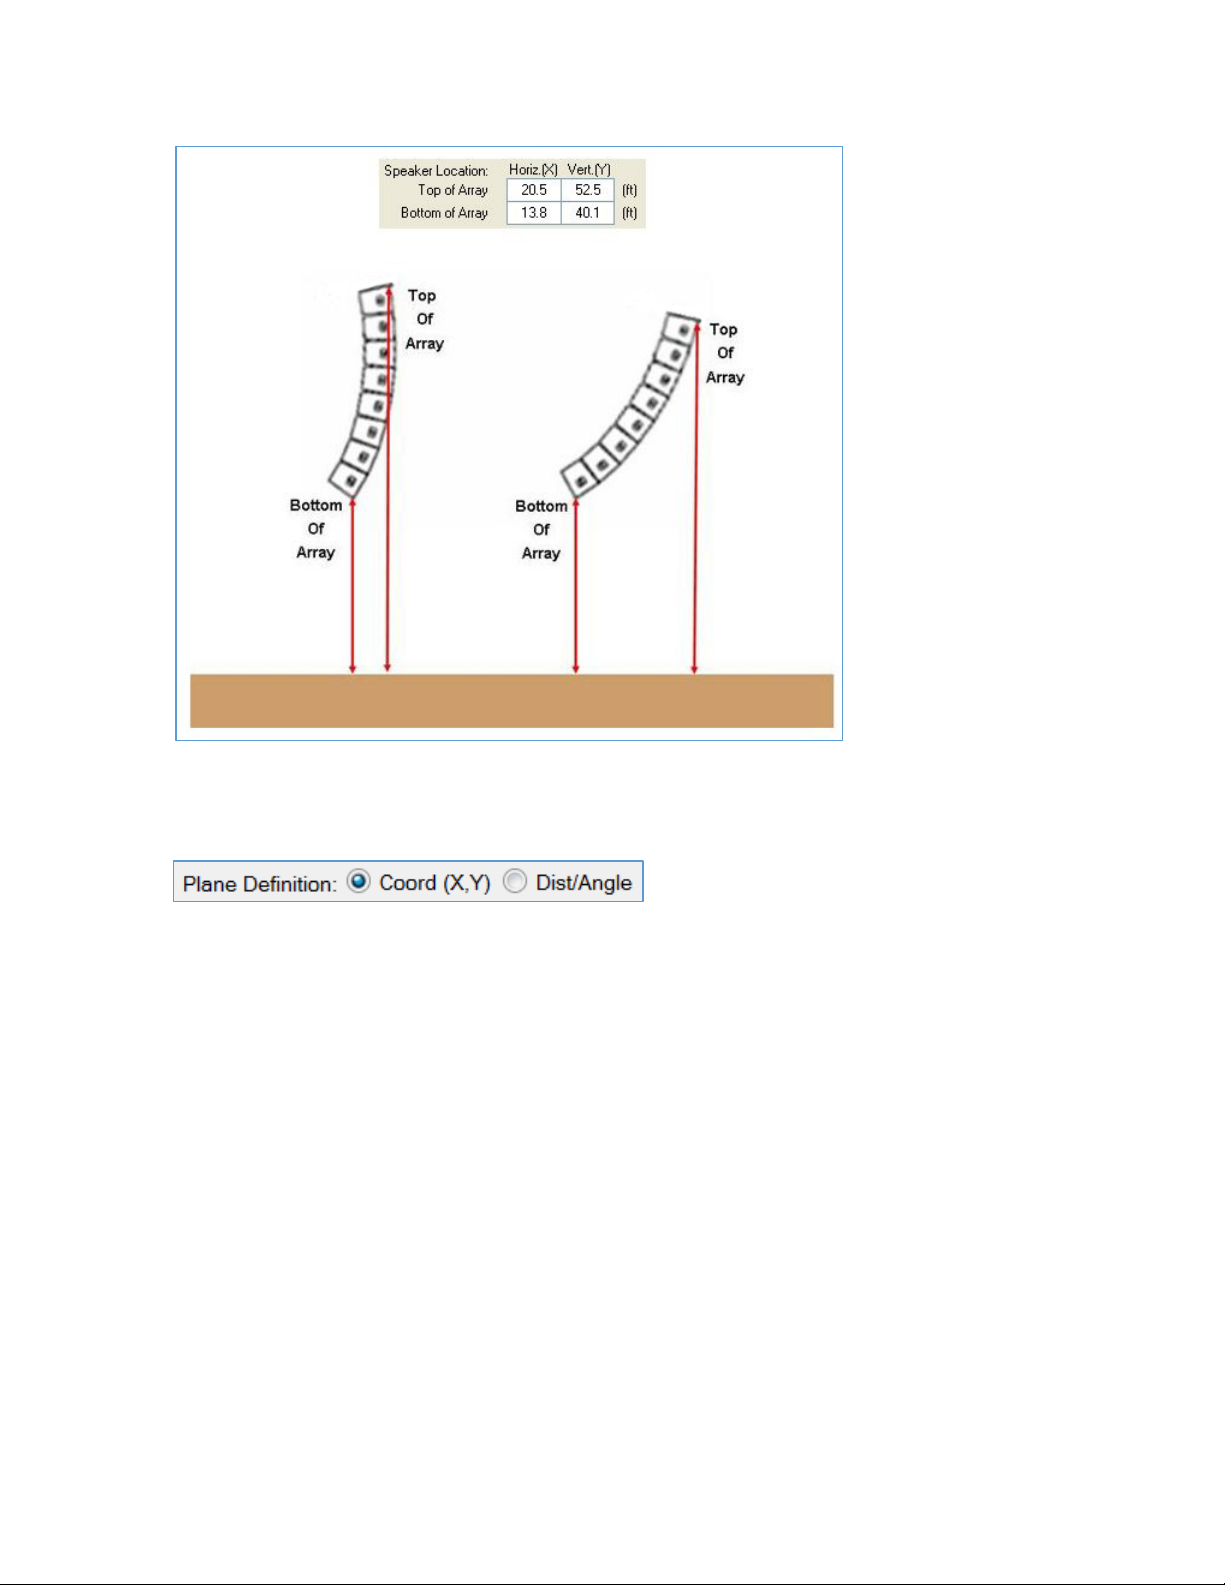
DEFINING THE AUDIENCE PLANES
Select “Coord (X,Y) or “Dist/Angle” to toggle between plane definition modes.
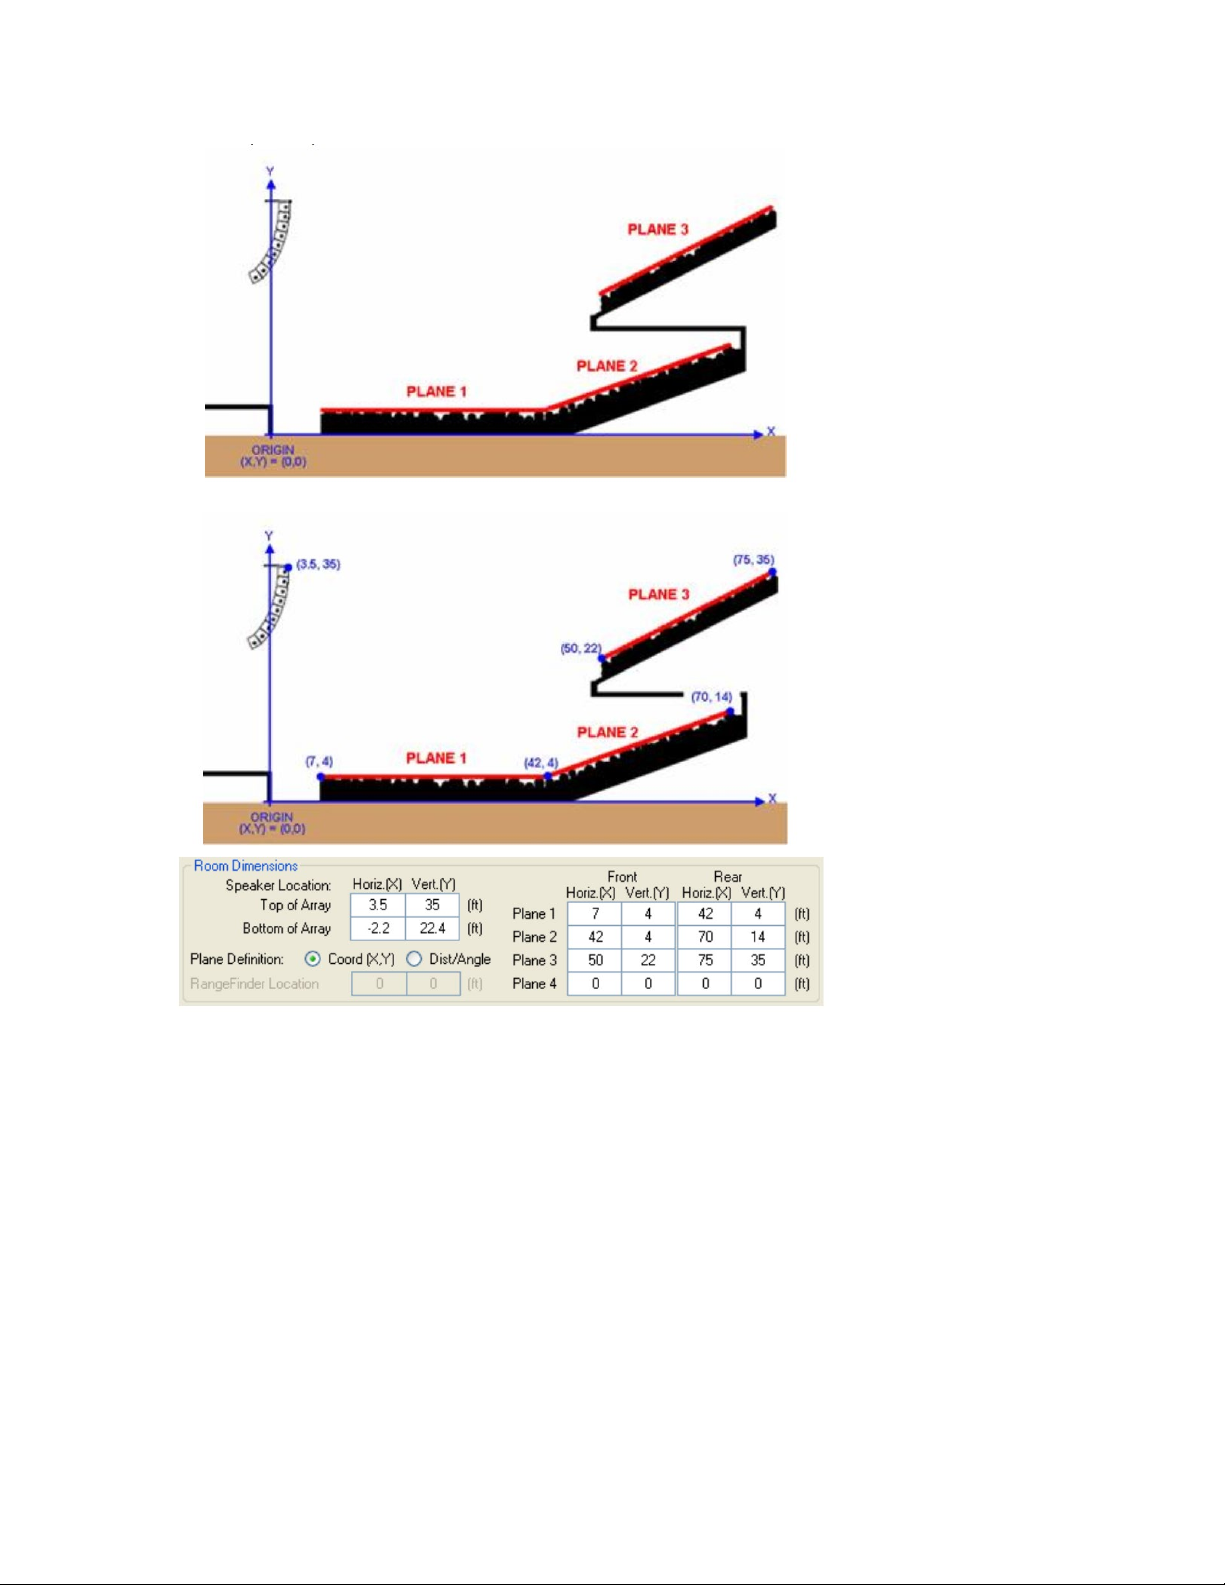
Coord (X,Y) Mode:
Audience listening planes can be entered graphically (see: Graphical Adjustment of Planes) or manually
in the “Room Dimensions” cells in terms of XY coordinates (X = distance/range, Y = elevation/height). In
the example below, the origin is set at the intersection between floor level (Y=0) and the downstage
edge (X=0). Always take into account the audience listening level (ear height) when defining audience
planes. For seated audiences, ear level is 4 ft (1.2 m) and for standing audiences approx 6 ft (1.8 m).
Page 4
Distance/Angle Mode:
Planes can be entered in terms of distance and angle, allowing measurements to be taken on-sight with
a laser rangefinder and inclinometer. The rangefinder/inclinometer location should first be defined in
terms of XY coordinates (a yellow cursor is displayed in the Acoustical Mapping window to show its
location). For the example below, the rangefinder/inclinometer is tripod-mounted on the stage with XY
coordinates = (0,6). It is also possible to left-click, drag-and-drop to move the rangefinder location in the
Acoustical Mapping plot window, as desired.
Distance Measurement:
Page 5

Angle Measurement:
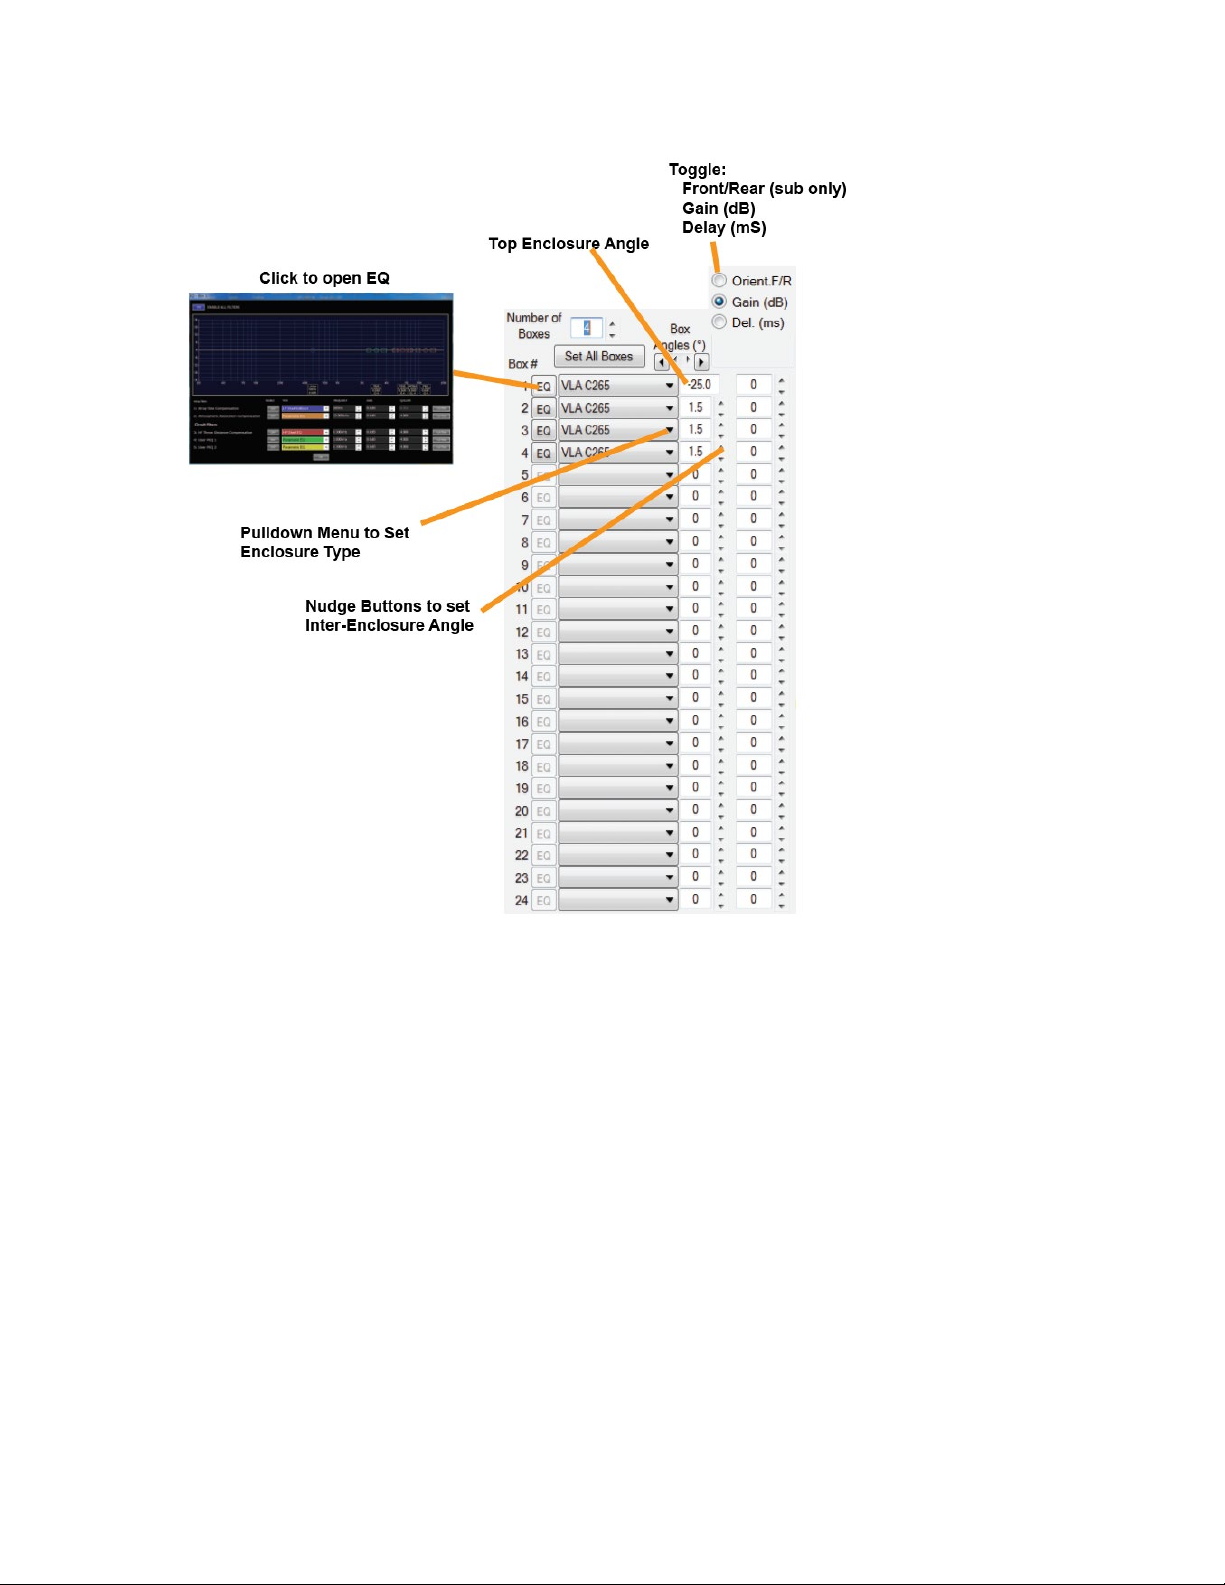
DEFINING ARRAYS
Arrays can be defined on either Acoustical Mapping or Array Configuration pages. Up to 24 enclosures*
can be defined along with enclosure: type, EQ, gain, delay; array sight angle (equivalent to Box #1
angle); and inter-enclosure angles (adjustment via nudge buttons).
By default, four VLA-C265 enclosures are loaded with 1.5 degree inter-enclosure angles:
Page 6
* Exact suspension limits depend on enclosure type(s), array size, array shape, overall array orientation and the
selected array frame attachment configuration. Always refer to warning indications on the Array Configuration
page. Overhead suspension of loudspeaker systems should be undertaken only by trained and qualified personnel.
JBL Professional is not responsible for the use, misuse or misapplication of these products.
SELECTING INTER-ENCLOSURE ANGLES
Once the vertical section of the audience profile has been defined, the goal in selecting the number of
enclosures and angles between enclosures is to ensure that the audience is covered from front to rear
of the defined audience profile with equal spacing between enclosure site angle impacts (rays) over the
audience profile. Note: for long throw applications, reduced enclosure impact spacing may be desirable
for the upper enclosures of the array. Once coverage and enclosure site angle spacing is correct, further
optimization can be performed by applying circuit level gain shading and frequency tapering
(equalization on a circuit basis using shelving eq filters available in the JBL Line Array Control Panel
through the EQ button).
The “Get Me Started” feature implemented provides a useful starting point for further manual
optimization. Provided that a sufficient number of enclosures is specified to cover the audience from
Page 7

front to rear, the Get Me Started feature will determine inter-enclosure angles that provide equal site
angle impact spacing:
BEFORE “GET ME STARTED”
AFTER “GET ME STARTED”
Gain can be adjusted in 0.5 dB steps and delay in 0.022 millisecond (ms) increments. Note: Delay
adjustment is recommended for Electronic Delay Steering (EDS) of subwoofer arrays only -- Delays are
pre-defined and linked for VLA-C265 and VLA-C2100 enclosures.
FILTER EQ
The frequency response of a line array is determined by many factors including the array size (number of
boxes), array curvature, and the listening distance. JBL factory presets were designed to create an
appropriate tonal balance starting point for the array conditions described above. Since the number of
Page 8
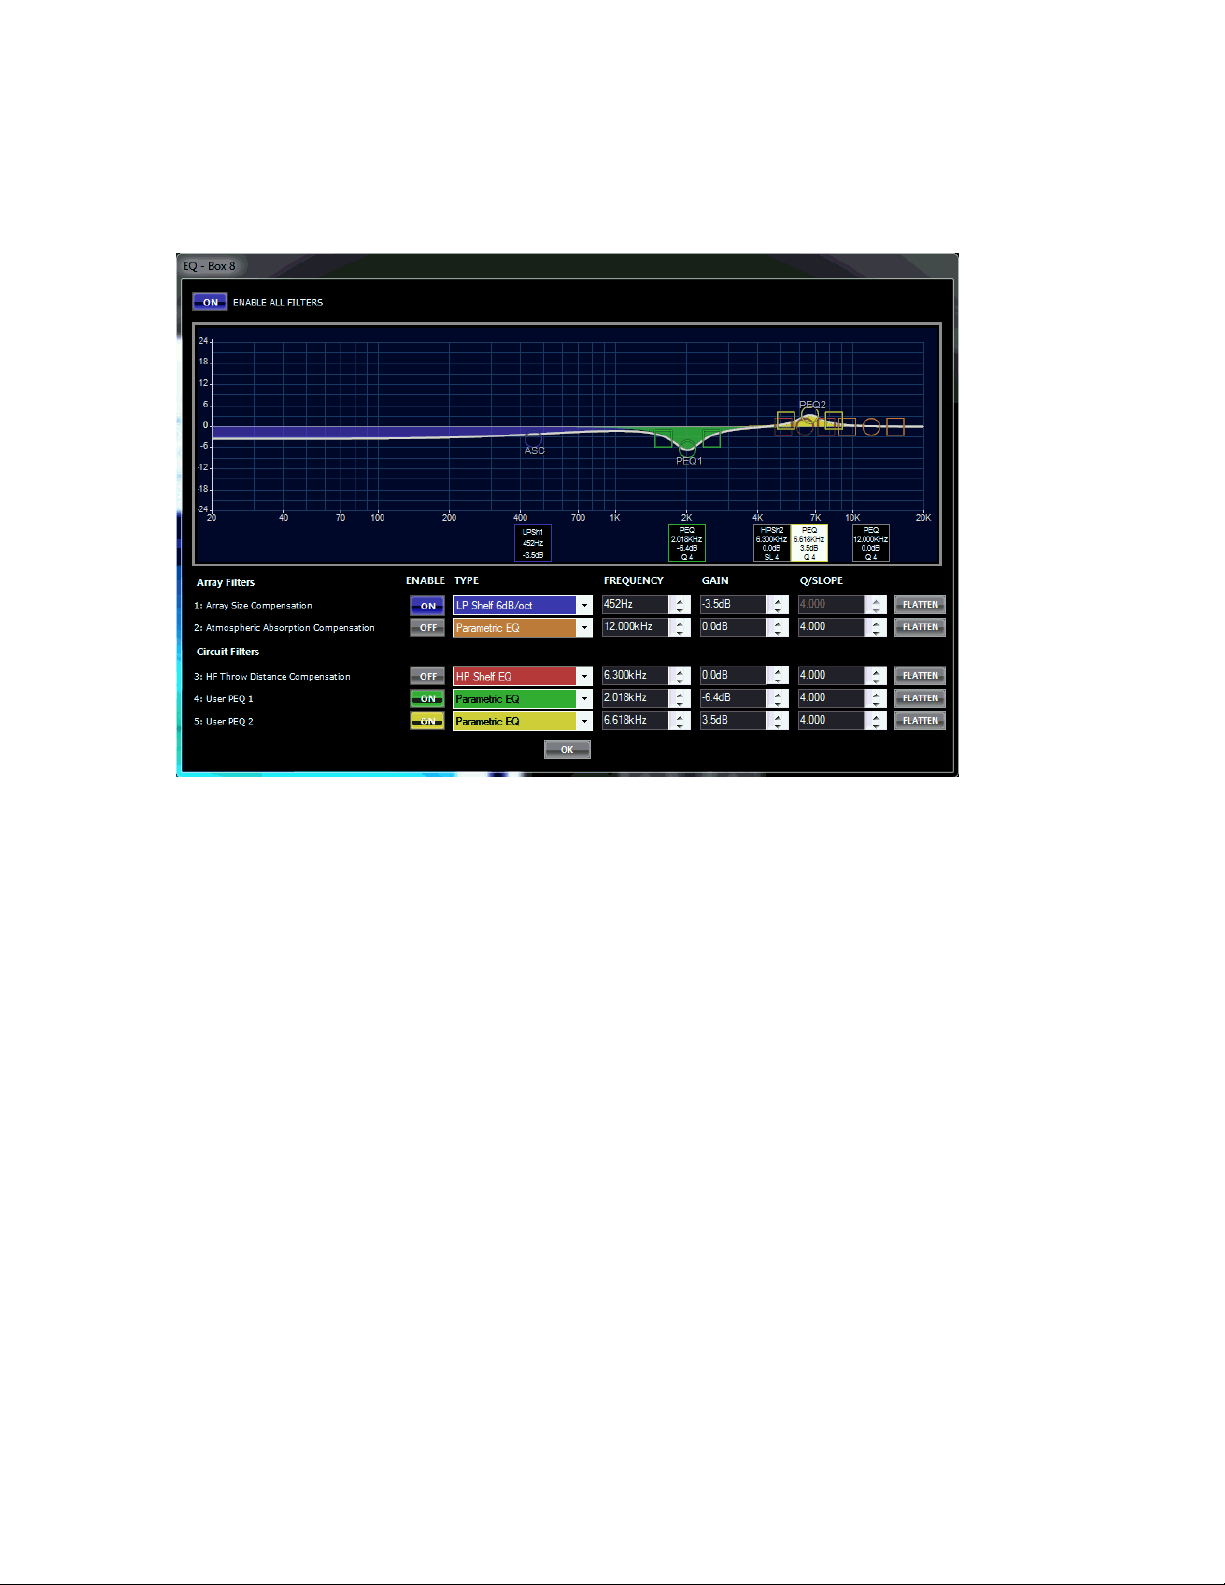
presets that can be created by a manufacturer is not infinite, user adjustment of certain DSP parameters
is necessary to create the desired tonal balance for a given array and application. This EQ was designed
to help system engineers quickly and easily manipulate the tonal balance of an array.
This EQ consists of 5 adjustable DSP filters, each with a specific intended purpose. Some of these filters are
grouped across the entire array (global adjustments), some filters are circuit group specific, and some filters have
frequency centers and Q values that are linked but have adjustable circuit gain. Below is a description of how these
filters work:
Array Size Compensation: Filter 1 is intended for correcting LF/MF build up created by an array that is longer than
the intended preset. LF adjustments should be applied to all cabinets within the array, therefore filter 1 is a global
filter (affecting all enclosures in the array).
Atmospheric Absorption Compensation: Filter 2 is intended to compensate for atmospheric conditions due to
large variations in temperature and humidity that can have an impact on the overall HF energy. This filter is applied
globally (to all the enclosures in the array) and can be used to quickly brighten or darken an array. It can also be
used for artistic preference reasons to adjust overall system tonal balance.
HF Throw Distance Compensation: Filter 3 along with Gain shading is intended to correct for distance offsets
between different sections of an array. The Type, Frequency and Q are linked across the entire array but the gain is
adjustable per circuit (ie, per enclosure individual or set of enclosures that are on the same amplifier channel). This
filter can be used to reduce HF energy close to an array and increase HF energy to areas further away where air
absorption has a bigger impact.
User PEQ 1 & 2: Filters 4 and 5 are User PEQs that can be applied to individual circuit groups (ie, per enclosure
individual or set of enclosures that are on the same amplifier channel). Frequency centers and Q are not linked
across circuits and, for this reason, it is recommended that User PEQ 1 & 2 are used for frequencies above 1kHz
with moderate gain changes only.
Page 9

SUBWOOFER MODELING
Cardioid Subwoofer Systems
A cardioid subwoofer system is where one of the subwoofers (typically one out every three enclosures)
is reversed to face toward the rear to cancel out some of the subwoofer sound projecting in toward the
rear of the array. Some adjustments need to made to the setting of the rear-facing subwoofer in order
to make it work properly. To simulate reverse cardioid (gradient) subwoofer arrays, additional polarity
and orientation parameters are available in the LVA-C Calculator. When a subwoofer’s orientation is
reversed to rear-firing, polarity is automatically inverted and the appropriate delay and EQ are applied
to the rear-firing enclosure. Since rear-firing cardioid delays (as implemented in cardioid preset output
processing blocks) are included in the LAC II simulation, default delay values are displayed as 0.0 msec.
Selecting VLA-C125S versus VLA-C125-LF
Whether the VLA-C125S subwoofers are going to act as subwoofers or as low-frequency loudspeakers is
selected via the Preset box located below the main graphic display. This corresponds with the VLAC125S-LF and VLA-C125S sub DSP settings you select in the amplifier DSP setting presets. The VLAC125S-LF setting raises up the low-pass crossover frequency to allow the subwoofers to extend higher in
frequency.
DEFINING MIXED ARRAYS
Mixed arrays can be created by selecting the desired enclosure types from the pulldown menu on either
Acoustical Mapping or Array Configuration pages.
GRAPHICAL ADJUSTMENT OF PLANES AND ARRAYS
Adding and Deleting Audience Listening Planes
Planes can be added by “right clicking” on an area of the window that does not correspond to a
loudspeaker array. A context menu will appear, allowing a plane to be added. The seating plane will
appear approximately where the right click occurred, closest to the nearest existing plane.
Page 10

After a seating plane is added, left-click, drag-and-drop in the center of the plane to move it around or
left-click, drag-and-drop the ends to adjust the plane (see the following section for further details).
To delete a plane, hover the cursor over the plane until it highlights red, then right-click and a context
menu will appear allowing the plane to be removed:
Locking Audience Planes and Array Location
Moving and Adjusting Seating Planes
If “Lock Planes” is not selected:
When the cursor is hovered over either end of an audience plane, a circular cursor will appear and it is
possible to left-click, drag-and-drop that end of the seating plane to resize it. When the cursor is
hovered over the middle of an audience plane, a circular cursor will appear and it is possible to left-click,
drag-and-drop the entire plane. If the seating plane is dragged or resized so that it is outside of the
“display window”, the graphics display will automatically rescale.
Page 11

Moving and Aiming the Speaker Array
If “Lock Array” is not selected:
When the cursor is hovered over the top front corner of the top enclosure of the array, a circular cursor
will appear and it is possible to left-click, drag-and-drop the entire array in the window:
Page 12

When the cursor is hovered over the bottom front corner of the bottom enclosure of the array, the
overall aiming angle or sight angle for the entire array can be changed via left-click, drag-and-drop. The
entire array will pivot about the top front corner of the top box as the bottom front corner is draggedand-dropped.
If the speaker cluster is dragged or rotated to the left of the “zero” horizontal coordinate, the graphics
window will automatically rescale.
Alternatively, it is possible to left-click, drag and drop on enclosure site angle reference lines (rays) to
select angles between enclosures. Selecting the ray for the top enclosure adjusts the overall site angle of
the entire array:
Top enclosure ray selected / highlighted: allows for array site angle adjustment (drag and drop)
Page 13

Enclosure ray selected / highlighted: allows for inter-enclosure angle adjustment (drag and drop)
SPL MAPPING VIEW
The rated sensitivity and electrical power handling and gain selections are used to determine the
maximum peak SPL for the frequency of interest, providing an indication as to available system
headroom.
Isobar lines display constant SPL contours at the selected frequency and are shown in dark blue for 0 /
+3 / +6 dB (default values). Isobars provide a convenient way to visualize relative attenuation and
pressure gradients between the loudspeaker array and defined audience listening planes. Scale of the
Isobars can be changed to: 0 / +2 / +4 dB or 0 / +1 / +2 dB from the “Tools → Options” menu. Isobar
smoothing can be adjusting using the horizontal “Smoothing” slider located below the graphics window.
Left-click on the SPL Mapping view to display the SPL and the XY coordinate at the selected location.
Selecting the “Rel dB” check box to the right of the display window will normalize the SPL mapping so
that 0 dB is the loudest location on all seating planes.
Page 14
Modifying Factors for SPL
• The SPL shown in the Frequency Response chart is based on the full rated power input to each
cabinet as specified on the model’s specification sheet, as modified by whatever gain reduction
you’ve got selected in the “Gain (dB)” selection boxes.
• The SPL shown is exclusive of power compression from the transducers. Power compression
occurs when heat from high drive levels causes the impedance of the driver’s voice coils to
increase, thereby reducing power draw from the supplied amplifier voltage. Power compression
varies with time duration and duty cycle of the program material. Such dynamic factors are not
shown in steady-state modeling software and is not reflected in the indicated SPL figures. The
VLA-C model’s NDD (Neodymium Differential Drive ™) transducers tend to dissipate heat better
than traditional transducers, so power compression tends to be lower, however as with all
loudspeakers, power compression can increase with drive level and time duration and can
reduce the overall maximum SPL of the system compared to what is shown.
• The SPL computations in the modeling presumes that all frequency bands are hitting the limiter
voltage at the same time, which may not be the case. If the combination of the program
content and the filter EQs is such that a particular frequency band reaches the limiter voltage
before other bands, then the full-band SPL may not reach the indicated SPL level due to limiter
activation.
0 dB ISOBAR VIEW
The “0 dB Isobar” view allows the pressure gradient of up to four frequencies to be simultaneously
displayed on the same plot. The highest SPL for any of the seating planes shown in the mapping view is
displayed as the 0 dB reference level. The relative distance of the isobar from the seating plane provides
Page 15

an indication of the variation in SPL immediately perpendicular to the plane. Selected frequencies are
shown in the top right corner of the display window.
Smoothing of the 0 dB Isobar view can be adjusted using the slider control labeled “Smoothing”.
All other graphical controls for planes, loudspeaker array location and aiming are as previously
described.
SPL ATTENUATION VIEW
The “SPL Attenuation” view shows relative SPL level along each of the listening planes at up to four
frequencies simultaneously. This view provides a quick, at-a-glance indication of SPL variation along the
entire length of the audience planes and is a useful representation for array gain shading and frequency
tapering (i.e., equalization as implemented using Box EQ).
Darker green lines are equally-spaced between the listening plane and the loudspeaker array and
indicate 3 dB, 6 dB and 9 dB of attenuation relative to the 0 dB attenuation reference corresponding to
the seating plane. As seen in the example below, all SPL contours fall within the listener plane and the -3
dB reference, corresponding to a variation of +/- 1.5 dB along the audience plane.
The relative scale (or spacing) between attenuation lines can be adjusted using the “SPL plot zoom”
horizontal slider control.
All other graphical controls for planes, loudspeaker array location and aiming are as previously
described.
Page 16

ADDING / ADJUSTING FREQUENCY RESPONSE PROBES
Right-clicking on a listening plane opens a context menu where it is possible to select “Show Freq
Probe”. When this option is selected, a circular marker will appear and a frequency response curve
displayed in the lower right window, corresponding to the probe at this location.
The SPL shown at the probe location is the calculated level due to the complex (magnitude and phase)
summation of the array at each probe location. Subwoofer levels are scaled to provide summation at
the recommended ratio of 2 subwoofers for every 3 “full-range” boxes.
Page 17

It is possible to “left-click” on a probe location and drag the probe along an audience plane to
dynamically re-plot the frequency response in real time. Conceptually, this is the equivalent of walking
along an audience listening plane with a measurement microphone.
“Right-click” on another open area of an audience plane to add additional frequency response probe
locations (up to 6 total). Each probe can be dragged along the audience plane and positioned, as
desired. Frequency response curves and probe locations can be deleted by right-clicking on the probe,
and selecting “Remove Freq Probe” or “Remove All Freq Probe”.
Note: To avoid accidentally moving planes or the speaker array, turn on the “Lock Array” and “Lock Planes” check
boxes above the graphics window.
“Right-click” in the Frequency Response window and select “Show Marker” to display a cursor
Page 18

DOCUMENTING PROJECTS
Comments
Click on the Project: window in order to add comments and document your project. Comments entered
on the Acoustical Mapping page are automatically copied to Array Configuration and Printout pages.
Copying Graphs and Plots to the Clipboard
By “right-clicking” on “Frequency Response”, “SPL Mapping”, “0 dB Isobar” or “SPL Attenuation”
windows, it is possible to copy any of these display views to the clipboard. From the clipboard, graphs
can be pasted into any standard Windows application. The frequency response graph is in vector format
and can be rescaled without loss of resolution. SPL Mappings, 0 dB Isobar or SPL Attenuation plots are
captured as a 1:1 pixel bitmap.
OPTIONS MENU
Select Tools→Options
If Snap to Grid is selected, coordinates of features that are graphically modified in the mapping window,
will automatically round to the nearest increment entered in “Grid Size”. Grid units (feet or meters) are
Page 19

the same as the units selected in the main project window (on either Acoustical Mapping or Array
Configuration tabs).
Isobars (dB) sets the spacing or range of the three SPL Isobars that are displayed when “SPL Mapping” is
selected on the Acoustical Mapping tab.
Default Units sets the units default to either ft/lb or m/kg. Note that the units selected are saved as
part of the project “.lineac” file. If a project is opened that was saved with different units than the
preference specified in Tools/Options, the “.lineac” file will open showing the units that were selected
by the user when the file was saved. It is always possible to change units using the radio buttons
available on the Acoustical Mapping or the Array Configuration tabs. When units are changed, the
program automatically converts from ft/lb to m/kg and temperature values are automatically converted
from °F to °C, or vice versa.
When Rays Shadowing is selected, dotted reference lines showing the sight angle for each loudspeaker
in the array stop when they first intersect a plane. If Ray Shadowing is not selected, then sight angle
reference rays continue to the edge of the graphics plot.
Show Error Messages in Acoustical mapping page toggles warning messages on/off
Show Warning Messages when creating Groups toggles warning messages on/off
ARRAY CONFIGURATION TAB
The Array Configuration tab provides information that is useful for suspending the loudspeaker array.
Any changes made to the array in the Array Configuration tab will automatically update in the Acoustical
Mapping tab, and vice versa.
Exact suspension limits depend on enclosure type(s), array size, array shape, overall array orientation.
Always refer to warning indications on the Array Configuration page.
Double-point suspension is recommended for minimized risk.
ANSI Standard E1.8-2005 (Entertainment Technology Loudspeaker Enclosures Intended for Overhead
Suspension) Section 5.3.4 specifies a minimum 5:1 design factor.
Overhead suspension of loudspeaker systems should be undertaken only by trained and qualified
personnel.
JBL Professional is not responsible for the use, misuse or misapplication of these products.
Page 20

Design Factor
Design factors of 5:1, 7:1, or 10:1 can be selected. It is advised to check local regulations regarding
design factor requirements.
Frame Options
The Frame Options cells allow selection of a number of suspension options. The selected frame will be
utilized for the Suspension Detail limits.
VLA-C-SB (Discontinued) -- The VLA-C-SB was a now-discontinued light-duty suspension bar
intended for use with very small (2 or 3 speaker) arrays, under a limited set of suspension
angles. It is included in this Calculator for anyone who may still have one and wants to use it.
VLA-C-SB2 (SKU #JBL-VLACSB2BK) -- The VLA-C-SB2 is a heavier-duty suspension bar capable of
being utilized with larger arrays and higher weights. When the VLA-C-SB2 bar is selected, there
is a cell immediately below the selection for also selecting the angle of the bar in relation to the
speaker cabinet. The selected angle will also be shown graphically in the Suspension Detail
diagram.
Using the VLA-C-SB2 Bracket on a VLA-C265 or VLA-C2100 Full-Range Speaker
Top Bracket -- The top bracket can be attached at either 0°, 15°, 30°, 45°, or 90° (angle is
in relation to the front-baffle of the speaker):
Page 21

Page 22

Bottom Bracket -- The bottom bracket (sometimes referred to as “pull-back” bracket)
can be attached at either 0°or 90° (0° is extending straight down from the bottom of the
lower-most speaker; 90° is extending straight back from the bottom of the lower-most
speaker):
Using the VLA-C-SB2 Bracket on a VLA-C-125S Low-Frequency Speaker
Top Bracket -- The top bracket can be attached to a VLA-C-125S at either 0°, 15°, 30°, or
45° (angle is in relation to the front-baffle of the speaker). It cannot be attached at 90°,
and therefore the program does not include a selection option for 90°:
Page 23

(Again, the VLA-C-SB2 cannot be attached at 90°, and therefore the program does not include a
selection option for 90°)
Bottom Bracket -- The bottom bracket (sometimes referred to as “pull-back” bracket for
the array) can be attached at either 0°or 90° (0° is extending straight down from the
bottom of the lower-most speaker; 90° is extending straight back from the bottom of
the lower-most speaker):
Note that for 90°, the VLA-C-SB2 bracket attaches to points that are located closer to the back of
the VLA-C125S cabinet (to avoid an interference between the bracket and the cabinet). See the
bracket’s installation instructions for the exact location of the attachment points for this 90°
position.
Custom Frame -- Selecting Custom Frame is a common suspension method for larger arrays and
special installation circumstances. In this selection, the VLA-C Calculator shows vertical
suspension lines which will need to be attached to a custom array frame or secure attachment
points on the building structure.
Page 24

No Frame -- Selecting No Frame removes the vertical suspension lines and frame limitations will
not be utilized in the Suspension Detail computations.
Important: For any suspension, all suspension lines must be vertical and attach to secure points that
will ensure that the suspension lines remain vertical during the life of the installation. Do not angle
any suspension lines. Custom array frames may need to be designed and installed by the integrator or
installer to provide safe attachment points for these vertical suspension lines.
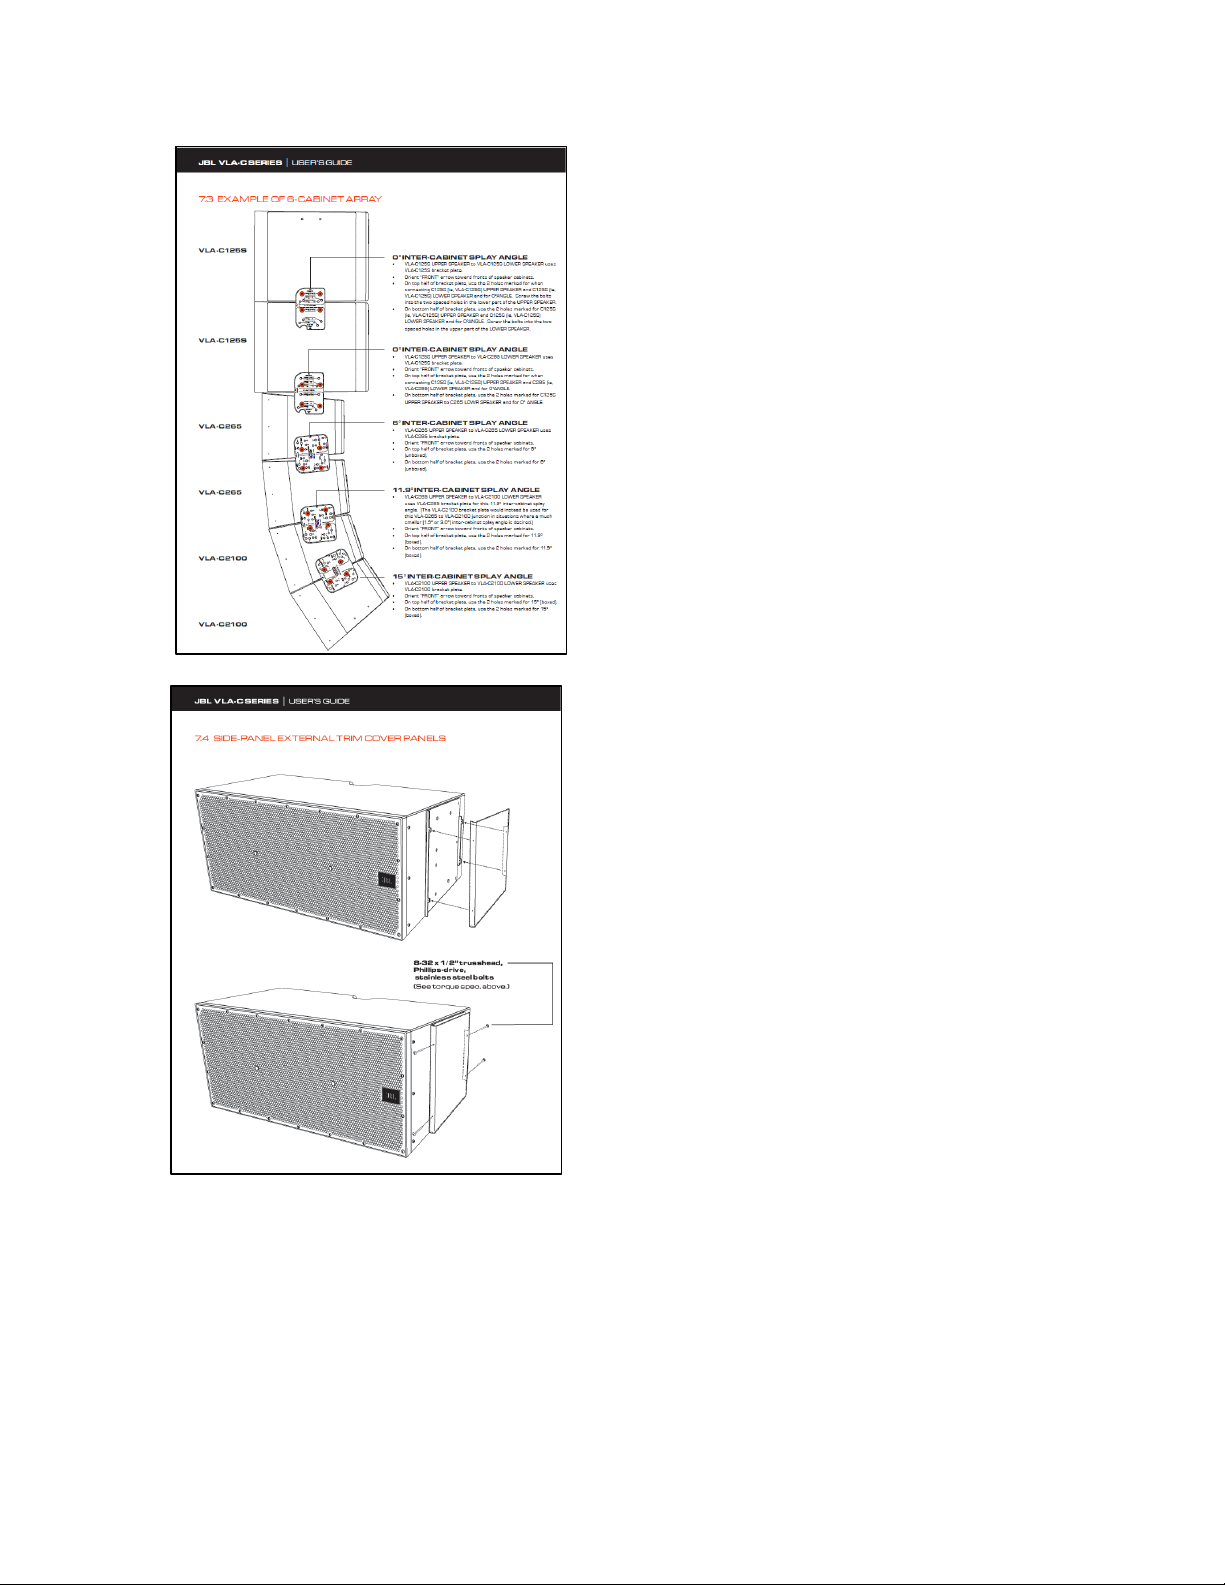
Setting of Inter-Enclosure Splay Angles
See the VLA Compact User’s Guide for instructions and diagrams showing how to use the angle brackets
for setting inter-enclosure splay angles.
Page 25

VLA COMPACT USER’S GUIDE
For additional information about VLA Compact loudspeakers and systems, see the VLA Compact User’s
Guide (Document #1000344625).
Example system assembly diagrams from the User’s Guide:
Page 26
 Loading...