

Page 1

P/N:0302-0304C January 2003
V-530/550/560/570
Spectrophotometer
Instruction Manual
V -500 for W indow s
Ò
Page 2

i
Safety Considerations
To ensure operation safety, this instrument must be operated correctly and maintained
according to a regular schedule. Carefully read to fully understand all safety precautions in this
manual before operating the instrument. Please take a moment to understand what the signal
words WARNING!, CAUTION, and Note mean in this manual.
(1) Safety symbols
Instruction manual symbol. If the product is marked with this symbol, refer to
the instrument manuals to protect the instrument against damage.
WARNING A WARNING indicates an potentially hazardous situation which, if not avoided,
could result in death or serious injury
.
CAUTION A CAUTION indicates a potentially hazardous situation which, if not avoided,
may result in minor or moderate injury. It may also be used to alert against
damaging the equipment.
Do not proceed beyond a WARNING or CAUTION notice until you understand
the hazardous conditions and have taken the appropriate steps.
Note A Note provides additional information to aid the operator in obtaining optimal
instrument performance.
Page 3
ii
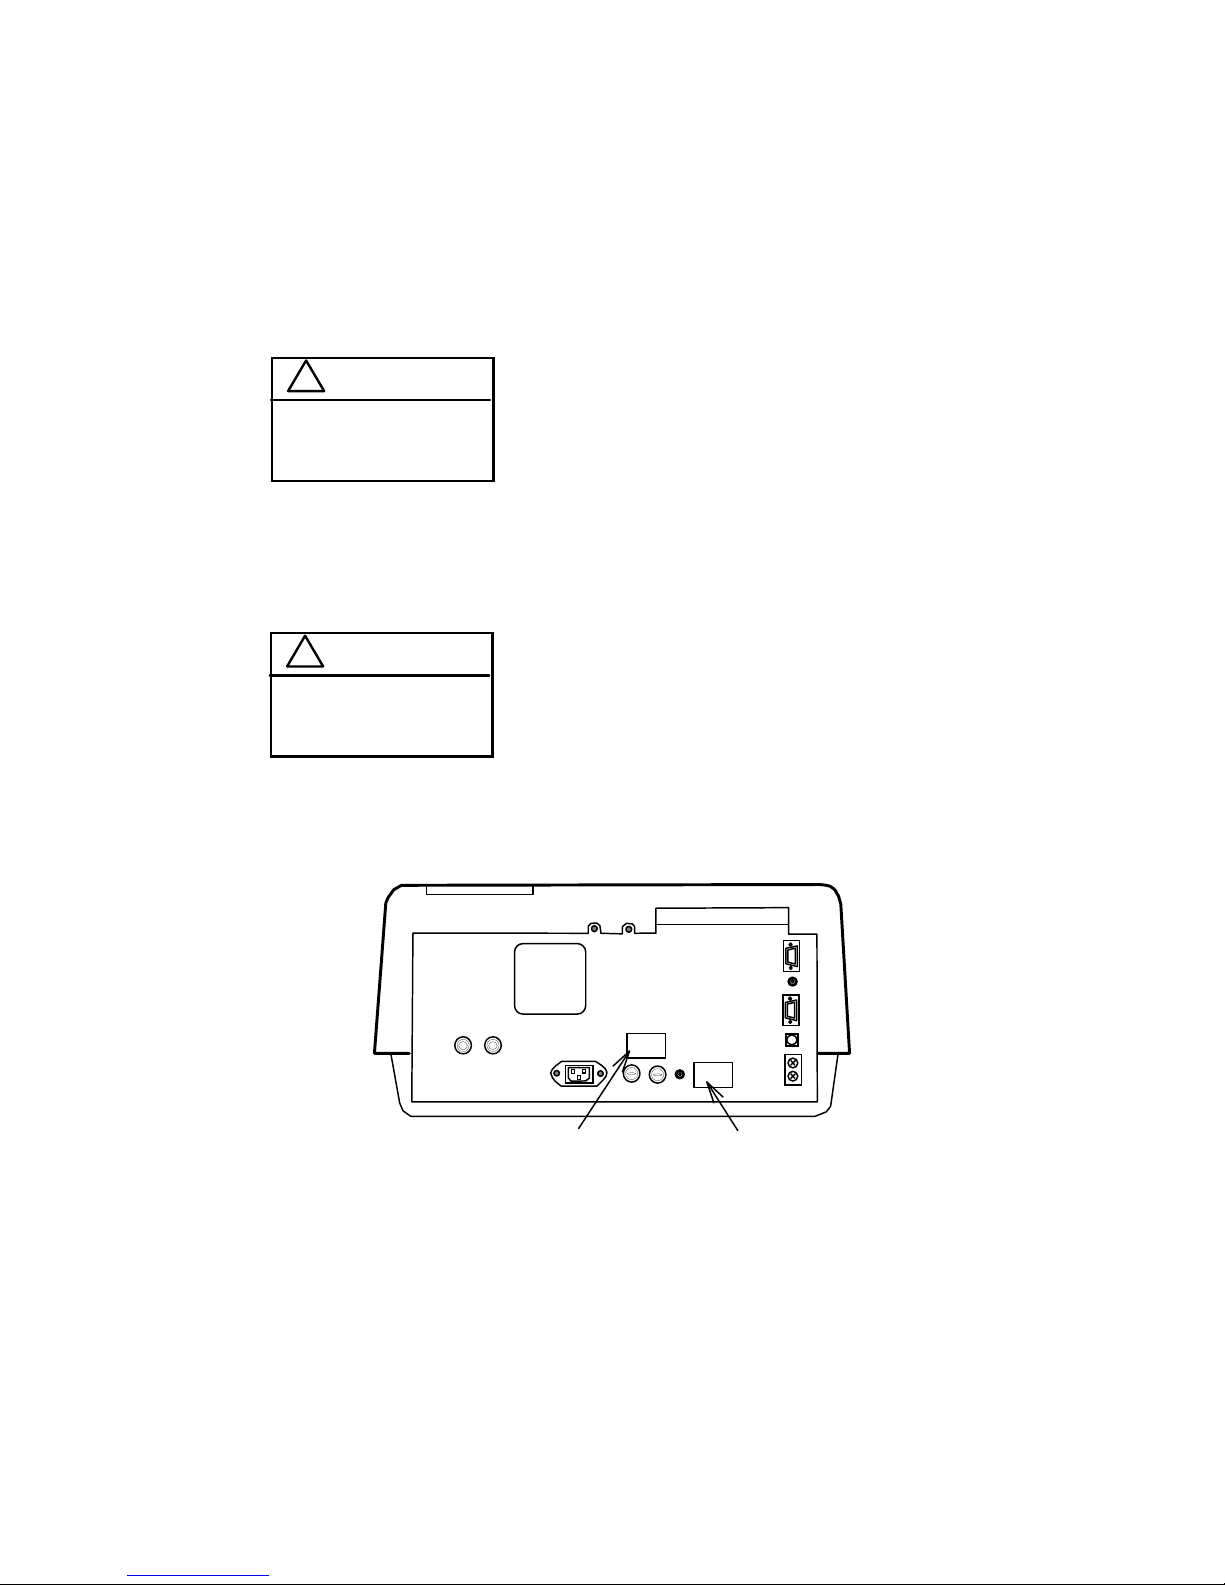
(2) Warning Label
Warning labels are attached at several locations on this instrument. Do not remove,
deface or damage the warning labels. If a warning label peels off the instrument or
becomes illegible, contact your local JASCO distributor and state the part number of
the label you want to replace.
1) Warning for FUSE
(Fig.1 or Fig. 2)
Part No.: 0822-0120A
2) Warning for GROUND
(Fig.1 or Fig.2)
Part No.: 0822-0125A
Warning for FUSE Warning for GROUND
Figure 1 Warning Labels on the V-530 Back Panel
!
WARNING
FOR CONTINUED PROTECTION
AGAINST RISK OF FIRE, REPLACE
ONLY WITH FUSE OF THE SPECIFIED
TYPE AND CURRENT RATINGS.
Only use fuses of the specified rating to protect
both operator and instrument from fire and other
hazards. When replacing a fuse, refer to the
hardware manual (4.4.1 Replacing the fuse). The
warning labels that pertain to fuse ratings are
located on the back panel of the instrument.
!
WARNING
MAINS PLUG GROUND PIN
OR GROUND TERMINAL
MUST BE CONNECTED
TO GROUND.
This instrument must be grounded correctly;
either the mains plug ground pin or through the
ground terminal on the rear panel of the
instrument.
Page 4
iii
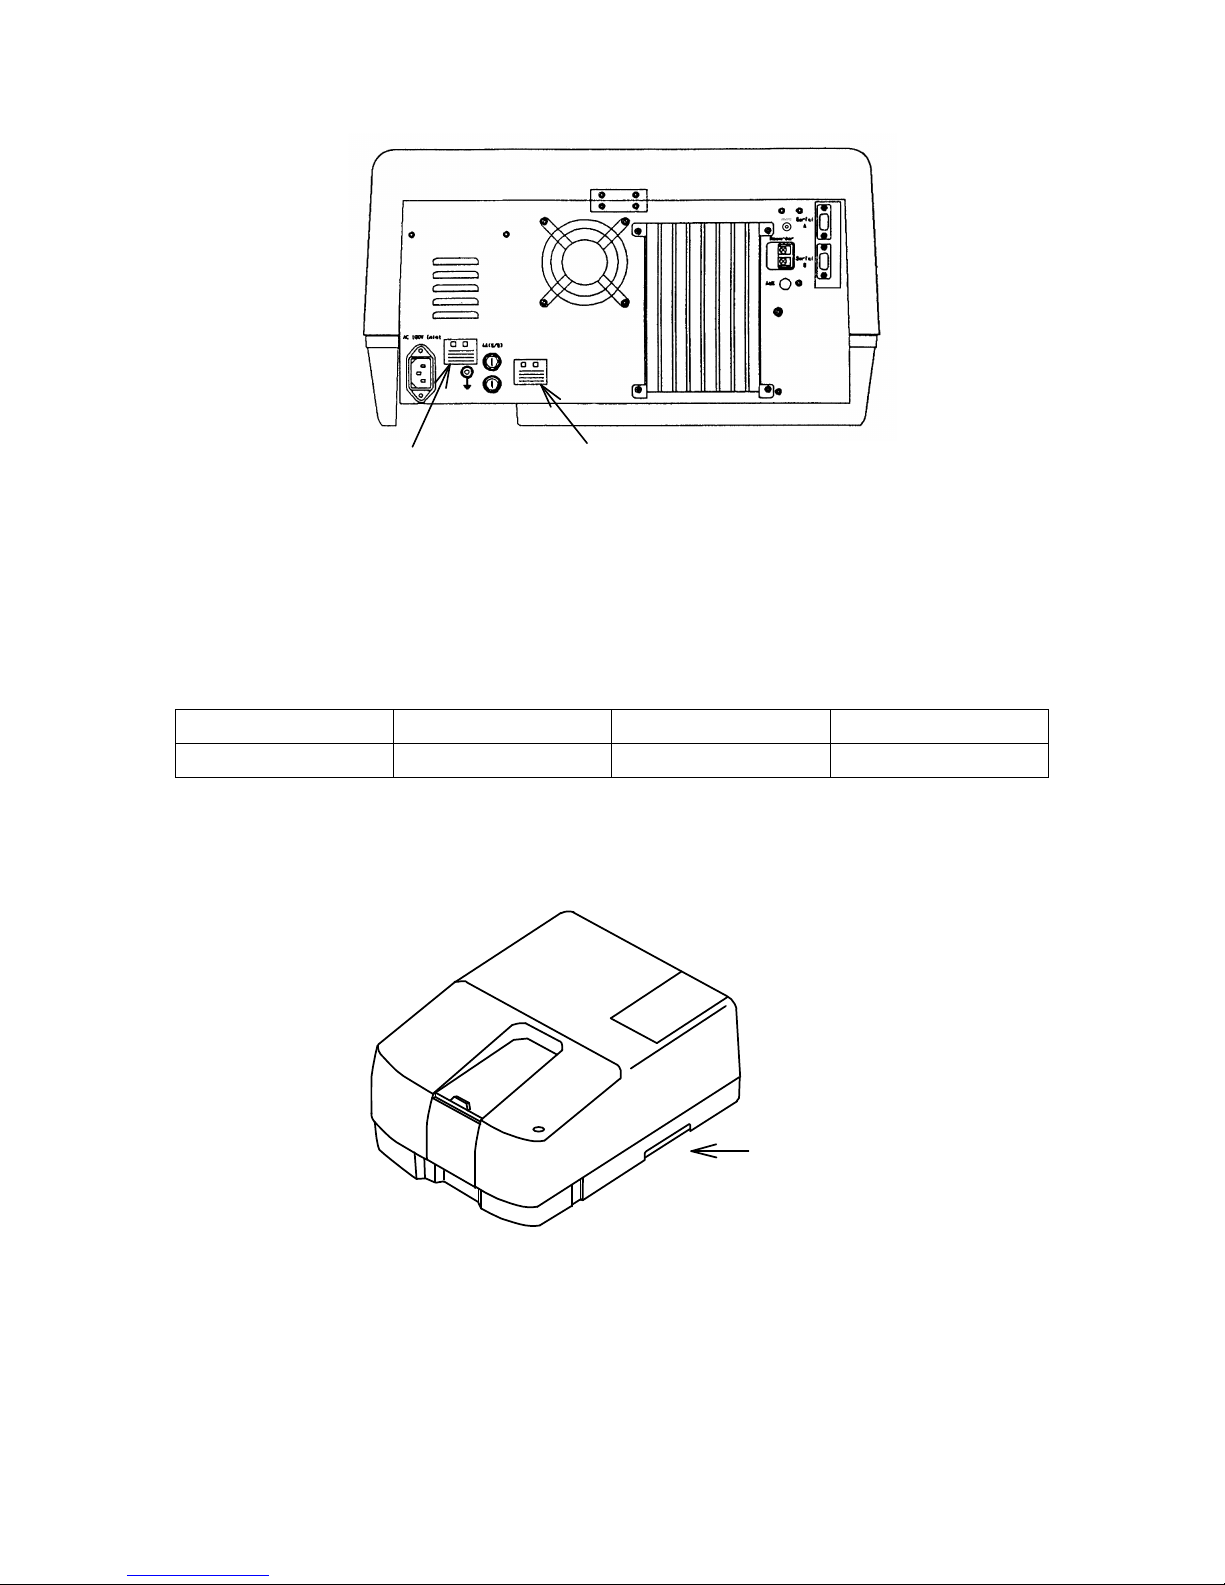
Warning for FUSEWarning for GROUND
Figure 2 Warning Labels on the V-550/560/570 Back Panel
(2) Warning for carrying
The weight (in kilograms) of each instrument is as follows:
V-530 V-550 V-560 V-570
16.0 30.5 32.0 33.0
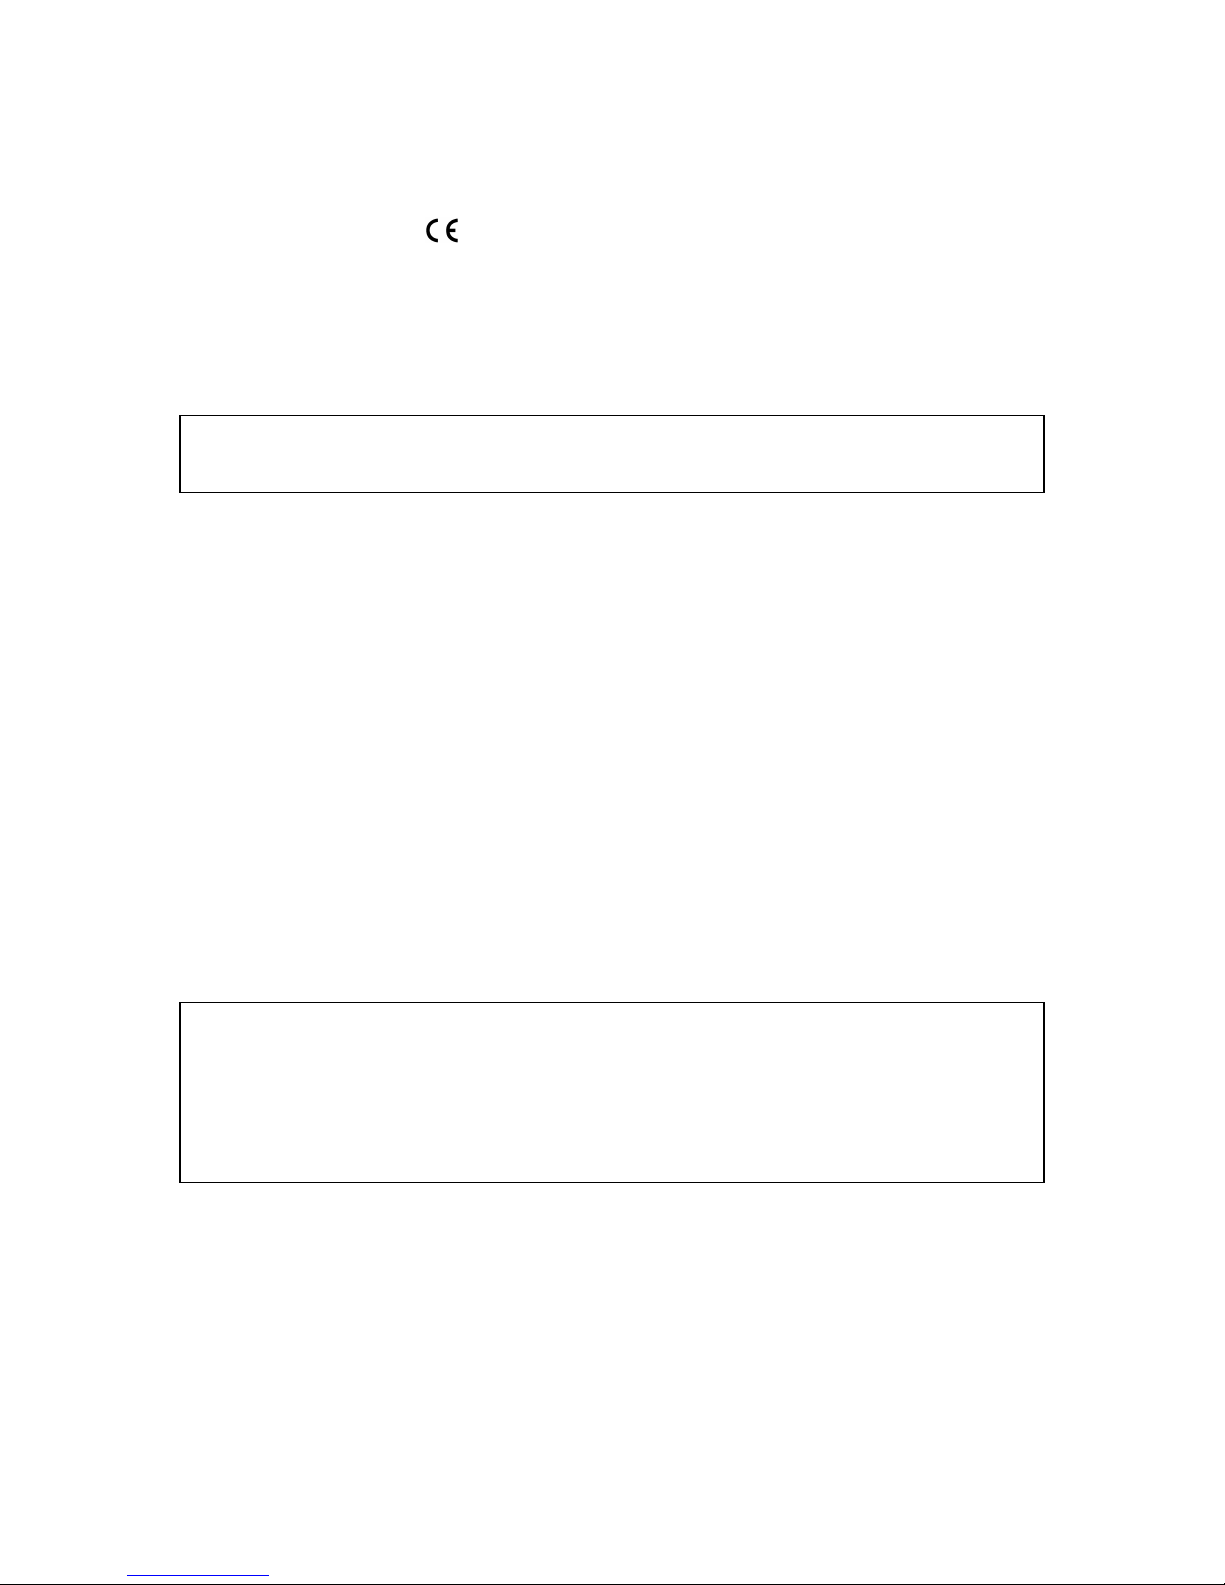
When moving the instrument, hold the handgrips at the bottom of the instrument
firmly (see Fig. 3).
Handgrips
Figure 3 Example: V-550/560/570 side view
Page 5
iv
Regulatory Statements
CE Notice
Marking by the symbol
indicates compliance of this JASCO system to the EMC
(Electromagnetic Compatibility) and Low Voltage Directives of the European Community. This
symbol indicates that this JASCO system meets the relevant basic safety and health
requirements of the EC Directive based on the following technical standards:
· EN55011 ---- ”Limits and Methods of Measurement of Radio Interference Characteristics of
Information Technology Equipment.” ---- Group 1, Class A.
WARNING: This is a Class A product. In a domestic environment this product may cause
radio interference, in which case the user may be required to take adequate
measures.
· EN50082-1 -- "Electromagnetic compatibility -- Generic immunity standard Part 1:
Residential, commercial, and light industry."
· IEC61000-4-2 -- "Electromagnetic compatibility for industrial-process measurement and
control equipment Part 2: Electrostatic discharge requirements."-- Severity level 3.
· IEC61000-4-3 -- "Electromagnetic compatibility for industrial-process measurement and
control equipment Part 3: Radiated electromagnetic field requirements." -- Severity level 2.
· IEC61000-4-4 -- "Electromagnetic compatibility for industrial-process measurement and
control equipment Part 4: Electrical fast transient/burst requirements."-- Severity level 3.
· IEC1010-1: 1990 + Amd.1: 1992 + Amd.2: 1995 -- Safety requirements for electrical
equipment for measurements, control and laboratory use.
· IEC61000-3-2: 1995 + Amd.1: 1998 + Amd.2: 1998 --- "Electromagnetic compatibility:
Limits for harmonic current emissions (equipment input current up to and including 16A per
phase).
· A "Declaration of Conformity" in accordance with the above standards has been made and
is on file at JASCO EUROPE srl, Via Confalonieri 25, 22060 CREMELLA (LC), Italy.
FCC Statement (for USA only)
Federal Communications Commission Radio Frequency Interference Statement
W A R N IN G : T his equipm ent generates, uses, and can radiate radio frequency energy. If it is not installed
and used in accordance w ith the instruction m an ual, it m ay cause interference to radio
com m unications. It has been tested and found to com ply w ith the lim its for a C lass A com puting
device pursuant to P art 15 of F C C R ules, w hich are intended to provide reasonable protection
against such interference w hen operated in a com m ercial environm ent. O peration of this
equipm ent in a residential area is likely to cause interference, in w hich case the u ser at his ow n
expense w ill be required to take w ha tever m easures m ay be required to correct the interference.
Page 6

v
Preface
This instruction manual is your guide for using this instrument. It instructs first-time users on
how to use the instrument, and serves as a reference for experienced users.
Before using the instrument, please read this instruction manual carefully, and make sure that the
contents are fully understood. This manual should be easily accessible to the operator at all times
during instrument operation. When not using the instrument, keep this manual in a safe place. If this
instruction manual becomes lost, order a replacement from your local JASCO distributor.
The instruction manual is divided into following volumes:
1) Hardware manual: Describes the principles of operation, specifications,
maintenance, troubleshooting of this instrument.
2) Operation manual: Describes the configuration of this measument program,
functions, and operating procedures.
3) Analysis: Describes the configuration of spectra analysis and file viewer program.
(DS type)
N ote: The operating procedure varies w ith the type of instrum en t. O peration is describ ed by type. R ead the
relevant portion.
Page 7

vi
Installation Requirements
To ensure operation safety, observe the following conditions:
(1) Do not operate the instrument under voltage fluctuations exceeding 10% of the
recommended line voltage. Otherwise, the instrument may not function properly.
(2) Frequency or spike noise in the power supply should be minimal.
(3) Ensure that the instrument is grounded.
(4) Operate the instrument in a temperature range of 10 ~ 35°C.
(5) Operate the instrument in a humidity range of 35 ~ 85%(RH). If ambient humidity
exceeds 85%(RH), condensation may deteriorate optical components.
(6) Operate the instrument in an atmospheric pressure range of 950 ~ 1060hPa.
(7) Avoid strong magnetic fields and sources of high frequency. The instrument may not
function properly when near a strong magnetic field or high frequency source.
(8) Avoid vibration from vacuum pumps, electric motors, processing equipment and
machine tools.
(9) Avoid dust and corrosive gas. Do not install the instrument where it may be exposed to
dust, especially in locations exposed to outside air or ventilation outlets that discharge
dust particles.
(10) Do not install the instrument in a location where it may be exposed to direct sunlight.
(11) Install the instrument in a horizontal and stable position. (This includes a table or desk
upon which the instrument is installed.)
(12) Ensure that no air conditioner blows air directly onto the instrument. This may prevent
stable measurement.
(13) Install the instrument in a location that allows easy access for maintenance.
Note: The above conditions do not guarantee optimal performance of this instrument.
Page 8

vii
Servicing
Contact your local JASCO distributor for instrument servicing. In addition, contact your JASCO
distributor before moving the instrument to another location. Consumable parts should be
ordered according to part number from your local JASCO distributor. If a part number is
unknown, give your JASCO distributor the model name and serial number of your instrument.
Do not return contaminated products or parts that may constitute a health hazard to
JASCO employees.
Notices
(1) JASCO shall not be held liable, either directly or indirectly, for any consequential damage
incurred as a result of product use.
(2) Prohibitions on the use of JASCO software
· Copying software for purposes other than backup
· Transfer or licensing of the right to use software to a third party
· Disclosure of confidential information regarding software
· Modification of software
· Use of software on multiple workstations, network terminals, or by other methods
(not applicable under a network licensing agreement concluded with JASCO)
(3) The contents of this manual are subject to change without notice for product improvement.
(4) This manual is considered complete and accurate at publication.
(5) This manual does not guarantee the validity of any patent rights or other rights.
(6) In general, company names and product names are trademarks or registered trademarks
of the respective companies.
(7) JASCO and the JASCO logo are registered trademarks of JASCO Corporation
ã JASCO Corporation, 2003. All rights reserved. Printed in JAPAN.
Page 9

viii
Limited Warranty
Products sold by JASCO, unless otherwise specified, are warranted for a period of one year
from the date of shipment to be free of defects in materials and workmanship. If any defects in
the product are found during this warranty period, JASCO will repair or replace the defective
part(s) or product free of charge.
THIS WARRANTY DOES NOT APPLY TO DEFECTS RESULTING FROM THE FOLLOWING:
1) IMPROPER OR INADEQUATE INSTALLATION
2) IMPROPER OR INADEQUATE OPERATION, MAINTENANCE, ADJUSTMENT OR
CALIBRATION
3) UNAUTHORIZED MODIFICATION OR MISUSE
4) USE OF CONSUMABLE PARTS NOT SUPPLIED BY AN AUTHORIZED JASCO
DISTRIBUTOR
5) CORROSION DUE TO THE USE OF IMPROPER SOLVENTS, SAMPLES, OR DUE TO
SURROUNDING GASES
6) ACCIDENTS BEYOND JASCO’S CONTROL, INCLUDING NATURAL DISASTERS
This warranty does not cover the consumable parts listed below:
1) Deuterium lamp, tungsten lamp, xenon lamp and other light sources
2) Mirrors in the light source section, and cell windows
3) Fuses, batteries, glassware, chart paper and ink
The LC system only contains:
4) Plunger seals, needle seals, cell window gaskets, valve seals, disk seals and other seal
materials
5) Tubing and fittings (e.g., ferrules, compression screws), and filters (e.g., inlet filters, line
filters, other solvent filters)
6) Pre-columns and guard columns
THE WARRANTY FOR ALL PARTS SUPPLIED AND REPAIRS PROVIDED UNDER THIS
WARRANTY EXPIRES ON THE WARRANTY EXPIRATION DATE OF THE ORIGINAL
PRODUCT. FOR INQUIRIES CONCERNING REPAIR SERVICE, CONTACT YOUR JASCO
DISTRIBUTOR AFTER CONFIRMING THE MODEL NAME AND SERIAL NUMBER OF YOUR
INSTRUMENT.
JASCO Corporation
2967-5, Ishikawa-machi, Hachioji-shi
Tokyo 192-8537
JAPAN
Page 10

ix
Contents
Safety Considerations.................................................................................................................i
Regulatory Statements .............................................................................................................. iv
Preface ....................................................................................................................................... v
Installation Requirements........................................................................................................ vi
Servicing ..................................................................................................................................vii
Notices...................................................................................................................................... vii
Limited Warranty.................................................................................................................... viii
1. Introduction ........................................................................................................................... 1
1.1 Layout of this Manual....................................................................................................... 1
1.2 Foreword and Notation Used............................................................................................ 1
1.3 Overview of [Spectra Manager] ....................................................................................... 2
2. Starting and exiting programs and [Spectra Manager] ....................................................... 4
2.1 Startup............................................................................................................................... 4
2.1.1 Turning ON the spectrophotometer........................................................................................ 4
2.1.2 PC and WindowsÒ startup ..................................................................................................... 4
2.1.3 [Spectra Manager] startup ...................................................................................................... 4
2.2 Exiting .............................................................................................................................. 6
2.2.1 Exiting measurement or spectra analysis program ................................................................. 6
2.2.2 PC and spectrophotometer shutdown ..................................................................................... 7
2.3 [Spectra Manager] Menu .................................................................................................. 8
3. Quantitative Analysis and Spectrum Measurement........................................................... 10
3.1 Quantitative Analysis Introduction................................................................................. 10
3.1.1 Quantitative analysis program overview .............................................................................. 10
3.1.1.1 Quantitative analysis program....................................................................................... 10
3.1.1.2 Quantitative analysis operation ..................................................................................... 11
3.1.2 Program startup .................................................................................................................... 11
3.1.3 Calibration curve creation .................................................................................................... 12
3.1.4 Calibration curve modification............................................................................................. 16
3.1.5 Saving quantitative analysis method .................................................................................... 17
3.1.6 Unknown sample measurement............................................................................................ 18
3.1.7 Saving data sheet .................................................................................................................. 19
3.1.8 Printing results...................................................................................................................... 19
3.1.9 Exiting quantitative analysis ................................................................................................ 20
3.2 Spectrum Measurement .................................................................................................. 21
3.2.1 Procedural overview............................................................................................................. 21
3.2.2 [Spectrum measurement] program startup............................................................................ 21
3.2.3 Setting measurement parameters.......................................................................................... 22
3.2.4 Setting the baseline(or Measurement) .................................................................................. 23
3.2.5 Sample measurement............................................................................................................ 25
3.2.6 Spectrum save....................................................................................................................... 26
3.2.7 Printing results...................................................................................................................... 26
3.2.8 Instrument shutdown ............................................................................................................ 27
4. [Quantitative Analysis]........................................................................................................ 28
Page 11

x
4.1 [File] menu ..................................................................................................................... 30
4.1.1 [New...]................................................................................................................................. 30
4.1.2 [Open...]................................................................................................................................ 32
4.1.3 [Save].................................................................................................................................... 32
4.1.4 [Save As...] ........................................................................................................................... 33
4.1.5 [Page Setup...] ...................................................................................................................... 34
4.1.6 [Print Setup...] ...................................................................................................................... 34
4.1.7 [Print...] ................................................................................................................................ 35
4.1.8 [Exit]..................................................................................................................................... 35
4.2 [Method] menu ............................................................................................................... 36
4.2.1 [New...]................................................................................................................................. 36
4.2.2 [Open...]................................................................................................................................ 40
4.2.3 [Save As...] ........................................................................................................................... 41
4.2.4 [Modify...]............................................................................................................................. 41
4.2.5 [Information...] ..................................................................................................................... 42
4.3 [Measurement] menu...................................................................................................... 42
4.3.1 [Measurement...]................................................................................................................... 42
4.3.2 [Parameters...]....................................................................................................................... 43
4.3.3 [Blank Correction...]............................................................................................................. 43
4.4 [Edit] menu ..................................................................................................................... 44
4.4.1 [Copy Picture] ...................................................................................................................... 44
4.4.2 [Copy Bitmap]...................................................................................................................... 44
4.4.3 [Copy Text]........................................................................................................................... 44
4.4.4 [Invalid]................................................................................................................................ 44
4.4.5 [Data Input...] ....................................................................................................................... 44
4.4.6 [Title...]................................................................................................................................. 44
4.5 [View] menu ................................................................................................................... 44
4.5.1 [Font...]................................................................................................................................. 45
4.5.2 [Format...]............................................................................................................................. 46
4.5.3 [Cell Width...]....................................................................................................................... 46
4.5.4 [Scale...]................................................................................................................................ 46
4.5.5 [Pattern...] ............................................................................................................................. 47
4.5.6 [Grid...]................................................................................................................................. 47
4.5.7 [Style...] ................................................................................................................................ 48
4.5.8 [Marker...]............................................................................................................................. 49
4.6 [Window] menu ..............................................................................................................49
4.7 [Help] menu.................................................................................................................... 49
5. [Spectrum Measurement].................................................................................................... 50
5.1 [Measurement] menu...................................................................................................... 51
5.1.1 [Start].................................................................................................................................... 51
5.1.2 [Parameter...] ........................................................................................................................ 51
5.1.2.1 [Parameters] dialog box................................................................................................. 51
5.1.2.2 [Data File] dialog box.................................................................................................... 55
5.1.3 [Baseline...]........................................................................................................................... 56
5.1.4 [Move Wavelength...] ........................................................................................................... 58
5.1.5 [Auto Zero]........................................................................................................................... 59
5.1.6 [Exchange Wavelength...]..................................................................................................... 59
5.1.7 [Wavelength for Grating Exchange...].................................................................................. 59
5.1.8 [Exit]..................................................................................................................................... 59
5.2 [Help] menu.................................................................................................................... 59
6. [Time Course Measurement] ..............................................................................................60
6.1 [Measurement] menu...................................................................................................... 61
Page 12

xi
6.1.1 [Start].................................................................................................................................... 61
6.1.2 [Parameter...] ........................................................................................................................ 61
6.1.2.1 [Parameter] dialog box .................................................................................................. 61
6.1.2.2 [Data File] dialog box.................................................................................................... 63
6.1.3 [Move Wavelength...] ........................................................................................................... 63
6.1.4 [Auto Zero]........................................................................................................................... 63
6.1.5 [Exit]..................................................................................................................................... 63
6.2 [Help] menu.................................................................................................................... 64
7. [Fixed Wavelength Measurement]...................................................................................... 65
7.1 [Measurement] menu...................................................................................................... 66
7.1.1 [Start].................................................................................................................................... 66
7.1.2 [Blank] ( ) [Blank Correct] ([Correct]) ...................................................................... 66
7.1.3 [Parameter...] ........................................................................................................................ 67
7.1.4 [Goto Wavelength...] ............................................................................................................ 69
7.1.5 [Auto Zero]........................................................................................................................... 69
7.1.6 [Exit]..................................................................................................................................... 69
7.2 [Data] .............................................................................................................................. 69
7.3 [Help] menu.................................................................................................................... 69
8. [Abs/%T Meter] ...................................................................................................................70
9. [Environment] ..................................................................................................................... 72
9.1 [Hardware Setting] ......................................................................................................... 72
9.2 [Diagnosis] menu............................................................................................................ 73
9.3 [Accessories Setting] ...................................................................................................... 74
9.4 [Wavelength Correction] ................................................................................................ 75
10. Appendix ............................................................................................................................ 76
10.1 Spectra Manager Installation ........................................................................................ 76
10.1.1 Before installation .............................................................................................................. 76
10.1.2 Installing Spectra Manager from Floppy Disk ................................................................... 76
10.1.2.1 Starting up SETUP.EXE.............................................................................................. 76
10.1.2.2 Inputting operator name or company name................................................................. 79
10.1.2.3 Setting the program directory...................................................................................... 80
10.1.2.4 Setting the data directory............................................................................................. 80
10.1.2.5 Copying files to hard disk ........................................................................................... 81
10.1.3 Installing Spectra Manager from CD-ROM................................................................... 82
10.2 Setting the Serial Port (RS-232C) ................................................................................ 84
Page 13

xii
Page 14

1
1. Introduction
1.1 Layout o f this M anual
T his section describes the layout and fun ction of this m anual. T he V -500 for W indow sÒ in struction m anual
consists of 10 sections, including this on e. R ead this m anual carefully in o rder to ensure a full
understanding of th e operating procedures before using the V -530/55 0/560/5 70.
F or [S pectra A nalysis] program , refer to the "S pectra A nalysis/F ile V iew er Instructio n M anual". F or [JA S C O
C anvas] program , refer to the "JA S C O C anvas Instruction M anu al".
H ereafter, this m anual w ill refer to the V -500 for W indow s as the V -500W , and to M icrosoft W indow s as
W indow s.
S ection 1. Introduction
T his section expla ins th e w riting syntax an d d isplay configuration used in this m anual. R ead this section
first.
S ection 2. S ta rtin g up/exiting program s and [S pectra M ana ger]
T his section outlines the procedures associated w ith op era ting the V -500W includin g starting up the
spectrophotom eter, P C , W indow s, and V -500W , as w ell as exiting V -500W and W indow s and shutting
dow n the spectrophotom eter. S pecific pro gram op era tions are described in subsequent sections. This
section also describes the m enu that appea rs w hen you start up JA S C O [S pectra M a nager].
S ection 3. Introdu ction to qu antitative analysis and spectrum m easurem ent
T his section describes quantitative analysis and spectrum m easurem ent. This section introduces the
inexperienced user to W indow s, spectrophotom etry, and V -500W operation.
S ections 4. to 9. S tandard m easurem ent program reference
T his section p rovides a reference to explain th e functions of each m ea surem ent progra m . It also explains
the procedure for setting instrum ental h ardw are and self-diagnostics.
S ection 10. A pp end ix
T his section describ es how to install the so ftw are and set the serial port.
1.2 F o rew ord and N otation U sed
V -500W runs o n W indow s 95/9 8/N T 4.0/2000, so you need to be fam iliar w ith basic W indow s operations.
T his m anual does not explain how to open m enus, select com m ands, or cop y files. If necessa ry, read the
W indow s docum entation b efore o perating V -500W .
Page 15

2
T he follow ing notational conventions are used throughout this m anual:
General Notation
Notation Meaning
[Measurement] menu
[Parameters...] command
Names of menus, commands, and text boxes are enclosed in
square brackets [ ], followed by a description indicating whether
the function is a menu, command, text box, or other.
<OK>, <Cancel>
Names of buttons are enclosed in angular brackets < >.
Keyboard Operations
Notation Meaning
Shift CTRL
Names of keys found on the keyboard are enclosed in boxes.
Alt , F
Keys that are to be pressed in succession are separated by commas. In the
example shown on the left, the Alt key is to be pressed and released,
followed by the F key.
Shift + ®
Keys that are pressed simultaneously are linked by a plus sign. In the
example shown on the left, press the ® key while holding down the Shift
key.
Mouse Operations
Notation Meaning
Point
Move the mouse pointer to the specified item.
Click
Quickly press and release the mouse button.
Double-click
Click the mouse button twice in rapid succession.
Drag
Point to an item, click and hold down the mouse button. Move the mouse
with the button held down, and release the button when the pointer is where
you want it.
1.3 O verview of [S pe ctra M anager]
T he follow ing program s are registered in th e [S pectra M anager] of th e M odel V -500W as standard.
M easu rem ent program s
(1) [Q uantitative m easurem ent] program
T his program creates a calib ration curve by m easuring a standard sam ple w ith know n concentration
according to the com m on quantita tive analysis m ethod and m easures an unknow n sam ple to find its
concentration.
(2) [S pectrum m easurem ent] progra m
T his program obtains the U V /V IS absorptio n spectrum of a sa m ple. T he spectrum m easured by this
pro gram is autom atically transferred to the [S pectra A nalysis] progra m .
(3) [Tim e C ourse M easurem ent] program
T his program m easures the changes in a sam ple w ith tim e at a fixed w avelength. T he tim e course
data obtained by this program is transferred to the [S pectra A nalysis] program .
(4) [Fixed W avelength M easurem ent] program
T his program m easures the absorbance or transm ittance of a sam p le at a fixed w avelength. U p to
Page 16

3
eight w avelengths can be set and m easured.
(5) [A bs/% T M eter] progra m
T his program reproduces the analog spectrophotom eter o n the C R T screen , so you ca n read the
absorbance (A bs) or transm itta nce (% T ) at an arbitrary w avelength on the m eter.
(6) [E nvironm ent] program
T his program sets the system hard w are, does self-diagnosis, sets optional accessories, and
calib rates w avelengths.
A nalysis program
(1) [S pectra A nalysis] program
T his p rogram saves, prints, an d processes (difference spectrum , peak picking, sm oothin g, derivative,
vertical axis conversion, and so on) spectrum data or tim e course data.
(2) [File V iew er] progra m
Y ou u se this program to search fo r a spectrum sa ved on the d isk.
(3) [JA S C O C anvas] program
Y ou use this program to lay out and print spectra, m easurem ent para m eters, com m ents, and so on.
Y ou ca n also create d raw ings an d enter chara cters.
N ote: T his m anual describes the m easurem ent program . F or the A nalysis program , refer to the S pectra A nalysis
P rogram M anual.
Page 17
4
2. Starting and exiting programs and [Spectra Manager]
T his section describ es how to start and exit program s and the [S pectra M anager].
2.1 S tartup
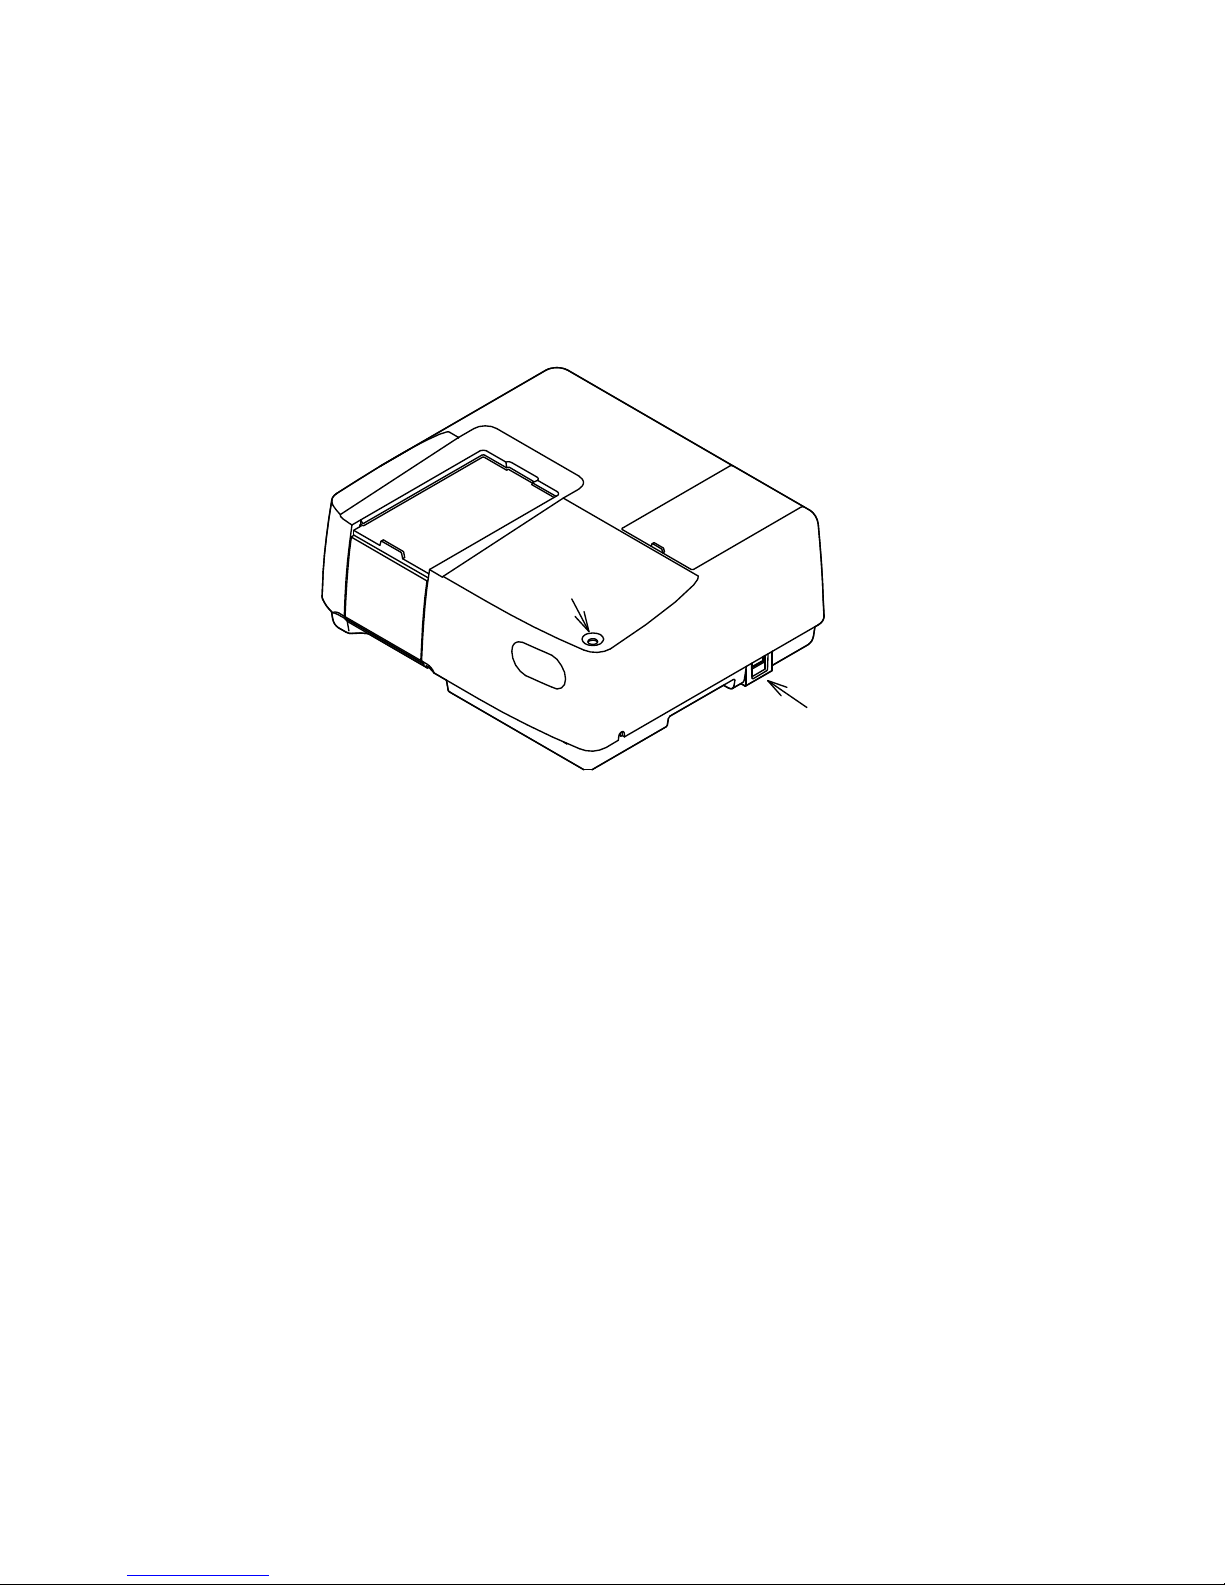
2.1.1 T urning O N the spectropho to m eter
T urn O N the pow er sw itch on the right side of the spectrophotom eter.
"Power" Switch
"Power" Lamp
F igure 2.1 S pectrophotom eter (V -53 0)
W hen the pow er is turned O N , the pow er lam p on the spectrophotom eter is lit.
T he light so urce needs about five m inutes to becom e stable. T hen m easurem ent m ay begin.
2.1.2 P C and W indow sÒ sta rtup
T urn O N the pow er sw itches for the P C and C R T. M icrosoft W indow s should start au tom atically. If
necessary, refer to the M icrosoft W indow s instruction m anual
2.1.3 [S pectra M anager] startu p
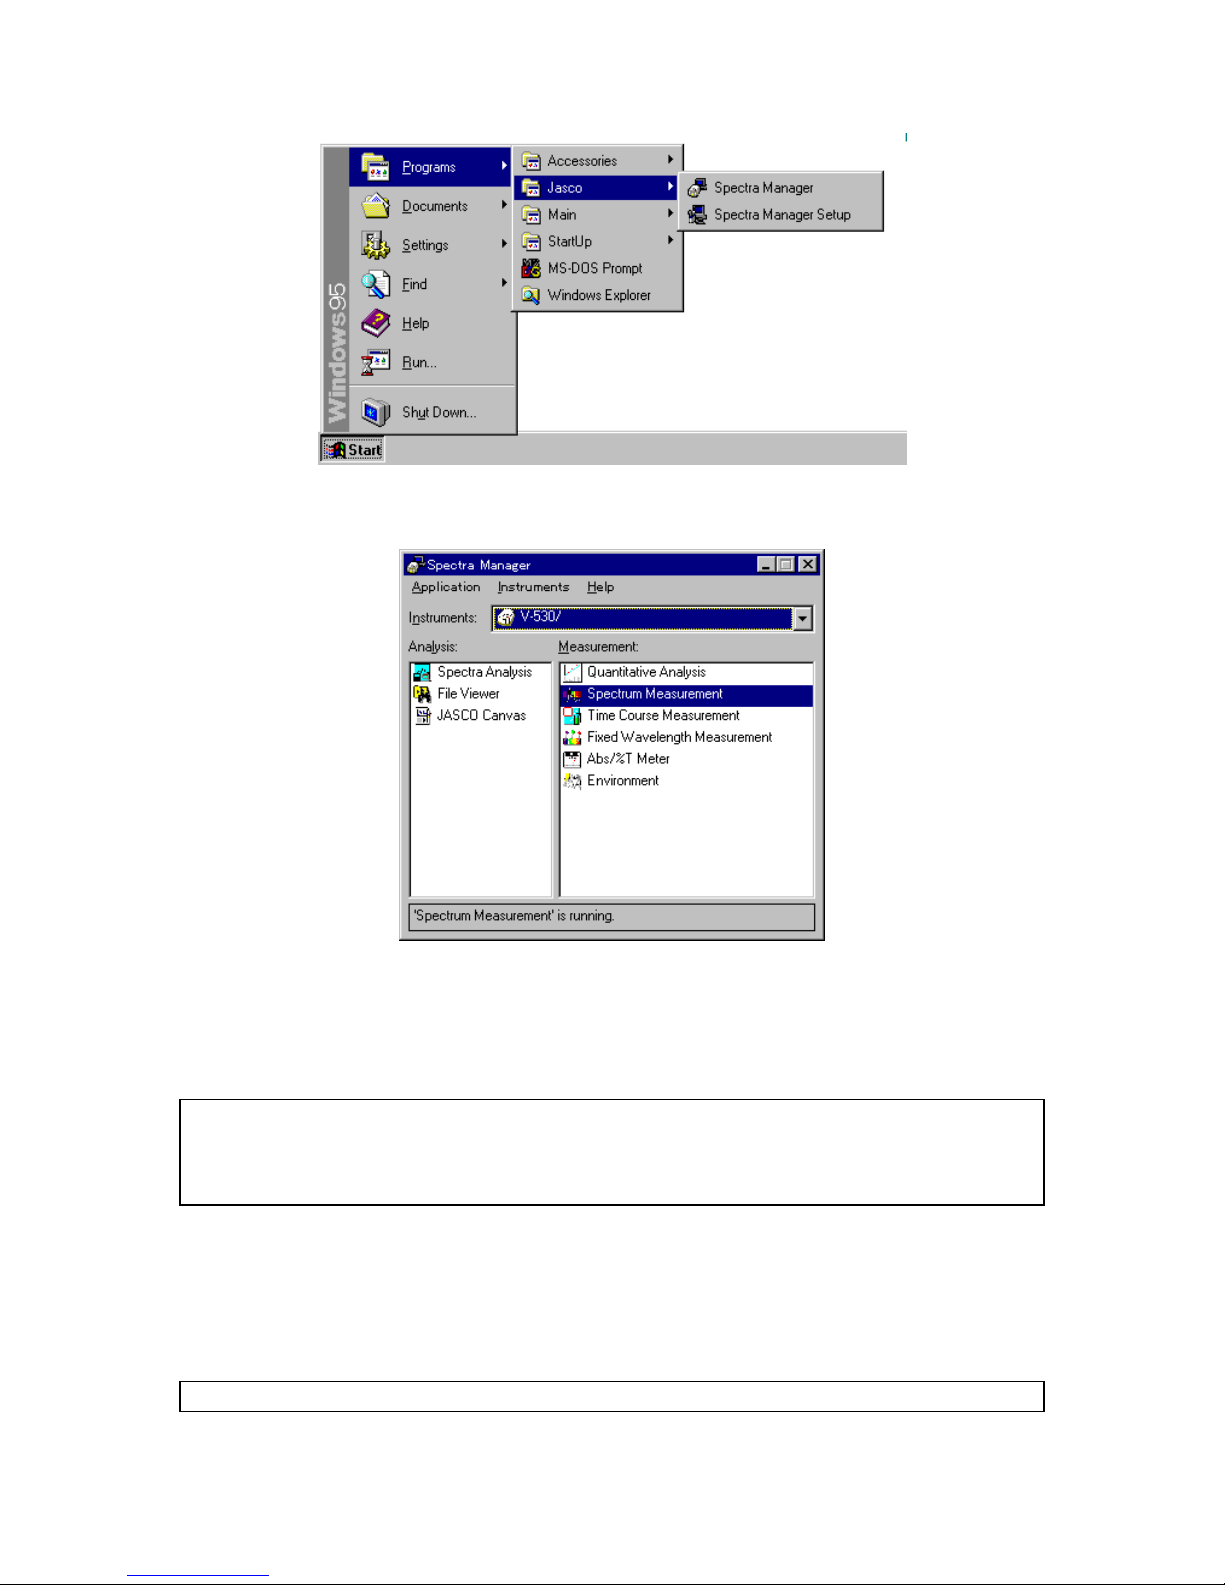
(1) W hen W indo w s is started, [Jasco]-[S p ectra M a nager] also sta rts. (S ee F ig. 2.2.) T he [S pectra
M anag er] w indow app ears. (S ee F ig. 2.3.)
Page 18
5
F igure 2.2 W indow s screen
F igure 2.3 [S pectra M anager] w ind ow
(2) In the [S pectra M anager] w indow , m ake sure th e Instrum ent in the [Instrum ents:] box is the
spectrophotom eter you are u sing. If not, click the arrow at the right side of the box and select the
correct spectrophotom eter. T he w indow changes to the m enu for that spectro photom eter.
N ote: The [S pectra M anager] w indow displays the available program s for the spectrophotom eter. F ig. 2.3 show s
an exam ple of the standard program m enu. If an optional application program has been included, it
w ill also appear in the [S pectra M anager] w indow . S ee S ection 2.3, [S pectra M anager] M enu for a full
explanation.
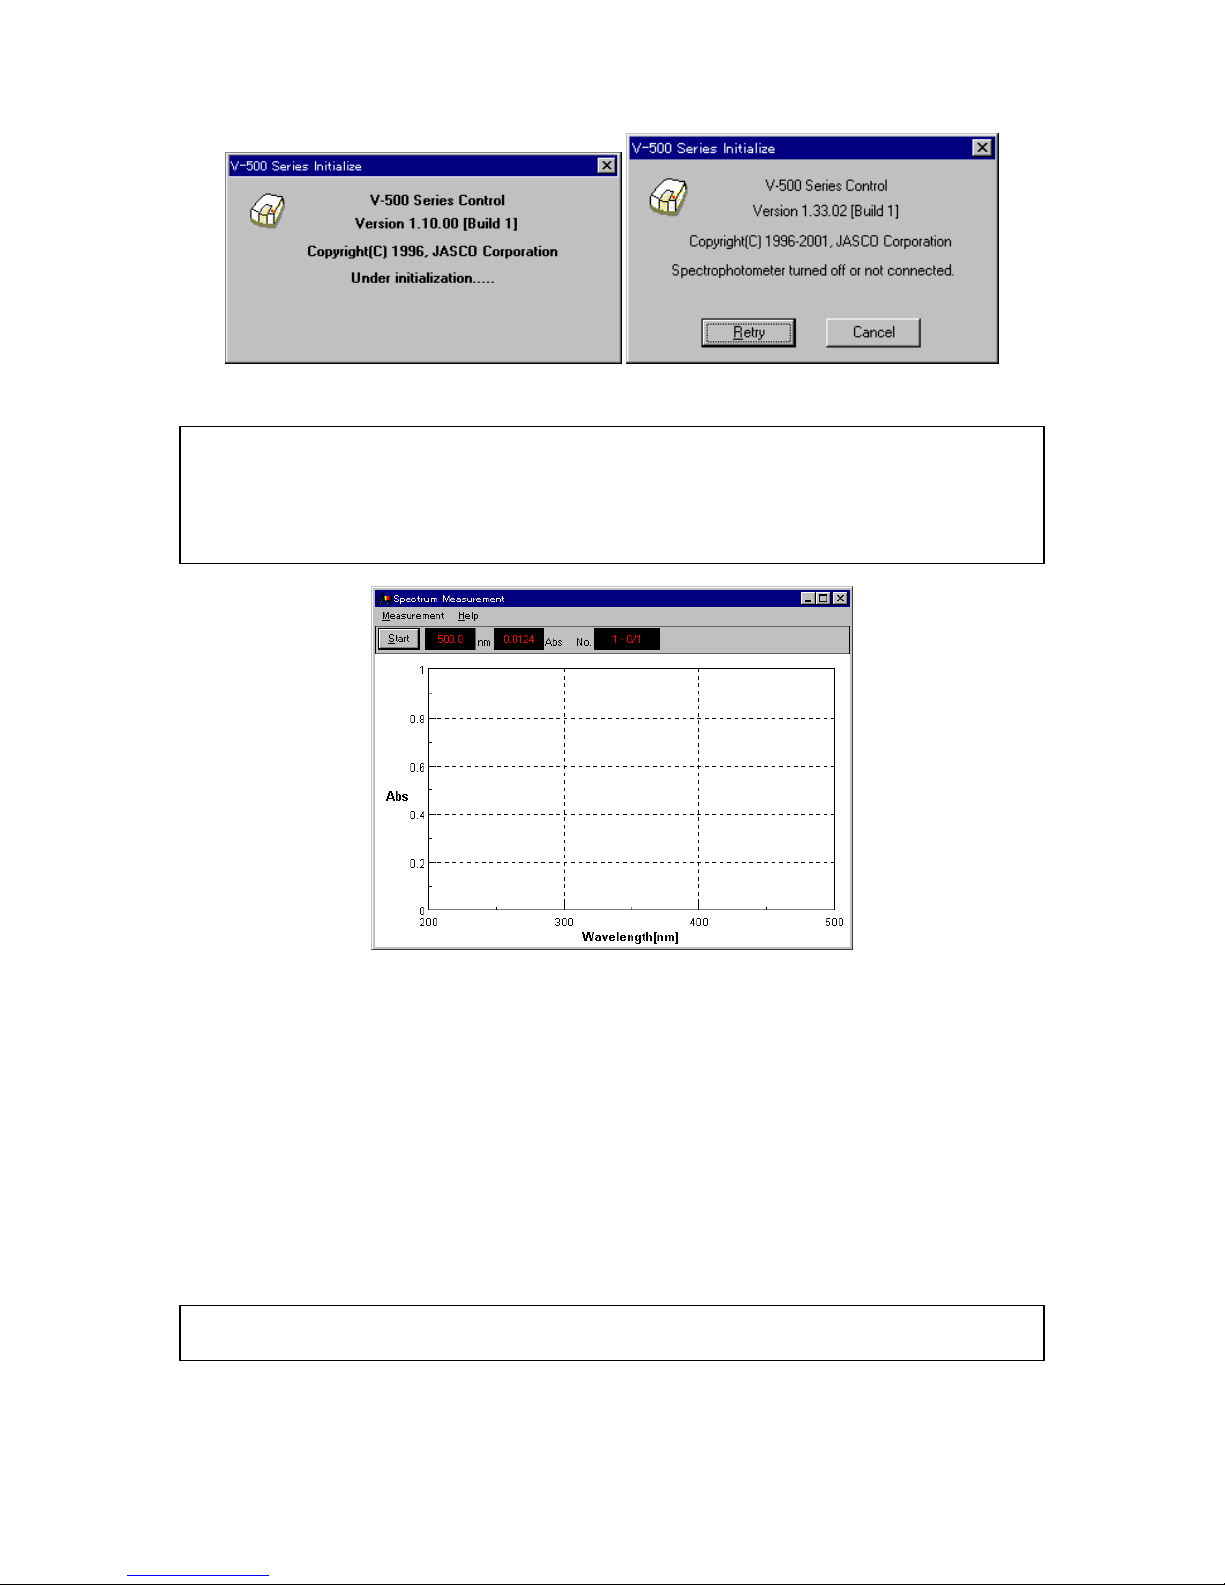
(3) D ouble-click a prog ram on the m enu. T he selected program sta rts and the program w indow appears.
T he spectrophotom eter also starts autom atically, but need s about tw o m inutes to w arm up.
M essag es appea r throughout the procedure. For exam ple, w hen the [S pectrum M easurem ent]
pro gram is started, the [S pectrum M ea surem ent] display show n in F ig. 2.5 appears after the display
show n in F ig. 2.4 appears.
N ote: S ee S ection 3 Introduction for a full description of the M easurem ent program operation.
Page 19
6
F igure 2.4 M essage boxes during startup
N ote: C heck the follow ing if the m essage on the right in F ig. 2.4 appears.
·
P ow er to the spectrophotom eter is turn ed O N .
·
T he spectrophotom eter and P C are correctly interfaced.
·
T he P C environm en t (for exam ple, com m unication po rt) is correctly set.
F igure 2.5 [S pectrum M easurem ent] display
2.2 E xiting
T his section describes how to exit the [M easurem ent] or [A nalysis] program s and how to sh ut dow n the
spectrophotom eter and P C .
2.2.1 E xitin g m easurem ent or spectra analysis program
E nds the [M easurem ent] or [ A nalysis] program and exits it.
(1) E xiting the [S pectra A nalysis] progra m
C lick [F ile] - [E xit]. T he [S pectra A nalysis] w indow closes and the [S pectrum M easurem ent] w indow
appears.
N ote: If a spectrum has not been saved, a m essage appears to inform the operator. P ro ceed according to the
m essage. A m essage appears for each unsaved spectrum . R epeat procedure accordingly.
(2) E xiting the [S pectrum M easurem ent] progra m
C lick [M easurem ent] - [E xit]. The [S pectrum M ea surem ent] w indow closes and the [S p ectra
Page 20

7
M anag er] w indow app ears.
(3) E xiting the [S pectra M anager] program
C lick [A pplications] - [E xit].
(4) E xiting W indow s
E xit W indow s accord ing to the W indow s U ser’s G uid e.
2.2.2 P C an d sp ectropho tom eter shutdow n
(1) Turn O F F the po w er to the P C and display. D o not forget to turn off the disp lay.
(2) C heck that the sam ple cha m ber is em pty. T hen turn O F F the pow er to the spectrophotom eter.
Page 21
8
2.3 [S p e ctra M anager] M enu
T he [S pectra M a nager] is used to start m easurem ent, sp ectra an alysis and en vironm ent setting using the
spectrophotom eter, and selecting, for starting up and shutting dow n the sp ectrophotom eter, as w ell as for
setting the co m m unica tion port.
F igure 2.6 [S pectra M anager] w ind ow
F ig. 2.6 show s the standard [M easurem ent] and [A nalysis] program m enu. W hen addition al progra m s are
installed, they are added to this m enu. The [A nalysis] m enu appears on the left and the [M easurem ent]
m enu appears on the right. D ouble-click a pro gram to start it. If the spectrophotom eter has n ot already been
started , it w ill start tog ether w ith the program .
N ote: If m ultiple instrum ent program s are installed in the P C , select one from the [Instrum ent] list.
M enu
[A pplication] m enu
[A nalysis] S tarts the [A nalysis] program .
[M ea surem ent] S tarts the [M ea surem ent] program .
[E xit] E xits the [S pectra M anager] w indow and returns to W indow s.
N ote: The progra m can also be started by double-clicking the m enu item .
[Instrum ents] m enu
[S tart] Initializes the spectrophotom eter and starts com m unication. Initializa tion
takes about tw o m inutes. T his o peration is usually not necessary because
the spectrop hotom eter starts autom atically w hen the [M easurem ent]
pro gram is started.
[S top] S tops com m unication w ith the sp ectroph otom eter. T his o peration is
usually not necessary because com m unicatio n w ith the
spectrophotom eter stops auto m atically w hen the [M easurem ent] program
is exited.
[P ort S etting...] C hanges the com m unication port w ith the spectrophotom eter. [C O M 1] is
the default serial port for V -500W . S ee S ection 10.2 S etting the S erial P ort
(R S -232C ).
Page 22

9
[O ption...] Install the optio nal accessory (R efer to the accessory instruction m anual).
[A bout...] D isplays the version inform ation of the control driver of the
spectrophotom eter.
[H elp] m enu
[C ontents] D isplays the help C ontents w indow .
[S earch T o pic] D isplays the keyw o rd w indow .
[A bout...] D isplays the version inform atio n o f the control program of the
spectrophotom eter.
[S ystem inform ation ...] D isplays the system inform atio n.
Page 23
10
3. Quantitative Analysis and Spectrum Measurement
T his section describes qu antitative analysis and spectrum m easurem ent. The param eters are describ ed
only briefly in order to clarify th e operation flow . F ollow the procedures outlined below in order to becom e
fam iliar w ith the operation of V -500W . F or m o re detailed inform ation, see the section for each program .
3.1 Q uantitative A nalysis Introduction
T he follow ing sectio ns briefly describ e the quantitative analysis program and its operation flow , follow ed by
the procedure for creating calibration curves, unkno w n sam ple m easurem ent, and saving and printing
results.
3.1.1 Q uantitative analysis program overview
3.1.1.1 Quantitative analysis program
T he q uantitative analysis program has the follo w ing features.
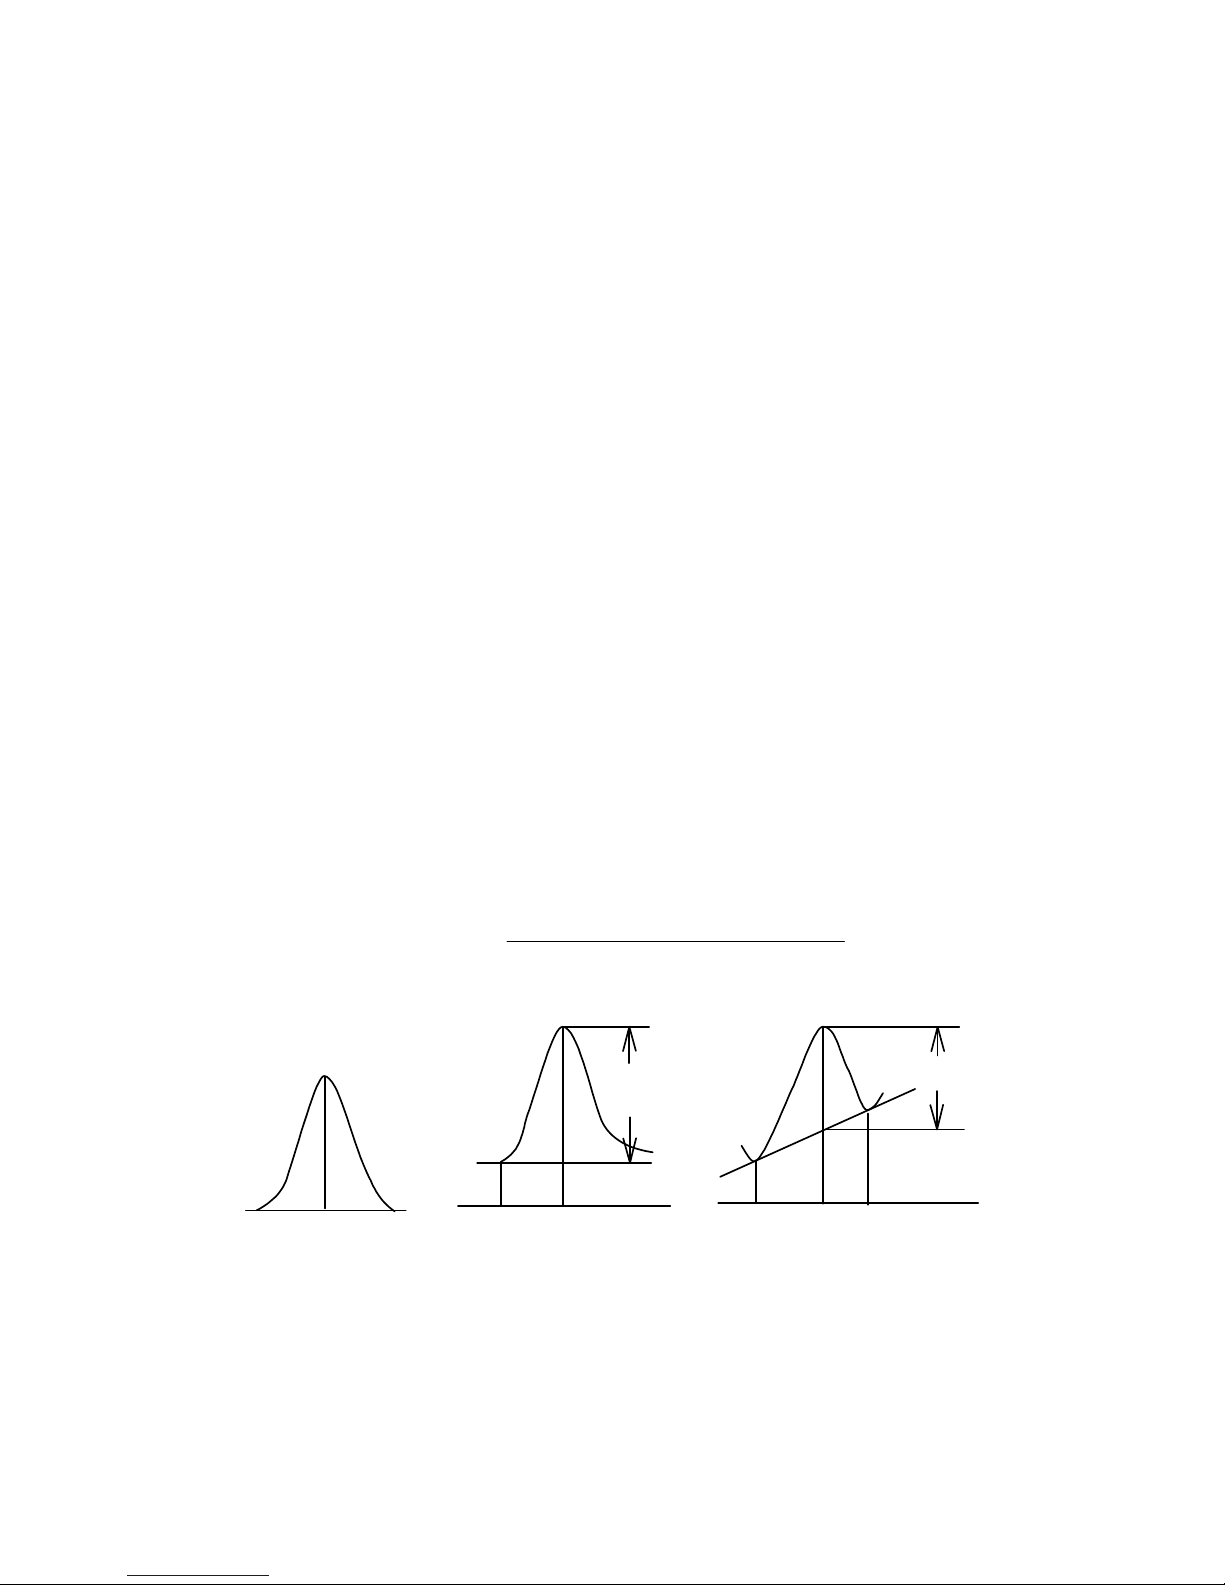
(1) T hree m ethods of analysis outlined.
1) 1-w avelength quantitative analysis. F ig. 3.1 (1).
U sed for norm al solution sam ple.
2) 2-w avelength quantitative analysis. F ig. 3.1 (2).
U sed for baseline correction.
3) 3-w avelength quantitative analysis. F ig. 3.1 (3).
U sed for baseline correction.
T he follow ing form ula is used for 3-w avelength quantitative analysis. W L1 is the w avelength and E
(1) the abso rbance at that w avelength.
DAbs E
WLWLEWLWL
E
WL WL
= -
-×+-×
-
( )
||()||(
)
| |
1
12331
2
3 2
WL 1 WL 1WL 2
D Abs
D Abs
WL 1WL 2 WL 3
E(2)
E(1)
E(3)
(1) (2) (3)
1-wavelength
2-wavelength 3-wavelength
(Peak) (Base 1) (Peak) (Peak)(Base 1) (Base2)
F igure 3.1 Q uantitative analysis m ethods
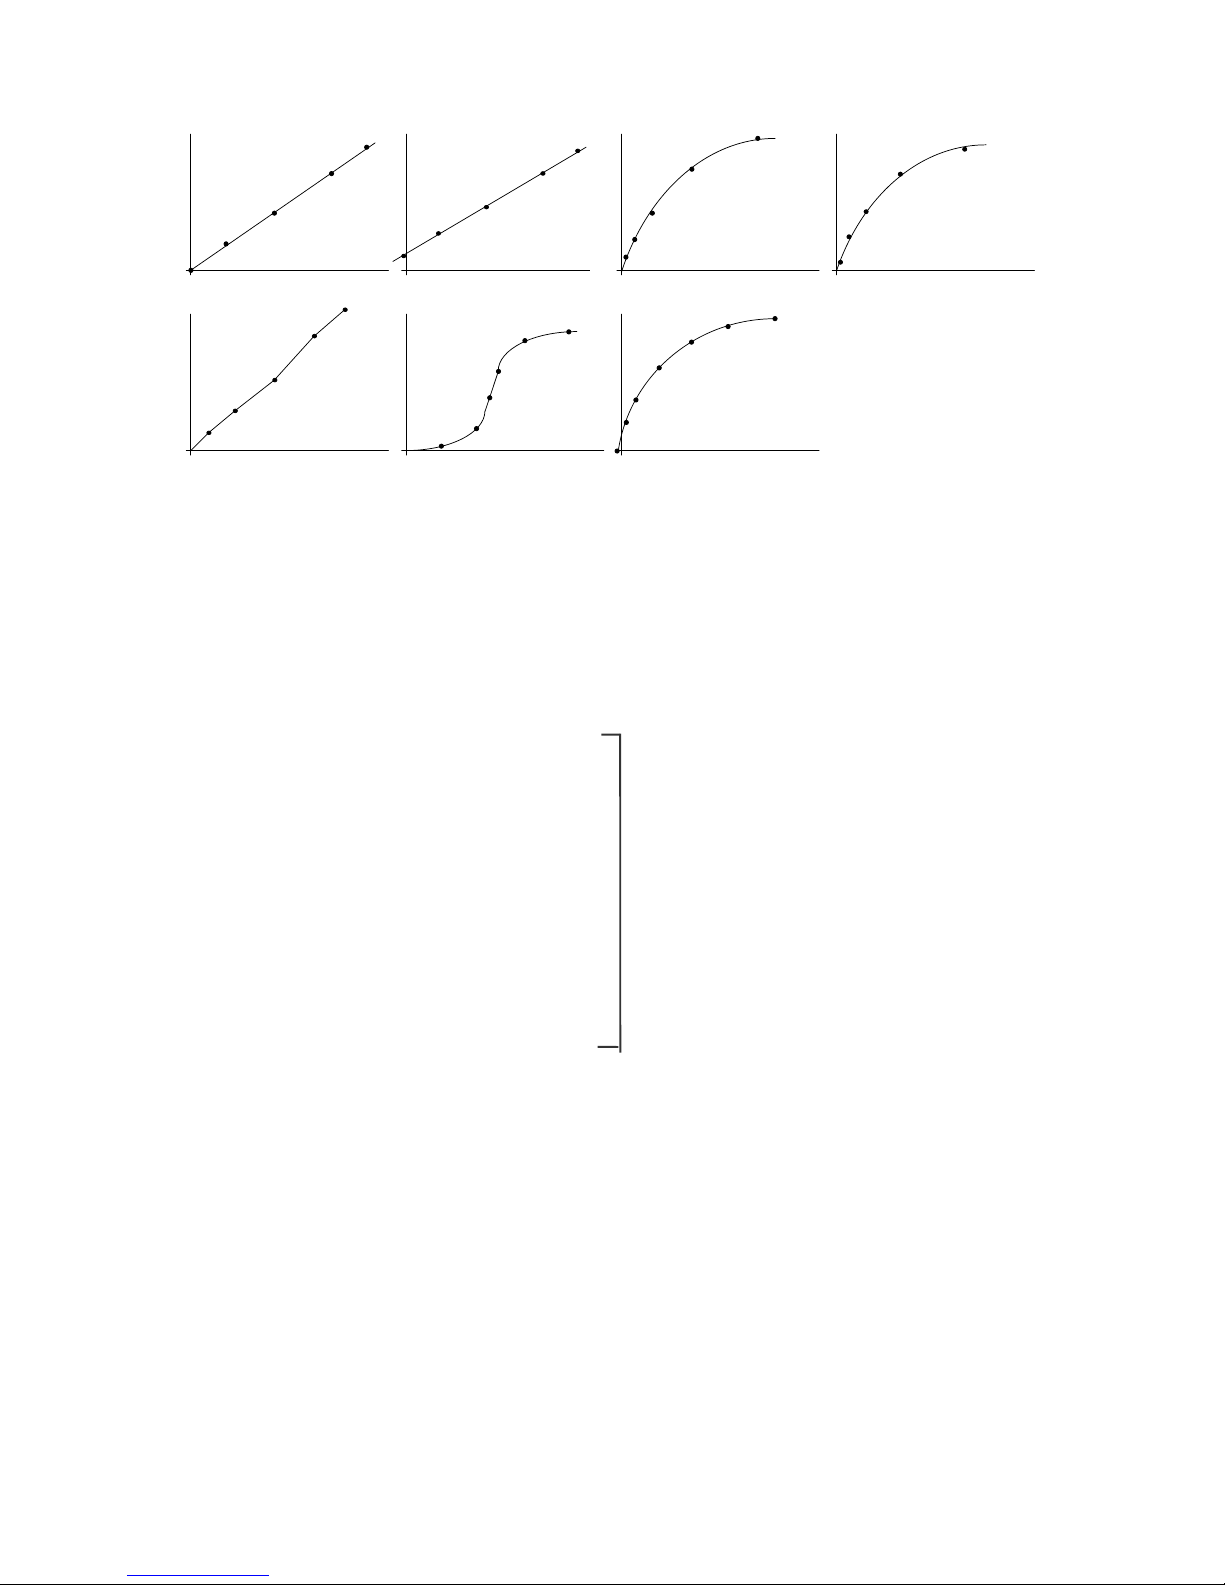
(2)
T he ca libratio n curve can be selected from the m od es show n below , accord ing to the a pplica tion.
Page 24
11
Segmented line Logistic function
Spline function
Proportional expression
Linear expression Quadratic expression
Third-order expression
F igure 3.2 C alibration curve m odes
(3) T h e operator can set w h ether to use standard m ea surem ent data (set of co ncentration/absorb ance)
to calculate the calibration curve.
3.1.1.2 Quantitative analysis operation
S tart quantitative analysis program S ee S ection 3.1.2
¯
C reate file
¯
S et quantitative analysis m ethod
and m easurem ent param eters
¯
S et calibration curve param eters
and input standard sam p le concentration S ee S ection 3.1.3
¯
M easu re standard sam ple blank
¯
M easu re standard sam ples
¯
D isplay calibration curve
¯
M odify (check and correct) calibration curve S ee S ection 3.1.4
¯
S ave calibration curve S ee S ection 3.1.5
¯
M easu re unknow n sam ples S ee S ection 3.1.6
¯
S ave results S ee S ection 3 .1.7
¯
P rint R esults S ee S ection 3.1.8
¯
E xit quantitative analysis program S ee S ection 3.1.9
3.1.2 P rogram startup
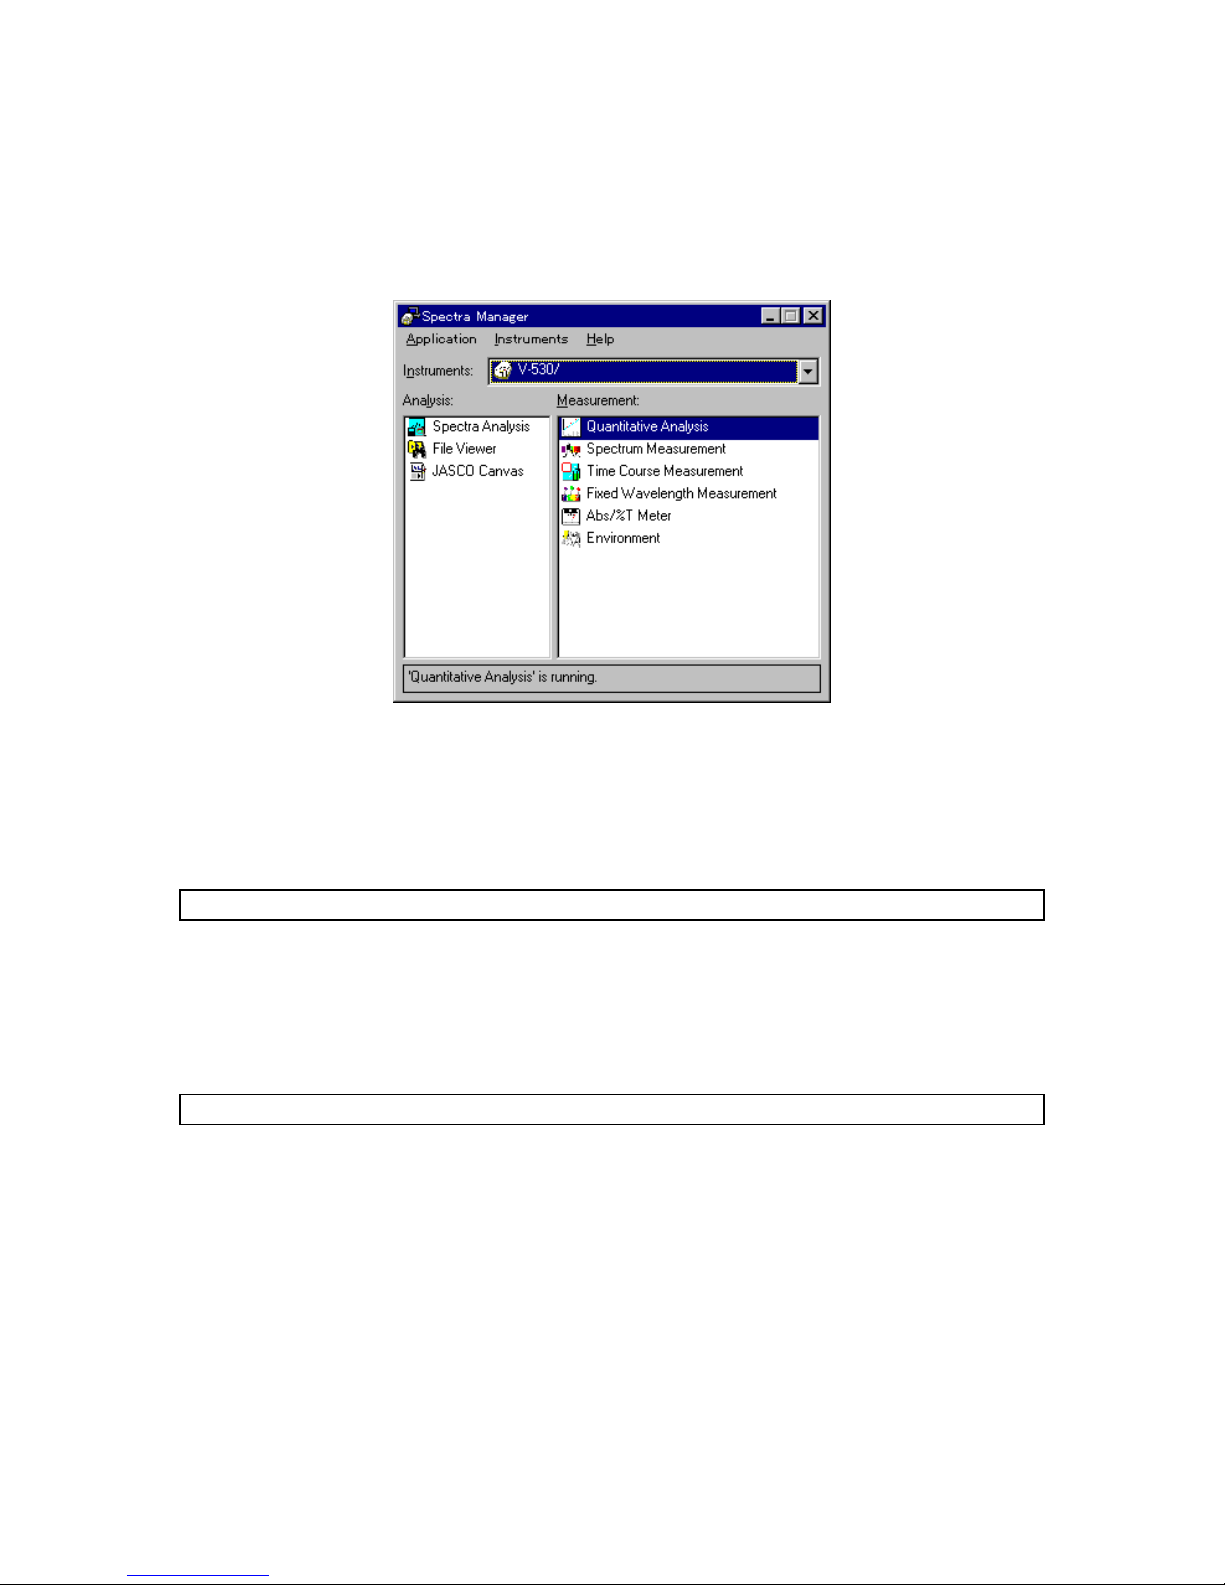
In the [S pectra M a nager] w indow , double-click [Q uantitative A nalysis].
Page 25
12
T he m essage U N D E R IN IT IA LIZ A TIO N appears and m easurem ent param eters are transferred to the
spectrophotom eter. W hen transfer is finished, the pro gram starts and th e follow in g w indow appears.
F igure 3.3 [Q uantitative an alysis] w indow
3.1.3 C alibratio n curve creation
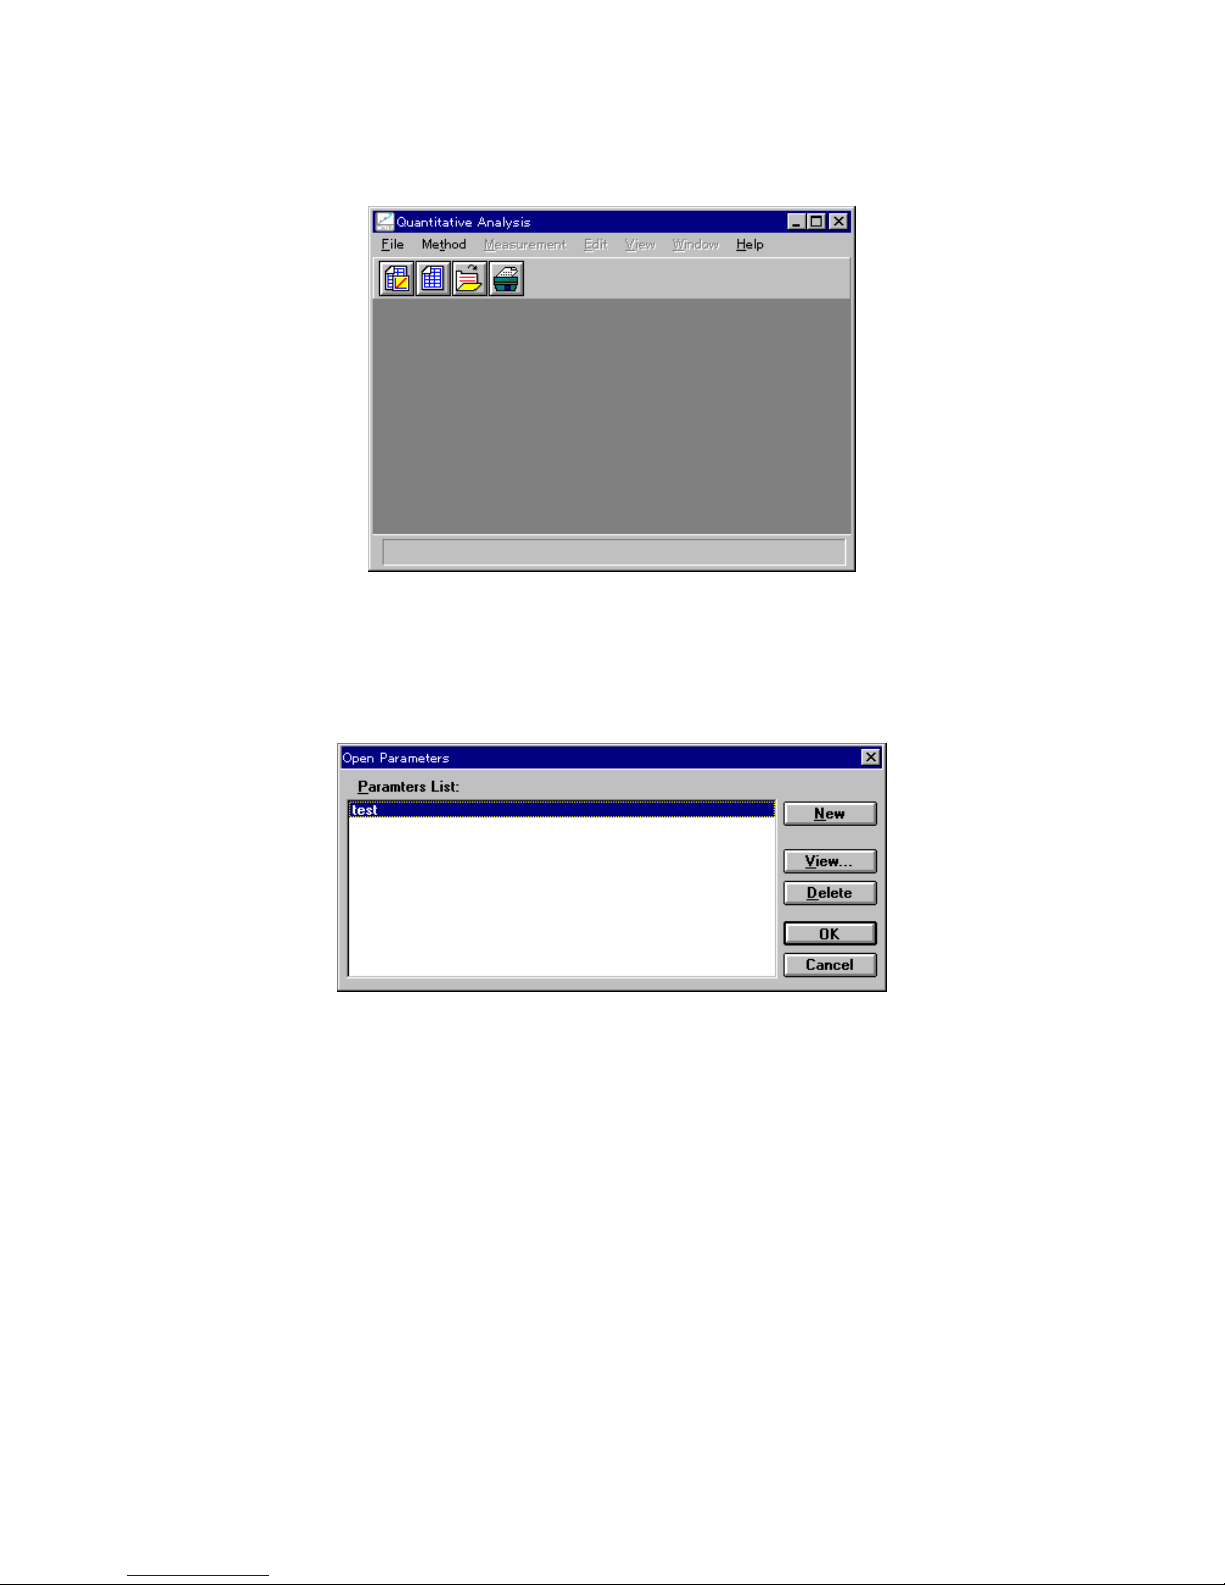
(1) C lick [F ile] - [N ew ...]. T he follow ing dialog box appears.
F igure 3.4 [O pen P aram eters] dia log box
Page 26
13
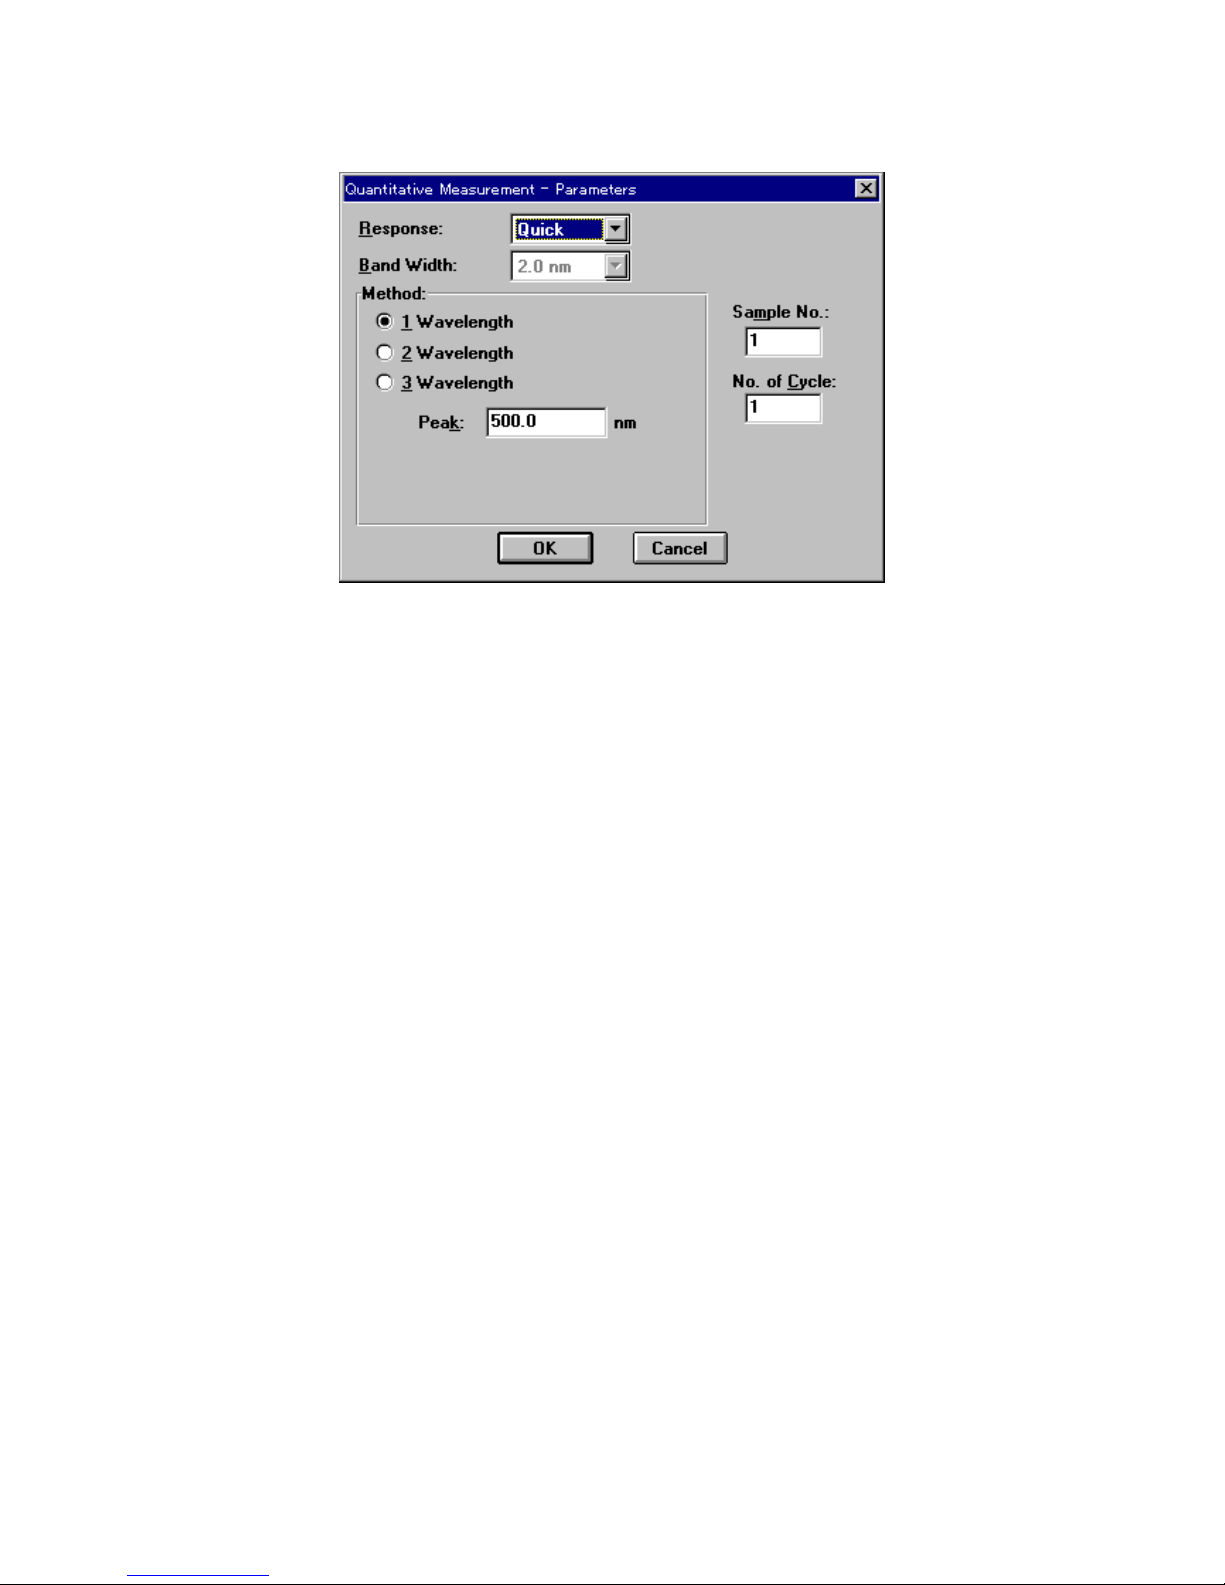
(2) C lick <N ew > to open the follow ing dialog box.
F igure 3.5 [Q uantitative M easurem ent P aram eters] dialog b ox
(3) C hanging m easurem ent para m eters procedu re
T he [Q uantitative M easurem ent P aram eters] dialog box displays the instrum ent d efau lt
settings. T he follow ing param eters m ay be changed.
R esponse: F ast
M ethod: 1 W avelength
P eak w avelength: X X X nm
1) [R esponse] is a drop-dow n list box. C lick the arrow to the right of the box to display the full list
of options. T o select [F ast] response, click [F ast].
C hange other param eters if necessary.
2) C lick the [1-w avelength] option button of the [M ethod] group to select this m ethod. T he bu tton
becom es filled in [·]. N ext, use the num ber pad to input the peak w avelength of the standard sam ple
into the [P eak] text box.
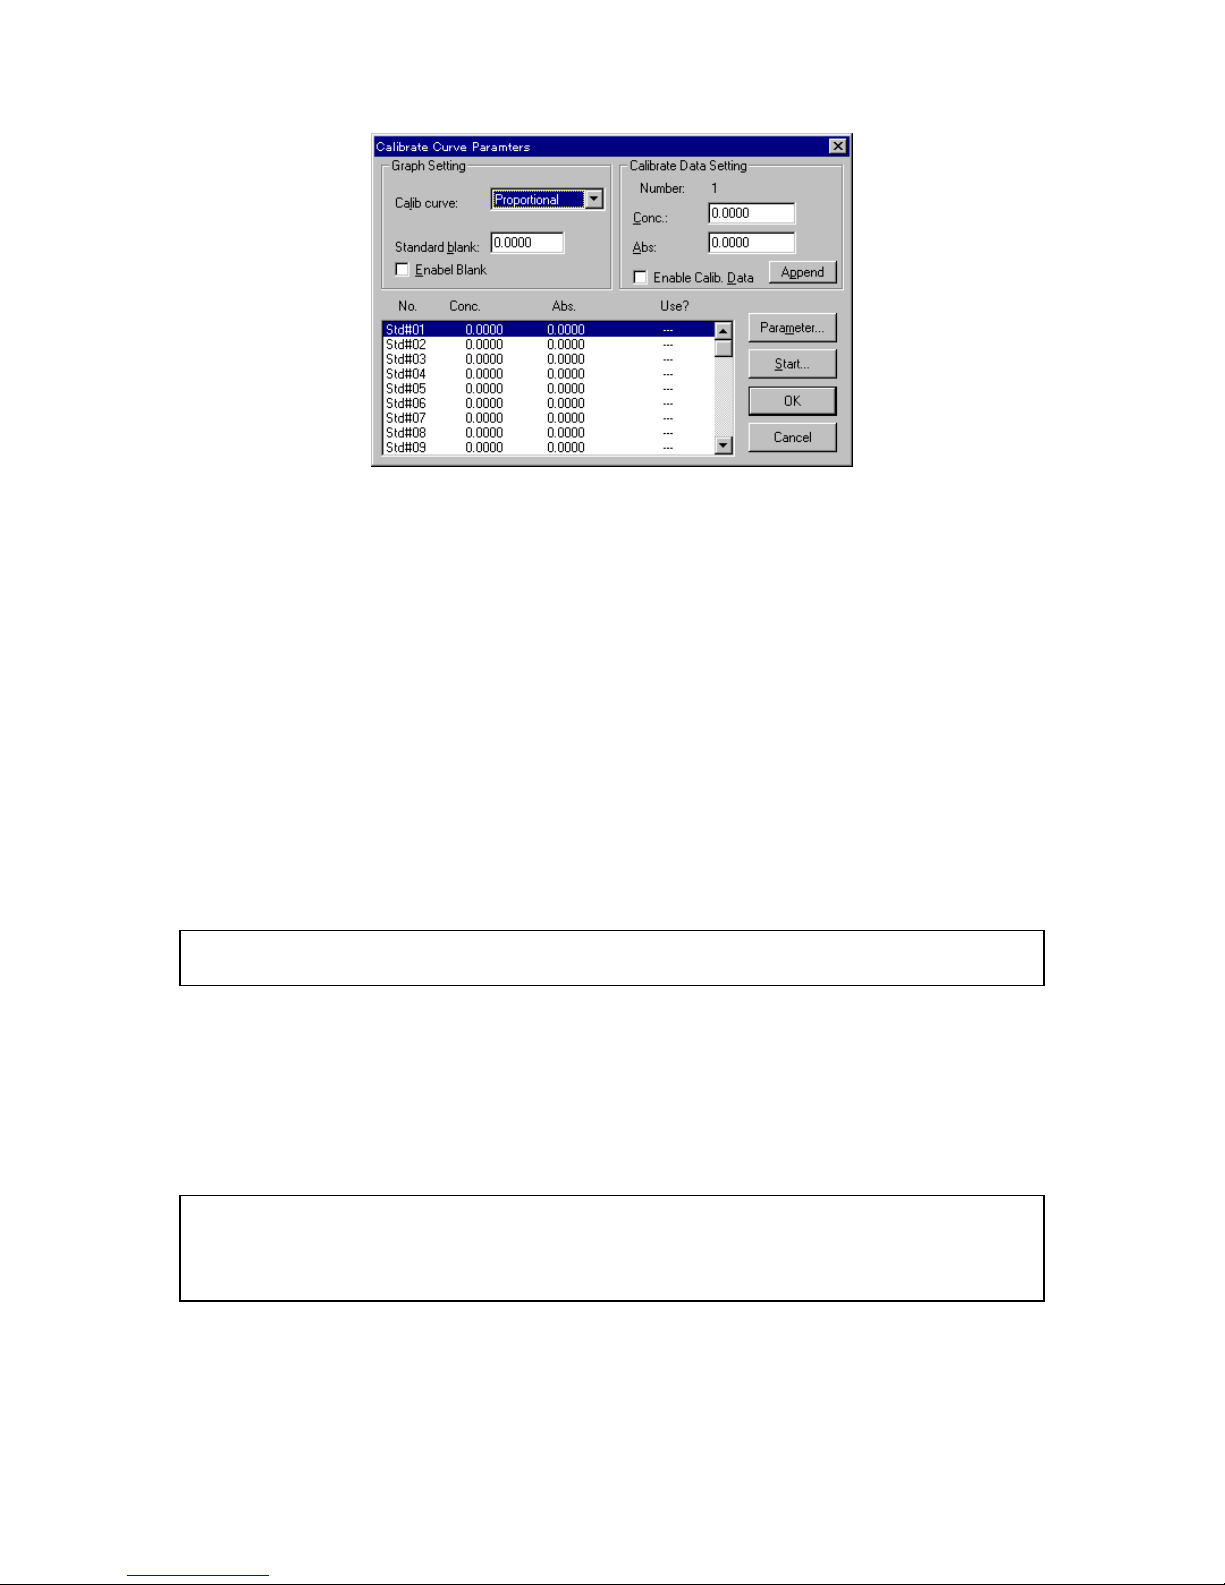
(4) C lick <O K > to transfer the m easurem ent para m eters to the spectrophotom eter. W hen transfer is
finished, the [C alibrate C urve P aram eters] dialog box appears. Y ou can set the calibration curve
param eters and input th e concentration of th e standard sam ple.
Page 27
14
F igure 3.6 [C alibrate C urve P ara m eters] dialo g box
(5) C alibration curve para m eter setting
1) S et [C alib . curve] to [P ro portional]. U se the sam e procedu re as for changing param eters
2) If [S tandard blank] is know n, input tha t value to the text box. If the [S tandard bla nk] is
unknow n, it w ill be m easured later. In that case, steps 2) and 3) are not necessary.
3) S elect the [E n able B lank] checkbox. T he ch eckbox is m arked w ith an [x].
(6) Inputting concentration
1) C lick the [S td#01] line of the standard data display field. The cursor m o ves to that line.
2) Input concentratio n to the [C onc.] text box of the [C alibrate D ata S etting] group. C lick
<A ppend>. T he concen tration appears in th e standard data display field and the cursor m oves to the
next line autom atically.
N ote: If the absorbance of the standard sam ple is know n, m easuring the standard sam ple is not necessary.
In put the absorbance, then select the [E nable C alib. D ata] checkbox. C lick < A ppend>.
3) R epeat step 2 ) as m any tim es as the num ber of standard sam ples.
4) C lick the [S td#01] line in the data display field. The cursor returns to line 1.
(7) C lick < S tart...> . T he [Q uantitative M easurem ent] dialog box opens. T he standard b lank and standa rd
sam p les are m ea sured.
N ote: The [Q uantitative M easurem ent] dialog box appears on top of the [C alibrate C urve P aram eters] dialog
box. T o view the [C alib rate C urve P aram eters] dialog box, click and drag the title bar of the [Q uantitative
M easurem ent] dialog box. B oth dialog boxes are active. T he calibration curve param eters can be
changed according to steps (5) and (6).
Page 28

15
F igure 3.7 [Q uantitative M easurem ent] dialog box
(8) M easuring the standard blank
1) S elect the [B lank] option button.
2) Place the standard blank in the cell holder of the sam ple cham b er. T he cell holder is on the
near-side.
Sample Chamber
F igure 3.8 S am ple cham ber
3) C lick < S tart> . T he standard blank is m easured. T he value autom atically app ears in th e
[S tandard blank] text box of the [C alib rate C urve P aram eters] dialog box and the [E nable B lank]
checkbox becom es selected.
N ote: W hen <O K > is clicked and the [C alibrate C urve P aram eters] dialog bo x is closed, th e standard blank
valu e is subtracted from the abso rbance value of the standard sam ple. T he standard blank and standard
sam ple can be m easured in any order.
(9) S tandard sam ples m easurem ent
B efore m easuring the stand ard sam ples, check that the curso r is positioned at the first line of the
standard data display field . C lick the [S td#01] line to m ove the cursor to the first line.
1) S elect the [S tandard] option button.
2) P lace standard sam ple N o. 1 in the cell holder.
3) C lick <S tart> . The standa rd sam ple is m easured. The abso rbance value appears
autom atically in the standard da ta displa y field of the [C alibrate C urve P aram eters] dialog box. T he
Page 29
16
[U se] field changes from [---] to [U se]. T he cursor autom atically m oves to the next line.
N ote: The sta ndard blank value is not subtracted from th e absorbance in the standard data display field .
4) R epeat steps 2 ) an d 3) as m any tim es as the num ber of standard sam ples.
5) A fter stand ard sam ple m ea surem ent, click <C lose> to close the [Q uantitative M easurem ent]
dialog bo x.
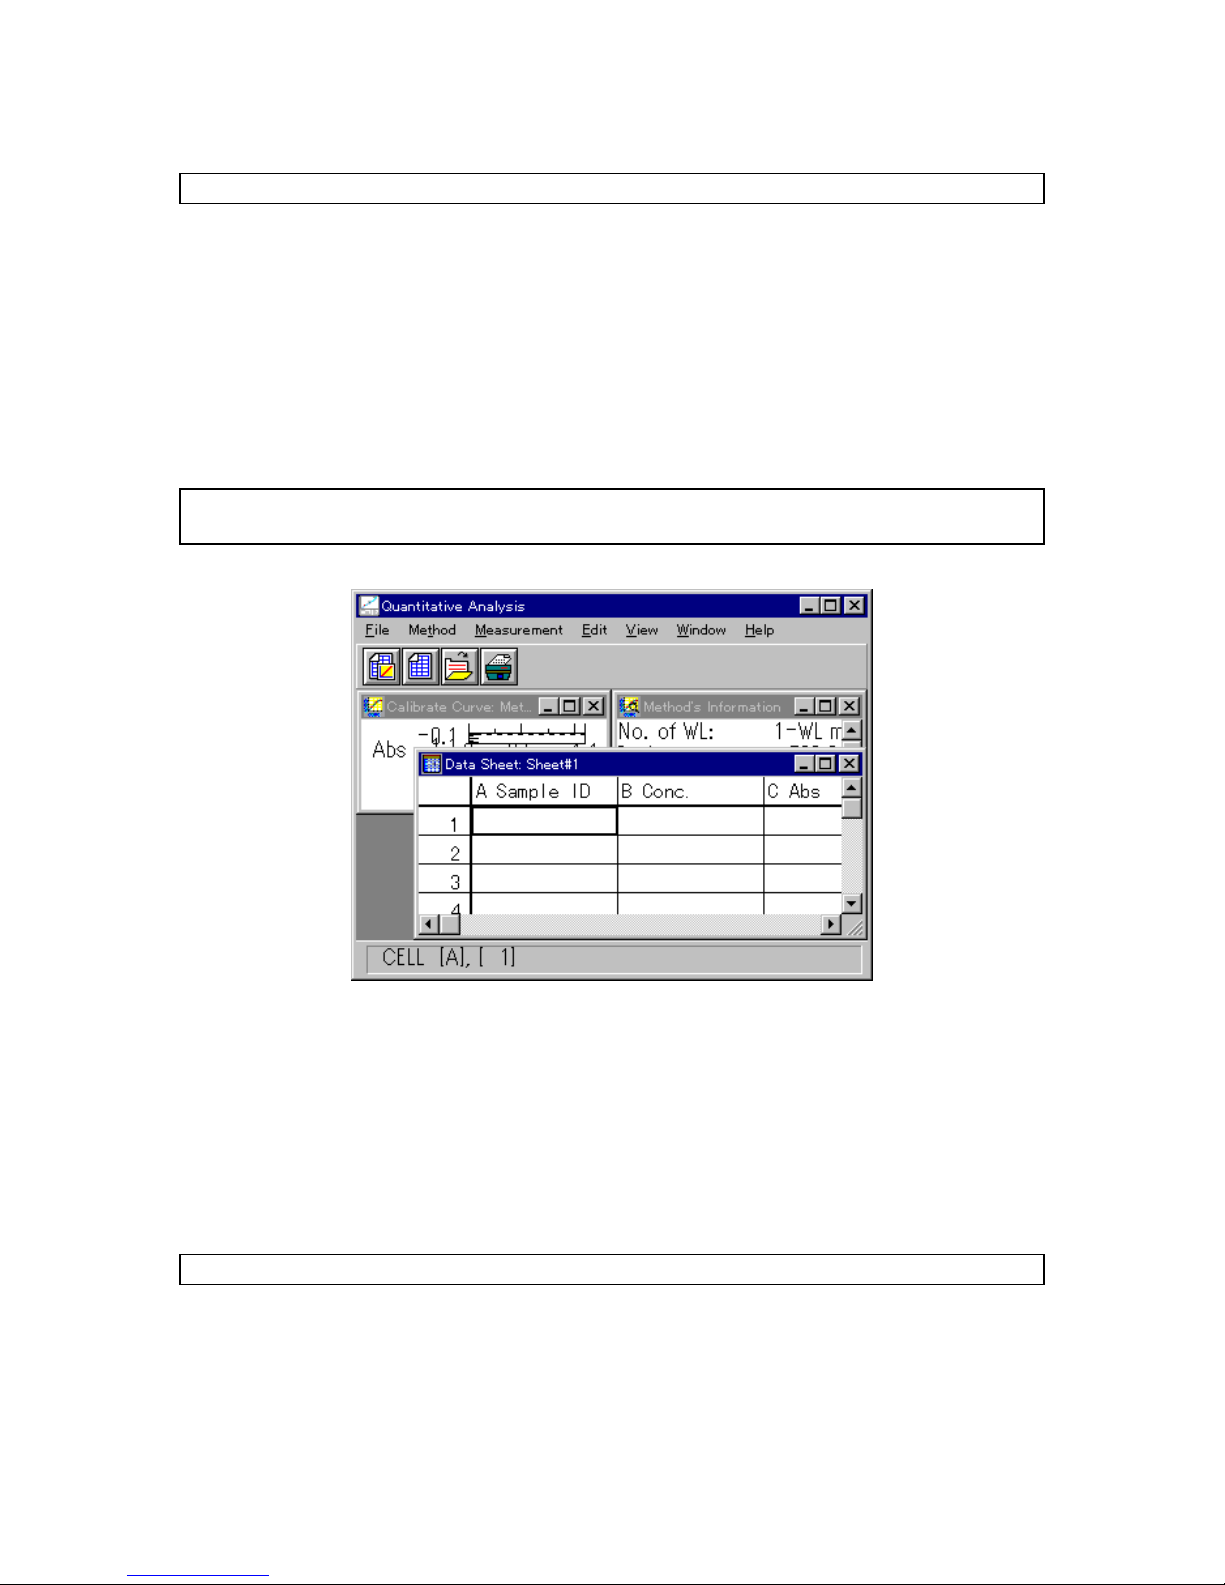
(10) D isplaying the calibration curve
C lick < O K > in the [C alibration C urve P aram eters] dialog box. T he standard blank value is subtracted
from the absorbance value of the standard sam ple an d the [C alibrate C urve] w indow o pens. A t the
sam e tim e, the [M ethod Inform ation] and [D ata sheet] w indow s open.
N ote: If a calibration curve is created by clicking [M ethod] - [N ew ], only the [C a librate C urve] and [M ethod
In form ation] w indow s open.
F igure 3.9 [D ata S heet] w indow
3.1.4 C alibratio n curve m odification
C lick the title bar of the [C alibra te C urve] w indow to activate it. T he calibration curve can be confirm ed. If the
calib ration curve m ust b e changed, click [M etho d] - [M odify...]. The [C alibrate C urve P aram eters] dialog box
opens (S ee Fig. 3.8).
C alibration curve param eters can be changed accordingly, and then the standard sam ple can be
re-m easured. D ata can be also invalidated rather than continuing w ith m ea surem ent.
N ote: The calibration curve cannot be m odified after m easuring an unknow n sam ple.
(1) R e-m easurem ent
1) M ove the curso r to the incorrect data line.
2) C lick <S tart...> to open the [Q uantitative M easu rem ent] dialog box. R epeat standard sam ple
m easurem ent.
Page 30
17
(2) Invalidating
1) M ove the curso r to the incorrect data line.
2) U nselect the [E nable C alib. D ata] ch eckbox, a nd th en click <A ppend> . T he [U se] cha nges to
[---].
3.1.5 S aving qua ntitative a nalysis m ethod
S ave to disk th e qu antitative an alysis m ethod (calibration curve data) and the m easurem ent param eters.
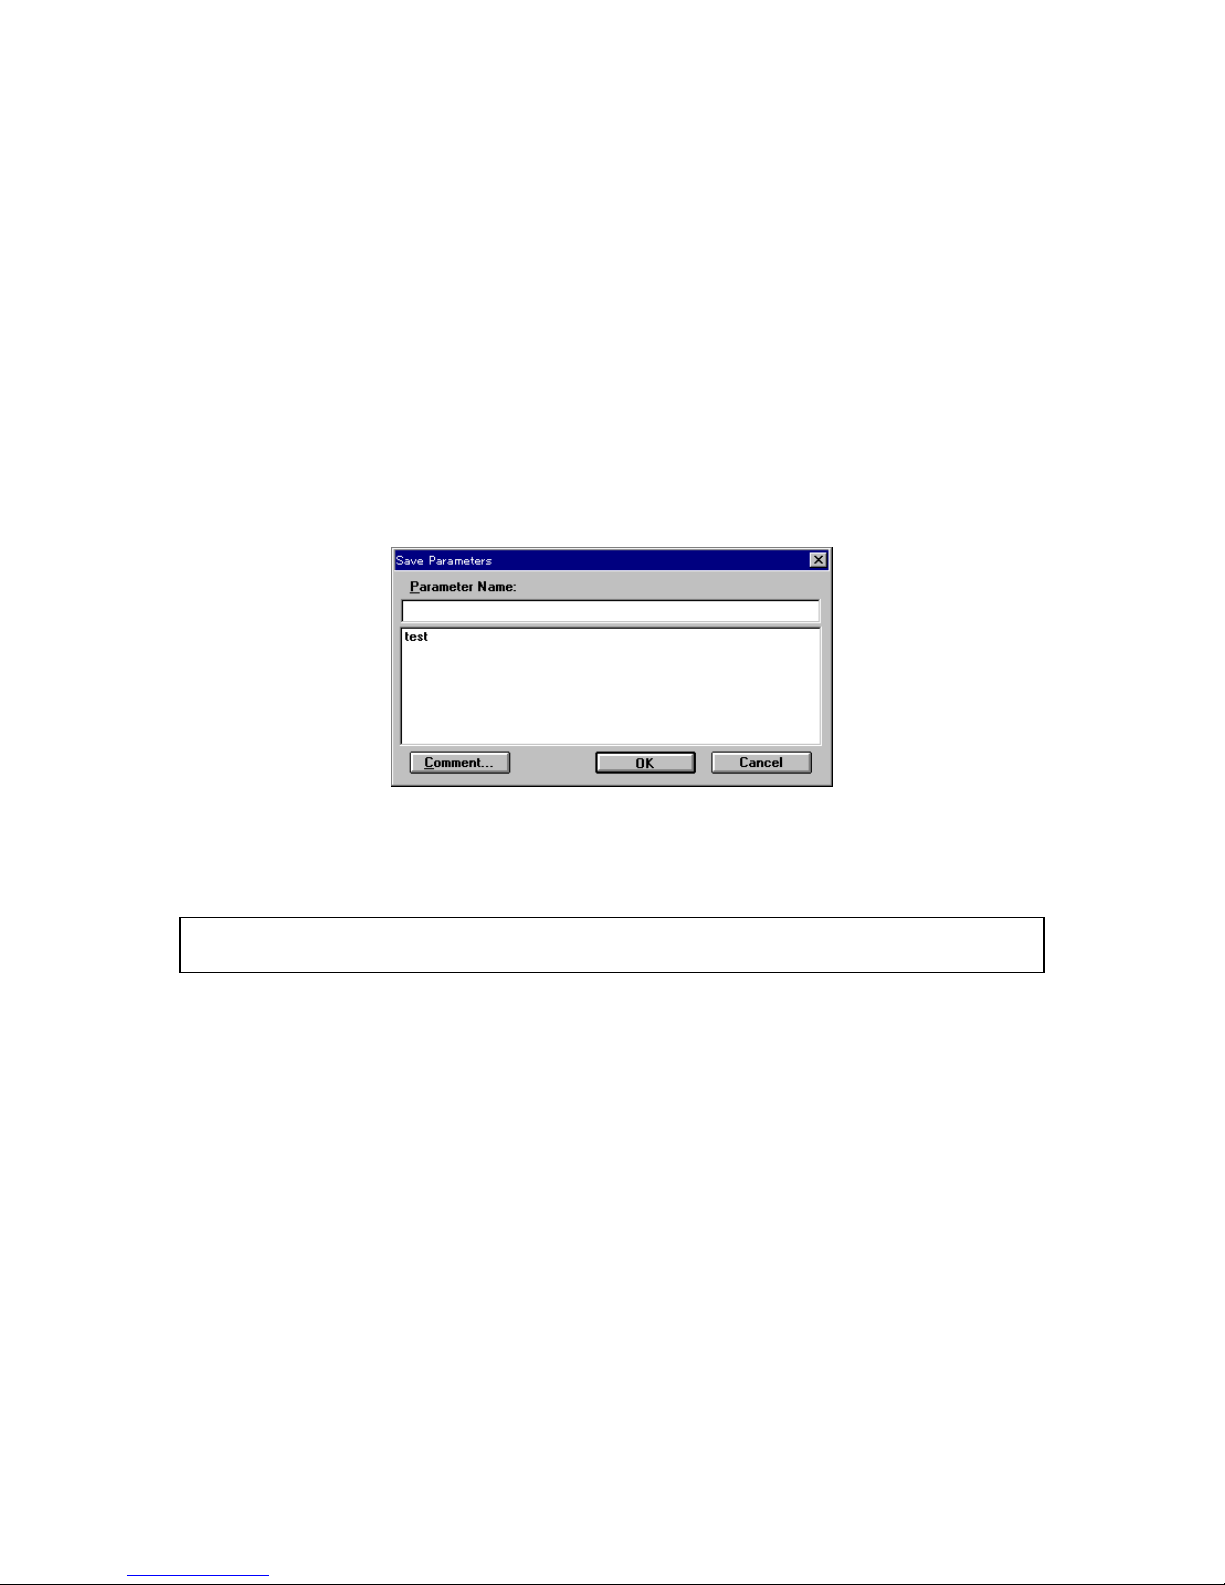
(1) C lick [M ethod] - [S ave A s...]. T he follow ing dialog box appears.
F igure 3.10 [S ave P aram eters] dialog box
(2) Input a filenam e to the [P aram eter N am e] text box. T he filena m e m ay conta in up to 32 characters. A
m axim um of 32 calibra tion curve files m ay be input.
N ote:
C lick < C om m ent...> to open the [C om m ents] dialog box. S am ple nam e, operator, and orga nization can
be input if necessary.
(3) C lick <O K > to save the quantitative analysis m ethod onto the d isk.
Page 31

18
3.1.6 U nknow n sam ple m easurem ent
(1) C lick [M easurem ent] - [M easurem ent...]. T he follow ing dialog box appears.
F igure 3.11 [Q ua ntitative M easurem ent] dialog box
(2) S am ple blank m easurem ent
M easu re the sam ple blank according to the follow ing procedu re. If the sam ple b lank is n ot m easured,
the stan dard sam ple blank value is used as the sam ple blank value.
N ote: The sam ple blank value can be confirm ed by clicking [M easurem ent] - [B lank C orrection].
1) S elect the [B lank] option button.
2) P lace the sam ple blank in the cell holder of the sam ple cham ber.
3) C lick <S tart>. The sam ple blank is m easured. T he resu lts appear on the [D ata S heet].
(3) S am ple m easurem ent
1) S elect the [S am p le] option bu tton.
2) P lace the sam ple in the cell holder
3) C lick < S tart> . T he sam ple is m easured and concentration is calculated from the calibra tion
curve displayed in the w indow . T he results appear on the [D ata S heet].
4) R epeat steps 2 ) an d 3) as m any tim es as the num ber of sam ples.
N ote: The sam ple blank is subtracted from the absorbance value of the sam ple w hen calculating concentration.
T he sam ple blank can b e re-m easured d uring sam ple m easurem ent. T he blank value is valid for
subsequent sam ple m easurem ents.
<<R e-m easurem ent>>
T o re-m easure a sam ple, m ove the cursor to the line in the [D ata S heet] w indow . R ep eat m easurem ent. T he
previous data is autom a tically overw ritten. Follow ing sam ple re-m easurem ent, m easurem ent resum es at
the next sam ple num ber. In ord er to resum e m easurem ent at a specific sam ple num ber, do one of the
follow ing procedures.
C lose th e [Q u antitative M easurem ent] dia log box before m easurem ent. C lick [M easurem ent] -
[P aram eters...] to op en the [Q uantitative M easurem ent - P aram eters] dialog box. In put the sam ple
num ber.
A fter m easurem ent, rew rite the data using the data sheet m odifyin g function (see S ection 4.4,
“
[E dit] m enu”).
Page 32

19
N ote: The line w ith the incorrect m easurem ent can be invalidated (see S ection 4.4.4, “[T itle...]”).
3.1.7 S aving data sheet
S ave to disk th e da ta sheet and quantita tive analysis m ethod.
(1) C lick [F ile] - [S ave A s...] to op en the follow ing dialog box.
F igure 3.12 [S ave A s] dialog b ox
(2) Input a filenam e to the [F ile N am e] text box. U p to 8 characters can be inp ut. T he extension is not
necessary (after the “.”).
N ote: C lick <C om m ents...> to open the [C om m ents] dialog box. S am ple nam e, operator, and organization can
be input if necessary.
(3) C lick <S ave> to save the d ata sheet to disk.
3.1.8 P rinting resu lts
P rint quantitative analysis data using a printer.
(1) C lick [F ile] - [P age S etup...]. T he follow ing dialog b ox appears. S elect item s to print. C lick < O K > to
confirm s the item s. T he dialog bo x closes.
F igure 3.13 [P rint Form at] dialog bo x
(2) C lick [F ile] - [P rint]. T he follo w ing dialog bo x appears. T he con tent of the dialog box varies according
to the printer.
Page 33

20
F igure 3.14 [P rint] dialog box
(3) C lick <O K > to print the quantitative a nalysis data.
3.1.9 E xitin g quantitative ana lysis
C lick [F ile] - [E xit] to return to the [S pectra M anager] w indow after m easurem ent is finished.
N ote: If unsaved [D ata S heet] and/or [C alibra te C urve] data exist, a m essage appears to ask if the data should
be saved. P roceed according to the m essage.
Page 34

21
3.2 S pectrum M easure m e nt
T his section describes the procedures for starting the S pectrum M easurem ent progra m , m easuring
standard sam ples, saving m easured spectra to disk, and printing data.
3.2.1 P rocedural overview
T he S pectrum M easurem ent progra m m easures sam ple spectra for a set of m easurem ent param eters. It
also does ba selin e m easurem ent for correcting sam ple spectra. S p ectra cannot be printed or saved in the
S pectrum M easurem ent p rogram . S pectrum m easurem ent autom atically starts the [S pectra A nalysis]
pro gram and the spectra are displayed in the active view . S pectra can be saved or prin ted in the [S pectra
A nalysis] program .
[S pectrum m easu rem ent] pro gram start S ee S ection 3.2.2.
¯
S etting m easurem ent param eters S ee S ection 3.2.3.
¯
S etting the baseline(or M ea surem ent) S ee S ection 3.2.4.
¯
S am ple m easurem ent S ee S ection 3.2.5.
¯
S pectrum save S ee S ection 3.2.6.
¯
P rinting results S ee S ection 3.2.7.
¯
E xit (shutdow n instrum ent). S ee S ection 3.2.8.
3.2.2 [S pectrum m easurem ent] program startup
In the [S pectra M anager] w in dow , double-click [S pectrum M easu rem ent]. T he program starts and the
follow ing w indow appears.
F igure 3.15 [S pectrum M easurem ent] w in dow
Page 35

22
3.2.3 S etting m easurem ent para m eters
(1) C lick [M easurem ent] - [P aram eter...]. T he follow ing dialog box appears. T h e dialog box consists of
tw o pages, [P aram eter] and [D ata F ile]. C lick the [D ata F ile] tab to activate the [D ata File] dialog box.
C lick the [P aram eters] tab to reactivate the [P aram eters] dia log box.
N ote: The [D ata F ile] function is necessary for saving data autom atically to disk.
F igure 3.16 [P aram eters] dialog b ox F igure 3.17 [D ata F ile] dialog box
(2) C hanging m easurem ent param eters procedure
T he default param eters fo r the instrum ent appear in the [P aram eters] dialog box. The para m eters
can be changed, according to the exam ples below .
P hoto m etric M o de: T %
M easuring w avelength range: 600 to 400
1) C hanging ph otom etric m ode
T he [P hotom etric M ode] is a d rop-dow n list box. C lick the arrow to the right of the b ox to display the
available m odes. C lick [% T] to set that photom etric m ode.
2) C hanging w avelength ra nge
Input the longer w avelength end into the [S tart] text box and the shorter w avelength end into the
[E nd] text box.
F or exam ple, to input the starting w avelen gth, click the appro pria te text box. T he cursor ap pears in
the [S tart] text box. T he starting w avelength can be input using the num ber keys.
C hange other param eters, as requ ired
(3) A fter changing the n ecessary param eters, click <O K > to transfer the param eters to th e
spectrophotom eter.
Page 36

23
3.2.4 S etting the b aseline(or M easurem ent)
T he baseline defines the “0” absorbance (100% for transm ittance) level. T he baseline value is subtracted
from the m easured data (divided for transm ittance) in order to determ ine the correct spectrum of a sam ple.
T he baseline is inh erent to each instrum ent. W hen the ba seline is m easured, it varies according to the set of
param eters such as the response setting and scan ning speed. In ord er to m axim ize the accuracy of the
spectra, the ba selin e m ust be m easured under the sam e condition s as those used for m easuring the
spectra.
T he m easured b aseline is saved, even w hen the po w er is turned off. T herefore, it can be used again w hen
the S pectru m M easurem ent progra m is started.
N ote: W hen an optional accessory is installed in the sam ple cham ber, the optical path changes. T hus, the
baseline m ust be re-m easured.
(1) C lick [M easurem ent] - [B aseline...] . T he follow ing dialog box ap pears. A m essage in the dialog box
asks the operator w hether a baseline exists.
F igure 3.18 [B aseline C orrectio n] dialog b ox
N ote: W hen a partial baseline exists, m easurem ent param eters are d isplayed in the [B aseline param eters]
display field.
W hen [B aseline data exist.] is d isplayed:
P reviously m easured b aseline data exist in m em o ry. D o step (2) to use that baseline or step
(3) to re-m easure the baselin e.
W hen [B aseline data not exist.] is displayed:
P roceed to step (3) to m easure the baseline.
(2) Select the [B aseline C orrectio n] checkbox, and then click < O K > . T his com pletes baseline setting.
(3) Select the [Full W avelength] checkbox, and then click <M easu re...> to display the follow ing dialog
box.
Page 37

24
F igure 3.19 [B aseline M easurem ent] (1) dialog box
N ote: If the <M easure> button is clicked w ithout putting a check m ark to [F ull W avelength], m easurem ent w ill
start im m ediately w ithout displaying F ig. 3.20. In this case, the partial baseline is m easured (see S ectio n
4.2.1.3 [B aseline (B )...]).
(4) M ake sure that the sam ple cham ber is em pty. C lick < S tart> to b egin m easurem ent. T he m easured
baseline is saved in m em ory. A t the sam e tim e, the [B aselin e C orrection] checkbox is selected. T o
confirm that the [B aseline C o rrection] checkbox has been selected, do step (1) again.
N ote: F ull baseline m easurem ent param eters are those that are currently selected except the m easurem ent
range. M easurem ent can be stopped by clicking the <S top > button during m easurem en t. W hen
m easurem ent is stopped, the full baselines in m em ory w ill disappear.
Page 38

25
3.2.5 S am ple m easu rem ent
(1) P lace a sam ple in th e cell holder on the near-side of the sam p le cham ber, an d then close the lid.
Sample Chamber
F igure 3.20 S am ple cha m ber
(2) C lick [M easurem ent] - [S tart] (or click the <S tart> bu tton). The sam ple is m easured and the
m easurem ent progression appears. W hen m easurem ent is finished, the [S pectra A nalysis] progra m
starts autom atically and the spectrum is d isplayed in th e active view .
F igure 3.21 [S pectra A nalysis] w ind ow (spectrum view )
Page 39

26
3.2.6 S pectrum save
S pectra can b e saved in a file.
(1) C lick [F ile] - [S ave A s...]. T he follow ing dialog box appears.
F igure 3.22 [S ave A s] dialog box
(2) Input the filenam e in the [F ile N a m e] text box. U p to 8 cha racters can be input. T h e extension is not
required (after the “.”).
(3) C lick <S ave> to save spectra to disk.
3.2.7 P rintin g results
S pectra can b e printed using a printer.
(1) C lick [F ile] - [P rint S etup...]. T he follo w ing d ialog b ox appears. T he con tent of the dialog box varies
according to the active printer.
F igure 3.23 [[P rin t S etup] dialog box
Page 40

27
(2) C lick [F ile] - [P rint...] to print the spectra.
3.2.8 Instrum ent shutdow n
(1) E xiting the [S pectra A nalysis] progra m
C lick [F ile] - [E xit]. T he [S pectra A nalysis] w indow closes and the [S pectrum M easurem ent] w indow
appears.
N ote: If an unsaved spectrum exists, a m essage appears to inform the operator. P roceed according to the
m essage. A m essage appears for each unsaved spectrum . R epeat procedure accordingly.
(2) E xiting the [S pectrum M easurem ent] progra m
C lick [M easurem ent] - [E xit]. The [S pectrum M ea surem ent] w indow closes and the [S p ectra
M anag er] w indow reappears.
(3) E xiting the [S pectra M anager] program
C lick [A pplications] - [E xit].
(4) E xiting W indow s
E xit W indow s accord ing to the W indow s U ser’s G uid e.
(5) P C and spectrophotom eter shutdow n
T urn off the pow er to both th e P C and C R T . In particular, m ake sure that the C R T has been turned
O F F . C heck that th e sam ple cha m ber is em pty, then turn off the spectrop hotom eter.
Page 41

28
4. [Quantitative Analysis]
D ouble-click [Q uantitative A nalysis] in the [S pectra M anager] w indow . T he prog ram starts and the follow ing
w indow appears after spectrophotom eter initializatio n.
Calibration Curve
Data Sheet
Method's Information
F igure 4.1 [Q ua ntitative A na lysis] w indow
[Q u antitative A nalysis] w ind ow
T he [Q uantitative A nalysis] program display contains the follow ing three w indow s (see F ig. 4.1). T hese
three w indow s m ay be opened sim ultaneously. H ow ever, no m ore than one of the sam e w indow m ay be
opened at the sam e tim e.
[Calibration Curve] Displays a calibration curve. Always appears when the [Method
Information] window is opened.
[Data Sheet] Measurement of unknown sample is done when this window is
open. [Calibration Curve] and [Method Information] windows
must be opened in order to display this window.
[Method Information] Displays information including measurement parameters,
calibration curve data, and comments. Always appears when the
[Calibration Curve] window is opened.
m en u
[F ile] m enu
[N ew ...] O pens a new [D a ta S heet] display.
[O pen...] O pens a saved [D ata S heet] file.
[S ave] S aves the active [D ata S heet] under the current filenam e. M easurem ent
param eters and calibration curve data are also saved at that tim e.
[S ave A s...] S aves the active [D ata S heet] under a new filenam e. M easurem ent
param eters and calibration curve data are also saved at that tim e.
[P age S etup...] S ets print contents such as [D ata S heet], calib ration curve, or
m easurem ent para m eters.
[P rint S etup...] S ets the target printer and the printing conditions.
[P rint...] P rints the data from the active w ind ow set by [P age S etup...].
[E xit] E xits the quantitative analysis program and returns to the [S p ectra
Page 42

29
M anag er].
[M eth od] m enu
[N ew ...] C reates a new calibration curve.
[O pen...] O pens saved quantitative a nalysis m ethod files.
[S ave A s...] S aves quantitative analysis m ethod data, including calibration curve, and
m easurem ent para m eters.
[M odify...] E d its existing calibration curve data.
[Inform ation...] W hen the [M ethod Inform ation] w indow is in icon form , starting this
function reopens the original w indow .
[M easurem ent] m enu
[M ea surem ent...] M easure a sam ple blank or unknow n sam ple.
[P aram eters...] S et m easurem ent param eters.
[B la nk C o rrection...] S et w hether to input the sam ple blank value and w hether blank correction
should be do ne.
[E dit] m enu
[C opy P icture] C op ies a calibration curve to the clipboard as a picture.
[C opy B itm ap] C opies a calibration curve to the clipboard as a bitm ap.
[C opy T ext] C opies the resu lts of quantitative analysis to the clipboard in a text fo rm at.
[Invalid] Invalidates selected lines from th e D ata S heet.
[D ata Input...] Inputs m easu rem ent data directly using the nu m ber keys.
[T itle...] edits the [D ata S heet] colum n title.
[V iew ] m enu
[F ont...] S ets the font for the [D ata S heet] or calibration curve.
[F orm at...] Sets the n um ber o f decim al places to appear o n the [D a ta S heet].
[C ell W idth...] S ets the cell w idth for each colum n of the [D ata S heet].
[S cale...] S ets the scale of the vertical and horizontal axes of the calibration curve.
[P attern ...] S ets the calib ration curve, fram e, scale line color, line style, o r line w idth.
[G rid...] Sets w hether to display th e vertical and horizontal axes of the calibration
curve.
[S tyle...] S ets the scale interval and decim al places of the vertical and horizontal
axes of the calibration curve.
[M arker...] S ets the type, size, and color of the m arker used to indicate specific data
points on the calib ration curve, and w hether to fill the inside of the m arker.
[W indow ] m enu
[C ascade] O verlays the [D ata Sheet], [C alibrate C urve], and [M ethod Inform ation]
w indow s in the d isplay.
[T ile] D isplays the [D ata S heet], [C alibrate C urve], and [M ethod Inform ation]
w indow s side-by-side.
[H elp] m enu
[A bout...] D isplays version inform ation for the [Q uantitative A nalysis] program .
T ool button
C reates a new calib ration curve ([M ethod]-[N ew ...])
O pens a new [D ata S heet] display ([F ile]-[N ew ...])
Page 43

30
O pens a saved [D a ta S heet] file ([F ile]-[O p en...])
P rints the data from the active w ind ow set by [P age S etup...] ([F ile]-[P rint...])
4.1 [F ile] m e nu
4.1.1 [N ew ...]
O pens a new [D a ta S heet] display.
N ote: If an unsaved [D ata S heet] and/or [C alibrate C urve] is in the w indow w hen [N ew ...] is clicked, a m essage
appears to ask the operator w hether the data should b e saved. P roceed according to the m essage.
W hen [N ew ...] is clicked, the fo llow ing dialog bo x appea rs.
F igure 4.2 [O pen P aram eters] dia log box
[P aram eters List] Lists the available quantitative analysis m ethods.
<N ew > O pens the [Q uantitative M easurem ent-P aram eters] dialog box. A new
quantitative analysis m ethod file can be added. S ee S ection 4.2.1,
[N ew ...].
<V iew ...> D isplays details of the currently selected quantitative analysis m ethod file.
<O K > Lo ads the details of the currently selected qu antitative analysis m ethod file,
and sim ultaneously opens th e [C alibrate C urve], [M ethod Inform ation] and
[D ata S heet] w indow s.
N ote: The [D ata S heet] w ind ow is the collective display of the [C alibrate C urve] and [M ethod Inform a tion]
w indow s w hich appear in this w indow at all tim es.
<C ancel> C loses the dialog box w ithout changing the o riginal param eters.
<D elete> D eletes the curren tly selected quantitative analysis m ethod file.
C lick < V iew ...> to open the follow ing dialog box.
Page 44

31
F igure 4.3 [Inform ation] dialog box
F igure 4.4 [D ata S heet] w indow
A n unknow n sam ple can be m easured from the [D ata S heet] w indow using the displayed quantitative
analysis m etho d.
Page 45

32
4.1.2 [O pen...]
O pens a saved [D ata S heet] file.
N ote: If an unsaved [D ata S heet] or [C alibrate C urve] is in the w indow w hen [O pen...] is clicked, a m essage
appears to ask the operator w hether the data should b e saved. P roceed according to the m essage.
F igure 4.5 [O pen] d ialog box
[Look in] S ets target drive or directory. A vailable d rives or directory appear in the
dro p-dow n list box.
F ile nam e list b ox S elect a filenam e.
[F ile nam e] T ext box for inputting a filenam e. T he filenam e can also be selected from
the filenam e list.
[F iles of type] O nly JA S C O JQ A is available.
<Inform ation...> D isplays inform ation abo ut the qua ntitative analysis m ethod file.
4.1.3 [S ave]
S aves the active [D ata S heet] un der the current filenam e. M easu rem ent param eters and calibration curve
data are also saved. T his function overw rites any previo us data in that file.
Page 46

33
4.1.4 [S ave A s...]
S aves the active [D ata S heet] under a new filenam e. M easurem ent pa ram eters and calibration curve d ata
are also saved.
F igure 4.6 [S ave A s] dialog b ox
[S ave in] S ets ta rget drive or directory. A vailable d rives or directory app ear in the
dro p-dow n list box.
F ile nam e list b ox Lists existing files in the target directory. R efer to this list w hen n am in g a
file. T o use the nam e of an existing file, click the filena m e.
[F ile nam e] Input nam e of [D ata S h eet] file to be saved. If the extension is om itted, the
set F ile T ype extension is affixed autom atically. If an existing filenam e is
input, and then <O K > is clicked , the follow ing dialog box appears.
F igure 4.7 D ialog bo x displayed w hen an existing file is specified
If < O K > is clicked, the original file is erased.
[S ave as type] Lists available file types (extension). A file cannot be saved if an incorrect
extension is input.
<C om m ent> S am ple N am e, O perator, C om m ent, and C opyright can be add ed or
edited in this dialog box.
Page 47

34
4.1.5 [P age S etup...]
S ets print contents su ch as [D ata S heet], calibration curve, or m easurem ent param eters.
F igure 4.8 [P rint Form at] dialog bo x
[T itle] T itle input text box. U p to 62 characters m ay be input.
[P attern] group The quantitative analysis m ethod or results can be printed by selecting either
the [M ethod] or [R esult] option button.
[Item ] C heck box item s such as [P aram eters] and [G raph] can be selected for
printing from this group. A check m ark n ext to the item indicates that it w ill
be printed.
<F ont...> O pens the [F o nt] dialog box.
4.1.6 [P rint S etu p...]
S ets the target printer and the printing conditions.
F igure 4.9 [P rint S etup] dialo g box
[S pecific P rinter] Lists available prin ters. (A dditional printers can be selected by ad ding
them from th e [M ain] group control panel.)
<O ption> button S ets the printing conditions for the target printer. T he dialog box that
appears varies according to the printer.
Page 48

35
4.1.7 [P rint...]
P rints the data from the active w ind ow set in [P age S etup...].
F igure 4.10 [P rint] dialog box
[P rint range] O nly [A ll pa ges] is available.
[P rint Q uality] list S ets print quality. C annot be set for som e printers. T he resolution of the
printer is in dpi, w hich is the num ber of dots per inch (2.4 cm ). T he higher
the num ber, the hig her the resolution .
[S etup...] S ets the target printer and printing conditions for that printer. T he sam e
pro ced ure as that for [P rinter S etting] is used.
4.1.8 [E xit]
E xits the qu antitative analysis program a nd retu rns to the [S pectra M anager]. If an unsaved [D ata S heet] or
[C alibrate C urve] exists, a m essage asks w hether it should be saved. P roceed accord ing to the m essage.
Page 49

36
4.2 [M e thod] m enu
4.2.1 [N ew ...]
C reates a new calibration curve. C lick [N ew ...] to open the follo w ing dialog box.
N ote: If a calibration curve has not been saved, a m essage appears to ask the operator w hether to save it.
P roceed according to the m essage.
F igure 4.11 [Q ua ntitative M easurem ent - P aram eters] dia log box
[R esponse] R esponse by sim p le m o ving averag e.
Q uick: M oving average during about 0.03 sec
F ast: M oving average during about 0.25 sec
M edium : M oving average during about 1 sec
S low : M oving average during about 4 sec
[B and w idth] S pectral bandw idth. S electable range varies accord ing to the m odel.
V -530: F ixed at 2 nm
V -550/56 0: 0.1, 0.2, 0.5, 1, 2, 5, 10 nm
V -570: 0.1, 0.2, 0.5, 1, 2, 5, 10 nm
0.4, 0.8, 2, 4, 8 , 20, 40 nm (near infrared
region)
N ote: W hen u sing the V -570 for m easurem ent from the near-infrared region to the visible region in succession,
the bandw idths listed in T able 4.1 should be paired. If the bandw idth is set to the sam e (nearly equal)
valu e, noise in the near-infrared region m easurem ent value w ill increase.
N ote: In the T able below , L after the bandw id th m eans low stray light m ode. In this m ode, the slit is m asked
at the top and bottom to im prove the pu rity o f light by cutting off unnecessary light.
T able 4.1
U ltravio let (U V ) / visible region ban dw id th (nm ) N ea r-infrared (N IR ) bandw idth (nm )
0.1 0.4
0.2 0.8
Page 50

37
0.5 2
1 4
2 (L2) 8
5 (L5) 20
10 (L10) 40
[M eth od] N o. of w avelengths used in quantitative analysis. S elects optim um
num ber. of w avelengths (1, 2, or 3) according to the sam ple con dition.
1-w avelen gth: F or com m on solution sam ple. S ee F ig. 4.13 (1).
2-w a velength: F or baseline correction. S ee F ig. 4.13 (2).
3-w a velength: F or baseline correction. S ee F ig. 4.13 (3).
In [3-w avelen gth], the absorba nce value is obtained from the follow ing
equation:
DAbs E
WLWLEWLWL
E
WL WL
= -
-×+-×
-
( )
||()||(
)
| |
1
12331
2
3 2
WL 1 WL 1WL 2
D Abs
D Abs
WL 1WL 2 WL 3
E(2)
E(1)
E(3)
(1) (2) (3)
1-wavelength
2-wavelength 3-wavelength
(Peak) (Base 1) (Peak) (Peak)(Base 1) (Base2)
F igure 4.12 Q uantitative analysis m ethod according to num ber of w avelengths.
[P eak] P eak w avelength
[B ase 1] Base 1 w avelength
[B ase 2] B ase 2 w aveleng th
T he input range varies a ccording to the m odel.
V -530: 190.0 to 1100 .0 nm
V -550/56 0: 190.0 to 900.0 nm
V -570: 190.0 to 25 00.0 nm
[S am ple N o.] S ets the sam ple num ber for m ea surem ent. S am ple num b er increases
increm entally by one w ith each subsequent m easurem ent.
[N o. of C ycle] S ets how m any tim es each sam ple is m easured. If 2 or m ore
m easurem ents are set, the [C ycle T im e] field appears.
[C ycle T im e] S ets the tim e in seconds betw een m easurem ents. If the cycle tim e is
shorter than the m easurem ent tim e, the next m easurem ent starts
im m ediately.
Input range: 0 to 15000 sec.
<O K > T ransfers the m easurem ent param eters to the spectropho tom eter. The
[C alibrate C urve P aram eters] dialog box appears.
Page 51

38
F igure 4.13 [C alibrate C urve P ara m eters] dialo g box
[G ra ph S etting]
[C alib C u rve] T he type of calibration curve. C lick the drop-dow n form at box and select a
type. F ig. 4.15 show s the nam es of m odes and types of graph s.
Segmented line Logistic function
Spline function
Proportional expression
Linear expression Quadratic expression
Third-order expression
F igure 4.14
[S tandard B lank] If th e stan dard blank value is know n , select the [E nable B lank] checkbox
by entering the value. If the standard blank is un know n, a value does not
need to be inp ut, becau se the stan dard blank can be m easured later from
the [Q uantitative M easurem ent] dialog b ox.
[E nable B lank] S elect the [E nable B lank] checkbox w hen the standard blank value is
input. A check is autom atically appended w hen the stand ard blank is
m easured.
[C alibrate D ata S etting]
[N um ber] Indicates the standard sam ple num ber. The displayed num ber reflects the
selected standard sam ple from the standard data display field. T he
concentration and absorbance of the selected standard sam ple can be input.
[C onc.] T ext box for inputting the standard sam ple concentration.
[A bs] T ext box for inputting the sta ndard sam ple a bsorbance if it is know n . If the
absorbance is unknow n, a value does n ot need to be input because the
standard sam ple absorbance can be m easured later from the
[Q uantitative M easu rem ent] dialog bo x.
Page 52

39
[E nable C alib. D ata] D ata in the standard data display field can be used for the calibra tion
curve by selecting the [E nable C alib. D ata] checkbox. S elect the checkbox
(x), then click < A ppend>. T he colum n w ith [---] in the standard data
display field is rew ritten to [U se].
<A ppend> C lick < A ppend> to w rite into the standard data display field the
concentration and absorbance in put in the [C alibrate D ata S etting] group.
If the [E nable C alib. D ata] checkbox is selected, [---] in the standard data
display field is rew ritten to [U se].
S tandard data display field S how s the input or m easured standard data (concentration, absorbance).
D ata of the selected line can be input or m easured.
<P aram eter...> C lick <P aram eter...> to returns to the [Q uantitative M easurem ent
P aram eters] dialog box.
<S tart...> C lick <S tart...> to open the [Q ua ntitative M easurem ent] dialog box. T h e
standard blank and standard sam p le are m easured from this dialog box.
F igure 4.15 [Q uantitative M easurem ent] dialog box
[S tandard] S elect the [S tandard] option button to m ea sure a standard sam ple.
[B lank] S elect the [B lank] option button to m easure a standard blank.
<S tart> S tarts m easurem ent.
W hen a standard sam ple is m easured, the m easurem ent value is w ritten
to the [A bs] colum n of th e standard sam ple data display field in the
[C alibrate C urve P aram eters] dialog box. A t the sam e tim e, [---] is
rew ritten to [U se].
W hen a standard blank is m ea sured, the m easurem ent value is w ritten to
the [S tand ard B lan k] text box and the [E nable B lank] checkbox is
selected.
<C lose> C loses the [Q uantitative M easurem ent] dialog box and returns to th e
[C alibrate C urve P aram eters] dialog box.
<G oto W L...> M oves the w a velength of the spectrophotom eter to a set w avelength.
W hen < G oto W L...> is clicked, the follow ing dialog box appears.
F igure 4.16 [G oto W avelength] dialog box
[W avelength]: Text box for in putting w avelength.
<O K >: C lick < O K > to accept and m ove the w avelength of the spectrophotom eter to
the set w avelength.
Page 53

40
<C ancel> : C loses the dialog bo x w ithout changing the previously set w avelength.
<A uto Z ero> S ets the absorbance value of the current w avelength to zero.
<O K > E xits the [C alibrate C urve P a ram eters] dialog box and opens the
[C alibrate C urve] a nd [M ethod Inform ation] w indow s.
F igure 4.17 [C alibrate C urve] and [M etho d Inform ation] w indow s
4.2.2 [O pen...]
O pens saved quantitative a nalysis m ethod files.
T his function is the sa m e as the one described in [4.1.1 N ew ...].
Page 54

41
4.2.3 [S ave A s...]
S aves quantitative analysis m etho d data, including ca libratio n curve, and m easurem ent param eters.
F igure 4.18 [S ave P aram eters] dialog box
[P aram eter N am e] T ext box for inputting the quantita tive a nalysis m etho d filenam e. U p to 32
characters m ay be input. If an existin g nam e from the quantitative analysis
m etho d nam e list is set, the previous file w ill be overw ritten .
<O K > S aves the quantitative analysis m ethod.
<C om m ents...> S am ple nam e, op era tor, copyright, and com m ent can b e input or edited .
T he follow ing dialog box appears.
F igure 4.19 [C om m ents] dialog box
Input [S am ple N am e] (up to 62 characters), [O perator] (62 ch), [C opyrigh t] (62 ch), and [C om m ent] (124
ch).
4.2.4 [M odify...]
E dits existing calib ration curve data. W hen this functio n is started, the [C alib rate C urve P aram eters] dialog
box app ears. S ee the [C alibrate C urve P aram eters] dia log box in S ection 4.2.1 N ew ...
N ote: If a calibration curve has not been saved, a m essage appears asking w hether it should be saved. P ro ceed
according to the m essage.
Page 55

42
4.2.5 [Info rm ation...]
W hen the [M ethod Inform ation] w indow is in icon fo rm , starting this function opens the original w indow
again.
F igure 4.20 [M ethod Inform ation] w indow
4.3 [M e asurem ent] m e nu
4.3.1 [M easurem ent...]
U se this fu nction to m easure a sam ple blank or unknow n sam ple. T he sam ple blank is used to correct the
absorbance of an un know n sam ple. T he sam ple blank value cannot be ap plied retroactively to previously
m easured unknow n sam p les. If the sam ple blank is updated, the new value is ap plied only to all
subsequently m easured unknow n sam ples.
N ote: To see the current sam ple blank value, open the [B lank C orrection] dialog bo x (see S ection 4.3.3 [B lank
C orrection]).
F igure 4.21 [Q uantitative M easurem ent] dialog box
[S am ple] S elect the [S am ple] option button to m easure a sam ple.
[B lank] S elect the [B lank] option button to m easure a blank.
<S tart> S tarts m easurem ent. T he < S tart> button changes to <S top> d uring
m easurem ent. A fter m easurem ent, the resu lt is w ritten to the [D ata
S heet].
N ote: S tarting blank m easurem ent autom atically selects [E nabled S am ple B lank] and puts a check m ark in
the [B lank C orrection] dialog box.
Page 56

43
<C lose> C loses th e [Q uantitative M easurem ent] dialog box.
<G oto W L...> M oves the w avelength of the spectrophotom eter to a set w avelength (see
F ig. 4.16).
<A uto Z ero> S ets the absorbance value at the current w avelength to zero.
4.3.2 [P aram eters...]
C lick [M easurem ent] - [P aram eters...] to set m easurem ent param eters.
F igure 4.22 [Q uantitative M easurem ent-P aram eters] dialog b ox
T he [Q uantitative M easurem ent-P aram eters] dialo g box show s the m easurem ent param eters from the
quantitative analysis m etho d file. [R esponse], [B and W idth], [S a m ple N o.] and [N o. of C ycle] can all be
changed. S ee S ection 4.2.1 [N ew ...] to see the [Q ua ntitative M easurem ent-P aram eters] dialog box.
4.3.3 [B lan k C orrection...]
C lick [M easurem ent] - [B lank C orrectio n...] to set w hether to input the sam p le blank value and w hether
blank correction should be done.
N ote: The [B lank C orrection] dialog box can be used to confirm w hether the sam ple blank value and blank have
been corrected.
F igure 4.23 [B lank C orrection] dialog box
[S am ple B lank] T ext box for inputting the sam ple blank value. If the sam ple blank value is
know n, input the value, then select the [E nabled S am ple B lank] checkbox.
If the sam ple blank is m easured, the value is w ritten autom atically.
[E nabled S am ple B lank] S ets w hether to correct the sam ple blank.
Page 57

44
4.4 [E d it] m enu
4.4.1 [C opy P icture]
C opies a calibration curve to the clipbo ard as a picture.
4.4.2 [C opy B itm ap ]
C opies a ca libratio n curve to th e clipboard as a bitm ap. S uitable for editing grap hs using paint-type
softw are such as P aintbrush.
4.4.3 [C opy T ext]
C opies the results of quantitative analysis to the clipboard in a text fo rm a t.
4.4.4 [Invalid]
Invalida tes selected lines from the D ata S h eet. The line ap pears gray and is not printed . T o validate the line
again, select it, then click [Invalid] aga in.
4.4.5 [D ata Input...]
C lick [E dit] - [D ata Input...] to input m easurem ent data directly using the num ber keys. S elect a cell from the
[D ata S heet]. T he follow ing dialog box a ppears. If absorbance data is input, the concentratio n is calculated
according to the curren t quantitative a nalysis m ethod and is w ritten to the concentration field.
T he [D ata Inpu t] dialo g box can also be opened by double-clicking a cell.
F igure 4.24 [D ata Inpu t] dialog box
4.4.6 [T itle...]
S elect a co lum n. C lick [E dit] - [T itle...] to edit the [D ata S heet] colum n title. U p to 30 characters m ay be input.
T he [T itle] dialog bo x can also be opened by double-clicking the title field of a colum n.
F igure 4.25 [T itle] d ialog box
4.5 [V iew ] m e nu
T he [V iew ] m enu contains the follow ing functions.
[Form at] and [C ell W idth] are active only w hen the [D ata S heet] w indow is active. [S cale], [P attern], [G rid], [S tyle],
and [M arker] are active only w hen the [C alibrate C urve] w indow is active. [F ont] is active w hen either w indow is
active. H ow ever, w hen the [M ethod Inform ation] w indow is active, all functions related to the display are inactive.
Page 58

45
4.5.1 [F ont...]
S ets the font for the [D ata Sheet] or calibration cu rve. W hen the [C alibrate C urve] w indow is active, the
follow ing w indow opens before the [Font] dialog box appears.
F igure 4.26 [F ont S etting] dialog box
[Item ] Lists the item s for w hich the font can be set.
[A xis label]: A lphabetic cha racters for [Intensity] or
[C oncentration].
[S cale label]: N um eric characters.
[A s D efault] S elect the [A s D efault] checkbox to use the set fonts in subsequent displays in
the [C alibrate C urve] w indow .
<S etting...> O pens the [F ont] dialog bo x.
Page 59

46
F igure 4.27 [F ont] dialog box
[F ont] list S elect a font from this list.
[F ont S tyle] list S elect a font style from this list.
[S ize] list S et a font size.
[E ffects] S et special character styles such as strike-throug h or underlined.
[C olor] list S et a font color.
[S am ple] D isplays a sam p le of the set font.
4.5.2 [F orm at...]
S elect a colum n. C lick [V iew ] - [F orm at...] to set the num b er of decim al places to appear on the [D ata S heet].
T his can be set individua lly for each colum n. T his function is active only w hen the [D ata S heet] w ind ow is
active.
F igure 4.28 [International N um ber F orm at] dialog box
4.5.3 [C ell W idth...]
C lick [V iew ] - [C ell W idth...] to set th e cell w idth for each colum n of the [D ata S heet]. T h is function is a ctive
only w hen the [D ata S heet] w indow is active.
F igure 4.29 [C ell W idth] setting dialog b ox
[C ell W idth] Text b ox for inputting cell w idth. Input range is 4 to 32 ch aracters.
[D efault] T he standard cell w id th is 12 characters.
4.5.4 [S cale...]
C lick [V iew ] - [S cale...] to set the scale of the vertical and horizo ntal axes of the calib ration cu rve. S elect the
Page 60

47
[A uto] checkbox to set the scale to the optim a l value according to the calibration curve data. T his function is
active o nly w hen the [C alibrate C urve] w indow is active.
F igure 4.30 [S cale] dialog box
4.5.5 [P attern...]
C lick [V iew ] - [P attern...] to set the calibration curve, fram e, scale line color, line style, or line w id th. T his
function is active on ly w hen the [C alibrate C urve] w indow is active.
F igure 4.31 [P attern S ettings] dialog box
[E lem ent] Lists the item s for w hich color, line style, an d line w idth can be set. T hese
inclu de calibration curve, fram e, and scale line.
[C olor] S ho w s available colo rs. S elect a color from this palette. T he line set in the
[E lem ent] list w ill be displayed in the selected color.
[Line S tyle] S how s available line style. T he line set in the [E lem ent] list is displayed
w ith the selected line style.
[Line W idth] S how s available line w idths. T he line set in the [E lem ent] list is displayed
w ith the selected line w idth.
[A s D efa ult] S elect the [A s D efault] checkbox to used the pattern settings in
subsequent d isplays in the [C alibrate C urve] w indow .
[S am ple] D isplays a sam p le of the set pattern .
4.5.6 [G rid...]
C lick [V iew ] - [G rid...] to set w hether to display the vertical and horizontal axes of the calibration curve. T he
function can only be started w hen the [C alibrate C urve] w indow is active.
Page 61

48
F igure 4.32 [G rid Lines] dialog box
[M ain] S elect the [V ertical A xis] and/or [H orizonta l A xis] checkbox to display the
scale line.
[A uxiliary] N ot used
[A s D efa ult] S elect the [A s D efault] checkbox to use the set grid lines in subsequent
displays in the [C alibrate C urve] w indow .
4.5.7 [S tyle...]
C lick [V iew ] - [S tyle...] to set the scale interval an d decim al places of the vertical a nd horizontal axes of the
calib ration curve. T his function can only be started w hen the [C alib rate C urve] w indow is active.
F igure 4.33 [S tyle S ettings] dialog box
[A xis] Lists the axes for w hich the style can be set. Select [C oncentration] or
[A bsorbance].
[S cale Label] The scale interval and num ber of decim al places can be set.
[Interval]: A llow s the scale interval to be set to [A uto] or
[M anual].
[A uto]: T he scale interval is set autom atically.
[M a nual]:T ext box for inputting m ain scale interval.
[D ecim al P oint on S cale]: S ets the num ber of decim al places for the m ain scale.
D efau lt: #.### (3 decim al places)
Integer: D isplays only the integer.
#.#: D isplays to 1 decim al place.
#.##: D isplays to 2 decim al places.
[A s D efa ult] S elect the [A s D efault] checkbox to u se the set style settin gs for
subsequent d isplays in the [C alibrate C urve] w indow .
Page 62

49
4.5.8 [M arker...]
C lick [V iew ] - [M arker...] to set the type, size, and color of the m arker used to indicate sp ecific data points on
the calibration curve, and w heth er to fill the inside of the m arker.
F igure 4.34 [M arker S ettings] dialog box
[T ype] Lists the types of m arkers available. S elect from circle, square, triangle,
rhom bus, o r cross.
[S ize] S ets the m arker size.
[C olor] S ho w s available colors. S elect a color from this pa lette.
[F ill Inside] S elect the [F ill Inside] checkbox to fill the inside of the m arker.
[A s D efa ult] S elect the [A s D efault] checkb ox to use the set m arker patterns in
subsequent d isplays in the [C alibrate C urve] w indow .
[S am ple] D isplays a sam p le of the set m arker.
4.6 [W indow ] m enu
[C ascade] S elect [W indow ] - [C ascad e] to overlay the [D ata S heet], [C a librate C urve],
and [M ethod Inform ation ] w ind ow s in the display.
[T ile] S elect [W indow ] - [T ile] to display the [D ata S heet], [C alibrate C urve], and
[M ethod Inform ation] w indow s side-by-side.
4.7 [H elp] m e nu
[A bou t...] C lick [H elp] - [A bout...] to display version inform atio n for the [Q uantitative
A nalysis] program .
Page 63

50
5. [Spectrum Measurement]
[S pectrum M easurem ent] m easures a sam p le spectrum . In th e [S pectra M an ager] w indow , double-click
[S pectrum M easurem ent]. The spectrophotom eter is initialized and the follow ing w indow appears.
Title Bar
Menu Bar
Monitor Bar
Spectrum display field
F igure 5.1 [S pectrum M easurem ent] w indow
[S pectrum M ea surem ent] w in dow
T itle B ar D isplays the nam e o f the pro gram . T h e color changes w hen the w indow is
active.
M enu B ar C ontains the m enus of the program . E ach m enu contains a list o f
com m ands.
M onitor B ar D isp lays current m easurem ent values.
W avelength, photom etric value, and sam ple N o. fro m left to right.
D ouble-clickin g the w avelength display displays th e [G oto W avelength]
dialog box, w hich is used to m ove the w avelength to an arbitra ry
w avelength. D o uble-clicking the photom etric value display disp lays the
[P aram eters] dialog b ox, w hich is u sed to set m easurem ent param eters.
S pectrum display field M onitors a spectrum during m easurem ent. W hen m easurem ent is
finished, the spectrum is autom atically transferred to the [S pectra
A nalysis] program .
M enu
[M easurem ent] m enu
[S tart] S tarts spectrum m easurem ent.
[P aram eter...] S et and save param eters.
[B aseline] M easures baseline data for correcting the spectroph otom eter b aseline.
[G oto W avelength...] M o ves the spectrophotom eter w a velength to a set w avelength.
[A uto Z ero] S ets the absorbance (or transm ittance) of the current w a velength to zero
(or 100% T for transm itta nce).
[E xchange W avelength...] C hanges the exchange w avelength of the spectrophotom eter light source
and the exchange w avelength of the diffraction grating (V -570).
Page 64

51
[E xit] E xits the spectrum m easurem ent program and returns to [S pectra
M anag er].
[H elp] m enu
[A bout...] D isplays inform ation such as the program version.
5.1 [M e asurem ent] m e nu
5.1.1 [S tart]
S tarts spectrum m easurem ent. T he spectrum is displayed in real tim e. D urin g m easurem ent, the vertical
axis of the spectrum is set from 0 to 1 A bs in the photom etric m ode or 0 to 100 in the T % m ode.
F igure 5.2 M easurem ent w indow
W hen m easurem ent has finished, a new w indow opens w hich displays a spectrum on the vertical axis set
from the [P aram eters] dia log box. A t the sam e tim e, the spectra analysis prog ram starts.
N ote 1: A fter activating spectra analysis and starting initial m easurem ent, the next view show ing the results covers
the [S pectrum V iew ], and hides it. T o save the hidden [S pectrum V iew ], save or print it. T o display the
hidden [S pectrum V iew ] again, change the application.
N ote 2: If m easurem ent in progress in interrupted, the [S pectrum V iew ] displays all data up to that point.
5.1.2 [P aram eter...]
H ere you set an d save param eters. C lick the [D a ta File] tab to set inform ation such as the filenam e for
autom atically saving m easurem ent data.
5.1.2.1 [Parameters] dialog box
C lick [M easurem ent] - [P aram eter...] to displa y the follow ing dialog box.
Page 65

52
F igure 5.3 [P aram eters] dialog b ox
[P hotom etric M o de] S ets the photom etric m ode.
S electable range:
A bs: A bsorbance m easurem ent
% T: Transm ittance m ea surem ent
% R : R eflectance m easurem ent
S am ple: S ingle-beam m easurem ent on the sam ple
beam side
R eference: S ingle-beam m easurem ent on the reference
beam side
N ote: For m odels V -550/560/570, w hen [S am ple] or [R eference] is set, [P M T voltage] is added to the left side.
In put the voltage to be applied to the photom ultiplier. In put range is 0 to 1000 V .
[R esponse] R esponse by sim ple m oving average. S electable range varies a ccording to
the m odel.
V -530:
Q uick: M oving average during about 0.03 sec
F ast: M oving average during about 0.25 sec
M edium : M oving average during about 1 sec
V -550/560/570:
Q uick: M oving average during about 0.03 sec
F ast: M oving average during about 0.25 sec
M edium : M oving average during about 1 sec
S low : M oving average during about 4 sec
[B and w idth] S pectral bandw idth. S electable rang e varies according to the m odel.
V -530: F ixed at 2 nm
V -550/56 0: 0.1, 0.2, 0 .5, 1, 2, 5 , 10 nm
V -570: 0.1, 0.2, 0.5, 1, 2, 5, 10 nm
0.4, 0.8, 2, 4, 8, 20, 40 nm (near infrared
Page 66

53
region)
N ote: W hen u sing the V -570 for m easurem ent from the near-infrared region to the visible region in succession,
the bandw idths listed in T able 5.1 should be paired. If the bandw idth is set to the sam e (nearly equal)
valu e, noise in the near-infrared region m easurem ent value w ill increase.
T able 5.1
U ltraviolet/visible regio n bandw idth (U V ) nm N ear-infrared band w idth (N IR ) n m
0.1 0.4
0.2 0.8
0.5 2
1 4
2 (L2) 8
5 (L5) 20
10 (L10) 40
[S canning speed] W avelength scanning speed. S electab le range varies acco rdin g to the
m odel.
V -530: 40, 100, 200, 40 0, 1000, 2000, 4000 nm /m in
V -550/56 0/570 : 10, 20, 40, 100, 200 , 400, 1000, 2000,
40 00 nm /m in
[S tart] Lo nger w avelen gth end of the m easurem ent w avelength range. Form s a
pair w ith [E nd]. Input range varies accord ing to the m o del.
V -530: 190.0 to 1100.0 nm
V -550/56 0: 190.0 to 900.0 nm
V -570: 190.0 to 2500.0 nm
[E nd] S horter w avelength end of the m easurem ent w avelength range.
[D ata P itch] D ata collecting w avelength interval. S electable range varies according to the
m odel.
V -530: 0.1, 0.2, 0.5, 1, 2 nm
V -550/56 0/570 : 0.025, 0.05, 0.1, 0.2, 0.5, 1, 2 nm
N ote: The m ea surem ent w avelength range is lim ited by the com bination of [S canning S peed] and [D ata P itch].
T able 5.2 C om binatio n of [D ata P itch] an d w a velength scanning range
D ata P itch (nm ) M ax. m easurem ent w avelength range (nm )
0.025* 40
0.05* 80
0.1 160
0.2 320
0.5 800
1 1600
2 2310
*[D ata P itch] of 0.025 a nd 0.05 nm are not available on m odel V -530.
N ote: The num ber of com bina tions of [S canning S peed] and [D ata P itch] is lim ited.
T able 5.3 C om binatio n of [S ca nning speed] and [D ata P itch]
D ata P itch (nm ) 0.025* 0.05* 0.1 0.2 0.5 1 2 5 10
Page 67

54
S canning S peed (nm /m in)
10*
20*
40
100 -
200 - -
400 - - -
1000 - - - -
2000 - - - - -
4000 - - - - - -
*D ata pitch o f 0.025 and 0.05 nm and scanning S peeds of 10 and 20 nm /m in are n ot available on the
V -530.
[S am ple N o.] S ets w hich sam ple shou ld be m easured first. S ubsequent sam ples are
m easured in order from the first sa m ple num ber, increasing in increm ents of
one.
[N o. of C ycle] S ets num ber of m easurem ents for each sam ple. If 2 or m ore m easurem ents
are set, the [C ycle T im e] field is displayed.
[C ycle T im e] S ets the tim e betw een m easurem ents in seconds. If the set tim e is shorter
than the m easurem ent tim e, the next m ea surem ent starts im m ediately.
Input range: 0 to 15000 sec.
[D isplay] S ets the higher and low er lim its of the vertical axis range displayed on the
screen. If [A uto] is selected, the full-scale axis is set to about 1.2 tim es the
m axim um w idth of the d isplayed spectrum , based on the m easurem ent
result.
<O K > E nds param eter setting. C lick this button to transfer the set param eters to
the spectrophotom eter. A t the sam e tim e, the dialog box closes.
<C ancel> S tops param eter setting w ithou t changin g the previous settings, and clo ses
the dialog b ox.
<S ave...> P aram eters can be saved to the param eter libra ry on the hard disk. C lick
<S ave...> in the [P aram eters] dialog box to open the dia log box show n
below .
F igure 5.4 [P aram eters - S ave] dialog box
[P aram eter N am e] T ext box for inputting param eter nam e. A m axim um of 32 characters m ay
be input. E xisting param eter nam es m ay be selected from the
[P aram eters List]. In this case, the previous param eter settings are
overw ritten.
Page 68

55
<O K > S aves param eters.
<C ancel> R eturns to the [P aram eters] dialog b ox w ithout saving the param eters.
<C ontents...> D isplays the param eters selected from the param eter list. U se to confirm
selections.
<D elete> D eletes set param eters from the param eters list.
<O pen...> P reviously saved param eters in the para m eter library can be selected.
C lick <O pen...> in the [P aram eters] dialog box. The dialog box show n
below appears.
F igure 5.5 [P aram eters - O pen] dialog bo x
[P aram eters List] Lists available saved param eters.
<O K > Loads selected para m eter(s) from m em ory.
<C ancel> R eturns to the [P aram eters] dialog box w ithout loa ding saved param eters.
<C ontents...> D isplays selected param eters from the para m eter list. U se to confirm
selections.
<D elete> D eletes selected param eters from the param eter list.
5.1.2.2 [Data File] dialog box
C lick [D ata F ile] in the [P a ram eters] dialog box to display the dia log box show n below .
F igure 5.6 [D ata F ile] d ialog bo x
[A uto S ave] W hen this check box is selected, the data from the m easured spectrum
Page 69

56
are saved autom atically.
[F ile N am e] T ext box for inputting th e filenam e of autom a tically saved data. U p to 5
characters m ay be input. T he last 3 characters reflect the sam ple num ber.
T he n um ber increases in increm ents of 1 each tim e data is saved.
[D irectory] T ext box fo r inputtin g the nam e of the target drive an d directory.
<B ro w se...> H elps the user to find an appro priate target drive and directory. C lick this
button to open the [S ave A s] dialog box. T he drive and directory can be
changed in this dialog box.
5.1.3 [B aseline...]
M easu res baseline d ata for correcting the spectrophotom eter baseline. C lick [B aseline C orrection] to
display the dia log box show n below .
F igure 5.7 [B aseline C orrectio n] dialog b ox
[B aseline param eters] display field
D isplays the m ea surem ent param eters for th e p artial baseline. U sed to
confirm the w avelength range and other param eters. T he partial baseline
is saved in the P C m em ory. If it is not saved, nothing w ill be displayed
here.
[F ull W avelength] P ut a check m ark w hen m easuring or using the full baselin e. R em ove the
check m ark w hen m easuring or using a partial baseline.
[B aseline data exists] T his indicates that the full baseline exists in the spectrophotom eter
m em o ry.
N ote: If the m easurem ent of the full baseline is stop ped or if the backup battery for the spectrophotom eter has
no pow er, the full baseline w ill disappear and the m essage w ill change to [B aseline data not exist]. E ven
if the b aseline m easurem ent is stopped, the previous ba seline w ill rem ain because the set baseline
has been stored in the P C m em ory.
[B aseline C o rrection] S elect this check box to allo w a saved baseline to be used. If there are n o
saved baselines, the ch eck bo x is deactivated and cannot be selected.
A m ark is autom atically put w hen baseline is m easu red.
<O K > C onfirm s current settings and returns to previous display.
<C ancel> R eturns to previous display w ithout changing any settings.
<O pen...> Loads the set baseline saved on the disk in the P C m em o ry. C licking this
opens the fo llow ing dialog bo x.
Page 70

57
F igure 5.8 [P aram eters-O pen] dialo g box
S electing a filenam e from [P aram eters List] and clicking <O K > loads it
into m em ory a nd rew rites [B aseline param eters] to those of the file. If the
baseline m easu rem ent param eters differ from the currently set
m easurem ent para m eters, a w arning w ill appear.
<S ave...> S aves a set area baseline stored in m em ory onto the disk. C lickin g this
opens the fo llow ing dialog bo x.
F igure 5.9 [P aram eters-S ave] dia log box
E ntering a filenam e and clicking < O K > saves the baseline o nto the disk.
<M easu re...> M easures the baseline. T he m easu ring procedu re differs slightly b etw een
the full w avelength baseline and the set area baseline.
M easurem ent of full w avelen gth baseline
1) C heck m ea surem ent param eters other than the w aveleng th ran ge.
2) P ut a check m ark to [F ull W avelength].
3) C lick <M ea sure...> . The follow ing dialog box appears after the
m easurem ent para m eters are transferred to the spectrophotom eter.
Page 71

58
F igure 5.10 [B aseline M easurem ent] dialog box
4) C lick the <S tart> button. B aselin e m easurem ent starts. D urin g
m easurem ent, the follo w ing dialog box is displayed. W hen m easurem ent
finishes, a check m ark is put in the [B aseline C orrection] check box.
F igure 5.11 B aseline m easurem ent dialog box
N ote: P ressing the <S top> button during m easurem ent stops the m easurem ent. If m easurem ent is stopped,
the full w aveleng th baseline m easured before w ill disappear. T hat is, control reverts to the status before
baseline m easurem ent.
Measurement of set baseline
1) S et m easurem ent para m eters.
2) R em o ve the check m ark fro m [F ull W avelength].
3) C lick <M easure...> . B aseline m easurem ent starts after transferring the
m easurem ent param eters to the spectrophotom eter. W hen m easurem ent
finishes, a check m ark is put in the [B aseline C o rrection] check box and
the [P aram eters-S ave] dialog box (F ig. 5.7) opens. Sim ultaneously, the
baseline data is autom atically transferred to the [S pectra A nalysis]
pro gram and is displayed on the V iew .
N ote: P ressing the < S top> button during m easurem ent stops the m easurem ent. If m easurem ent is stopped ,
the set baseline m easured before w ill be effective.
4) E nter a filenam e, if necessary, and click the <O K > bu tton. If the filenam e
is used only at this tim e, click the <C ancel> button.
N ote: T he set baseline, w hich is stored in the P C m em ory, is effective even if the pow er is turned O F F unless
it is updated. It can also be saved by opening the [B aseline] dialog box.
5.1.4 [M ove W avelength...]
M oves the spectrophotom eter w avelength to a set w avelength. C lick [G oto W avelen gth] to display th e
dialog bo x show n belo w .
Page 72

59
F igure 5.12 [G oto W avelength] dialog box
[W avelength] T ext box for inputting a w avelength.
<O K > M oves the spectrop hotom eter w avelength to the set w avelength.
<C ancel> C loses the dialog box w ithout changing the p reviou sly set w avelength.
5.1.5 [A uto Z ero]
S ets the absorbance (or transm itta nce) of the current w avelength to zero (or 100% T for transm ittance).
5.1.6 [E xchange W aveleng th...]
C hanges the exchange w aveleng th of the spectrophotom eter light source and the exchange w avelength of
the diffraction grating (V -570).
F igure 5.13 [E xchange W avelength] dialo g box
[W avelength for Lam p E xchange] S ets the deuterium lam p and halogen lam p
exchange w avelength. E nter a w avelength in
the text box.
Input range: 330 to 350 nm (340 nm as default)
5.1.7 [W avelen gth for G rating E xchange...]
In the V -570, you can also set the excha nge w avelength for th e diffraction grating.
[W avelength for G rating E xchange] S ets the exchange w avelength for the diffraction grating fo r
U V /V IS region and diffraction grating for near infrared region.
Input range: 750 to 900 nm
5.1.8 [E xit]
E xits the spectrum m easurem ent progra m an d returns to [S pectra M anager].
5.2 [H elp] m e nu
[A bou t...] D isplays inform ation such as pro gram version.
Page 73

60
6. [Time Course Measurement]
M easu res changes in a sam ple over tim e at a set w a velength.
In the [S pectra M a nager] w indow , double-click [T im e C ourse M easurem ent]. T he program starts, and the
w indow show n below opens.
Title Bar
Menu Bar
Monitor Bar
Data display field
F igure 6.1 [T im e C ourse M easurem ent] w indow
[T im e C o urse M easurem ent] w indow
T itle B ar D isplays the nam e o f the pro gram . T h e color changes w hen the w indow is
active.
M enu B ar C ontains the m enus of the program . E ach m enu contains a list o f
com m ands.
M onitor B ar D isp lays current m easurem ent values.
W avelength, photom etric value and sam ple N o. from left to rig ht.
D ouble-clickin g the w avelength display opens the [G oto W avelength]
dialog box: it is used for m oving the w avelength to an arbitrary w avelen gth.
D ouble-clickin g th e photom etric value display opens the [P aram eter]
dialog bo x: it is used for setting m easurem ent param eters.
D ata display field A rea in w hich data is displayed. W hen m easurem ent is finished, the data
is autom atically transferred to the [S pectra A nalysis] program .
M enu
[M easurem ent] m enu
[S tart] S tarts tim e course m easurem ent.
[P aram eter...] S et and save param eters.
[M ove W avelength...] M oves the spectrophotom eter w avelength to a set w avelength.
[A uto Z ero] S ets the absorbance (or transm ittance) of the current w a velength to zero
(or 100% T for transm itta nce).
[E xit] E xits the [Tim e C ourse M ea surem ent] progra m and returns to [S pectra
M anag er].
Page 74

61
[H elp] m enu
[A bout...] D isplays inform ation such as pro gram version.
6.1 [M e asurem ent] m e nu
6.1.1 [S tart]
S tarts tim e course m easurem ent. C hanges are displa yed in real tim e. The vertical axis during m easurem ent
is 0 to 1 A bs in ph otom etric m ode, and 0 to 100 in T % m ode.
F igure 6.2 [T im e course m easurem ent] w indow
W hen m easurem ent is finished, the data is displayed again on the vertical axis set by the param eters. A t the
sam e tim e, the [S pectra A nalysis] program starts.
T o stop m easurem ent, press the <S top> button. This displa ys th e m easurem ent data again on the set
vertical axis and starts the spectra analysis pro gram .
N ote 1: A fter activating spectra analysis and starting initial m easurem ent, the next view show ing the results covers
the [S pectrum V iew ], and hides it. T o save the hidden [S pectrum V iew ], save or print it. T o display the
hidden [S pectrum V iew ] again, change the application.
N ote 2: If m easurem ent in progress is interrupted, the [S pectrum V iew ] displays all data up to that point.
6.1.2 [P aram eter...]
C lick [M easurem ent] - [P aram eter...] to set and save param eters. T he param eter dialog box has tw o pages:
[P aram eters] dialog box and [D ata F ile] dialog box. C lick the [D ata File] tab w hile the [P aram eters] dialog box is
active to activate the [D ata F ile] dialog box.
P aram eters are set in the [P aram eters] dialog box. Inform ation such as the filenam e for autom atically saving
m easurem ent data can be input in the [D ata File] dialog box.
6.1.2.1 [Parameter] dialog box
C lick [M easurem ent] - [P a ram eter...] to displa y the dialog box show n below .
Page 75

62
F igure 6.3 [P aram eter] dialog b ox
[P hotom etric M ode] S ets the ph otom etric m ode.
S electable range:
A bs: A bsorbance m easurem ent
% T: T ransm ittance m easurem ent
% R : R eflectance m easurem ent
S am ple: S ingle-beam m easurem ent on the sam ple
bea m side
R eference: S ingle-beam m ea surem ent on the reference
bea m side
N ote: For m odels V -550/560/570, w hen [S am ple] or [R eference] is selected, [P M T voltage] is added to the left
side. Input the voltage to be applied to the photom ultiplier. T he input range is 0 to 1000 V .
[R esponse] R esponse by sim ple m oving average. S electable rang e varies according
to the m odel.
V -530:
Q uick: M oving average during about 0.03 sec
F ast: M oving average during about 0.25 sec
M edium : M oving average during about 1 sec
V -550/560/570:
Q uick: M oving average during about 0.03 sec
F ast: M oving average during about 0.25 sec
M edium : M oving average during about 1 sec
S low : M oving average during about 4 sec
[B andw idth] S pectral band w idth. S electable range varies according to the m odel.
V -530: F ixed at 2 nm
V -550/56 0: 0.1, 0.2, 0.5, 1, 2, 5, 10 nm
V -570: 0.1, 0.2, 0.5, 1, 2, 5, 10 nm
0.4, 0.8, 2, 4, 8 , 20, 40 nm (near infrared
region)
N ote: W hen u sing the V -570 for m easurem ent from the near-infrared region to the visible region in succession,
the bandw idths listed in Table 4.4 should be paired. If the bandw idth is set to the sam e (nearly equal)
valu e, noise in the near-infrared region m easurem ent value w ill increase.
Page 76

63
T able 6.1
U ltraviolet/visible regio n bandw idth (U V ) nm N ear-infrared bandw idth (N IR ) nm
0.1 0.4
0.2 0.8
0.5 2
1 4
2 (L2) 8
5 (L5) 20
10 (L10) 40
[W avelength] S ets the m easurem ent w avelength. Inpu t ra nge varies according to the
m odel.
V -530: 190.0 to 1100.0 nm
V -550/56 0: 190.0 to 900.0 nm
V -570: 190.0 to 2500.0 nm
[E nd T im e] M easurem ent tim e interval in seconds.
[D ata P itch] D ata collecting w avelength interval. S electable range varies acco rding to
the m odel.
V -530: 0.1, 0.2, 0.5, 1, 2 nm
V -550/56 0/570 : 0.025, 0.05, 0.1, 0.2, 0.5, 1, 2 nm
[S am ple N o.] S ets w hich sam ple should be m easured first. Subsequent sam ples are
m easured in order from the first sam ple num ber, increasing in increm ents
of one.
[D isplay] S ets the up per and low er lim its of the vertical axis ra nge displayed on the
screen. If [A uto] is selected, the full-scale axis is set to about 1.2 tim es the
m axim um w idth of the displayed spectrum , based on the m ea surem ent
result.
<O K > E nds param eter setting, and closes the dialog box. C lick this button to
transfer the set param eters to the spectrophotom eter.
<C ancel> S tops para m eter setting w ithout changin g the previous settings, and
closes the dia log box.
<Save...> S aves param eters in the param eter library on the hard disk (see S ection
5.1.2.1 P aram eters] dialog box).
<O pen...> Previously saved param eters in the param eter library can be selected (see
S ection 5.1.2.1 [P aram eters] dialog box).
6.1.2.2 [Data File] dialog box
C lick [D ata F ile] in the [P aram eters] dialog box to display the [D ata F ile] dialog box (see S ection 5.1.2.2
[D ata F ile] dialog bo x).
6.1.3 [M ove W avelength...]
M oves the spectrop hotom eter w avelength to a set w avelength (see S ection 5.1.4 [M ove W avelength...]).
6.1.4 [A uto Z ero]
S ets the absorbance (or transm itta nce) at the current w avelength to zero (or 100% T for transm ittance).
6.1.5 [E xit]
E xits the [T im e C ourse M easurem ent] program a nd returns to [S pectra M ana ger].
Page 77

64
6.2 [H elp] m e nu
[A bou t...] D isplays inform ation such as pro gram version.
Page 78

65
7. [Fixed Wavelength Measurement]
[F ixed W avelength M easurem ent] m easures sam ple absorbance or tran sm ittance at a fixed w avelen gth.
D ouble-click [F ixed W avelength M easurem ent] in the [S pectra M anager] w indow . T he program starts an d
the w indow show n belo w appears.
Title Bar
Menu Bar
Monitor Bar
Data display field
F igure 7.1 [F ixed W avelength M easurem ent] w ind ow
[F ixed W avelength M easurem ent] w indow
T itle B ar T he color changes w hen the w indow is active.
M enu B ar C ontains the m enus of the program . E ach m enu contains a list o f
com m ands.
M onitor B ar D isp lays current m easurem ent values.
W avelength, photom etric value, and sam ple N o. fro m left to right.
D ouble-clickin g the w avelength display displays th e [G oto W avelength]
dialog box, used for m oving the w avelength to an arbitrary w avelength.
D ouble-clickin g the photom etric value display displays the [P ara m eter]
dialog bo x, used for setting m easurem ent param eters.
D ata display field Field w here data is displayed.
M enu
[M easurem ent] m enu
[S tart](
) S tarts fixed-w avelength m ea surem ent.
[B la nk]( ) Starts blank m easurem ent.
[P aram eter...] S et and save param eters.
[B la nk C o rrect] ([C orrect]) B lank correction O N /O F F . A check m ark m eans it is O N .
[M ove W avelength...] M oves the spectrophotom eter w avelength to a set w avelength.
[A uto Z ero] S ets the absorbance (or transm ittance) of the current w avelength to zero
(or 100% T for transm itta nce).
[E xit] E xits the [F ixed W avelength M easurem ent] program and returns to
[S pectra M anager].
[H elp] m enu
Page 79

66
[A bout...] D isplays inform ation such as pro gram version.
7.1 [M e asurem ent] m e nu
7.1.1 [S tart]
S tarts fixed-w avelength m easurem ent. T o suspend m easurem ent, click <S top> .
7.1.2 [B lank] ( ) [B lan k C orrect] ([C orrect])
S tarts blank m easurem ent. W hen finished, the blank value (B LK ) appears on the screen an d a check m ark
is put to [B lank C orrect] ([C orrect]). M easuring the sam ple in this condition subtracts the blank value. If
blank correction is no t needed, rem ove the check m ark from [B lank C orrect] ([C orrect]).
S tarting the second and later blank m easurem ents displays the follow ing m essage. C licking <O K > updates
the blank value in m em ory and displays the blank value (B LK ) on the screen. N ew blank values are applied
to the sam ples that are m easured after that.
F igure 7.2 [B lank M easurem ent] dialog box
N ote: T o stop m easurem ent, press the <S top> button.
Page 80

67
7.1.3 [P aram eter...]
S ets param eters, and saves them to the hard disk.
C lick [M easurem ent] - [P a ram eter...] to displa y the dialog box show n below .
F igure 7.3 [param eters] dia log box
[P hotom etric M ode] S ets the ph otom etric m ode.
S electable range:
A bs: A bsorbance m easurem ent
% T: T ransm itta nce m easurem ent
% R : R eflectan ce m easurem ent
S am ple: S ingle-beam m easurem ent on the sam ple beam side
R eference: Single-beam m ea surem ent on the reference b eam side
N ote: For m odels V -550/560/570, w hen [S am ple] or [R eference] is selected, [P M T voltage] is added to the left
side. Input the voltage to be applied to the photom ultiplier. T he input range is 0 to 1000 V .
[R esponse] R esponse by sim ple m oving average. S electable rang e varies according
to the m odel.
V -530:
Q uick: M oving average during about 0.03 sec
F ast: M oving average during about 0.25 sec
M edium : M oving average during about 1 sec
V -550/560/570:
Q uick: M oving average during about 0.03 sec
F ast: M oving average during about 0.25 sec
M edium : M oving average during about 1 sec
S low : M oving average during about 4 sec
[B and w idth] S pectral bandw idth. S electable range varies accord ing to the m odel.
V -530: F ixed at 2 nm
V -550/56 0: 0.1, 0.2, 0.5, 1, 2, 5, 10 nm
V -570: 0.1, 0.2, 0.5, 1, 2, 5, 10 nm
0.4, 0.8, 2, 4, 8 , 20, 40 nm (near infrared
region)
Page 81

68
N ote: W hen u sing the V -570 for m easurem ent from the near-infrared region to the visible region in succession,
the bandw idths listed in T able 7.1 should be paired. If the bandw idth is set to the sam e (nearly equal)
valu e, noise in the near-infrared region m easurem ent value w ill increase.
T able 7.1
U ltraviolet/visible regio n bandw idth (U V ) nm N ear-infrared band w idth (N IR ) n m
0.1 0.4
0.2 0.8
0.5 2
1 4
2 (L2) 8
5 (L5) 20
10 (L10) 40
[W avelength] D ialog box for inputting m easurem ent w avelen gth. U p to 8 w avelengths
can be input. T he w avelength input range varies according to th e m odel.
V -530: 190.0 to 1100 .0 nm
V -550/56 0: 190.0 to 900.0 nm
V -570: 190.0 to 25 00.0 nm
W avelength display field: D isplays the input w avelength.
T ext box: A rea for inputting w aveleng th.
<A dd> : Loads input w avelength into th e display field.
H o w to add w avelength
1) Input a w avelength in the text bo x.
2) C lick <A dd> .
<C hange> : R ew rites w avelength in the d isplay field.
H o w to change w avelength
1) S elect a w avelength from the displa y field.
2) Input new w avelength in the text box.
3) C lick <C hange> .
<D elete> : D eletes a w aveleng th from the display field.
H o w to delete w avelength
1) S elect a w avelength to be deleted from the disp lay field.
2) C lick <D elete> .
[S am ple N o.] S ets w hich sam ple should be m easured first. Subsequent sam ples are
m easured in order from the first sam ple num ber, increasing in increm ents
of one.
[N o. of C ycles] S ets num ber of m easurem ents for each sam ple. If 2 or m ore
m easurem ents are set, the [C ycle T im e] field is displayed. If sam ple is
m easured by setting m ultiple cycles, m easurem ent values for each of the
cycles as w ell as the average value are displayed.
Input range: 0 to 999.
[C ycle T im e] S ets the tim e betw een m ea surem ents in seconds. If the set tim e is sho rter
than the m easurem ent tim e, the next m ea surem ent starts im m ediately.
Input range: 0 to 15000 sec.
Page 82

69
<O K > E nds param eter setting. C lick this button to transfer the set para m eters to
the spectrophotom eter. A t the sam e tim e, the dialog box closes.
<C ancel> S tops para m eter setting w ithout changin g the previous settings, and
closes the dia log box.
<Save...> S aves param eters in the param eter library on the hard disk (see S ection
5.1.2.1 [P aram eters] dialog box).
<O pen...> Previously saved param eters in the param eter library can be selected (see
S ection 5.1.2.1 [P aram eters] dialog box).
7.1.4 [G oto W avelength...]
M oves the spectrop hotom eter w avelength to a set w avelength (see S ection 5.1.4, [M ove W avelength...]).
7.1.5 [A uto Z ero]
S ets absorbance (or transm ittance) at the current w avelength to zero (or 10 0% T for transm itta nce).
7.1.6 [E xit]
E xits the [F ixed W avelength M easurem ent] program and return s to [S pectra M anager].
7.2 [D ata]
[N ew ] D eletes the displayed data and creates a new data file. B e careful, if the
data has not been saved on the disk, the data w ill be lost.
[S ave A s...] S aves da ta under a set nam e (see S ection 4.1.4, [S ave A s...]).
[P rint...] P rints the data (see S ection 4.1.7, [P rint...]).
[P rint S etup...] S ets the ta rget printer an d the prin ting condition s (see S ection 4.1.6, [P rint
S etup]).
7.3 [H elp] m e nu
[A bou t...] D isplays inform ation such as pro gram version.
Page 83

70
8. [Abs/%T Meter]
[A bs/% T M eter] is a display of the analog spectrophotom eter on the screen. Y ou can rea d A bsorbance
(A bs) or transm ittance (% T ) at a set w avelength.
In the [S p ectra M anager] w indow , double-click [A bs/% T M eter]. T he program starts and the w indow below
appears.
F igure 8.1 [% T /A bs M eter] w indow
T he sam ple m ea surem ent value is displayed on the m eter and in the [nm ] (w avelength), [% T]
(transm ittance), a nd [A bs] (absorbance) field ab ove the m eter.
<H old/S tart> C lick this button to accept a m easurem ent value. W hen the m eter pointer
is fixed in position, this button changes to <S tart> . C lick this button a
second tim e to return to original sta tus. This function is useful for
obtaining da ta w hen the m eter pointer is un steady.
<A uto Z ero> S ets the absorbance (or transm ittance) at the current w avelength to zero
(100% for transm ittance).
<G oto W L...> M oves the spectrophotom eter w avelength to a set w avelength (see
S ection 5.1.4, [M ove W avelength]).
<S etting...> S ets pa ram eters. C lick this b utton to display the dialog box show n below .
F igure 8.2 [P aram eter S etting] dialog box
[R esponse] R esp onse by sim ple m oving average.
S electable range:
Q uick: M oving average during about 0.03 sec
F ast: M oving average during about 0.25 sec
Page 84

71
M edium : M oving average during about 1 sec
S low : M oving average during about 4 sec
[B and w idth] S pectral bandw idth. S electable range varies a ccording to the m odel.
V -530: F ixed at 2 nm
V -550/56 0: 0.1, 0.2, 0.5, 1, 2, 5, 10 nm
V -570: 0.1, 0.2, 0.5, 1, 2, 5, 10 nm
0.4, 0.8, 2, 4, 8 , 20, 40 nm (near infrared
region)
<A bout...> D isplays program version inform ation.
Page 85

72
9. [Environment]
S ystem hardw are setting, self-d iagnosis, optional accessory setting, and w avelength correction can be
started from this m enu.
In the [S pectra M anager] w indow , double-click [E nvironm ent]. T he [E nviro nm ent] dialog box show n below
appears. C lick an item .
F igure 9.1 [E nvironm ent] dialog box
[Item s] Lists the item s to set.
[H ardw are S etting]: S ets w hether to turn the lam p O N or O FF , selects the lam p changeover
w avelength, and sets the lam p operating hours
[D iagnosis]: D iagnoses the spectrophotom eter status.
[A ccessories S etting]: S ets the conditions of the optional intelligent accessories that have
com m unicating functions.
[W avelength C orrection]: C orrects the w avelength using the em ission of the deuterium lam p.
9.1 [H ardw are S etting ]
S ets w hether to turn the lam p O N or O F F , selects the lam p changeover w avelength, and sets the lam p operating
hours. S elect [H ardw are Setting] from the [E nvironm ent] dialog box, then press <E xecute>. The dialog box show n
below appears.
F igure 9.2 [H ardw are S etting] dialog box
[Lam p] S ets w hether to turn the deuterium and halogen lam ps O N or O F F . S elect
a check box, then press <O K > to close the dialog box. T he selected lam p
Page 86

73
is turned O N . If both lam p s are selected, the lit lam p changes from
halogen to deuterium at the set [W avelength for Lam p E xchange]
w avelength. A t the changeover w avelength, the halogen lam p beco m es
activated.
[W avelength for S ets w aveleng th at w hich th e deuterium lam p
Lam p E xchange] sw itches O F F and the halogen lam p sw itches O N . Input th e w avelen gth in
the text box.
Input range: 330 to 350 nm .
D efau lt value: 34 0 nm .
[D euterium Lam p U se] T otal tim e of deuterium lam p use. W hen the light source is repla ced , input
0 in the text box. T he tim e is reset.
[H alogen Lam p U se] T otal tim e of halogen lam p use. W hen the light source is replaced, input 0
in th e text box. T he tim e is reset.
N ote: For the V -570, [W avelength for G rating E xchange] can also be selected.
[W avelength for S ets the diffraction grating chang eover w avelength
G rating E xchange] for the ultraviolet/visible region and for the near-infrared region. Input the
w avelength in the text box.
Input range: 750 to 900 nm .
D efau lt value: 85 0 nm .
9.2 [D iag nosis] m enu
A utom atically diagnoses the spectrophotom eter for the item s listed in the figure below .
F igure 9.3 [D iagnosis] dialog box
[Longer W avelength Lim iter] O K if the longer w avelength lim iter is operating properly.
[S horter W avelength Lim iter] O K if the shorter w avelength lim iter is operating properly.
[P M T V oltage C ontrol] O K if correct voltage is applied to the p hotom ultiplier.
[H alogen Lam p] O n if the ha logen lam p is operating properly.
[D euterium Lam p] O n if the deuterium lam p is o perating p roperly.
[S ector M irror] O K if th e sector m irror rotates at 33 H z.
[B attery] O K if the m em ory backup battery is charged.
[A /D C onversion ] O K if th e A /D converter is operating prop erly.
N ote: For the V -530, [P M T V oltage C ontrol] and [S ector M irror] are not available.
Page 87

74
<R etry> D oes self-diagnosis again.
<C lose> E nds self-diagno sis.
9.3 [A ccesso rie s S e tting]
S ets the conditions of the optional intelligent accessories that have com m unication functions. F or details,
refer to the instructio n m anuals for the accessories.
F igure 9.4 [A ccessories S etting] dialog bo x
S ipper
[C ontrol] check box W hen checked, th e sipper is used.
[S uction] Sam ple suction tim e.
[S ending] T im e required to pum p the sam ple into the cell. V alid w ith peristaltic-p um p
sipper.
[D elay] W aiting tim e before m easurem ent (from sam ple suction or end of
pum ping to start of m easurem ent).
[D rain] S am ple d ischarge tim e.
[D irection] S ets the draining direction of the m easured sam ple. A ctivated w hen the
option button is selected. V a lid w ith peristaltic-pum p sipper.
[F orw ard ]: R otates the pum p forw ard and discharges th e sam p le into the w aste
solution bottle.
[B ackw ard]: R otates the pum p in the reverse direction and recovers sam ple into th e
sam p le container.
C ell P ositioner
[C ontrol] check box W hen checked, th e cell chang er is used.
[N o. of C ells] S ets how m any cells to use.
Page 88

75
T em peratu re C on troller
[C ontrol] check box W hen checked, the tem perature co ntroller is used.
[T em perature] S et tem perature.
[S tirrer] W hen checked, the stirrer is used.
[S ensor] S elects a tem perature sensor.
[Internal]: A llow s tem perature m ea surem ent usin g the sensor in corporated in th e
cell holder.
[E xternal]: A llow s tem p era ture m easurem ent using external sensor dipped in the cell.
S am ple tem perature can be m easured directly.
9.4 [W aveleng th C o rre ctio n]
C orrects the w avelength using the em issio n of the deuterium lam p . S electing this item displays the dialo g
box show n below .
F igure 9.5 [W avelength C orrection] dialo g box
[W avelength R ange] F or M odel V -570, corrects the w avelength for each of th e visible and
near-infrared regions.
<E xecute> S tarts w avelength correction.
Page 89

76
10. Appendix
10.1 S p e ctra M anag e r Installation
10.1.1 B efore installation
B efore installing the [S pectra M anager], confirm the follow ing:
* T he com puter a nd all periphera l devices are properly co nnected .
* W indow s 95/98/N T 4.0 is installed.
* S ufficient space (about 5 M B ) is available on the hard disk to install the [S pectra M a nager].
N ote: F or first-tim e users of W indow s 95/98 /N T 4.0/2 000, install W indow s according to th e procedure described
in the W indow s 95/98/N T 4.0/2000 U ser’s G uide.
R efer to the W indow s 95/98/N T 4.0/20 00 Instruction M a nual for details on how m uch disk space is required.
10.1.2 Insta lling S pectra M anager from F loppy D isk
Install the [S pectra M a nager] after starting up W indow s 95/98/N T 4.0 as follow s:
1. S tart up S E TU P .E X E .
2. Inpu t the nam e of the operator or com pany.
3. S pecify the [S pectra M anag er] directory.
4. S pecify the data directory.
5. Install the files on the hard disk.
10.1.2.1 Starting up SETUP.EXE
(1) C lick [S etting s] - [C ontrol P anel] on the [S tart] m enu as show n in Fig. 10.1. The [C ontrol P anel]
w indow is show n in F ig. 10.2.
F igure 10.1 W indow s 95
Page 90

77
F igure 10.2 [C ontrol P anel]
(2) D ouble-click [A dd/R em ove P rogram s] in the [C ontrol P anel] w indow . T he w indow below appears.
F igure 10.3 [A dd/R em ove P rogram s P roperties]
Page 91

78
(3) S elect [Install/U nin stall], then click the < Install (I)> button. T he w indow below ap pears.
F igure 10.4 [Install P rogram F rom F loppy D isk or C D -R O M ]
(4) C lick the < N ext> button in the w indow show n in F ig. 10.4. T he w indow show n in F ig. 10.5 app ears.
F igure 10.5 [R un Installation P rogram ]
Page 92

79
(5) C lick the < F inish > b utton. T he w ind ow b elow appears.
F igure 10.6 [S pectra M anager] for W indow s S etup
(6) C lick the < N ext> button. T h e screen sho w n in F ig. 10.7. appears.
F igure 10.7
10.1.2.2 Inputting operator name or company name
(1) Input the nam e of the operator or com pany in the text box sh ow n in F ig. 10.7. T he nam e that you
input is registered in the system . T h is procedure can be om itted if registration is unnecessary.
N ote:
T he nam e of the operator or com pany is used as the default setting for O perator or O rganization com m ents
w ith data collected using the [S pectra M anager].
Page 93

80
(2) C lick the < N ext> button. T h e dialog box show n in F ig. 10.8 app ears.
F igure 10.8 T arget program d irecto ry setting for [S pectra M anager]
10.1.2.3 Setting the program directory
(1) Input the drive a nd na m e of the target [S pectra M an ager] program directory.
T he follow ing directory nam e should be used:
c:\jascow 32
(2) C lick the < N ext> button. T h e screen sho w n in F ig. 10.9 appears.
F igure 10.9 D ata D irectory input screen
10.1.2.4 Setting the data directory
(1) Input the drive a nd na m e of the target [S pectra M an ager] da ta directory.
T he follow ing directory nam e should be used:
c:\jascow 32\data
(2) C lick the < N ext> button. T h e m essage prom pt show n in F ig. 10.10 appears.
F igure 10.10 M essage prom pt for installing S p ectrophotom eter control driver
Page 94

81
(3) C lick the < Y es> button. T h e dialog box show n in F ig. 10.11 appears.
F igure 10.11 [S pectra M anager] S etup dialog box
(4) Insert the [JA S C O Instru m ent] disk into the floppy disk drive. C lick the <N ext> button. T he screen
show n in F ig. 10.12 appears.
F igure 10.12 C onfirm ation of control driver
(5) C lick the < C ontinue> button. T he screen show n in F ig. 10.13 appears.
F igure 10.13 M odel nam e and serial num ber input screen
(6) Input the m odel nam e and serial num ber if necessary. C lick the < N ext> button .
10.1.2.5 Copying files to hard disk
T he [S etup] prog ram copies the [S pectra M anager] p rogram an d related files to the hard disk. A s these files
are copied, [S etup] m ay request th at the operator insert disks in to the floppy disk d rive. If so, click <O K >
after each disk has been inserted into the drive.
A fter the files have been copied, the [S etup] program creates a Jasco group. A dialog box appears,
Page 95

82
indicating that installation has finished. C lick <O K >.
10.1.3 Insta lling
Spectra Manager from CD-ROM
(1) O pen [C ontrol P anel], select [A dd/R em o ve P rogram s] to run p rogram .
F igure 10.14
(2) P lace the setup C D in the C D -R O M drive and click < S etup > .
(3) T h e m essa ge " If this is the correct installatio n program ,…" w ill appear. H ere, click < B row se...> .
F igure 10.15
(4) S elect C D -R O M drive [S pectra M anager\D isk1\S etup], click < O K > and the setup of S pectra M ana ger
w ill begin. W hen "user nam e" is requested during the setup, please input com pa ny or personal user
nam e.
F igure 10.16
(5) W hen the setup of S pectra M anager is fin ished, setup of [Instrum ent driver] w ill start autom a tically.
Page 96

83
P lease select and click [Instrum ent driver V er x.xx.xx\D isk1] to continue the setup.
F igure 10.17
(6) T h e next step w ill be to set up each of the various applica tions. C lick < start> o n the taskbar and
pro ceed to [program ], then [Jasco], then [S pectra M anager setup] and click to run program .
F igure 10.18
(7) S elect [applicatio n] from the m enu box and click <next>.
F igure 10.19
(8) In the sam e w ay as above, click the < B row se..> b utton to start the setup of the application.
(R epeat this process to set up each application).
Page 97

84
10.2 S e tting the S e rial P ort (R S -232C )
T he serial port default value is [C O M 1]. T he serial port num ber m ust be changed w hen the
S pectrophotom eter is controlled through another port. T he procedure is as follow s:
F igure 10.20 [S pectra M an ager] w indow
(1) C lick [Instrum ents] - [P ort S etting] on the [S pectra M anager] m enu. T he dialog box show n in F ig.
10.21 appears.
F igure 10.21 [P ort S ettin g]
(2) S elect the serial port in the box, then click < O K >. T he new ly selected serial port is now set.
Page 98

85
Page 99

JASCO Corporation
2967-5 Ishikawa-machi, Hachioji
TOKYO, Japan
Printed in Japan
 Loading...