

Page 1

MODEL J-810
SPECTROPOLARIMETER
Hardware/Function Manual
JASCO Corporation
P/N: 0302-0407A March 1999
Page 2

Safety Cautions
Correct operation and scheduled maintenance are essential for safe use
of the instrument. Read the safety cautions in this manual and fully
understand them before operation.
″WARNING″, ″CAUTION″ and ″Note″ are used throughout this manual
to call operator′s attention to safety.
(1) Meanings of safety notations
WARNING : Failure to comply with this involves the possibility of death
or serious personal injury. Serious personal injury means
loss of sight, injury, burn (high temperature, low
temperature), electric shock, fracture, intoxication, etc.
which can cause sequel or require hospitalization or longterm treatment at hospital.
CAUTION : Failure to comply with this involves the possibility of minor
personal injury or physical damage. Minor personal injury
means injury that does not require hospitalization or longterm treatment, and physical damage means damage to the
instrument itself or damage to objects other than the
instrument, such as buildings, properties, etc. (extended
damage).
Note : This contains care to be taken during operation and
information that will be helpful in operation.
i
Page 3
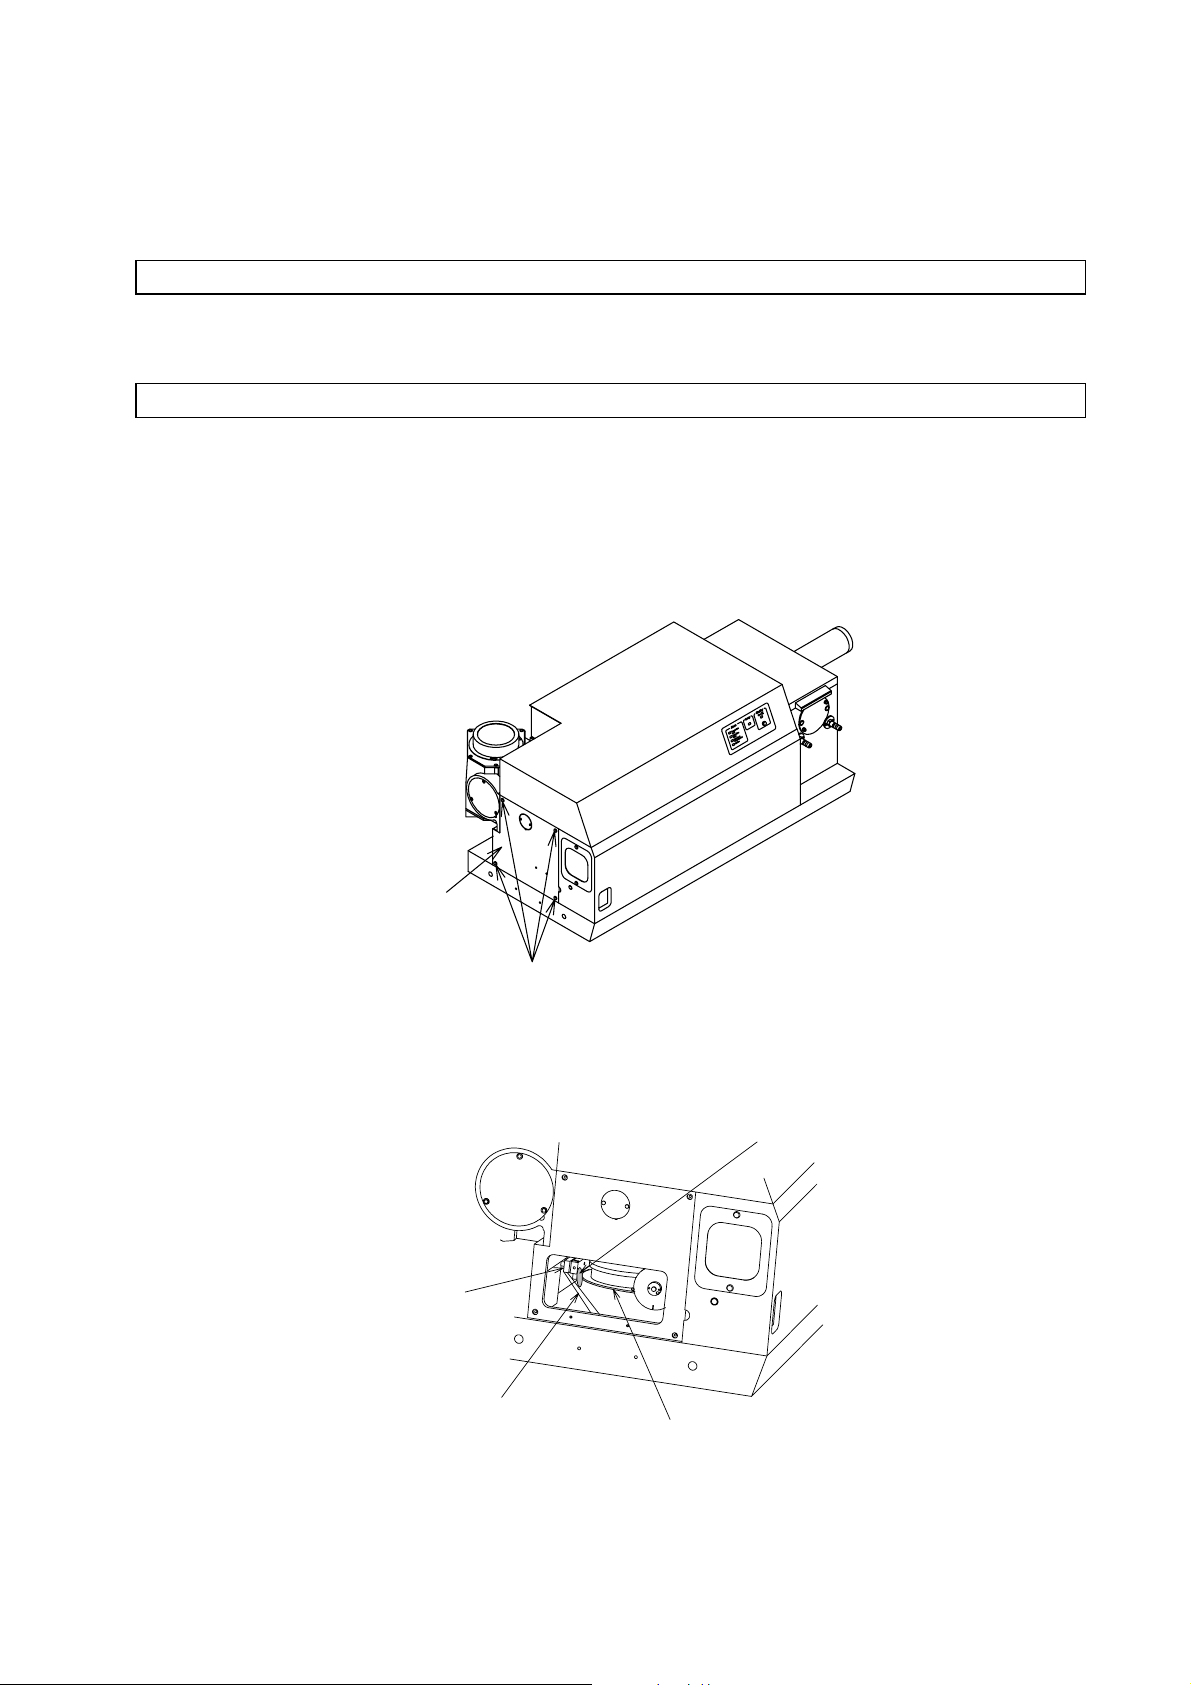
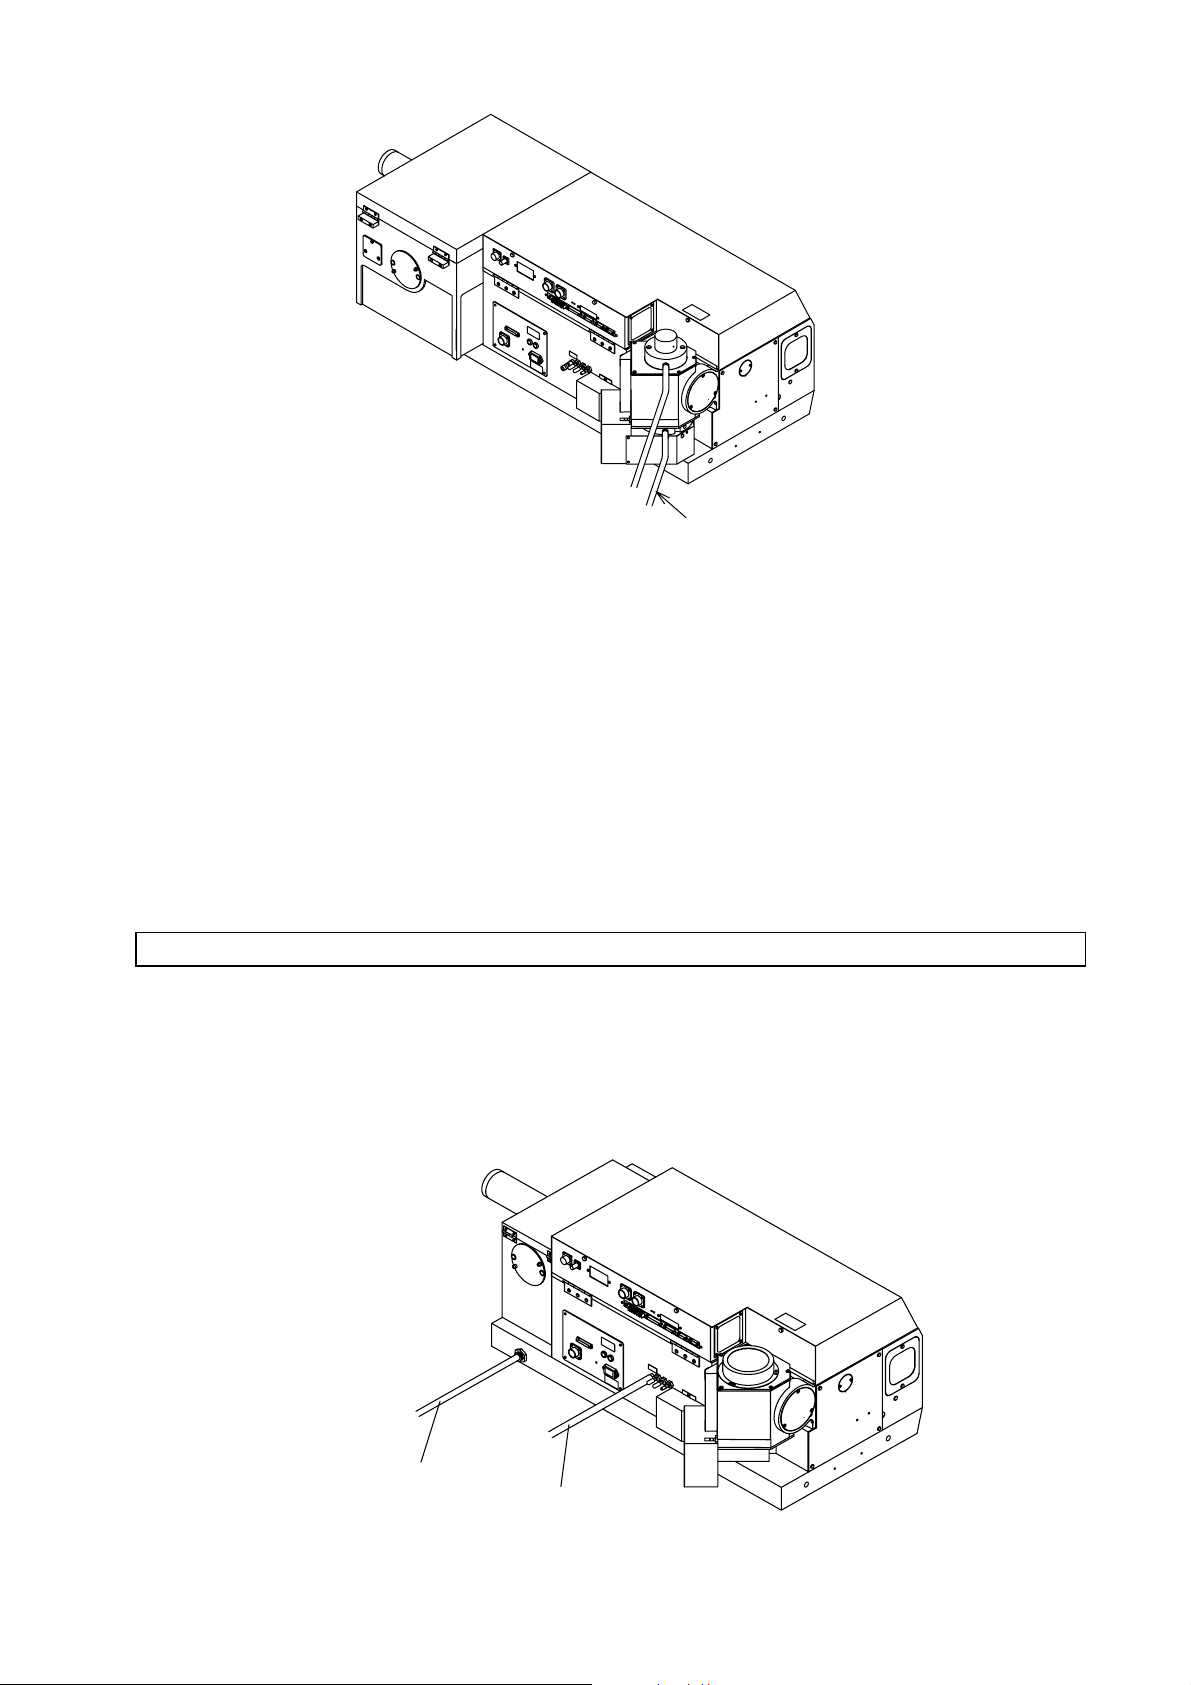
(2) Location of Warning Labels
The instrument is labeled with the following warnings. Use care not to damage or
tear the labels. Should the labels be stained or torn, contact your local JASCO
distributor with its part number.
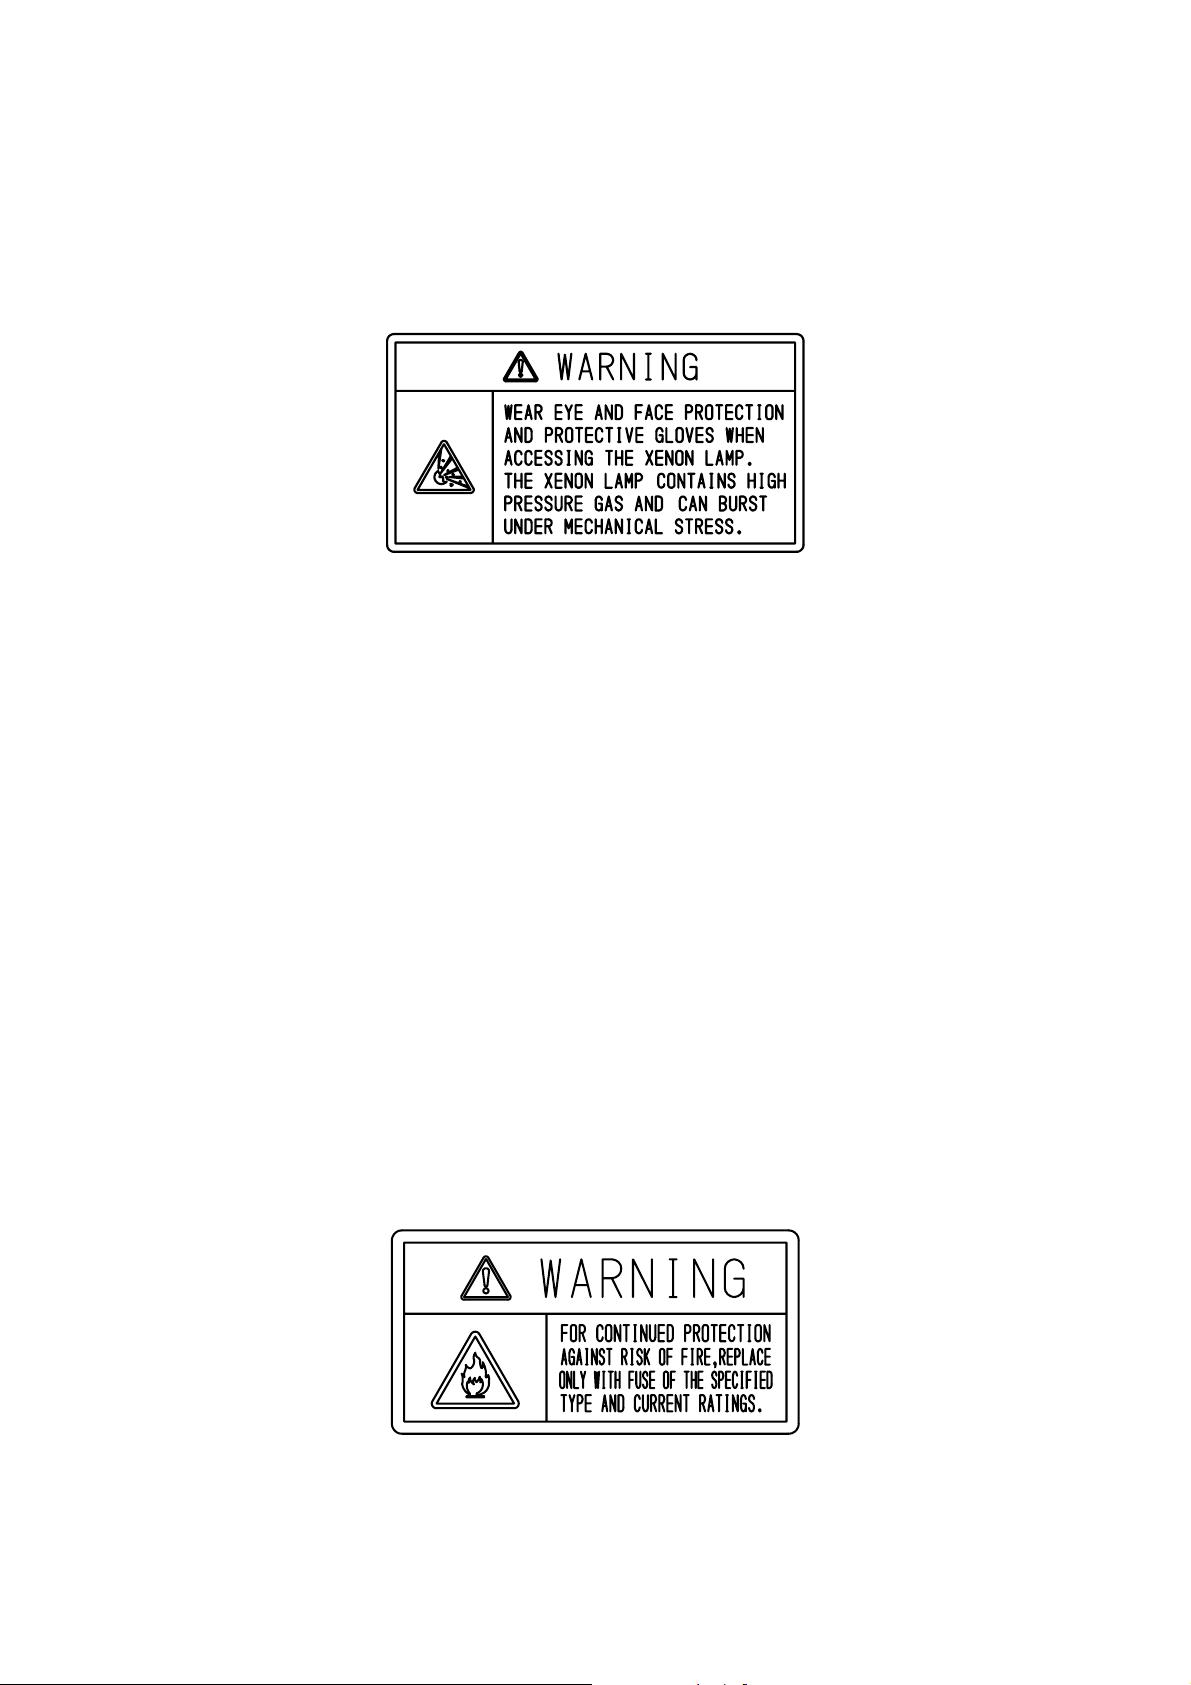
1) WARNINGS! Handling the Xenon Lamp (①of Fig. 1)
Part number:0822-0127A
. The xenon lamp is made of quartz glass and is filled with high-pressure gas (5 to 10
atm. pressure, about four times when the lamp is lit).
Twisting, bending or impact can burst the lamp, causing danger with glass
fragments. Never open the lid of the light source unit if the lamp is lit or hot.
. When handling the xenon lamp, wear protective clothing such as a thick, long-
sleeved shirt, a mask, thick gloves, etc.
. Before replacing the xenon lamp, turn the lamp off and allow it to cool for about 30
minutes.
When replacing the xenon lamp, be careful not to give an impact to the lamp.
Never twist the lamp by holding it at both ends.
. Do not mistake the mounting direction (polarity) of the lamp. The cathode will be
damaged if the lamp is mounted incorrectly, rendering the lamp inoperable.
. Do not touch the glass portion of the xenon lamp with bare skin.
. If the glass portion of the xenon lamp is contaminated, wipe it with clean gauze
moistened with alcohol.
. After removal and before disposal, place the xenon lamp in its case, and store the
case in a safe place. If the case is not available, carefully wrap the lamp in
foamed plastic or other protective wrapping, and store it in a same place.
. When disposing of the xenon lamp, carefully wrap it in a cloth, smash it with a
hammer, and dispose of it as hazardous material.
WARNING! Fuse Rating (②in Fig. 1)
Part number:0822-0102A
ii
Page 4
Use only fuses of the designated rating to protect both the operator and the
equipment from fire and other hazards. When replacing the fuse, turn OFF the ″
Power″ switch and unplug the power cable from the outlet to avoid electric shock.
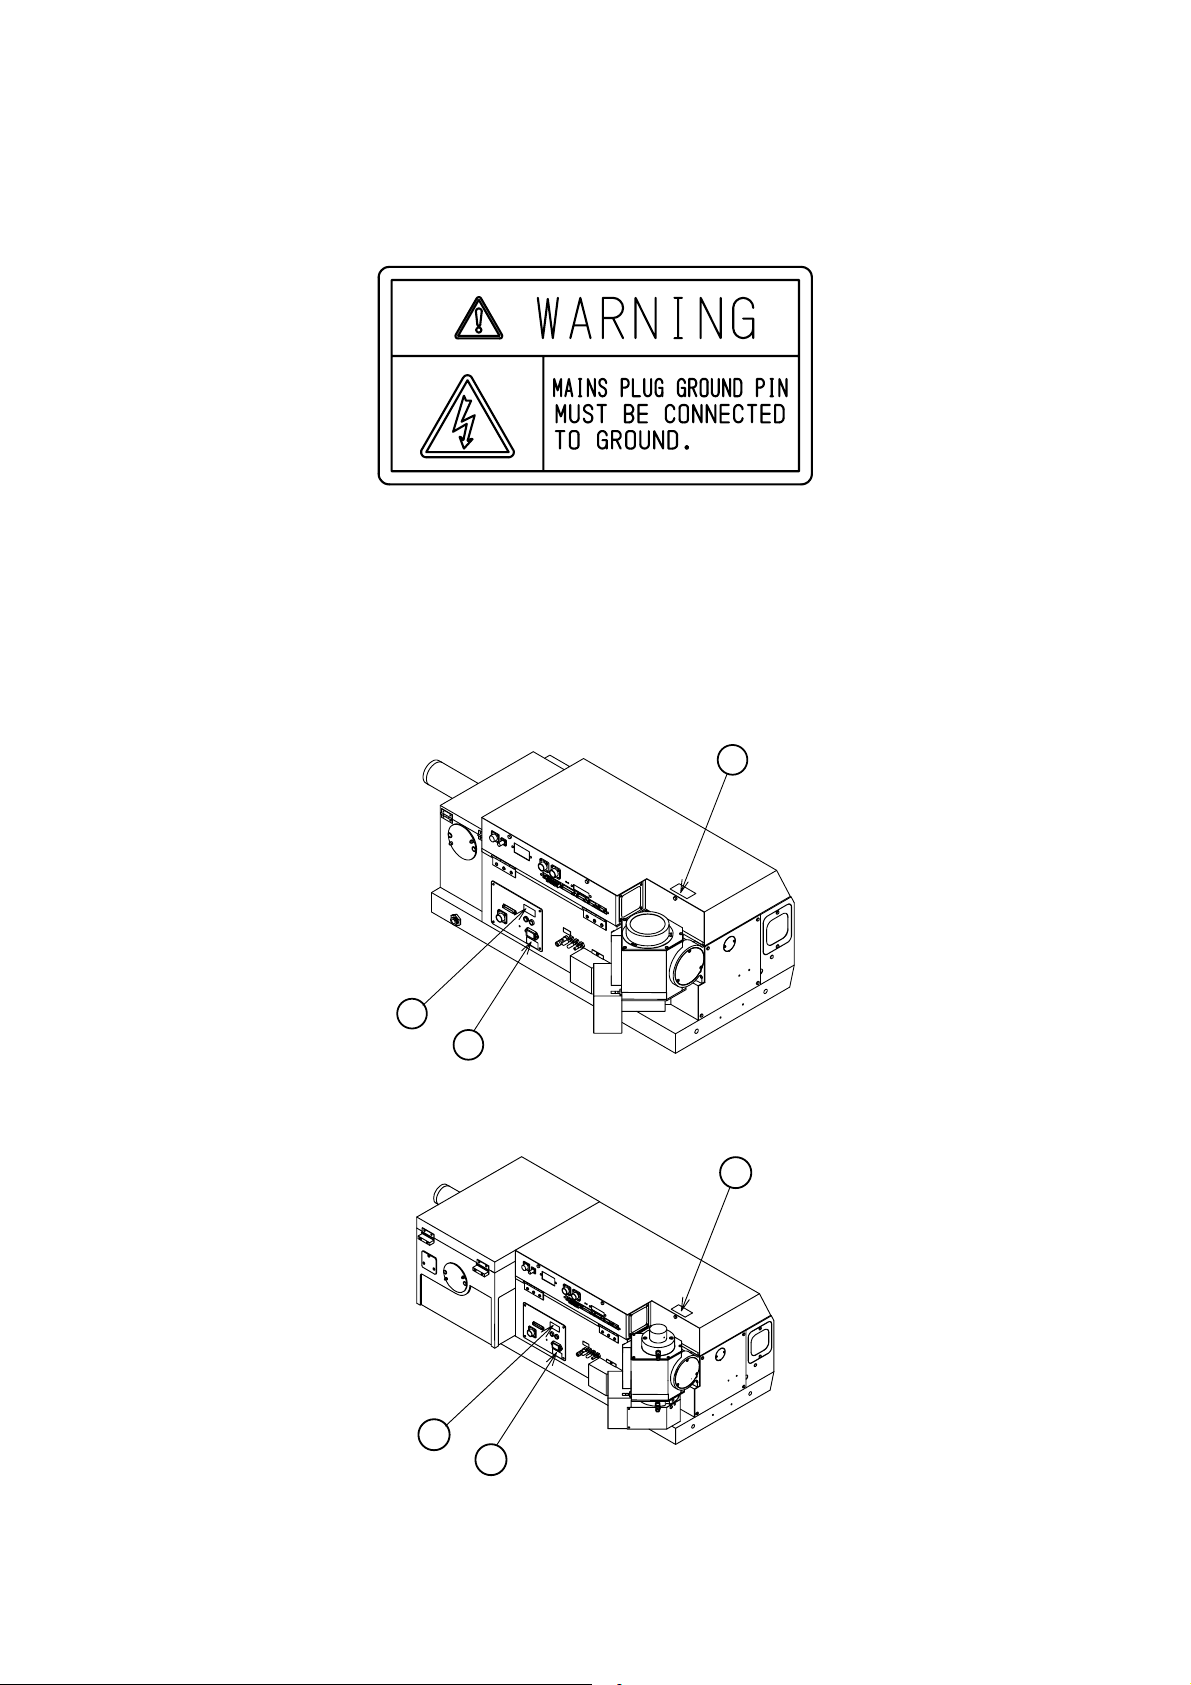
WARNING! Grounding (③in Fig. 1)
Part number:0822-0109A
If the instrument is operated without being grounded properly, the operator may be
subjected to electric shock. Correctly ground the instrument using the grounding
terminal on the switchboard. Do not use gas or water pipes for grounding, because
these pipes are often made of non-conductive material.
150W Light Source, Small Sample Chamber
2
3
450W Light Source, Large Sample Chamber
1
1
2
3
Fig. 1
iii
Page 5

Introduction
This manual is intended to serve as a guide for using the Model J-810
spectropolarimeter, both for experienced and first-time operators.
Prior to operating the instrument, the operator should carefully read and thoroughly
understand the contents of these manuals. In addition, the ″Measurement″,
″Analysis″ and ″ CD-ORD Measurement Method″ instruction manuals should be
understood in full. These three manuals should be kept at your hand at all time
during operation of the instrument. After operation, keep these manuals in your file.
Should the manuals be lost, contact your local JASCO distributor for an additional
copy.
Installation Requirements
Install the instrument in a location where the following conditions are satisfied. The
instrument should be installed in a room that is maintained at a constant temperature
and humidity, because the spectropolarimeter is sensitive to atmosphere fluctuations.
. Room temperature 20 ±5°C
. Humidity lower than 70%
. Not exposed to direct sunlight
. Not in the proximity of harmful or corrosive gas
. Not exposed to a high-intensity light source
. Not in the direct path of air currents emanating from air conditioners or other
equipment
. Relatively free of vibration
. Not in the proximity of a high-intensity magnetic or electromagnetic field
. For the 450W light source, within the proximity of a water supply (flow rate : 2 λ
/min, pressure : 0.5~2.0 kg/cm2). Cooling water piping : 10 m in length, inside
diameter : 12 mm
Note: Do not use water at more than 2.0 kg / cm2 pressure.
. Within the proximity of equipment that supplies nitrogen gas. (flow rate : more
than 3 λ/min). Nitrogen gas tube : 3 m in length, inside diameter : 9.5 mm.
. Within the proximity of nitrogen gas ventilator.
iv
Page 6

Contents
1. Overview and Specifications .........................................................1
1.1 Overview................................................................................................. 1
1.1.1 Principles of operation ...................................................................... 1
1.1.2 Optical system .................................................................................. 2
1.1.3 Electrical system............................................................................... 3
1.2 Specifications.......................................................................................... 4
2. Unpacking and Installation ............................................................7
2.1 Unpacking............................................................................................... 7
2.2 Installation Requirements ....................................................................... 7
2.3 Reassembly ............................................................................................ 8
2.3.1 Removing the cushion from the main unit......................................... 8
2.3.2 Installing the modulation element ..................................................... 9
2.3.3 Installation the detector unit ............................................................ 10
2.3.4 Connecting the cables and tubes.................................................... 11
3. Names of Functions of Components ...........................................14
3.1 Overall View.......................................................................................... 14
3.2 Panels................................................................................................... 17
3.3 Sample Chamber .................................................................................. 20
3.4 Detector Unit......................................................................................... 22
4. MAINTENANCE ..........................................................................23
4.1 Light Source Check and Replacement.................................................. 23
4.2 Energy Check ....................................................................................... 25
4.3 Wavelength Accuracy Check and Adjustment ...................................... 27
4.4 CD Scale Check and Adjustment.......................................................... 28
4.5 Test Signal Check ................................................................................. 30
5. TROUBLESHOOTING ................................................................31
v
Page 7

π
I
I
1. Overview and Specifications
1.1 Overview
1.1.1 Principles of operation
When linearly-polarized light passes through an optically-active substance, its two
circularly-polarized components (right and left circularly-polarized beams of light) travel
at different speeds, and are absorbed in differing degrees by the substance. Thus, the
light passing through the substance is elliptically polarized, and the substance is said to
have ″Circular Dichroism (CD)″. The magnitude of circular dichroism is usually
expressed in terms of molecular elliptically [θ], which is determined according to the
following formula :
4500
θ
=−
where, εL and ε
R
polarized beams of light. The difference (∆ε) between εL and ε
the following formula :
εεε
RL
[]
θ
=
4500
LC
π
In equation (2) and (3), L represents the thickness (cm) of the absorbing layer, and C
represents the molar concentration, I
left circularly-polarized beams of light, respectively, after passing through the substance.
Theoretically, the molecular ellipticity can be derived using equation (3). However, in
practice, determining [θ] with a high degree of accuracy is very difficult using equation
(3), because the value of IR.IL is nearly 1. To avoid this difficulty, we substitute the
following quantities.
1
()
2
S
=−
RL
(5)
Since S/2
Ι
is less than 1, equation (3) can be re-expressed as follows, by substituting
A
the expressions from equations (4) and (5) :
εε
LR e
10( ) log
(1)
are the molecular extinction coefficients for the right and left circularly-
is determined using
R
1
log
=−=∆
LC
log10log
e
III +=
(4)
LRA
I
R
10
10
(2)
I
L
I
R
(3)
I
L
and IL represent the intensities of the right and
R
1
Page 8
S
+
1
4500
[]
=
θ
LC
π
e
log10log
10
−
1
I
2
A
S
(6)
I
2
A
=
4500
LC
π
S
e
log10log
I
A
e
10
Thus, the ratio between IA and S can be approximated with an accuracy sufficient for
practical application.
Given that EA and ES represent the output voltages of the photomultiplier tubes
corresponding to light intensities IA and S respectively, S/IA = ES/EA. By substituting
this expression, equation (6) can be expressed as follows.
4500
[]
θ
= e
π
LC
E
S
e 10
log10log
E
A
(7)
Here, if ES can be amplified independently of EA, equation (7) can be expressed as
follows.
4500
[]
=
θ
LC
π
10log
e
GE
S
E
A
log
e
10
(8)
G
where G represents the amplification factor of ES. Since the value ESG can be brought
very close to the value of E
by choosing an appropriate value for G, [θ] can be
A
determined with a high degree of accuracy.
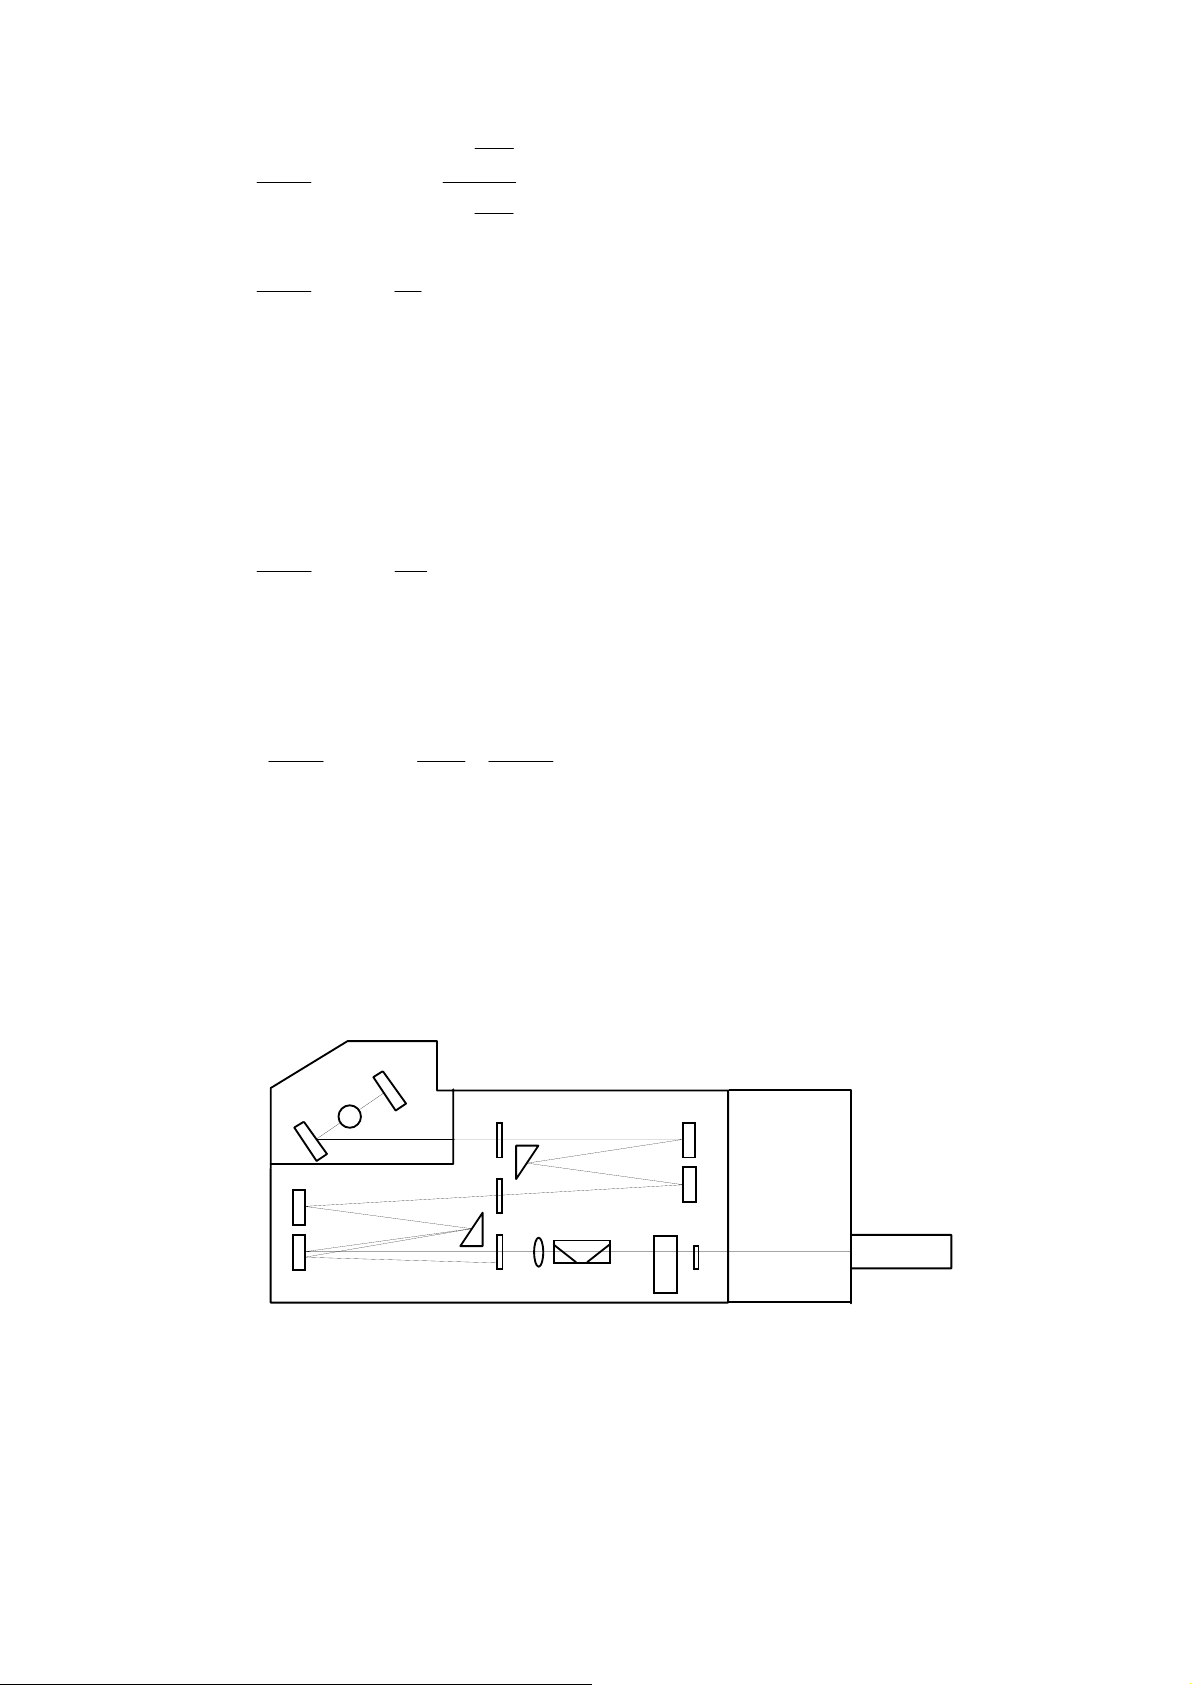
1.1.2 Optical system
Fig. 1.1 shows the optical system of the Model J-810 spectropolarimeter.
M
0
P
O-ray
E-ray
S
2
S
1
S
3
P
1
2
L F CDM
M
M
SH
2
3
PM
M
LS
1
M
4
M
5
M0, M1, Mp, M2 ~ M5 : Mirrors LS : Light source
~ S3 : Slits P1 : First prism (horizontal optical axis)
S
1
P
: Second prism (vertical optical axis) O-ray : Ordinary ray
2
E-ray : Extraordinary ray L : Lens
F : Filter CDM : Modulator
SH : Shutter PM : Photomultiplier tube
Fig. 1.1 Block diagram of optical system
2
Page 9
A xenon lamp is used as the light source. The light emitted from the xenon lamp is
converged by the M1 mirror into the S1 entrance slit. The optical system between the
S1 entrance slit and the S2 intermediate slit is referred to as the first monochromator,
and the optical system between the S2 intermediate slit and the S3 exit slit is referred to
as the second monochromator. Such an optical system, comprised of two
monochromators, is known as a double monochromator. The capability of a double
monochromator reducing stray light makes it indispensable for CD measurement.
The instrument uses crystal prisms (P1 and P2) that have different axial orientations, so
that the light that passes through the monochromator is not only monochromated, but
also linearly polarized, and oscillates in the horizontal direction.
This linearly-polarized light is modulated by the modulator into right and left circularlypolarized beams of light. The modulator subjects quartz to mechanical stress in order
to produce circular polarization in the crystal, based on the principle of the Piezo effect.
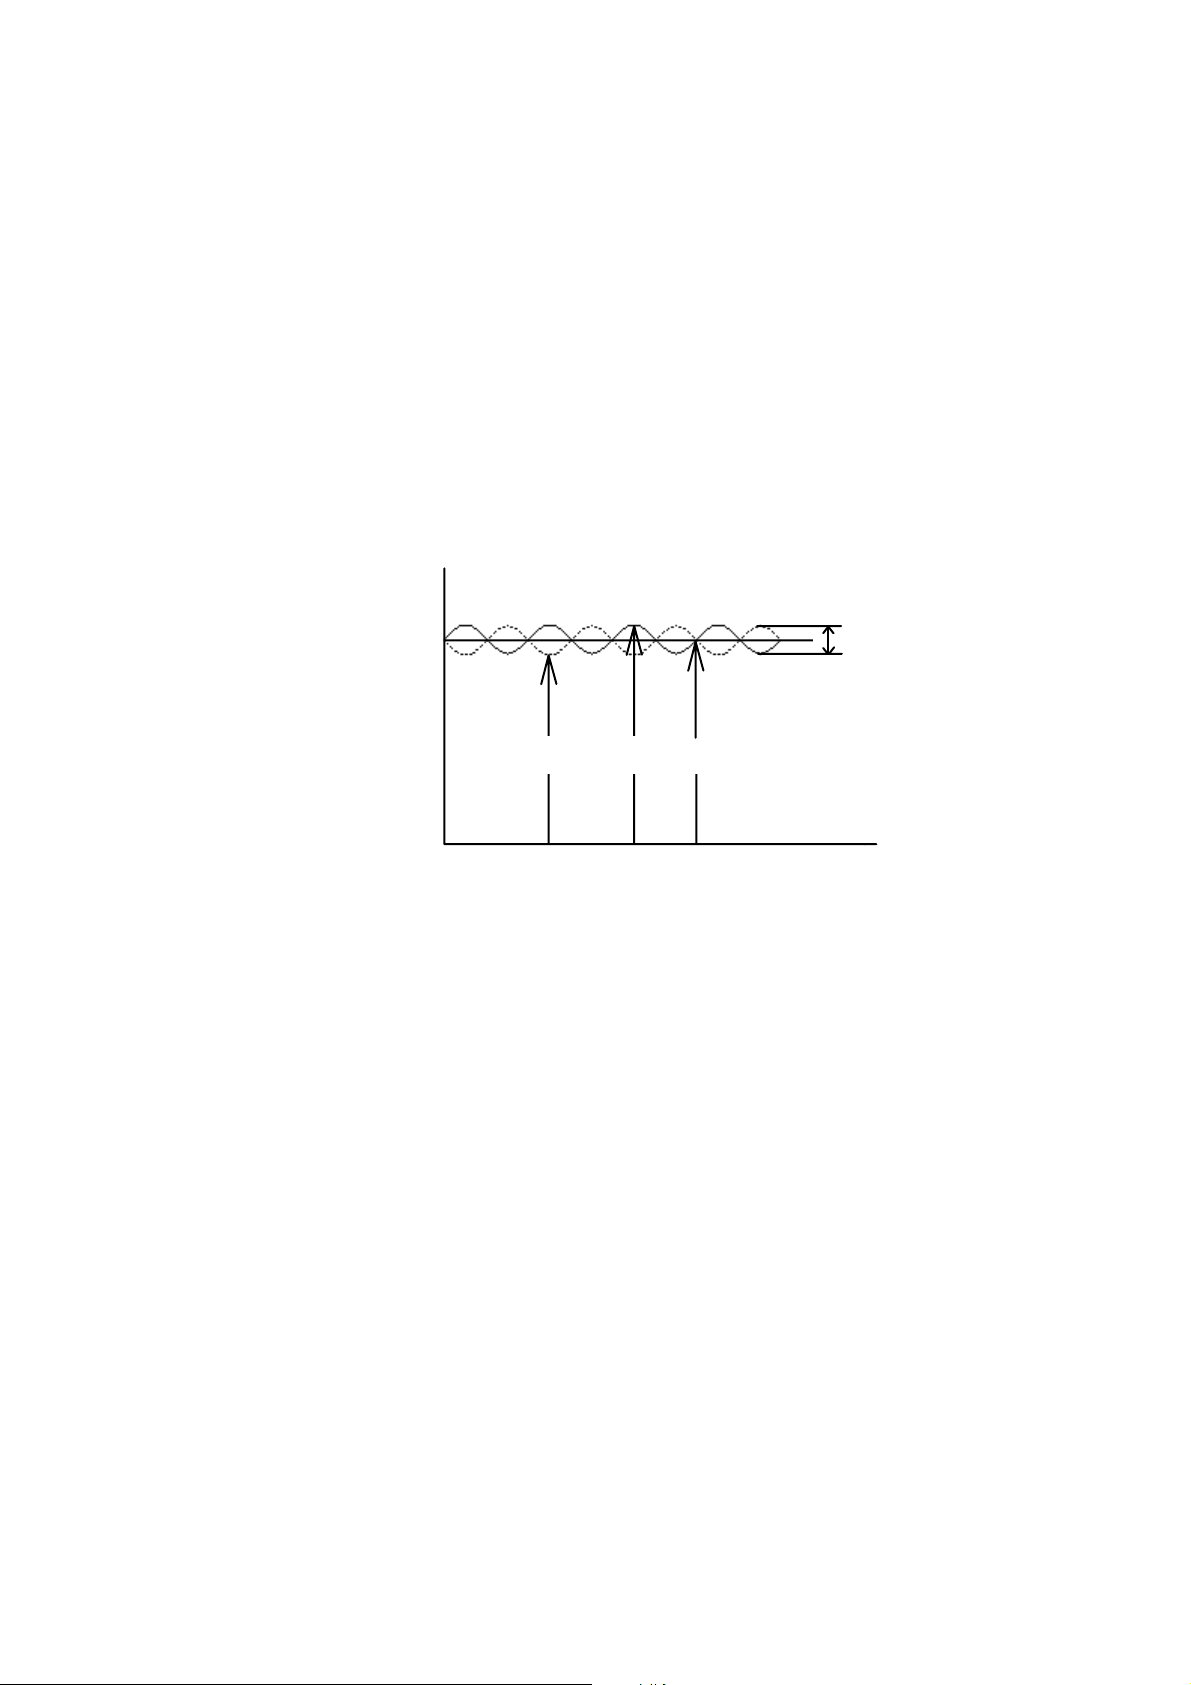
When a sample with circular dichroism is placed in the sample chamber, the intensity, I,
of the transmitted light changes as shown in Fig. 1.2 :
Intensity
I
L
I
I
R
A
Time
S
Fig. 1.2 Intensity of transmission light
The relationship between the minimum and maximum intensities and the right and left
circularly-polarized light depends on whether the value E
value E
the dotted line represents the case when E
and S, refer to Section 1.1.1
. In Fig. 1.2, the solid line represents the case when ER is greater than EL, and
L
is smaller than EL. For the definitions of IA
R
″Principles of operation″.
is smaller or larger than the
R
When light with intensity fluctuations such as that shown in Figure 1.2 is incident upon
the photomultiplier tube, the output signal consists of DC components equivalent to I
A
and AC components equivalent to S.
,
1.1.3 Electrical system
The output signal from the detector (PM photomultiplier tube) consists of an AC
component electrically modulated by the modulator and a DC component that
represents the average intensity of the transmission light. The CD value can be derived
from the ratio between the DC component and the AC component. This instrument
varies the PM voltage in order to maintain a constant DC component, and utilizes the
AC component as the CD signal. Therefore, once the AC signal is calibrated using a
standard sample, the correct CD value can be obtained.
Fig 1.3 shows a block diagram of the electrical system. Since the AC and DC
components can be discussed independently, they are described separately in
reference to Figure 1.3.
3
Page 10
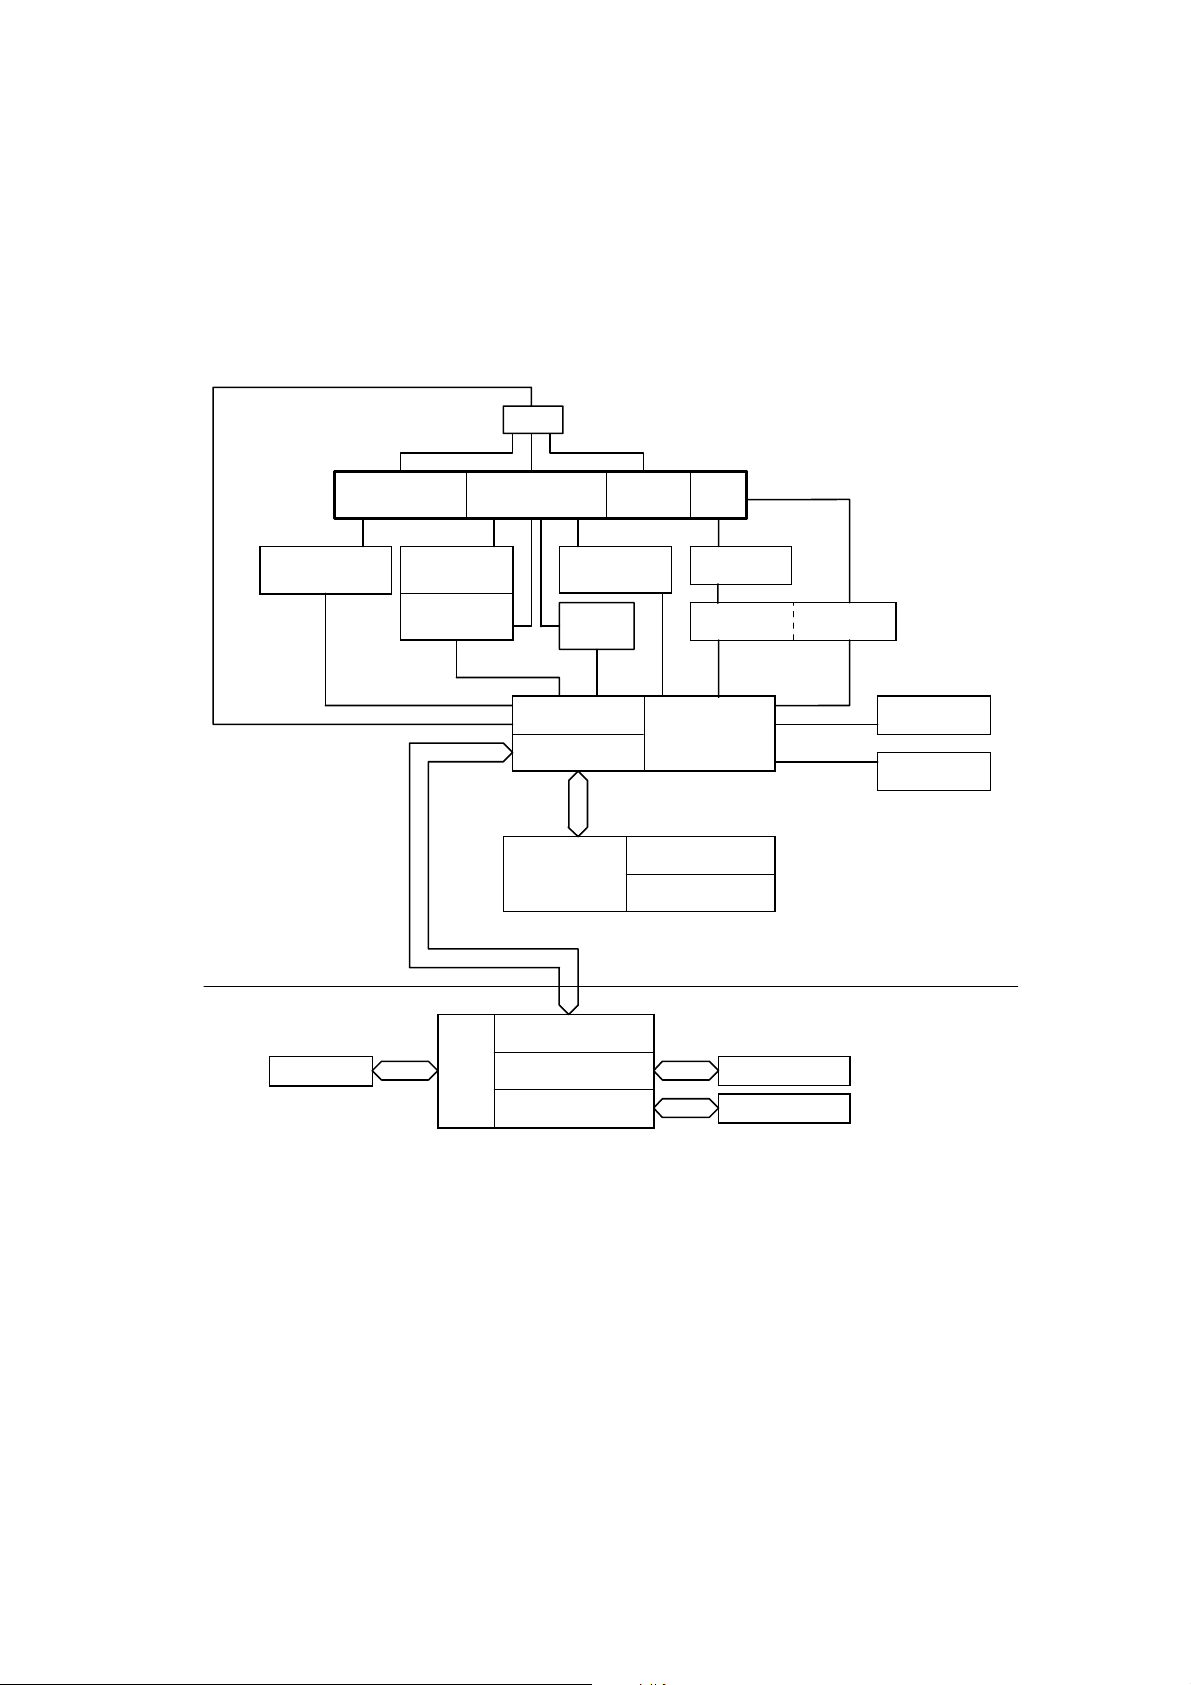
The DC component is separated between the preamplifier and the CD amplifier, and is
compared with the reference voltage in order to control the voltage of the PM power
supply. This voltage is also applied to the PM detector, changing the PM sensitivity.
The AC component is converted to a digital signal after being amplified by the
preamplifier and the CD amplifier.
The main unit and the personal computer communicate through the RS-232C interface.
All parameters of the main unit are designated from the personal computer. The CD
signal and PM voltage are communicated to the personal computer through the RS232C interface after being converted to digital signal and stored in the buffer memory.
Sensor
Light Source
Light Source
Power Supply
Main Unit
PC
Monochromator
Slit Motor
Driver
Wavelength
Motor Driver
Modulator
Driver
Shutter
Driver
I/O
RS-232C I/F
CPU
RS-232C I/F
Sample
Chamber
Buffer Memory
Program Memory
PM
Preamplifier
CD Amplifier
A/D D/A
PM Power
Supply
External
Input 1
External
Input 2
Keyboard
PC
SVGA
Parallel I/F
CRT Display
Printer
Fig. 1.3 Block diagram of electrical system
1.2 Specifications
Light source : 150W air-cooled xenon lamp, or 450W water-cooled xenon
lamp
Detector : Head-on photomultiplier tube
Modulator : Piezoelastic modulator
Measurement wavelength range : 163 to 900 nm (standard detector)
163 to 1100 nm (optional detector)
Wavelength accuracy : ±0.2 nm at 163 to 180 nm
±0.1 nm at 180 to 250 nm
±0.3 nm at 250 to 500 nm
4
Page 11

±0.8 nm at 500 to 800 nm
±2.0 nm at 800 to 1100 nm
Wavelength repeatability : ±0.05 nm at 163 to 250 nm
±0.1 nm at 250 to 500 nm
±0.2 nm at 500 to 1100 nm
Spectral bandwidth : 0.01 to 15 nm
Slit width : 1 to 3000 µm
Response : 0.5 msec to 32 sec
Scanning system : Continuous scan
Step scan (Fixed response and auto response system)
Scanning speed : to 10000 nm/min (continuous scan)
Data interval : 0.025 to 10 nm (continuous scan)
0.1 to 100 nm (step scan)
0.5 msec to 60 min (time change)
CD full scale : ±10, 200, 2000 mdeg
CD resolution : 0.0005 mdeg (at
0.01 mdeg (at
0.1 mdeg (at ±2000 mdeg full scale)
Stray light : Not more than 0.0003% (200 nm)
RMS noise : 185 nm : 0.050 mdeg (150W light source)
0.045 mdeg (450W light source)
200 nm : 0.040 mdeg (150W light source)
0.035 mdeg (450W light source)
500 nm : 0.035 mdeg (150W light source)
0.035 mdeg (450 light source)
(spectral bandwidth 1nm, response 16 sec)
Baseline stability : 0.03 mdeg/hr
(spectral bandwidth 1 nm, response 32 sec, wavelength 290
nm)
UV measurement : Single beam measurement
Photometric range : 0 to 5 Abs
Photometric accuracy :
(0 to 1 Abs, checked using NIST SRM 930D filter)
External input terminal : Two channels (input range : -1 to 1 V DC)
Shutter : Opens and closes in front of sample
Sample chamber : Small sample chamber dimensions :
140mm wide × 300mm deep × 130mm high
Large sample chamber dimensions :
305mm wide
Sample stage can be dismounted and remounted and
accepts various accessories.
Equipped with constant temperature water inlet/outlet ports
Nitrogen gas displacement: Atmosphere in the light source unit, monochromator unit,
and sample chamber is displaced using dry nitrogen gas.
Temperature : 20 ±5°C
Humidity : Less than 70%
Dimensions : Main unit (small sample chamber) :
1115mm wide × 570mm deep × 410mm high
±10 mdeg full scale)
±200 mdeg full scale)
±0.01 Abs
× 420mm deep × 270mm high
5
Page 12

Main unit (large sample chamber) :
1270mm wide × 570mm deep × 410mm high
Weight : Main unit (small sample chamber): 87 kg
Main unit (large sample chamber): 106 kg
Power requirements : 100, 115, 200, 220, 230, 240 V, 50/60 Hz
270 W (150 W light source)
670 W (450 W light source)
6
Page 13

2. Unpacking and Installation
Note: Hold the monochromater bench when you move the main unit.
2.1 Unpacking
After unpacking the instrument, check the parts received against the list of components
(Table 2.1). If any part is missing or damaged, contact your local JASCO distributor.
Table 2.1 List of Components for J-810 Spectropolarimeter
Component
J-810 main unit 1
Modulator element 1
Detector unit 1
Cable 1 set
Nitrogen gas inlet tube 1 3 m
Nitrogen gas outlet tube 1
Nitrogen gas tube band 2
Cooling water tube 1 10 m for the 450W light source
Cooling water tube band 3 For the 450W light source
Sample chamber window 1
Inner sample chamber 1 For large sample chamber
Cell holder 1
Standard samples 1 set Ammonium d-10-camphor sulfonate, etc.
Tools 1 set
Floppy disk 1 set For setup, data, etc.
Instruction manual 1 set For hardware, software, etc.
Tube for accessories 1 set For accessories
Q′ty
Remarks
2.2 Installation Requirements
Install the instrument in a location where the following conditions are satisfied. The
instrument should be installed in a room that is maintained at a constant temperature
and humidity, because the spectropolarimeter is sensitive to atmosphere fluctuations.
. Room temperature 20
. Humidity lower than 70%
. Not exposed to direct sunlight
. Not in the proximity of harmful or corrosive gas
. Not exposed to a high-intensity light source
. Not in the direct path of air currents emanating from air conditioners, or other
equipment
. Relatively free of vibration
. Not in the proximity of a high-intensity magnetic or electromagnetic field
. For the 450W light source, within the proximity of a water supply (flow rate : 2 λ/min,
pressure : 0.5~2.0 kg/cm
mm
Note: Do not use water at more than 2.0 kg / cm
±5°C
2
). Cooling water tube : 10 m in length, inside diameter : 12
2
pressure.
7
Page 14
. Within the proximity of equipment that supplies nitrogen gas. (flow rate : more than 3
λ/min).
. Nitrogen gas tube : 3 m in length, inside diameter : 9.5 mm.
2.3 Reassembly
Note: Reassembly of the instrument is performed by your local JASCO distributor.
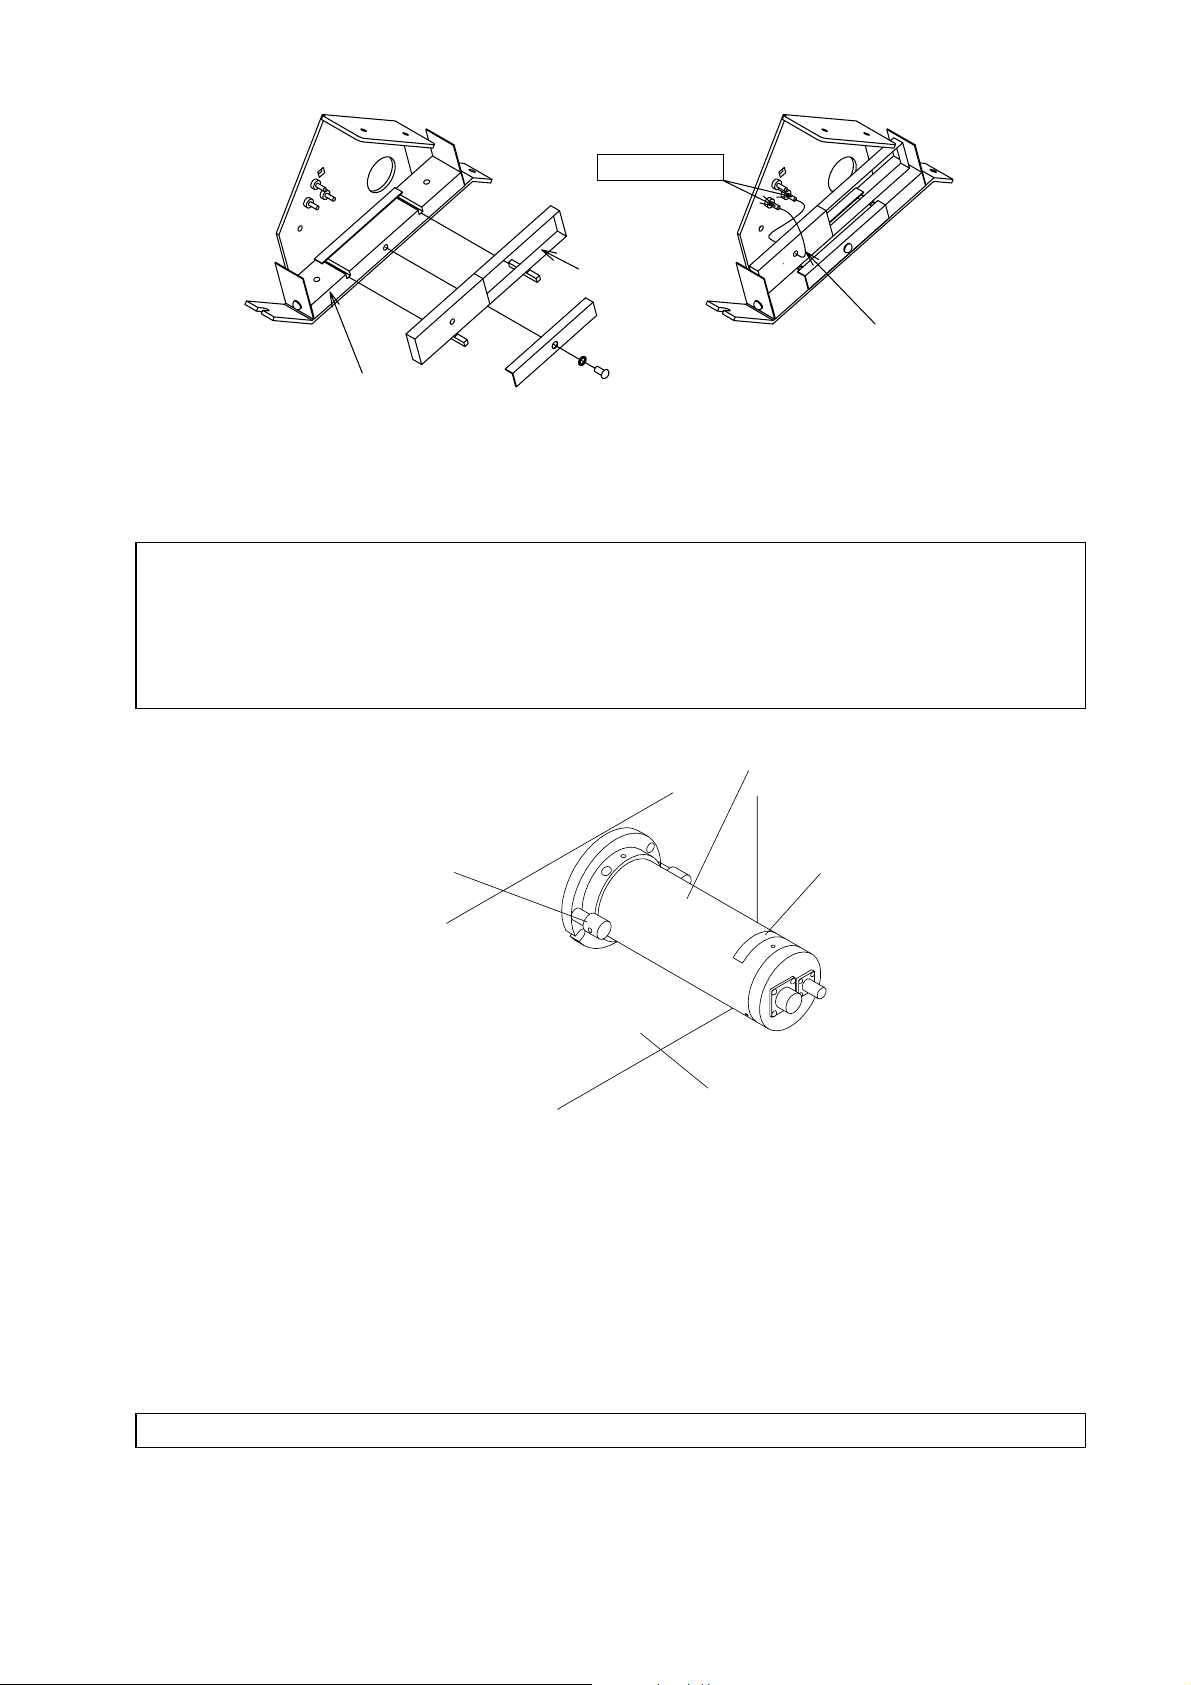
2.3.1 Removing the cushion from the main unit
CAUTION : When removing the cushion, be careful not to give an impact to the cam.
The cam and lever on the bottom of the instrument are separated by a cushion and
secured with a rubber band to protect the cam from damage and the wavelength from
shifting during transit.
Remove the cushion and rubber band after installing the main unit.
(1) Remove the side cover from the main unit.
Side cover
Setscrews
Fig. 2.1 Removing the side cover
(2) Remove the cushion and rubber band.
Wavelength
lever
Rubber band
Fig. 2.2 Removing the cushion and rubber band
Cam
Cushion
8
Page 15
r
2.3.2 Installing the modulation element
The modulation element has been removed from the main unit before shipment to
prevent damage in transit. Install the modulator element in the main unit after installing
the main unit.
(1) Remove the electrical system cover from the main unit.
Electrical system cove
Pull
Setscrews
Fig. 2.3 Removing the electrical system cover
(2) Open the monochromator lid.
Lift
Monochromator lid
Setscrews
Fig. 2.4 Opening the monochromator lid
(3) Mount the modulator element in the holder and mount it in the main unit.Solder the
leads to the terminals.
CAUTION : Be careful not to damage the modulator element or break the leads.
CAUTION : See to it that the leads do not come into contact with the holder, cover or
with each other.
9
Page 16
Solder
Modulator
element
Lead wire
Holder
Fig. 2.5 Mounting the modulator element
2.3.3 Installation the detector unit
CAUTION : Handle the detector unit with great care. Do not give an impact to the
detector unit.
CAUTION : Do not loosen any screws, except for the lock screw.
CAUTION : Do not expose the detector window to intense light.
Detector unit
Lock screw
Label
Sample chamber
Fig. 2.6 Installation of detector unit
Install the detector unit on the main unit according to the following procedure.
(1) Remove the cover from the detector mounting hole located in the right side panel
of the main unit
(2) Remove the cover from the detector unit
(3) Gently mount the detector unit on the main unit, and secure it using the lock screw.
CAUTION : Install the detector so that the label faces upward.
10
Page 17

2.3.4 Connecting the cables and tubes
Connect the cables and tubes according to the following procedure :
(1) Connecting the cables
1) Using a digital voltmeter, confirm that the supplied line voltage corresponds to
the voltage shown on the rating plate.
CAUTION : The line voltage must be confirmed. An outlet can provide an incorrect
voltage due to faulty wiring.
2) Confirm that the ″Power″ switch on the power supply unit is turned OFF.
3) Plug the cables according to Fig. 2.7.
CAUTION: Ground the grounding terminal of the power cable.
CAUTION: For details regarding the wiring and connections of the personal computer
and printer, refer to their respective instruction manuals.
Detector unit
"CD In"
Amplifier rear panel
"PS In" "Optical Unit" "Serial"
"Amp Unit""PS Out"
Conecting plate of
monochromator
"AC INPUT"
Computer
Line voltage
Fig. 2.7 Connection of cables
(2) Connecting the cooling water tubes (450W light source)
CAUTION : Bind the tube at the water faucet and the water inlet/outlet ports of the light
source unit, using the supplied tube bands.
11
Page 18
Water outlet
Water inlet
Cooling water tube
Fig. 2.8
1) Connect the ″Water Inlet″ of the light source cooling water flow sensor to the
faucet using the tube.
2) Connect the ″Water Outlet″ of the light source cooling water flow sensor to the
″Water Inlet″ of the light source unit.
3) Connect the ″Water Outlet″ of the light source unit to the water drain port.
4) Feed cooling water to confirm that the system is free from leakage.
(3) Connecting the nitrogen gas tube
Connect the nitrogen gas cylinder (flow meter) to the nitrogen gas inlet.
Note : Bind the tube with the tube band, if necessary.
(4) Connecting the nitrogen gas or leak water outlet port.
The outlet tube for nitrogen gas or leaked circulation water is provided at the
bottom of the sample chamber. Connect the tube to the water outlet port, if
necessary.
Outlet tube for nitrogen
gas or leaked water
Notroger gas
inlet tube
12
Page 19

Fig. 2.9
13
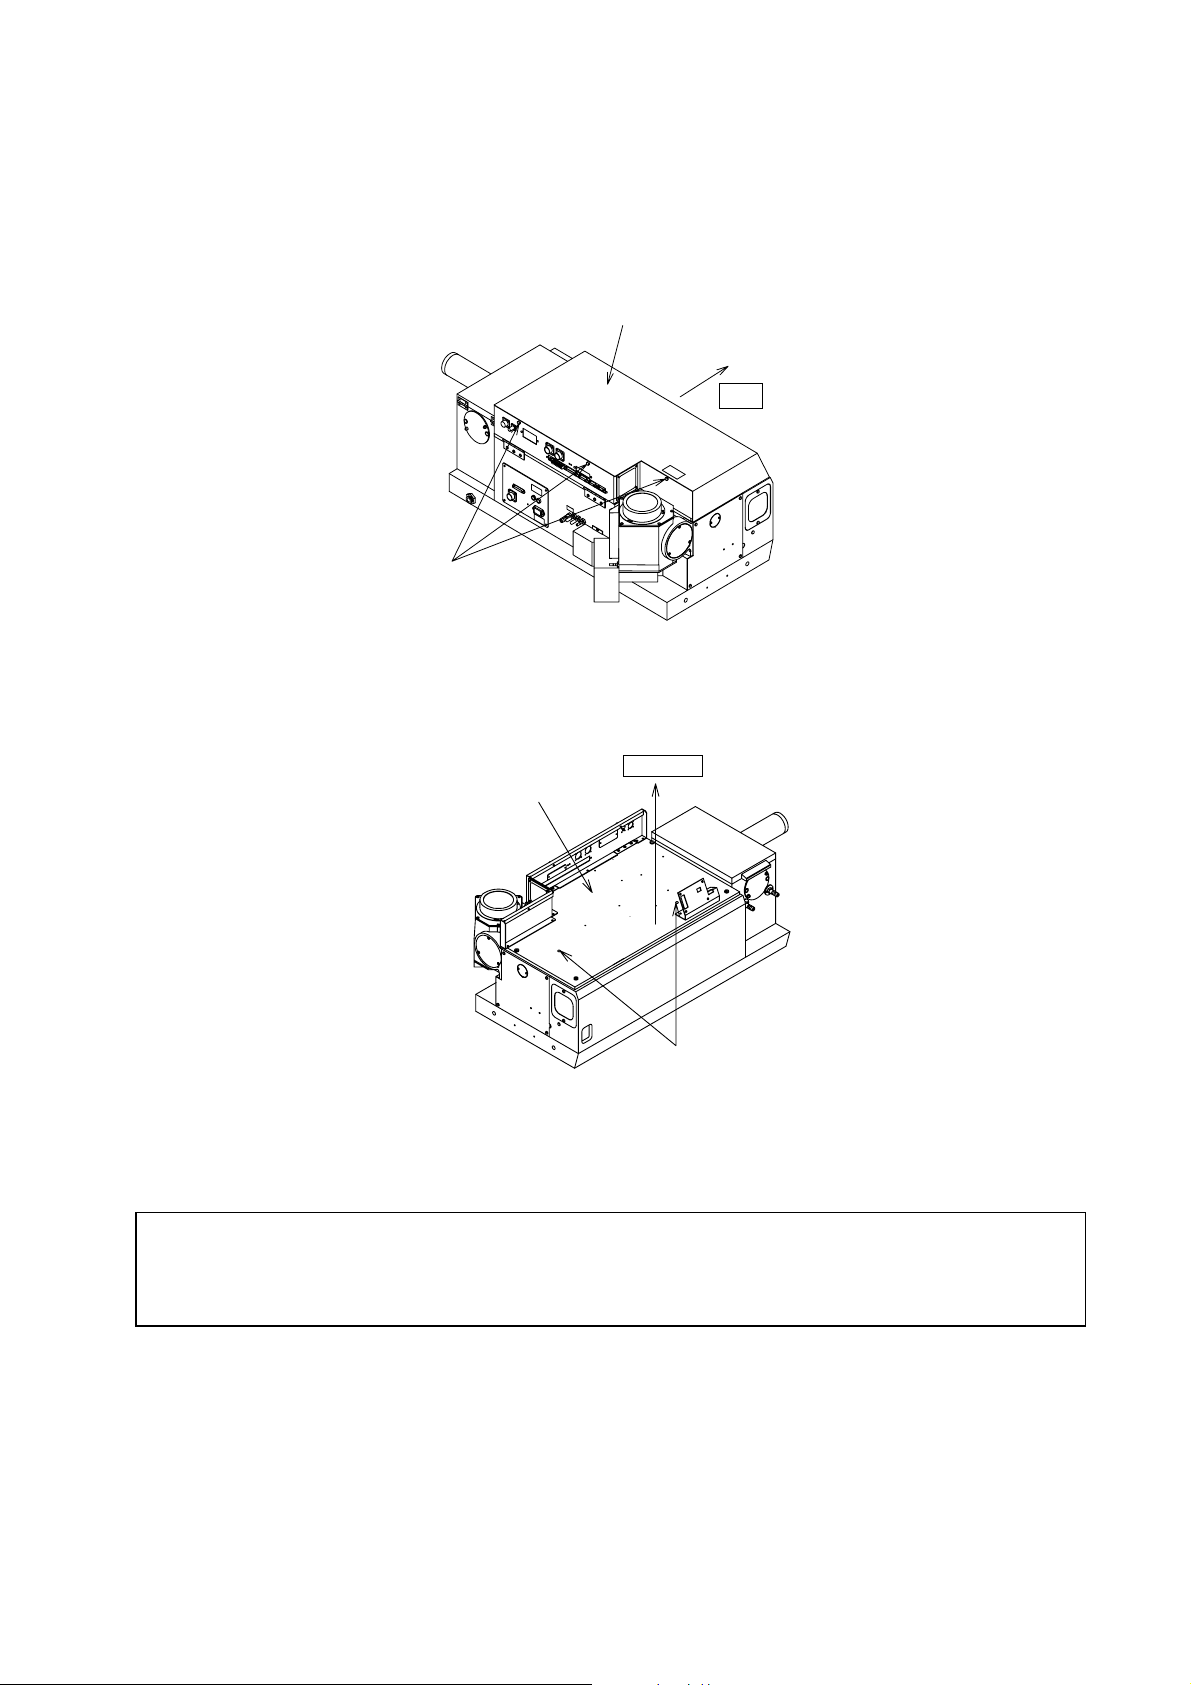
Page 20

3. Names of Functions of Components
3.1 Overall View
150W light source. Small sample chamber
2
5
1
4
3
6
8
7
9
10
Fig. 3.1 Overall view (150 kW light source. Small sample chamber)
14
Page 21

450W light source. Large sample chamber
5
2
4
3
1
6
8
7
9
12
11
10
Fig. 3.2 Overall view (450kW light source. Large sample chamber)
15
Page 22

Component Function
① ″Power″ switch
②Sample chamber
③Constant temperature
Power switch of the main unit.
Set sample.
Inlet and outlet ports of constant temperature water.
water ports
④Detector unit
⑤Amplifier unit
⑥Sample chamber leak
Houses the photomultiplier tube and preamplifier.
Houses the amplifier and other elements.
Outlet for the water leaking from sample chamber.
water outlet
⑦Monochromator unit
⑧Connecting plate
⑨Nitrogen gas inlet
Houses the monochromator and modulator.
Connected to the electrical system.
Admits nitrogen gas to displace the air in the
monochromator.
⑩Light source unit
⑪Light source cooling
Houses the light source.
Cooling water inlet to the light source.
water inlet
⑫Light source cooling
Cooling water outlet from the light source.
water outlet
16
Page 23
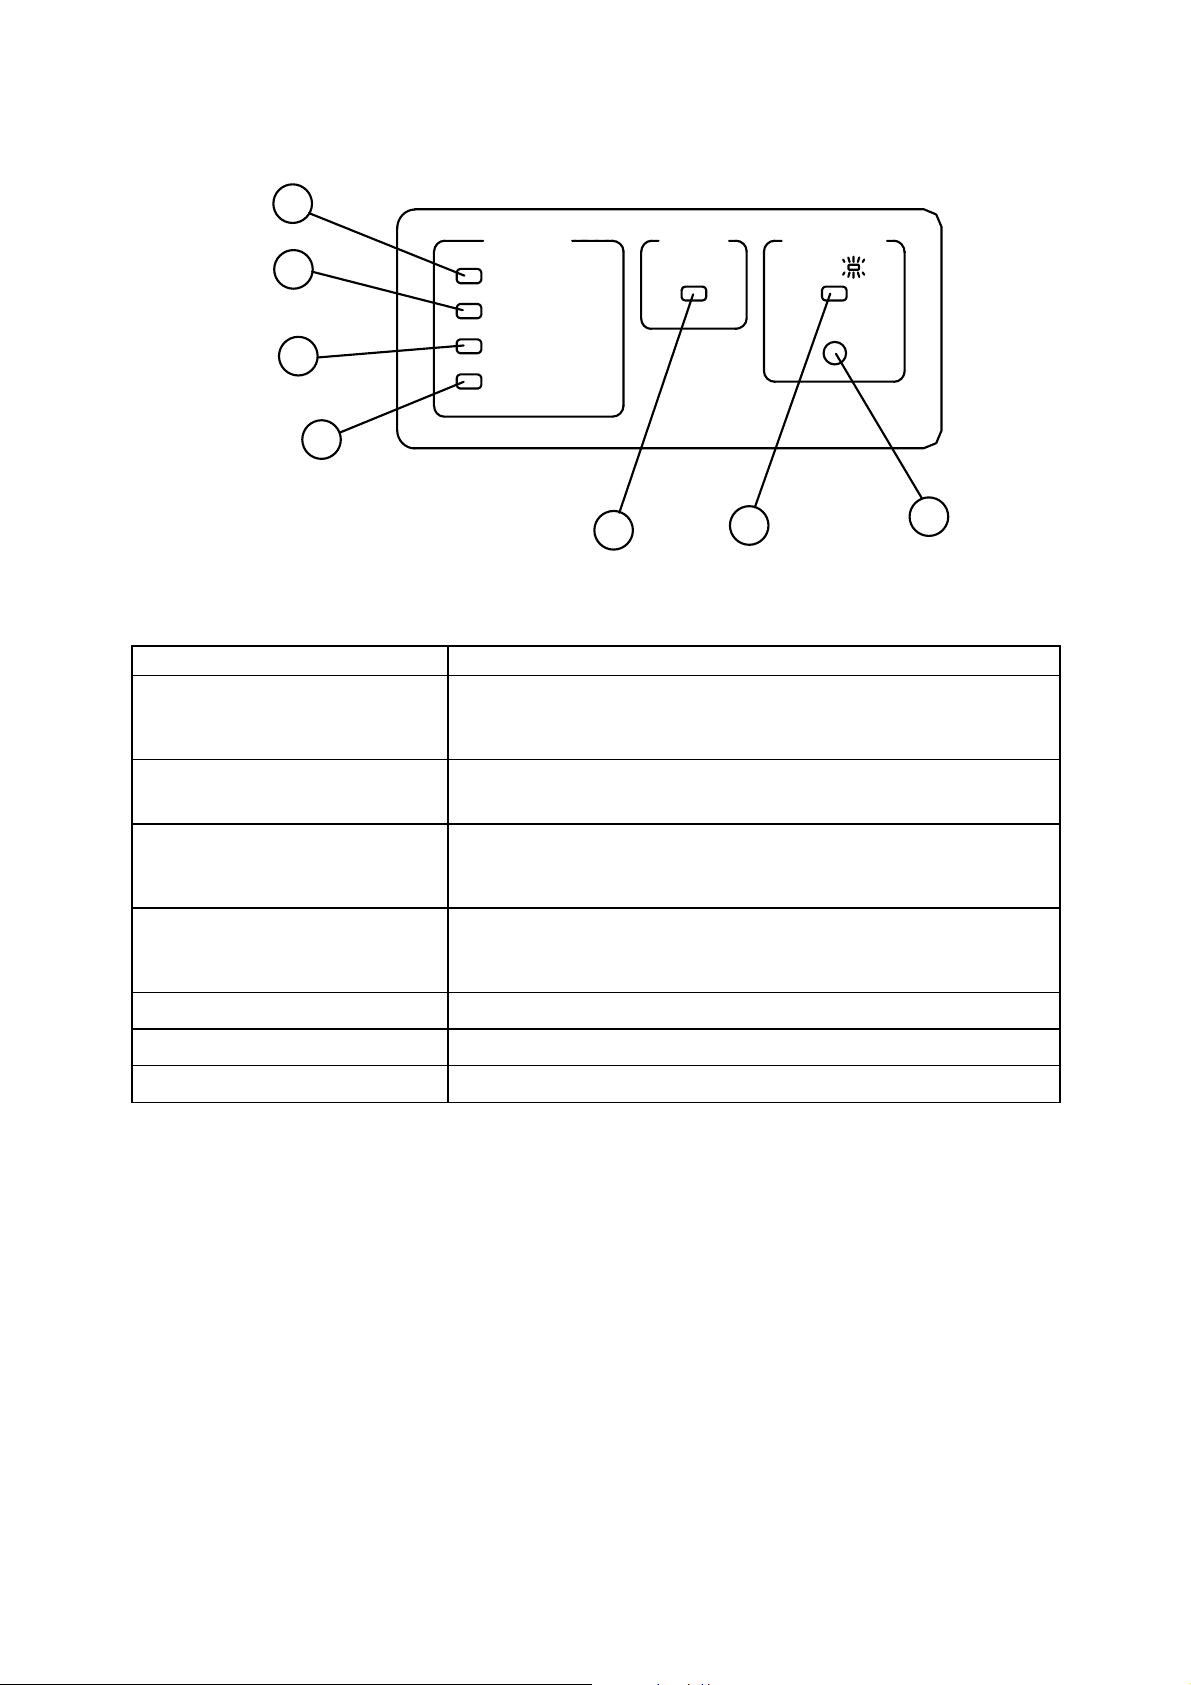
3.2 Panels
1
Alarm
2
3
Temperature
(Lamp)
Water Flow
(Lamp)
Water Leak
(Sample Chamber)
N2 Flow
Lamp
4
5
Fig. 3.3 Front panel of amplifier unit
Component Function
① ″Temperature (Lamp)″
LED
② ″Water Flow (Lamp)″
LED
③ ″Water Leak (Sample
Chamber)″ LED
④ ″N2 Flow″ LED
⑤ ″Lamp″ LED
⑥ ″Shutter″ LED
⑦ ″Shutter″ button
Lights if the light source temperature becomes
abnormally high. The light source is automatically
turned off if an alarm is displayed.
Lights if the cooling water to the 450W light source is
insufficient.
Lights if water leaks in the sample chamber. The use
of the optional constant temperature water stop valve
stops water leak automatically.
Lights if the nitrogen gas flow rate is insufficient. This
alarm is effective when the optional PC-controlled
flowmeter or the flowmeter with sensor is used.
Lights when the light source is turned ON.
Lights when the shutter is open.
Opens/closes the light shield shutter.
6
Shutter
Open
7
17
Page 24

Scale Correction
2
1
CD In
ORD In
7
Offset
CD
9
3
4
CD
8
Accessory
×1
×100
PS In
Scale Correction
LD ORD
Optical unit
10
Fig. 3.4 Rear panel of amplifier unit
Component Function
① ″CD In″ connector
② ″Scale Correction ID″
Connect to the connector on the detector unit.
Trimmer for adjusting the CD scale using a standard
sample.
③ ″Offset CD″ trimmer
④ ″ORD In″ connector
Trimmer for adjusting offset of CD.
Connect the connector for optional ORD unit.
port
⑤ ″ORD Unit″ connector
Connect the connector for optional ORD unit.
port
⑥ ″Scale Correction
LD/ORD″ adjustment
Port for mounting the optional LD/ORD scale
adjustment.
mounting port
⑦ ″Accessory″ connector
Connector for optional accessories.
6
ORD Unit
I/O 1 I/O 2 Serial
11
5
13
12
14
⑧ ″Ps In″ connector Connect to the ″Ps Out″ connector on the rear panel of
the monochromator unit.
⑨ ″X1/X100″ selector
switch
⑩I/O terminals
″Ext1″ terminal
″Ext2″ terminal
″GND″ terminal
″DA1″ terminal
″DA5″ terminal
″DGND″ terminal
″Trig″ terminal
Changes over the ″Ext2″ terminal input voltage gain.
Set it at X100 to amplify the gain by a factor of 100.
Input terminal for analog signal (-1 to 1 VDC)
Input terminal for analog signal (-1 to 1 VDC)
Grounding terminal (for analog signal)
Output terminal for analog signal (0 to 1 VDC)
Output terminal for analog signal (0 to 5 VDC)
Grounding terminal (for digital signal).
Trigger signal input terminal.
⑪ ″Optical Unit″ connector Connect to the ″Amp Unit″ connector on the rear panel
of the monochromator unit.
⑫ ″I/O 1″ connector
⑬ ″I/O 2″ connector
⑭ ″Serial″ connector
Connect to an optional accessory.
Connect to an optional accessory.
Connect to the connector for communication of the
personal computer.
18
Page 25

1
Amp Unit
PS Out
2
4
T6.3A
AC INPUT
T10A
T3.15A
3
Fig. 3.5 Rear panel of monochromator unit
Component Function
① ″Amp Unit″ connector Connect to the ″Optical In″ connector on the rear panel
of the amplifier unit.
② ″PS Out″ connector Connect to the ″PS In″ connector on the rear panel of
the amplifier unit.
③Receptacle
④Fuse
″T3.15A″ label
″T6.3A″ label
Power inlet receptacle
For 200 VAC line voltage.
For 100 VAC (150W light source) or 200 VAC (450W
light source) line voltage.
″T10A″ label
For 100 VAC line voltage.
19
Page 26

3.3 Sample Chamber
Small sample chamber
6
7
Large sample chamber
1
5
8
4
2
9
3
1
4
5
2
6
9
7
3
8
10
Fig. 3.6 Sample chamber
20
Page 27

Component Function
①Cell holder
②Cell holder mount
③Sample stage sub-base (1)
Set the cell.
Set the cell holder.
Remove this when a medium-sized accessory like
Peltier type thermostatted cell holder is mounted.
④Sample stage sub-base (2)
Remove this when a small-sized accessory like
sample changer is mounted.
⑤Light shield plate
Changes over the beam diameter to 8 mm or 13
mm according to the cell to be used.
⑥Detector protective switch
Turns OFF the switch and sets the voltage applied
to the detector to zero when the sample chamber lid
is opened.
⑦Constant temperature
water inlet/outlet ports
⑧Joint
⑨Window plate
Removable joint for constant temperature water.
Attached to the sample chamber window when
measuring a sample that emits harmful gas to
protect the monochromator unit.
⑩Inner sample chamber
Sample chamber to displace nitrogen gas more
efficiently.
21
Page 28

3.4 Detector Unit
1
Fig. 3.7 Detector unit
Component Function
①Lock screw
②Connector
Secures the detector unit to the main unit.
Connect to the ″CD In″ connector located on the rear
panel of the amplifier unit.
③Label
Indicates the wavelength range. Install the detector
unit on the main unit with this label facing upward.
3
2
22
Page 29

4. MAINTENANCE
4.1 Light Source Check and Replacement
The service life of the xenon lamp is 300 to 500 hours, but it differs considerably from
one light source to another. It is therefore difficult to predict life expectancy from
operating hours. It is generally predicted from noise on the measured data. Compare
the current data with the data on delivery (data obtained with a new light source) to
make decision.
Note : Noise may also appear if the line voltage fluctuates abruptly.
Observe the following guidelines in order to maximize the service life of the xenon lamp.
. If the light source is not used for an extended period, turn it off. However, if the light
source will be inactive for an hour or less, leave it on Frequently turning the light
source on and off will shorten its service life.
. Always feed cooling water to the light source (450W light source).
<Procedure>
WARNING : Carefully read the ″Safety Cautions″ at the beginning of this manual.
(1) Turn OFF the ″Power″ switch located on the main unit.
(2) For the 150W light source, remove the light source cover and then remove the
anode holder and the light source. For the 450W light source, remove the anode
holder, and then loosen the cathode fixing screw with a screwdriver through the
hole on the side cover to remove the light source.
Note : The 150W light source is attached to the anode holder.
(3) For the 150W light source, remove the anode holder and cathode adapter from the
light source, and attach them to a new light source.
(4) Mount a new light source in the position of the old light source.
CAUTION : Confirm that the glass protrusion of the Xe lamp does not face the M
M1 mirrors.
CAUTION : Do not mistake the polarity of the Xe lamp.
and
0
23
Page 30

(150W Light source)
Cathode adaptor
M mirror
0
(450W Light source)
Light source cover
Anode holder
Light source
1
M mirror
Anode holder
Light source
M mirror
0
M mirror
1
Cathode fixing screw
Fig. 4.1
(5) Tighten the cathode fixing screw (for the 450W light source)
(6) Mount the anode holder (for the 450W light source).
(7) Start up the instrument.
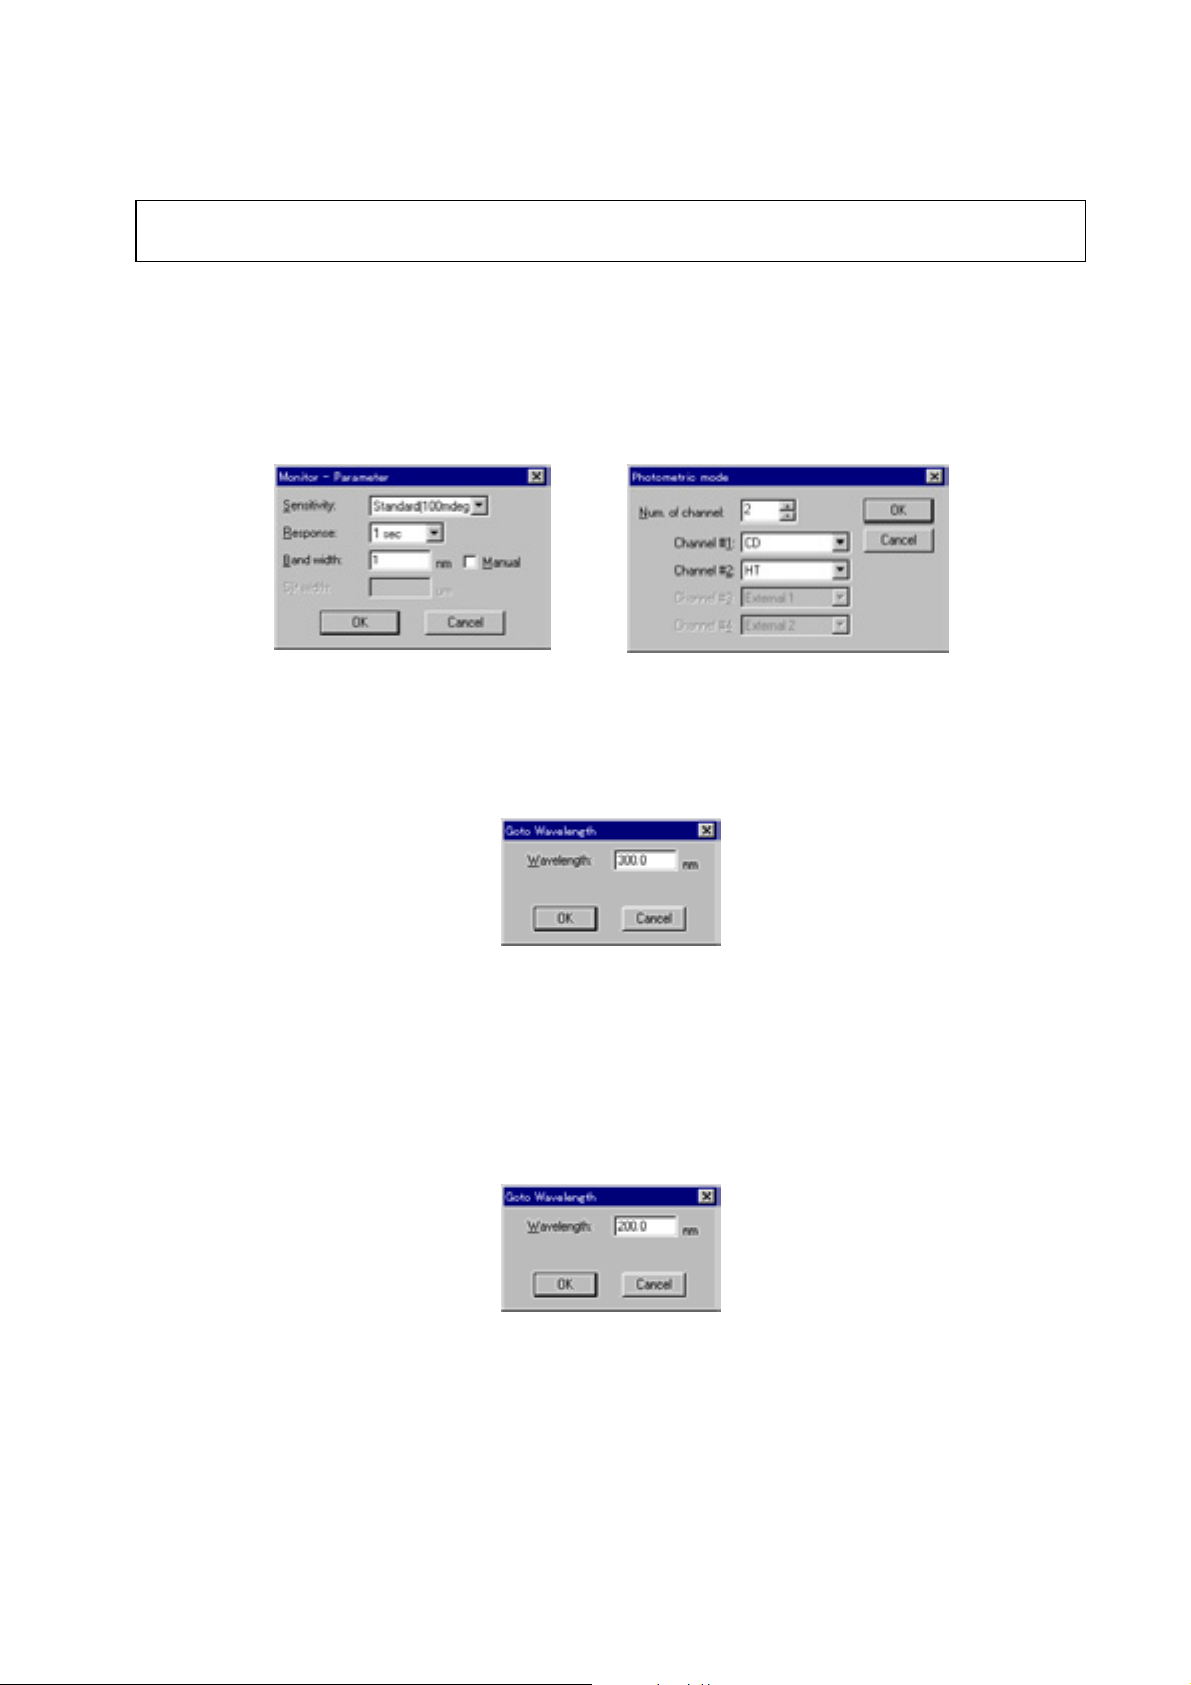
(8) Start up the [Data Monitor] program.
(9) Select the [Parameter...] and [Data Mode...] commands from the [Setting] menu
and designate the monitoring parameters shown in Fig. 4-2.
24
Page 31

Fig. 4.2 Setting parameters (replacement of light source)
(10) Select the [Move Wavelength...] command from the [Setting] menu and set the
wavelength at ″546.1 nm″.
Fig. 4.3 Setting wavelength (replacement of light source)
(11) Remove the cover from the M0 and M1 mirrors. The adjustment screw shown in
Fig. 4.4 will be visible.
Vertical adjustment screw
Horizontal adjustment screw
Cover
Fig. 4.4 Mirror adjustment screw
(12) Adjust the adjustment screws for the M1 mirror to minimize the value of channel 2
(HT voltage) when the sample chamber is empty.
(13) Adjust the adjustment screws for the M0 mirror to minimize the value of channel 2
(HT voltage) when the sample chamber is empty.
Note : Normally, the minimum value is 200 to 300 volts.
(14) Re-install the covers for the M0 and M1 mirrors.
4.2 Energy Check
The energy of the instrument will decrease over time due to the deterioration of the
mirrors and other optical components. This decrease in energy is most apparent in the
25
Page 32
shorter wavelength region (250 nm and less). Check the energy about once a year.
The M0 and M1 mirrors should be replaced every two years, and the M2 through M5
mirrors should be replaced every five years.
Note : If an energy decrease is observed in the long wavelength region, improper optical
alignment or a other trouble is suspected.
<Procedure>
(1) Start up the [Data Monitor] program.
(2) Select the [Parameter...] and [Data Mode...] commands from the [Setting] menu
and designate the monitoring parameters shown in Fig. 4.5.
Fig. 4.5 Setting measurement parameters (energy check)
(3) Select the [Wavelength ...] command from the [Setting] menu and set the
wavelength at ″300 nm″
Fig. 4.6 Setting wavelength (energy check at 300 nm)
(4) Confirm that the value of channel 2 (HT voltage) is 180 to 260 volts when the
sample chamber is empty.
(5) Select the [Move Wavelength...] command from the [Setting] menu and set the
wavelength at ″300 nm″.
Fig. 4.7 Setting wavelength (energy check at 200 nm)
(6) Confirm that the value of channel 2 (HT voltage) is 500 volts or less when the
sample chamber is empty.
26
Page 33

4.3 Wavelength Accuracy Check and Adjustment
Note : Before checking wavelength accuracy, warm up the instrument for about one
hour after turning the light source ON.
Note : Use neodymium glass as the sample.
<Procedure>
(1) Start up the Spectrum Measurement program.
(2) Select the [Parameter...] command from the [Measurement] menu, and designate
the measurement parameters shown in Fig. 4.8.
Fig. 4.8 Measurement parameters (wavelength accuracy check)
(3) Mount neodymium glass in the sample chamber.
(4) Select the [Start] command from the [Measurement] menu in order to perform
measurement.
(5) Using the spectrum analysis program, verify that the peak wavelength of Channel
2 (Fig. 4.9) of the measurement data is 586
±0.8 nm. If the peak wavelength
does not fall within this range, adjust the instrument according to the following
procedure.
100
0
H
T
0
560
Wavelength[nm
586±0.8nm
]
610
Fig. 4.9 HT data of neodymium glass
<Adjustment procedure>
Make adjustment using the adjustment screws on the wavelength lever located at the
bottom of the main unit.
(1) If the main unit is mounted in the optional cabinet, the wavelength cam and
27
Page 34

wavelength lever will be visible from below, as shown in Fig. 4.10. If the main unit
is mounted on a table or bench, bridge the instrument across two tables or
benches to permit access to the adjustment screws.
Fine adjustment screw
Wavelength lever
Coarse adjustment screw
Cam
Fig. 4.10 Adjustment screws
(2) Correct the wavelength by adjusting the fine and coarse adjustment screws
located on the wavelength lever. Turning the screw clockwise shifts the HT data
to shorter wavelengths, and turning the screw counterclockwise shifts the data to
longer wavelengths.
(3) Measure the HT data of the neodymium glass sample to check the wavelength.
Note : If the instrument is moved, gently move it back to its original position, and check
wavelength accuracy again.
4.4 CD Scale Check and Adjustment
Note : Before checking the CD scale, warm up the instrument for about one hour after
turning the light source ON.
Note : Use a 0.06% (w/v) aqueous solution of ammonium d-10-camphor sulfonate as
the sample.
<Procedure>
(1) Start up the [Spectrum Measurement] program.
(2) Select the [Parameter...] command from the [Measurement] menu, and designate
the measurement parameters in Fig. 4.11.
28
Page 35

Fig. 4.11 Measurement parameters (CD scale check)
(3) Fill the 10mm light path cell with 0.06% aqueous solution of ammonium d-10-
camphor sulfonate (solvent : distilled water), and mount the cell in the sample
chamber.
(4) Select the [Start] command from the [Measurement] menu to make measurement.
(5) Using the spectrum analysis program, confirm that the peak value of Channel 1
(Fig. 4.12) is 190.4 ±1 mdeg (291.0 nm). If the peak value does not fall within this
range, adjust the instrument according to the following procedure.
20
0
190.4±1mdeg
C
D
0
250
Wavelength[nm
]
350
Fig. 4.12 CD spectrum of 0.06% ammonium d-10-camphor sulfonate
<Adjustment procedure>
Use the
″Scale Correction CD″ knob located on the rear panel of the amplifier unit (Fig.
3.4).
(1) Select the [Move Wavelength...] command from the [Control] menu and designate
the wavelength shown in Fig. 4.13. Click on the <OK> button.
29
Page 36

Fig. 4.13 Setting wavelength (CD scale adjustment)
(2) Turn the ″Scale Correction CD″ knob located on the rear panel of the amplifier unit
(Fig. 3.4) until the CD value comes within the reference range.
(3) Measure the CD spectrum to check the CD scale.
4.5 Test Signal Check
The test signal is used to check if the electrical system is operating normally. A test
signal can be generated by setting the photometric mode at ″Test Signal″.
<Procedure>
(1) Start up the [Data Monitor] program.
(2) Select the [Parameter...] and [Data mode...] commands from the [Setting] menu
and designate the measurement parameters as shown in Fig. 4.14.
Fig. 4.14 Setting measurement parameters (Test signal check)
(3) Verify that the measurement value of Channel 1 falls within 18 (±10%) mdeg.
(4) After that, set the ″Photometric mode″ at ″CD″.
30
Page 37

5. TROUBLESHOOTING
If the instrument does not operate properly, the following causes are suspected.
. Erroneous operation
. Deterioration of consumable components
. Failure of instrument
The following table describes basic corrective actions for specific symptoms. If the
difficulty cannot be corrected by performing these actions, failure of the instrument is
suspected. In this case, contact your local JASCO distributor with detailed information
about your difficulty, including the model name, serial number, and date of manufacture
of your instrument.
Symptom Check Corrective action
Power cannot be
turned ON
Is the fuse for the power
The light source does
not light.
Is the cooling water supplied
Is the cathode fixing screw
Is a sparking sound heard? Replace the lamp.
HT voltage does not
increase.
Is the photometric mode set
Is the sample chamber lid
HT voltage has risen
and will not lower.
Is the spectral bandwidth
Is the cable correctly
Is the power cable plugged in
to the outlet?
supply unit intact?
Is the check box ″Turn ON
light source at start″ in the
″System Setting″ dialog box
checked?
to the 450W light source
sufficient?
tight, (450W light source) and
are the anode holder and
lamp is contact with each
other?
Is the shutter open? Open the shutter in the
correctly?
Is the ″HT voltage setting″ in
the ″Detector sensitivity″
dialog box set correctly?
completely closed?
Is a sample in the sample
chamber?
setting too small?
connected to the detector unit
and to the connector located
on the back panel of the
amplifier unit?
Correctly plug in the cable.
Replace the fuse.
Turn ON the light source in
the ″Light source control″
dialog box.
Increase the cooling water
flow rate.
Tighten the cathode fixing
screw. Adjust the contact
plate of the anode holder.
″Shutter control″ dialog box.
Set the measurement mode
at ″CD″ (not ″Test signal″).
Set it at ″Auto″ (not
″Manu″).
Completely close the lid.
Remove the sample.
Increase the spectral
bandwidth.
Correctly replug the cable.
31
Page 38

Is the wavelength set to a
value at which the detector is
not sensitive?
Is the nitrogen gas flow rate
high enough when the
Set the wavelength to a
value at which the detector
is sensitive.
Increase the nitrogen gas
flow rate.
wavelength is set below 180
nm?
Is the ″HT″ switch on the subpanel of the amplifier unit in
Set the ″HT″ switch to
″Auto″.
the ″Auto″ position?
Noise is high Is the spectra bandwidth
setting too small?
Does the sample have high
light absorption?
Increase the spectra
bandwidth.
Decrease the sample
concentration, or shorten
the light path of the cell.
Is noise detected in the HT
Replace the Xe lamp.
voltage?
Is the HT voltage at below
250 nm too high?
Any noise source that
generates electromagnetic
waves nearby?
Is any source of mechanical
vibration nearby?
Does line voltage vary
Adjust the M0 and M1
mirrors.
Remove the noise source
from the proximity of the
instrument.
Remove the source of
vibration.
Use stabilized line voltage.
abruptly.
The baseline curves
sharply.
Is the curvature within ±10
mdeg when the baseline is
Perform baseline correction.
not corrected?
CD value is displayed
although sample is not
Is the sample fluorescent? Decrease sample
absorbance to 2 or less.
optically active.
Is the sample a film or liquid
crystal?
Does the cell contain any
False CD signal from the
sample is suspected.
Prepare a new sample.
optically active residue?
The displayed CD
value is smaller than
normal, or no display
Is the ″HT voltage setting″ in
the ″Detector sensitivity″
dialog box set correctly?
Set it at ″Auto″ (not
″Manu″).
appears.
Repeatability of CD
values is low.
Is the photometric value 18±2
mdeg when the photometric
mode is ″Test signal″?
Is the instrument warmed up
sufficiently?
Failure of the electrical
system or modulator
element is suspected.
Before performing Cd
measurement, warm up the
instrument for approximately
one hour after the light
source has lit.
32
Page 39

Is the sample deteriorated by
the light emitted from the light
source?
Is the variation of the peak
Use the shutter function or
narrow the spectrum
bandwidth.
Normal.
value of aqueous solution of
ammonium d-10-camphor
sulfonate (distilled water, 10
nm cell) at 291.0 nm within 2
mdeg/hr?
Are room temperature and
humidity variations normal?
Maintain room temperature
within 20 ±5°C, and humidity
below 70%.
Is the instrument blown with
draft from an air conditioner or
other?
Is the scanning speed too
high?
Install the instrument in a
position outside of the direct
path of air currents.
Slightly lower the scanning
speed.
Is noise too high? Increase response. Or,
refer to the ″Noise is high″
symptom.
Wavelength
repeatability is low.
Is the instrument warmed up
sufficiently?
Measure wavelength
repeatability after warming
up the instrument for
approximately one hour
after the light source is lit.
Are room temperature and
humidity variations too high?
Maintain room temperature
within 20 ±5°C, and humidity
below 70%.
No communication
with the computer.
Is the communication port
Is the RS-232C cable
connected properly?
Reconnect the cable
correctly.
Correctly set the
setting in agreement with the
communication ports.
wiring?
33
 Loading...