

Page 1

Power meter
IT9121 Series User Manual
Model: IT9121
Version:V1.4
Page 2

IT9121 User Manual
Notices
© ItechElectronic, Co., Ltd. 2017
No part of this manual may be
reproduced in any form or by any means
(including electronic stor age and
retrieval or translation into a foreig n
language) without prior permission and
written consent from Itech Electronic,
Co., Ltd. as governed by international
copyright laws.
Manual Par t Number
IT9121-402145
Revision
1
st
Edition: June 27, 2017
Itech Electronic, Co., Ltd.
Trademarks
Pentium is U.S. registered trademarks
of Intel Corporation.
Microsoft, Visual Studio, Windows and
MS Windows are registe red trad em arks
of Microsoft Corporation in the United
States and/or other countries and
regions.
Warranty
The materials contained in this
document are provided “as is”, and
is subject to change, without prior
notice, in future editions. Further, to
the maximum extent permitted by
applicable laws, ITECH disclaims
all warrants, either express or
implied, with regard to this manual
and any information contained
herein, including but not limited to
the implied warranties of
merchantability and fitness for a
particular purpose. ITECH shall not
be held liable for errors or for
incidental or indirect damages in
connection with the furnishing, use
or application of this document or of
any information contained herein.
Should ITECh and the user enter
into a separate written agreement
with warranty terms covering the
materials in this document that
conflict with these terms, the
warranty terms in the separate
agreement shall prevail.
Technol ogy Licenses
The hardware and/or software
described herein are furnish ed under a
license and may be used or cop ied only
in accordance with the terms of such
license.
Restricted Rights Leg end
U.S. Government Restricted Rights.
Software and technical data rights
granted to the federal government
include only those rights customarily
provided to end user customers. ITECH
provides th is custo mary comme rcial
license in software and technical
data pursuant to FAR 12.211
(Technical Data) and 12.212
(Computer Software) and, for the
Department of Defense, DFARS
252.227-7015 (Technical Data –
Commercial Items) and DFARS
227.7202-3 (Rights in Commercial
Computer Software or Computer
Software Documentation).
Safety Notices
A CAUTION sign denotes a
hazard. It calls attention to an
operating procedure or practice
that, if not correctly performed
or adhered to, could result in
damage to the product or loss of
important data. Do not proceed
beyond a CAUTION sign until
the indicated conditions are fully
understood and met.
A WARNING sign denotes a
hazard. It calls attention to an
operating procedure or practice
that, if not correctly performed
or adhered to, could result in
personal injury or death. Do
not proceed beyond a
WARNING sign until the
indicated conditions are fully
understood and met.
NOTE
A NOTE sign denotes important
hint. It calls attention to tips or
supplementary information that
is essential for users to refer to.
.
Page 3

IT9121 User Manual
Copyright © Itech Electronics Co., Ltd. i
Quality Certification and Assurance
We certify that T9121 power m eter meets al l the published specifications.
Warranty
ITECH warrants that the product will be free from defects in material and
workmanship under normal use for a period of one (1) year from the date of
delivery ( except those described in the Limi tation of Warranty below).
For warranty service or repair, the product must be r eturned to a s ervice center
designated by ITEC H.
The product returned to ITECH for warranty service must be shipped PREP AID.
And ITECH will pay for return of the product to customer.
If the product is returned to ITECH for warranty service from overseas, all the
freights, duties and other taxes shall be on the acc ount of customer.
Limitation of Warranty
This War ranty will be rendered invalid if the product is:
Damage d resulting from cus tom er-wired circuits or customer-supplied parts or
accessories;
Modified or repaired b y customer without authorization;
Damage d resulting from cus tom er-wired circuits or use in an envi ronment not
designated by us;
The product model or serial number is altered, deleted, removed or made
illegible by customer;
Damaged as a result of accidents, includi ng but not limited to lightning,
moisture, fir e, improper use or negligence.
Safety Symbols
Direct current
ON (power)
Alternating current
OFF (power)
Both direct and alternating
current
Power-on state
Protective earth (ground)
terminal
Power-off state
Earth (ground) termi nal
Reference terminal
Caution
Positive terminal
Warning (refer to this manual
for specific Warning or
Caution informati on)
Negati ve terminal
A chassis terminal
-
-
Page 4

IT9121 User’s Manual
Copyright © Itech Electronics Co., Ltd. ii
Safety Precautions
The following safety precautions must be observed during all phases of
operation of this instrume nt. Failure to comply with these pr e cautions or speci f i c
warnings elsewhere in this manual will constitute a default under safety
standards of design, manufacture and intended use of the instrument. ITECH
assumes no l iability for the custom er’ s failure to comply with these preca utions.
Do not use the instrument if it is damaged. Before operation, check the
casing to see whether it cracks or is not appli ed w ith suf ficient plastics. Do
not operate the instrum ent in the pr esence of inflammable gasses, vapor s
or dusts.
The max imum operating voltage and current of the inst rument are 600V
and 20A respectively. Exceeding these limits will l ead to burnout of the
instrument.
Make sure to use the power cord supplied by ITECH.
Check all marks on the instrument before connecting the instrument to
power supply.
Tur n off the instrument and the operation system before connecting to the
I/O terminal.
Do not use the instrument if t he detachable cover is remo ved or loosen.
Do not connect the instrument to any cable or terminal block bef ore
self-testing.
To prevent the pos sibility of accidental injuries, be sure to use the power
adapter supplied by the manufacturer only.
We do not accept responsibility for any direct or indirect financial damag e
or loss of pr ofit that might occur when using the instrument.
This instrument is used for industrial purposes. Do not apply t his product to
IT power supply system.
Never use t he i nst rum ent with a life-support syst em or any ot her equi pment
subject to saf ety requirements.
Fail ure to use the instrument as directed by the manufacturer may render
its protective features void.
Always clean the casing with a dry cloth. Do not clean the internals.
Make sure the vent hole is always unblocked.
Environmental Conditions
The instrum ent is designed for indoor use and an area with low condensation.
The table below shows the general environmental requirements for the
instrument.
Enviro nmental Cond iti ons
Requirements
Operating tem perature
5°C-40°C
Operating humidity
humidity 20%-80%
(non-condensation)
Storage temper ature
-20°C-50 °C
Altitude
Operating up to 2,000 meters
Page 5

IT9121 User’s Manual
Copyright © Itech Electronics Co., Ltd. iii
Install ation category
II
Polluti on degree
Polluti on degree 2
NOTE
To m ake accurate measurements, allow the instrument to warm up for 30 min.
Regulatory Markings
The CE mark indicates that the product
complies with all the relevant European
legal
directives. The specific year (if any)
affixed refers to the year when the design
was approved.
The instrum ent complies with the WEEE
Directive (2002/96/EC) marking
requirement. This affix product label
indicates that you must not discard the
electrical
/electronic product in domestic
househol d waste.
This symbol indicates the time period
during which no hazardous or toxic
substances are expected to leak or
deteriorate during normal use. The
expected useful life of the product is 10
years. The product
can be used safely
during the 10-
year Environment Friendly
Use Period (EFUP). Upon expiration of
the EFUP, the product must be
immediately recycled.
Waste Electrical and Electronic Equiment (WEEE)
Directive
2002/96/E C Waste Electrical and El ectronic Equipment
(WEEE) Directive
This product complies with the WEEE Directive (2002/96/EC)
marking requirement. Thi s affix product label indicates that you
must not discard the el ectrical/electronic product in domestic
househol d waste.
Product Category
With
reference to the equi pment classifications described in the
Annex 1 of the WEEE Directive, this instrument is classified as
a “Monitoring and Control Instr ument”.
To return thi s unw anted instrument, contact your ne ar est I TE CH
office.
Page 6

IT9121 User’s Manual
Copyright © Itech Electronics Co., Ltd. iv
Compliance Information
Complies with the essential requirements of the following applicable European
Directives, and carries the CE marking accordingly:
Electromagnetic Compatibility (EMC) Directive 2014/30/EU
Low-Voltage Directive (Safety) 201 4/35/EU
Conforms with the following product standards:
EMC Standard
IEC 61326-1:2012/ EN 61326-1:2013 ¹²³
Reference Standards
CISPR 11:2009+A1:2010/ EN 55011:2009+A1:2010 (Group 1, Class A)
IEC 61000-4-2:2008/ EN 61000-4-2:2009
IEC 61000-4-3:2006+A1:2007+A2:2010/ EN 61000-4-3:2006+A1:2008+A2:2010
IEC 61000-4-4:2004+A1:2010/ EN 61000-4-4:2004+A1:2010
IEC 61000-4-5:2005/ EN 61000-4-5:2006
IEC 61000-4-6:2008/ EN 61000-4-6:2009
IEC 61000-4-11:2004/ EN 61000-4-11:2004
1. The product is intended for use in non-residential/non-domestic environments. Use of the
product in residential/domestic environments may cause electromagnetic interference.
2. Connection of the instrument to a test object may produce radiations beyond the specified
limit.
3. Use high-performance shielded interface cable to ensure conformity with the EMC standards
listed above.
Safety Standard
IEC 61010-1:2010/ EN 61010-1:2010
Page 7

IT9121 User’s Manual
Copyright © Itech Electronics Co., Ltd. v
Content
Quality Certification and Assurance ....................................................................................................................... 1
Warranty ............................................................................................................................................................... 1
Limitation of Warranty .......................................................................................................................................... 1
Safety Symbols ...................................................................................................................................................... 1
Safety Precautions ................................................................................................................................................. 2
Environmental Conditions ..................................................................................................................................... 2
Regulatory Markings ............................................................................................................................................. 3
Waste Electrical and Electronic Equiment (WEEE) Directive ................................................................................... 3
Compliance Information ........................................................................................................................................ 4
Chapter1 Introduction ..................................................................................................................................... 1
1.1 Brief Introduction ............................................................................................................................................ 1
1.2 Introduction of front panels............................................................................................................................. 2
1.3 Introduction to keyboard ................................................................................................................................. 2
1.4 Introduction of Menu Function........................................................................................................................ 3
1.5 Introduction of Interface Display Information .................................................................................................. 5
1.6 Introduction of Interface Symbols.................................................................................................................... 5
1.7 Introduction of rear panels .............................................................................................................................. 6
Chapter2 Measurement Conditions ................................................................................................................. 7
2.1 Setting of Measurement Range ....................................................................................................................... 7
2.2 Setting of Measurement Interval ..................................................................................................................... 9
2.3 Setting of Filter and Crest Factor .................................................................................................................... 11
2.4 Setting of Averaging Function ........................................................................................................................ 12
Chapter3 Basic Measurement Functions ....................................................................................................... 15
3.1 Basic Concepts .............................................................................................................................................. 15
3.2 Setting of Measurement Function and Interface Display ................................................................................ 16
Chapter4 Waveform Display Function ........................................................................................................... 18
4.1 Basic Concepts .............................................................................................................................................. 18
4.2 Adjustment of Measurement Parameters ...................................................................................................... 21
4.3 Setting of Trigger Configuration ..................................................................................................................... 21
Chapter5 Integral Operation Function ........................................................................................................... 23
5.1 Basic Concepts .............................................................................................................................................. 23
5.2 Setting of Integral Measurement Configuration ............................................................................................. 27
5.3 Integration..................................................................................................................................................... 29
Chapter6 Harmonic Measurement Function .................................................................................................. 32
6.1 Basic Concepts .............................................................................................................................................. 32
6.2 Setting of Harmonic Measurement Configuration .......................................................................................... 35
Chapter7 Routine Maintenance ..................................................................................................................... 38
7.1 Self-inspection ............................................................................................................................................... 38
7.2 Error Information References ........................................................................................................................ 38
7.3 Daily maintenance ......................................................................................................................................... 40
7.4 Contact of ITECH Engineers............................................................................................................................ 40
Chapter8 Technical Specifications .................................................................................................................. 42
8.1 General Specification ..................................................................................................................................... 42
8.2 Screen Display ............................................................................................................................................... 42
8.3 Input Parameters ........................................................................................................................................... 42
8.4 Voltage and Current Accuracy ........................................................................................................................ 44
8.5 Active Power Accuracy .................................................................................................................................. 44
8.6 Voltage Current and Power measurements.................................................................................................... 45
8.7 Frequency Measurement............................................................................................................................... 47
8.8 Harmonic Measurement ................................................................................................................................ 47
Page 8

IT9121 User’s Manual
Copyright © Itech Electronics Co., Ltd. vi
8.9 Fundamental Frequency ................................................................................................................................ 48
8.10 Accuracy ...................................................................................................................................................... 48
8.11 Oscilloscope Function .................................................................................................................................. 49
8.12 Interface Specification ................................................................................................................................. 49
Page 9

Introduction
Copyright © Itech Electronics Co., Ltd. 1
Chapter1 Introduction
1.1 Brief Introduction
The IT9121 power meter can provide the maximum input of 600Vrms and
20Arms and the measurement bandwidth of 100KHZ and thus can be easily
used for measuring the parametersincluding voltage, current, power, frequency
and harmonics. Standard configuration includes USB, GPIB, RS232 and LAN
communication interfaces and also the interface for USB peripherals. The user
can store the measured parameters in the external storage medium. The
voltage and current precision is 0.1%. The instrument also has many integral
functions, such as the active power. The product can be widely applied in
motors, household appliances, UP S and other test fields.
Features
4.3-inch color liquid crystal displ ay (TFT)
The number of matrix columns to be displayed on the screen and the
commonly used measurement parameters can be set freely.
Input range:600Vrms/20Arms
The voltage, current, power, harmonics and other parameters can be
measured at the same time.
The precision of voltage and current m easurement is up to 0.1%.
It has the harmonic measuring function and can measure 50-order
harmoni c components at most.
With the interface for USB peripherals, the user can store the interface in
the external storage medium.
With many powerful integral functions, the bought/sold electricity can be
calculated.
Frequency me asurement function
Built-in USB, GPIB, RS232 and LAN communication interfaces
Application advantages
Analysis of UPS power quality:
As an important backup power supply in the communication industry, the
steady-state characteristics, dynamic characteristics, power quality and
other parameters of UPS should be analyzed. With internal nonlinear
elements, the UPS power supply will generate a large number of harmonic
components during operation, which may affect operation of the
communication system. The IT9121 power meter can measure such
parameters as the AC/DC signal, power factor, harmonics, frequency and
distortion factor, and systematically and comprehensively analyze the
performance of the UPS power supply.
Test of performance of household appliances:
With promotion of the concept of using energy in a rational and
environmentally friendly manner, more and more household appliances
adopt the variable frequency control technology to reduce the power
consumption. The IT9121 power meter can measure the inrush current,
active power, crest factor, etc.
Page 10

Introduction
Copyright © Itech Electronics Co., Ltd. 2
1.2 Introduction of front panels
Schematic Diagram of Front Panel of IT9121 Series Power Meter and Diagram
of Key Functions.
1 USB Interface
2. Displ ay
3. Menu key
4. Waveform Display key
5 Basic fu nctions
6. Harmonic key
7. Integrator key
8. Setting knob
9. Arrow keys
10. Hold/Esc key
11. Enter key
12. Image Save key
13 Parameter setting key
14. Menu key
15 Power switch
1.3 Introduction to keyboard
The functions of keys on the front panel of the IT9121 series power meter are
shown in the following table.
Key tag
Name and funct ion
Waveform Display key When this key is pressed,the waveform
corresponding to current measurement data will be displayed.
Harmonic Measurement key When this key is pressed, the
harmonic measurement results and the menu of harmonic
measurement parameter configuration will be displayed.
Basic Measurement key When this key is pressed, the
measurement data of various it ems w ill be displayed.
Integral Measurement key When this key is pressed, the integral
measurement results and the menu of integral measurement
parameter configuration will be displayed.
Menu key, used for setting relevant measurem ent parameters of
the power met er.
Enter key, used for savi ng the settings.
Image Save key
Cancel/E SC key
The front panel keyboard can be locked/unlocked when the ESC
key is constant ly pressed for 5s.
The remote control m ode of the power meter can be switched to
the panel operation mode when
the ESC key is constantly
pressed for 5s.
Page 11

Introduction
Copyright © Itech Electronics Co., Ltd. 3
Key tag
Name and funct ion
Up/Down key and Left/Right key
List Edi t: t hose l i nes w hich are not displayed c an be di spl ay ed by
operating t he Left /R i ght key. Those rows w hi ch are not di spl ay ed
can be displayed by operating the Up/Down key.
Menu Edit: the programming items can be rolled by operating
the Up/Down key. Prompts of corresponding options are
displayed on the right and options can be selected v ia the soft
key.
Digit Edit: the programming items can be rolled by operating the
Up/
Down key. The digit to be edited is selected by operating the
Left/Right key or via the knob. Carrying can be completed
automatically.
Soft key The contents on the left of the key and the menu
function displayed above the key on the display screen may be
subject to changes.
Knob key, used for setting the value indicated by the cursor,
selecting the voltage and current range, adjusting the waveform,
etc.
1.4 Introduction of Menu Function
Press this key to enter the system menu function. Menu is described as
follows.
Menu
Menu setting
SYSTEM
SYSTEM INFO
Instrument system
information
Model
Instrument model
Serial
Instrument SN
Cpu Version
The version of CPU
Dsp Version
The version of Digital Sig nal Processing
MAC address
Network hardware address
Socket Port
Port number
COMM CONFIG
Communication
configuration
R232
BAUD Rate
Set the communication baud
rate:4800/9600/19200/38400/57600/115200
Parity Chack
Communication parity check bit: Default:
NONE
Data bit
Communication data bit: 8 (default)
Stop bit
Communication st op bit : 1 (default)
USB T y pe B Conne ct
Select the USB communicat ion interface.
GPIB GPIB Address
The address is adjustable between 1 and 30.
LAN
IP mode
IP mode: MANU/DHCP
IP Addre ss
IP address setting
Subnet mask
Set the subn etmask.
Gateway
Set the gateway.
Page 12

Introduction
Copyright © Itech Electronics Co., Ltd. 4
SYSTEM CONFIG
System conf iguration
Date (YY/MM/DD)
System date: Year/Month/Day
Ti me (hh:mm:ss)
System time: Hour/Minute/Second
Brightness
Set the screen brightne ss.
Beep
Set the keyboard sound
SELF TEST
Self test
SYSTEM SELF_T EST
Self test
INITIAL
Initialize
SYSTEM INITIAL
System initialization
SETUP
SETUP INFO
Configuration information
Averag
Average
Sync Source
Synchronization
Line Filt er
Line fil ter
Update Rate
Data updating rate
Freq Filter
Frequency filter
Crest Factor
Crest factor
ExSensor1
External current sensor 1 (range:
CF=3:2.5V,5V,10V; CF=6:1.25V, 2.5V,5V.)
ExSensor2
External current sensor 2 (range:
CF=3:50mV,100mV,200mV,500mV,1V,2V;
CF=6:25 mV,50mV,100mV,250mV,0.5V,1V.)
Rate(V/A)
Conversion ratio of external cur rent sensor 1
Rate(mV/A)
Conversion ratio of external cur rent sensor 2
U_Range
Voltage range
I_Range
Current range
AVERAG SET
Average f unction setting
State
Status
Mode
Mode
Type
Loading Type
Count
Counti ng cycle
EXT SEN SET
External current sensor
setting
EXSENSOR 1
Set the external current sensor 1: ON/OFF
Ratio(V/A)
Set the con version ratio of the external
current sensor 1
EXSENSOR 2
Set the external current sensor 2: ON/OFF
Ratio(mV/A)
Set the con version ratio of the external
current sensor 2
OTHER SET
Other settings
Sync Source
Select the synchroni zation source: U/I/OFF
Freq Filter
Set the frequency filter: ON/OFF
Line Filt er
Set theline filter : ON /OFF
Crest Factor
Set the crest factor: CF3/CF6
Update Rate
Set the data updating rate:
0.1s/0.25s/0.5s/1s/2s/5s
INRUSH SET
Inrush sett ing
Page 13

Introduction
Copyright © Itech Electronics Co., Ltd. 5
State
Status
Trig le vel(A)
Trigger level
Delay time(ms)
Delay time
Measure time(s)
Measuri ng time
CAL ZERO
Calibration Zero
Zero point calibration
Calibration Zero
Zero point calibration
1.5 Introduction of Interface Display Information
The IT9121 power meter has four measurement modes. Below is the
introduction of basic interface information, with the basic measurement
interface as an example.
Basic measurement interface
Select the “Meter” button, and the initial interface of basic measurement as
shown bel ow will appear.
1.6 Introduction of Interface Symbols
The interface of the IT9121 power meter will display the following symbols.
Status Bar icon
Status descri ption
This icon appears when the line filter is
switched on.
This icon appears when the frequency filter is
switched on.
This icon appears when USB is insert ed.
Over-voltage protection icon: this icon appears
when over-voltage occurs.
Over-current protection icon: this icon appears
when over-current occurs.
Page 14

Introduction
Copyright © Itech Electronics Co., Ltd. 6
Status Bar icon
Status descri ption
Key Lock: this icon appears when the keyboard
is locked.
Remote Lock: this icon appears in remote
operation and then local keys fail.
This icon appears in remote network
connection.
1.7 Introduction of rear panels
Schemati c D iagram of Rear Panel of IT9121 Power Meter.
1. GPIB interface
2 Ethernet interface
3 USB Interface
4. RS232 i nterface
5. External synchronization signal interface
6 Power i nterface
7. External sensor interface
8. Voltage input terminal
9. Current input terminal
Warning: The external sensor interface (as shown in Fig. 7 above) of IT
9121 power meter is installed with a protective jacket at ex-factory, which
should be correctly installed at all circumstances unless an external sensor
permitted by ITEC H is used.
Page 15

Measurement Conditions
Copyright © Itech Electronics Co., Ltd. 7
Chapter2 Measurement Condi t i ons
This chapter describes details of relevant work to be finished before use of the
IT9121 power meter.
2.1 Setting of Measurement Range
The appropriate measurement range (v oltage and current range) must be set
for accurate measurement. The selected range is effective for different
measurement modes, such as waveform display, integral measurement and
harmoni c me asurement.
Operation steps
1. In the “Meter” interface Press the soft key corresponding to “V-RANGE” or
“A-RANGE”, and us e the knob or “ ” to select the voltage or current
range.
2. Press the “Enter” key to confirm the setting. The instrument will
automatically confirm and exit the setting in case of no operation on the
interface for more than 5s.
When the crest factor is 6:
Figure: Voltage Range
Figure: Current Range
Page 16

Measurement Conditions
Copyright © Itech Electronics Co., Ltd. 8
When the crest factor is 3:
Figure: Voltage Range
Figure: Current Range
NOTE
When EX1 or EX2 is installed, the power meter has more current range options. See details
in IT9121 Installation Instructions.
Voltage and current range
Set the measurement range according to the lev el of the effective value. When
the voltage or current signal is input into the input unit, there are two types of
range: fixed and automatic.
Fixed range
Select the required range from a number of options. After selection, the range
will not change with the input signal. For the voltage range, when the crest
factor is 3, the maximum option is “600V” and the minimum option is “15V”.
When the crest factor is 6, the maximum option is “300V” and the minimum
option is “7.5V”.
Page 17

Measurement Conditions
Copyright © Itech Electronics Co., Ltd. 9
NOTE
During measurement of the distortion waveform and other non-sinusoidal wave signals, the
accuracy of measurement can be improved by selecting the minimum range on the premise
that the measured value does not exceed the range.
Auto-measuring span
The range is switched automatically according to the input signal. The range
types for switching are the same as those of the fixed range.
Principles of automatic range l evel increase:
The range level is increased when any one of the following conditions is
satisfied.
Urms or Irms exceeds 110% of the current range setting.
The crest fa ct or is 3. The value Upk or Ipk of t he i nput si gnal ex cee ds 33 0%
of the current range setting.
The crest factor is 6. The value Upk or Ipk of the input signal exceeds 660 %
of the current range setting.
Principles of automatic range l evel decrease:
The range level is decreased when all of the following conditions are satisfi ed.
Urms or Irms is less than or equal to 30% of the current measurement
range.
The crest factor is 3. The v alue Upk or Ipk of the input signal is less than
300% of the ra nge at the following l evel.
The crest factor is 6. The v alue Upk or Ipk of the input signal is less than
600 % of the ran ge at the following l evel.
NOTE
The selected automatic range may change when the input waveform is a pulse waveform of uncertain
cycle. In this case, the fi xed range should be selected.
2.2 Setting of Measurement Interval
The time for acquisition of sampling data is determined by the measurement
interval during measurement. The measurement interval is determined by the
data updating rate and synchronization source. The synchronization source
provides reference signals for measurement, and the data updating rate
determines the updating cycle of sampling data.
Measurement interval
The measurement interval is determined by the data updating rate and
synchronization source. (see “2.3 Setting of Filter and Crest Factor” for specific
settings)
Synchronization
IT9121 adopts the frequency measurement circuit to t est the input signal cycle
set in the measurement interval. The measurement inter val is the integer times
of the test cy cle. The measured value of IT9121 is calculated by averaging
sampli ng data in the measurement i nterval. The reference input signal used for
defining the input signal measurement interval is called the synchronization
source.
Measurement inter val for conventional measurement
The measurement interval of the reference input signal is the time fro m the
Page 18

Measurement Conditions
Copyright © Itech Electronics Co., Ltd. 10
starti ng part of the rising slope (or descending sl ope) through the zero point
(intermediate value of amplit ude) to the ending point of the rising slope (or
descendi ng slope) through the zero point (intermediate value of amplitude).
However, the measurement int erval which det ermines the maximum
voltage or current is within the overall data updating cycle. Therefore, the
measurement of Ipk+, I pk-, Upk+, Upk-, Ucf and Icf cal cul ated base d on t he
maximum voltage and current also adopts the data updating cycle as the
measurement interval.
The rising or descending edge is selected automatically to prolong the
measurement interval.
If there i s only one or no rising slope or descending slope wit hin the data
updating cycle, the data updating cy cle is taken as the measurement
interval.
The input signal to be used as the synchronization source can be set in
each unit (for synchronizati on with the zero point of that input signal). The
overall interval of the signal voltage, current or data updating cycle can be
selected as the synchronization source for mea surement.
NOTE
The data updating cycle refers to the cycle used for calculating sampling data of the
measurement function. It is identical to the set value of the data updating rate.
The slope refers to signal changes from low level to high level (rising edge) or from high level to
low level (descending edge).
Measurement interval for harmonic measurement
At the sampling frequency of harmonic m easur e ment , t he meas ure ment i nt erval
refers to t he first point 1024 from the data updating cycle. The sampling
frequency of harmonic measure me nt is determined automatically by the signal
cycle set as t he P LL source in the instrument. The sampling data or
measurement interval for calculation may be differ ent from the sampling data or
measurement interval of the measur ement function in conventional
measurement.
Page 19

Measurement Conditions
Copyright © Itech Electronics Co., Ltd. 11
2.3 Setting of Filter and Crest Factor
Operation steps
1. Select Menu > SET UP > OTHER SET and enter the OTHER configuration
page.
2. Press to select the param eter to be config ured (bl ue fo nt bac kgr ound),
and then press the soft key corresponding to the paramet er on the right to set
the required value, as shown in the following diagram.
Character
Function description
Sync Source
Select the synchronization source: U/I/OFF. The overall
interval of the signal voltage, current or data updating cycle
can be selected as the synchronization source for
measurement.
Freq Filter
Set the status of the frequency filter. When “ON” is selected,
the frequency filter is turned on. When “OFF” is selected, the
frequency filter is turned off.
Line Filt er
Set the status of theline filter. When “ON” is selected, the line
filter is turned on. When “OFF” is selected, the line filter is
turned off.
Crest Factor
Set the crest factor: CF3/CF6
Update Rate
Data Updating Rate Setting key: when this key is pressed, the
capture interval of the voltage, current, power and other data,
i.e. data updating rate, can be set. When the data updating
rate is increased, rapid load changes of the power system can
be obtained. When the data updating rate is decreased,
relative low-
frequency signals can be measured. Options of
the data updating rate: 0.1s/0.25 s/0.5s/1s/2s/5s
3. Press the Enter key to save the settings.
Filter
Frequency filter: it is inserted in the frequency measurement circuit and may
affect frequency measurement. It can be used for filtering high-frequency
components of interference to make the measured frequency parameter more
accurate. W hen the frequency filter is switched on, the voltage or current of no
more than 200Hz can be mea sured. The cutoff frequency is 500HZ.
Page 20

Measurement Conditions
Copyright © Itech Electronics Co., Ltd. 12
Line filter: it is inserted in the voltage and current m easurement circuit and has
direct influence on measurement of the voltage, current and power. When the
line filt er is swit ched on, noi se and high-frequency component s fr om t he invert er
or distortion waveform can be fil tered. The cutoff frequency is 500HZ.
Crest factor
The crest factor is the ratio of the waveform peak to the effective value. The
crest factor of IT9121 is specified as the times of the crest value which can be
input under the rated input conditions. The crest factor CF3 or CF6 can be
selected in the interface “Menu > SETUP > OTHER SET”.
ranget Measuremen
input be can whichPeak value
)(factor Crest =CF
The crest factor can be set as 3 or 6. The crest factor can be measured under
the foll ow ing conditions:
{ }
value)(effective valueMeasured
6)or (3 CF of Set valueranget Measuremen
factorCrest
×
=)(CF
NOTE
The crest value of the input signal must be no more than the maximum allowable
input value.
When the crest factor of the measured signal is larger than the crest factor in
instrument specifications (based on the crest value of rated input), the signal
with the crest factor larger than the specified value can be measured by setting
a range including the value of the measured signal.
For example, when CF is set as 3 but the measured value (effective value) is
less than 60% of the range, the signal w ith CF more than 5 can be measured.
When CF is 3, the signal with CF equal to 300 can be measured under
minimum effective input (1% of the range) conditions.
The voltage range, current range, effective input range and measurement
accuracy de pend on the set crest factor.
2.4 Setting of Averaging Function
The user can set the averaging function via this menu. When the input signal
frequency is low, the value is displayed unstably and cannot be read easily. In
this case, the averaging function can be enabled to calculate and display the
average value of several measurements.
Operation steps
1. Select Menu > SET UP > AVERAG SET to enter the configuration page of
the averaging function.
2. Press to select the parameter to be configured (blue font
background), and then press the soft key corresponding to the parameter on
the right to set the required value, as shown in t he followi ng diagram.
Page 21

Measurement Conditions
Copyright © Itech Electronics Co., Ltd. 13
Parameter descriptions:
Character
Function description
State Set the status of the averaging function. When “ON” is selected,
the averaging function is enabled. When “OFF” is selected, the
averaging function is disabled.
Type
Set the linear averaging type. EXP: index averaging, often used
for analy sis of t he non-st ationary process. LINE: li near averaging,
often used for measurement and analysis of the stationary
random process. The deviation relative to the standard can be
reduced by increasing the averaging times.
Tcontrol
Set the mode of the averaging function. MOVING: moving
averaging R EP EAT: repeate d averaging
Count
Set the times of the averaging function. If the mode of the
averaging function is set as EXP (index averaging), the
attenuation constant can be set. If the mode of the averaging
function is set as LINE (linear averaging), the averaging times
can be set.
3. Press the Enter key to confir m the setting.
Averaging mode
Index averaging:
Computing formula:
k
DM
DD
nn
nn
11−
−
−
+=
Dn: the value displayed after the nth index averaging (D1, the value
displayed after the first averaging, is equal t o M1)
Dn-1: the value displayed after the (n-1)th index averaging
Mn: the nth measured data.
K: attenuation constant (1-64)
Linear averaging
Computing formula:
( )
m
MMMM
D
nnnmn
n
+++
=
−−−− 121
....
Dn: the value displayed after linear averaging of m values from the
(n-(m-1))th to nth val ue
Page 22

Measurement Conditions
Copyright © Itech Electronics Co., Ltd. 14
Mn-(m-1): the (n-(m-1))th measured data
Mn-2: the (n-2)th measured data
Mn-1: the (n-1)th measured data
Mn: the nth measured data.
M: the number of average values (1-64)
When m can be divided exactly by n, the calculated value is the moving
average; when there is no particular relationship between m and n, the
calculated value is the repeated averag e.
NOTE
When index averaging is set, averaging is implemented under the harmonic
measurement function.
When linear averaging is set, averaging can only be implemented in the conventional
measurement function and this mode is not applicable to the harmonic measurement
function.
Averaging function
Measurement function in conventional measurement
The following measurement functions are subject to di rect averaging. Data of
the foll owing mea sure ment funct i ons ar e obtained via operation in ot her modes,
and the obtained measurement function is affected averaging.
Urms, Umn, Udc, Urmn, Uac, Irms, Imn, Idc, Irmn, Iac, P, S and Q.
Ucf, Icf, PF and WPAV are calculated by operation of the a veraged Urms,
Irms, P and S.
Measurement function in harmonic measureme nt
The following measurement functions are subject to di rect averaging. Data of
the foll owing mea sure ment funct i ons ar e obtained via operation in ot her modes,
and the obtained measurement function is affected averaging.
U(k), I(k), P(k), S(k) and Q(k).
PF(k) is calculated via operation of the average d P(k) and Q(k).
U(%r), I(%r), P(%r) , U(%f), I(%f) and P(%f ) are calculated via operation of
the averaged U (k), I(k) and P(k).
(k indicates t he harm onic t imes.)
NOTE
When the averaging function is enabled, the average of a number of measurements
are calculated and displayed. Therefore, in case of drastic changes of the input signal,
the measured value will slowly affect these changes.
For both the attenuation constant of index averaging and the number of averaged
values of linear averaging, the larger the set value is, the more stable the measured
value is.
The following measurement functions will not be affected by averaging.
Conventional measurement functions:fU, fI, Ipk+, Ip k-, Upk+, Upk-, Time, WP, WP+,
WP-, q+, q-, q and Fsyn.
Harmonic measurement functions: φ(k) , φUU(k) and φII(k) (k indicates the harmonic
times).
Page 23

Basic Measurement Functions
Copyright © Itech Electronics Co., Ltd. 15
Chapter3 Basic Measurement Funct ions
This chapter describes the features and use of the basic measurement
functions of the IT9121 power meter in details.
3.1 Basic Concepts
The IT9121 power meter has rich basic power measurement functions and can
be used for accurately measuring the voltage, current, power, AC/DC signal,
power factor, harmonics, frequency, distortion factor and other parameters. The
reliable data can prov ide a scientific basis for analysis of the power quality and
performance of equipment.
Introduction of soft keys on the interface
Menu soft key
Instruction
U-RANGE
Set the voltage range.
I-RANGE
Set the current range.
RUN/HOLD
Running/holding
RESET Reset soft key When this key is pressed, the instrument
can immedi ately carry out measurem ent again.
VIEW 1
View (1): displaying 1 large value and 6 small values.
VIEW 4
View (4): displaying 4 large value and 6 small values.
VIEW 12
View (2): displaying 12 large values.
MAXHOLD
(OFF/ON)
Maximum value holding (OFF/ON): the maximum value
(MAX) of data can be held.
CONFIG
Basic measur ement configuration
Measured parameters
Parameters
Parameter descriptions
Parameters
Parameter descriptions
P
Active power [W]
Imn
Average rectified val ue after
the
current is calibrated to
the effective value
Q
Reactive power [var]
Idc
Average current
S
Apparent power [VA]
Ipk+
Positive current peak value
[A]
PF
Power factor
Ipk-
Negative current peak value
[A]
Page 24

Basic Measurement Functions
Copyright © Itech Electronics Co., Ltd. 16
Parameters
Parameter descriptions
Parameters
Parameter descriptions
φ
Phase difference of voltage
and current
Ipp
Current peak-to-peak value
[A]
Fsyn
Synchronization source
frequency
Icf
Current crest factor
Irms
Current effective value [VA]
fI
Current frequency (Hz)
Iac
AC current component
Irush
Inrush current
Irmn
Average rectified current [A]
Urms
Voltage effective value [VA]
Umn
Average rectified value after
the voltage is calibrated to the
effective value
Urmn
Average rectified value of
voltage [V]
Udc
Average voltage [V]
Uac
AC voltage component
Upk+
Positive voltage peak value
[V]
Upk-
Negative vo ltage peak va lue
[V]
Upp
Voltage peak-to-peak value
[V]
Ucf
Voltage crest factor
fU
Voltage frequency (Hz)
3.2 Setting of Measurement Function and Interface
Display
The power meter has three interface display styles for measurement of basic
parameters. At most five pages are displayed in each style. When one or more
important measurement parameter(s) should be highlighted, the View1 or
View4 mode can be freely enabled to design the humane display style. W hen
you need to view all parameters at the same time in one interface, the View12
mode can be enabled.
Take power measurement as an example. The interface can display four
parameters in the large font form: effective voltage, effective current, active
power and power factor. Operating procedures ar e as below:
Operation steps
1. In the “Meter” interface when the soft key corresponding to “VIEW 4” is
pressed, 10 measurement parameters can be displayed in total, 4 of which
are displayed in an amplified manner. Other measurement parameters can
be viewed by pressing key to turn pages, as shown in the figure
below.
2. When the soft key corresponding to “CONFIG” is pressed, the
measurement function can be selected and the interface display
Page 25

Basic Measurement Functions
Copyright © Itech Electronics Co., Ltd. 17
information can be set.
3. W hen the soft key corresponding to “FUNC” is pressed, the measurem ent
function can be s elected. For exam ple, when the “FUNC” key is pressed
once, the displayed measurement function will be switched once in the
W/I/V sequence. Different measurement parameters are displayed when
different functions are selected. As power measurement is taken as an
example in this operat ion, P is selected.
P (power): P, Q, S, PF, φ and Fsyn
I (current): Irms, Imn, Irmn, Idc, Iac, Ipk+, Ipk-, Ipp, Icf,
fI and Irush
U (voltage): Urms, Umn, Urmn, Udc, Uac, Upk+, Upk-, Upp, Ucf and
fU
4. Press the “ ” key and move the cursor to select the parameter
displayed in the interface (blue font background). Press the right soft key
corresponding to the parameter to adjust the parameter displayed at
present. P, Q, S and PFare set in sequence.
NOTE
When the soft key corresponding to the parameter is pressed once, the parameter will be
selected in sequence.
5. You can also press the “INSER T PAGE” to add a display page. At most five
pages are all owabl e. Press t he “DELET E P AGE” to del ete the di splay page.
At least one page should be left.
Page 26

Waveform Display Function
Copyright © Itech Electronics Co., Ltd. 18
Chapter4 Waveform Display Function
This chapter describes the features and use of the waveform display function of
the IT9121 power meter in details.
4.1 Basic Concepts
The IT9121 power meter has a waveform display function based on sampling
data. The voltage and current waveform of the input unit can be displayed or
hidden. Only the necessary waveform is displayed to facilitate observation. The
wavefor m display interface includes the vertical axis and the horizontal axis.
Introduction of soft keys on the interface
When the button is pressed, the initial waveform display interface
below appear s.
Description of information of w aveform display interf ace:
Parameter name
Parameter descriptions
U_RANGE
Voltage range setting: press the soft key
corresponding to this parameter to set the voltage
range.
I_RANGE
Current range setting: press the soft key
corresponding to this parameter to set the current
range.
RUN/STOP
Run/stop: press the soft key corresponding to this
parameter to run or stop the waveform status.
SINGLE
Single measurement key: when single
measurement is performed under stop conditions,
the stop status will be enabled again after one
measurement according to the curre
nt data
updating rate. When single measurement is
performed under running conditions, one
measurement will be performed immediately by
the instrument and then the stop status will be
enabled.
SCOPE(U/I/UI)
Select the waveform to be displayed on the
screen: voltage/current/voltage and current.
Page 27

Waveform Display Function
Copyright © Itech Electronics Co., Ltd. 19
Parameter name
Parameter descriptions
KNOB SEL
(U/I/TL/TD/Td)
Knob selection: the following variables can be
adjusted by rotating the knob: vertical voltage
position/vertical current position/trigger
level/t rigger delay/level calibration.
AUTO
Automatic adjustment key: when the soft key
corresponding to this parameter is pressed, the
power meter will automatically calibrate the input
signal to display the best effect of t he input signal.
TRIG SET
Trigger setting
MEASURE SET
Measurement setting
Introduction of waveform display interface
The trigger status is described as follows:
Trigger
status
Instruction
Auto
When the trigger mode is set as Auto, the trigger status Auto
will be di splayed after triggering.
Auto?
When the trigger mode is set as Auto, the trigger status will be
Auto in the case of no triggering?
Trig
When the trigger mode is set as Normal, the trigger status Trig
will be di splayed after triggering.
Trig?
When the trigger mode is set as Normal, the trigger status will
be Trig in the case of no triggering?
Stop
When the “Stop” soft key in the waveform display interface is
pressed, the t rigger status Stop will be displayed.
Vertical calibration
When the crest factor CF is 3, the selected vol tage range and current range will
Page 28

Waveform Display Function
Copyright © Itech Electronics Co., Ltd. 20
be subject to vertical calibration (voltage/grid, current/grid). When CF is 6, the
selected voltage range and current range will be subject to two-time vertical
calibration (voltage/grid, current/grid).
Horizontal calibration
When the “KNOB SEL” soft key is pressed and “T/d” is selected, horizontal
calibration (scanning speed) adjusted by rotating the knob. In this case,
time/grid information changes can be observed on the screen by rotating the
knob and changing the horizontal (time/grid) setting. When acquisition is run,
the sampling rate can be changed by adjusting the horizonta l calibration knob.
When acquisition is stopped, sampling data can be amplified by adjusting the
horizontal calibration knob.
Trigger delay
When the KNOB SEL s of t key is pr essed and “T D” is selected, the trigger delay
can be adju sted by rotating the knob. In this case, when the knob is rotated, the
trigger point will move horizontally and the delay time will be displayed on the
screen. When the delay time is changed, the trigger point ( ) will move
horizontally, and the distance between the trigger point and the horizontal
center will be indicated. The trigger point is displayed along the top of the
display grid.
Trigger waveform
When the specified trigger conditions are satisfied, the trigger waveform will be
displayed, and the triggering time point is called trigger point. The trigger point
is general ly di spl ay ed in t he l ef t of the display screen. Foll owi ng t he tr i gger poi nt ,
the waveform is displayed on the display screen from left to right over time.
Before using the trigger function, the user needs to configure the following
parameters:
Trigger mode
The trigger mode refers to conditions for updating the contents displayed
on the screen. Including the Auto model and Normal mode Auto mode: the
displayed waveform is updated in case of triggering in the pause time and
automatically updated in case of no triggering in the pause tim e. Normal
mode: the displayed content is updated in case of triggering and not
updated in case of no triggering.
Trigger source
The trigger source is used for generating triggering conditions. The user
can select the trigger source from the input signal of the input unit and the
external clock signal.
Trigger slope
The slope refers to signal changes from low level to high level (rising edge)
or from high level to low level (descending edge). When used as a
triggering condition, the slope is called trigger slope.
Trigger level
Level of trigger slope: triggering occurs when the level of the signal of the
trigger source reaches the set trigger level under t he specified trigger slope
conditions. When the “KNOB SEL” soft key is pressed and “ TL” is selected,
the trigger level can be adjusted by rotating the knob. In this case, the
trigger level can be changed by rotating the knob, and changes in the
Page 29

Waveform Display Function
Copyright © Itech Electronics Co., Ltd. 21
trigger level can be observed on the screen.
4.2 Adjustment of Measurement Parameters
You can rotate the knob to adjust the vertica l calibration, horizontal calibration,
trigger delay and trigger level of the waveform display interface. Detailed steps
are as follows:
Operation steps
1. Press “ ” to enter the w aveform display interface.
2. In the waveform dis play interface Press the soft key corresponding to the
“KNOB SEL” parameter and select the parameter to be adjusted. When
“KNOB SEL” is pressed once, the parameter to be adjusted via the knob
will be switched in sequ ence among U/I/TL/TD/Td.
3. When the parameter is adjusted by rotating the knob, the interface will
display changes of the corresponding value.
4.3 Setting of Trigger Configuration
When you need to enable the trigger function, you should select the trigger
source, trigger mode, trigger slope and other trigger-related configuration.
Detailed steps are as follows:
Operation steps
1. Press “ ” to enter the w aveform display interface.
2. In the waveform dis play interface Press the soft key corresponding to the
“TIRG SET” parameter to enter the trigger setting interface, as shown
below.
3. Press the right soft key corresponding to the parameter to select the
required trigger configuration.
Source: trigger source
Mode: trigger mode
Slope: trigger slope
Page 30

Waveform Display Function
Copyright © Itech Electronics Co., Ltd. 22
External trigger input (Ext)
When the trigger source is set as Ext, input the trigger signal into the external
signal input interface (Synchr onous) of the rear panel according to the following
specifications.
Projects
Specification
Interface t ype
BNC inter face
Input level
TTL
Minimum pulse width
1µs
Trigger delay time
Within (1μs + 3 sampling cycles)
NOTE
When the voltage higher than 0-3.3V is applied on the external signal input interface
(Synchronous), the instrument may be damaged.
Minimum pulse width: refers to the width of the high or low trigger level, at least 1µs.
Trigger delay time: refers to the delay between the appearance of the trigger level and the
response of CPU, within (1μs + 3 sampling cycles).
Page 31

Integral Operation Function
Copyright © Itech Electronics Co., Ltd. 23
Chapter5 Integral Operation Function
This chapter describes the features and use of the integral function of the
IT9121 power meter in details.
5.1 Basic Concepts
The IT9121 power meter can be used for integral operation of the current and
power of the input un it. Technical indic ators can be calculated. In addition, the
range can be swi tched auto mati cally in the Buy and Sell modes accor ding t o the
input level so as to accurately compl et e integr ate mea sur e ment .
During operation of the air-conditioner, refrigerator, induction cook and other
household appliances, the working status will change frequently, resulting in
changes of the working current in a large scale. The current m ay decrease of
dozens of amperes to a few milliamperes. Ordinary power measuring
instruments can only be used for integral measurement within one range. If the
measured value exceeds the current maximum range, the measurem ent result
is inaccurate. You need to manually switch the range before integral
measurement. Integral measurement of equipment subject to large current
changes cannot be performed continuously. The IT9120 series power meter
can automatically switch the range in the integral mode. Therefore, errors of
integral measurement caused by manual range switching can be elim inated,
and the power consumption of household appliances can be measured more
accurately. See the schematic diagram below.
Introduction of soft keys on the interface
When the “Integ” button is pressed, the initial integral measurement interface
below will appear.
Page 32

Integral Operation Function
Copyright © Itech Electronics Co., Ltd. 24
Description of information of integral measurement interface:
Parameter name
Parameter descriptions
U_RANGE
Vol t age r ang e set ting: press the soft key c orr esp ondi ng
to this paramet er to set the voltage range.
I_RANGE
Current rang e s ett i ng: press t he soft key cor r esponding
to this par ameter to set the current range.
RUN/HOLD
Run/hold: press the soft key corresponding to this
parameter to run or hold the integral function.
RESET
Reset.
FUNC(WP/q/AV)
Selection of the integral function: active power integral
(WP
), current integral (q) and average active power
integral (AV).
LARGE(WP/WP+/WP
-, q/q+/q-, WPAV)
Selection of the item to be displayed in a amplified
manner: WP (watt hour, the sum of positive and minus
watt hours), WP+ (the consumption of positive watt
hours), WP-
(the negative watt hours of feedback
power), q (ampere hour, the sum of positive and
ne
gative ampere hours), q+ (the consumption of
positive ampere hours), q- (the negative ampere hours
of feedback power) and WPAV (average active
powerintegral).
START
Integral Star t key In t he manu al st art mode, the integral
function can be enabled by press
ing the soft key
corresponding to this parameter.
STOP
Integral Stop key In the manual stop mode, the integral
function can be disabled by pressing the soft key
corresponding to this parameter.
SETUP
Set relevant parameters of integral measurement.
Page 33

Integral Operation Function
Copyright © Itech Electronics Co., Ltd. 25
Integral measurement display information
Description of measurement information:
Character
Function description
Mode
Display the integral start and stop mode. Start mode: MANUAL
and TIME
Stop mode: MANUAL, T I M E and TIN Terval.
State
Display the current status of the integral function.
Start: di splayed when the integral function is working.
Stop: displayed when the integral function is interrupted,
canceled or stopped.
Ready: displayed in the ready state of the real-time start mode.
Time Up: displayed wh
en it reaches the specified time of the
integral timer.
Reset: displayed when the integral value and integral time are
reset via integral resetting.
Error: when the power supply is recovered, the integral funct ion is
stopped and the integral result before power failure is displayed.
This integral state is called Error state.
Time
Display the integral time.
St
Display the set integral time.
Et
Display the set integral ending time.
Timer
Display the fixed integral time.
Integral operation
Active pow er integral
In watt hour, displ ayed as WP ( w at t hour s, t he su m of p osi t i ve and n egat i ve w att
hours), WP+ (the consumption of positive watt hours) and WP- (the negative
watt hours of feedback power).
Current integral
In q, displayed as q (ampere hours, the sum of positive and negative ampere
hours), q+ (the consumption of positive ampere hours) and q- (the negative
ampere hours of feedba ck power)
Average act ive power integral
In watt, displayed as WPAV (average active power integral)
Page 34

Integral Operation Function
Copyright © Itech Electronics Co., Ltd. 26
Integration time
Displayed as Time, in the format of hhhh:mm:ss.
Specification
Save in case of power failure
The integral result can be kept in the memory even in case of power failure
during operation of the integral function. When the power supply is recovered
and the integral function is disabled, the integral result before power failure is
displayed. When the power supply is recovered and the integral is rest, the
integral function is enabled again.
Display resolution
The maximum display resolution of the integral value is 99999. When the
integral v alue reaches 100000, the decimal point will move automatically. For
example, when 0.01mwh is added to 999.99mwh, 1.0000wh will be displayed.
Display in case of overflow
When the integral value meets the following overflow conditions, the integral
function w i ll be di sabl ed, and the integral time and integral value at t hi s poi nt wil l
be kept.
The integral time reaches the maximum value (10000 hours).
The integral values of WP, q and WPAV reach the maxi mum/mini mum
display integral values.
Maximum/minimum display integral value
Active pow er integral (WP): ±99999 Mwh
Current integral (q): ±99999 MAh
Average power integral (WPAV): ± 99999 Mw
Restricted implementation
Settings of the following functions cannot be changed during integral operation.
Function
Integration status
Integral
resetting
Current
integral status
Integral
interruption
Functions r elated to settings of m easurement parameters
Wiring
Executable
Unenforceable
Unenforceable
Measurement range
Executable
Unenforceable
Unenforceable
Filter
Executable
Unenforceable
Unenforceable
Averagi ng function
Executable
Unenforceable
Unenforceable
Synchronization
Executable
Unenforceable
Unenforceable
Data updating rate
Executable
Unenforceable
Unenforceable
Integral function parameter setting
Integral mode
Executable
Unenforceable
Unenforceable
Integral timer
Executable
Unenforceable
Unenforceable
Integral operation
Integral start
Executable
Unenforceable
Executable
Integral stop
Unenforceable
Executable
Unenforceable
Integral resetting
Executable
Unenforceable
Executable
Other operati ons
Save operat ion
Executable
Executable
Executable
Hold operation
Executable
Executable
Executable
Single measurement
operation
Executable
Executable
Executable
Page 35

Integral Operation Function
Copyright © Itech Electronics Co., Ltd. 27
NOTE
In addition to the above items, other settings (such as self-testing and date/time setting) or
operations with influence on the integral cannot be executed; otherwise, errors may be
caused.
5.2 Setting of Integral Measurement Configuration
You can set the start mode, stop mode, automatic zero setting, automatic
calibration, watt-hour integration, current integration and other parameters of
integral measurement. Specific steps are as fol lows:
Operation steps
1. Press “Integ” to enter the integral measurement interface.
2. Press the soft key corresponding to the “SETUP” parameter in the integral
measurement interface to enter the integral parameter configuration
interface. Press the “ ” key to select the required parameter, as
shown in the figure below.
Parameter descriptions:
Start: set in the MANUAL mode or TIME mode via the right soft key.
MANUAL: press the “START” soft key in the integral measurement
interf ace i n t he manual st art mode t o tr i gger the m anual start of the int egral
function.
TIME: the date on which the integral mode is started can be set in the
real-tim e start mode. Integration will be started on the set date. When the
time/date combination is set in the real-time start mode, integration will not
be started before the current time and date. Integration will be started
when the screen is updated once at l east before the start time.
Stop: set in the MANUAL mode, TIME mode and TINTerval mode via the right
soft key.
MANUAL: press the “STOP” soft key in theintegral measurement interface
in the manual st op mode t oman ual l y stop i nt egr ati on. When the integration
time reaches the maximum integration time (10,000 hours) or the integral
Page 36

Integral Operation Function
Copyright © Itech Electronics Co., Ltd. 28
value reaches the maximum/minimum display value, integration will be
stopped, and the current integral time and integral value will be kept.
TIME: The date for stop of the integral mode can be set in the real-time
stop mode. Int egrat i on w i ll be stop ped on the s et date. When i t reach es the
set time or the integral value reaches the maximum/minimum display
integral value, i nt egrati on w il l be st opped, and t he c urr ent integral time and
integral value will be kept.
TINTerval: the integral measurem ent tim e can be set in the set-time stop
mode. When it reaches the set ending date and time or the integral value
reaches the maximum/minimum display integral value, integration will be
stopped, and the current integral time and integral value will be kept.
Page 37

Integral Operation Function
Copyright © Itech Electronics Co., Ltd. 29
Auto Clear: used for enabling (ON) or disabling (OFF) the function of automatic
zero clearing of the integral. On: i ntegration is restarted when the ST A RT key is
pressed to start integration. OFF: integration is restarted based on the integral
value at the end of previous integration when the START key is pressed to start
integration.
Auto Cal: used for enabling (ON) or disabling (OFF) the function of automatic
integral calibration. W hen automatic integral calibration is enabled, zero setting
is implemented. In this case, the power and current measured just now are
subject to integration.
WP type: used for selecting the integral mode for positiv e and negative watt
hours. There are four integral mod es:
Charge/Discharge: used for measuring the DC positive and negative watt
hours (integration of sampling data).
Sold/Bought: used for measuring the AC positive and negative watt hours
(value integration in each data updating cycle).
q type: used for selecting the current integration mode. Options of the current
integration mode are as f ollows:
rms: Effective value;
mn: Calibration to t he average rectified value of the effective value.
dc: Simple averaging;
rmn: Average rectified value;
ac: AC component
5.3 Integration
When the integral measurement function is enabled, you can keep the current
integral information and carry out the following operations: exit, start and stop.
Specific steps are as follows:
Operation steps
1. Press “Integ” to enter the integral display interface.
2. In the integral measurement display interface Press the soft key
corresponding to the “START” parameter to start or recover integral
operation. T he Star t st at us and integral operati on val ue ar e di splayed in the
Page 38

Integral Operation Function
Copyright © Itech Electronics Co., Ltd. 30
interface.
3. W hen you need to keep the current integral status and integral result, you
can press the soft key corresponding to the “RUN HOLD” parameter. Then
the current status of the integral result display and communication output
will be kept no matter whether integral operation is running.
4. When you need to continue to implement integral operation, double-press
the soft key correspon ding to the “RUN HOLD” parameter to exit the HOLD
status. The power meter will display the integral result after exiting the
HOLD status. The schematic diagram of display of the HOLD/RUN integral
result i s shown below.
5. When you need to suspend integral operation, press the soft key
corresponding to the “Stop” parameter to suspend integral operation.
6. Press the soft key corresponding to the “RESET” parameter to reset the
integral value and integral time. The relationship diagram of start,
suspension and resetting of the integral operation status is shown below.
Auto Clear: when ON is selected.
Auto Clear: when OFF is selected.
Page 39

Integral Operation Function
Copyright © Itech Electronics Co., Ltd. 31
Page 40

Harmonic Measurement Function
Copyright © Itech Electronics Co., Ltd. 32
Chapter6 Harmonic Measurement Funct ion
This chapter describes the features and use of the harmonic measurement
function of the IT9121 power meter i n details.
6.1 Basic Concepts
With the 100kHZ bandwidth, the IT9121 power meter can realize harmonic
measurement of high speed and wide dynamic range. The voltage, current,
active power, reactive power and phase of harmonics and total harmonic
distortion (THD) factor can be tested in the harmonic mode. In addition, the
IT9121 power meter can be used for multiple harmonic measurements,
50-order harmonics of the fundamental frequen cy at most.
The IT9121 power meter displays harmonic parameters in the list or bar chart
form so as to provide cl ear analysis of test results.
Introduction of soft keys on the interface
Select the “ ” button, and the initial harmonic measurement interface
below will appear.
Description of information of harmonic measur ement interface:
Parameter
name
Parameter descriptions
U_RANGE
Voltage range setting: press the soft key corresponding to
this parameter to set the voltage range.
I_RANGE
Current range setting: press the soft key corresponding to
this parameter to set the current range.
RUN/HOLD
RUN/HOLD: press the soft key corresponding to this
parameter to run/hold the harmonic status.
RESET
Reset.
FUNC(P/I/U)
Function options (power/current /voltage)
BAR
Displayed in the bar char t form
LIST
Displayed in the list form
SETUP
Parameter setting.
Page 41

Harmonic Measurement Function
Copyright © Itech Electronics Co., Ltd. 33
Introduction of harmonic information
Description of har m onic bar chart interf ace
When the “BAR” button is selected in the harmonic measureme nt interface,
the bar chart of harmonic measurement results will be displayed. The bar
chart is used for displaying the percentage of different harmonics.
Harmonics can be displayed in the whole sequence, odd sequence and
even sequence. The following is the whole-sequence harmonic bar char t.
Description of interface information:
Total harmonic parameter: including the total harmonic distortion (THD)
factor and total harmonic content. When different measurement functions
are selected, different harmonic parameters will be displayed. When the
soft key corresponding to the “FUNC” parameter is pressed, different
measurement functions can be selected. W/I/U can be selected as the
measurement function in sequence when this key is pressed once.
Parameter m eanings of different functions are as follows:
Power (P): total harmonic distortion rate of power and total harmonic
power
Current (I): total harmonic distortion rate of current and total harmonic
current
Voltage (U): total harmonic distortion rate of voltage and total harmonic
voltage
Single-order harmonic parameters: displaying the frequency, harmonic
content, harmonic distortion factor and phase of single-order harmonics.
The user can rotate the knob to select the single-order harmonics to be
displayed. The selected harmonics are displayed in red in the bar chart
form.
Description of har m onic list interface
When the “LIST ” but ton i s sel ect ed i n the har monic measurement inter face,
Page 42

Harmonic Measurement Function
Copyright © Itech Electronics Co., Ltd. 34
the list of harmonic measurement results will be displayed. This list is used
for showing the voltage, current, activ e power, reactive power, phase and
total harmonic distortion (THD) factor of different har m onics. Harmonic lists
can be displayed in the whole sequence, odd sequence and even
sequence. B elow is a whole-sequence ha rmonic list.
Harmonic content: this list is used for showing all harmonic contents of
single-order harmonics, including the voltage, current and power. You can
view other harmonic parameters by operating the Left/Right key to turn
pages. In thi s case, the line scrol l bar and current page are shown in bright
white circles. Measurement parameters are described in the following
table:
Abbreviations
Instruction
Abbreviations
Instruction
U(V)
Voltage
φUI(°)
Phase difference of k-order
harmonic voltage and
harmonic current
I(mA)
Current
φ
UU(°)
Phase difference of harmonic
voltage U(k) and fundamental
wave U(1)
P(W)
Active power
φ
II(°)
Phase difference of harmonic
current I(k) and fundamental
waveI(1)
S(VA)
Apparent
power
U(%r)/ U(%f)
Harmonic distortion factor of
voltage
Q(var)
Reactive
power
I(%r)/ I(%f)
Harmonic distortion factor of
current
PF()
Power factor
P(%r)/P(%f)
Harmonic distortion factor of
active power
Harmonic order list: this LIST can show the data of one-order to 50-order
harmoni c si gnal s. These data c an be di splayed in the whole sequen ce, od d
sequence and even sequence. The rows which are not displayed, i.e.
single-order harmonic data which are not displayed, can be presented by
operating the Up/Down key. In this case, the row scroll bar and current
page in displayed in bright blue bar s.
Page 43

Harmonic Measurement Function
Copyright © Itech Electronics Co., Ltd. 35
6.2 Setting of Harmonic Measurement Configuration
You can set the distortion factor calculation formula, PLL source, harmonic
sequence and harmonic analysis times of harmonic measurement. Specific
steps are as follows:
Operation steps
1. Press “ ” to enter the harm onic measurement int erface.
2. Press the soft key corresponding to the “SETUP” parameter in the
harmonic measurement display interface to enter the harmonic parameter
configuration interface. Press the “ ” key to select the required
parameter, as shown in the figure below.
Parameter descriptions:
Parameters
Instruction
THD Formal
Distortion factor calculati on formula. % r: displayi ng
harmoni cs in the form of percentage to the overall current
(voltage, power) amplitude of all harmonics. % f: displaying
harmoni cs in the form of percentage to the fundamental
wave current (voltage, power).
PLL Source
Select the PLL (Phase Locked Loop) source: U/I/OFF. Used
for determining t he fundamental wave cycle as the reference
for analysis of harmonic orders.
Serial
Harmonic sequence: whole sequence/odd sequence/even
sequences
Order Max
Set the harmonic analysis orders (1-50). You can specify the
harmonic measurement range. These specified analysis
orders are used for calculating the value of the distortion
factor.
Distortion factor calculation formula:
The following two formulas can be selected for calculation of the distortion
factor.
%r: using all harmonic measurement data from the minimum harmonic
order (0) to the maximum harmonic order (within the upper limit of analysis
orders) as the denominator.
%f: using the data of fundamental wave (1-order) components as the
Page 44
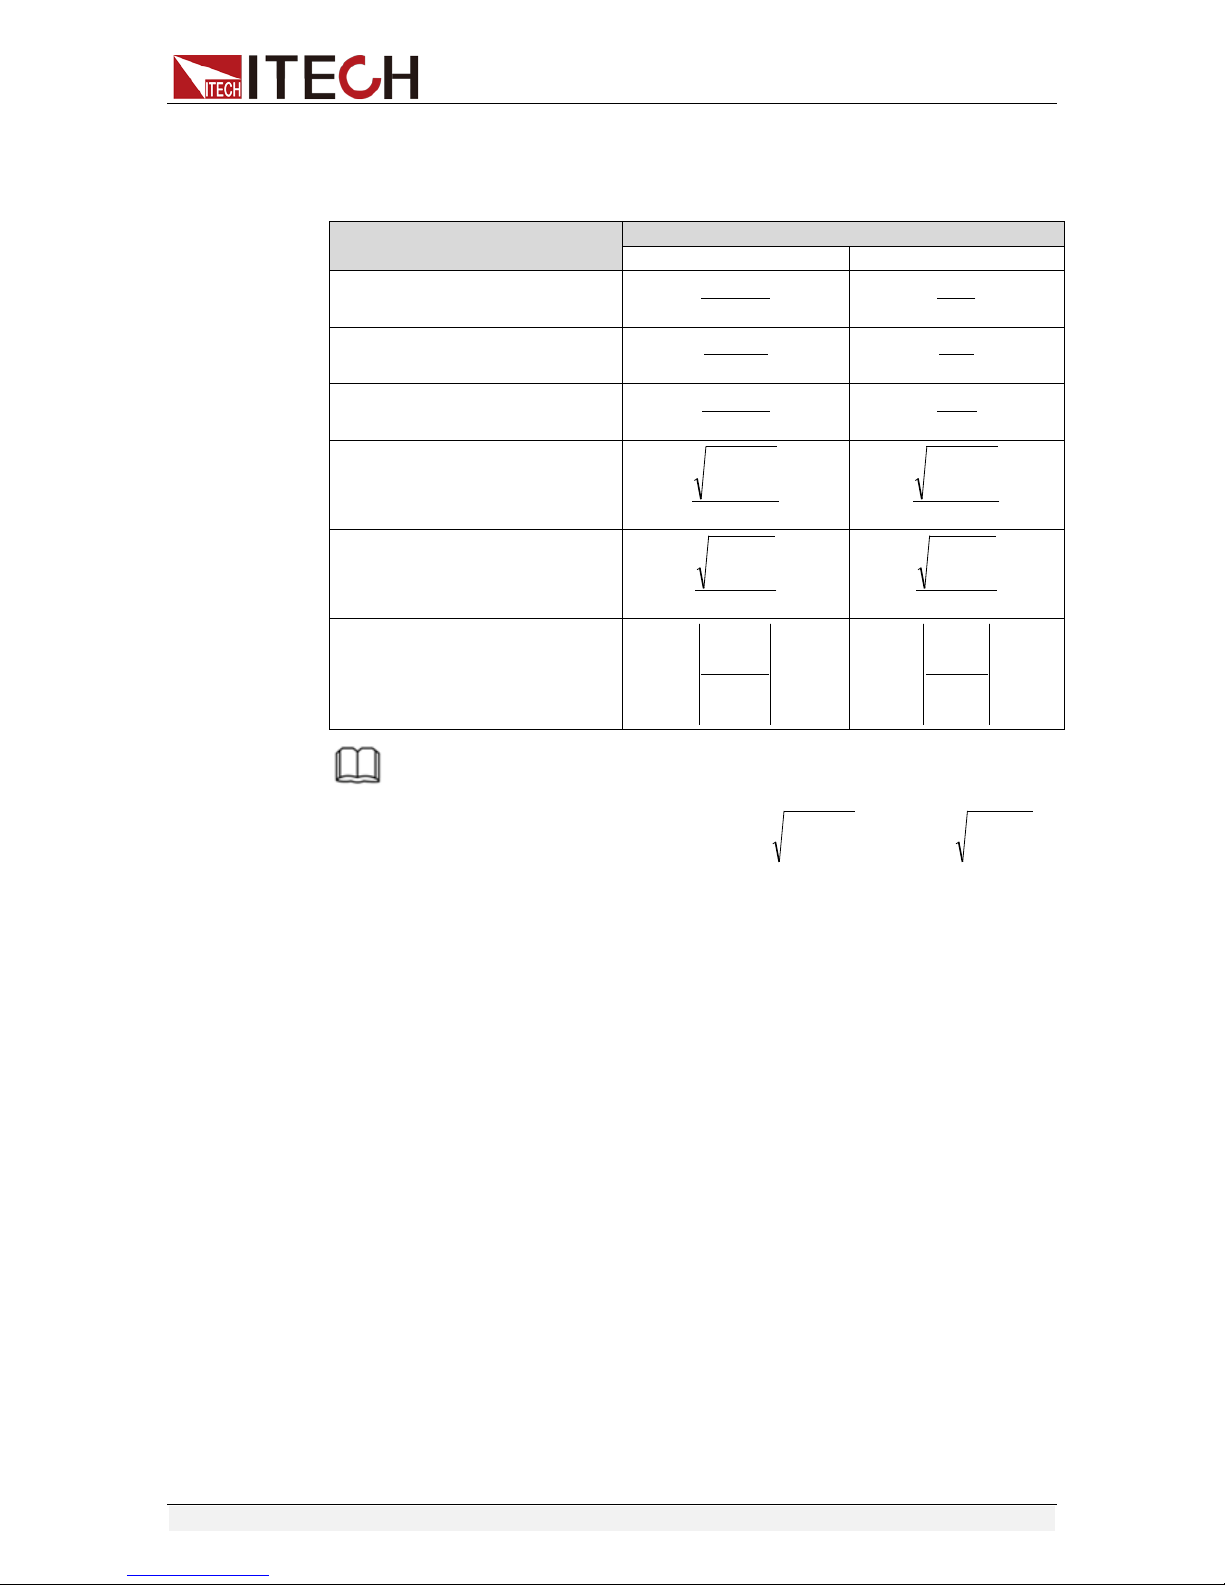
Harmonic Measurement Function
Copyright © Itech Electronics Co., Ltd. 36
denominator.
The distortion factor calculation formulas and methods of different
measurement functions are as fol lows:
Measurement function
Calculatio n formula and method
%r
%f
Harmonic distortion factor of
voltage
( )
( )
TotalU
kU
( )
( )
1U
kU
Harmonic distortion factor of
current
( )
( )
TotalI
kI
( )
( )
1I
kI
Harmonic distortion factor of
active power
( )
( )
TotalP
kP
( )
( )
1P
kP
Total harmonic distortion rate
of voltage
( )
( )
TotalU
kU
k∑=
max
2
2
( )
( )
1
max
2
2
U
kU
k
∑
=
Total harmonic distortion rate
of current
( )
( )
TotalI
kI
k∑=
max
2
2
( )
( )
1
max
2
2
I
kI
k∑=
Total harmonic distortion rate
of active power
( )
( )
TotalP
kP
k∑=
max
2
( )
( )
1
max
2
P
kP
k∑=
NOTE
Tot al harmonics are calculated as follows:
( ) ( )
∑
=
=
max
02k
kUTotalU
,
( ) ( )
∑
=
=
max
02k
kITotalI
,
( ) ( )
∑
=
=
max
0k
kPTotalP
. k indicates the harmonic order, and max indicates the upper limit of
analysis orders. max is determined by the frequency of PLL source automatically, 50 orders
at most.
PLL source
In the harmonic mode, IT9121 adopts PLL to multiply the frequency of the i nput
signal. The frequency multiplication output signal is used as the A/D sampling
clock in the instrument so as to achieve the purpose of synchronous sampling.
Therefore, the frequency of the signal of the PLL source can determine the A/D
sampling clock in the instrument. However, the quality of the signal of the PLL
source may affect the stabili ty and accuracy of sampling data.
PLL source selection
The voltage or c urr ent of t he i nput uni t can be sel ect ed as the PL L source. Used
for determining the fundamental wave cycle as the reference for analysis of
harmoni c order s. T he fundamental wave f r equency of th e P LL source is 10Hz to
1.2kHz.
Consider ations for selection of PLL source
Please select the signal with the same cycle as that of the harmonic
measurement object signal. In order to stably measure harmonics, select the
input signal with little distortion as the PLL source. If the fundamental wave
frequency of the PLL source changes or the fundamental wave frequency
cannot be measured as a result of waveform distortion, accurate measurement
results may not be obtained. When the test object i s a switch t ype pow er suppl y
Page 45

Harmonic Measurement Function
Copyright © Itech Electronics Co., Ltd. 37
and the voltage signal is subject to less distortion than the current signal, it is
recommended to use the voltage as the PLL source.
Signal level of PLL source
If the amplitude level of the signal input into the unit as the PLL source is small
relative to the range, synchronization with PLL will fail. If the crest factor is set
as 3, the amplitude lev el of the PLL source should exceed 50% of the range at
least during setting of the range. If the cres t factor is set as 6, the amplitude
level of t he PLL so ur ce sh ould exceed 100 % of the ran ge at least during setti ng
of the range.
NOTE
When the fundamental wave frequency is no more than 200Hz, the frequency filter must be
turned on.
When the fundamental wave frequency is lower than 440Hz and contains high-frequency
components, it is recommended to turn on the frequency filter. This filter only applies to the
frequency measurement circuit.
If the frequency of the PLL source changes, the correct measured value will be displayed
after data are updated several times. The frequency of the PLL source needs to be tested
again via the PLL circuit in the instrument in case of changes of the PLL source or its
frequency, the correct measured value cannot be obtained at once.
Harmonic analysis order
The harmonic analysis order k is an integer number ranging from 0 to the upper
limit of analysis orders. Zero indicates the DC c omponent. The upper limit of
analysis orders is automatically determined by the frequ ency of the PLL source.
The upper limit of harmonic analysis orders can be determined automatically or
set manually. Take the smaller value. 50 orders at most The relationship
between the upper lim it of harmonic analysis orders and the fundamental wave
frequency of the PLL source is shown in the table below.
Fundamental wave
frequency of PLL
source
Sampling rate
Window widt h
Upper limit of
analysis orders *
10Hz ~ 75Hz
f*1024
1
50
75 Hz ~ 150 Hz
f*512
2
32
150 Hz ~ 300 Hz
f*256
4
16
300 Hz ~ 600 Hz
f*128
8
8
600 Hz ~ 1200 Hz
f*64
16
4
* The upper l imit of analysis order s can be reduced.
NOTE
If the analysis window determined by the fundamental wave frequency of the PLL source is
longer than the data updating cycle, no harmonic data will be detected. In this case, the data
updating cycle should be reduced. For example, when the fundamental wave frequency of
the PLL source is 10Hz (cycle: 100ms), the analys i s window is one-wave long, and the data
measurement interval is 100ms. In this case, the harmonic measurement time is
approximately more than or equal to 150ms (data measurement interval and data processing
time). Therefore, please select the data updating rate of 250ms or more for measurement
and display of harmonic data.
Page 46

Routine Maintenance
Copyright © Itech Electronics Co., Ltd. 38
Chapter7 Routine Maintenance
This chapter describes general maintenance items and maintenance methods
of the IT9121 power meter.
7.1 Self-inspection
The IT9121 power meter has a self-inspection function. See “Power-on Self-Test”
of Chapter 3 “Inspecting the Instrument” of IT9121 Installation Instructions for
detailed steps of self-inspection.
7.2 Error Information References
The IT9121 power meter has a detailed error and prompt information function,
so as to help the user to easily carry out positioning and m easurement during
measurement and use.
This section describes all error information of the IT9121 power meter as well
as error causes and disposals. All prompt inf ormation is listed.
Prompt Message List
Prompt information
Explanation of prompt information
Cal Zero is working!
The instrument is calibrating the zero point .
Cal Zero is completed!
The instrument has completed zero point
calibration.
Test screen
Self-inspection of LC D screen
Test dsp
Self-inspection of D SP.
Test beep
Self-inspection of the buzzer.
SelfTest is finished!
The instrument has fi nished the self-test.
Softkey is not available
The current soft key is not available.
Ti me set ok!
The time setting is completed.
Meter Initialization
Initi ali zation of general measurem ent
Integ Ini tialization
Initialization of integral function
Scope Initialization
Initi ali zation of the oscilloscop e function
Harmonic Initialization
Initi ali zation of the harmonic funct ion
Inrush Ini tialization
Initi ali zation of the inrush function
Setup Initialization
Initi ali zation of setup
System Initialization
Initi ali zation of the system
Initialization is finished!
Initi ali zation is finished.
Integ start
Integration is started.
Integ stop
Integration is stopped.
Integ ti me up
The integral time is up.
Max page has been reached.
It displays The maximum page has been
reached.
One page should exist at least
One page should exist at least.
Not used in current state
The current operation is not available.
Please reset first
Please reset first.
Page 47

Routine Maintenance
Copyright © Itech Electronics Co., Ltd. 39
Error information list
Error information
Error inf ormation explanation
usb is not detected
[Error description] No USB peripheral is
found.
[Possible cause] No USB peripheral is
inserted.
[Disposal] Insert the U disc type USB
peripheral and then copy the screen.
Save screen fail
[Error description] The screen is not saved
successfully.
[Possible cause] USB is disconnected.
[Disposal] Reinsert the USB peripheral.
Start ti me is less than cur rent
[Error description] The start time is less than
the current t ime.
[Possible cause] The integral setting is
incorrect.
[Disposal] Reset the integral start time.
End time is less than current
[Error description] The ending time is less
than the current time.
[Possible cause] The integral setting is
incorrect.
[Disposal] Reset the integral ending time.
Ti mer must b e larger than zero.
[Error description] The set time must be
larger than zero.
[Possible cause] The set integral time is not
correct.
[Disposal] Reset the set integral time.
Harmonic op en fail
[Error description] The harmonic function
cannot be enabled.
[Possible cause] Communication
abnormality
[Disposal] Check the communication cable.
Integ open fail
[Error description] The integral function
cannot be enabled.
[Possible cause] Communication
abnormality
[Disposal] Check the communication cable.
Integ start fail
[Error description] The integral function
cannot be started.
[Possible cause] Communication
abnormality
[Disposal] Check the communication cable.
Integ stop fail
[Error description] The integral function
cannot be stopped.
[Possible cause] Communication
abnormality
[Disposal] Check the communication cable.
Scope openfail
[Error description] The oscilloscope function
cannot be enabled.
[Possible cause] Communication
abnormality
[Disposal] Check the communication cable.
Ti me set fail
[Error descr iption] Time setting f ails.
[Possible cause] Tim e setting is illegal.
[Disposal] Reset the system time.
Page 48

Routine Maintenance
Copyright © Itech Electronics Co., Ltd. 40
Cal zero fail
[Error descr iption] Zero cali bration fails.
[Possible cause] Communication
abnormality
[Disposal] Check the communication cable.
7.3 Daily maintenance
Introduce basic maintenance in daily use of equipment. Such as cleaning,
self-maintenance allowed to be performed by the user, etc.
Equipment cleaning
Use dry cloth or slightly wet cloth to gently wipe the equipment. Do not
arbitrarily wipe the inside of the instrument. Cut off the power supply before
cleaning.
Initialize
When this operation is implemented, the system settings are recovered to the
factory def ault values.
1. Select “SYSTEM > INITIAL” in the “Menu” interface to enter the system
initi ali zation interface. See the following figure.
2. Select the menu items to be initialized (blue symbol background) via
key. Menu items wi th characters following should be i nitialized;
indicates t hat the items will not be initialized.
3. Press the soft key corresponding to the symbol on the right of the interface
to determine whether to initialize this menu item. Or use the soft key
“ ” (for initializat ion of all menu items) or “ ” (no initialization for
all menu items) in the lower part of the interface.
4. Press the “START” soft key to initia lize system settings. Press the ESC to
exit.
7.4 Contact of ITECH Engineers
This section describes operations to be carried out by the user in case of failure
of the inst rument.
Page 49

Routine Maintenance
Copyright © Itech Electronics Co., Ltd. 41
Preparation before contact
When the instrument fails, you should make the following preparations before
returning the instrument to ITECH for repair or contacting engineers.
1. Check all the items listed in the “Self-inspection of Equipment Faults” and
confirm whether there are still som e problems.
2. If there are still some problems, carefully read the contents of warranty
services and warranty restrictions in the preface of the manual. Confirm
that our instrument co m plies with warranty ser vice conditions.
3. If you want to send the instrument to the manufacturer for repair, refer to
instructions in “7.5 Returning Your Power Meter for Service”.
Self-inspection of equipment faults
In case of failure of the instrument, self-inspect the following items. If the
instrument failure can be eliminated via simple inspection, the maintenance
cost and time can be sa ved. Please check the f ollowing items before contacting
the engineer of ITECH.
Check whether the power meter is powered up.
Check whether the power meter is st arted normally.
Check whether the instrument fuse is in good conditions.
Check whet her oth er c onnect or s ar e i n go od con di ti ons an d w heth er cables,
plugs and other parts are connected properly.
Check whether the system configuration of the instrument is correct during
use.
Check whether self-inspection of the instrument is successful and whether
the specifications and performance are wit hin the indicator ranges.
Check whether the instrument displays error information.
Use other instruments instead of this instrument for confirmation.
Collect the SN number.
ITECH will constantly improve the product performance, availability and
reliability. The service personnel of ITECH will record changes of each
instrument. A ll relevant information are marked uniquely according to the serial
number of eac h instrum ent. The equipment returned for repair m ust adopt the
SN number as the tracking ID.
When you contact the engineer, the effective SN number of the instrument will
be the effective guarantee for effective service and complete information. You
can obtain the SN number of the instrument by the following ways:
1. Press the Menu key to enter the system setti ng page of the power meter.
2. Press the SYSTEM to enter “SYS TEM INFO” interface to view the product
model, product SN, software version number and other inf ormation.
Page 50

Technical Specifications
Copyright © Itech Electronics Co., Ltd. 42
Chapter8 Technical Specificat i ons
8.1 General Specification
Model
IT9121
AC input voltage
100VAC-240VAC 50/60HZ
Warm-up time
Apporx 30 mi nutes
Operating Environme nt
Temperature:5°C-40°C
Humidi ty: 20%-80% (non-condensation)
Altitude: ≤2,000m
Storage En vironment
Temperature: -20°C -50°C
humidi ty 20%-80% (non-condensation)
Altitude: ≤2,000m
Installation
Indoors
Safety
IEC 61010-1、EN 61010-1 、Measurement CAT Ⅱ
Polluti on degree
Polluti on degree 2
EMC
IEC 61326
Maximum power consumption 50VA
Battery backup
Backup the setting parameters
Dimension
214.5mmW×88.2mmH×354.6mmD
8.2 Screen Display
Item Detailed Information
Display Interface
Specification
Dimension 4.3-inch color liquid crystal display (TFT )
Full screen pixel 480(horizontal) × 272(vertical) points
Waveform display
pixel
384(horizontal) × 194(vertical) points
Operating
temperature
-20℃~ 70℃
Storage
temperature
-30℃~ 80℃
Value display
Currently set up as a matrix display.It is
optional to display the array number.
8.3 Input Parameters
Input
parameter
Description
Input
terminals
type
Volta
ge
plug-in terminal(safety terminal)
Input type
Curr
ent
Direct input large binding post
External
current sensor
DB9 connector
Page 51

Technical Specifications
Copyright © Itech Electronics Co., Ltd. 43
Input
parameter
Description
input
Input type
Volta
ge
Floating input through resistive voltage divider
Curr
ent
Floating input through shunt
Measure
range
Volta
ge
CF=3:15V, 30V, 60V, 150V, 300V, 600V.
CF=6:7.5V, 15V, 30V, 75V, 150, 300V.
Curr
ent
Direct input
CF=3:5mA,10mA,20mA,50mA,100mA,200mA,0.5A,1A,
2A,5A,10A,20A.
CF=6:2.5mA,5mA,10mA,25mA,50mA,100mA,250mA,0.
5A,1A,2.5A,5A,10A.
Sensor input
EX1,
CF=3:2.5V, 5V, 10V.
CF=6:1.25V, 2.5V, 5V.
EX2,
CF=3:50mV, 100mV, 200mV, 500mV, 1V, 2V.
CF=6:25mV, 50mV, 100mV, 250mV, 500mV, 1V .
Input
impedance
Volta
ge
Input resistanceApprox.2MΩ,input capacitace:
Approx.13 pF(in parallel with the resistance)
Curr
ent
Direct input
range5mA~2
00mA
Input resistance: Approx.505mΩ
Input resistance: Approx.505mΩ
Direct input
range0.5A~20
A
Input resistance: Approx 5mΩ
Input inductance: Approx0.1μH
Sensor input
Input resistance: Approx 100kΩ(2.5V~10V)
Input resistance: Approx 20kΩ(50mV~2V)
Continuous
maximum
allowable
input
Volta
ge
peak value of 1.5kV or RMS value of 1kV,
whichever is less
Curr
ent
Direct input
range
5mA~200mA
peak value of 30A or RMS value of 20A,whichever is
less
Direct input
range
0.5A~20A
peak value of 100A or RMS value of30A,whichever is
less
Sensor input
Peak value less than or equal to 5 times of the rated
range
Instantane
ous
maximum
allowable
input(1s)
Volta
ge
peak value of 2kV or RMS value of 1.5kV,whichever is less
Curr
ent
Direct input
range
5mA~200mA
peak value of 30A or RMS value of 20A,whichever is
less
Direct input
range
0.5A~20A
peak value of 150A or RMS value of 40A,whichever is
less
Sensor input
Peak value less than or equal to 10 times of the rated
range
Input
bandwidth
DC,0.5Hz~100KHz
Continuous
maximum
Common-
600Vrms,CAT Ⅱ
Page 52

Technical Specifications
Copyright © Itech Electronics Co., Ltd. 44
Input
parameter
Description
mode
voltage
Line fil ter select OFF, cutoff frequency of 500Hz
Frequency
filter
select OFF, cutoff frequency of 500Hz
Digital filter
select OFF, cutoff frequency of 5KHz and 10KHz (this item has not been set up
yet)
Range range of each unit can be set separately
A/D
converter
Simultaneous conversion voltage an current i nputs
Resolution:18-bit
Maximum conversion rate: 10μs
8.4 Voltage and Current Accuracy
Item Specification
Requirements
temperature 23±5° C, hundity: 30 ~ 75%RH.
Input wa veform
Sine wave crest factor:3, common-mode
voltage: 0V
Number of
displayed digits
5digits (6 digits when
including the decimal point)
Frequency filter
Tur n on to measure voltage or cur rent
of 200Hz
30 minutes after warm-up time has pas sed
After zero-level compensation or measurement range
is changed
Accuracy
(The following accuracy is
the sum of the re adi ng er r or
and the rang e error)
* f is the frequency of input
signal in the reading error
formula, the unit is kHz.
DC ±(0.1% of reading+0.2% of range)
0.5Hz≤f<45Hz ±(0.1% of reading+0.2% of range)
45Hz≤f≤ 66Hz ±(0.1% of reading+0.2% of range)
66Hz<f≤ 1kHz ±(0.1% of reading+0.2% of range)
1kHz<f≤10kHz ±(0.07*f)% of reading+0.3% of range)
10kHz<f≤100kHz
±(0.5% of reading+0.5% of
range)±[{0.04×(f-10)}%
of reading]
8.5 Active Power Accuracy
Item Specification
Requirements same as the conditions for voltage and current . Power factor:1
Accuracy(The following
accuracy is the sum of the
reading error and the
range error)
* f
is the frequency of input
signal in the reading error
formula, the unit is kHz.
DC ±(0.1% of readi ng+0.2% of range)
0.5Hz≤ f<45Hz ±(0.3% of reading+0.2% of range)
45Hz≤f ≤ 66Hz ±(0.1% of reading+0.1% of range)
66Hz<f ≤ 1kHz ±(0.2% of reading+0.2% of range)
1kHz<f≤10kHz
±(0.1% of reading+0.3% of
Page 53

Technical Specifications
Copyright © Itech Electronics Co., Ltd. 45
Item Specification
range)±[{0.067×(f-1)}% of reading]
10kHz<f≤100kHz
±(0.5% of reading+0.5% of
range)±[{0.09×(f-10)}% of reading]
Influence of power factor
when power f actor (PF)=0 (S:apparent power)
• ±0.2% of S for 45Hz≤f≤66Hz
• ±{(0. 2+0.2×f)% of S }for up to 100kHz as reference data
f is frequency of input signal in kHz
when 0<PF<1(Φ:phase angle of the Voltage and current)
(power reading )×[(power readi ng error%)+(power range % )×
(power range/indicated apparent power value)+{tanΦ×
(influenc e when PF=o)%}]
When the line filter is
turned ON
45~66Hz:Add 0.3% of reading
<45Hz:Add 1% of reading
Temperature coefficient same as the temperatur e coefficient for voltage and current
Accuracy w hen the
crest factor is set to 6
accuracy obtained by doubling the m easurement range
error for the accuracy when the crest factor is set to 3
Accuracy of apparent
power S
voltage accuracy +current accuracy
Accuracy of reactive
power Q
accuracy of apparent power +(√1.0004-PF2)-(√1-PF2)
×100%
Accuracy of power Factor
PF
±[(PF–PF/1.0002)+|cosØ-cos{Ø+sin-1(influence from the power
factor when PF=0%/100)
±1digit when voltage and current are at the measurement range
rated input.
Accuracy of phase
difference Φ
±[|Ø-cos-1(PF/1.0002)|+sin-1{(influence from the power factor
when PF=0%/100)
±1digit when voltage and current are at the measurement range
rated input.
8.6 Voltage Current and Power measurements
Item Specification
Measurement
method
digital sam pling method
Crest factor 3 or 6
Wiring system (one element model ) :single-phase ,two-wire(1P2W)
Range sel ect select manu al or auto ranging
Auto range
Range incr ease
When meet any of the following conditions, the range will increase
automatically.
• Urms or Irms is greater than 110% of the current setting range
• CF=3: the values of the input signal Upk and Ipk are great er than
330% of the current setting range
• CF=6: the values of the input signal Upk and Ipk are great er than
660% of the current setting range
Range decrease
When meet
any of the following conditions, the range will
decrease automatically.
• Urms or Irms is less than or equal to 30% of the current setting
range
Page 54

Technical Specifications
Copyright © Itech Electronics Co., Ltd. 46
Item Specification
• PF=3: the values of the input signal Upk and Ipk are less than
300% of the current setting range
• PF=6: the values of the input signal Upk and Ipk are less than
600% of the current setting range
Name
Symbols and meani ngs
Measurement
parameters
voltage
current
Select RMS(the true RMS value of voltage
andcurrent) 、MEAN:(the rectified mean
value calibrated to
theRMS value of the
voltage andthe true RMS value of the
current )、
RMN (rectified mean value of
voltage and current
DC:(simple average of voltage and
current)、
AC: alternating current、PP: (peak value
of voltage and peak value of current )
active power [W]
P
reactive power [var]
Q
apparent pow er [VA]
S
power factor
PF
phase difference (°)
φ
frequency(Hz)
fU (FreqU): voltage frequency、 fI
(FreqI):
current fr equency
max/mix of voltage
(V)
Upk+: volt age positive peak、 Upk-
: voltage
negative peak
max/mix of current
(A)
Ipk+: current positive peak、Ipk-
: current
negative peak
crest factor
(The ratio of peak
value and RMS)
Ucf: crest fa ctor of voltage, Icf : c rest factor
of current
integration
TM:integration time 、
WP:sum of positive
and
negative watt hour 、
WP+:positive power
sum 、
WP-:negat ive power sum、q:sum of positive
and negative ampere-hour 、
q+:positive
ampere
-hour sum、q-:negative ampere-hour sum
Measurement
synchronization
source
Select voltage, current, or the entire period of the data updata
interval for the signal used to achieve synchronization during
measurement.
Line fil ter Select OFF or O N (cutoff frequency at 500Hz)
Peak
measurement
Measures the peak (max,min) value of voltage,current or power
from the instantaneous current or instantaneous power that is
sampled.
Page 55

Technical Specifications
Copyright © Itech Electronics Co., Ltd. 47
8.7 Frequency Measurement
Item Specification
Measurement item
voltage or cur rent frequencies applied to one selected
input element can be mea sured
Frequency
measurement
range
vaties depending on the data update interval (see
description given later)as follows
Data update interval measurement range
0.1s 25Hz ≤ f ≤100kHz
0.25s 10Hz ≤ f ≤ 100kHz
0.5s 5Hz ≤ f ≤ 100kHz
1s 2.5Hz ≤ f ≤ 100kHz
2s 1.5Hz ≤ f ≤ 50kHz
5s 0.5Hz ≤ f ≤ 20kHz
Frequency filter select OFF or ON (cut off frequency of 500H z)
Accuracy
requirements : When the input signal level is 30% or
moreof the me asurement range if the crest factor is set
to 3 (60% or more if the crest factor is set to 6) , frequency
filter is ON when measuring voltage or current of 200Hz or
less. Accura cy:±( 0.06%of reading)
8.8 Harmonic Measurement
Measured i tem all inst alled elements
Method PLL synchronization meth od
Frequency range
fundament al frequency of the PLL source is in the
range of 10Hz to 1.2kHz
PLL source
select voltage of current of each i nput element
When PF=3, the input level is equal to or greater t han 50% of
the rated range
When PF=6, the input level is equal to or greater than 100%
of the rated r ange
When fundam ental frequency is less than or equal to 200Hz,
the frequency filter must be opened.
FFT data length 1024
Measurement parameter
Name
Symbols and meani ngs
Voltage(V)
U(k): voltage effective
value of Kth harmonic
U(Total): voltage
effecti ve val ue
Current(A)
I(k): curent effective value
of Kth harmo nic
I(Total): curent effective
value
Active
power(W)
P(k): active power of Kth
harmonic
P(Total): Acti ve power
Apparent
power(VA)
S(k): apparent power of
Kth harmonic
S(Total): total apparent
power
Reactive
power(var)
Q(k): react i ve pow er of Kt h
harmonic
Q(Total): total reactive
power
Power
factor
PF(k) : power factor of Kth
harmonic
PF(Total): Total power
factor
phase
φ(k): phase difference
φ: total phase
Page 56

Technical Specifications
Copyright © Itech Electronics Co., Ltd. 48
difference
(°)
between volt age and
current of Kt h harmonic\
φU(k): voltage phase
difference Kth
harmonic(UK) and
fundamental wave(U1)
φI(k): phase difference
current phase difference
between Kth
harmonic(IK)
and fundament al wave(I1)
difference
harmonic
distortion
factor (%)
Uhdf(k): Voltage ratio of Kth harmonic(Uk) and
fundmental wave(U1) or total distortion
wave(Utotal)
Ihdf(k): current ratio of Kth harmonic( Ik)
and
fundmental wave(I1)
or total di storti on wave(I total )
Phdf(k): active power ratio of Kth harmonic(Pk)and
fundmental wave or total distortion wave(Ptotal)
(THD)total
harmonic
distortion
(%)
Uthd: voltage ratio of total harmonic and
fundmental
wave(U1) or total distortion
wave(Utotal)
Ithd: curr ent ratio of total harmonic and fundmental
wave(I1) or total distortion wave(Itotal)
Pthd: active power ratio of total harmonic and
fundmental wave(P1) or total distortion
wave(Ptotal)
Window
function
Rectangle
Note: K is a integer from 0 to upper limit of harmonic analyse times.0th means DC parameter. User can
configure the maximum number of harmonic times manually or auto-decided by equipment, taking the
minmum value between the two methods. IT9121 can measure up to 50th harmonic..
8.9 Fundamental Frequency
Fundamental
frequency
sample rate window width
upper limit of*
analysis orders*
10Hz ~ 75Hz f*1024 1 50
75Hz ~ 150Hz f*512 2 32
150Hz ~ 300Hz f*256 4 16
300Hz ~ 600Hz f*128 8 8
600Hz ~ 1200Hz f*64 16 4
*the upper limit of analysis orders can be decrease
8.10 Accuracy
*When line filter is off, the accuracy shown below is the sum of reading and
range errors.
Frequency
Voltage
Current
Power
10Hz≤f<45Hz
0.15% of reading
+0.35% of range
0.15% of reading
+0.35% of range
0.15% of reading
+0.50% of range
Page 57

Technical Specifications
Copyright © Itech Electronics Co., Ltd. 49
45Hz ≤ f ≤
440Hz
0.15% of reading
+0.35% of range
0.15% of reading
+0.35% of range
0.20% of reading
+0.50% of range
440Hz<f ≤
1kHz
0.20% of reading
+0.35% of range
0.20% of reading
+0.35% of range
0.40% of reading
+0.50% of range
1kHz<f ≤
2.5kHz
0.80% of reading
+0.45% of range
0.80% of reading
+0.45% of range
1.56% of reading
+0.60% of range
2.5kHz<f ≤
5kHz
3.05% of reading
+0.45% of range
3.05% of reading
+0.45% of range
5.77% of reading
+0.60% of range
8.11 Oscilloscope Function
Channel
2
Measurement V ol tage and curr ent
Bandwidth(-3dB) DC : 10 kHz
Sample rat e 100kHz
Record length Each channel is 300 poi nts
Horizontal system
The level of s cale
range
500us/case, 1ms/case, 2ms/case, 5ms/case, 10ms/case, 20ms/case,
50ms/case, 100ms/case, 200ms/case, 500ms/case
The accuracy of
horizontal cursor
Each case i s ±4.0%
Vertical system
Vertical scale
range
CF=3: Range/case
CF=6:Range*2/case
The accuracy of
the vertical cursor
Each case i s ±4.0%
Maximum input
voltage
1800V (DC+AC peak)
Maximum input
current
60A (DC+AC peak)
Triggle system
Trigger source Voltage, current and EXT
Trigger type Edge(ri sing edge, falling edge, arbitrary edge)
Trigger mode Automatic, Normal, Single
8.12 Interface Specification
USB Interface
Item
Specification
Interface t ype
Type B (socket)
Electrical and mechanical specifications
USB 2.0
Tr ansmission speed
Maximum speed is 12Mbps
Port number
1
Power supply
Self-powered
Support service
Remote control
Support system
Run PC with Windows 7(SP4 version or
Page 58
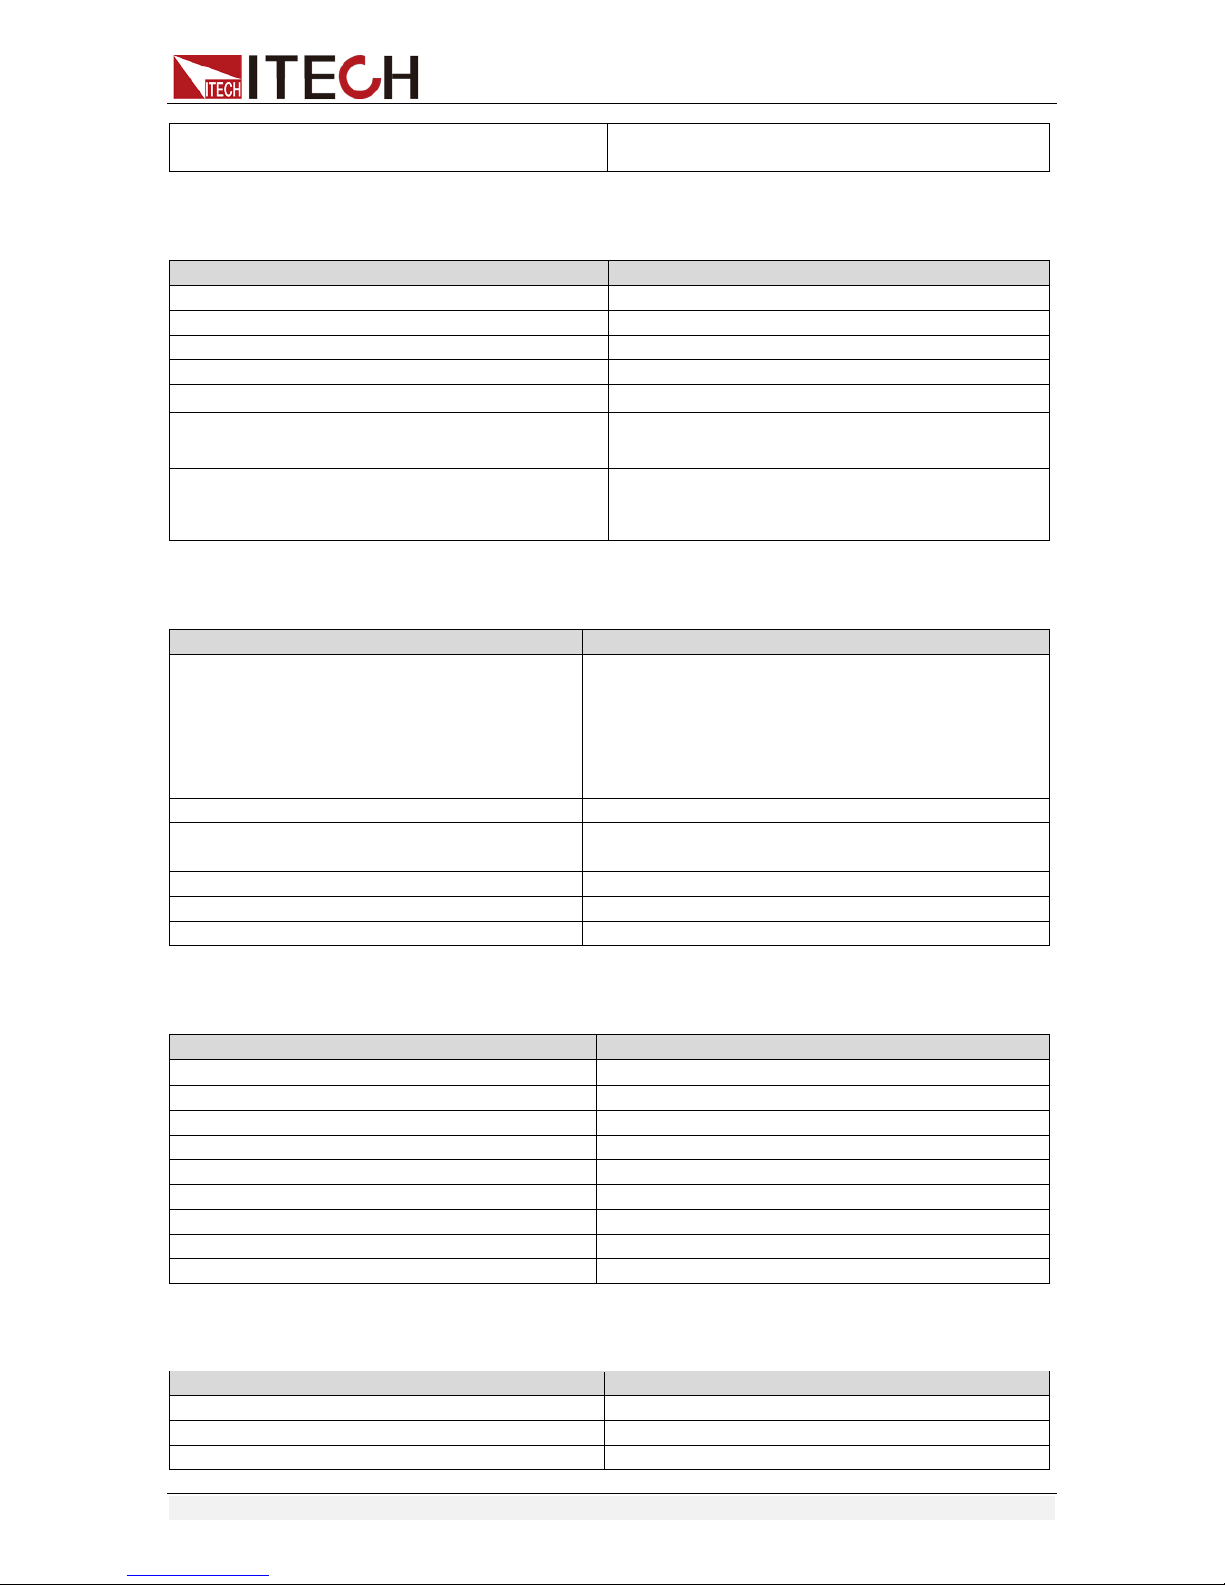
Technical Specifications
Copyright © Itech Electronics Co., Ltd. 50
update version), Windows XP or Windows
Vista,standard USB interface.
USB peripheral equipment interface
Item
Specification
Interface t ype
T ype A (socket)
Electrical and mechanical specifications
USB 2.0
Tr ansmission speed
Maximum speed is 12Mbps
Port number
1
Power supply
Power supply 5V、500mA2 (per port)
Support USB large capacity memory
USB flash memory ( meet USB Mass Storag e
Class Specification)
Support system
Run PC with Windows 7(SP4 version or
update version),
Windows XP or Windows
Vista,standard USB interface.
GP-IB Interface
Item
Specification
Available equipment
America NI Company
• AT-GPIB
• PCI-GPIB or PCI-GPIB+
• PCMCIA-GPIB, PCMCIA-GPIB+ or PCIe-GPIB
Drive program: NI-
488.2M 1.60 or update
version
Electrical and mechanical specifications
IEEE St’d 488-1978 (JIS C 1901-1987)
Functional specification
SH1, AH1, T6, L4, SR1, RL1, PP0, DC1, DT1,
C0
Protocol
IEEE St’d 488.2-1992
Encoding
ISO (ASCII)
Mode
The address mode can be set
Serial port(RS-232)
Item
Specification
Electrical Specification
Comply with EIA-232(RS-232) standard
Connection type
Point to point
Communication type
Full duplex
Synchronization
Start and stop can be synchronized
Baud rate
The baud rat e can be set(Default:9600)
Start bit
1 bit
Data length
8 bits
Parity bit
NONE
Stop bit
1 bit
Ethernet Communication
Item
Specification
Port number
1
Interface
RJ-45
Electrical and mechanical specifications
IEEE802.3
Page 59

Technical Specifications
Copyright © Itech Electronics Co., Ltd. 51
Transmission system
Ethernet (100BASE-TX)
Tr ansmission speed
Maximum speed: 100Mbps
Communication protocol
TCP/IP
Support equipment
FTP service、DHCP、DNS、Remote control
(VXI-11)
Page 60

Contact Us
Thanks for purchasing ITECH products. In case of any doubts, please contact us as follows:
1.
Refer to accompanying data disk and relevant manual.
2.
Visit ITECH website:www.itechate.com
3.
Select the most convenient contact method, for further information.
 Loading...