

Page 1

Intel® Xeon® Processor 7500 Series
Uncore Programming Guide
Reference Number: 323535-001
March 2010
Page 2

INFORMATION IN THIS DOCUMENT IS PROVIDED IN CONNECTION WITH INTEL PRODUCTS. NO LICENSE, EXPRESS OR IMPLIED, BY
ESTOPPEL OR OTHERWISE, TO ANY INTELLECTUAL PROPERTY RIGHTS IS GRANTED BY THIS DOCUMENT. EXCEPT AS PROVIDED IN
INTEL’S TERMS AND CONDITIONS OF SALE FOR SUCH PRODUCTS, INTEL ASSUMES NO LIABILITY WHATSOEVER, AND INTEL DISCLAIMS ANY EXPRESS OR IMPLIED WARRANTY, RELATING TO SALE AND/OR USE OF INTEL PRODUCTS INCLUDING LIABILITY OR
WARRANTIES RELATING TO FITNESS FOR A PARTICULAR PURPOSE, MERCHANTABILITY, OR INFRINGEMENT OF ANY PATENT, COPYRIGHT OR OTHER INTELLECTUAL PROPERTY RIGHT. INTEL PRODUCTS ARE NOT INTENDED FOR USE IN MEDICAL, LIFE SAVING, OR
LIFE SUSTAINING APPLICATIONS.
Intel may make changes to specifications and product descriptions at any time, without notice.
Developers must not rely on the absence or characteristics of any features or instructions marked “reserved” or “undefined.” Im-
proper use of reserved or undefined featu res or instructions may cause unpr edictable behavior or failure in developer 's software
code when running on an Intel processor. Intel reserves these features or instr uctions for fut ure definition and s hall hav e no responsibility whatsoever for conflicts or incompatibilities arising from their unauthorized use.
The Intel
able on request.
Hyper-Threading Technology requires a computer system with an Intel
HT T echnology enabled chipset, BIO S and oper ating sy stem. P erformance wi ll vary dependin g on the specific ha rdware and softw are
you use. For more information, see http://www.intel.com/technology/hyperthread/index.htm; including details on which processors support
HT Technology.
Intel
and for some uses, certain platform software enabled for it. Functionality, performance or other benefits will
ware and software c onfigurations. Intel
ment.
64-bit computing on Intel architecture requires a computer system with a processor, chipset, BIOS, operating system, device drivers
and applications enabled for Intel
architecture-enabled BIOS. P erforma nce will v ary depend ing on yo ur hardwar e and soft ware conf igurat ions. Consul t with your system vendor for more information.
®
64 architecture processors may contain design defects or errors known as err at a. Curren t char ac terize d err ata ar e av ail -
®
processor supporting Hyper-Threading Technology and an
®
Virtualization T echnolo gy requires a computer system with an enabled Intel® processor , BIOS, virtual machine monitor (VMM)
®
Virtualization Technology-enabled BIOS and VMM applications are currently in develop-
®
64 architecture. Processors will not op erate (including 32-bit operation) witho ut an Intel® 64
vary depending on hard-
Intel and Intel Xeon are trademarks or registered trademarks of Intel Corporation or its subsidiaries in the United States and other
countries.
*Other names and brands may be claimed as the property of others.
Contact your local Intel sales office or your distributor to obtain the latest specifications and before placing your product order.
Copies of documents which have an ordering nu mber and are r eferenced in t his document, or other Intel liter ature, may be obtained
from:
Intel Corporation
P.O. Box 5937
Denver, CO 80217-9808
or call 1-800-548-4725
or visit Intel’s website at http://www.intel.com
Copyright © 2010 Intel Corporation
Page 3

INTEL® XEON® PROCESSOR 7500 SERIES UNCORE PROGRAMMING GUIDE CONTENTS
CONTENTS
CHAPTER 1
INTRODUCTION
1.1 INTRODUCTION . . . . . . . . . . . . . . . . . . . . . . . . . . . . . . . . . . . . . . . . . . . . . . . . . . . . . . . . . . . . . . . . . . . . . . . . . . . . . . . . . . . . . . 1-1
1.2 U
1.3 U
1.4 R
CHAPTER 2
UNCORE PERFORMANCE MONITORING
2.1 GLOBAL PERFORMANCE MONITORING CONTROL . . . . . . . . . . . . . . . . . . . . . . . . . . . . . . . . . . . . . . . . . . . . . . . . . . . . . . . . . . . . . . 2-1
2.1.1 Counter Overflow. . . . . . . . . . . . . . . . . . . . . . . . . . . . . . . . . . . . . . . . . . . . . . . . . . . . . . . . . . . . . . . . . . . . . . . . . . . . . . . . . .2-1
2.1.1.1 Freezing on Counter Overflow . . . . . . . . . . . . . . . . . . . . . . . . . . . . . . . . . . . . . . . . . . . . . . . . . . . . . . . . . . . . . . . . . . .2-1
2.1.1.2 PMI on Counter Overflow. . . . . . . . . . . . . . . . . . . . . . . . . . . . . . . . . . . . . . . . . . . . . . . . . . . . . . . . . . . . . . . . . . . . . . . .2-1
2.1.2 Setting up a Monitoring Session . . . . . . . . . . . . . . . . . . . . . . . . . . . . . . . . . . . . . . . . . . . . . . . . . . . . . . . . . . . . . . . . . . . .2-1
2.1.3 Reading the Sample Interval . . . . . . . . . . . . . . . . . . . . . . . . . . . . . . . . . . . . . . . . . . . . . . . . . . . . . . . . . . . . . . . . . . . . . . . .2-2
2.1.4 Enabling a New Sample Interval from Frozen Counters. . . . . . . . . . . . . . . . . . . . . . . . . . . . . . . . . . . . . . . . . . . . . . .2-2
2.1.5 Global Performance Monitors . . . . . . . . . . . . . . . . . . . . . . . . . . . . . . . . . . . . . . . . . . . . . . . . . . . . . . . . . . . . . . . . . . . . . . .2-3
2.1.5.1 Global PMON Global Control/Status Registers . . . . . . . . . . . . . . . . . . . . . . . . . . . . . . . . . . . . . . . . . . . . . . . . . . . . .2-3
2.2 U-B
2.2.1 U-Box PMON Summary . . . . . . . . . . . . . . . . . . . . . . . . . . . . . . . . . . . . . . . . . . . . . . . . . . . . . . . . . . . . . . . . . . . . . . . . . . . . .2-5
2.2.1.1 U-Box Box Level PMON State . . . . . . . . . . . . . . . . . . . . . . . . . . . . . . . . . . . . . . . . . . . . . . . . . . . . . . . . . . . . . . . . . . .2-5
2.2.1.2 U-Box PMON state - Counter/Control Pairs . . . . . . . . . . . . . . . . . . . . . . . . . . . . . . . . . . . . . . . . . . . . . . . . . . . . . . .2-5
2.2.2 U-Box Performance Monitoring Events. . . . . . . . . . . . . . . . . . . . . . . . . . . . . . . . . . . . . . . . . . . . . . . . . . . . . . . . . . . . . .2-6
2.2.3 U-Box Events Ordered By Code . . . . . . . . . . . . . . . . . . . . . . . . . . . . . . . . . . . . . . . . . . . . . . . . . . . . . . . . . . . . . . . . . . . . .2-6
2.2.4 U-Box Performance Monitor Event List. . . . . . . . . . . . . . . . . . . . . . . . . . . . . . . . . . . . . . . . . . . . . . . . . . . . . . . . . . . . . .2-7
2.3 C-B
2.3.1 Overview of the C-Box . . . . . . . . . . . . . . . . . . . . . . . . . . . . . . . . . . . . . . . . . . . . . . . . . . . . . . . . . . . . . . . . . . . . . . . . . . . . .2-9
2.3.2 C-Box Performance Monitoring Overview . . . . . . . . . . . . . . . . . . . . . . . . . . . . . . . . . . . . . . . . . . . . . . . . . . . . . . . . . . .2-9
2.3.2.1 C-Box PMU - Overflow, Freeze and Unfreeze . . . . . . . . . . . . . . . . . . . . . . . . . . . . . . . . . . . . . . . . . . . . . . . . . . . . .2-9
2.3.3 C-BOX Performance Monitors. . . . . . . . . . . . . . . . . . . . . . . . . . . . . . . . . . . . . . . . . . . . . . . . . . . . . . . . . . . . . . . . . . . . . 2-10
2.3.3.1 C-Box Box Level PMON state . . . . . . . . . . . . . . . . . . . . . . . . . . . . . . . . . . . . . . . . . . . . . . . . . . . . . . . . . . . . . . . . . . 2-13
2.3.3.2 C-Box PMON state - Counter/Control Pairs . . . . . . . . . . . . . . . . . . . . . . . . . . . . . . . . . . . . . . . . . . . . . . . . . . . . . 2-14
2.3.4 C-BOX Performance Monitoring Events . . . . . . . . . . . . . . . . . . . . . . . . . . . . . . . . . . . . . . . . . . . . . . . . . . . . . . . . . . . 2-16
2.3.4.1 An Overview: . . . . . . . . . . . . . . . . . . . . . . . . . . . . . . . . . . . . . . . . . . . . . . . . . . . . . . . . . . . . . . . . . . . . . . . . . . . . . . . . . 2-16
2.3.4.2 Acronyms frequently used in C-Box Events: . . . . . . . . . . . . . . . . . . . . . . . . . . . . . . . . . . . . . . . . . . . . . . . . . . . . 2-16
2.3.4.3 The Queues: . . . . . . . . . . . . . . . . . . . . . . . . . . . . . . . . . . . . . . . . . . . . . . . . . . . . . . . . . . . . . . . . . . . . . . . . . . . . . . . . . . 2-17
2.3.4.4 Detecting Performance Problems in the C-Box Pipeline: . . . . . . . . . . . . . . . . . . . . . . . . . . . . . . . . . . . . . . . . . 2-17
2.3.5 C-Box Events Ordered By Code . . . . . . . . . . . . . . . . . . . . . . . . . . . . . . . . . . . . . . . . . . . . . . . . . . . . . . . . . . . . . . . . . . . 2-17
2.3.6 C-Box Performance Monitor Event List . . . . . . . . . . . . . . . . . . . . . . . . . . . . . . . . . . . . . . . . . . . . . . . . . . . . . . . . . . . . 2-18
2.4 B-B
2.4.1 Overview of the B-Box . . . . . . . . . . . . . . . . . . . . . . . . . . . . . . . . . . . . . . . . . . . . . . . . . . . . . . . . . . . . . . . . . . . . . . . . . . . 2-29
2.4.2 B-Box Performance Monitoring Overview . . . . . . . . . . . . . . . . . . . . . . . . . . . . . . . . . . . . . . . . . . . . . . . . . . . . . . . . . 2-29
2.4.2.1 B-Box PMU - On Overflow and the Consequences (PMI/Freeze). . . . . . . . . . . . . . . . . . . . . . . . . . . . . . . . . . 2-29
2.4.3 B-BOX Performance Monitors . . . . . . . . . . . . . . . . . . . . . . . . . . . . . . . . . . . . . . . . . . . . . . . . . . . . . . . . . . . . . . . . . . . . 2-30
2.4.3.1 B-Box Box Level PMON state . . . . . . . . . . . . . . . . . . . . . . . . . . . . . . . . . . . . . . . . . . . . . . . . . . . . . . . . . . . . . . . . . . 2-30
2.4.3.2 B-Box PMON state - Counter/Control Pairs + Filters. . . . . . . . . . . . . . . . . . . . . . . . . . . . . . . . . . . . . . . . . . . . . 2-31
2.4.4 B-Box Performance Monitoring Events . . . . . . . . . . . . . . . . . . . . . . . . . . . . . . . . . . . . . . . . . . . . . . . . . . . . . . . . . . . . 2-33
2.4.4.1 On the ARBQ:. . . . . . . . . . . . . . . . . . . . . . . . . . . . . . . . . . . . . . . . . . . . . . . . . . . . . . . . . . . . . . . . . . . . . . . . . . . . . . . . . 2-33
2.4.4.2 On the Major B-Box Structures: . . . . . . . . . . . . . . . . . . . . . . . . . . . . . . . . . . . . . . . . . . . . . . . . . . . . . . . . . . . . . . . . 2-34
2.4.4.3 On InvItoE Transactions: . . . . . . . . . . . . . . . . . . . . . . . . . . . . . . . . . . . . . . . . . . . . . . . . . . . . . . . . . . . . . . . . . . . . . . 2-34
2.4.5 B-Box Events Ordered By Code . . . . . . . . . . . . . . . . . . . . . . . . . . . . . . . . . . . . . . . . . . . . . . . . . . . . . . . . . . . . . . . . . . . 2-34
2.4.6 B-Box Performance Monitor Event List. . . . . . . . . . . . . . . . . . . . . . . . . . . . . . . . . . . . . . . . . . . . . . . . . . . . . . . . . . . . 2-36
2.5 S-B
2.5.1 Overview of the S-Box . . . . . . . . . . . . . . . . . . . . . . . . . . . . . . . . . . . . . . . . . . . . . . . . . . . . . . . . . . . . . . . . . . . . . . . . . . . 2-45
2.5.2 S-Box Performance Monitoring Overview . . . . . . . . . . . . . . . . . . . . . . . . . . . . . . . . . . . . . . . . . . . . . . . . . . . . . . . . . 2-45
2.5.2.1 S-Box PMU - Overflow, Freeze and Unfreeze . . . . . . . . . . . . . . . . . . . . . . . . . . . . . . . . . . . . . . . . . . . . . . . . . . . 2-45
2.5.3 S-BOX Performance Monitors. . . . . . . . . . . . . . . . . . . . . . . . . . . . . . . . . . . . . . . . . . . . . . . . . . . . . . . . . . . . . . . . . . . . . 2-45
2.5.3.1 S-Box PMON for Global State . . . . . . . . . . . . . . . . . . . . . . . . . . . . . . . . . . . . . . . . . . . . . . . . . . . . . . . . . . . . . . . . . . 2-46
2.5.3.2 S-Box Box Level PMON state . . . . . . . . . . . . . . . . . . . . . . . . . . . . . . . . . . . . . . . . . . . . . . . . . . . . . . . . . . . . . . . . . . 2-47
2.5.3.3 S-Box PMON state - Counter/Control Pairs + Filters . . . . . . . . . . . . . . . . . . . . . . . . . . . . . . . . . . . . . . . . . . . . . 2-48
2.5.3.4 S-Box Registers for Mask/Match Facility . . . . . . . . . . . . . . . . . . . . . . . . . . . . . . . . . . . . . . . . . . . . . . . . . . . . . . . 2-49
2.5.4 S-BOX Performance Monitoring Events . . . . . . . . . . . . . . . . . . . . . . . . . . . . . . . . . . . . . . . . . . . . . . . . . . . . . . . . . . . 2-51
2.5.4.1 An Overview . . . . . . . . . . . . . . . . . . . . . . . . . . . . . . . . . . . . . . . . . . . . . . . . . . . . . . . . . . . . . . . . . . . . . . . . . . . . . . . . . 2-51
NCORE PMU OVERVIEW . . . . . . . . . . . . . . . . . . . . . . . . . . . . . . . . . . . . . . . . . . . . . . . . . . . . . . . . . . . . . . . . . . . . . . . . . . . . . . . . 1-1
NCORE PMU SUMMARY TABLES . . . . . . . . . . . . . . . . . . . . . . . . . . . . . . . . . . . . . . . . . . . . . . . . . . . . . . . . . . . . . . . . . . . . . . . . . 1-2
EFERENCES. . . . . . . . . . . . . . . . . . . . . . . . . . . . . . . . . . . . . . . . . . . . . . . . . . . . . . . . . . . . . . . . . . . . . . . . . . . . . . . . . . . . . . . . . . . 1-3
OX PERFORMANCE MONITORING . . . . . . . . . . . . . . . . . . . . . . . . . . . . . . . . . . . . . . . . . . . . . . . . . . . . . . . . . . . . . . . . . . . . . . . 2-5
OX PERFORMANCE MONITORING. . . . . . . . . . . . . . . . . . . . . . . . . . . . . . . . . . . . . . . . . . . . . . . . . . . . . . . . . . . . . . . . . . . . . . . . 2-9
OX PERFORMANCE MONITORING . . . . . . . . . . . . . . . . . . . . . . . . . . . . . . . . . . . . . . . . . . . . . . . . . . . . . . . . . . . . . . . . . . . . . . 2-29
OX PERFORMANCE MONITORING. . . . . . . . . . . . . . . . . . . . . . . . . . . . . . . . . . . . . . . . . . . . . . . . . . . . . . . . . . . . . . . . . . . . . . . 2-45
Page 4

INTEL® XEON® PROCESSOR 7500 SERIES UNCORE PROGRAMMING GUIDE CONTENTS
2.5.4.2 On Queue Occupancy Usage . . . . . . . . . . . . . . . . . . . . . . . . . . . . . . . . . . . . . . . . . . . . . . . . . . . . . . . . . . . . . . . . . . . 2-51
2.5.4.3 On Packet Transmission Events . . . . . . . . . . . . . . . . . . . . . . . . . . . . . . . . . . . . . . . . . . . . . . . . . . . . . . . . . . . . . . . 2-52
2.5.5 S-Box Events Ordered By Code . . . . . . . . . . . . . . . . . . . . . . . . . . . . . . . . . . . . . . . . . . . . . . . . . . . . . . . . . . . . . . . . . . . 2-53
2.5.6 S-Box Performance Monitor Event List. . . . . . . . . . . . . . . . . . . . . . . . . . . . . . . . . . . . . . . . . . . . . . . . . . . . . . . . . . . . 2-55
2.6 R-BOX PERFORMANCE MONITORING . . . . . . . . . . . . . . . . . . . . . . . . . . . . . . . . . . . . . . . . . . . . . . . . . . . . . . . . . . . . . . . . . . . . . . 2-72
2.6.1 Overview of the R-Box . . . . . . . . . . . . . . . . . . . . . . . . . . . . . . . . . . . . . . . . . . . . . . . . . . . . . . . . . . . . . . . . . . . . . . . . . . . 2-72
2.6.1.1 R-Box Input Port. . . . . . . . . . . . . . . . . . . . . . . . . . . . . . . . . . . . . . . . . . . . . . . . . . . . . . . . . . . . . . . . . . . . . . . . . . . . . . 2-72
2.6.1.2 R-Box Arbitration Control . . . . . . . . . . . . . . . . . . . . . . . . . . . . . . . . . . . . . . . . . . . . . . . . . . . . . . . . . . . . . . . . . . . . . 2-72
2.6.1.3 R-Box Output Port . . . . . . . . . . . . . . . . . . . . . . . . . . . . . . . . . . . . . . . . . . . . . . . . . . . . . . . . . . . . . . . . . . . . . . . . . . . . 2-73
2.6.1.4 R-Box Link Layer Resources . . . . . . . . . . . . . . . . . . . . . . . . . . . . . . . . . . . . . . . . . . . . . . . . . . . . . . . . . . . . . . . . . . . 2-73
2.6.2 R-Box Performance Monitoring Overview . . . . . . . . . . . . . . . . . . . . . . . . . . . . . . . . . . . . . . . . . . . . . . . . . . . . . . . . . 2-73
2.6.2.1 Choosing An Event To Monitor - Example. . . . . . . . . . . . . . . . . . . . . . . . . . . . . . . . . . . . . . . . . . . . . . . . . . . . . . . 2-73
2.6.2.2 R-Box PMU - Overflow, Freeze and Unfreeze . . . . . . . . . . . . . . . . . . . . . . . . . . . . . . . . . . . . . . . . . . . . . . . . . . . 2-74
2.6.3 R-BOX Performance Monitors . . . . . . . . . . . . . . . . . . . . . . . . . . . . . . . . . . . . . . . . . . . . . . . . . . . . . . . . . . . . . . . . . . . . 2-74
2.6.3.1 R-Box Performance Monitors To Port Mapping . . . . . . . . . . . . . . . . . . . . . . . . . . . . . . . . . . . . . . . . . . . . . . . . . 2-77
2.6.3.2 R-Box Box Level PMON state . . . . . . . . . . . . . . . . . . . . . . . . . . . . . . . . . . . . . . . . . . . . . . . . . . . . . . . . . . . . . . . . . . 2-78
2.6.3.3 R-Box PMON state - Counter/Control Pairs + Filters . . . . . . . . . . . . . . . . . . . . . . . . . . . . . . . . . . . . . . . . . . . . . 2-78
2.6.3.4 R-Box IPERF Performance Monitoring Control Registers . . . . . . . . . . . . . . . . . . . . . . . . . . . . . . . . . . . . . . . . 2-82
2.6.3.5 R-Box QLX Performance Monitoring Control Registers . . . . . . . . . . . . . . . . . . . . . . . . . . . . . . . . . . . . . . . . . . 2-83
2.6.3.6 R-Box Registers for Mask/Match Facility . . . . . . . . . . . . . . . . . . . . . . . . . . . . . . . . . . . . . . . . . . . . . . . . . . . . . . . 2-84
2.6.4 R-BOX Performance Monitoring Events . . . . . . . . . . . . . . . . . . . . . . . . . . . . . . . . . . . . . . . . . . . . . . . . . . . . . . . . . . . 2-87
2.6.4.1 An Overview: . . . . . . . . . . . . . . . . . . . . . . . . . . . . . . . . . . . . . . . . . . . . . . . . . . . . . . . . . . . . . . . . . . . . . . . . . . . . . . . . . 2-87
2.6.5 R-Box Events Ordered By Code . . . . . . . . . . . . . . . . . . . . . . . . . . . . . . . . . . . . . . . . . . . . . . . . . . . . . . . . . . . . . . . . . . . 2-87
2.6.6 R-Box Performance Monitor Event List. . . . . . . . . . . . . . . . . . . . . . . . . . . . . . . . . . . . . . . . . . . . . . . . . . . . . . . . . . . . 2-88
2.7 M-B
OX PERFORMANCE MONITORING . . . . . . . . . . . . . . . . . . . . . . . . . . . . . . . . . . . . . . . . . . . . . . . . . . . . . . . . . . . . . . . . . . . . . . 2-95
2.7.1 Overview of the M-Box . . . . . . . . . . . . . . . . . . . . . . . . . . . . . . . . . . . . . . . . . . . . . . . . . . . . . . . . . . . . . . . . . . . . . . . . . . 2-95
2.7.2 Functional Overview . . . . . . . . . . . . . . . . . . . . . . . . . . . . . . . . . . . . . . . . . . . . . . . . . . . . . . . . . . . . . . . . . . . . . . . . . . . . . 2-95
2.7.2.1 Intel ® 7500 Scalable Memory Buffer. . . . . . . . . . . . . . . . . . . . . . . . . . . . . . . . . . . . . . . . . . . . . . . . . . . . . . . . . . . 2-96
2.7.3 M-Box Performance Monitoring Overview . . . . . . . . . . . . . . . . . . . . . . . . . . . . . . . . . . . . . . . . . . . . . . . . . . . . . . . . . 2-96
2.7.3.1 Choosing An Event To Monitor - Example using subcontrol registers . . . . . . . . . . . . . . . . . . . . . . . . . . . . . 2-96
2.7.3.2 M-Box PMU - Overflow, Freeze and Unfreeze . . . . . . . . . . . . . . . . . . . . . . . . . . . . . . . . . . . . . . . . . . . . . . . . . . 2-97
2.7.4 M-BOX Performance Monitors . . . . . . . . . . . . . . . . . . . . . . . . . . . . . . . . . . . . . . . . . . . . . . . . . . . . . . . . . . . . . . . . . . . . 2-98
2.7.4.1 M-Box Box Level PMON state . . . . . . . . . . . . . . . . . . . . . . . . . . . . . . . . . . . . . . . . . . . . . . . . . . . . . . . . . . . . . . . . . 2-99
2.7.4.2 M-Box PMON state - Counter/Control Pairs . . . . . . . . . . . . . . . . . . . . . . . . . . . . . . . . . . . . . . . . . . . . . . . . . . . . 2-100
2.7.4.3 M-Box PMU Filter Registers . . . . . . . . . . . . . . . . . . . . . . . . . . . . . . . . . . . . . . . . . . . . . . . . . . . . . . . . . . . . . . . . . . 2-102
2.7.4.4 M-Box PMU Subcontrol Registers - Subunit descriptions . . . . . . . . . . . . . . . . . . . . . . . . . . . . . . . . . . . . . . . 2-102
2.7.5 M-Box Performance Monitoring Events . . . . . . . . . . . . . . . . . . . . . . . . . . . . . . . . . . . . . . . . . . . . . . . . . . . . . . . . . . 2-109
2.7.5.1 An Overview: . . . . . . . . . . . . . . . . . . . . . . . . . . . . . . . . . . . . . . . . . . . . . . . . . . . . . . . . . . . . . . . . . . . . . . . . . . . . . . . . 2-109
2.7.6 M-Box Events Ordered By Code. . . . . . . . . . . . . . . . . . . . . . . . . . . . . . . . . . . . . . . . . . . . . . . . . . . . . . . . . . . . . . . . . . 2-110
2.7.7 M-Box Performance Monitor Event List . . . . . . . . . . . . . . . . . . . . . . . . . . . . . . . . . . . . . . . . . . . . . . . . . . . . . . . . . . 2-111
2.8 W-B
OX PERFORMANCE MONITORING . . . . . . . . . . . . . . . . . . . . . . . . . . . . . . . . . . . . . . . . . . . . . . . . . . . . . . . . . . . . . . . . . . . . 2-124
2.8.1 Overview of the W-Box . . . . . . . . . . . . . . . . . . . . . . . . . . . . . . . . . . . . . . . . . . . . . . . . . . . . . . . . . . . . . . . . . . . . . . . . . 2-124
2.8.2 W-Box Performance Monitoring Overview. . . . . . . . . . . . . . . . . . . . . . . . . . . . . . . . . . . . . . . . . . . . . . . . . . . . . . . . 2-124
2.8.2.1 W-Box PMU - Overflow, Freeze and Unfreeze . . . . . . . . . . . . . . . . . . . . . . . . . . . . . . . . . . . . . . . . . . . . . . . . . 2-124
2.8.3 W-BOX Performance Monitors . . . . . . . . . . . . . . . . . . . . . . . . . . . . . . . . . . . . . . . . . . . . . . . . . . . . . . . . . . . . . . . . . . . 2-125
2.8.3.1 W-Box Box Level PMON state . . . . . . . . . . . . . . . . . . . . . . . . . . . . . . . . . . . . . . . . . . . . . . . . . . . . . . . . . . . . . . . . 2-125
2.8.3.2 W-Box PMON state - Counter/Control Pairs. . . . . . . . . . . . . . . . . . . . . . . . . . . . . . . . . . . . . . . . . . . . . . . . . . . . 2-126
2.8.4 W-BOX Performance Monitoring Events . . . . . . . . . . . . . . . . . . . . . . . . . . . . . . . . . . . . . . . . . . . . . . . . . . . . . . . . . . 2-128
2.8.4.1 An Overview: . . . . . . . . . . . . . . . . . . . . . . . . . . . . . . . . . . . . . . . . . . . . . . . . . . . . . . . . . . . . . . . . . . . . . . . . . . . . . . . . 2-128
2.8.5 W-Box Events Ordered By Code . . . . . . . . . . . . . . . . . . . . . . . . . . . . . . . . . . . . . . . . . . . . . . . . . . . . . . . . . . . . . . . . . 2-128
2.8.6 W-Box Performance Monitor Event List . . . . . . . . . . . . . . . . . . . . . . . . . . . . . . . . . . . . . . . . . . . . . . . . . . . . . . . . . . 2-128
2.9 P
ACKET MATCHING REFERENCE . . . . . . . . . . . . . . . . . . . . . . . . . . . . . . . . . . . . . . . . . . . . . . . . . . . . . . . . . . . . . . . . . . . . . . . . 2-130
Page 5

INTEL® XEON® PROCESSOR 7500 SERIES UNCORE PROGRAMMING GUIDE FIGURES
FIGURES
Figure 1-1. Intel Xeon Processor 7500 Series Block Diagram . . . . . . . . . . . . . . . . . . . . . . . . . . . . . . . . . . . . . . . . . . . . . . . . .1-1
Figure 2-1. R-Box Block Diagram . . . . . . . . . . . . . . . . . . . . . . . . . . . . . . . . . . . . . . . . . . . . . . . . . . . . . . . . . . . . . . . . . . . . . . . . . . 2-72
Figure 2-2. Memory Controller Block Diagram. . . . . . . . . . . . . . . . . . . . . . . . . . . . . . . . . . . . . . . . . . . . . . . . . . . . . . . . . . . . . . 2-95
Page 6

INTEL® XEON® PROCESSOR 7500 SERIES UNCORE PROGRAMMING GUIDE FIGURES
This page intentionally left blank
Page 7

INTEL® XEON® PROCESSOR 7500 SERIES UNCORE PROGRAMMING GUIDE TABLES
TABLES
Table 1-1. Per-Box Performance Monitoring Capabilities . . . . . . . . . . . . . . . . . . . . . . . . . . . . . . . . . . . . . . . . . . . . . . . . . . . . 1-2
Table 1-2. Uncore Performance Monitoring MSRs . . . . . . . . . . . . . . . . . . . . . . . . . . . . . . . . . . . . . . . . . . . . . . . . . . . . . . . . . . 1-2
Table 2-1. Global Performance Monitoring Control MSRs . . . . . . . . . . . . . . . . . . . . . . . . . . . . . . . . . . . . . . . . . . . . . . . . . . . . 2-3
Table 2-2. U_MSR_PMON_GLOBAL_CTL Register – Field Definitions . . . . . . . . . . . . . . . . . . . . . . . . . . . . . . . . . . . . . . . . . 2-4
Table 2-3. U_MSR_PMON_GLOBAL_STATUS Register – Field Definitions . . . . . . . . . . . . . . . . . . . . . . . . . . . . . . . . . . . . . 2-4
Table 2-4. U_MSR_PMON_GLOBAL_OVF_CTL Register – Field Definitions . . . . . . . . . . . . . . . . . . . . . . . . . . . . . . . . . . . . 2-4
Table 2-5. U-Box Performance Monitoring MSRs . . . . . . . . . . . . . . . . . . . . . . . . . . . . . . . . . . . . . . . . . . . . . . . . . . . . . . . . . . .2-5
Table 2-6. U_MSR_PMON_EVT_SEL Register – Field Definitions . . . . . . . . . . . . . . . . . . . . . . . . . . . . . . . . . . . . . . . . . . . . . 2-5
Table 2-7. U_MSR_PMON_CTR Register – Field Definitions . . . . . . . . . . . . . . . . . . . . . . . . . . . . . . . . . . . . . . . . . . . . . . . . . . 2-6
Table 2-8. Performance Monitor Events for U-Box Events . . . . . . . . . . . . . . . . . . . . . . . . . . . . . . . . . . . . . . . . . . . . . . . . . .2-6
Table 2-9. C-Box Performance Monitoring MSRs . . . . . . . . . . . . . . . . . . . . . . . . . . . . . . . . . . . . . . . . . . . . . . . . . . . . . . . . . . 2-10
Table 2-10. C_MSR_PMON_GLOBAL_CTL Register – Field Definitions . . . . . . . . . . . . . . . . . . . . . . . . . . . . . . . . . . . . . . . 2-14
Table 2-11. C_MSR_PMON_GLOBAL_STATUS Register – Field Definitions . . . . . . . . . . . . . . . . . . . . . . . . . . . . . . . . . . . 2-14
Table 2-12. C_MSR_PMON_GLOBAL_OVF_CTL Register – Field Definitions . . . . . . . . . . . . . . . . . . . . . . . . . . . . . . . . . . 2-14
Table 2-13. C_MSR_PMON_EVT_SEL{5-0} Register – Field Definitions . . . . . . . . . . . . . . . . . . . . . . . . . . . . . . . . . . . . . . 2-15
Table 2-14. C_MSR_PMON_CTR{5-0} Register – Field Definitions . . . . . . . . . . . . . . . . . . . . . . . . . . . . . . . . . . . . . . . . . . . 2-15
Table 2-15. Performance Monitor Events for C-Box Events . . . . . . . . . . . . . . . . . . . . . . . . . . . . . . . . . . . . . . . . . . . . . . . . . 2-17
Table 2-16. B-Box Performance Monitoring MSRs . . . . . . . . . . . . . . . . . . . . . . . . . . . . . . . . . . . . . . . . . . . . . . . . . . . . . . . . . . 2-30
Table 2-17. B_MSR_PMON_GLOBAL_CTL Register – Field Definitions . . . . . . . . . . . . . . . . . . . . . . . . . . . . . . . . . . . . . . . 2-31
Table 2-18. B_MSR_PMON_GLOBAL_STATUS Register – Field Definitions . . . . . . . . . . . . . . . . . . . . . . . . . . . . . . . . . . . 2-31
Table 2-19. B_MSR_PMON_GLOBAL_OVF_CTL Register – Field Definitions . . . . . . . . . . . . . . . . . . . . . . . . . . . . . . . . . . 2-31
Table 2-20. B_MSR_PMON_EVT_SEL{3-0} Register – Field Definitions . . . . . . . . . . . . . . . . . . . . . . . . . . . . . . . . . . . . . . 2-32
Table 2-21. B_MSR_PMON_CNT{3-0} Register – Field Definitions . . . . . . . . . . . . . . . . . . . . . . . . . . . . . . . . . . . . . . . . . . . 2-32
Table 2-22. B_MSR_MATCH_REG Register – Field Definitions . . . . . . . . . . . . . . . . . . . . . . . . . . . . . . . . . . . . . . . . . . . . . . . 2-33
Table 2-23. B_MSR_MASK_REG Register – Field Definitions . . . . . . . . . . . . . . . . . . . . . . . . . . . . . . . . . . . . . . . . . . . . . . . . 2-33
Table 2-24. Performance Monitor Events for B-Box Events . . . . . . . . . . . . . . . . . . . . . . . . . . . . . . . . . . . . . . . . . . . . . . . . 2-35
Table 2-25. S-Box Performance Monitoring MSRs . . . . . . . . . . . . . . . . . . . . . . . . . . . . . . . . . . . . . . . . . . . . . . . . . . . . . . . . . . 2-45
Table 2-26. S_MSR_PMON_SUMMARY Register Fields . . . . . . . . . . . . . . . . . . . . . . . . . . . . . . . . . . . . . . . . . . . . . . . . . . . . . 2-47
Table 2-27. S_CSR_PMON_GLOBAL_CTL Register Fields . . . . . . . . . . . . . . . . . . . . . . . . . . . . . . . . . . . . . . . . . . . . . . . . . . . 2-47
Table 2-28. S_MSR_PMON_GLOBAL_STATUS Register Fields . . . . . . . . . . . . . . . . . . . . . . . . . . . . . . . . . . . . . . . . . . . . . . . 2-47
Table 2-29. S_MSR_PMON_OVF_CTRL Register Fields . . . . . . . . . . . . . . . . . . . . . . . . . . . . . . . . . . . . . . . . . . . . . . . . . . . . . 2-48
Table 2-30. S_CSR_PMON_CTL{3-0} Register – Field Definitions . . . . . . . . . . . . . . . . . . . . . . . . . . . . . . . . . . . . . . . . . . . . 2-48
Table 2-31. S_CSR_PMON_CTR{3-0} Register – Field Definitions . . . . . . . . . . . . . . . . . . . . . . . . . . . . . . . . . . . . . . . . . . . . 2-49
Table 2-32. S_MSR_MM_CFG Register – Field Definitions . . . . . . . . . . . . . . . . . . . . . . . . . . . . . . . . . . . . . . . . . . . . . . . . . . . 2-49
Table 2-33. S_MSR_MATCH Register – Field Definitions . . . . . . . . . . . . . . . . . . . . . . . . . . . . . . . . . . . . . . . . . . . . . . . . . . . . 2-50
Table 2-34. S_MSR_MATCH.opc - Opcode Match by Message Class . . . . . . . . . . . . . . . . . . . . . . . . . . . . . . . . . . . . . . . . . . 2-50
Table 2-35. S_MSR_MASK Register – Field Definitions . . . . . . . . . . . . . . . . . . . . . . . . . . . . . . . . . . . . . . . . . . . . . . . . . . . . . 2-51
Table 2-36. S-Box Data Structure Occupancy Events . . . . . . . . . . . . . . . . . . . . . . . . . . . . . . . . . . . . . . . . . . . . . . . . . . . . . . 2-52
Table 2-37. Performance Monitor Events for S-Box Events . . . . . . . . . . . . . . . . . . . . . . . . . . . . . . . . . . . . . . . . . . . . . . . . 2-53
Table 2-38. Input Buffering Per Port . . . . . . . . . . . . . . . . . . . . . . . . . . . . . . . . . . . . . . . . . . . . . . . . . . . . . . . . . . . . . . . . . . . . . . 2-73
Table 2-39. R-Box Performance Monitoring MSRs . . . . . . . . . . . . . . . . . . . . . . . . . . . . . . . . . . . . . . . . . . . . . . . . . . . . . . . . . . 2-74
Table 2-40. R-Box Port Map . . . . . . . . . . . . . . . . . . . . . . . . . . . . . . . . . . . . . . . . . . . . . . . . . . . . . . . . . . . . . . . . . . . . . . . . . . . . . . 2-77
Table 2-41. R_MSR_PMON_GLOBAL_CTL_{15_8, 7_0} Register Fields . . . . . . . . . . . . . . . . . . . . . . . . . . . . . . . . . . . . . . 2-78
Table 2-42. R_MSR_PMON_GLOBAL_STATUS_{15_8, 7_0} Register Fields . . . . . . . . . . . . . . . . . . . . . . . . . . . . . . . . . . 2-78
Table 2-43. R_MSR_PMON_OVF_CTL_{15_8, 7_0} Register Fields . . . . . . . . . . . . . . . . . . . . . . . . . . . . . . . . . . . . . . . . . . 2-78
Table 2-44. R_MSR_PMON_CTL{15-0} Register – Field Definitions . . . . . . . . . . . . . . . . . . . . . . . . . . . . . . . . . . . . . . . . . . 2-79
Table 2-45. R_MSR_PMON_CTL{15-8} Event Select . . . . . . . . . . . . . . . . . . . . . . . . . . . . . . . . . . . . . . . . . . . . . . . . . . . . . . . . 2-80
Table 2-46. R_MSR_PMON_CTL{7-0} Event Select . . . . . . . . . . . . . . . . . . . . . . . . . . . . . . . . . . . . . . . . . . . . . . . . . . . . . . . . . 2-81
Table 2-47. R_MSR_PMON_CTR{15-0} Register – Field Definitions . . . . . . . . . . . . . . . . . . . . . . . . . . . . . . . . . . . . . . . . . . 2-81
Table 2-48. R_MSR_PORT{7-0}_IPERF_CFG{1-0} Registers . . . . . . . . . . . . . . . . . . . . . . . . . . . . . . . . . . . . . .
Table 2-49. R_MSR_PORT{7-0}_QLX_CFG Register Fields . . . . . . . . . . . . . . . . . . . . . . . . . . . . . . . . . . . . . . . . . . . . . . . . . . 2-83
Table 2-50. R_MSR_PORT{7-0}_XBR_SET{2-1}_MM_CFG Registers . . . . . . . . . . . . . . . . . . . . . . . . . . . . . . . . . . . . . . . . . 2-85
Table 2-51. R_MSR_PORT{7-0}_XBR_SET{2-1}_MATCH Registers . . . . . . . . . . . . . . . . . . . . . . . . . . . . . . . . . . . . . . . . . . 2-85
Table 2-52. R_MSR_PORT{7-0}_XBR_SET{2-1}_MASK Registers . . . . . . . . . . . . . . . . . . . . . . . . . . . . . . . . . . . . . . . . . . . 2-86
Table 2-53. Message Events Derived from the Match/Mask filters . . . . . . . . . . . . . . . . . . . . . . . . . . . . . . . . . . . . . . . . . . 2-87
Table 2-54. Performance Monitor Events for R-Box Events . . . . . . . . . . . . . . . . . . . . . . . . . . . . . . . . . . . . . . . . . . . . . . . . 2-88
Table 2-55. Unit Masks for ALLOC_TO_ARB . . . . . . . . . . . . . . . . . . . . . . . . . . . . . . . . . . . . . . . . . . . . . . . . . . . . . . . . . . . . . . . 2-89
Table 2-56. Unit Masks for EOT_DEPTH_ACC . . . . . . . . . . . . . . . . . . . . . . . . . . . . . . . . . . . . . . . . . . . . . . . . . . . . . . . . . . . . . . 2-89
Table 2-57. Unit Masks for EOT_ROLL_DEPTH_ACC . . . . . . . . . . . . . . . . . . . . . . . . . . . . . . . . . . . . . . . . . . . . . . . . . . . . . . . . 2-90
Table 2-58. Unit Masks for GLOBAL_ARB_BID_FAIL . . . . . . . . . . . . . . . . . . . . . . . . . . . . . . . . . . . . . . . . . . . . . . . . . . . . . . . . 2-91
Table 2-59. Unit Masks for NEW_PACKETS_RECV . . . . . . . . . . . . . . . . . . . . . . . . . . . . . . . . . . . . . . . . . . . . . . . . . . . . . . . . . . 2-92
Table 2-60. Unit Masks for QUE_ARB_BID . . . . . . . . . . . . . . . . . . . . . . . . . . . . . . . . . . . . . . . . . . . . . . . . . . . . . . . . . . . . . . . . . 2-93
. . . . . . . . . . . 2-82
Page 8

INTEL® XEON® PROCESSOR 7500 SERIES UNCORE PROGRAMMING GUIDE TABLES
Table 2-61. Unit Masks for QUE_ARB_BID_FAIL . . . . . . . . . . . . . . . . . . . . . . . . . . . . . . . . . . . . . . . . . . . . . . . . . . . . . . . . . . . 2-93
Table 2-62. Unit Masks for TARGET_AVAILABLE . . . . . . . . . . . . . . . . . . . . . . . . . . . . . . . . . . . . . . . . . . . . . . . . . . . . . . . . . . . 2-94
Table 2-63. M-Box Performance Monitoring MSRs . . . . . . . . . . . . . . . . . . . . . . . . . . . . . . . . . . . . . . . . . . . . . . . . . . . . . . . . . 2-98
Table 2-64. M_MSR_PERF_GLOBAL_CTL Register Fields . . . . . . . . . . . . . . . . . . . . . . . . . . . . . . . . . . . . . . . . . . . . . . . . . . 2-100
Table 2-65. M_MSR_PERF_GLOBAL_STATUS Register Fields . . . . . . . . . . . . . . . . . . . . . . . . . . . . . . . . . . . . . . . . . . . . . . 2-100
Table 2-66. M_MSR_PERF_GLOBAL_OVF_CTL Register Fields . . . . . . . . . . . . . . . . . . . . . . . . . . . . . . . . . . . . . . . . . . . . . 2-100
Table 2-67. M_MSR_PMU_CNT_CTL{5-0} Register – Field Definitions . . . . . . . . . . . . . . . . . . . . . . . . . . . . . . . . . . . . . . 2-101
Table 2-68. M_MSR_PMU_CNT_{5-0} Register – Field Definitions . . . . . . . . . . . . . . . . . . . . . . . . . . . . . . . . . . . . . . . . . . 2-101
Table 2-69. M_MSR_PMU_TIMESTAMP_UNIT Register – Field Definitions . . . . . . . . . . . . . . . . . . . . . . . . . . . . . . . . . . 2-102
Table 2-70. M_MSR_PMU_MM_CFG Register – Field Definitions . . . . . . . . . . . . . . . . . . . . . . . . . . . . . . . . . . . . . . . . . . . . 2-102
Table 2-71. M_MSR_PMU_ADDR_MATCH Register – Field Definitions . . . . . . . . . . . . . . . . . . . . . . . . . . . . . . . . . . . . . . 2-102
Table 2-72. M_MSR_PMU_ADDR_MASK Register – Field Definitions . . . . . . . . . . . . . . . . . . . . . . . . . . . . . . . . . . . . . . . . 2-102
Table 2-73. M_MSR_PMU_DSP Register – Field Definitions . . . . . . . . . . . . . . . . . . . . . . . . . . . . . . . . . . . . . . . . . . . . . . . . 2-104
Table 2-74. M_CSR_ISS_PMU Register – Field Definitions . . . . . . . . . . . . . . . . . . . . . . . . . . . . . . . . . . . . . . . . . . . . . . . . . . 2-104
Table 2-75. M_MSR_PMU_MAP Register – Field Definitions . . . . . . . . . . . . . . . . . . . . . . . . . . . . . . . . . . . . . . . . . . . . . . . . 2-105
Table 2-76. M_CSR_PMU_MA_MSC_THR Register – Field Definitions . . . . . . . . . . . . . . . . . . . . . . . . . . . . . . . . . . . . . . . 2-105
Table 2-77. TRP_PT_{DN,UP}_CND Encodings . . . . . . . . . . . . . . . . . . . . . . . . . . . . . . . . . . . . . . . . . . . . . . . . . . . . . . . . . . . . 2-106
Table 2-78. M_MSR_PMU_PGT Register – Field Definitions . . . . . . . . . . . . . . . . . . . . . . . . . . . . . . . . . . . . . . . . . . . . . . . . 2-106
Table 2-79. M_MSR_PMU_PLD Register – Field Definitions . . . . . . . . . . . . . . . . . . . . . . . . . . . . . . . . . . . . . . . . . . . . . . . . 2-107
Table 2-80. M_MSR_PMU_ZDP_CTL_FVC Register – Field Definitions . . . . . . . . . . . . . . . . . . . . . . . . . . . . . . . . . . . . . . 2-108
Table 2-81. M_MSR_PMU_ZDP_CTL_FVC.evnt{4-1} Encodings . . . . . . . . . . . . . . . . . . . . . . . . . . . . . . . . . . . . . . . . . . . . . 2-108
Table 2-82. M_MSR_PMU_ZDP_CTL_FVC.RESP Encodings . . . . . . . . . . . . . . . . . . . . . . . . . . . . . . . . . . . . . . . . . . . . . . . . . 2-109
Table 2-83. M_MSR_PMU_ZDP_CTL_FVC.BCMD Encodings . . . . . . . . . . . . . . . . . . . . . . . . . . . . . . . . . . . . . . . . . . . . . . . . 2-109
Table 2-84. Performance Monitor Events for M-Box Events . . . . . . . . . . . . . . . . . . . . . . . . . . . . . . . . . . . . . . . . . . . . . . . 2-110
Table 2-85. Unit Masks for CYCLES_DSP_FILL . . . . . . . . . . . . . . . . . . . . . . . . . . . . . . . . . . . . . . . . . . . . . . . . . . . . . . . . . . . . 2-111
Table 2-86. Unit Masks for CYCLES_PGT_STATE . . . . . . . . . . . . . . . . . . . . . . . . . . . . . . . . . . . . . . . . . . . . . . . . . . . . . . . . . . 2-112
Table 2-87. Unit Masks for CYCLES_SCHED_MODE . . . . . . . . . . . . . . . . . . . . . . . . . . . . . . . . . . . . . . . . . . . . . . . . . . . . . . . . 2-112
Table 2-88. Unit Masks for DSP_FILL . . . . . . . . . . . . . . . . . . . . . . . . . . . . . . . . . . . . . . . . . . . . . . . . . . . . . . . . . . . . . . . . . . . . . 2-114
Table 2-89. Unit Masks for FVC_EV0 . . . . . . . . . . . . . . . . . . . . . . . . . . . . . . . . . . . . . . . . . . . . . . . . . . . . . . . . . . . . . . . . . . . . . 2-115
Table 2-90. Unit Masks for FVC_EV1 . . . . . . . . . . . . . . . . . . . . . . . . . . . . . . . . . . . . . . . . . . . . . . . . . . . . . . . . . . . . . . . . . . . . . 2-115
Table 2-91. Unit Masks for FVC_EV2 . . . . . . . . . . . . . . . . . . . . . . . . . . . . . . . . . . . . . . . . . . . . . . . . . . . . . . . . . . . . . . . . . . . . . 2-116
Table 2-92. Unit Masks for FVC_EV3 . . . . . . . . . . . . . . . . . . . . . . . . . . . . . . . . . . . . . . . . . . . . . . . . . . . . . . . . . . . . . . . . . . . . . 2-117
Table 2-93. Unit Masks for BCMD_SCHEDQ_OCCUPANCY . . . . . . . . . . . . . . . . . . . . . . . . . . . . . . . . . . . . . . . . . . . . . . . . . . 2-119
Table 2-94. W-Box Performance Monitoring MSRs . . . . . . . . . . . . . . . . . . . . . . . . . . . . . . . . . . . . . . . . . . . . . . . . . . . . . . . . 2-125
Table 2-95. W_MSR_PMON_GLOBAL_CTL Register Fields . . . . . . . . . . . . . . . . . . . . . . . . . . . . . . . . . . . . . . . . . . . . . . . . . 2-125
Table 2-96. W_MSR_PMON_GLOBAL_STATUS Register Fields . . . . . . . . . . . . . . . . . . . . . . . . . . . . . . . . . . . . . . . . . . . . . 2-126
Table 2-97. W_MSR_PMON_GLOBAL_OVF_CTRL Register Fields . . . . . . . . . . . . . . . . . . . . . . . . . . . . . . . . . . . . . . . . . . . 2-126
Table 2-98. W_MSR_PMON_EVT_SEL_{3-0} Register – Field Definitions . . . . . . . . . . . . . . . . . . . . . . . . . . . . . . . . . . . . 2-127
Table 2-99. W_MSR_PMON_FIXED_CTR_CTL Register – Field Definitions . . . . . . . . . . . . . . . . . . . . . . . . . . . . . . . . . . . 2-127
Table 2-100. W_MSR_PMON_CTR_{3-0} Register – Field Definitions . . . . . . . . . . . . . . . . . . . . . . . . . . . . . . . . . . . . . . . . 2-128
Table 2-101. W_MSR_PMON_FIXED_CTR Register – Field Definitions . . . . . . . . . . . . . . . . . . . . . . . . . . . . . . . . . . . . . . . 2-128
Table 2-102. Performance Monitor Events for W-Box Events . . . . . . . . . . . . . . . . . . . . . . . . . . . . . . . . . . . . . . . . . . . . . . . 2-128
Table 2-103. Intel® QuickPath Interconnect Packet Message Classes . . . . . . . . . . . . . . . . . . . . . . . . . . . . . . . . . . . . . . . . 2-130
Table 2-104. Opcode Match by Message Class . . . . . . . . . . . . . . . . . . . . . . . . . . . . . . . . . . . . . . . . . . . . . . . . . . . . . . . . . . . . . 2-131
Table 2-105. Opcodes (Alphabetical Listing) . . . . . . . . . . . . . . . . . . . . . . . . . . . . . . . . . . . . . . . . . . . . . . . . . . . . . . . . . . . . . . . 2-132
Page 9
INTEL® XEON® PROCESSOR 7500 SERIES UNCORE PROGRAMMING GUIDE INTRODUCTION
CHAPTER 1
INTRODUCTION
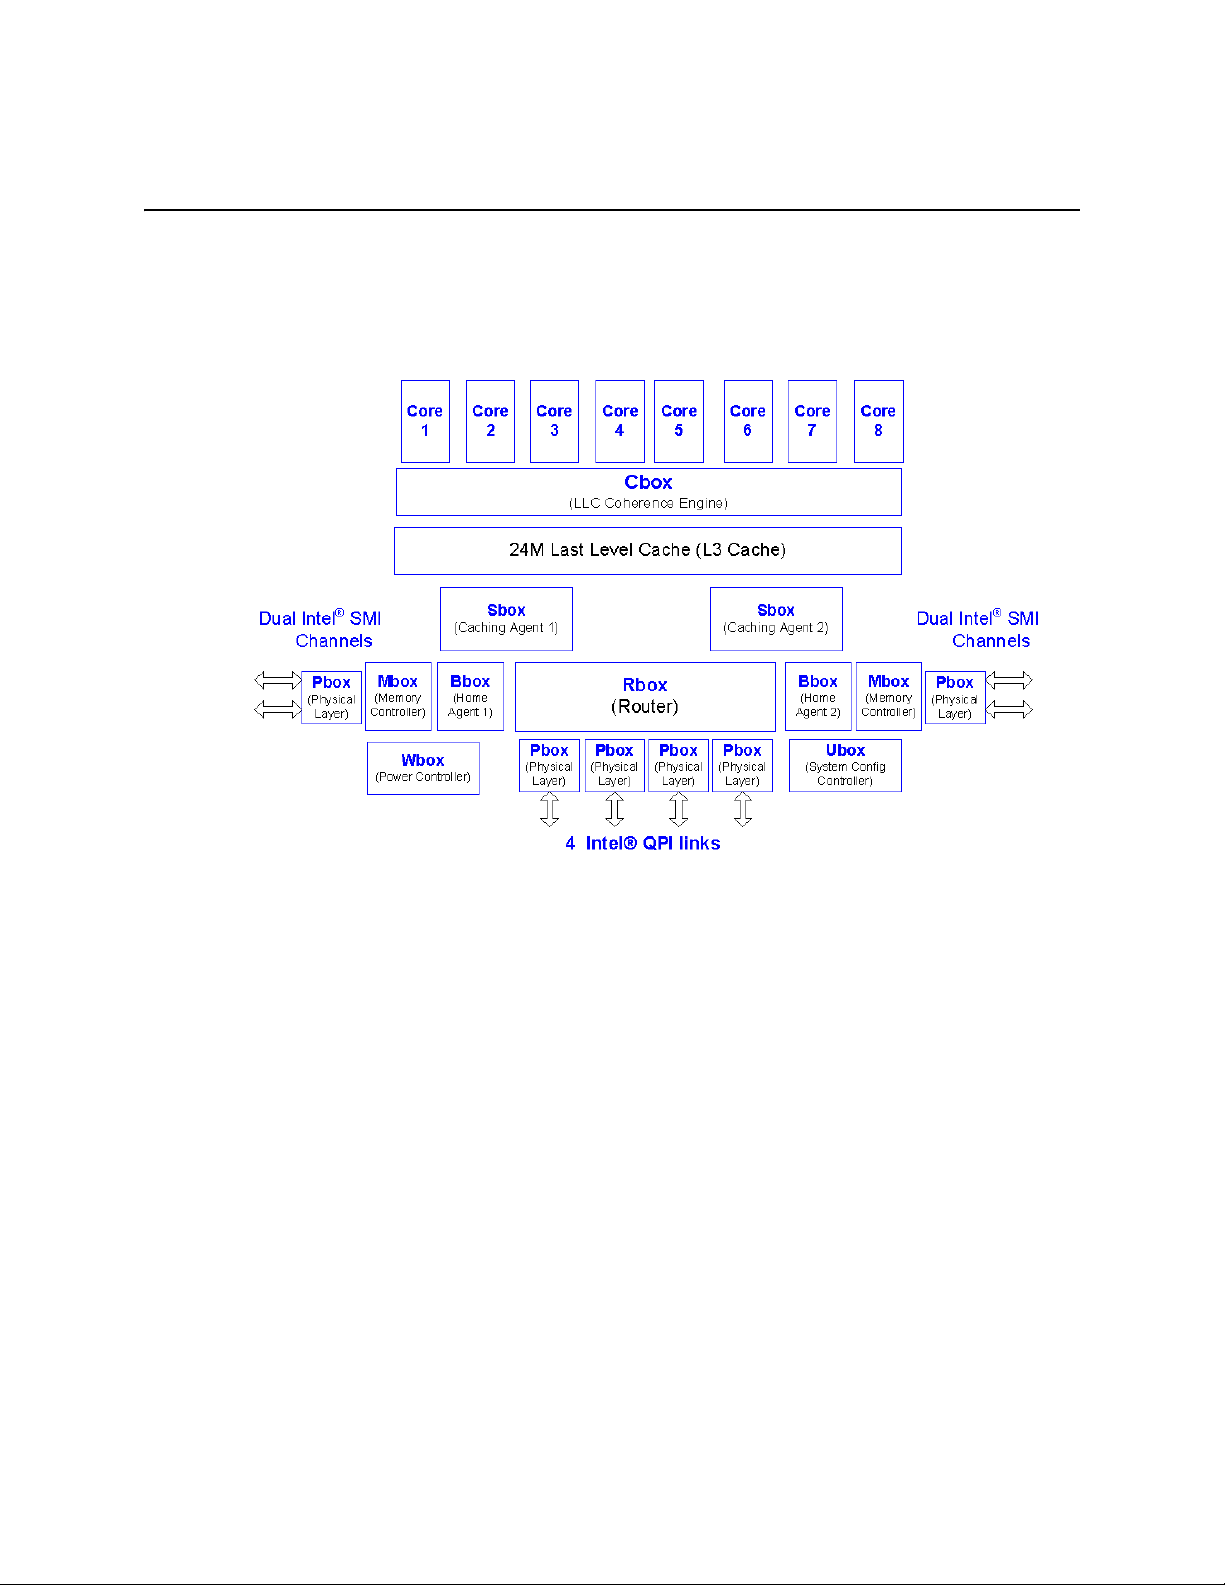
1.1 INTRODUCTION
Figure 1-1 provides an Intel® Xeon® Processor 7500 Series block diagram.
Figure 1-1. Intel Xeon Processor 7500 Series Block Diagram
1.2 Uncore PMU Overview
The processor uncore performance monitoring is supported by PMUs local to each of the C, S, B, M, R, U,
and W-Boxes. Each of these boxes communicates with the U-Box which contains registers to control all
uncore PMU activity (as outlined in Section 2.1, “Global Performance Monitoring Control”).
All processor uncore performance monitoring features can be accessed through RDMSR/WRMSR instructions executed at ring 0.
Since the uncore performance monitors represent socket-wide resources that are not context switched
by the OS, it is highly recommended that only one piece of software (per-socket) attempt to program and
extract information from the monitors. T o keep things simple, it is also recommended that the monitoring
software communicate with the OS such that it can be executed on coreId = 0, threadId = 0. Although
recommended, this step is not necessary . Software may be notified of an overflowing uncore counter on
any core.
1-1
Page 10

INTEL® XEON® PROCESSOR 7500 SERIES UNCORE PROGRAMMING GUIDE INTRODUCTION
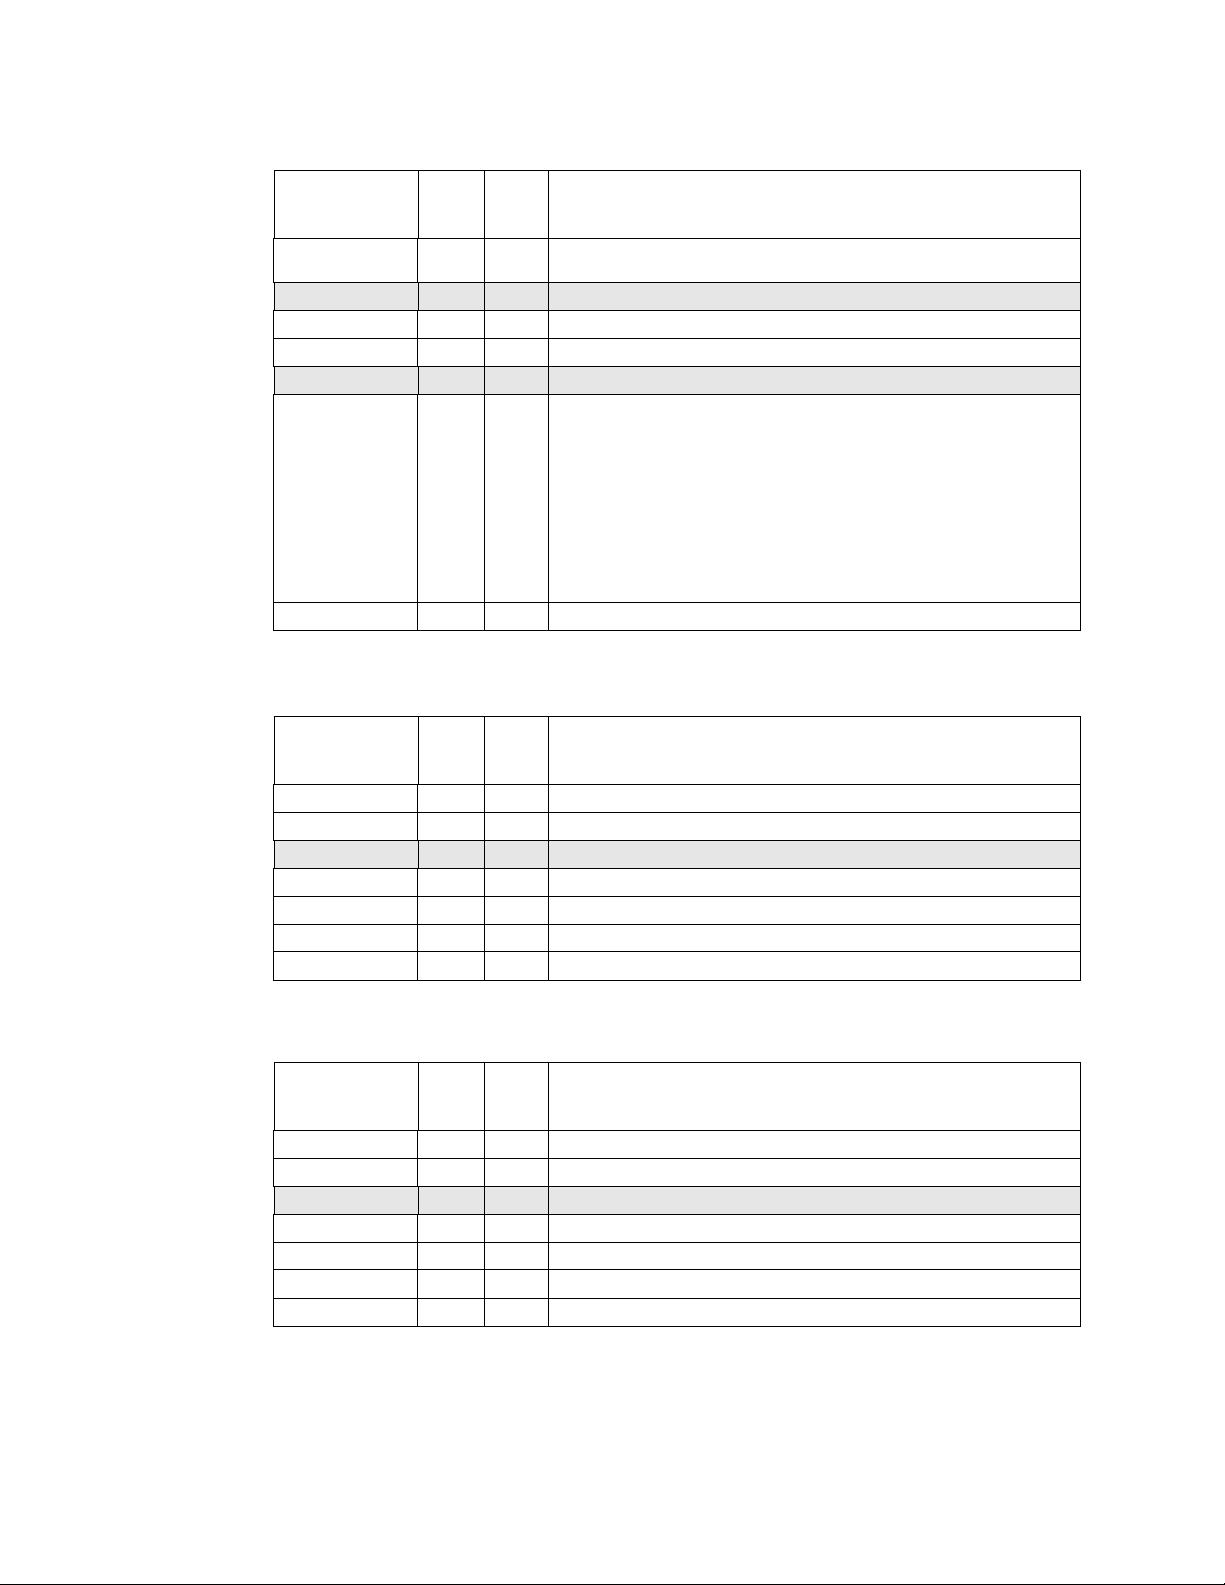
The general performance monitoring capabilities in each box are outlined in the following table.
Table 1-1. Per-Box Performance Monitoring Capabilities
Box # Boxes
C-Box 8 6 Y N 48
S-Box 2 4 Y Y 48
B-Box 2 4 N Y 48
M-Box 2 6 N N 48
R-Box 1 (L/R sides) 16
U-Box 1 1 Y N 48
W-Box 1 4 Y N 48
# Counters/
Box
(2 per port, 8
per side)
Generic
Counters?
Packet Match/
Mask Filters?
NY48
Bit Width
1.3 Uncore PMU Summary Tables
Table 1-2. Uncore Performance Monitoring MSRs
Box MSR Addresses Description
R-Box Counters
R-Box R
R-Box L
C-Box Counters
C-Box 7
C-Box 3
C-Box 5
C-Box 1
C-Box 6
C-Box 2
C-Box 4
C-Box 0
M-Box Counters
0xE3F-0xE30 Counter/Config Registers(15-8)
0xE2F-0xE2C QLX SubConfig Registers for Ports 7-4
0xE2B-0xE24 IPERF 1 SubConfig Registers
0xE22-0xE20 Global (Control/Status/Ovf Control)
0xE1F-0xE10 Counter/Config Registers(7-0)
0xE0F-0xE0C QLX SubConfig Registers for Ports 3-0
0xE0B-0xE04 IPERF 0 SubConfig Registers
0xE02-0xE00 Global (Control/Status/Ovf Control)
0xDFB-0xDF0 Counter/Config Registers
0xDE2-0xDE0 Global (Control/Status/Ovf Control)
0xDDB-0xDD0 Counter/Config Registers
0xDC2-0xDC0 Global (Control/Status/Ovf Control)
0xDBB-0xDB0 Counter/Config Registers
0xDA2-0xDA0 Global (Control/Status/Ovf Control)
0xD9B-0xD90 Counter/Config Registers
0xD82-0xDE0 Global (Control/Status/Ovf Control)
0xD7B-0xD70 Counter/Config Registers
0xD62-0xD60 Global (Control/Status/Ovf Control)
0xD5B-0xD50 Counter/Config Registers
0xD42-0xD40 Global (Control/Status/Ovf Control)
0xD3B-0xD30 Counter/Config Registers
0xD22-0xD20 Global (Control/Status/Ovf Control)
0xD1B-0xD10 Counter/Config Registers
0xD02-0xD00 Global (Control/Status/Ovf Control)
1-2
Page 11

INTEL® XEON® PROCESSOR 7500 SERIES UNCORE PROGRAMMING GUIDE INTRODUCTION
Table 1-2. Uncore Performance Monitoring MSRs
Box MSR Addresses Description
M-Box 1
M-Box 0
S-Box Counters
S-Box 1
S-Box 0
B-Box Counters
B-Box 1
B-Box 0
U-Box Counters
U-Box
W-Box Counters
W-Box
0xE5E-0xE5C Match/Mask Registers
0xCFB-0xCF0 Counter/Config Registers
0xCEB-0xCE4 Subconfig Registers (FVC,PLD,PGT,THR,MAP,ISS,DSP)
+ Timestamp Register
0xCE2-0xCE0 Global (Control/Status/Ovf Control)
0xE56-0xE54 Match/Mask Registers
0xCBB-0xCB0 Counter/Config Registers
0xCAB-0xCA4 Subconfig Registers (FVC,PLD,PGT,THR,MAP,ISS,DSP)
+ Timestamp Register
0xCA2-0xCA0 Global (Control/Status/Ovf Control)
0xE5A-0xE58 Match/Mask Registers
0xCD7-0xCD0 Counter/Config Registers
0xCC3-0xCC0 Global (Control/Status/Ovf Control)
0xE4A-0xE48 Match/Mask Registers
0xC57-0xC50 Counter/Config Registers
0xC43-0xC40 Global (Control/Status/Ovf Control)
0xE4E-0xE4D Match/Mask Registers
0xC77-0xC70 Counter/Config Registers
0xC62-0xC60 Global (Control/Status/Ovf Control)
0xE46-0xE45 Match/Mask Registers
0xC37-0xC30 Counter/Config Registers
0xC22-0xC20 Global (Control/Status/Ovf Control)
0xC11-0xC10 Counter/Config Registers
0xC02-0xC00 Global (Control/Status/Ovf Control)
0x395-0x394 Fixed Counter/Config Registers
0xC97-0xC90 Counter/Config Registers
0xC82-0xC80 Global (Control/Status/Ovf Control)
1.4 References
The following sections provide a breakdown of the performance monitoring capabilities of each box.
• Section 2.1, “Global Performance Monitoring Control”
• Section 2.2, “U-Box Performance Monitoring”
• Section 2.3, “C-Box Performance Monitoring”
• Section 2.4, “B-Box Performance Monitoring”
• Section 2.5, “S-Box Performance Monitoring”
• Section 2.6, “R-Box Performance Monitoring”
• Section 2.7, “M-Box Performance Monitoring”
1-3
Page 12

INTEL® XEON® PROCESSOR 7500 SERIES UNCORE PROGRAMMING GUIDE INTRODUCTION
• Section 2.8, “W-Box Performance Monitoring”
• Section 2.9, “Packet Matching Reference”
1-4
Page 13

INTEL® XEON® PROCESSOR 7500 SERIES UNCORE PROGRAMMING GUIDE UNCORE PERFORMANCE MONITORING
CHAPTER 2
UNCORE PERFORMANCE MONITORING
2.1 Global Performance Monitoring Control
2.1.1 Counter Overflow
If a counter overflows, it will send the overflow signal towards the U-Box. This signal will be
accumulated along the way in summary registers contained in each S-Box and a final summary register
in the U-Box.
®
The Intel
this overflow with two basic actions:
2.1.1.1 Freezing on Counter Overflow
Each uncore performance counter may be configured to, upon detection of overflow, disable (or
‘freeze’) all other counters in the uncore. To do so, the .pmi_en in the individual counter’s control
register must be set to 1. If the U_MSR_PMON_GLOBAL_CTL.frz_all is also set to 1, once the U-Box
receives the PMI from the uncore box, it will set U_MSR_PMON_GLOBAL_CTL.en_all to 0 which will
disable all counting.
Xeon® Processor 7500 Series uncore performance monitors may be configured to respond to
2.1.1.2 PMI on Counter Overflow
The uncore may also be configured to, upon detection of a performance counter overflow, send a PMI
signal to the core executing the monitoring software. To do so, the .pmi_en in the individual counter’s
control register must be set to 1 and U_MSR_PMON_GLOBAL_CTL.pmi_core_sel must be set to point to
the core the monitoring software is executing on.
Note: PMI is decoupled from freeze, so if software also wants the counters frozen, it must set
U_MSR_PMON_GLOBAL_CTL.frz_all to 1.
2.1.2 Setting up a Monitoring Session
On HW reset, all the counters should be disabled. Enabling is hierarchical. So the following steps must
be taken to set up a new monitoring session:
a) Reset counters to ensure no stale values have been acquired from previous sessions:
- set U_MSR_PMON_GLOBAL_CTL.rst_all to 1.
b) Select event to monitor:
Determine what events should be captured and program the control registers to capture them (i.e.
typically selected by programming the .ev_sel bits although other bit fields may be involved).
i.e. Set B_MSR_PMON_EVT_SEL3.ev _s e l to 0x03 to capture SNP_MERGE.
c) Enable counting locally:
i.e. Set B_MSR_PMON_EVT_SEL3.en to 1.
2-1
Page 14

INTEL® XEON® PROCESSOR 7500 SERIES UNCORE PROGRAMMING GUIDE UNCORE PERFORMANCE MONITORING
d) Enable counting at the box-level:
Enable counters within that box via it’s ‘GLOBAL_CTL’ register
i.e. set B_MSR_PMON_GLOBAL_CTL[3] to 1.
e) Select how to gather data. If polling, skip to 4. If sampling:
To set up a sample interval, software can pre-program the data register with a value of [2^48 -
sample interval length]. Doing so allows software, through use of the pmi mechanism, to be notified
when the number of events in the sample have been captured. Capturing a performance monitoring
sample every ‘X cycles’ (the fixed counter in the W-Box counts uncore clock cycles) is a common use of
this mechanism.
i.e. To stop counting and receive notification when the 1,000th SNP_MERGE has been detected,
- set B_MSR_PMON_CNT to (2^48- 1000)
- set B_MSR_PMON_EVT_SEL.pmi_en to 1
- set U_MSR_PMON_GLOBAL_CTL.frz_all to 1
- set U_MSR_PMON_GLOBAL_CTL.pmi_core_sel to which core the monitoring thread is executing on.
f) Enable counting at the global level by setting the U_MSR_PMON_GLOBAL_CTL.en_all bit to 1. Set the
.rst_all field to 0 with the same write.
And with that, counting will begin.
2.1.3 Reading the Sample Interval
Software can either poll the counters whenever it chooses, or wait to be notified that a counter has
overflowed (by receiving a PMI).
a) Polling - before reading, it is recommended that software freeze and disable the counters (by
clearing U_MSR_PMON_GLOBAL_CTL.en_all).
b) Frozen counters - If software set up the counters to freeze on overflow and send notification when it
happens, the next question is: Who caused the freeze?
Overflow bits are stored hierarchically within the Intel Xeon Processor 7500 Series uncore. First,
software should read the U_MSR_PMON_GLOBAL_STA T US.ov_* bits to determine whether a U or W box
counter caused the overflow or whether it was a counter in a box attached to the S0 or S1 Box.
The S-Boxes aggregate overflow bits from the M/B/C/R boxes they are attached to. So the next step is
to read the S{0,1}_MSR_PMON_SUMMARY.ov_* bits. Once the box(es) that contains the overflowing
counter is identified, the last step is to read that box’s *_MSR_PMON_GLOBAL_STATUS.ov field to find
the overflowing counter.
Note: More than one counter may overflow at any given time.
2.1.4 Enabling a New Sample Interval from Frozen Counters
Note: Software can determine if the counters have been frozen due to a PMI by examining two
bits: U_MSR_PMON_GLOBAL_SUMMARY.pmi should be 1 and
U_MSR_PMON_GLOBAL_CTL.en_all should be 0. If not, set
U_MSR_PMON_GLOBAL_CTL.en_all to 0 to disable counting.
2-2
Page 15

INTEL® XEON® PROCESSOR 7500 SERIES UNCORE PROGRAMMING GUIDE UNCORE PERFORMANCE MONITORING
a) Clear all uncore counters: Set U_MSR_PMON_GLOBAL_CTL.rst_all to 1.
b) Clear all overflow bits. When an overflow bit is cleared, all bits that summarize that overflow (above
in the hierarchy) will also be cleared. Therefore it is only necessary to clear the overflow bits
corresponding to the actual counter.
i.e. If counter 3 in B-Box 1 overflowed, to clear the overflow bit software should set
B_MSR_PMON_GLOBAL_OVF_CTL.clr_ov[3] to 1 in B-Box 1. This action will also clear
S_MSR_PMON_SUMMARY.ov_mb in S-Box 1 and U_MSR_PMON_GLOBAL_STATUS.ov_s1.c
c) Create the next sample: Reinitialize the sample by setting the monitoring data register to (2^48 sample_interval). Or set up a new sample interv al as outlined in Sect ion 2.1.2, “Setting up a Monitoring
Session”.
d) Re-enable counting: Set U_MSR_PMON_GLOBAL_CTL.en_all to 1. Set the .rst_all field back to 0 with
the same write.
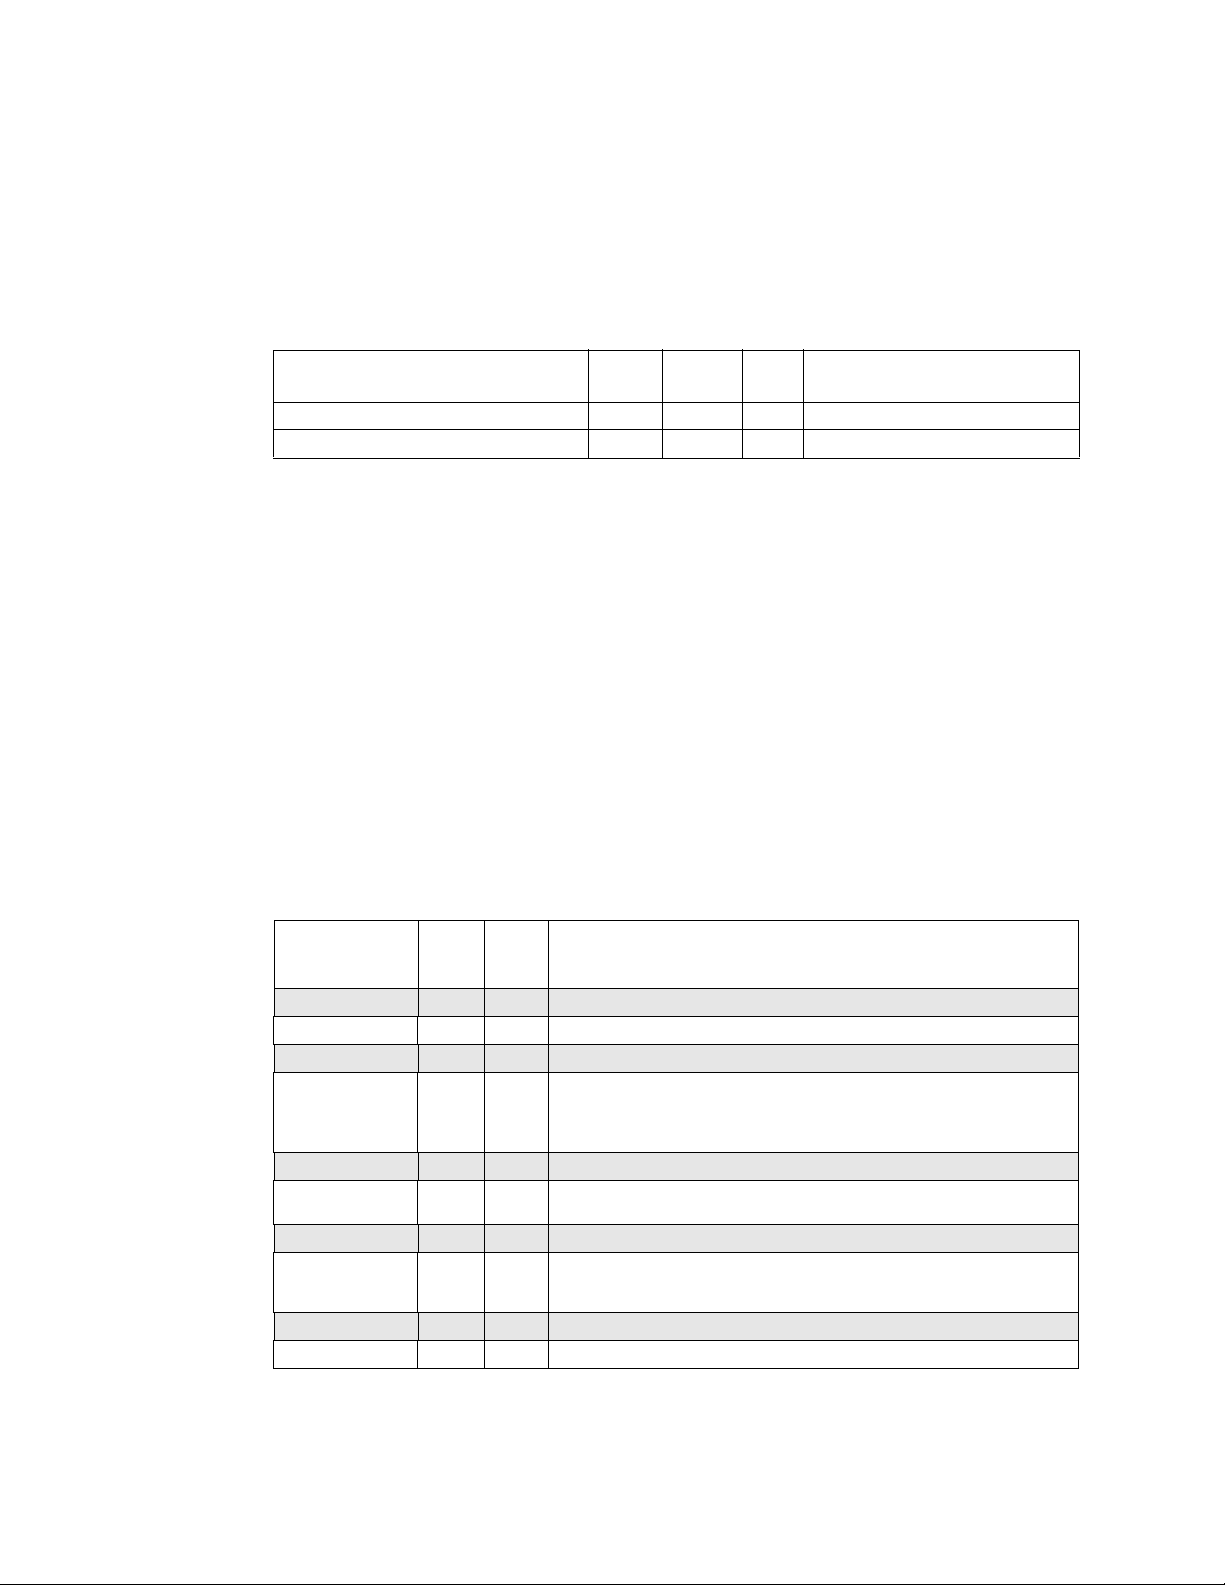
2.1.5 Global Performance Monitors
Table 2-1. Global Performance Monitoring Control MSRs
MSR Name Access
U_MSR_PMON_GLOBAL_OVF_CTL RW_RW 0x0C02 32 U-Box PMON Global Overflow Control
U_MSR_PMON_GLOBAL_STATUS RW_RO 0x0C01 32 U-Box PMON Global Status
U_MSR_PMON_GLOBAL_CTL RW_RO 0x0C00 32 U-Box PMON Global Control
MSR
Address
Size
(bits)
Description
2.1.5.1 Global PMON Global Control/Status Registers
The following registers represent state governing all PMUs in the uncore, both to exert global control
and collect box-level information.
U_MSR_PMON_GLOBAL_CTL contains bits that can reset (.rst_all) and freeze/enable (.en_all) all the
uncore counters. The .en_all bit must be set to 1 before any uncore counters will collect events.
Note: The register also contains the enable for the U-Box counters.
If an overflow is detected in any of the uncore’s PMON registers, it will be summarized in
U_MSR_PMON_GLOBAL_STATUS. This register accumulates overflows sent to it from the U-Box, W-Box
and S-Boxes and indicates if a disable was received from one of the boxes. To reset the summary
overflow bits, a user must set the corresponding bits in the U_MSR_PMON_GLOBAL_OVF_CTL register.
2-3
Page 16
INTEL® XEON® PROCESSOR 7500 SERIES UNCORE PROGRAMMING GUIDE UNCORE PERFORMANCE MONITORING
Table 2-2. U_MSR_PMON_GLOBAL_CTL Register – Field Definitions
Field Bits
frz_all 31 0 Disable uncore counting (by clearing .en_all) if PMI is received from box
ig 30 0 Read zero; writes ignored. (?)
rst_all 29 0 Reset All Uncore PMON Counters
en_all 28 0 Enable All Uncore PMON Counters
ig 27:9 0 Read zero; writes ignored. (?)
pmi_core_sel 8:1 0 PMI Core Select
en 0 0 Enable U-Box PMON counters
HW
Reset
Val
Description
with overflowing counter.
Ex:
If counter pmi is sent to U-Box for Box with overflowing counter...
00000000 - No PMI sent
00000001 - Send PMI to core 0
10000000 - Send PMI to core 7
11000100 - Send PMI to core 2, 6 & 7
etc.
Table 2-3. U_MSR_PMON_GLOBAL_STATUS Register – Field Definitions
Field Bits
cond 31 0 Condition Change
pmi 30 0 PMI Received from box with overflowing counter.
ig 31:4 0 Read zero; writes ignored. (?)
ov_s0 3 0 Set if overflow is detected from a S-Box 0 PMON register.
ov_s1 2 0 Set if overflow is detected from a S-Box 1 PMON register.
ov_w 1 0 Set if overflow is detected from a W-Box PMON register.
ov_u 0 0 Set if overflow is detected from a U-Box PMON register.
HW
Reset
Val
Description
Table 2-4. U_MSR_PMON_GLOBAL_OVF_CTL Register – Field Definitions
Field Bits
clr_cond 31 0 Clear Condition Change
clr_pmi 30 0 Clear PMI Received bit.
ig 29:4 0 Read zero; writes ignored. (?)
clr_ov_s0 3 0 Clear S-Box 0 Overflow
clr_ov_s1 2 0 Clear S-Box 1 Overflow
clr_ov_w 1 0 Clear W-Box Overflow
clr_ov_u 0 0 Clear U-Box Overflow
HW
Reset
Val
Description
2-4
Page 17
INTEL® XEON® PROCESSOR 7500 SERIES UNCORE PROGRAMMING GUIDE UNCORE PERFORMANCE MONITORING
2.2 U-Box Performance Monitoring
The U-Box serves as the system configuration controller for the Intel Xeon Processor 7500 Series.
It contains one counter which can be configured to capture a small set of events.
2.2.1 U-Box PMON Summary
Table 2-5. U-Box Performance Monitoring MSRs
MSR Name Access
U_MSR_PMON_CTR RW_RW 0x0C11 64 U-Box PMON Counter
U_MSR_PMON_EV_SEL RW_RO 0x0C10 32 U-Box PMON Event Select
MSR
Address
Size
(bits)
Description
2.2.1.1 U-Box Box Level PMON State
U-Box global state bits are stored in the uncore global state registers. Refer to Section 2.1, “Global
Performance Monitoring Control” for more information.
2.2.1.2 U-Box PMON state - Counter/Control Pairs
The following table defines the layout of the U-Box performance monitor control register. The main task
of this configuration register is to select the event to be monitored by its respective data counter.
Setting the .ev_sel field performs the event selection. The .en bit must be set to 1 to enable counting.
Additional control bits include:
- .pmi_en which governs what to do if an overflow is detected.
- .edge_detect - Rather than accumulating the raw count each cycle, the register can capture
transitions from no event to an event incoming.
Table 2-6. U_MSR_PMON_EVT_SEL Register – Field Definitions
Field Bits
ig 63 0 Read zero; writes ignored. (?)
rsv 62 0 Reserved; Must write to 0 else behavior is undefined.
ig 61:23 0 Read zero; writes ignored. (?)
en 22 0 Local Counter Enable. When set, the associated counter is locally
ig 21 0 Read zero; writes ignored. (?)
pmi_en 20 0 When this bit is asserted and the corresponding counter overflows, a PMI
ig 19 0 Read zero; writes ignored. (?)
edge_detect 18 0 When asserted, the 0 to 1 transition edge of a 1 bit event input will cause
ig 17:8 0 Read zero; writes ignored. (?)
ev_sel 7:0 0 Select event to be counted.
HW
Reset
Val
Description
enabled.
NOTE: It must also be enabled in C_MSR_PMON_GLOBAL_CTL and the
U-Box to be fully enabled.
exception is sent to the U-Box.
the corresponding counter to increment. When 0, the counter will
increment for however long the event is asserted .
2-5
Page 18
INTEL® XEON® PROCESSOR 7500 SERIES UNCORE PROGRAMMING GUIDE UNCORE PERFORMANCE MONITORING
The U-Box performance monitor data register is 48b wide. A counter overflow occurs when a carry out
bit from bit 47 is detected. Software can force all uncore counting to freeze after N events by preloading
48
a monitor with a count value of 2
- N and setting the control register to send a PMI to the U-Box. Upon
receipt of the PMI, the U-Box will disable counting ( Section 2.1.1.1, “Freezing on Counter Overflow”).
During the interval of time between overflow and global disable, the counter value will wrap and
continue to collect events.
In this way, software can capture the precise number of events that occurred between the time uncore
counting was enabled and when it was disabled (or ‘frozen’) with minimal skew.
If accessible, software can continuously read the data registers without disabling event collection.
Table 2-7. U_MSR_PMON_CTR Register – Field Definitions
Field Bits
event_count 47:0 0 48-bit performance event counter
HW
Reset
Val
Description
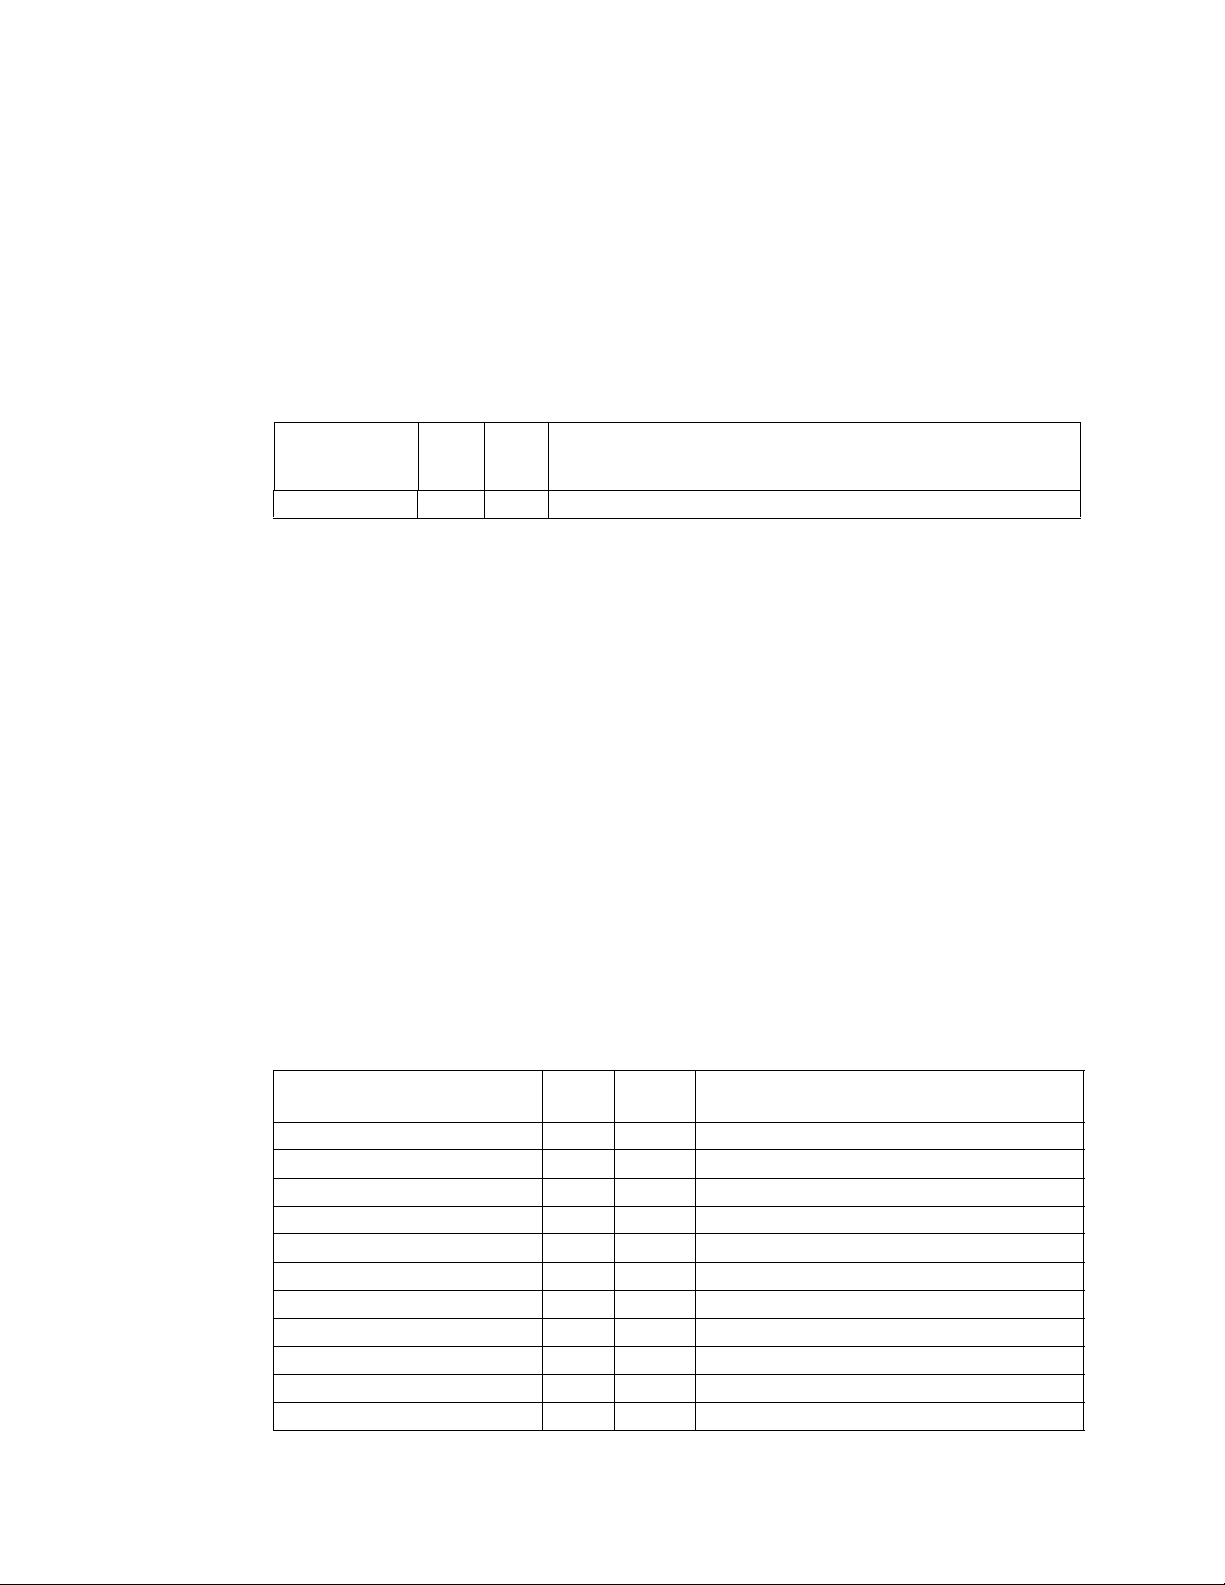
2.2.2 U-Box Performance Monitoring Events
The set of events that can be monitored in the U-Box are summarized in the following section.
- Tracks NcMsgS packets generated by the U-Box, as they arbitrate to be broadcast. They are
prioritized as follows: Special Cycle->StopReq1/StartReq2->Lock/Unlock->Remote Interrupts->Local
Interrupts.
- Errors detected and distinguished between recoverable, corrected, uncorrected and fatal.
- Number of times cores were sent IPIs or were Woken up.
- Requests to the Ring or a B-Box.
etc.
2.2.3 U-Box Events Ordered By Code
Table 2-8 summarizes the directly-measured U-Box events.
Table 2-8. Performance Monitor Events for U-Box Events
Symbol Name
BUF_VALID_LOCAL_INT 0x000 1 Local IPI Buffer is valid
BUF_VALID_REMOTE_INT 0x001 1 Remote IPI Buffer is valid
BUF_VALID_LOCK 0x002 1 Lock Buffer is valid
BUF_VALID_STST 0x003 1 Start/Stop Req Buffer is valid
BUF_VALID_SPC_CYCLES 0x004 1 SpcCyc Buffer is valid
U2R_REQUESTS 0x050 1 Number U-Box to Ring Requests
U2B_REQUEST_CYCLES 0x051 1 U to B-Box Active Request Cycles
WOKEN 0x0F8 1 Number of core woken up
IPIS_SENT 0x0F9 1 Number of core IPIs sent
RECOV 0x1DF 1 Recoverable
CORRECTED_ERR 0x1E4 1 Corrected Error
Event
Code
Max
Inc/Cyc
Description
2-6
Page 19

INTEL® XEON® PROCESSOR 7500 SERIES UNCORE PROGRAMMING GUIDE UNCORE PERFORMANCE MONITORING
Table 2-8. Performance Monitor Events for U-Box Events
Symbol Name
UNCORRECTED_ERR 0x1E5 1 Uncorrected Error
FATAL_ERR 0x1E6 1 Fatal Error
Event
Code
Max
Inc/Cyc
Description
2.2.4 U-Box Performance Monitor Event List
This section enumerates Intel Xeon Processor 7500 Series uncore performance monitoring events for
the U-Box.
BUF_VALID_LOCAL_INT
• Title: Local IPI Buffer Valid
• Category: U-Box Events
• Event Code: 0x000, Max. Inc/Cyc: 1,
• Definition: Number of cycles the Local Interrupt packet buffer contained a valid entry.
BUF_VALID_LOCK
• Title: Lock Buffer Valid
• Category: U-Box Events
• Event Code: 0x002, Max. Inc/Cyc: 1,
• Definition: Number of cycles the Lock packet buffer contained a valid entry.
BUF_VALID_REMOTE_INT
• Title: Remote IPI Buffer Valid
• Category: U-Box Events
• Event Code: 0x001, Max. Inc/Cyc: 1,
• Definition: Number of cycles the Remote IPI packet buffer contained a valid entry.
BUF_VALID_SPC_CYCLES
• Title: SpcCyc Buffer Valid
• Category: U-Box Events
• Event Code: 0x004, Max. Inc/Cyc: 1,
• Definition: Number of uncore cycles the Special Cycle packet buffer contains a valid entry. ‘Special
Cycles’ are NcMsgS packets generated by the U-Box and broadcast to internal cores to cover such
things as Shutdown, Invd_Ack and WbInvd_Ack conditions.
BUF_VALID_STST
• Title: Start/Stop Req Buffer Valid
• Category: U-Box Events
• Event Code: 0x003, Max. Inc/Cyc: 1,
• Definition: Number of uncore cycles the Start/Stop Request packet buffer contained a valid entry.
CORRECTED_ERR
• Title: Corrected Errors
• Category: U-Box Events
• Event Code: 0x1E4, Max. Inc/Cyc: 1,
• Definition: Number of corrected errors.
2-7
Page 20

INTEL® XEON® PROCESSOR 7500 SERIES UNCORE PROGRAMMING GUIDE UNCORE PERFORMANCE MONITORING
FATAL_ERR
• Title: Fatal Errors
• Category: U-Box Events
• Event Code: 0x1E6, Max. Inc/Cyc: 1,
• Definition: Number of fatal errors.
IPIS_SENT
• Title: Number Core IPIs Sent
• Category: U-Box Events
• Event Code: 0x0F9, Max. Inc/Cyc: 1,
• Definition: Number of core IPIs sent.
RECOV
• Title: Recoverable
• Category: U-Box Events
• Event Code: 0x1DF, Max. Inc/Cyc: 1,
• Definition: Number of recoverable errors.
U2R_REQUESTS
• Title: Number U2R Requests
• Category: U-Box Events
• Event Code: 0x050, Max. Inc/Cyc: 1,
• Definition: Number U-Box to Ring Requests.
U2B_REQUEST_CYCLES
• Title: U2B Active Request Cycles
• Category: U-Box Events
• Event Code: 0x051, Max. Inc/Cyc: 1,
• Definition: Number U to B-Box Active Request Cycles.
UNCORRECTED_ERR
• Title: Uncorrected Error
• Category: U-Box Events
• Event Code: 0x1E5, Max. Inc/Cyc: 1,
• Definition: Number of uncorrected errors.
WOKEN
• Title: Number Cores Woken Up
• Category: U-Box Events
• Event Code: 0x0F8, Max. Inc/Cyc: 1,
• Definition: Number of cores woken up.
2-8
Page 21

INTEL® XEON® PROCESSOR 7500 SERIES UNCORE PROGRAMMING GUIDE UNCORE PERFORMANCE MONITORING
2.3 C-Box Performance Monitoring
2.3.1 Overview of the C-Box
For the Intel Xeon Processor 7500 Series, the LLC coherence engine (C-Box) manages the interface
between the core and the last level cache (LLC). All core transactions that access the LLC are directed
from the core to a C-Box via the ring interconnect. The C-Box is responsible for managing data delivery
from the LLC to the requesting core. It is also responsible for maintaining coherence between the cores
within the socket that share the LLC; generating snoops and collecting snoop responses to the local
cores when the MESI protocol requires it.
®
The C-Box is also the gate keeper for all Intel
originate in the core and is responsible for ensuring that all Intel QuickPath Interconnect messages that
pass through the socket’s LLC remain coherent.
The Intel Xeon Processor 7500 Series contains eight instances of the C-Box, each assigned to manage a
distinct 3MB, 24-way set associative slice of the processor’s total LLC capacity. For processors with
fewer than 8 3MB LLC slices, the C-Boxes for missing slices will still be active and track ring traffic
caused by their co-located core even if they have no LLC related traffic to track (i.e. hits/misses/
snoops).
Every physical memory address in the system is uniquely associated with a single C-Box instance via a
proprietary hashing algorithm that is designed to keep the distribution of traffic across the C-Box
instances relatively uniform for a wide range of possible address patterns. This enables the individual CBox instances to operate independently, each managing its slice of the physical address space without
any C-Box in a given socket ever needing to communicate with the other C-Boxes in that same socket.
QuickPath Interconnect (Intel® QPI) messages that
Each C-Box is uniquely associated with a single S-Box. All messages which a given C-Box sends out to
the system memory or Intel QPI pass through the S-Box that is physically closest to that C-Box.
2.3.2 C-Box Performance Monitoring Overview
Each of the C-Boxes in the Intel Xeon Processor 7500 Series supports event monitoring through six 48bit wide counters (CBx_CR_C_MSR_PMON_CTR{5:0}). Each of these six counters can be programmed
to count any C-Box event. The C-Box counters can increment by a maximum of 5b per cycle.
For information on how to setup a monitoring session, refer to Section 2.1, “Global Performance
Monitoring Control”
2.3.2.1 C-Box PMU - Overflow, Freeze and Unfreeze
If an overflow is detected from a C-Box performance counter, the overflow bit is set at the box level
(C_MSR_PMON_GLOBAL_STATUS.ov), and forwarded up the chain towards the U-Box. If a C-Box0
counter overflows, a notification is sent and stored in S-Box0 (S_MSR_PMON_SUMMARY.ov_c_l) which,
in turn, sends the overflow notification up to the U-Box (U_MSR_PMON_GLOBAL_ST ATUS.ov_s0). Refer
to Table 2-26, “S_MSR_PMON_SUMMARY Register Fields” to determine how each C-Box’ s overflow bit is
accumulated in the attached S-Box.
HW can be also configured (by setting the corresponding .pmi_en to 1) to send a PMI to the U-Box
when an overflow is detected. The U-Box may be configured to freeze all uncore counting and/or send a
PMI to selected cores when it receives this signal.
Once a freeze has occurred, in order to see a new freeze, the overflow field responsible for the freeze,
must be cleared by setting the corresponding bit in C_MSR_PMON_GLOBAL_OVF_CTL.clr_ov. Assuming
all the counters have been locally enabled (.en bit in data registers meant to monitor events) and the
overflow bit(s) has been cleared, the C-Box is prepared for a new sample interval. Once the global
controls have been re-enabled (Section 2.1.4, “Enabling a New Sample Interval from Frozen
Counters”), counting will resume.
.
2-9
Page 22

INTEL® XEON® PROCESSOR 7500 SERIES UNCORE PROGRAMMING GUIDE UNCORE PERFORMANCE MONITORING
2.3.3 C-BOX Performance Monitors
Table 2-9. C-Box Performance Monitoring MSRs
MSR Name
CB7_CR_C_MSR_PMON_CTR_5 RW_RW0xDFB 64 C-Box 7 PMON Counter 5
CB7_CR_C_MSR_PMON_EVT_SEL_5 RW_RO 0xDFA 64 C-Box 7 PMON Event Select 5
CB7_CR_C_MSR_PMON_CTR_4 RW_RW0xDF964C-Box 7 PMON Counter 4
CB7_CR_C_MSR_PMON_EVT_SEL_4 RW_RO 0xDF8 64 C-Box 7 PMON Event Select 4
CB7_CR_C_MSR_PMON_CTR_3 RW_RW0xDF764C-Box 7 PMON Counter 3
CB7_CR_C_MSR_PMON_EVT_SEL_3 RW_RO 0xDF6 64 C-Box 7 PMON Event Select 3
CB7_CR_C_MSR_PMON_CTR_2 RW_RW0xDF564C-Box 7 PMON Counter 2
CB7_CR_C_MSR_PMON_EVT_SEL_2 RW_RO 0xDF4 64 C-Box 7 PMON Event Select 2
CB7_CR_C_MSR_PMON_CTR_1 RW_RW0xDF364C-Box 7 PMON Counter 1
CB7_CR_C_MSR_PMON_EVT_SEL_1 RW_RO 0xDF2 64 C-Box 7 PMON Event Select 1
CB7_CR_C_MSR_PMON_CTR_0 RW_RW0xDF164C-Box 7 PMON Counter 0
CB7_CR_C_MSR_PMON_EVT_SEL_0 RW_RO 0xDF0 64 C-Box 7 PMON Event Select 0
CB7_CR_C_MSR_PMON_GLOBAL_OVF_CTLWO_RO0xDE232C-Box 7 PMON Global Overflow Control
CB7_CR_C_MSR_PMON_GLOBAL_STATUS RW_RW0xDE132C-Box 7 PMON Global Status
Acces
MSR
Addres
s
Size
(bits
s
)
Description
CB7_CR_C_MSR_PMON_GLOBAL_CTL RW_RO 0xDE0 32 C-Box 7 PMON Global Control
CB3_CR_C_MSR_PMON_CTR_5 RW_RW0xDDB 64 C-Box 3 PMON Counter 5
CB3_CR_C_MSR_PMON_EVT_SEL_5 RW_RO 0xDDA 64 C-Box 3 PMON Event Select 5
CB3_CR_C_MSR_PMON_CTR_4 RW_RW0xDD9 64 C-Box 3 PMON Counter 4
CB3_CR_C_MSR_PMON_EVT_SEL_4 RW_RO 0xDD8 64 C-Box 3 PMON Event Select 4
CB3_CR_C_MSR_PMON_CTR_3 RW_RW0xDD7 64 C-Box 3 PMON Counter 3
CB3_CR_C_MSR_PMON_EVT_SEL_3 RW_RO 0xDD6 64 C-Box 3 PMON Event Select 3
CB3_CR_C_MSR_PMON_CTR_2 RW_RW0xDD5 64 C-Box 3 PMON Counter 2
CB3_CR_C_MSR_PMON_EVT_SEL_2 RW_RO 0xDD4 64 C-Box 3 PMON Event Select 2
CB3_CR_C_MSR_PMON_CTR_1 RW_RW0xDD3 64 C-Box 3 PMON Counter 1
CB3_CR_C_MSR_PMON_EVT_SEL_1 RW_RO 0xDD2 64 C-Box 3 PMON Event Select 1
CB3_CR_C_MSR_PMON_CTR_0 RW_RW0xDD1 64 C-Box 3 PMON Counter 0
CB3_CR_C_MSR_PMON_EVT_SEL_0 RW_RO 0xDD0 64 C-Box 3 PMON Event Select 0
CB3_CR_C_MSR_PMON_GLOBAL_OVF_CTLWO_RO0xDC232C-Box 3 PMON Global Overflow Control
CB3_CR_C_MSR_PMON_GLOBAL_STATUS RW_RW0xDC132C-Box 3 PMON Global Status
CB3_CR_C_MSR_PMON_GLOBAL_CTL RW_RO 0xDC0 32 C-Box 3 PMON Global Control
2-10
Page 23

INTEL® XEON® PROCESSOR 7500 SERIES UNCORE PROGRAMMING GUIDE UNCORE PERFORMANCE MONITORING
MSR Name
CB5_CR_C_MSR_PMON_CTR_5 RW_RW0xDBB 64 C-Box 5 PMON Counter 5
CB5_CR_C_MSR_PMON_EVT_SEL_5 RW_RO 0xDBA 64 C-Box 5 PMON Event Select 5
CB5_CR_C_MSR_PMON_CTR_4 RW_RW0xDB964C-Box 5 PMON Counter 4
CB5_CR_C_MSR_PMON_EVT_SEL_4 RW_RO 0xDB8 64 C-Box 5 PMON Event Select 4
CB5_CR_C_MSR_PMON_CTR_3 RW_RW0xDB764C-Box 5 PMON Counter 3
CB5_CR_C_MSR_PMON_EVT_SEL_3 RW_RO 0xDB6 64 C-Box 5 PMON Event Select 3
CB5_CR_C_MSR_PMON_CTR_2 RW_RW0xDB564C-Box 5 PMON Counter 2
CB5_CR_C_MSR_PMON_EVT_SEL_2 RW_RO 0xDB4 64 C-Box 5 PMON Event Select 2
CB5_CR_C_MSR_PMON_CTR_1 RW_RW0xDB364C-Box 5 PMON Counter 1
CB5_CR_C_MSR_PMON_EVT_SEL_1 RW_RO 0xDB2 64 C-Box 5 PMON Event Select 1
CB5_CR_C_MSR_PMON_CTR_0 RW_RW0xDB164C-Box 5 PMON Counter 0
CB5_CR_C_MSR_PMON_EVT_SEL_0 RW_RO 0xDB0 64 C-Box 5 PMON Event Select 0
CB5_CR_C_MSR_PMON_GLOBAL_OVF_CTLWO_RO0xDA2 32 C-Box 5 PMON Global Overflow Control
CB5_CR_C_MSR_PMON_GLOBAL_STATUS RW_RW0xDA1 32 C-Box 5 PMON Global Status
Acces
MSR
Addres
s
Size
(bits
s
)
Description
CB5_CR_C_MSR_PMON_GLOBAL_CTL RW_RO 0xDA0 32 C-Box 5 PMON Global Control
CB1_CR_C_MSR_PMON_CTR_5 RW_RW0xD9B 64 C-Box 1 PMON Counter 5
CB1_CR_C_MSR_PMON_EVT_SEL_5 RW_RO 0xD9A 64 C-Box 1 PMON Event Select 5
CB1_CR_C_MSR_PMON_CTR_4 RW_RW0xD9964C-Box 1 PMON Counter 4
CB1_CR_C_MSR_PMON_EVT_SEL_4 RW_RO 0xD98 64 C-Box 1 PMON Event Select 4
CB1_CR_C_MSR_PMON_CTR_3 RW_RW0xD9764C-Box 1 PMON Counter 3
CB1_CR_C_MSR_PMON_EVT_SEL_3 RW_RO 0xD96 64 C-Box 1 PMON Event Select 3
CB1_CR_C_MSR_PMON_CTR_2 RW_RW0xD9564C-Box 1 PMON Counter 2
CB1_CR_C_MSR_PMON_EVT_SEL_2 RW_RO 0xD94 64 C-Box 1 PMON Event Select 2
CB1_CR_C_MSR_PMON_CTR_1 RW_RW0xD9364C-Box 1 PMON Counter 1
CB1_CR_C_MSR_PMON_EVT_SEL_1 RW_RO 0xD92 64 C-Box 1 PMON Event Select 1
CB1_CR_C_MSR_PMON_CTR_0 RW_RW0xD9164C-Box 1 PMON Counter 0
CB1_CR_C_MSR_PMON_EVT_SEL_0 RW_RO 0xD90 64 C-Box 1 PMON Event Select 0
CB1_CR_C_MSR_PMON_GLOBAL_OVF_CTLWO_RO0xD8232C-Box 1 PMON Global Overflow Control
CB1_CR_C_MSR_PMON_GLOBAL_STATUS RW_RW0xD8132C-Box 1 PMON Global Status
CB1_CR_C_MSR_PMON_GLOBAL_CTL RW_RO 0xD80 32 C-Box 1 PMON Global Control
CB6_CR_C_MSR_PMON_CTR_5 RW_RW0xD7B 64 C-Box 6 PMON Counter 5
CB6_CR_C_MSR_PMON_EVT_SEL_5 RW_RO 0xD7A 64 C-Box 6 PMON Event Select 5
2-11
Page 24

INTEL® XEON® PROCESSOR 7500 SERIES UNCORE PROGRAMMING GUIDE UNCORE PERFORMANCE MONITORING
MSR Name
CB6_CR_C_MSR_PMON_CTR_4 RW_RW0xD7964C-Box 6 PMON Counter 4
CB6_CR_C_MSR_PMON_EVT_SEL_4 RW_RO 0xD78 64 C-Box 6 PMON Event Select 4
CB6_CR_C_MSR_PMON_CTR_3 RW_RW0xD7764C-Box 6 PMON Counter 3
CB6_CR_C_MSR_PMON_EVT_SEL_3 RW_RO 0xD76 64 C-Box 6 PMON Event Select 3
CB6_CR_C_MSR_PMON_CTR_2 RW_RW0xD7564C-Box 6 PMON Counter 2
CB6_CR_C_MSR_PMON_EVT_SEL_2 RW_RO 0xD74 64 C-Box 6 PMON Event Select 2
CB6_CR_C_MSR_PMON_CTR_1 RW_RW0xD7364C-Box 6 PMON Counter 1
CB6_CR_C_MSR_PMON_EVT_SEL_1 RW_RO 0xD72 64 C-Box 6 PMON Event Select 1
CB6_CR_C_MSR_PMON_CTR_0 RW_RW0xD7164C-Box 6 PMON Counter 0
CB6_CR_C_MSR_PMON_EVT_SEL_0 RW_RO 0xD70 64 C-Box 6 PMON Event Select 0
CB6_CR_C_MSR_PMON_GLOBAL_OVF_CTLWO_RO0xD6232C-Box 6 PMON Global Overflow Control
CB6_CR_C_MSR_PMON_GLOBAL_STATUS RW_RW0xD6132C-Box 6 PMON Global Status
CB6_CR_C_MSR_PMON_GLOBAL_CTL RW_RO 0xD60 32 C-Box 6 PMON Global Control
CB2_CR_C_MSR_PMON_CTR_5 RW_RW0xD5B 64 C-Box 2 PMON Counter 5
Acces
MSR
Addres
s
Size
(bits
s
)
Description
CB2_CR_C_MSR_PMON_EVT_SEL_5 RW_RO 0xD5A 64 C-Box 2 PMON Event Select 5
CB2_CR_C_MSR_PMON_CTR_4 RW_RW0xD5964C-Box 2 PMON Counter 4
CB2_CR_C_MSR_PMON_EVT_SEL_4 RW_RO 0xD58 64 C-Box 2 PMON Event Select 4
CB2_CR_C_MSR_PMON_CTR_3 RW_RW0xD5764C-Box 2 PMON Counter 3
CB2_CR_C_MSR_PMON_EVT_SEL_3 RW_RO 0xD56 64 C-Box 2 PMON Event Select 3
CB2_CR_C_MSR_PMON_CTR_2 RW_RW0xD5564C-Box 2 PMON Counter 2
CB2_CR_C_MSR_PMON_EVT_SEL_2 RW_RO 0xD54 64 C-Box 2 PMON Event Select 2
CB2_CR_C_MSR_PMON_CTR_1 RW_RW0xD5364C-Box 2 PMON Counter 1
CB2_CR_C_MSR_PMON_EVT_SEL_1 RW_RO 0xD52 64 C-Box 2 PMON Event Select 1
CB2_CR_C_MSR_PMON_CTR_0 RW_RW0xD5164C-Box 2 PMON Counter 0
CB2_CR_C_MSR_PMON_EVT_SEL_0 RW_RO 0xD50 64 C-Box 2 PMON Event Select 0
CB2_CR_C_MSR_PMON_GLOBAL_OVF_CTLWO_RO0xD4232C-Box 2 PMON Global Overflow Control
CB2_CR_C_MSR_PMON_GLOBAL_STATUS RW_RW0xD4132C-Box 2 PMON Global Status
CB2_CR_C_MSR_PMON_GLOBAL_CTL RW_RO 0xD40 32 C-Box 2 PMON Global Control
CB4_CR_C_MSR_PMON_CTR_5 RW_RW0xD3B 64 C-Box 4 PMON Counter 5
CB4_CR_C_MSR_PMON_EVT_SEL_5 RW_RO 0xD3A 64 C-Box 4 PMON Event Select 5
CB4_CR_C_MSR_PMON_CTR_4 RW_RW0xD3964C-Box 4 PMON Counter 4
CB4_CR_C_MSR_PMON_EVT_SEL_4 RW_RO 0xD38 64 C-Box 4 PMON Event Select 4
2-12
Page 25

INTEL® XEON® PROCESSOR 7500 SERIES UNCORE PROGRAMMING GUIDE UNCORE PERFORMANCE MONITORING
MSR Name
CB4_CR_C_MSR_PMON_CTR_3 RW_RW0xD3764C-Box 4 PMON Counter 3
CB4_CR_C_MSR_PMON_EVT_SEL_3 RW_RO 0xD36 64 C-Box 4 PMON Event Select 3
CB4_CR_C_MSR_PMON_CTR_2 RW_RW0xD3564C-Box 4 PMON Counter 2
CB4_CR_C_MSR_PMON_EVT_SEL_2 RW_RO 0xD34 64 C-Box 4 PMON Event Select 2
CB4_CR_C_MSR_PMON_CTR_1 RW_RW0xD3364C-Box 4 PMON Counter 1
CB4_CR_C_MSR_PMON_EVT_SEL_1 RW_RO 0xD32 64 C-Box 4 PMON Event Select 1
CB4_CR_C_MSR_PMON_CTR_0 RW_RW0xD3164C-Box 4 PMON Counter 0
CB4_CR_C_MSR_PMON_EVT_SEL_0 RW_RO 0xD30 64 C-Box 4 PMON Event Select 0
CB4_CR_C_MSR_PMON_GLOBAL_OVF_CTLWO_RO0xD2232C-Box 4 PMON Global Overflow Control
CB4_CR_C_MSR_PMON_GLOBAL_STATUS RW_RW0xD2132C-Box 4 PMON Global Status
CB4_CR_C_MSR_PMON_GLOBAL_CTL RW_RO 0xD20 32 C-Box 4 PMON Global Control
CB0_CR_C_MSR_PMON_CTR_5 RW_RW0xD1B 64 C-Box 0 PMON Counter 5
CB0_CR_C_MSR_PMON_EVT_SEL_5 RW_RO 0xD1A 64 C-Box 0 PMON Event Select 5
CB0_CR_C_MSR_PMON_CTR_4 RW_RW0xD1964C-Box 0 PMON Counter 4
Acces
MSR
Addres
s
Size
(bits
s
)
Description
CB0_CR_C_MSR_PMON_EVT_SEL_4 RW_RO 0xD18 64 C-Box 0 PMON Event Select 4
CB0_CR_C_MSR_PMON_CTR_3 RW_RW0xD1764C-Box 0 PMON Counter 3
CB0_CR_C_MSR_PMON_EVT_SEL_3 RW_RO 0xD16 64 C-Box 0 PMON Event Select 3
CB0_CR_C_MSR_PMON_CTR_2 RW_RW0xD1564C-Box 0 PMON Counter 2
CB0_CR_C_MSR_PMON_EVT_SEL_2 RW_RO 0xD14 64 C-Box 0 PMON Event Select 2
CB0_CR_C_MSR_PMON_CTR_1 RW_RW0xD1364C-Box 0 PMON Counter 1
CB0_CR_C_MSR_PMON_EVT_SEL_1 RW_RO 0xD12 64 C-Box 0 PMON Event Select 1
CB0_CR_C_MSR_PMON_CTR_0 RW_RW0xD1164C-Box 0 PMON Counter 0
CB0_CR_C_MSR_PMON_EVT_SEL_0 RW_RO 0xD10 64 C-Box 0 PMON Event Select 0
CB0_CR_C_MSR_PMON_GLOBAL_OVF_CTLWO_RO0xD0232C-Box 0 PMON Global Overflow Control
CB0_CR_C_MSR_PMON_GLOBAL_STATUS RW_RW0xD0132C-Box 0 PMON Global Status
CB0_CR_C_MSR_PMON_GLOBAL_CTL RW_RO 0xD00 32 C-Box 0 PMON Global Control
2.3.3.1 C-Box Box Level PMON state
The following registers represent the state governing all box-level PMUs in the C-Box.
The _GLOBAL_CTL register contains the bits used to enable monitoring. It is necessary to set the
.ctr_en bit to 1 before the corresponding data register can collect events.
2-13
Page 26

INTEL® XEON® PROCESSOR 7500 SERIES UNCORE PROGRAMMING GUIDE UNCORE PERFORMANCE MONITORING
If an overflow is detected from one of the C-Box PMON registers, the corresponding bit in the
_GLOBAL_STATUS.ov field will be set. To reset the overflow bits set in the _GLOBAL_STATUS.ov field, a
user must set the corresponding bits in the _GLOBAL_OVF_CTL.clr_ov field before beginning a new
sample interval.
Table 2-10. C_MSR_PMON_GLOBAL_CTL Register – Field Definitions
Field Bits
ctr_en 5:0 0 Must be set to enable each C-Box counter.
HW
Reset
Val
Description
NOTE: U-Box enable and per counter enable must also be set to fully
enable the counter.
Table 2-11. C_MSR_PMON_GLOBAL_STATUS Register – Field Definitions
Field Bits
ov 5:0 0 If an overflow is detected from the corresponding CBOX PMON register,
HW
Reset
Val
Description
it’s overflow bit will be set.
NOTE: This bit is also cleared by setting the corresponding bit in
C_MSR_PMON_GLOBAL_OVF_CTL
Table 2-12. C_MSR_PMON_GLOBAL_OVF_CTL Register – Field Definitions
Field Bits
clr_ov 5:0 0 Write ‘1’ to reset the corresponding C_MSR_PMON_GLOBAL_STATUS
HW
Reset
Val
Description
overflow bit.
2.3.3.2 C-Box PMON state - Counter/Control Pairs
The following table defines the layout of the C-Box performance monitor control registers. The main
task of these configuration registers is to select the event to be monitored by their respective data
counter. Setting the .ev_sel and .umask fields performs the event selection. The .en bit must be set to
1 to enable counting.
Additional control bits include:
- .pmi_en governs what to do if an overflow is detected.
- .threshold - since C-Box counters can increment by a value greater than 1, a threshold can be applied.
If the .threshold is set to a non-zero value, that value is compared against the incoming count for that
event in each cycle. If the incoming count is >= the threshold value, then the event count captured in
the data register will be incremented by 1.
- .invert - Changes the .threshold test condition to ‘<‘
- .edge_detect - Rather than accumulating the raw count each cycle (for events that can increment by
1 per cycle), the register can capture transitions from no event to an event incoming.
2-14
Page 27
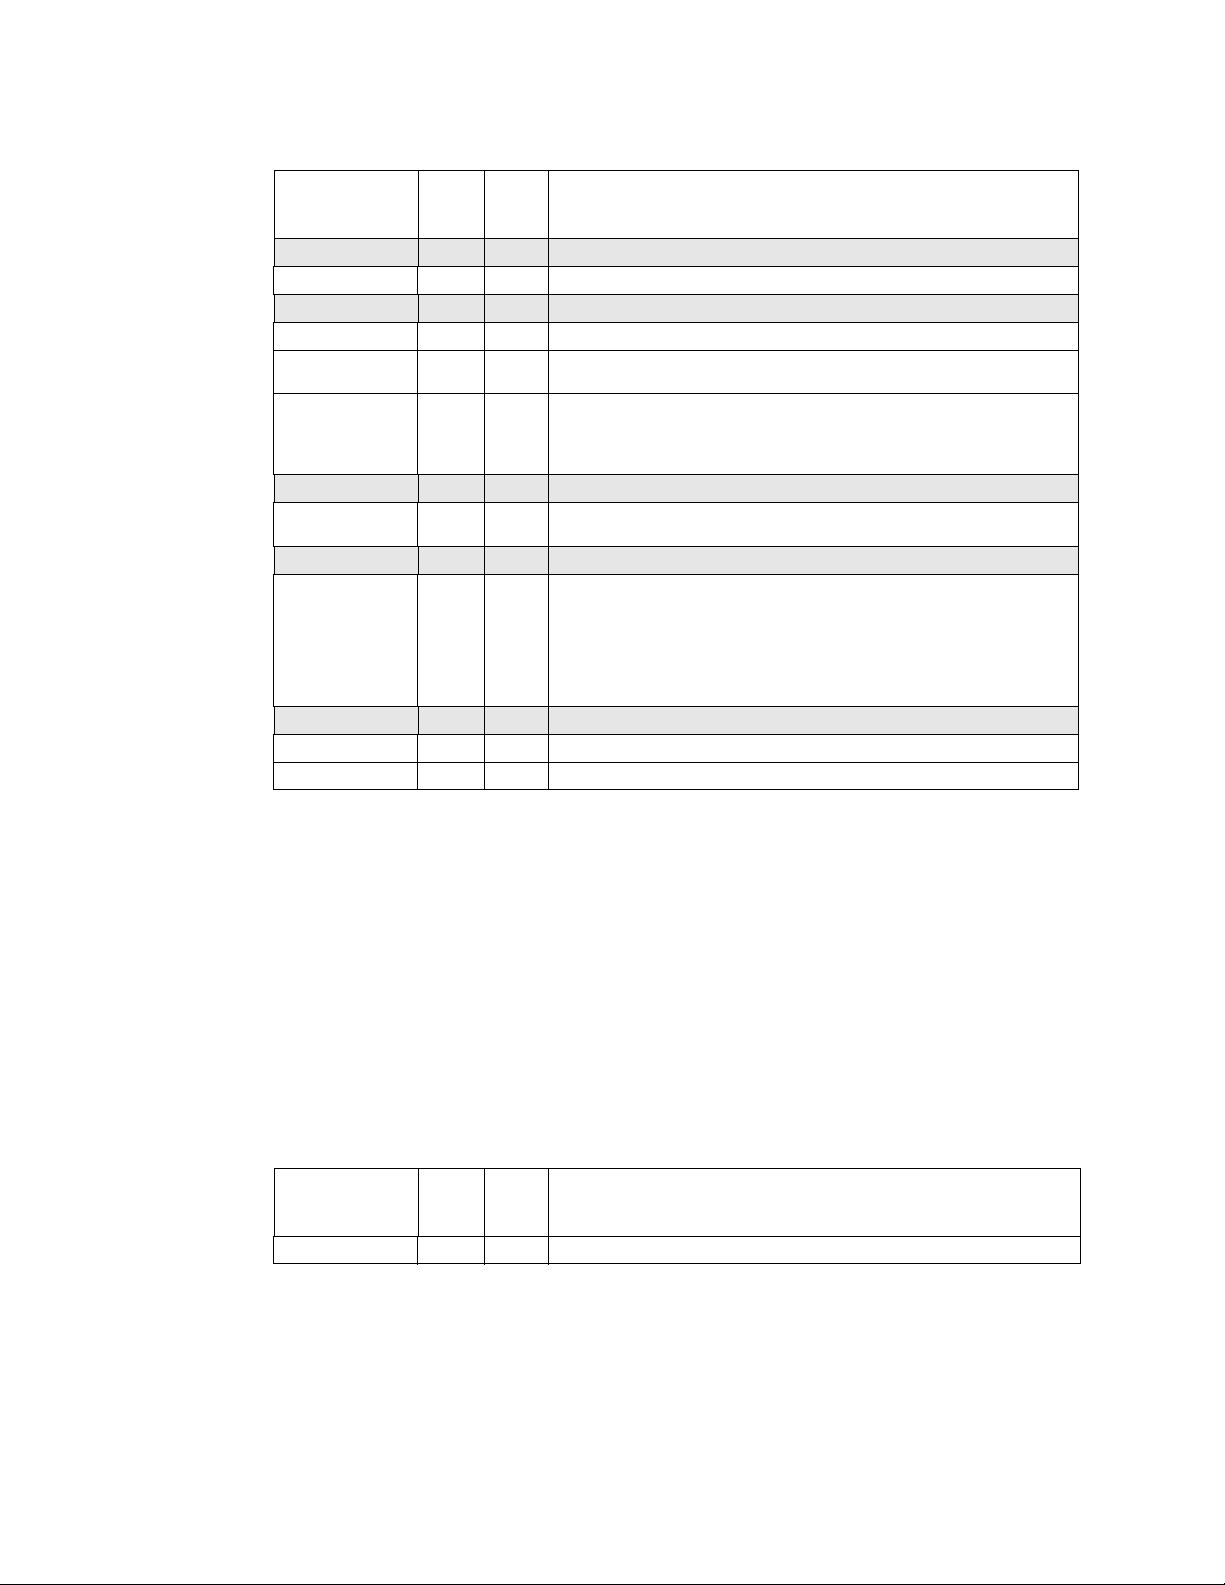
INTEL® XEON® PROCESSOR 7500 SERIES UNCORE PROGRAMMING GUIDE UNCORE PERFORMANCE MONITORING
Table 2-13. C_MSR_PMON_EVT_SEL{5-0} Register – Field Definitions
Field Bits
ig 63 0 Read zero; writes ignored. (?)
rsv 62:61 0 Reserved; Must write to 0 else behavior is undefined.
ig 60:50 0 Read zero; writes ignored. (?)
threshold 31:24 0 Threshold used in counter comparison.
invert 23 0 When 0, the comparison that will be done is threshold <= event. When
en 22 0 Local Counter Enable. When set, the associated counter is locally
ig 21 0 Read zero; writes ignored. (?)
pmi_en 20 0 When this bit is asserted and the corresponding counter overflows, a PMI
ig 19 0 Read zero; writes ignored. (?)
edge_detect 18 0 When asserted, the 0 to 1 transition edge of a 1 bit event input will cause
ig 17:16 0 Read zero; writes ignored. (?)
umask 15:8 0 Select subevents to be counted within the selected event.
ev_sel 7:0 0 Select event to be counted.
HW
Reset
Val
Description
set to 1, the comparison that is inverted (e.g. threshold < event)
enabled.
NOTE: It must also be enabled in C_MSR_PMON_GLOBAL_CTL and the
U-Box to be fully enabled.
exception is sent to the U-Box.
the corresponding counter to increment. When 0, the counter will
increment for however long the event is asserted .
NOTE: .edge_detect is in series following threshold and invert, so it can
be applied to multi-increment events that have been filtered by the
threshold field.
The C-Box performance monitor data registers are 48b wide. A counter overflow occurs when a carry
out bit from bit 47 is detected. Software can force all uncore counting to freeze after N events by
48
preloading a monitor with a count value of 2
- N and setting the control register to send a PMI to the
U-Box. Upon receipt of the PMI, the U-Box will disable counting ( Section 2.1.1.1, “Freezing on Counter
Overflow”). During the interval of time between overflow and global disable, the counter value will wr ap
and continue to collect events.
In this way, software can capture the precise number of events that occurred between the time uncore
counting was enabled and when it was disabled (or ‘frozen’) with minimal skew.
If accessible, software can continuously read the data registers without disabling event collection.
Table 2-14. C_MSR_PMON_CTR{5-0} Register – Field Definition s
Field Bits
event_count 47:0 0 48-bit performance event counter
HW
Reset
Val
Description
2-15
Page 28

INTEL® XEON® PROCESSOR 7500 SERIES UNCORE PROGRAMMING GUIDE UNCORE PERFORMANCE MONITORING
2.3.4 C-BOX Performance Monitoring Events
2.3.4.1 An Overview:
The performance monitoring events within the C-Box include all events internal to the LLC as well as
events which track ring related activity at the C-Box/Core ring stops. The only ring specific events that
are not tracked by the C-Box PMUs are those events that track ring activity at the S-Box ring stop (see
the S-Box chapter for details on those events).
C-Box performance monitoring events can be used to track LLC access rates, LLC hit/miss rates, LLC
eviction and fill rates, and to detect evidence of back pressure on the LLC pipelines. In addition, the CBox has performance monitoring events for tracking MESI state transitions that occur as a result of
data sharing across sockets in a multi-socket system. And finally, there are events in the C-Box for
tracking ring traffic at the C-Box/Core sink inject points.
Every event in the C-Box (with the exception of the P2C inject and *2P sink counts) are from the point
of view of the LLC and cannot be associated with any specific core since all cores in the socket send
their LLC transactions to all C-Boxes in the socket. The P2C inject and *2P sink counts serve as the
exception since those events are tracking ring activity at the cores’ ring inject/sink points.
There are separate sets of counters for each C-Box instance. For any event, to get an aggregate count
of that event for the entire LLC, the counts across the C-Box instances must be added together. The
counts can be averaged across the C-Box instances to get a view of the typical count of an event from
the perspective of the individual C-Boxes. Individual per-C-Box deviations from the average can be
used to identify hot-spotting across the C-Boxes or other evidences of non-uniformity in LLC behavior
across the C-Boxes. Such hot-spotting should be rare, though a repetitive polling on a fixed physical
address is one obvious example of a case where an analysis of the deviations across the C-Box es would
indicate hot-spotting.
2.3.4.2 Acronyms frequently used in C-Box Events:
The Rings:
AD (Address) Ring - Core Read/Write Requests and Intel QPI Snoops. Carries Intel QPI requests and
snoop responses from C to S-Box.
BL (Block or Data) Ring - Data == 2 transfers for 1 cache line
AK (Acknowledge) Ring - Acknowledges S-Box to C-Box and C-Box to Core. Carries snoop responses
from Core to C-Box.
IV (Invalidate) Ring - C-Box Snoop requests of core caches
Internal C-Box Queues:
IRQ - Ingress Request Queue on AD Ring. Associated with requests from core.
IPQ - Ingress Probe Queue on AD Ring. Associated with snoops from S-Box.
VIQ - Victim Queue internal to C-Box.
IDQ - Ingress Data Queue on BL Ring. For data from either Core or S-Box.
ICQ - S-Box Ingress Complete Queue on AK Ring
SRQ - Processor Snoop Response Queue on AK ring
IGQ - Ingress GO-pending (tracking GO’s to core) Queue
MAF - Miss Address File. Intel QPI ordering buffer that also tracks local coherence.
2-16
Page 29

INTEL® XEON® PROCESSOR 7500 SERIES UNCORE PROGRAMMING GUIDE UNCORE PERFORMANCE MONITORING
2.3.4.3 The Queues:
There are seven internal occupancy queue counters, each of which is 5bits wide and dedicated to its
queue: IRQ, IPQ, VIQ, MAF, RWRF, RSPF, IDF.
Note: IDQ, ICQ, SRQ and IGQ occupancies are not tracked since they are mapped 1:1 to the
MAF and, therefore, can not create back pressure.
It should be noted that, while the IRQ, IPQ, VIQ and MAF queues reside within the C-Box; the RWRF,
RSPF and IDF queues do not. Instead, they live in-between the Core and the Ring buffering messages
as those messages transit between the two. This distinction is useful in that, the queues located within
the C-Box can provide information about what is going on in the LLC with respect to the flow of
transactions at the point where they become “observed” by the coherence fabric (i.e. , where the MAF is
located). Occupancy of these buffers informs how many transactions the C-Box is tracking, and where
the bottlenecks are manifesting when the C-Box starts to get busy and/or congested.
There is no need to explicitly reset the occupancy counters in the C-Box since they are counting from
reset de-assertion.
2.3.4.4 Detecting Performance Problems in the C-Box Pipeline:
IRQ occupancy counters should be used to track if the C-Box pipeline is exerting back pressure on the
Core-request path. There is a one-to-one correspondence between the LLC requests generated by the
cores and the IRQ allocations. IPQ occupancy counters should be used to track if the C-Box pipeline is
exerting back pressure on the Intel QPI-snoop path. There is a one-to-one correspondence between the
Intel QPI snoops received by the socket, and the IPQ allocations in the C-Boxes. In both cases, if the
message is in the IRQ/IPQ then the C-Box hasn’t acknowledged it yet and the request hasn’t yet
entered the LLC’s “coherence domain”. It deallocates from the IRQ/IPQ at the moment that the C-Box
does acknowledge it. In optimal performance scenarios, where there are minimal conflicts between
transactions and loads are low enough to keep latencies relatively near to idle, IRQ and IPQ
occupancies should remain very low.
One relatively common scenario in which IRQ back pressure will be high is worth mentioning: The IRQ
will backup when software is demanding data from memory at a rate that exceeds the available
memory BW. The IRQ is designed to be the place where the extra transactions wait U-Box’s RTIDs to
become available when memory becomes saturated. IRQ back pressure becomes interesting in a
scenario where memory is not operating at or near peak sustainable BW. That can be a sign of a
performance problem that may be correctable with software tuning.
One final warning on LLC pipeline congestion: Care should be taken not to blindly sum events across CBoxes without also checking the deviation across individual C-Boxes when investigating performance
issues that are concentrated in the C-Box pipelines. Performance problems where congestion in the CBox pipelines is the cause should be rare, but if they do occur, the event counts may not be
homogeneous across the C-Boxes in the socket. The average count across the C-Boxes may be
misleading. If performance issues are found in this area it will be useful to know if they are or are not
localized to specific C-Boxes.
2.3.5 C-Box Events Ordered By Code
Table 2-15 summarizes the directly-measured C-Box events.
Table 2-15. Performance Monitor Events for C-Box Events
Symbol Name
Ring Events
BOUNCES_P2C_AD 0x01 1 Number of P2C AD bounces.
BOUNCES_C2P_AK 0x02 1 Number of C2P AK bounces.
BOUNCES_C2P_BL 0x03 1 Number of C2P BL bounces.
Event
Code
Max
Inc/Cyc
Description
2-17
Page 30

INTEL® XEON® PROCESSOR 7500 SERIES UNCORE PROGRAMMING GUIDE UNCORE PERFORMANCE MONITORING
Table 2-15. Performance Monitor Events for C-Box Events
Symbol Name
Ring Events
BOUNCES_C2P_IV 0x04 1 Number of C2P IV bounces.
SINKS_P2C 0x05 3 Number of P2C sinks.
SINKS_C2P 0x06 3 Number of C2P sinks.
SINKS_S2C 0x07 3 Number of S2C sinks.
SINKS_S2P_BL 0x08 1 Number of S2P sinks (BL only).
ARB_WINS 0x09 7 Number of ARB wins.
ARB_LOSSES 0x0A 7 Number of ARB losses.
Local Events
STARVED_EGRESS 0x0B 8 Increment on EGR queue starvation
EGRESS_BYPASS_WINS 0x0C 7 Egress Bypass Wins
INGRESS_BYPASS_WINS_AD 0x0E 1 Ingress S-Box/Non-S-Box Bypass Wins
MAF_ACK 0x10 1 MAF Acknowledges
LLC_MISSES 0x14 1 LLC Misses
LLC_HITS 0x15 1 LLC Hits
LLC_S_FILLS 0x16 1 LLC lines filled from S-Box
LLC_VICTIMS 0x17 1 LLC lines victimized
Queue Occupancy Events
OCCUPANCY_IRQ 0x18 24 IRQ Occupancy
TRANS_IRQ 0x19 1 IRQ Transactions (dealloc)
OCCUPANCY_IPQ 0x1A 8 IPQ Occupancy
TRANS_IPQ 0x1B 1 IPQ Transactions
OCCUPANCY_VIQ 0x1C 8 VIQ Occupancy
TRANS_VIQ 0x1D 1 VIQ Transactions
OCCUPANCY_MAF 0x1E 16 MAF Occupancy
TRANS_MAF 0x1F 1 MAF Transactions
OCCUPANCY_RWRF 0x20 12 RWRF Occupancy
TRANS_RWRF 0x21 1 RWRF Transactions
OCCUPANCY_RSPF 0x22 8 RSPF Occupancy
TRANS_RSPF 0x23 1 RSPF Transactions
SNPS 0x27 1 Snoops to LLC
SNP_HITS 0x28 1 Snoop Hits in LLC
Event
Code
Max
Inc/Cyc
Description
2.3.6 C-Box Performance Monitor Event List
This section enumerates Intel Xeon Processor 7500 Series uncore performance monitoring events for
the C-Box.
2-18
Page 31

INTEL® XEON® PROCESSOR 7500 SERIES UNCORE PROGRAMMING GUIDE UNCORE PERFORMANCE MONITORING
ARB_LOSSES
• Title: Arbiter Losses.
• Category: Ring - Egress
• Event Code: 0x0A, Max. Inc/Cyc: 7,
• Definition: Number of Ring arbitration losses. A loss occurs when a message injection on to the ring
fails. This could occur either because there was another message resident on the ring at that ring
stop or because the co-located ring agent issued a message onto the ring in the same cycle.
Extension
--- b00000000 (*nothing will be counted*)
AD_SB b00000001 AD ring in the direction that points toward the nearest S-Box
AD_NSB b00000010 AD ring in the direction that points away from the nearest S-Box
AD_ALL b00000011 AD ring in either direction.
AK_SB b00000100 AK ring in the direction that points toward the nearest S-Box
AK_NSB b00001000 AK ring in the direction that points away from the nearest S-Box
AK_ALL b00001100 AK ring in either direction.
BL_SB b00010000 BL ring in the direction that points toward the nearest S-Box
BL_NSB b00100000 BL ring in the direction that points away from the nearest S-Box
BL_ALL b00110000 BL ring in either direction.
IV b01000000 IV ring
ALL b01111111 All rings
umask
[15:8]
Description
ARB_WINS
• Title: Arbiter Wins
• Category: Ring - Egress
• Event Code: 0x09, Max. Inc/Cyc: 7,
• Definition: Number of Ring arbitration wins. A win is when a message was successfully injected onto
the ring.
Extension
--- b00000000 (*nothing will be counted*)
AD_SB b00000001 AD ring in the direction that points toward the nearest S-Box
AD_NSB b00000010 AD ring in the direction that points away from the nearest S-Box
AD_ALL b00000011 AD ring in either direction.
AK_SB b00000100 AK ring in the direction that points toward the nearest S-Box
AK_NSB b00001000 AK ring in the direction that points away from the nearest S-Box
AK_ALL b00001100 AK ring in either direction.
BL_SB b00010000 BL ring in the direction that points toward the nearest S-Box
BL_NSB b00100000 BL ring in the direction that points away from the nearest S-Box
BL_ALL b00110000 BL ring in either direction.
IV b01000000 IV ring
ALL b01111111 All rings
umask
[15:8]
Description
2-19
Page 32

INTEL® XEON® PROCESSOR 7500 SERIES UNCORE PROGRAMMING GUIDE UNCORE PERFORMANCE MONITORING
BOUNCES_C2P_AK
• Title: C2P AK Bounces
• Category: Ring - WIR
• Event Code: 0x02, Max. Inc/Cyc: 1,
• Definition: Number of LLC Ack responses to the core that bounced on the AK ring.
Extension
--- b00000000 (*nothing will be counted*)
SB b000000x1 Direction that points toward the nearest S-Box
NSB b0000001x Direction that points away from the nearest S-Box
ALL b00000011 Either direction
umask
[15:8]
Description
BOUNCES_C2P_BL
• Title: C2P BL Bounces
• Category: Ring - WIR
• Event Code: 0x03, Max. Inc/Cyc: 1,
• Definition: Number of LLC data responses to the core that bounced on the BL ring.
Extension
--- b00000000 (*nothing will be counted*)
SB b000000x1 Direction that points toward the nearest S-Box
NSB b0000001x Direction that points away from the nearest S-Box
ALL b00000011 Either direction
umask
[15:8]
Description
BOUNCES_C2P_IV
• Title: C2P IV Bounces
• Category: Ring - WIR
• Event Code: 0x04, Max. Inc/Cyc: 1,
• Definition: Number of C-Box snoops of a processor’s cache that bounced on the IV ring.
BOUNCES_P2C_AD
• Title: P2C AD Bounces
• Category: Ring - WIR
• Event Code: 0x01, Max. Inc/Cyc: ,
• Definition: Core request to LLC bounces on AD ring.
Extension
--- b00000000 (*nothing will be counted*)
SB b000000x1 Direction that points toward the nearest S-Box
NSB b0000001x Direction that points away from the nearest S-Box
ALL b00000011 Either direction
umask
[15:8]
Description
2-20
Page 33

INTEL® XEON® PROCESSOR 7500 SERIES UNCORE PROGRAMMING GUIDE UNCORE PERFORMANCE MONITORING
EGRESS_BYPASS_WINS
• Title: Egress Bypass Wins
• Category: Local - Egress
• Event Code: 0x0C, Max. Inc/Cyc: 7,
• Definition: Number of times a ring egress bypass was taken when a message was injected onto the
ring. The subevent field allows tracking of each available egress queue bypass path, including both 0
and 1 cycle versions.
Extension
--- b00000000 (*nothing will be counted*)
AD_BYP0 b00000001 0 cycle AD egress bypass
AD_BYP1 b00000010 1 cycle AD egress bypass
AK_BYP0 b00000100 0 cycle AK egress bypass
AK_BYP1 b00001000 1 cycle AK egress bypass
BL_BYP0 b00010000 0 cycle BL egress bypass
BL_BYP1 b00100000 1 cycle BL egress bypass
IV_BYP0 b01000000 0 cycle IV egress bypass
IV_BYP1 b10000000 1 cycle IV egress bypass
umask
[15:8]
Description
INGRESS_BYPASS_WINS_AD
• Title: Ingress S-Box/Non S-Box Bypass Wins
• Category: Local - Egress
• Event Code: 0x0E, Max. Inc/Cyc: 1,
• Definition: Number of times that a message, off the AD ring, sunk by the C-Box took one of the
ingress queue bypasses. The subevent field allows tracking of each available ingress queue bypass
path, including both 0 and 1 cycle versions.
Extension
--- b00000000 (*nothing will be counted*)
IRQ_BYP0 b00000001 0 cycle Ingress Request Queue bypass
IRQ_BYP1 b00000010 1 cycle Ingress Request Queue bypass
IPQ_BYP0 b00000100 0 cycle Ingress Probe Queue bypass
IPQ_BYP1 b00001000 1 cycle Ingress Probe Queue bypass
umask
[15:8]
Description
LLC_HITS
• Title: LLC Hits
• Category: Local - LLC
• Event Code: 0x15, Max. Inc/Cyc: 1,
• Definition: Last Level Cache Hits
• NOTE: LRU hints are included in count.
Extension
--- b00000000 (*nothing will be counted*)
M b0000xxx1 Modified
E b0000xx1x Exclusive
S b0000x1xx Shared
umask
[15:8]
Description
2-21
Page 34

INTEL® XEON® PROCESSOR 7500 SERIES UNCORE PROGRAMMING GUIDE UNCORE PERFORMANCE MONITORING
Extension
F b 00001xxx Forward (S with right to Forward on snoop)
ALL b00001111 All hits (to any cacheline state)
umask
[15:8]
LLC_MISSES
• Title: LLC Misses
• Category: Local - LLC
• Event Code: 0x14, Max. Inc/Cyc: 1,
• Definition: Last Level Cache Misses
Extension
--- b00000000 (*nothing will be counted*)
S b00000xx1 Shared - request requires S line to be upgraded (due to RFO)
F b00000x1x Forward - request requires F line to be upgraded (due to RFO)
I b000001xx Invalid - address not found
ALL b00000111 All misses
umask
[15:8]
LLC_S_FILLS
• Title: LLC S-Box Fills
• Category: Local - LLC
• Event Code: 0x16, Max. Inc/Cyc: 1,
• Definition: Last Level Cache lines filled from S-Box
Description
Description
Extension
--- b00000000 (*nothing will be counted*)
M b0000xxx1 Filled to LLC in Modified (remote socket forwarded M data without
E b0000xx1x Filled to LLC in Exclusive
S b0000x1xx Filled to LLC in Shared
F b00001xxx Filled to LLC in Forward
ALL b00001111 All fills to LLC
umask
[15:8]
LLC_VICTIMS
• Title: LLC Lines Victimized
• Category: Local - LLC
• Event Code: 0x17, Max. Inc/Cyc: 1,
• Definition: Last Level Cache lines victimized
Extension
--- b00000000 (*nothing will be counted*)
M b000xxxx1 Modified data victimized (explicit WB to memory)
E b000xxx1x Exclusive data victimized
S b000xx1xx Shared data victimized
F b000x1xxx Forward data victimized
I b0001xxxx LLC fill that occurred without victimizing any data
umask
[15:8]
Description
writing back to memory controller)
Description
2-22
Page 35

INTEL® XEON® PROCESSOR 7500 SERIES UNCORE PROGRAMMING GUIDE UNCORE PERFORMANCE MONITORING
MAF_ACK
• Title: MAF ACK
• Category: Local - MAF
• Event Code: 0x10, Max. Inc/Cyc: 1,
• Definition: Miss Address File Acknowledgements.
MAF_NACK1
• Title: MAF NACK1
• Category: Local - MAF
• Event Code: 0x11, Max. Inc/Cyc: 1,
• Definition: Rejected (not-acknowledged) LLC pipeline passes (Set 1).
Extension
--- b00000000 (*nothing will be counted*)
GO_PENDING bxxxxxxx1 A message associated with a transaction monitored by the MAF was
VIC_PENDING bxxxxxx1x An LLC fill was delayed because the victimized data in the LLC was
SNP_PENDING bxxxxx1xx A message associated with a transaction monitored by the MAF was
AC_PENDING bxxxx1xxx An incoming remote Intel QPI snoop was delayed because it conflicted
IDX_BLOCK bxxx1xxxx An incoming local core RD that missed the LLC was delayed because a
PA_BLOCK bxx1xxxxx If this count is very high, it likely means that software is frequently
IDLE_QPI bx1xxxxxx Idle Intel QPI State
ALL_MAF_NACK2 b1xxxxxxx A message was rejected when one or more of the sub-events under
TOTAL_MAF_NACKS b11111111 Total number of LLC pipeline passes that were nacked.
umask
[15:8]
Description
delayed because the transaction had a GO pen din g in th e r eq ues ting
core.
still being processed.
delayed because the transaction had a snoop pending.
with an existing MAF transaction that had an Ack Conflict pending.
victim way could not be immediately chosen.
issuing requests to the same physical addr es s from disparate threads
simultaneously . Though there will also sometimes be a s mall number
of PA_BLOCK nacks in the background due to cases when a pair of
messages associated with the same transaction happen to arrive at
the LLC at the same time and one of them gets delayed.
MAF_NACK2 was true. This is included in MAF_NACK1 so that
MAF_NACK1 with sub-event 0xFF will count the total number of
Nacks.
MAF_NACK2
• Title: MAF NACK2
• Category: Local - MAF
• Event Code: 0x12, Max. Inc/Cyc: 1,
• Definition: Rejected (not-acknowledged) LLC pipeline passes (Set 2).
Extension
--- b00000000 (*nothing will be counted*)
MAF_FULL bxxxxxxx1 An incoming local processor RD/WR or remote Intel QPI snoop
umask
[15:8]
request that required a MAF entry was delayed becau se no MAF entr y
was available.
Description
2-23
Page 36

INTEL® XEON® PROCESSOR 7500 SERIES UNCORE PROGRAMMING GUIDE UNCORE PERFORMANCE MONITORING
Extension
EGRESS_FULL bxxxxxx1x Some incoming message to the LLC that needed to generate a
VIQ_FULL bxxxxx1xx An incoming local processor RD request that missed the LLC was
NO_TRACKER_CREDITS bxxxx1xxx An incoming local processor RD or WR request w as delayed because it
NO_S_FIFO_CREDITS bxxx1xxxx Some incoming message to the LLC that needed to generate a
NO_S_REQTBL_ENTRIES bxx1xxxxx An incoming local processor Rd or WR that needed to generate a
WB_PENDING bx1xxxxxx An incoming remote Intel QPI snoop request to the LLC was delayed
NACK2_ELSE b1xxxxxxx Some incoming message to the LLC was delayed for a reason not
umask
[15:8]
Description
response message for transmission onto the ring was delayed due to
ring back pressure.
delayed because the LLC victim buffer was full.
required a Home tracker credit (for example, LLC RD Miss) and no
credit was available.
message to the S-Box was delayed due to lack of available buffering
resources in the S-Box.
transaction to Home (for example, LLC RD Miss) was delay ed because
the S-Box Request Table was full.
because it conflicted with an existing transaction that had a WB to
Home pending.
covered by any of the other MAF_NACK1 or MAF_NACK2 sub-events.
OCCUPANCY_IPQ
• Title: IPQ Occupancy
• Category: Queue Occupancy
• Event Code: 0x1A, Max. Inc/Cyc: 8,
• Definition: Cumulative count of occupancy in the LLC’s Ingress Probe Queue.
OCCUPANCY_IRQ
• Title: IRQ Occupancy
• Category: Queue Occupancy
• Event Code: 0x18, Max. Inc/Cyc: 24,
• Definition: Cumulative count of occupancy in the LLC’s Ingress Response Queue.
OCCUPANCY_MAF
• Title: MAF Occupancy
• Category: Queue Occupancy
• Event Code: 0x1E, Max. Inc/Cyc: 16,
• Definition: Cumulative count of occupancy in the LLC’s Miss Address File.
OCCUPANCY_RSPF
• Title: RSPF Occupancy
• Category: Queue Occupancy
• Event Code: 0x22, Max. Inc/Cyc: 8,
• Definition: Cumulative count of occupancy in the Snoop Response FIFO.
2-24
Page 37

INTEL® XEON® PROCESSOR 7500 SERIES UNCORE PROGRAMMING GUIDE UNCORE PERFORMANCE MONITORING
OCCUPANCY_RWRF
• Title: RWRF Occupancy
• Category: Queue Occupancy
• Event Code: 0x20, Max. Inc/Cyc: 12,
• Definition: Cumulative count of the occupancy in the Read/Write Request FIFO.
OCCUPANCY_VIQ
• Title: VIQ Occupancy
• Category: Queue Occupancy
• Event Code: 0x1C, Max. Inc/Cyc: 8,
• Definition: Cumulative count of the occupancy in the Victim Ingress Queue.
SINKS_C2P
• Title: C2P Sinks
• Category: Ring - WIR
• Event Code: 0x06, Max. Inc/Cyc: 3,
• Definition: Number of messages sunk by the processor that were sent by one of the C-Boxes.
• NOTE: Each sink represents the transfer of 32 bytes, or 2 sinks per cache line.
Extension
--- b00000000 (*nothing will be counted*)
IV b00000001 IV (C-Box snoops of a processor’s cache)
AK b00000010 AK (GO messages send to the processor)
BL b00000100 BL (LLC data sent back to processor)
umask
[15:8]
Description
SINKS_P2C
• Title: P2C Sinks
• Category: Ring - WIR
• Event Code: 0x05, Max. Inc/Cyc: 3,
• Definition: Number of messages sunk from the ring at the C-Box that were sent by one of the local
processors.
• NOTE: Each sink represents the transfer of 32 bytes, or 2 sinks per cache line.
Extension
--- b00000000 (*nothing will be counted*)
AD b00000001 AD (Core RD/WR requests to the LLC)
AK b00000010 AK (Core snoop responses to the LLC)
BL b00000100 BL (explicit and implicit WB data from the core to the LLC)
umask
[15:8]
Description
2-25
Page 38

INTEL® XEON® PROCESSOR 7500 SERIES UNCORE PROGRAMMING GUIDE UNCORE PERFORMANCE MONITORING
SINKS_S2C
• Title: S2C Sinks
• Category: Ring - WIR
• Event Code: 0x07, Max. Inc/Cyc: 3,
• Definition: Number of messages sunk from the ring at the C-Box that were sent by the S-Box.
• NOTE: Each sink represents the transfer of 32 bytes, or 2 sinks per cache line.
Extension
--- b00000000 (*nothing will be counted*)
AD b00000001 AD (Intel QPI snoop request of LLC)
AK b00000010 AK (Intel QPI completions sent to LLC)
BL b00000100 BL (Data Fills sent to the LLC in response to RD requests)
umask
[15:8]
Description
SINKS_S2P_BL
• Title: S2P Sinks
• Category: Ring - WIRa
• Event Code: 0x08, Max. Inc/Cyc: 1,
• Definition: Number BL ring messages sunk by the processor that were sent from the S-Box. This cov-
ers BL only, because that is the only kind of message the S-Box can send to a processor.
• NOTE: Each sink represents the transfer of 32 bytes, or 2 sinks per cache line.
SNP_HITS
• Title: Snoop Hits in LLC
• Category: Local - CC
• Event Code: 0x28, Max. Inc/Cyc: 1,
• Definition: Number of Intel QPI snoops that hit in the LLC according to state of LLC when the hit
occurred. GotoS: LLC Data or Code Read Snoop Hit ‘x’ state in remote cache. GotoI: LLC Data Read
for Ownership Snoop Hit ‘x’ state in remote cache.
Extension
--- b00000000 (*nothing will be counted*)
REMOTE_RD_HITM bxxxxxxx1 Intel QPI SnpData or SnpCode hit M line in LLC
REMOTE_RD_HITE bxxxxxx1x Intel QPI SnpData or SnpCode hit E line in LLC
REMOTE_RD_HITS bxxxxx1xx Intel QPI SnpData or SnpCode hit S line in LLC
REMOTE_RD_HITF bxxxx1xxx Intel QPI SnpData or SnpCode hit F line in LLC
REMOTE_RFO_HITM bxxx1xxxx Intel QPI SnpInvOwn or SnpInvItoE hit M line in LLC
REMOTE_RFO_HITE bxx1xxxxx Intel QPI SnpInvOwn or SnpInvItoE hit E line in LLC
REMOTE_RFO_HITS bx1xxxxxx Intel QPI SnpInvOwn or SnpInvItoE hit S line in LLC
REMOTE_RFO_HITF b1xxxxxxx Intel QPI SnpInvOwn or SnpInvItoE hit F line in LLC
REMOTE_HITM bxxx1xxx1 Intel QPI Snoops that hit M line in LLC
REMOTE_HITE bxx1xxx1x Intel QPI Snoops that hit E line in LLC
REMOTE_HITS bx1xxx1xx Intel QPI Snoops that hit S line in LLC
REMOTE_HITF b1xxx1xxx Intel QPI Snoops that hit F line in LLC
REMOTE_ANY b11111111 Intel QPI Snoops that hit in LLC (any line state)
umask
[15:8]
Description
2-26
Page 39

INTEL® XEON® PROCESSOR 7500 SERIES UNCORE PROGRAMMING GUIDE UNCORE PERFORMANCE MONITORING
SNPS
• Title: Snoops to LLC
• Category: Local - CC
• Event Code: 0x27, Max. Inc/Cyc: 1,
• Definition: Number of Intel QPI snoops seen by the LLC.
• NOTE: Subtract CACHE_CHAR_QUAL.ANY_HIT from this event to determine how many snoops
missed the LLC.
Extension
--- b00000000 (*nothing will be counted*)
REMOTE_RD b000000x1 Remote Read - Goto S State. Intel QPI snoops (SnpData or SnpCode)
REMOTE_RFO b0000001x Remote RFO - Goto I State. Intel QPI snoops (SnpInvOwn or
REMOTE_ANY b00000011 Intel QPI snoops to LLC that hit in the cache line
umask
[15:8]
to LLC that caused a transition to S in the cache.
NOTE: ALL SnpData and SnpCode transactions are counted. If
SnpData HITM policy is M->I, this subevent will capture those snoops.
SnpInvItoE) to LLC that caused an invalidate of a cache line.
STARVED_EGRESS
• Title: Egress Queue Starved
• Category: Local - EGR
• Event Code: 0x0B, Max. Inc/Cyc: 8,
• Definition: Number of cycles that an Egress Queue is in starvation
Extension
--- b00000000 (*nothing will be counted*)
P2C_AD_SB b00000001 Processor-to-C-Box AD Egress that injects in the direction toward the
C2S_AD_SB b00000010 C-Box-to-S-Box AD Egress.
AD_SB b00000011 Sum of AD Egresses that injects in the direction toward the nearest S-
AD_NSB b00000100 Sum across both AD Egress that inject in the direction away from the
AD b00000111 Sum across all AD Egresses
AK_SB b00001000 AK Egress that injects in the direction toward the nearest S-Box.
AK_NSB b00010000 AK Egress that injects in the direction away from the nearest S-Box.
AK b00011000 Sum across all AK Egresses.
BL_SB b00100000 BL Egress that injects in the direction toward the nearest S-Box.
BL_NSB b01000000 BL Egress that injects in the direction away from the nearest S-Box.
BL b01100000 Sum across all BL Egresses.
IV b10000000 IV Egress
umask
[15:8]
nearest S-Box
Box
nearest S-Box.
Description
Description
TRANS_IPQ
• Title: IPQ Transactions
• Category: Queue Occupancy
• Event Code: 0x1B, Max. Inc/Cyc: 1,
• Definition: Number of Intel QPI snoop probes that entered the LLC’s Ingress Probe Queue.
2-27
Page 40

INTEL® XEON® PROCESSOR 7500 SERIES UNCORE PROGRAMMING GUIDE UNCORE PERFORMANCE MONITORING
TRANS_IRQ
• Title: IRQ Transactions
• Category: Queue Occupancy
• Event Code: 0x19, Max. Inc/Cyc: 1,
• Definition: Number of processor RD and/or WR requests to the LLC that entered the Ingress
Response Queue.
TRANS_MAF
• Title: MAF Transactions
• Category: Queue Occupancy
• Event Code: 0x1F, Max. Inc/Cyc: 1,
• Definition: Number of transactions to allocate entries in LLC’s Miss Address File.
TRANS_RSPF
• Title: RSPF Transactions
• Category: Queue Occupancy
• Event Code: 0x23, Max. Inc/Cyc: 1,
• Definition: Number of snoop responses from the processor that passed through the Snoop Response
FIFO. The RSPF is a buffer that sits between each processor and the ring that buffers the processor’s
snoop responses in the event that there is back pressure due to ring congestion.
TRANS_RWRF
• Title: RWRF Transactions
• Category: Queue Occupancy
• Event Code: 0x21, Max. Inc/Cyc: 1,
• Definition: Number of requests that passed through the Read/Write Request FIFO. The RWRF is a
buffer that sits between each processor and the ring that buffers the processor’s RD/WR requests in
the event that there is back pressure due to ring congestion.
TRANS_VIQ
• Title: VIQ Transactions
• Category: Queue Occupancy
• Event Code: 0x1D, Max. Inc/Cyc: 1,
• Definition: Number of LLC victims to enter the Victim Ingress Queue. All LLC victims pass through
this queue. Including those that end up not requiring a WB.
2-28
Page 41

INTEL® XEON® PROCESSOR 7500 SERIES UNCORE PROGRAMMING GUIDE UNCORE PERFORMANCE MONITORING
2.4 B-Box Performance Monitoring
2.4.1 Overview of the B-Box
The B-Box is responsible for the protocol side of memory interactions, including coherent and noncoherent home agent protocols (as defined in the Intel® QuickPath Interconnect Specification).
Additionally, the B-Box is responsible for ordering memory reads/writes to a given address such that
the M-Box does not have to perform this conflict checking. All requests for memory attached to the
coupled M-Box must first be ordered through the B-Box.
The B-Box has additional requirements on managing interactions with the M-Box, including RAS flows.
All requests in-flight in the M-Box are tracked in the B-Box. The primary function of the B-Box, is as the
coherent home agent for the Intel
algorithm requires the B-Box to track outstanding requests, log snoop responses and other control
messages, and make certain algorithmic decisions about how to respond to requests.
The B-Box only supports source snoopy Intel QuickPath Interconnect protocol flows.
2.4.2 B-Box Performance Monitoring Overview
Each of the two B-Boxes in the Intel Xeon Processor 7500 Series supports event monitoring through
four 48-bit wide counters (BBx_CR_B_MSR_PERF_CNT{3:0}). Each of these four counters is dedicated
to observe a specific set of events as specified in its control register
(BBx_CR_B_MSR_PERF_CTL{3:0}). The B-Box counters will increment by a maximum of 1 per cycle.
®
QuickPath Interconnect cache coherence protocol. The home agent
For information on how to setup a monitoring session, refer to Section 2.1, “Global Performance
Monitoring Control”.
2.4.2.1 B-Box PMU - On Overflow and the Consequences (PMI/Freeze)
If an overflow is detected from a B-Box performance counter, the overflow bit is set at the box level
(B_MSR_PMON_GLOBAL_STATUS.ov), and forwarded up the chain towards the U-Box. If a B-Box0
counter overflows, a notification is sent and stored in S-Box0 (S_MSR_PMON_SUMMARY.ov_mb) which,
in turn, sends the overflow notification up to the U-Box (U_MSR_PMON_GLOBAL_STATUS.ov_s0). If a
B-Box1 counter overflows, the overflow bit is set on the S-Box1 side of the hierarchy.
HW can be also configured (by setting the corresponding .pmi_en to 1) to send a PMI to the U-Box
when an overflow is detected. The U-Box may be configured to freeze all uncore counting and/or send a
PMI to selected cores when it receives this signal.
Once a freeze has occurred, in order to see a new freeze, the overflow field responsible for the freeze,
found in B_MSR_PMON_GLOBAL_OVF_CTL.clr_ov, must be cleared. Assuming all the counters have
been locally enabled (.en bit in data registers meant to monitor events) and the overflow bit(s) has
been cleared, the B-Box is prepared for a new sample interval. Once the global controls have been reenabled (Section 2.1.4, “Enabling a New Sample Interval from Frozen Counters”) counting will resume.
2-29
Page 42

INTEL® XEON® PROCESSOR 7500 SERIES UNCORE PROGRAMMING GUIDE UNCORE PERFORMANCE MONITORING
2.4.3 B-BOX Performance Monitors
Table 2-16. B-Box Performance Monitoring MSRs
MSR Name Access
BB1_CR_B_MSR_MASK RW_RW 0x0E4E 64 B-Box 1 PMON Mask Register
BB1_CR_B_MSR_MATCH RW_RW 0x0E4D 64 B-Box 1 PMON Match Register
BB0_CR_B_MSR_MASK RW_RW 0x0E46 64 B-Box 0 PMON Mask Register
BB0_CR_B_MSR_MATCH RW_RW 0x0E45 64 B-Box 0 PMON Match Register
BB1_CR_B_MSR_PERF_CNT3_REG RW_RW 0x0C77 64 B-Box 1 PMON Counter 3
BB1_CR_B_MSR_PERF_CTL3_REG RW_RW 0x0C76 64 B-Box 1 PMON Event Select 3
BB1_CR_B_MSR_PERF_CNT2_REG RW_RW 0x0C75 64 B-Box 1 PMON Counter 2
BB1_CR_B_MSR_PERF_CTL2_REG RW_RW 0x0C74 64 B-Box 1 PMON Event Select 2
BB1_CR_B_MSR_PERF_CNT1_REG RW_RW 0x0C73 64 B-Box 1 PMON Counter 1
BB1_CR_B_MSR_PERF_CTL1_REG RW_RW 0x0C72 64 B-Box 1 PMON Event Select 1
BB1_CR_B_MSR_PERF_CNT0_REG RW_RW 0x0C71 64 B-Box 1 PMON Counter 0
BB1_CR_B_MSR_PERF_CTL0_REG RW_RW 0x0C70 64 B-Box 1 PMON Event Select 0
BB1_CR_C_MSR_PMON_GLOBAL_OVF_CTL RW_RW 0x0C62 32 B-Box 1 PMON Global Overflow
BB1_CR_B_MSR_PMON_GLOBAL_STATUS RW_RW 0x0C61 32 B-Box 1 PMON Global Status
BB1_CR_B_MSR_PERF_GLOBAL_CTL RW_RW 0x0C60 32 B-Box 1 PMON Global Control
BB0_CR_B_MSR_PERF_CNT3_REG RW_RW 0x0C37 64 B-Box 0 PMON Counter 3
BB0_CR_B_MSR_PERF_CTL3_REG RW_RW 0x0C36 64 B-Box 0 PMON Event Select 3
BB0_CR_B_MSR_PERF_CNT2_REG RW_RW 0x0C35 64 B-Box 0 PMON Counter 2
BB0_CR_B_MSR_PERF_CTL2_REG RW_RW 0x0C34 64 B-Box 0 PMON Event Select 2
BB0_CR_B_MSR_PERF_CNT1_REG RW_RW 0x0C33 64 B-Box 0 PMON Counter 1
BB0_CR_B_MSR_PERF_CTL1_REG RW_RW 0x0C32 64 B-Box 0 PMON Event Select 1
BB0_CR_B_MSR_PERF_CNT0_REG RW_RW 0x0C31 64 B-Box 0 PMON Counter 0
BB0_CR_B_MSR_PERF_CTL0_REG RW_RW 0x0C30 64 B-Box 0 PMON Event Select 0
BB0_CR_C_MSR_PMON_GLOBAL_OVF_CTL RW_RW 0x0C22 32 B-Box 0 PMON Global Overflow
BB0_CR_B_MSR_PMON_GLOBAL_STATUS RW_RW 0x0C21 32 B-Box 0 PMON Global Status
BB0_CR_B_MSR_PERF_GLOBAL_CTL RW_RW 0x0C20 32 B-Box 0 PMON Global Control
MSR
Address
Size
(bits)
Description
Control
Control
2.4.3.1 B-Box Box Level PMON state
The following registers represent the state governing all box-level PMUs in the B-Box.
The _GLOBAL_CTL register contains the bits used to enable monitoring. It is necessary to set the
.ctr_en bit to 1 before the corresponding data register can collect events.
If an overflow is detected from one of the B-Box PMON registers, the corresponding bit in the
_GLOBAL_STATUS.ov field will be set. To reset the overflow bits set in the _GLOBAL_STATUS.ov field, a
user must set the corresponding bits in the _GLOBAL_OVF_CTL.clr_ov field before beginning a new
sample interval.
2-30
Page 43

INTEL® XEON® PROCESSOR 7500 SERIES UNCORE PROGRAMMING GUIDE UNCORE PERFORMANCE MONITORING
Table 2-17. B_MSR_PMON_GLOBAL_CTL Register – Field Definitions
Field Bits
ctr_en 3:0 0 Must be set to enable each B-Box counter (bit 0 to enable ctr0, etc)
HW
Reset
Val
Description
NOTE: U-Box enable and per counter enable must also be set to fully
enable the counter.
Table 2-18. B_MSR_PMON_GLOBAL_STATUS Register – Field Definitions
Field Bits
ov 3:0 0 If an overflow is detected from the corresponding B-Box PMON register,
HW
Reset
Val
Description
it’s overflow bit will be set.
NOTE: This bit is also cleared by setting the corresponding bit in
B_MSR_PMON_GLOBAL_OVF_CTL
Table 2-19. B_MSR_PMON_GLOBAL_OVF_CTL Register – Field Definitions
Field Bits
clr_ov 3:0 0 Write ‘1’ to reset the corresponding B_MSR_PMON_GLOBAL_STATUS
HW
Reset
Val
Description
overflow bit.
2.4.3.2 B-Box PMON state - Counter/Control Pairs + Filters
The following table defines the layout of the B-Box performance monitor control registers. The main
task of these configuration registers is to select the event to be monitored by their respective data
counter. Setting the .ev_sel field performs the event selection. The .en bit which much be set to 1 to
enable counting.
Additional control bits include:
- .pmi_en governs what to do if an overflow is detected.
NOTE: In the B-Box, each control register can only select from a specific set of events (see Table 2-24,
“Performance Monitor Events for B-Box Events” for the mapping).
2-31
Page 44

INTEL® XEON® PROCESSOR 7500 SERIES UNCORE PROGRAMMING GUIDE UNCORE PERFORMANCE MONITORING
Table 2-20. B_MSR_PMON_EVT_SEL{3-0} Register – Field Definitions
Field Bits
ig 63 0 Read zero; writes ignored. (?)
rsv 62:61 0 Reserved; Must write to 0 else behavior is undefined.
ig 60:50 0 Read zero; writes ignored. (?)
rsv 50 0 Reserved; Must write to 0 else behavior is undefined.
ig 49:21 0 Read zero; writes ignored. (?)
pmi_en 20 0 When this bit is asserted and the corresponding counter overflows, a PMI
ig 19:6 0 Read zero; writes ignored. (?)
ev_sel 5:1 0 Select event to be counted.
en 0 0 Enable counter
HW
Reset
Val
Description
exception is sent to the U-Box.
NOTE: Event selects are NOT symmetric, each counter’s event set is
different. See event section and following tables for more details.
The B-Box performance monitor data registers are 48b wide. A counter overflow occurs when a carry
out bit from bit 47 is detected. Software can force all uncore counting to freeze after N events by
48
preloading a monitor with a count value of (2
- 1) - N and setting the control register to send a PMI to
the U-Box. Upon receipt of the PMI, the U-Box will disable counting ( Section 2.1.1.1, “Freezing on
Counter Overflow”). During the interval of time between overflow and global disable, the counter value
will wrap and continue to collect events.
In this way, software can capture the precise number of events that occurred between the time uncore
counting was enabled and when it was disabled (or ‘frozen’) with minimal skew.
If accessible, software can continuously read the data registers without disabling event collection.
Table 2-21. B_MSR_PMON_CNT{3-0} Register – Field Definition s
Field Bits
event_count 47:0 0 48-bit performance event counter
HW
Reset
Val
Description
In addition to generic event counting, each B-Box provides a MAT C H/MASK register pair that allow a
user to filter packet traffic (incoming and outgoing) according to the packet Opcode, Message Class and
Physical Address. Various events can be programmed to enable a B-Box performance counter (i.e.
OPCODE_ADDR_IN_MATCH for counter 0) to capture the filter match as an ev ent. The fields are laid out
as follows:
Note: Refer to Table 2-103, “Intel® QuickPath Interconnect Packet Message Classes” and
Table 2-104, “Opcode Match by Message Class” to determine the encodings of the B-Box
Match Register fields.
2-32
Page 45

INTEL® XEON® PROCESSOR 7500 SERIES UNCORE PROGRAMMING GUIDE UNCORE PERFORMANCE MONITORING
Table 2-22. B_MSR_MATCH_REG Register – Field Definitions
Field Bits
opc_out 59:56 0 Match to this outgoing opcode
opc_in 55:52 0 Match to this incoming opcode
msg_out 51:48 0 Mat ch to this outgoing message class
MC 12:9 0x0 Message Class
msg_in 47:44 0 Match to this incoming message class
addr 43:0 0 Match to this System Address - cache aligned address 49:6
HW
Reset
Val
Description
b0000 HOM - Requests
b0001 HOM - Responses
b0010 NDR
b0011 SNP
b0100 NCS
--b1100 NCB
--b1110 DRS
Table 2-23. B_MSR_MASK_REG Register – Field Definitions
Field Bits
opc_out 59:56 0 Mask for outgoing opcode
opc_in 55:52 0 Mask for incoming opcode
msg_out 51:48 0 Mask for outgoing message class
msg_in 47:44 0 Mask for incoming message class
addr 43:0 0 Mask this System Address - cache aligned address 49:6
HW
Reset
Val
Description
2.4.4 B-Box Performance Monitoring Events
B-box PMUs allow users to monitor a number of latency related events. Traditionally, latency related
events have been calculated by measuring the number of live transactions per cycle and accumulating
this value in one of the PMU counters. The B-box offers a different approach. A number of occupancy
counters are dedicated to track live entries in different queues and structures. Rather than directly
accumulate the occupancy values in the PMU counters, they are fed to a number of accumulators.
Overflow of these accumulator values are then fed into the main PMU counters.
2.4.4.1 On the ARBQ:
The ARBQ (arbitration queue), used to store requests that are waiting for completion or arbitrating for
resources, logically houses several smaller queues.
• COHQ0/1 (Coherence Queues) 256-entry - read request is pushed onto COHQ when it is in the
‘ready’ state (e.g. a read request that has received all of its snoop responses and is waiting for the
M-Box ACK). All snoop responses received or RspFwd* or RspWb* will result in pushing that
transaction onto the COHQ.
• NDROQ (NDR Output Queue) 256-entry - request is pushed when an NDR message has to be sent
but is blocked due to lack of credits or the output port is busy.
2-33
Page 46

INTEL® XEON® PROCESSOR 7500 SERIES UNCORE PROGRAMMING GUIDE UNCORE PERFORMANCE MONITORING
• SNPOQ (SNP Output Queue) 256-entry - request is pushed when a snoop message has to be sent
but is blocked due to lack of credits or the output port is busy.
• DRSOQ (DRS Output Queue) 32-entry - request is pushed when a DRS message has to be sent but
is blocked due to lack of credits or the output port is busy.
• MAQ (M-Box Arbitration Queue) 32-entry - Request is pushed when it asks for M-Box access and
the M-Box backpressures the B-Box (e.g. a link error flow in M-Box).
• MDRSOQ (Mirror DRS Output Queue) 32-entry - Request is pushed onto Mirror DRS output queue
when a NonSnpWrData(Ptl) needs to be sent to the mirror slave and VN1 DRS channel or Intel QPI
output resources are unavailable.
• MHOMOQ (Mirror HOM Output Queue) 256-entry - Request is pushed onto Mirror Home output
queue when a Home message needs to be sent out from mirror master to mirror slave (NonSnpWr/
RdCode/RdInvOwn) but is blocked due to a lack of credits (VN1 HOM) or the output port is busy.
2.4.4.2 On the Major B-Box Structures:
The 32-entry IMT (In Memory Table) Tracks and serializes in-flight reads and writes to the M-Box. The
IMT ensures that there is only one pending request to a given system address. (NOTE: tracks all
outstanding memory transactions that have already been sent to the M-Box.)
IMT average occupancy == (valid cnt * 32 / cycles)
IMT average latency == (valid cnt * 32 / IMT inserts)
The 256-entry TF (T r ack er File) holds all transactions that arrive in the B-Box from the time they arriv e
until they are completed and leave the B-Box. Transactions could stay in this structure much longer
than they are needed. IMT is the critical resource each transaction needs before being sent to the MBox (memory controller)
TF average occupancy == (valid cnt * 256 / cycles)
TF average latency == (valid cnt * 256 / IMT inserts)
NOTE: The latency is only valid under ‘normal’ circumstances in which a request generates a memory
prefetch. It will not hold true if the IMT is full and a prefetch isn’t generated.
2.4.4.3 On InvItoE Transactions:
TF and IMT entries are broken into four categories: writes and InvItoE transactions (reads may be
inferred by subtracting write and InvItoE transactions from all transactions) that do/do not come from
IOH agents within the system. While reads and writes should be self-explanatory, InvItoE’s may not
be.
- InvItoE - returns ownership of line to requestor (in E-state) without returning data. The Home Agent
sees it as an RFO and the memory controller sees it as memory read. The B-Box has to do more with it
than it does for regular reads. It must make sure that not only the data gets forwarded to the
requestor, but that it grants ownership to requestor. Depending on where the InvItoE re quest originates
from, the HA takes different actions - if triggered by directory agent then HA/B-Box has to generate
snoop invalidations to other caches/directories.
2.4.5 B-Box Events Ordered By Code
Table 2-24 summarizes the directly-measured B-Box events.
2-34
Page 47

INTEL® XEON® PROCESSOR 7500 SERIES UNCORE PROGRAMMING GUIDE UNCORE PERFORMANCE MONITORING
Table 2-24. Performance Monitor Events for B-Box Events
Symbol Name
Counter 0 Events
MSG_ADDR_IN_MATCH 0x01 1 Message + Address In Match
OPCODE_ADDR_IN_MATCH 0x02 1 Message + Opcode + Address In Match
MSG_OPCODE_ADDR_IN_MATCH 0x03 1 Opcode + Address In Match
TF_OCCUPANCY_ALL 0x04 1 TF Occupancy - All
TF_OCCUPANCY_WR 0x05 1 TF Occupancy - Writes
TF_OCCUPANCY_INVITOE 0x06 1 TF Occupancy - InvItoEs
IMT_VALID_OCCUPANCY 0x07 1 IMT Valid Occupancy
DRSQ_OCCUPANCY 0x09 1 DRSQ Occupancy
TF_OCCUPANCY_IOH 0x0B 1 TF Occupancy - All IOH
TF_OCCUPANCY_IOH_WR 0x0D 1 TF Occupancy - IOH Writes
TF_OCCUPANCY_IOH_INVITOE 0x0F 1 TF Occupancy - IOH InvItoEs
SNPOQ_OCCUPANCY 0x12 1 SNPOQ Occupancy
DIRQ_OCCUPANCY 0x17 1 DIRQ Occupancy
TF_OCCUPANCY_IOH_NON_INVITO
E_RD
Counter 1 Events
MSG_IN_MATCH 0x01 1 Message In Match
MSG_OUT_MATCH 0x02 1 Message Out Match
OPCODE_IN_MATCH 0x03 1 Opcode In Match
OPCODE_OUT_MATCH 0x04 1 Opcode Out Match
MSG_OPCODE_IN_MATCH 0x05 1 Message + Opcode In Match
MSG_OPCODE_OUT_MATCH 0x06 1 Message + Opcode Out Match
IMT_INSERTS_ALL 0x07 1 IMT All Inserts
DRSQ_INSERTS 0x09 1 DRSQ Inserts
IMT_INSERTS_IOH 0x0A 1 IMT IOH Inserts
IMT_INSERTS_NON_IOH 0x0B 1 IMT Non-IOH Inserts
IMT_INSERTS_WR 0x0 C 1 IMT Write Inserts
IMT_INSERTS_IOH_WR 0x0D 1 IMT IOH Write Inserts
IMT_INSERTS_NON_IOH_WR 0x0E 1 IMT Non-IOH Write Inserts
IMT_INSERTS_INVITOE 0x0F 1 IMT InvItoe Inserts
IMT_INSERTS_IOH_INVITOE 0x10 1 IMT IOH InvItoE Inserts
SNPOQ_INSERTS 0x12 1 SNPOQ Inserts
DIRQ_INSERTS 0x17 1 DIRQ Inserts
IMT_INSERTS_NON_IOH_INVITOE 0x1C 1 IMT Non-IOH InvItoE Inserts
IMT_INSERTS_RD 0x1D 1 IMT Read Inserts
IMT_INSERTS_NON_IOH_RD 0x1F 1 IMT Non-IOH Read Inserts
Counter 2 Events
MSGS_IN_NON_SNOOP 0x01 1 Incoming Non-Snoop Messages
MSGS_S_TO_B 0x02 1 SB Link (S to B) Messages
MSGS_B_TO_S 0x03 1 SB Link (B to S) Messages
ADDR_IN_MATCH 0x04 1 Address In Match
Event
Code
0x1C 1 TF Occupancy - IOH Non-InvItoE Reads
Max
Inc/Cyc
Description
2-35
Page 48

INTEL® XEON® PROCESSOR 7500 SERIES UNCORE PROGRAMMING GUIDE UNCORE PERFORMANCE MONITORING
Table 2-24. Performance Monitor Events for B-Box Events
Symbol Name
IMT_NE_CYCLES 0x07 1 IMT Non-Empty Cycles
Counter 3 Events
EARLY_ACK 0x02 1 Early ACK
IMT_PREALLOC 0x06 1 IMT Prealloc
DEMAND_FETCH 0x0F 1 Demand Fetches
IMPLICIT_WBS 0x12 1 Implicit WBs
COHQ_IMT_ALLOC_WAIT 0x13 1 COHQ IMT Allocation Wait
SBOX_VN0_UNAVAIL 0x14 1 S-Box VN0 Unavailable
RBOX_VNA_UNAVAIL 0x15 1 R-Box VNA Unavailable
IMT_FULL 0x16 1 IMT Full
CONFLICTS 0x17 1 Conflicts
ACK_BEFORE_LAST_SNP 0x19 1 Ack Before Last Snoop
Event
Code
Max
Inc/Cyc
Description
2.4.6 B-Box Performance Monitor Event List
This section enumerates Intel Xeon Processor 7500 Series uncore performance monitoring events for
the B-Box.
ACK_BEFORE_LAST_SNP
• Title: Ack Before Last Snoop
• Category: Snoops
• Event Code: 0x19, Max. Inc/Cyc: 1, PERF_CTL: 3,
• Definition: Number of times M-Box acknowledge arrives before the last snoop response. For
transactions issued to the memory controller (M-Box) as prefetches.
ADDR_IN_MATCH
• Title: Address In Match
• Category: Mask/Match
• Event Code: 0x04, Max. Inc/Cyc: 1, PERF_CTL: 2,
• Definition: Address Match at B-Box Input. Use B_MSR_MATCH/MASK_REG
CONFLICTS
• Title: Conflicts
• Category: Miscellaneous
• Event Code: 0x17, Max. Inc/Cyc: 1, PERF_CTL: 3,
• Definition: Number of conflicts.
COHQ_BYPASS
• Title: COHQ Bypass
• Category: ARB Queues
• Event Code: 0x0E, Max. Inc/Cyc: 1, PERF_CTL: 3,
• Definition: Coherence Queue Bypasses.
2-36
Page 49

INTEL® XEON® PROCESSOR 7500 SERIES UNCORE PROGRAMMING GUIDE UNCORE PERFORMANCE MONITORING
COHQ_IMT_ALLOC_WAIT
• Title: COHQ IMT Allocation Wait
• Category: ARB Queues
• Event Code: 0x13, Max. Inc/Cyc: 1, PERF_CTL: 3,
• Definition: Cycles Coherence Queue Waiting on IMT Allocation.
DIRQ_INSERTS
• Title: DIRQ Inserts
• Category: ARB Queues
• Event Code: 0x17, Max. Inc/Cyc: 1, PERF_CTL: 1,
• Definition: Directory Queue Inserts. Queue Depth is 256.
DIRQ_OCCUPANCY
• Title: DIRQ Occupancy
• Category: ARB Queues
• Event Code: 0x17, Max. Inc/Cyc: 1, PERF_CTL: 0,
• Definition: Directory Queue Occupancy. Queue Depth is 256.
DEMAND_FETCH
• Title: Demand Fetches
• Category: Miscellaneous
• Event Code: 0x0F, Max. Inc/Cyc: 1, PERF_CTL: 3,
• Definition: Counts number of times a memory access was issued after CohQ pop (i.e. IMT prefetch
was not used).
DRSQ_INSERTS
• Title: DRSQ Inserts
• Category: ARB Queues
• Event Code: 0x09, Max. Inc/Cyc: 1, PERF_CTL: 1,
• Definition: DRSQ Inserts.
DRSQ_OCCUPANCY
• Title: DRSQ Occupancy
• Category: ARB Queues
• Event Code: 0x09, Max. Inc/Cyc: 1, PERF_CTL: 0,
• Definition: DRSQ Occupancy. Queue Depth is 4.
EARLY_ACK
• Title: Early ACK
• Category: Miscellaneous
• Event Code: 0x02, Max. Inc/Cyc: 1, PERF_CTL: 3,
• Definition: M-Box Early Acknowledgements.
IMPLICIT_WBS
• Title: Implicit WBs
• Category: Miscellaneous
• Event Code: 0x12, Max. Inc/Cyc: 1, PERF_CTL: 3,
• Definition: Number of Implicit Writebacks.
2-37
Page 50

INTEL® XEON® PROCESSOR 7500 SERIES UNCORE PROGRAMMING GUIDE UNCORE PERFORMANCE MONITORING
IMT_FULL
• Title: IMT Full
• Category: In-Flight Memory Table
• Event Code: 0x16, Max. Inc/Cyc: 1, PERF_CTL: 3,
• Definition: Number of times In-Flight Memory Table was full when entry was needed by incoming
transaction.
IMT_INSERTS_ALL
• Title: IMT All Inserts
• Category: In-Flight Memory Table
• Event Code: 0x07, Max. Inc/Cyc: 1, PERF_CTL: 1,
• Definition: Inserts (all requests) to In-Flight Memory Table (e.g. all memory transactions targeting
this B-Box as their home node and processed by this B-Box)
• NOTE: Conflicts and AckConflicts are considered IMT insert events. If the conflict rate (CONFLICTS/
IMT_INSERTS_ALL * 100) is > ~5%, it is not recommended that this event (along with
IMT_VALID_OCCUPANCY) be used to derive average IMT latency or latency for specific flavors of
inserts.
IMT_INSERTS_INVITOE
• Title: IMT InvItoE Inserts
• Category: In-Flight Memory Table
• Event Code: 0x0F, Max. Inc/Cyc: 1, PERF_CTL: 1,
• Definition: In-Flight Memory Table ins erts of InvItoE requests (e.g. all InvItoE memory transactions
targeting this B-Box as their home node and processed by this B-Box)
• NOTE: Conflicts and AckConflicts are considered IMT insert events. If the conflict rate (CONFLICTS/
IMT_INSERTS_ALL * 100) is > ~5%, it is not recommended that this event (along with
IMT_VALID_OCCUPANCY) be used to derive average IMT latency or latency for specific flavors of
inserts.
IMT_INSERTS_IOH
• Title: IMT IOH Inserts
• Category: In-Flight Memory Table
• Event Code: 0x0A, Max. Inc/Cyc: 1, PERF_CTL: 1,
• Definition: In-Flight Memory Table inserts of IOH requests (e.g. all IOH triggered memory
transactions targeting this B-Box as their home node and processed by this B-Box)
• NOTE: Conflicts and AckConflicts are considered IMT insert events. If the conflict rate (CONFLICTS/
IMT_INSERTS_ALL * 100) is > ~5%, it is not recommended that this event (along with
IMT_VALID_OCCUPANCY) be used to derive average IMT latency or latency for specific flavors of
inserts.
IMT_INSERTS_IOH_INVITOE
• Title: IMT IOH InvItoE Inserts
• Category: In-Flight Memory Table
• Event Code: 0x10, Max. Inc/Cyc: 1, PERF_CTL: 1,
• Definition: In-Flight Memory Table inserts of IOH InvItoE requests (e.g. all IOH triggered InvItoE
memory transactions targeting this B-Box as their home node and processed by this B-Box)
• NOTE: Conflicts and AckConflicts are considered IMT insert events. If the conflict rate (CONFLICTS/
IMT_INSERTS_ALL * 100) is > ~5%, it is not recommended that this event (along with
IMT_VALID_OCCUPANCY) be used to derive average IMT latency or latency for specific flavors of
inserts.
2-38
Page 51

INTEL® XEON® PROCESSOR 7500 SERIES UNCORE PROGRAMMING GUIDE UNCORE PERFORMANCE MONITORING
IMT_INSERTS_IOH_WR
• Title: IMT IOH Write Inserts
• Category: In-Flight Memory Table
• Event Code: 0x0D, Max. Inc/Cyc: 1, PERF_CTL: 1,
• Definition: In-Flight Memory Table Write IOH Request Inserts (e.g. all IOH triggered memory write
transactions targeting this B-Box as their home node and processed by this B-Box)
• NOTE: Conflicts and AckConflicts are considered IMT insert events. If the conflict rate (CONFLICTS/
IMT_INSERTS_ALL * 100) is > ~5%, it is not recommended that this event (along with
IMT_VALID_OCCUPANCY) be used to derive average IMT latency or latency for specific flavors of
inserts.
IMT_INSERTS_NON_IOH
• Title: IMT Non-IOH Inserts
• Category: In-Flight Memory Table
• Event Code: 0x0B, Max. Inc/Cyc: 1, PERF_CTL: 1,
• Definition: In-Flight Memory Table inserts of Non-IOH requests (e.g. all non IOH triggered memory
transactions targeting this B-Box as their home node and processed by this B-Box)
• NOTE: Conflicts and AckConflicts are considered IMT insert events. If the conflict rate (CONFLICTS/
IMT_INSERTS_ALL * 100) is > ~5%, it is not recommended that this event (along with
IMT_VALID_OCCUPANCY) be used to derive average IMT latency or latency for specific flavors of
inserts.
IMT_INSERTS_NON_IOH_INVITOE
• Title: IMT Non-IOH InvItoE Inserts
• Category: In-Flight Memory Table
• Event Code: 0x1C, Max. Inc/Cyc: 1, PERF_CTL: 1,
• Definition: In-Flight Memory Table inserts of Non-IOH InvItoE requests (e.g. all non IOH triggered
InvItoE memory transactions targeting this B-Box as their home node and processed by this B-Box)
• NOTE: Conflicts and AckConflicts are considered IMT insert events. If the conflict rate (CONFLICTS/
IMT_INSERTS_ALL * 100) is > ~5%, it is not recommended that this event (along with
IMT_VALID_OCCUPANCY) be used to derive average IMT latency or latency for specific flavors of
inserts.
IMT_INSERTS_NON_IOH_RD
• Title: IMT Non-IOH Read Inserts
• Category: In-Flight Memory Table
• Event Code: 0x1F, Max. Inc/Cyc: 1, PERF_CTL: 1,
• Definition: In-Flight Memory Table inserts of Non-IOH read requests (e.g. all non IOH triggered
memory read transactions targeting this B-Box as their home node and processed by this B-Box)
• NOTE: Conflicts and AckConflicts are considered IMT insert events. If the conflict rate (CONFLICTS/
IMT_INSERTS_ALL * 100) is > ~5%, it is not recommended that this event (along with
IMT_VALID_OCCUPANCY) be used to derive average IMT latency or latency for specific flavors of
inserts.
IMT_INSERTS_NON_IOH_WR
• Title: IMT Non-IOH Write Inserts
• Category: In-Flight Memory Table
• Event Code: 0x0E, Max. Inc/Cyc: 1, PERF_CTL: 1,
• Definition: In-Flight Memory Table Write Non-IOH Request Inserts (e.g. all non IOH triggered
memory write transactions targeting this B-Box as their home node and processed by this B-Box)
• NOTE: Conflicts and AckConflicts are considered IMT insert events. If the conflict rate (CONFLICTS/
IMT_INSERTS_ALL * 100) is > ~5%, it is not recommended that this event (along with
IMT_VALID_OCCUPANCY) be used to derive average IMT latency or latency for specific flavors of
inserts.
2-39
Page 52

INTEL® XEON® PROCESSOR 7500 SERIES UNCORE PROGRAMMING GUIDE UNCORE PERFORMANCE MONITORING
IMT_INSERTS_RD
• Title: IMT Read Inserts
• Category: In-Flight Memory Table
• Event Code: 0x1D, Max. Inc/Cyc: 1, PERF_CTL: 1,
• Definition: In-Flight Memory Table inserts of read requests (e.g. all memory read transactions target-
ing this B-Box as their home node and processed by this B-Box)
• NOTE: Conflicts and AckConflicts are considered IMT insert events. If the conflict rate (CONFLICTS/
IMT_INSERTS_ALL * 100) is > ~5%, it is not recommended that this event (along with
IMT_VALID_OCCUPANCY) be used to derive average IMT latency or latency for specific flavors of
inserts.
IMT_INSERTS_WR
• Title: IMT Write Inserts
• Category: In-Flight Memory Table
• Event Code: 0x0C, Max. Inc/Cyc: 1, PERF_CTL: 1,
• Definition: In-Flight Memory Table Write Request Inserts (e.g. all memory write transactions
targeting this B-Box as their home node and processed by this B-Box)
• NOTE: Conflicts and AckConflicts are considered IMT insert events. If the conflict rate (CONFLICTS/
IMT_INSERTS_ALL * 100) is > ~5%, it is not recommended that this event (along with
IMT_VALID_OCCUPANCY) be used to derive average IMT latency or latency for specific flavors of
inserts.
IMT_NE_CYCLES
• Title: IMT Non-Empty Cycles
• Category: In-Flight Memory Table
• Event Code: 0x07, Max. Inc/Cyc: 1, PERF_CTL: 2,
• Definition: In-Flight Memory Table Non-Empty Cycles.
IMT_PREALLOC
• Title: IMT Prealloc
• Category: In-Flight Memory Table
• Event Code: 0x06, Max. Inc/Cyc: 1, PERF_CTL: 3,
• Definition: In-Flight Memory Table in 1 DRS preallocation mode.
IMT_VALID_OCCUPANCY
• Title: IMT Valid Occupancy
• Category: In-Flight Memory Table
• Event Code: 0x07, Max. Inc/Cyc: 1, PERF_CTL: 0,
• Definition: In-Flight Memory Table (tracks memory transactions that have already been sent to the
memory controller connected to this B-Box) valid occupancy. Indicates occupancy of the IMT.
• NOTE: A count of valid entries is accumulated every clock cycle in a subcounter. Since the IMT Queue
Depth is 32, multiple this event by 32 to get a full count of valid IMT entries.
MSG_ADDR_IN_MATCH
• Title: Message + Address In Match
• Category: Mask/Match
• Event Code: 0x01, Max. Inc/Cyc: 1, PERF_CTL: 0,
• Definition: Message Class and Address Match at B-Box Input. Use B_MSR_MATCH/MASK_REG
MSGS_B_TO_S
• Title: SB Link (B to S) Messages
• Category: S-Box Interface
• Event Code: 0x03, Max. Inc/Cyc: 1, PERF_CTL: 2,
• Definition: Number of SB Link (B to S) Messages (multiply by 9 to get flit count).
2-40
Page 53

INTEL® XEON® PROCESSOR 7500 SERIES UNCORE PROGRAMMING GUIDE UNCORE PERFORMANCE MONITORING
MSG_IN_MATCH
• Title: Message In Match
• Category: Mask/Match
• Event Code: 0x01, Max. Inc/Cyc: 1, PERF_CTL: 1,
• Definition: Message Class Match at B-Box Input. Use B_MSR_MATCH/MASK_REG
MSGS_IN_NON_SNP
• Title: Incoming Non-Snoop Messages
• Category: Snoops
• Event Code: 0x01, Max. Inc/Cyc: 1, PERF_CTL: 2,
• Definition: Incoming Non-Snoop Messages.
MSG_OPCODE_ADDR_IN_MATCH
• Title: Message + Opcode + Address In Match
• Category: Mask/Match
• Event Code: 0x03, Max. Inc/Cyc: 1, PERF_CTL: 0,
• Definition: Message Class, Opcode and Address Match at B-Box Input. Use B_MSR_MATCH/
MASK_REG
MSG_OPCODE_IN_MATCH
• Title: Message + Opcode In Match
• Category: Mask/Match
• Event Code: 0x05, Max. Inc/Cyc: 1, PERF_CTL: 1,
• Definition: Message Class and Opcode Match at B-Box Input. Use B_MSR_MATCH/MASK_REG
MSG_OPCODE_OUT_MATCH
• Title: Message + Opcode Out Match
• Category: Mask/Match
• Event Code: 0x06, Max. Inc/Cyc: 1, PERF_CTL: 1,
• Definition: Message Class and Opcode Match at B-Box Output. Use B_MSR_MATCH/MASK_REG
MSG_OUT_MATCH
• Title: Message Out Match
• Category: Mask/Match
• Event Code: 0x02, Max. Inc/Cyc: 1, PERF_CTL: 1,
• Definition: Message Class Match at B-Box Output. Use B_MSR_MATCH/MASK_REG
MSGS_S_TO_B
• Title: SB Link (S to B) Messages
• Category: S-Box Interface
• Event Code: 0x02, Max. Inc/Cyc: 1, PERF_CTL: 2,
• Definition: Number of SB Link (S to B) Messages.
OPCODE_ADDR_IN_MATCH
• Title: Opcode + Address In Match
• Category: Mask/Match
• Event Code: 0x02, Max. Inc/Cyc: 1, PERF_CTL: 0,
• Definition: Opcode and Address Match at B-Box Input. Use B_MSR_MATCH/MASK_REG
2-41
Page 54

INTEL® XEON® PROCESSOR 7500 SERIES UNCORE PROGRAMMING GUIDE UNCORE PERFORMANCE MONITORING
OPCODE_IN_MATCH
• Title: Opcode In Match
• Category: Mask/Match
• Event Code: 0x03, Max. Inc/Cyc: 1, PERF_CTL: 1,
• Definition: Opcode Match at B-Box Input. Use B_MSR_MATCH/MASK_REG
OPCODE_OUT_MATCH
• Title: Opcode Out Match
• Category: Mask/Match
• Event Code: 0x04, Max. Inc/Cyc: 1, PERF_CTL: 1,
• Definition: Opcode Match at B-Box Output. Use B_MSR_MATCH/MASK_REG
RBOX_VNA_UNAVAIL
• Title: R-Box VNA Unavailable
• Category: R-Box Interface
• Event Code: 0x15, Max. Inc/Cyc: 1, PERF_CTL: 3,
• Definition: Number of times R-Box VNA credit was not available when needed.
SBOX_VN0_UNAVAIL
• Title: S-Box VN0 Unavailable
• Category: S-Box Interface
• Event Code: 0x14, Max. Inc/Cyc: 1, PERF_CTL: 3,
• Definition: Number of times S-Box VN0 credit was not available when needed.
SNPOQ_INSERTS
• Title: SNPOQ Inserts
• Category: ARB Queues
• Event Code: 0x12, Max. Inc/Cyc: 1, PERF_CTL: 1,
• Definition: SNP Output Queue Inserts. Queue Depth is 256.
SNPOQ_OCCUPANCY
• Title: SNPOQ Occupancy
• Category: ARB Queues
• Event Code: 0x12, Max. Inc/Cyc: 1, PERF_CTL: 0,
• Definition: SNP Output Queue Occupancy. Queue Depth is 256.
TF_ALL
• Title: TF Occupancy - All
• Category: Tracker File
• Event Code: 0x04, Max. Inc/Cyc: 1, PERF_CTL: 0,
• Definition: Tracker File occupancy for all requests. Accumulates lifetimes of all memory transactions
that have arrived in this B-Box (TF starts tracking transactions before they are sent to the M-Box).
• NOTE: This event captures overflows from a subcounter tracking all requests. Multiply by 256 to
determine the correct count.
2-42
Page 55

INTEL® XEON® PROCESSOR 7500 SERIES UNCORE PROGRAMMING GUIDE UNCORE PERFORMANCE MONITORING
TF_INVITOE
• Title: TF Occupancy - InvItoEs
• Category: Tracker File
• Event Code: 0x06, Max. Inc/Cyc: 1, PERF_CTL: 0,
• Definition: Tracker File occupancy for InvItoE requests. Accumulates lifetimes of InvItoE memory
transactions that have arrived in this B-Box (TF starts tracking transactions before they are sent to the
M-Box).
• NOTE: This event captures overflows from a subcounter tracking all requests. Multiply by 256 to
determine the correct count.
TF_IOH
• Title: TF Occupancy - All IOH
• Category: Tracker File
• Event Code: 0x0B, Max. Inc/Cyc: 1, PERF_CTL: 0,
• Definition: Tracker File occupancy for IOH requests. Accumulates lifetimes of IOH triggered memory
transactions that have arrived in this B-Box (TF starts tracking transactions before they are sent to the
M-Box).
• NOTE: This event captures overflows from a subcounter tracking all requests. Multiply by 256 to
determine the correct count.
TF_IOH_INVITOE
• Title: TF Occupancy - IOH InvItoEs
• Category: Tracker File
• Event Code: 0x0F, Max. Inc/Cyc: 1, PERF_CTL: 0,
• Definition: Tracker File occupancy for IOH InvItoE requests. Accumulates lifetimes of IOH triggered
InvItoE memory transactions that have arrived in this B-Box (TF starts tracking transactions before
they are sent to the M-Box).
• NOTE: This event captures overflows from a subcounter tracking all requests. Multiply by 256 to
determine the correct count.
TF_IOH_NON_INVITOE_RD
• Title: TF Occupancy - IOH Non-InvItoE Reads
• Category: Tracker File
• Event Code: 0x1C, Max. Inc/Cyc: 1, PERF_CTL: 0,
• Definition: Tracker File occupancy for IOH Non-InvItoE read requests. Accumulates lifetimes of IOH
triggered non-InvItoE memory transactions that have arrived in this B-Box (TF starts tracking
transactions before they are sent to the M-Box).
• NOTE: This event captures overflows from a subcounter tracking all requests. Multiply by 256 to
determine the correct count.
TF_IOH_WR
• Title: TF Occupancy - IOH Writes
• Category: Tracker File
• Event Code: 0x0D, Max. Inc/Cyc: 1, PERF_CTL: 0,
• Definition: Tracker File occupancy for IOH write requests. Accumulates lifetimes of IOH triggered
write transactions that have arrived in this B-Box (TF starts tracking transactions before they are sent
to the M-Box).
• NOTE: This event captures overflows from a subcounter tracking all requests. Multiply by 256 to
determine the correct count.
2-43
Page 56

INTEL® XEON® PROCESSOR 7500 SERIES UNCORE PROGRAMMING GUIDE UNCORE PERFORMANCE MONITORING
TF_WR
• Title: TF Occupancy - Writes
• Category: Tracker File
• Event Code: 0x05, Max. Inc/Cyc: 1, PERF_CTL: 0,
• Definition: Tracker File occupancy for write requests. Accumulates lifetimes of write memory
transactions that have arrived in this B-Box (TF starts tracking transactions before they are sent to the
M-Box).
• NOTE: This event captures overflows from a subcounter tracking all requests. Multiply by 256 to
determine the correct count.
2-44
Page 57

INTEL® XEON® PROCESSOR 7500 SERIES UNCORE PROGRAMMING GUIDE UNCORE PERFORMANCE MONITORING
2.5 S-Box Performance Monitoring
2.5.1 Overview of the S-Box
The S-Box represents the interface between the last level cache and the system interface. It manages
flow control between the C and R & B-Boxes. The S-Box is broken into system bound (ring to Intel QPI)
and ring bound (Intel QPI to ring) connections.
As such, it shares responsibility with the C-Box(es) as the Intel QPI caching agent(s). It is responsible
for converting C-box requests to Intel QPI messages (i.e. snoop generation and data response
messages from the snoop response) as well as converting/forwarding ring messages to Intel QPI
packets and vice versa.
2.5.2 S-Box Performance Monitoring Overview
Each S-Box in the Intel Xeon Processor 7500 Series supports event monitoring through 4 48b wide
counters (S_MSR_PMON_CTR/CTL{3:0}). Each of these four counters can be programmed to count any
S-Box event. the S-Box counters can increment by a maximum of 64 per cycle.
The S-Box also includes a mask/match register that allows a user to match packets leaving the S-Box
according to various standard packet fields such as message class, opcode, etc. (NOTE: specifically
goes with event 0, does not effect other events)
For information on how to setup a monitoring session, refer to Section 2.1, “Global Performance
Monitoring Control”
.
2.5.2.1 S-Box PMU - Overflow, Freeze and Unfreeze
If an overflow is detected from a S-Box performance counter, the overflow bit is set at the box level
(S_MSR_PMON_GLOBAL_STATUS.ov), and forwarded up the chain to the U-Box where it will be stored
in U_MSR_PMON_GLOBAL_STA TUS .ov_s0. Each S-Box collects overflow bits for all boxes on it’ s ‘side’ of
the chip. Refer to Table 2-26, “S_MSR_PMON_SUMMARY Register Fields” to determine how these bits
are accumulated before they are forwarded to the U-Box.
HW can be also configured (by setting the corresponding .pmi_en to 1) to send a PMI to the U-Box
when an overflow is detected. The U-Box may be configured to freeze all uncore counting and/or send a
PMI to selected cores when it receives this signal.
Once a freeze has occurred, in order to see a new freeze, the overflow field responsible for the freeze,
must be cleared by setting the corresponding bit in S_MSR_PMON_GLOBAL_OVF_CTL.clr_ov . Assuming
all the counters have been locally enabled (.en bit in data registers meant to monitor events) and the
overflow bit(s) has been cleared, the S-Box is prepared for a new sample interval. Once the global
controls have been re-enabled (Section 2.1.4, “Enabling a New Sample Interval from Frozen
Counters”), counting will resume.
Note: Due to the nature of the subcounters used in the S-Box, if a queue occupancy count
event is set up to be captured, SW should set .reset_occ_cnt in the same write that the
corresponding control register is enabled.
2.5.3 S-BOX Performance Monitors
Table 2-25. S-Box Performance Monitoring MSRs
MSR Name Access
SS1_CR_S_MSR_MASK RW_RO 0x0E5A 64 S-Box 1 Enable Mask Register
SS1_CR_S_MSR_MATCH RW_RO 0x0E59 64 S-Box 1 Enable Match Register
SS1_CR_S_MSR_MM_CFG RW_NA 0x0E58 64 S-Box 1 Enable Match/Mask Config
MSR
Address
Size
(bits)
Description
2-45
Page 58

INTEL® XEON® PROCESSOR 7500 SERIES UNCORE PROGRAMMING GUIDE UNCORE PERFORMANCE MONITORING
MSR Name Access
SS0_CR_S_MSR_MASK RW_RO 0x0E4A 64 S-Box 0 Enable Mask Register
SS0_CR_S_MSR_MATCH RW_RO 0x0E49 64 S-Box 0 Enable Match Register
SS0_CR_S_MSR_MM_CFG RW_NA 0x0E48 64 S-Box 0 Enable Match/Mask Config
SR1_CR_S_MSR_PMON_CTR3 RW_RW 0x0CD7 64 S-Box 1 PMON Counter 3
SR1_CR_S_MSR_PMON_CTL3 RW_RO 0x0CD6 64 S-Box 1 PMON Control 3
SR1_CR_S_MSR_PMON_CTR2 RW_RW 0x0CD5 64 S-Box 1 PMON Counter 2
SR1_CR_S_MSR_PMON_CTL2 RW_RO 0x0CD4 64 S-Box 1 PMON Control 2
SR1_CR_S_MSR_PMON_CTR1 RW_RW 0x0CD3 64 S-Box 1 PMON Counter 1
SR1_CR_S_MSR_PMON_CTL1 RW_RO 0x0CD2 64 S-Box 1 PMON Control 1
SR1_CR_S_MSR_PMON_CTR0 RW_RW 0x0CD1 64 S-Box 1 PMON Counter 0
SR1_CR_S_MSR_PMON_CTL0 RW_RO 0x0CD0 64 S-Box 1 PMON Control 0
SR1_CR_S_MSR_PMON_SUMMARY RO_WO 0x0CC3 32 S-Box 1 PMON Global Summary
SR1_CR_S_MSR_PMON_OVF_CTL WO_RO 0x0CC2 32 S-Box 1 PMON Global Overflow
SR1_CR_S_MSR_PMON_GLOBAL_STATUS RW_RW 0x0CC1 32 S-Box 1 PMON Global Overflow
SR1_CR_S_MSR_PMON_GLOBAL_CTL RW_RO 0x0CC0 32 S-Box 1 PMON Global Control
MSR
Address
Size
(bits)
Description
Control
Status
SR0_CR_S_MSR_PMON_CTR3 RW_RW 0x0C57 64 S-Box 0 PMON Counter 3
SR0_CR_S_MSR_PMON_CTL3 RW_RO 0x0C56 64 S-Box 0 PMON Control 3
SR0_CR_S_MSR_PMON_CTR2 RW_RW 0x0C55 64 S-Box 0 PMON Counter 2
SR0_CR_S_MSR_PMON_CTL2 RW_RO 0x0C54 64 S-Box 0 PMON Control 2
SR0_CR_S_MSR_PMON_CTR1 RW_RW 0x0C53 64 S-Box 0 PMON Counter 1
SR0_CR_S_MSR_PMON_CTL1 RW_RO 0x0C52 64 S-Box 0 PMON Control 1
SR0_CR_S_MSR_PMON_CTR0 RW_RW 0x0C51 64 S-Box 0 PMON Counter 0
SR0_CR_S_MSR_PMON_CTL0 RW_RO 0x0C50 64 S-Box 0 PMON Control 0
SR0_CR_S_MSR_PMON_SUMMARY RO_WO 0x0C43 32 S-Box 0 PMON Global Summary
SR0_CR_S_MSR_PMON_OVF_CTL WO_RO 0x0C42 32 S-Box 0 PMON Global Overflow
SR0_CR_S_MSR_PMON_GLOBAL_STATUS RW_RW 0x0C41 32 S-Box 0 PMON Global Overflow
SR0_CR_S_MSR_PMON_GLOBAL_CTL RW_RO 0x0C40 32 S-Box 0 PMON Global Control
Control
Status
2.5.3.1 S-Box PMON for Global State
The S_MSR_PMON_SUMMARY in each S-Box collects overflow bits from the boxes attached to it and
forwards them to the U-Box.
2-46
Page 59

INTEL® XEON® PROCESSOR 7500 SERIES UNCORE PROGRAMMING GUIDE UNCORE PERFORMANCE MONITORING
Table 2-26. S_MSR_PMON_SUMMARY Register Fields
Field Bits
ig 63:20 Read zero; writes ignored.
ov_r 19 0 Overflow in R Box
ov_s 18 0 Overflow in S Box
ig 17 Read zero; writes ignored.
ov_mb 16 0 Overflow in M- or B-Box
ig 15:3 Read zero; writes ignored.
ov_c_l 2 0 Overflow in ‘left’ C-Boxes
ig 1 Read zero; writes ignored.
ov_c_r 0 0 Overflow in ‘right’ C-Boxes
HW
Reset
Val
Description
In S-Box0, indicates overflow from Left R-Box
In S-Box1, indicates overflow from Right R-Box
In SBOX0, indicates overflow in C-Box 0 or 1.
In SBOX1, indicates overflow in C-Box 4 or 5.
In SBOX0, indicates overflow in C-Box 2 or 3.
In SBOX1, indicates overflow in C-Box 6 or 7.
2.5.3.2 S-Box Box Level PMON state
The following registers represent the state governing all box-level PMUs in the S-Box.
The _GLOBAL_CTL register contains the bits used to enable monitoring. It is necessary to set the
.ctr_en bit to 1 before the corresponding data register can collect events.
If an overflow is detected from one of the S-Box PMON registers, the corresponding bit in the
_GLOBAL_STATUS.ov field will be set. To reset the overflow bits set in the _GLOBAL_STATUS.ov field, a
user must set the corresponding bits in the _GLOBAL_OVF_CTL.clr_ov field before beginning a new
sample interval.
Table 2-27. S_CSR_PMON_GLOBAL_CTL Register Fields
Field Bits
ctr_en 3:0 0 Must be set to enable each SBOX counter (bit 0 to enable ctr0, etc)
HW
Reset
Val
Description
NOTE: U-Box enable and per counter enable must also be set to fully
enable the counter.
Table 2-28. S_MSR_PMON_GLOBAL_STATUS Register Fields
Field Bits
ov 3:0 0 If an overflow is detected from the corresponding SBOX PMON register,
HW
Reset
Val
Description
it’s overflow bit will be set.
2-47
Page 60

INTEL® XEON® PROCESSOR 7500 SERIES UNCORE PROGRAMMING GUIDE UNCORE PERFORMANCE MONITORING
Table 2-29. S_MSR_PMON_OVF_CTRL Register Fields
Field Bits
clr_ov 3:0 0 Writing ‘1’ to bit in filed causes corresponding bit in ‘Overflow PerfMon
HW
Reset
Val
Description
Counter’ field in S_CSR_PMON_GLOBAL_ST A TUS r egister to be cleared t o
0.
2.5.3.3 S-Box PMON state - Counter/Control Pairs + Filters
The following table defines the layout of the S-Box performance monitor control registers. The main
task of these configuration registers is to select the event to be monitored by their respective data
counter. Setting the .ev_sel field performs the event selection. The .en bit must be set to 1 to enable
counting.
Additional control bits include:
- .pmi_en governs what to do if an overflow is detected.
- .threshold - If the .threshold is set to a non-zero value, that value is compared against the incoming
count for that event in each cycle. If the incoming count is >= the threshold value, then the event
count captured in the data register will be incremented by 1.
- .invert - Changes the .threshold test condition to ‘<‘
- .edge_detect - Rather than accumulating the raw count each cycle (for events that can increment by
1 per cycle), the register can capture transitions from no event to an event incoming.
- .reset_occ_cnt - Reset 7b occupancy counter associated with this counter.
Table 2-30. S_CSR_PMON_CTL{3-0} Register – Field Definitions
Field Bits
ig 63 0 Read zero; writes ignored. (?)
rsv 62:61 0 Reserved; Must write to 0 else behavior is undefined.
ig 60:32 0 Read zero; writes ignored. (?)
threshold 31:24 0 Threshold used for counter comparison.
invert 23 0 Invert threshold comparison. When ‘0’, the comparison will be thresh >=
enable 22 0 Enable counter.
ig 21 0 Read zero; writes ignored. (?)
pmi_en 20 0 PMI Enable. If bit is set, when corresponding counter overflows, a PMI
ig 19 0 Read zero; writes ignored. (?)
edge_detect 18 0 Edge Detect. When bit is set, 0->1 transition of a one bit event input will
reset_occ_cnt 17 0 Reset Occupancy Counter associated with this counter.
ig 16 0 Read zero; writes ignored. (?)
umask 15:8 0 Unit Mask - select subevent of event.
ev_sel 7:0 0 Event Select
HW
Reset
Val
Description
event. When ‘1’, the comparison will be threshold < event.
exception is sent to the U-Box.w
cause counter to increment. When bit is 0, counter will increment for
however long event is asserted.
2-48
Page 61

INTEL® XEON® PROCESSOR 7500 SERIES UNCORE PROGRAMMING GUIDE UNCORE PERFORMANCE MONITORING
The S-Box performance monitor data registers are 48b wide. A counter overflow occurs when a carry
out bit from bit 47 is detected. Software can force all uncore counting to freeze after N events by
48
preloading a monitor with a count value of (2
- 1) - N and setting the control register to send a PMI to
the U-Box. Upon receipt of the PMI, the U-Box will disable counting ( Section 2.1.1.1, “Freezing on
Counter Overflow”). During the interval of time between overflow and global disable, the counter value
will wrap and continue to collect events.
In this way, software can capture the precise number of events that occurred between the time uncore
counting was enabled and when it was disabled (or ‘frozen’) with minimal skew.
If accessible, software can continuously read the data registers without disabling event collection.
Table 2-31. S_CSR_PMON_CTR{3-0} Register – Field Definitions
Field Bits
event_count 47:0 0 48-bit performance event counter
HW
Reset
Val
Description
2.5.3.4 S-Box Registers for Mask/Match Facility
In addition to generic event counting, each S-Box provides a MATCH/MASK register pair that allows a
user to filter outgoing packet traffic (system bound) according to the packet Opcode, Message Class,
Response, HNID and Physical Address. Program the selected S-Box counter to capture TO_R_PROG_EV
to capture the filter match as an event.
To use the match/mask facility :
a) Set MM_CFG (see Table 2-32, “S_MSR_MM_CFG Register – Field Definitions”) reg bit 63 to 0.
b) Program match/mask regs (see Ta ble 2-33, “S_MSR_MATCH Register – Field Definitions”). (if
MM_CFG[63] == 1, a write to match/mask will produce a GP fault).
NOTE: The address and the Home Node ID have a mask component in the MASK register. To mask off
other fields (e.g. opcode or message class), set the field to all 0s.
c) Set the counter’s control register event select to 0x0 (TO_R_PROG_EV) to capture the mask/match
as a performance event.
d) Set MM_CFG reg bit 63 to 1 to start matching.
Table 2-32. S_MSR_MM_CFG Register – Field Definitions
Field Bits
mm_en 63 0 Enable Match/Mask
ig 62:0 Read zero; writes ignored.
HW
Reset
Val
Description
2-49
Page 62

INTEL® XEON® PROCESSOR 7500 SERIES UNCORE PROGRAMMING GUIDE UNCORE PERFORMANCE MONITORING
Table 2-33. S_MSR_MATCH Register – Field Definitions
Field Bits
resp 63:59 0 Match if returning data is in
opc 58:48 0 Match on Opcode (see Table 2-34, “S_MSR_MATCH.opc - Opcode Match
mc 47:43 0 Match on Message Class
addr 42:5 0 Match on PA address bits [43:6]
hnid 4:0 0 Match on Home NodeID
HW
Reset
Val
Description
b1xxxx - ‘F’ state.
bx1xxx - ‘S’ state
bxx1xx - ‘E’ state.
bxxx1x - ‘M’ state.
bxxxx1 - ‘I’ state.
NOTE: Response matching is only done o n th e DRS re spo nse to a HOM0
RdCode, RdData or RdInvOwn request.
NOTE: Match will be ignored if field set to all 0s.
by Message Class”)
NOTE: Match will be ignored if field set to all 0s.
b1xxxx - NCB
bx1xxx - NCS
bxx1xx - NDR
bxxx1x - HOM1
bxxxx1 - HOM0
NOTE: Match will be ignored if field set to all 0s.
Refer to Table 2-105, “Opcodes (Alphabetical Listing)” for definitions of the opcodes found in the
following table.
Table 2-34. S_MSR_MATCH.opc - Opcode Match by Message Class
bit NCB NCS NDR HOM1 HOM0
58 --- NcMsgS --- --- --57 --- NcIOWr --- --- --56 DebugData --- --- RspSWb --55 WcWrPtl NcCfgWr --- RspIWb AckCnflt
54 NcWrPtl NcIORd --- RspFwdSWb WbMtoE
53 IntPriorUpd --- --- RspFwdIWb WbMtoI
52 IntPhysical NcCfgRd --- RspFwdS AckCnfltWbI
51 IntLogical NcRdPtl --- RspFwdI InvItoE
50 NcMsgB FERR --- RspCnflt RdInvOwn
49 WcWr IntAck CmpD RspS RdData
48 NcWr NcRd Cmp RspI RdCode
2-50
Page 63

INTEL® XEON® PROCESSOR 7500 SERIES UNCORE PROGRAMMING GUIDE UNCORE PERFORMANCE MONITORING
Table 2-35. S_MSR_MASK Register – Field Definitions
Field Bits
ig 62:39 Read zero; writes ignored.
addr 38:1 0 Mask PA address bits [43:6].
hnid 0 0 Disable HNID matching.
HW
Reset
Val
Description
For each mask bit that is set, the corresponding bit in the address is
already considered matched (e.g. it is ignored). If it is clear the it must
match the corresponding address match bit in the S_MSR_MATCH
register.
1 - HNID is NOT matched
0 - HNID is compared against the match
2.5.4 S-BOX Performance Monitoring Events
2.5.4.1 An Overview
The S-Box provides events to track incoming (ring bound)/outgoing (system bound) transactions,
various queue occupancies/latencies that track those transactions and a variety of static events such as
bypass use (i.e. EGRESS_BYPASS) and when output credit is unavailable (i.e. NO_CREDIT_SNP). Many
of these events can be further broken down by message class.
2.5.4.2 On Queue Occupancy Usage
This means two things:
a) none of the physical queues receive more than one entry per cycle
b) The entire 7b from the ‘selected’ (by the event select) queue occ subcounter is sent to the generic
counter each cycle, meaning that the max inc of a generic counter is 64 (for the sys bound HOM
buffer).
Associated with each of the four general purpose counters is a 7b queue occupancy counter which
supports the various queue occupancy events found in Section 2.5.5, “S-Box Events Ordered By Code”.
Each System Bound and Ring Bound data storage structure within the S-Box (queue/FIFO/buffer) has
an associated tally counter which can be used to provide input into one of the S-Box performance
counters. The data structure the tally counter is ‘attached’ to then sends increment/decrement signals
as it receives/removes new entries. The tally counter then sends its contents to the performance
counter each cycle.
The following table summarizes the queues (and their associated events) responsible for buffering
traffic into and out of the S-Box.
2-51
Page 64

INTEL® XEON® PROCESSOR 7500 SERIES UNCORE PROGRAMMING GUIDE UNCORE PERFORMANCE MONITORING
Table 2-36. S-Box Data Structure Occupancy Events
Structure/Event Name Subev
System Bound HOM Message
Queue
TO_R_B_HOM_MSGQ_OCCUPANCY
System Bound SNP Message Queue
TO_R_SNP_MSGQ_OCCUPANCY
System Bound NDR Message Queue
TO_R_NDR_MSGQ_OCCUPANCY
System Bound DRS Messa ge Queue
TO_R_DRS_MSGQ_OCCUPANCY
System Bound NCB Message Queue
TO_R_NCB_MSGQ_OCCUPANCY
System Bound NCS Message Queue
TO_R_NCS_MSGQ_OCCUPANCY
Ring Bound Message Queue
TO_RING_MSGQ_OCCUPANCY
Ring Bound NDR Message Queue
TO_RING_NDR_MSGQ_OCCUPANC
Y
Ring Bound R2S Message Queue
TO_RING_R2S_MSGQ_OCCUPANCY
Ring Bound B2S Message Queue
TO_RING_B2S_MSGQ_OCCUPANCY
Request Table 48 1 System Bound Request
RBOX 64 2 HOM Packet to System
B-Box 64
ALL 64
SNP 31 1 Packets from System (SNP/NCS/NCB - NDR
NCS 4
NCB 4
ALL 36
Max
Entries
Insta
nces
1 buffer for R-Box and 1 for B-Box, 64
entries each. The sum of the occupied
entries in the two header buffers will never
exceed 64.
32 1 SNP Packet to System
16 1 NDR Packet to System
16 4 DRS Packet to System
16 4 NCB Packet to System
16 4 NCS Packet to System
is separate)
The total of the buffer entries occupied by
all 3 message classes will never exceed 36.
32 1 NDR Packet from System
8 1 DRS Packet from R-Box
8 1 DRS Packet from B-Box
Description/Comment
2.5.4.3 On Packet Transmission Events
For the message classes that have variable length messages, the S-Box has separate events which
count the number of flits of those message classes sent or received (i.e PKTS_SENT_HOM vs. PKTS/
FLITS_SENT_NCB). For message classes that have fixed length messages, the total number of flits can
be calculated by multiplying the total messages by the number of flits per message (i.e.
PKTS_RCVD_NCB).
Message Class
HOM 1
SNP 1
NDR 1
Ring Bound DRS 9 R2S and B2S DRS messages are always full cacheline messages which are 9
Ring Bound NCS 3 The only ring bou nd NCS message type is NcMsgS. There are always 3 flits.
Flits per
Msg
Comment
flits.
NOTE: flits are variable in the Sys Bound direction.
NOTE: flits are variable in the Sys Bound direction.
2-52
Page 65

INTEL® XEON® PROCESSOR 7500 SERIES UNCORE PROGRAMMING GUIDE UNCORE PERFORMANCE MONITORING
Message Class
Ring Bound NCB 11 The only ring bound NCB message t ypes are: NcMsgB , IntLogical, IntPhysical.
Flits per
Msg
Comment
These are all 11 flit messages.
NOTE: flits are variable in the Sys Bound direction.
The number of flits sent or received can be divided by the total number of uncore cycles (see Section
2.8.2, “W-Box Performance Monitoring Overview”) to calculate the link utilization for each message
class. The combined number of flits across message classes can be used to calculate the total link
utilization.
Note that for S2R and R2S links, there is no single event which counts the total number of message and
credit carrying idle flits sent on the link. The total link utilization can be approximated by adding
together the number of flits of the message classes that are expected to be most frequent.
2.5.5 S-Box Events Ordered By Code
Table 2-37 summarizes the directly-measured S-Box events.
Table 2-37. Performance Monitor Events for S-Box Events
Symbol Name
TO_R_PROG_EV 0x00 1 System Bound Programmable Event
TO_R_B_HOM_MSGQ_CYCLES_FULL 0x03 1 Cycles System Bound HOM Message Queue Full.
TO_R_B_HOM_MSGQ_CYCLES_NE 0x06 1 Cycles System Bound HOM Message Queue Not
TO_R_B_HOM_MSGQ_OCCUPANCY 0x07 64 System Bound HOM Message Queue Occupancy
TO_R_SNP_MSGQ_CYCLES_FULL 0x08 1 Cycles System Bound SNP Message Queue Full
TO_R_SNP_MSGQ_CYCLES_NE 0x09 1 Cycles System Bound SNP Message Queue Not
TO_R_SNP_MSGQ_OCCUPANCY 0x0A 32 System Bound SNP Message Queue Occupancy
TO_R_NDR_MSGQ_CYCLES_FULL 0x0B 1 Cycles System Bound NDR Message Queue Full.
TO_R_NDR_MSGQ_CYCLES_NE 0x0C 1 Cycles System Bound NDR Message Queue Not
TO_R_NDR_MSGQ_OCCUPANCY 0x0D 16 System Bound NDR Message Queue Occupancy
TO_R_DRS_MSGQ_CYCLES_FULL 0x0E 1 Cycles System Bound DRS Message Queue Full
TO_R_DRS_MSGQ_CYCLES_NE 0x0F 1 Cycles System Bound DRS Message Queue Not
TO_R_DRS_MSGQ_OCCUPANCY 0x10 64 System Bound DRS Message Queue Occupancy
TO_R_NCB_MSGQ_CYCLES_FULL 0x11 1 Cycles System Bound NCB Message Queue Full
TO_R_NCB_MSGQ_CYCLES_NE 0x12 1 Cycles System Bound NCB Message Queue Not
TO_R_NCB_MSGQ_OCCUPANCY 0x13 64 System Bound NCB Message Queue Occupancy
TO_R_NCS_MSGQ_CYCLES_FULL 0x14 1 Cycles System Bound NCS Message Queue Full
TO_R_NCS_MSGQ_CYCLES_NE 0x15 1 Cycles System Bound NCS Message Queue Not
TO_R_NCS_MSGQ_OCCUPANCY 0x16 64 System Bound NCS Message Queue Occupancy
TO_RING_SNP_MSGQ_CYCLES_FULL 0x20 1 Cycles Ring Bound SNP Message Queue Full
TO_RING_NCB_MSGQ_CYCLES_FULL 0x21 1 Cycles Ring Bound NCB Message Queue Full
TO_RING_NCS_MSGQ_CYCLES_FULL 0x22 1 Cycles Ring Bound NCS Message Queue Full
TO_RING_SNP_MSGQ_CYCLES_NE 0x23 1 Cycles Ring Bound SNP Message Queue Not Empty
Event
Code
Max
Inc/Cyc
Description
Empty.
Empty
Empty
Empty
Empty
Empty
2-53
Page 66

INTEL® XEON® PROCESSOR 7500 SERIES UNCORE PROGRAMMING GUIDE UNCORE PERFORMANCE MONITORING
Table 2-37. Performance Monitor Events for S-Box Events
Symbol Name
TO_RING_NCB_MSGQ_CYCLES_NE 0x24 1 Cycles Ring Bound NCB Message Queue Not Empty
TO_RING_NCS_MSGQ_CYCLES_NE 0x25 1 Cycles Ring Bound NCS Message Queue Not Empty
TO_RING_MSGQ_OCCUPANCY 0x26 361 Cycles Ring Bound Message Queue Occupancy
TO_RING_NDR_MSGQ_CYCLES_FULL 0x27 1 Cycles Ring Bound NDR Message Queue Full.
TO_RING_NDR_MSGQ_CYCLES_NE 0x28 1 Cycles Ring Bound NDR Message Queue Not Empty
TO_RING_NDR_MSGQ_OCCUPANCY 0x29 321 Ring Bound NDR Message Queue Occupancy
TO_RING_R2S_MSGQ_CYCLES_FULL 0x2A 1 Cycles Ring Bound R2S Message Queue Full.
TO_RING_R2S_MSGQ_CYCLES_NE 0x2B 1 Cycles Ring Bound R2S Message Queue Not Empty
TO_RING_R2S_MSGQ_OCCUPANCY 0x2C 8 Ring Bound R2S Message Queue Occupancy
TO_RING_B2S_MSGQ_CYCLES_FULL 0x2D 1 Cycles Ring Bound B2S Message Queue Full.
TO_RING_B2S_MSGQ_CYCLES_NE 0x2E 1 Cycles Ring Bound B2S Message Queue Not Empty
TO_RING_B2S_MSGQ_OCCUPANCY 0x2F 8 Ring Bound B2S Message Queue Occupancy
HALFLINE_BYPASS 0x30 1 Half Cacheline Bypass
REQ_TBL_OCCUPANCY 0x31 48 Request Table Occupancy
EGRESS_BYPASS 0x40 1 Egress Bypass
EGRESS_ARB_WINS 0x41 1 Egress ARB Wins
EGRESS_ARB_LOSSES 0x42 1 Egress A RB Losses
EGRESS_STARVED 0x43 1 Egress Cycles in Starvation
RBOX_HOM_BYPASS 0x50 1 R-Box HOM Bypass
RBOX_SNP_BYPASS 0x51 1 R-Box SNP Bypass
S2B_HOM_BYPASS 0x52 1 S-Box to B-Box HOM Bypass
B2S_DRS_BYPASS 0x53 1 B-Box to S-Box DRS Bypass
BBOX_HOM_BYPASS 0x54 1 B-Box HOM Bypass
PKTS_SENT_HOM 0x60 1 HOM Packets Sent to System
PKTS_SENT_SNP 0x62 1 SNP Packets Sent to System
PKTS_SENT_NDR 0x63 1 NDR Packets Sent to System
PKTS_SENT_DRS 0x64 1 DRS Packets Sent to System
FLITS_SENT_DRS 0x65 1 DRS Flits Sent to System
PKTS_SENT_NCS 0x66 1 NCS Packets Sent to System
FLITS_SENT_NCS 0x67 1 NCS Flits Sent to System
PKTS_SENT_NCB 0x68 1 NCB Packets Sent to System
FLITS_SENT_NCB 0x69 1 NCB Flits Sent to System
RBOX_CREDIT_RETURNS 0x6A 1 R-Box Credit Returns
BBOX_CREDIT_RETURNS 0x6B 1 B-Box Credit Returns
TO_R_B_REQUESTS 0x6C 1 System Bound Requests
PKTS_RCVD_NDR 0x70 1 NDR Packets Received from System
PKTS_RCVD_SNP 0x71 1 SNP Packets Received from System
PKTS_RCVD_DRS_FROM_R 0x72 1 DRS Packets Received from R-Box
PKTS_RCVD_DRS_FROM_B 0x73 1 DRS Packets Received from B-Box
PKTS_RCVD_NCS 0x74 1 NCS Packets Received from System
PKTS_RCVD_NCB 0x75 1 NCB Packets Received from System
RBOX_CREDITS 0x76 1 R-Box Credit Carrying Flits
BBOX_CREDITS 0x77 1 B-Box Credit Carrying Flits
Event
Code
Max
Inc/Cyc
Description
2-54
Page 67

INTEL® XEON® PROCESSOR 7500 SERIES UNCORE PROGRAMMING GUIDE UNCORE PERFORMANCE MONITORING
Table 2-37. Performance Monitor Events for S-Box Events
Symbol Name
NO_CREDIT_HOM 0x80 1 HOM Credit Unavailable
NO_CREDIT_SNP 0x81 1 SNP Credit Unavailable
NO_CREDIT_DRS 0x82 1 DRS Credit Unavailable
NO_CREDIT_NCS 0x83 1 NCS Credit Unavailable
NO_CREDIT_NCB 0x84 1 NCB Credit Unavailable
NO_CREDIT_NDR 0x85 1 NDR Credit Unavailable
NO_CREDIT_VNA 0x86 1 VNA Credit Unavailable
NO_CREDIT_AD 0x87 1 AD Credit Unavailable
NO_CREDIT_AK 0x88 1 AK Credit Unavailable
NO_CREDIT_BL 0x89 1 BL Credit Unavailable
NO_CREDIT_IPQ 0x8A 1 IPQ Credit Unavailable
Event
Code
Max
Inc/Cyc
Description
2.5.6 S-Box Performance Monitor Event List
This section enumerates Intel Xeon Processor 7500 Series uncore performance monitoring events for
the S-Box.
B2S_DRS_BYPASS
• Title: B-Box to S-Box DRS Bypass
• Category: Ring Bound Enhancement
• Event Code: 0x53, Max. Inc/Cyc: 1,
• Definition: Number of cycles the B-Box to S-Box DRS channel bypass optimization was utilized.
Includes cycles used to transmit message flits and credit carrying idle credit flits.
BBOX_CREDITS
• Title: B-Box Credit Carrying Flits
• Category: Ring Bound Transmission
• Event Code: 0x77, Max. Inc/Cyc: 1,
• Definition: Number credit carrying idle flits received from the B-Box.
BBOX_CREDIT_RETURNS
• Title: B-Box Credit Returns
• Category: System Bound Transmission
• Event Code: 0x6B, Max. Inc/Cyc: 1,
• Definition: Number credit return idle flits sent to the B-Box.
BBOX_HOM_BYPASS
• Title: B-Box HOM Bypass
• Category: System Bound Enhancement
• Event Code: 0x54, Max. Inc/Cyc: 1,
• Definition: B-Box HOM Bypass optimization utilized.
2-55
Page 68

INTEL® XEON® PROCESSOR 7500 SERIES UNCORE PROGRAMMING GUIDE UNCORE PERFORMANCE MONITORING
EGRESS_ARB_LOSSES
• Title: Egress ARB Losses
• Category: Ring Bound Credits
• Event Code: 0x42, Max. Inc/Cyc: 1,
• Definition: Egress Arbitration Losses.
• NOTE: Enabling multiple subevents in this category will result in the counter being increased by the
number of selected subevents that occur in a given cycle. Because only one of the even/odd FIFOs
can arbitrate to send onto the ring in each cycle, the event for the even/odd FIFOs in each direction
are exclusive. The bypass event for each direction is the sum of the bypass events of the even/odd
FIFOs.
Extension
--- b000000 (*nothing will be counted*)
AD_CW b000001 AD Clockwise
AD_CCW b000010 AD Counter-Clockwise
AD b000011 AD
AK_CW b000100 AK Clockwise
AK_CCW b001000 AK Counter-Clockwise
AK b001100 AK
BL_CW b010000 BL Clockwise
BL_CCW b100000 BL Counter-Clockwise
BL b110000 BL
umask
[15:8]
Description
EGRESS_ARB_WINS
• Title: Egress ARB Wins
• Category: Ring Bound Transmission
• Event Code: 0x41, Max. Inc/Cyc: 1,
• Definition: Egress Arbitration Wins.
• NOTE: Enabling multiple subevents in this category will result in the counter being increased by the
number of selected subevents that occur in a given cycle. Because only one of the even/odd FIFOs
can arbitrate to send onto the ring in each cycle, the event for the even/odd FIFOs in each direction
are exclusive. The bypass event for each direction is the sum of the bypass events of the even/odd
FIFOs.
Extension
--- b000000 (*nothing will be counted*)
AD_CW b000001 AD Clockwise
AD_CCW b000010 AD Counter-Clockwise
AD b000011 AD
AK_CW b000100 AK Clockwise
AK_CCW b001000 AK Counter-Clockwise
AK b001100 AK
BL_CW b010000 BL Clockwise
BL_CCW b100000 BL Counter-Clockwise
BL b110000 BL
umask
[15:8]
Description
2-56
Page 69

INTEL® XEON® PROCESSOR 7500 SERIES UNCORE PROGRAMMING GUIDE UNCORE PERFORMANCE MONITORING
EGRESS_BYPASS
• Title: Egress Bypass
• Category: Ring Bound Enhancement
• Event Code: 0x40, Max. Inc/Cyc: 1,
• Definition: Egress Bypass optimization utilized.
• NOTE: Enabling multiple subevents in this category will result in the counter being increased by the
number of selected subevents that occur in a given cycle. Because only one of the even/odd FIFOs
can arbitrate to send onto the ring in each cycle, the event for the even/odd FIFOs in each direction
are exclusive. The bypass event for each direction is the sum of the bypass events of the even/odd
FIFOs.
Extension
--- b000000 (*nothing will be counted*)
AD_CW b000001 AD Clockwise
AD_CCW b000010 AD Counter-Clockwise
AD b000011 AD
AK_CW b000100 AK Clockwise
AK_CCW b001000 AK Counter-Clockwise
AK b001100 AK
BL_CW b010000 BL Clockwise
BL_CCW b100000 BL Counter-Clockwise
BL b110000 BL
umask
[15:8]
Description
EGRESS_STARVED
• Title: Egress Cycles in Starvation
• Category: Ring Bound Credits
• Event Code: 0x43, Max. Inc/Cyc: 1,
• Definition: Number of cycles the S-Box egress FIFOs are in starvation.
• NOTE: Enabling multiple subevents in this category will result in the counter being increased by the
number of selected subevents that occur in a given cycle. Because only one of the even/odd FIFOs
can arbitrate to send onto the ring in each cycle, the event for the even/odd FIFOs in each direction
are exclusive. The bypass event for each direction is the sum of the bypass events of the even/odd
FIFOs.
Extension
--- b000000 (*nothing will be counted*)
AD_CW b000001 AD Clockwise
AD_CCW b000010 AD Counter-Clockwise
AD b000011 AD
AK_CW b000100 AK Clockwise
AK_CCW b001000 AK Counter-Clockwise
AK b001100 AK
BL_CW b010000 BL Clockwise
BL_CCW b100000 BL Counter-Clockwise
BL b110000 BL
umask
[15:8]
Description
2-57
Page 70

INTEL® XEON® PROCESSOR 7500 SERIES UNCORE PROGRAMMING GUIDE UNCORE PERFORMANCE MONITORING
FLITS_SENT_DRS
• Title: DRS Flits Sent to System
• Category: System Bound Transmission
• Event Code: 0x65, Max. Inc/Cyc: 1,
• Definition: Number of data response flits the S-Box has transmitted to the system.
FLITS_SENT_NCB
• Title: NCB Flits Sent to System
• Category: System Bound Transmission
• Event Code: 0x69, Max. Inc/Cyc: 11,
• Definition: Number of non-coherent bypass flits the S-Box has transmitted to the system.
FLITS_SENT_NCS
• Title: NCS Flits Sent to System
• Category: System Bound Transmission
• Event Code: 0x67, Max. Inc/Cyc: 1,
• Definition: Number of non-coherent standard flits the S-Box has transmitted to the system.
HALFLINE_BYPASS
• Title: Half Cacheline Bypass
• Category: Ring Bound Enhancement
• Event Code: 0x30, Max. Inc/Cyc: 1,
• Definition: Half Cacheline Bypass optimization (where the line is sent early) was utilized.
NO_CREDIT_AD
• Title: AD Ring Credit Unavailable
• Category: Ring Bound Credits
• Event Code: 0x87, Max. Inc/Cyc: 1,
• Definition: Number of times the S-Box has a pending SNP, NCS or NCB message to send and there is
no credit for the target egress FIFO.
NO_CREDIT_AK
• Title: AK Ring Credit Unavailable
• Category: Ring Bound Credits
• Event Code: 0x88, Max. Inc/Cyc: 1,
• Definition: Number of times the S-Box has a pending NDR or S2C credit return message to send but
there is no credit for the target egress FIFO.
NO_CREDIT_BL
• Title: BL Ring Credit Unavailable
• Category: Ring Bound Credits
• Event Code: 0x89, Max. Inc/Cyc: 1,
• Definition: Number of times the S-Box has a pending DRS or debug message to send and there is no
credit for the target egress FIFO.
NO_CREDIT_DRS
• Title: DRS Credit Unavailable
• Category: System Bound Credits
• Event Code: 0x82, Max. Inc/Cyc: 1,
• Definition: Number of times the S-Box has a pending data response message to send and there is no
DRS or VNA credit available.
2-58
Page 71

INTEL® XEON® PROCESSOR 7500 SERIES UNCORE PROGRAMMING GUIDE UNCORE PERFORMANCE MONITORING
NO_CREDIT_HOM
• Title: HOM Credit Unavailable
• Category: System Bound Credits
• Event Code: 0x80, Max. Inc/Cyc: 1,
• Definition: Number of times the S-Box has a pending home message to send and there is no HOM or
VNA credit available.
NO_CREDIT_IPQ
• Title: IPQ Credit Unavailable
• Category: Ring Bound Credits
• Event Code: 0x8A, Max. Inc/Cyc: 1,
• Definition: Number of times the S-Box has an incoming SNP to send but there is no IPQ credit
available for the target C-Box.
NO_CREDIT_NCB
• Title: NCB Credit Unavailable
• Category: System Bound Credits
• Event Code: 0x84, Max. Inc/Cyc: 1,
• Definition: Number of times the S-Box has a pending non-coherent bypass message to send and
there is no NCB or VNA credit available.
NO_CREDIT_NCS
• Title: NCS Credit Unavailable
• Category: System Bound Credits
• Event Code: 0x83, Max. Inc/Cyc: 1,
• Definition: Number of times the S-Box has a pending non-coherent standard message to send and
there is no NCS or VNA credit available.
NO_CREDIT_NDR
• Title: NDR Credit Unavailable
• Category: System Bound Credits
• Event Code: 0x85, Max. Inc/Cyc: 1,
• Definition: Number of times the S-Box has a pending non-data response message to send and there
is no NDR or VNA credit available.
NO_CREDIT_SNP
• Title: SNP Credit Unavailable
• Category: System Bound Credits
• Event Code: 0x81, Max. Inc/Cyc: 1,
• Definition: Number of times the S-Box has a pending snoop message to send and there is no SNP or
VNA credit available.
2-59
Page 72

INTEL® XEON® PROCESSOR 7500 SERIES UNCORE PROGRAMMING GUIDE UNCORE PERFORMANCE MONITORING
NO_CREDIT_VNA
• Title: VNA Credit Unavailable
• Category: System Bound Transmission
• Event Code: 0x86, Max. Inc/Cyc: 1,
• Definition: Number of times the S-Box has exhausted its VNA credit pool. When more than one
subevent is selected, the credit counter will be incremented by the number of selected subevents that
occur in each cycle.
Extension
--- b00 (*nothing will be counted*)
RBOX b01 R-Box Out
B-Box b10 B-Box Out
ALL b11 Both R and B Boxes
umask
[15:8]
Description
PKTS_RCVD_DRS_FROM_B
• Title: DRS Packets Received from B-Box
• Category: Ring Bound Transmission
• Event Code: 0x73, Max. Inc/Cyc: 1,
• Definition: Number of data response packets the S-Box has received from the B-Box.
• NOTE: DRS messages are always full cacheline messages which are 9 flits. Multiply this event by 9 to
derive flit traffic from the B-Box due to DRS messages.
PKTS_RCVD_DRS_FROM_R
• Title: DRS Packets Received from R-Box
• Category: Ring Bound Transmission
• Event Code: 0x72, Max. Inc/Cyc: 9,
• Definition: Number of data response packets the S-Box has received from the R-Box.
• NOTE: DRS messages are always full cacheline messages which are 9 flits. Multiply this event by 9 to
derive flit traffic from the R-Box due to DRS messages.
PKTS_RCVD_NCB
• Title: NCB Packets Received from System
• Category: Ring Bound Transmission
• Event Code: 0x75, Max. Inc/Cyc: 1,
• Definition: Number of non-coherent bypass packets the S-Box has received from the system.
• NOTE: The only ring bound NCB message types are: NcMsgB (StartReq2, VLW), IntLogical,
IntPhysical. These are all 11 flit messages. Multiply this event by 11 to derive flit traffic from the system
due to NCB messages.
PKTS_RCVD_NCS
• Title: NCS Packets Received from System
• Category: Ring Bound Transmission
• Event Code: 0x74, Max. Inc/Cyc: 1,
• Definition: Number of non-coherent standard packets the S-Box has received from the system.
• NOTE: The only ring bound NCS message type is NcMsgS (StopReq1). There are always 3 flits.
Multiply this event by 3 to derive flit traffic from the system due to NCS messages.
PKTS_RCVD_NDR
• Title: NDR Packets Received from System
• Category: Ring Bound Transmission
• Event Code: 0x70, Max. Inc/Cyc: 1,
• Definition: Number of non-data response packets the S-Box has received from the system.
2-60
Page 73

INTEL® XEON® PROCESSOR 7500 SERIES UNCORE PROGRAMMING GUIDE UNCORE PERFORMANCE MONITORING
PKTS_RCVD_SNP
• Title: SNP Packets Received from System
• Category: Ring Bound Transmission
• Event Code: 0x71, Max. Inc/Cyc: 1,
• Definition: Number of snoop packets the S-Box has received from the system.
PKTS_SENT_DRS
• Title: DRS Packets Sent to System
• Category: System Bound Transmission
• Event Code: 0x64, Max. Inc/Cyc: 1,
• Definition: Number of DRS packets the S-Box has transmitted to the system.
• NOTE: If multiple C-Boxes are selected, this event counts the total data response packets sent by all
the selected C-Boxes. In the cases where one DRS message spawns two messages, one to the
requester and one to the home, this event only counts the first DRS message. DRS messages are
always full cacheline messages which are 9 flits.
Extension
--- b0000 (*nothing will be counted*)
CBOX0_4 bxxx1 C-Boxes 0 and 4
CBOX1_5 bxx1x C-Boxes 1 and 5
CBOX2_6 bx1xx C-Boxes 2 and 6
CBOX3_7 b1xxx C-Boxes 3 and 7
umask
[15:8]
Description
PKTS_SENT_HOM
• Title: HOM Packets Sent to System
• Category: System Bound Transmission
• Event Code: 0x60, Max. Inc/Cyc: 1,
• Definition: Number of home packets the S-Box has transmitted to the R-Box or B-Box. If both R -Bo x
and B-Box are selected, counts the total number of home packets sent to both boxes.
Extension
--- b00 (*nothing will be counted*)
RBOX b01 R-Box (1 flit per request)
B-Box b10 B-Box (1 flit per request)
ALL b11 Both R and B Boxes
umask
[15:8]
Description
PKTS_SENT_NCB
• Title: NCB Packets Sent to System
• Category: System Bound Transmission
• Event Code: 0x68, Max. Inc/Cyc: 11,
• Definition: Number of NCB packets the S-Box has transmitted to the system.
• NOTE: If multiple C-Boxes are selected, this event counts the total non-coherent bypass packets sent
by all the selected C-Boxes. The only ring bound NCB message types are: NcMsgB (StartReq2, VLW),
IntLogical, IntPhysical. These are all 11 flit messages.
Extension
--- b0000 (*nothing will be counted*)
CBOX0_4 bxxx1 C-Boxes 0 and 4
CBOX1_5 bxx1x C-Boxes 1 and 5
umask
[15:8]
Description
2-61
Page 74

INTEL® XEON® PROCESSOR 7500 SERIES UNCORE PROGRAMMING GUIDE UNCORE PERFORMANCE MONITORING
CBOX2_6 bx1xx C-Boxes 2 and 6
CBOX3_7 b1xxx C-Boxes 3 and 7
PKTS_SENT_NCS
• Title: NCS Packets Sent to System
• Category: System Bound Transmission
• Event Code: 0x66, Max. Inc/Cyc: 3,
• Definition: Number of NCS packets the S-Box has transmitted to the system.
• NOTE: If multiple C-Boxes are selected, this event counts the total non-coherent standard packets
sent by all the selected C-Boxes. The only ring bound NCS message type is NcMsgS (StopReq1).
There are always 3 flits.
Extension
--- b0000 (*nothing will be counted*)
CBOX0_4 bxxx1 C-Boxes 0 and 4
CBOX1_5 bxx1x C-Boxes 1 and 5
CBOX2_6 bx1xx C-Boxes 2 and 6
CBOX3_7 b1xxx C-Boxes 3 and 7
umask
[15:8]
Description
PKTS_SENT_NDR
• Title: NDR Packets Sent to System
• Category: System Bound Transmission
• Event Code: 0x63, Max. Inc/Cyc: 1,
• Definition: Number of non-data response packets the S-Box has transmitted to the system.
PKTS_SENT_SNP
• Title: SNP Packets Sent to System
• Category: System Bound Transmission
• Event Code: 0x62, Max. Inc/Cyc: 1,
• Definition: Number of SNP packets the S-Box has transmitted to the system. This event only counts
the first snoop that is spawned from a home request. When S-Box broadcast is enabled, this event does
not count the additional snoop packets that are spawned.
RBOX_CREDIT_CARRIERS
• Title: R-Box Credit Carrying Flits
• Category: Ring Bound Transmission
• Event Code: 0x76, Max. Inc/Cyc: 1,
• Definition: Number credit carrying idle flits received from the R-Box.
RBOX_CREDIT_RETURNS
• Title: R-Box Credit Re turns
• Category: System Bound Transmission
• Event Code: 0x6A, Max. Inc/Cyc: 1,
• Definition: Number credit return idle flits sent to the R-Box.
RBOX_HOM_BYPASS
• Title: R-Box HOM Bypass
• Category: System Bound Enhancement
• Event Code: 0x50, Max. Inc/Cyc: 1,
• Definition: R-Box HOM Bypass optimization was utilized.
2-62
Page 75

INTEL® XEON® PROCESSOR 7500 SERIES UNCORE PROGRAMMING GUIDE UNCORE PERFORMANCE MONITORING
RBOX_SNP_BYPASS
• Title: R-Box SNP Bypass
• Category: System Bound Enhancement
• Event Code: 0x51, Max. Inc/Cyc: 1,
• Definition: R-Box SNP bypass optimization utilized. When both snoop and big snoop bypass are
selected, the performance counter will increment on both subevents.
Extension
--- b00 (*nothing will be counted*)
SNP b01 Snoop
BIG_SNP b10 Big Snoop
ALL b11 Both Bypasses
umask
[15:8]
Description
REQ_TBL_OCCUPANCY
• Title: Request Table Occupancy
• Category: Ring Bound Queue
• Event Code: 0x31, Max. Inc/Cyc: 48,
• Definition: Number of request table entries occupied by socket requests. Local means request is
targeted towards the B-Boxes in the same socket. Requests to the B-Box in the same socket are
considered remote.
• NOTE: Occupancy is tracked from allocation to deallocation of each entry in the queue.
Extension
--- b00 (*nothing will be counted*)
LOCAL b01 Local
REMOTE b10 Remote
ALL b11 Local And Remote
umask
[15:8]
Description
S2B_HOM_BYPASS
• Title: S-Box to B-Box HOM Bypass
• Category: System Bound Enhancement
• Event Code: 0x52, Max. Inc/Cyc: 1,
• Definition: Number of cycles the S-Box to B-Box HOM channel bypass optimization was utilized.
Includes cycles used to transmit message flits and credit carrying idle credit flits.
TO_RING_B2S_MSGQ_CYCLES_FULL
• Title: Ring Bound B2S Message Queue Full
• Category: Ring Bound Queue
• Event Code: 0x2B, Max. Inc/Cyc: 1,
• Definition: Number of cycles in which the header buffer, containing B to S-Box messages on their
way to the Ring, is full.
TO_RING_B2S_MSGQ_CYCLES_NE
• Title: Cycles Ring Bound B2S Message Queue Not Empty
• Category: Ring Bound Queue
• Event Code: 0x2D, Max. Inc/Cyc: 1,
• Definition: Number of cycles in which the header buffer, containing B to S-Box messages on their
way to the Ring, has one or more entries allocated.
2-63
Page 76

INTEL® XEON® PROCESSOR 7500 SERIES UNCORE PROGRAMMING GUIDE UNCORE PERFORMANCE MONITORING
TO_RING_B2S_MSGQ_OCCUPANCY
• Title: Ring Bound B2S Message Queue Occupancy
• Category: Ring Bound Queue
• Event Code: 0x2F, Max. Inc/Cyc: 8,
• Definition: Number of entries in header buffer containing B to S-Box messages on their way to the
Ring.
TO_RING_MSGQ_OCCUPANCY
• Title: Ring Bound Message Queue Occupancy
• Category: Ring Bound Queue
• Event Code: 0x26, Max. Inc/Cyc: 1,
• Definition: Number of entries in header buffer containing SNP, NCS or NCB messages headed for the
Ring. Each subevent represents usage of the buffer by a particular message class. When more than one
message class is selected, the queue occupancy counter counts the total number of buffer entries
occupied by messages in the selected message classes.
• NOTE: Total of the buffer entries occupied by all message classes in umask will never exceed 36.
Extension
--- b000 (*nothing will be counted*)
SNP bxx1 Snoop (31 entry buffer)
NCS bx1x Non-coherent Standard (4 entry buffer)
NCB b1xx Non-Coherent Bypass (4 entry buffer)
ALL b111 All C-Boxes
umask
[15:8]
Description
TO_RING_NCB_MSGQ_CYCLES_FULL
• Title: Cycles Ring Bound NCB Message Queue Full
• Category: Ring Bound Queue
• Event Code: 0x21, Max. Inc/Cyc: 1,
• Definition: Number of cycles in which the header buffer, containing NCB messages on their way to
the Ring, is full.
TO_RING_NCB_MSGQ_CYCLES_NE
• Title: Cycles Ring Bound NCB Message Queue Not Empty
• Category: Ring Bound Queue
• Event Code: 0x24, Max. Inc/Cyc: 1,
• Definition: Number of cycles in which the header buffer, containing NCB messages on their way to
the Ring, has one or more entries allocated.
TO_RING_NCS_MSGQ_CYCLES_FULL
• Title: Cycles Ring Bound NCS Message Queue Full
• Category: Ring Bound Queue
• Event Code: 0x22, Max. Inc/Cyc: 1,
• Definition: Number of cycles in which the header buffer, containing NCS messages on their way to
the Ring, is full.
TO_RING_NDR_MSGQ_CYCLES_FULL
• Title: Cycles Ring Bound NDR Message Queue Full
• Category: Ring Bound Queue
• Event Code: 0x27, Max. Inc/Cyc: 1,
• Definition: Number of cycles in which the header buffer, containing NDR messages on their way to
the Ring, is full.
2-64
Page 77

INTEL® XEON® PROCESSOR 7500 SERIES UNCORE PROGRAMMING GUIDE UNCORE PERFORMANCE MONITORING
TO_RING_NDR_MSGQ_CYCLES_NE
• Title: Cycles Ring Bound NDR Message Queue Not Empty
• Category: Ring Bound Queue
• Event Code: 0x28, Max. Inc/Cyc: 1,
• Definition: Number of cycles in which the header buffer, containing NDR messages on their way to
the Ring, has one or more entries allocated.
TO_RING_NDR_MSGQ_OCCUPANCY
• Title: Ring Bound SNP Message Queue Occupancy
• Category: Ring Bound Queue
• Event Code: 0x29, Max. Inc/Cyc: 32,
• Definition: Number of entries in header buffer containing NDR messages on their way to the Ring.
TO_RING_R2S_MSGQ_CYCLES_FULL
• Title: Cycles Ring Bound R2S Message Queue Full
• Category: Ring Bound Queue
• Event Code: 0x2A, Max. Inc/Cyc: 1,
• Definition: Number of cycles in which the header buffer, containing R to S-Box messages on their
way to the Ring, is full.
TO_RING_R2S_MSGQ_CYCLES_NE
• Title: Cycles Ring Bound R2S Message Queue Not Empty
• Category: Ring Bound Queue
• Event Code: 0x2C, Max. Inc/Cyc: 1,
• Definition: Number of cycles in which the header buffer, containing R to S-Box messages on their
way to the Ring, has one or more entries allocated.
TO_RING_R2S_MSGQ_OCCUPANCY
• Title: Ring Bound R2S Message Queue Occupancy
• Category: Ring Bound Queue
• Event Code: 0x2E, Max. Inc/Cyc: 8,
• Definition: Number of entries in header buffer containing R to S messages on their way to the Ring.
TO_RING_SNP_MSGQ_CYCLES_FULL
• Title: Cycles Ring Bound SNP Message Queue Full
• Category: Ring Bound Queue
• Event Code: 0x20, Max. Inc/Cyc: 1,
• Definition: Number of cycles in which the header buffer , containing SNP messages on their w ay to the
Ring, is full.
TO_RING_SNP_MSGQ_CYCLES_NE
• Title: Cycles Ring Bound SNP Message Queue Not Empty
• Category: Ring Bound Queue
• Event Code: 0x23, Max. Inc/Cyc: 1,
• Definition: Number of cycles in which the header buffer , containing SNP messages on their w ay to the
Ring, has one or more entries allocated.
2-65
Page 78

INTEL® XEON® PROCESSOR 7500 SERIES UNCORE PROGRAMMING GUIDE UNCORE PERFORMANCE MONITORING
TO_R_DRS_MSGQ_CYCLES_FULL
• Title: Cycles System Bound DRS Message Queue Full.
• Category: System Bound Queue
• Event Code: 0x0E, Max. Inc/Cyc: 1,
• Definition: Number of cycles in which the header buffer for the selected C-Box, containing DRS messages heading to a System Agent (through the R-Box), is full. Only one C-Box’s DRS header buffer
should be selected for the buffer full checking to be correct, else the result is undefined.
Extension
--- b0000 (*nothing will be counted*)
CBOX0_4 bxxx1 CBOX 0 and 4
CBOX1_5 bxx1x CBOX 1 and 5
CBOX2_6 bx1xx CBOX 2 and 6
CBOX3_7 b1xxx CBOX 3 and 7
ALL b1111 All C-Boxes
umask
[15:8]
Description
TO_R_DRS_MSGQ_CYCLES_NE
• Title: Cycles System Bound DRS Message Queue Not Empty
• Category: System Bound Queue
• Event Code: 0x0F, Max. Inc/Cyc: 1,
• Definition: Number of cycles in which the header buffer for the selected C-Box, containing DRS messages heading to a System Agent (through the R-Box), has one or more entries allocated. When more
than one C-Box is selected, the event is asserted when any of th e selec ted C -Bo x DRS head er buffers
are not empty.
Extension
--- b0000 (*nothing will be counted*)
CBOX0_4 bxxx1 CBOX 0 and 4
CBOX1_5 bxx1x CBOX 1 and 5
CBOX2_6 bx1xx CBOX 2 and 6
CBOX3_7 b1xxx CBOX 3 and 7
ALL b1111 All C-Boxes
umask
[15:8]
Description
TO_R_DRS_MSGQ_OCCUPANCY
• Title: System Bound DRS Message Queue Occupancy
• Category: System Bound Queue
• Event Code: 0x10, Max. Inc/Cyc: 16,
• Definition: Number of entries in the header buffer for the selected C-Box, containing DRS messages
heading to a System Agent (through the R-Box). When more than one C-Box is selected, the queue
occupancy counter counts the total number of occupied entries in all selected C-Box DRS header buffers.
• NOTE: 1 buffer per C-Box, 4 entries each.
Extension
--- b0000 (*nothing will be counted*)
CBOX0_4 bxxx1 CBOX 0 and 4
CBOX1_5 bxx1x CBOX 1 and 5
CBOX2_6 bx1xx CBOX 2 and 6
umask
[15:8]
Description
2-66
Page 79

INTEL® XEON® PROCESSOR 7500 SERIES UNCORE PROGRAMMING GUIDE UNCORE PERFORMANCE MONITORING
CBOX3_7 b1xxx CBOX 3 and 7
ALL b1111 All C-Boxes
TO_R_B_HOM_MSGQ_CYCLES_FULL
• Title: Cycles System Bound HOM Message Queue Full.
• Category: System Bound Queue
• Event Code: 0x03, Max. Inc/Cyc: 1,
• Definition: Number of cycles in which the header buffer, containing HOM messages heading to a System Agent (through the B or R-Box), is full. If both R-Box and B-Box subevents are selected, this
event is asserted when the total number of entries in the R-Box and B-Box Home header buffers is
equal to 64.
Extension
--- b00 (*nothing will be counted*)
RBOX b01 R-Box
BBOX b10 B-Box
RBBOX b11 R or B-Box
umask
[15:8]
Description
TO_R_B_HOM_MSGQ_CYCLES_NE
• Title: Cycles System Bound HOM Header Not Empty
• Category: System Bound Queue
• Event Code: 0x06, Max. Inc/Cyc: 1,
• Definition: Number of cycles in which the header buffer, containing HOM messages heading to a System Agent (through the B or R-Box), has one or m ore entries allocated. If both R-Box and B-Box subevents are selected, this event is asserted when the total number of entries in the R-Box and B-Box
Home header buffers is equal to 64.
Extension
--- b00 (*nothing will be counted*)
RBOX b01 R-Box
BBOX b10 B-Box
RBBOX b11 R or B-Box
umask
[15:8]
Description
TO_R_B_HOM_MSGQ_OCCUPANCY
• Title: System Bound HOM Message Queue Occupancy
• Category: System Bound Queue
• Event Code: 0x07, Max. Inc/Cyc: 64,
• Definition: Number of entries in the header buffer containing HOM messages heading to a System
Agent (through the B or R-Box).
• NOTE: 1 buffer for the R-Box and 1 for the B-Box, 64 entries each. The sum of the occupied entries
in the 2 header buffers will never exceed 64.
Extension
--- b00 (*nothing will be counted*)
RBOX b01 R-Box
BBOX b10 B-Box
RBBOX b11 R or B-Box
umask
[15:8]
Description
2-67
Page 80

INTEL® XEON® PROCESSOR 7500 SERIES UNCORE PROGRAMMING GUIDE UNCORE PERFORMANCE MONITORING
TO_R_NCB_MSGQ_CYCLES_FULL
• Title: Cycles System Bound NCB Message Queue Full.
• Category: System Bound Queue
• Event Code: 0x11, Max. Inc/Cyc: 1,
• Definition: Number of cycles in which the header buffer for the selected C-Box, containing NCB messages heading to a System Agent (through the R-Box), is full. Only one C-Box’s NCB header buffer
should be selected for the buffer full checking to be correct, else the result is undefined.
Extension
--- b0000 (*nothing will be counted*)
CBOX0_4 bxxx1 CBOX 0 and 4
CBOX1_5 bxx1x CBOX 1 and 5
CBOX2_6 bx1xx CBOX 2 and 6
CBOX3_7 b1xxx CBOX 3 and 7
ALL b1111 All C-Boxes
umask
[15:8]
Description
TO_R_NCB_MSGQ_CYCLES_NE
• Title: Cycles System Bound NCB Message Queue Not Empty
• Category: System Bound Queue
• Event Code: 0x12, Max. Inc/Cyc: 1,
• Definition: Number of cycles in which the header buffer for the selected C-Box, containing NCB messages heading to a System Agent (through the R-Box), has one or more entries allocated. When more
than one C-Box is selected, the event is asserted when any of th e selec ted C -Bo x DRS head er buffers
are not empty.
Extension
--- b0000 (*nothing will be counted*)
CBOX0_4 bxxx1 CBOX 0 and 4
CBOX1_5 bxx1x CBOX 1 and 5
CBOX2_6 bx1xx CBOX 2 and 6
CBOX3_7 b1xxx CBOX 3 and 7
ALL b1111 All C-Boxes
umask
[15:8]
Description
TO_R_NCB_MSGQ_OCCUPANCY
• Title: System Bound NCB Message Queue Occupancy
• Category: System Bound Queue
• Event Code: 0x13, Max. Inc/Cyc: 8,
• Definition: Number of entries in the header buffer for the selected C-Box, containing NCB messages
heading to a System Agent (through the R-Box). When more than one C-Box is selected, the queue
occupancy counter counts the total number of occupied entries in all selected C-Box NCB header buffers.
• NOTE: 1 buffer per C-Box, 2 entries each.
Extension
--- b0000 (*nothing will be counted*)
CBOX0_4 bxxx1 CBOX 0 and 4
CBOX1_5 bxx1x CBOX 1 and 5
CBOX2_6 bx1xx CBOX 2 and 6
umask
[15:8]
Description
2-68
Page 81

INTEL® XEON® PROCESSOR 7500 SERIES UNCORE PROGRAMMING GUIDE UNCORE PERFORMANCE MONITORING
CBOX3_7 b1xxx CBOX 3 and 7
ALL b1111 All C-Boxes
TO_R_NCS_MSGQ_CYCLES_FULL
• Title: Cycles System Bound NCS Message Queue Full.
• Category: System Bound Queue
• Event Code: 0x14, Max. Inc/Cyc: 1,
• Definition: Number of cycles in which the header buffer for the selected C-Box, containing NCS messages heading to a System Agent (through the R-Box), is full. Only one C-Box’s NCS header buffer
should be selected for the buffer full checking to be correct, else the result is undefined.
Extension
--- b0000 (*nothing will be counted*)
CBOX0_4 bxxx1 CBOX 0 and 4
CBOX1_5 bxx1x CBOX 1 and 5
CBOX2_6 bx1xx CBOX 2 and 6
CBOX3_7 b1xxx CBOX 3 and 7
ALL b1111 All C-Boxes
umask
[15:8]
Description
TO_R_NCS_MSGQ_CYCLES_NE
• Title: Cycles System Bound NCS Message Queue Not Empty
• Category: System Bound Queue
• Event Code: 0x15, Max. Inc/Cyc: 1,
• Definition: Number of cycles in which the header buffer for the selected C-Box, containing NCS messages heading to a System Agent (through the R-Box), has one or more entries allocated. When more
than one C-Box is selected, the event is asserted when any of the selected C-Box NCS header buffers
are not empty.
Extension
--- b0000 (*nothing will be counted*)
CBOX0_4 bxxx1 CBOX 0 and 4
CBOX1_5 bxx1x CBOX 1 and 5
CBOX2_6 bx1xx CBOX 2 and 6
CBOX3_7 b1xxx CBOX 3 and 7
ALL b1111 All C-Boxes
umask
[15:8]
Description
TO_R_NCS_MSGQ_OCCUPANCY
• Title: System Bound NCS Message Queue Occupancy
• Category: System Bound Queue
• Event Code: 0x16, Max. Inc/Cyc: 2,
• Definition: Number of entries in the header buffer for the selected C-Box, containing NCS messages
heading to a System Agent (through the R-Box). When more than one C-Box is selected, the queue
occupancy counter counts the total number of occupied entries in all selected C-Box NCS header buffers.
• NOTE: 1 buffer per C-Box, 2 entries each.
Extension
--- b0000 (*nothing will be counted*)
CBOX0_4 bxxx1 CBOX 0 and 4
umask
[15:8]
Description
2-69
Page 82

INTEL® XEON® PROCESSOR 7500 SERIES UNCORE PROGRAMMING GUIDE UNCORE PERFORMANCE MONITORING
CBOX1_5 bxx1x CBOX 1 and 5
CBOX2_6 bx1xx CBOX 2 and 6
CBOX3_7 b1xxx CBOX 3 and 7
ALL b1111 All C-Boxes
TO_R_NDR_MSGQ_CYCLES_FULL
• Title: Cycles System Bound NDR Message Queue Full
• Category: System Bound Queue
• Event Code: 0x0B, Max. Inc/Cyc: 1,
• Definition: Number of cycles in which the header buffer, containing NDR messages heading to a System Agent (through the R-Box), is full.
TO_R_NDR_MSGQ_CYCLES_NE
• Title: Cycles System Bound NDR Message Queue Not Empty
• Category: System Bound Queue
• Event Code: 0x0C, Max. Inc/Cyc: 1,
• Definition: Number of cycles in which the header buffer, containing NDR messages heading to a System Agent (through the R-Box), has one or more entries allocated.
TO_R_NDR_MSGQ_OCCUPANCY
• Title: System Bound NDR Message Queue Occupancy
• Category: System Bound Queue
• Event Code: 0x0D, Max. Inc/Cyc: 16,
• Definition: Number of entries in the header buffer, containing NDR messages heading to a System
Agent (through the R-Box).
TO_R_PROG_EV
• Title: System Bound Programmable Event
• Category: System Bound Queue
• Event Code: 0x00, Max. Inc/Cyc: 1,
• Definition: Programmable Event heading to a System Agent (through the R-Box). Match/Mask on
criteria set in S_MSR_MATCH/MASK registers (Refer to Section 2.5.3.4, “S-Box Registers for Mask/
Match Facility”).
TO_R_B_REQUESTS
• Title: System Bound Requests
• Category: System Bound Transmission
• Event Code: 0x6C, Max. Inc/Cyc: 1,
• Definition: Socket request (both B-Boxes). Local means request is targeted towards the B-Boxes in
the same socket. Requests to the U-Box in the same socket are considered remote.
Extension
--- b00 (*nothing will be counted*)
LOCAL b01 Local
REMOTE b10 Remote
ALL b11 Local And Remote
umask
[15:8]
Description
2-70
Page 83

INTEL® XEON® PROCESSOR 7500 SERIES UNCORE PROGRAMMING GUIDE UNCORE PERFORMANCE MONITORING
TO_R_SNP_MSGQ_CYCLES_FULL
• Title: Cycles System Bound SNP Message Queue Full
• Category: System Bound Queue
• Event Code: 0x08, Max. Inc/Cyc: 1,
• Definition: Number of cycles in which the header buffer, containing SNP messages heading to a System Agent (through the R-Box), is full.
TO_R_SNP_MSGQ_CYCLES_NE
• Title: Cycles System Bound SNP Message Queue Not Empty
• Category: System Bound Queue
• Event Code: 0x09, Max. Inc/Cyc: 1,
• Definition: Number of cycles in which the header buffer, containing SNP messages heading to a System Agent (through the R-Box), has one or more entries allocated.
TO_R_SNP_MSGQ_OCCUPANCY
• Title: System Bound SNP Message Queue Occupancy
• Category: System Bound Queue
• Event Code: 0x0A, Max. Inc/Cyc: 32,
• Definition: Number of entries in the header buffer, containing SNP messages heading to a System
Agent (through the R-Box).
2-71
Page 84

INTEL® XEON® PROCESSOR 7500 SERIES UNCORE PROGRAMMING GUIDE UNCORE PERFORMANCE MONITORING
2.6 R-Box Performance Monitoring
2.6.1 Overview of the R-Box
The Crossbar Router (R-Bo x) is a 8 port switch/router implementing the Intel® QuickPath Interconnect
Link and Routing layers. The R-Box is responsible for routing and transmitting all intra- and interprocessor communication.
The on-die agents include two B-Boxes (ports 4/7), two S-boxes (ports 2/6) and the U-Box (which
shares a connection with B-Box1 on Port7). The R-Bo x connects to these through full flit 80b links. Ports
0,1,4 and 5 are connected to external Intel QPI agents (through P-boxes also known as the physical
layers), also through full flit 80b links.
The R-Box consists of 8 identical ports and a wire crossbar that connects the ports together. Each port
contains three main sections as shown in the following figure: the input port, the output port, and the
arbitration control.
Port 0 (QPI1)
Input Output
Port 1 (QPI0)
Input Output
Port 2 (S-Box0)
Input Output
Port 3 (B-Box0)
Input Output
L
Half
XBar
Arb0
Arb1
Arb2
Arb3
Arb4
Arb5
Arb6
Arb7
R
Half
XBar
Port 4 (QPI2)
Input Output
Port 5 (QPI3)
Input Output
Port 6 (S-Box1)
Input Output
Port 7 (U/B-Box1)
Input Output
Figure 2-1. R-Box Block Diagram
2.6.1.1 R-Box Input Port
The R-Box input port is responsible for storing incoming packets from the B and S-Boxes as well as offchip requests using the Intel
consolidated and sent to the R-Box arbiter.
R-Box input ports have two structures of important to performance monitoring; Entry overflow table
(EOT) and Entry Table (ET). R-Box PMU supports performance monitoring in these two structures.
®
QuickPath Interconnect protocol. Data from each packet header is
2.6.1.2 R-Box Arbitration Control
The R-Box arbitr ation control is responsible for selecting when packets move from the input ports to the
output ports and which output port they go to if there are multiple options specified.
R-Box arbitration does not have any storage structures. This part of the logic basically determines
which port to route the packet and then arbitrate to secure a route to that port through the cross-bar.
The arbitration is done at 3 levels: queue, port and global arbitration. R -Box PMUs support perfo rmance
monitoring at the arbitration control.
2-72
Page 85

INTEL® XEON® PROCESSOR 7500 SERIES UNCORE PROGRAMMING GUIDE UNCORE PERFORMANCE MONITORING
2.6.1.3 R-Box Output Port
The R-Box output port acts as a virtual wire that is responsible for de-coupling the crossbar from further
downstream paths to on-chip or off-chip ports while carrying out the Link layer functions.
2.6.1.4 R-Box Link Layer Resources
Each R-Box port supports up to three virtual networks (VN0, VN1, and VNA) as defined by the Intel®
QuickPath Interconnect Specification. The following table specifies the port resources.
Table 2-38. Input Buffering Per Port
Message Class Abbr
Home HOM 961111
Snoop SNP 1 1 1 1
Non-Data Response NDR 1 1 1 1
Data Response DRS 1 up to 11 1 up to 11
Non-Coherent Standard NCS 1 up to 3 1 up to 3
Non-Coherent Bypass NCB 1 up to 11 1 up to 11
VNA VN0 VN1
Pkts Flits Pkts Flits Pkts Flits
2.6.2 R-Box Performance Monitoring Overview
The R-Box supports performance ev ent monitoring through its Performance Monitoring Unit (PMU). A t a
high level, the R-Box PMU supports features comparable to other uncore PMUs. R-Box PMUs support
both Global and Local PMU freeze/unfreeze. R-Box PMUs are accessible through Machine Specific
Registers (MSRs). R-Box PMU consists of 16 48b-wide performance monitoring data counters and a
collection of other peripheral control registers.
For information on how to setup a monitoring session, refer to Section 2.1.2, “Setting up a Monitoring
Session”
The counters, along with the control register paired with each one, are split. Half of the counters (0-7)
can monitor events occurring on the ‘left’ side of the R-Box (ports 0-3) and the other half (8-15)
monitor ports 4-7 on the ‘right’ side.
.
Since the R-Box consists of 12 almost identical ports, R-Box perfmon events consist of an identical set
of events for each port. The R-Box perfmon usage model allows monitoring of multiple ports at the
same time. R-Box PMUs do not provide any global performance monitoring events.
However, unlike many other uncore boxes, event programming in the R-Box is hierarchical. It is
necessary to program multiple MSRs to select the event to be monitored. In order to program an event,
each of the control registers for its accompanying counter must be redirected to a subcontrol register
attached to a specific port. Each control register can be redirected to one of 2 IPERF control registers
(for RIX events), one of 2 fields in a QLX control register or one of 2 mask/match registers. Therefore,
it is possible to monitor up to two of any event per port.
The R-Box also includes a pair of mask/match registers on each port that allow a user to match packets
serviced (packet is transferred from input to output port) by the R-Box according to various standard
packet fields such as message class, opcode, etc.
2.6.2.1 Choosing An Event To Monitor - Example
1) Pick an event to monitor (e.g. FLITS_SENT)
2) Pick a port to monitor on (e.g. QPI0)
2-73
Page 86

INTEL® XEON® PROCESSOR 7500 SERIES UNCORE PROGRAMMING GUIDE UNCORE PERFORMANCE MONITORING
3) Pick a generic counter (control+data) that can monitor an event on that port. (e.g
R_MSR_PMON_CTL/CTR3)
4) Pick one of the two sub counters that allows a user to monitor the event (R_MSR_PORT1_IPERF1),
program it to monitor the chosen event (R_MSR_PORT1_IPERF1[31] = 0x1) and set the generic control
to point to it (R_MSR_PMON_CTL3.ev_sel == 0x7).
5) Enable the counter (e.g. R_MSR_PMON_CTL3.en == 0x1)
2.6.2.2 R-Box PMU - Overflow, Freeze and Unfreeze
If an overflow is detected from a R-Box performance counter, the overflow bit is set at the box level
(R_MSR_PMON_GLOBAL_STATUS_15_8.ov for the R side and R_MSR_PMON_GLOBAL_STATUS_7_0.ov
for the L), and forwarded up the chain towards the U-Box. If counter overflows in the left R-Box, a
notification is sent and stored in S-Box0 (S_MSR_PMON_SUMMARY.ov_c_l) which, in turn, sends the
overflow notification up to the U-Box (U_MSR_PMON_GLOBAL_STATUS.ov_s0). Refer to Table 2-26,
“S_MSR_PMON_SUMMARY Register Fields” to determine how each R-Box’s overflow bit is accumulated
in the attached S-Box.
HW can be also configured (by setting the corresponding .pmi_en to 1) to send a PMI to the U-Box
when an overflow is detected. The U-Box may be configured to freeze all uncore counting and/or send a
PMI to selected cores when it receives this signal.
Once a freeze has occurred, in order to see a new freeze, the overflow field responsible for the freeze,
must be cleared by setting the corresponding bit in R_MSR_PMON_GLOBAL_OVF_CTL.clr_ov. Assuming
all the counters have been locally enabled (.en bit in data registers meant to monitor events) and the
overflow bit(s) has been cleared, the R-Box is prepared for a new sample interval. Once the global
controls have been re-enabled (Section 2.1.4, “Enabling a New Sample Interval from Frozen
Counters”), counting will resume.
2.6.3 R-BOX Performance Monitors
Table 2-39. R-Box Performance Monitoring MSRs
MSR Name Access
R_MSR_PORT7_XBR_SET2_MASK RW_NA 0x0E9E 64 R-Box Port 7 Mask 2
R_MSR_PORT7_XBR_SET2_MATCH RW_NA 0x0E9D 64 R-Box Port 7 Match 2
R_MSR_PORT7_XBR_SET2_MM_CFG RW_NA 0x0E9C 64 R-Box Port 7 Mask/Match Config 2
R_MSR_PORT7_XBR_SET1_MASK RW_NA 0x0E8E 64 R-Box Port 7 Mask 1
R_MSR_PORT7_XBR_SET1_MATCH RW_NA 0x0E8D 64 R-Box Port 7 Match 1
R_MSR_PORT7_XBR_SET1_MM_CFG RW_NA 0x0E8C 64 R-Box Port 7 Mask/Match Config 1
R_MSR_PORT6_XBR_SET2_MASK RW_NA 0x0E9A 64 R-Box Port 6 Mask 2
R_MSR_PORT6_XBR_SET2_MATCH RW_NA 0x0E99 64 R-Box Port 6 Match 2
R_MSR_PORT6_XBR_SET2_MM_CFG RW_NA 0x0E98 64 R-Box Port 6 Mask/Match Config 2
R_MSR_PORT6_XBR_SET1_MASK RW_NA 0x0E8A 64 R-Box Port 6 Mask 1
R_MSR_PORT6_XBR_SET1_MATCH RW_NA 0x0E89 64 R-Box Port 6 Match 1
R_MSR_PORT6_XBR_SET1_MM_CFG RW_NA 0x0E88 64 R-Box Port 6 Mask/Match Config 1
R_MSR_PORT5_XBR_SET2_MASK RW_NA 0x0E96 64 R-Box Port 5 Mask 2
R_MSR_PORT5_XBR_SET2_MATCH RW_NA 0x0E95 64 R-Box Port 5 Match 2
R_MSR_PORT5_XBR_SET2_MM_CFG RW_NA 0x0E94 64 R-Box Port 5 Mask/Match Config 2
MSR
Addres
s
Size
(bits)
Description
2-74
Page 87

INTEL® XEON® PROCESSOR 7500 SERIES UNCORE PROGRAMMING GUIDE UNCORE PERFORMANCE MONITORING
MSR
MSR Name Access
R_MSR_PORT5_XBR_SET1_MASK RW_NA 0x0E86 64 R-Box Port 5 Mask 1
R_MSR_PORT5_XBR_SET1_MATCH RW_NA 0x0E85 64 R-Box Port 5 Match 1
R_MSR_PORT5_XBR_SET1_MM_CFG RW_NA 0x0E84 64 R-Box Port 5 Mask/Match Config 1
R_MSR_PORT4_XBR_SET2_MASK RW_NA 0x0E92 64 R-Box Port 4 Mask 2
R_MSR_PORT4_XBR_SET2_MATCH RW_NA 0x0E91 64 R-Box Port 4 Match 2
R_MSR_PORT4_XBR_SET2_MM_CFG RW_NA 0x0E90 64 R-Box Port 4 Mask/Match Config 2
R_MSR_PORT4_XBR_SET1_MASK RW_NA 0x0E82 64 R-Box Port 4 Mask 1
R_MSR_PORT4_XBR_SET1_MATCH RW_NA 0x0E81 64 R-Box Port 4 Match 1
R_MSR_PORT4_XBR_SET1_MM_CFG RW_NA 0x0E80 64 R-Box Port 4 Mask/Match Config 1
R_MSR_PORT3_XBR_SET2_MASK RW_NA 0x0E7E 64 R-Box Port 3 Mask 2
R_MSR_PORT3_XBR_SET2_MATCH RW_NA 0x0E7D 64 R-Box Port 3 Match 2
R_MSR_PORT3_XBR_SET2_MM_CFG RW_NA 0x0E7C 64 R-Box Port 3 Mask/Match Config 2
R_MSR_PORT3_XBR_SET1_MASK RW_NA 0x0E6E 64 R-Box Port 3 Mask 1
R_MSR_PORT3_XBR_SET1_MATCH RW_NA 0x0E6D 64 R-Box Port 3 Match 1
R_MSR_PORT3_XBR_SET1_MM_CFG RW_NA 0x0E6C 64 R-Box Port 3 Mask/Match Config 1
R_MSR_PORT2_XBR_SET2_MASK RW_NA 0x0E7A 64 R-Box Port 2 Mask 2
R_MSR_PORT2_XBR_SET2_MATCH RW_NA 0x0E79 64 R-Box Port 2 Match 2
R_MSR_PORT2_XBR_SET2_MM_CFG RW_NA 0x0E78 64 R-Box Port 2 Mask/Match Config 2
R_MSR_PORT2_XBR_SET1_MASK RW_NA 0x0E6A 64 R-Box Port 2 Mask 1
R_MSR_PORT2_XBR_SET1_MATCH RW_NA 0x0E69 64 R-Box Port 2 Match 1
R_MSR_PORT2_XBR_SET1_MM_CFG RW_NA 0x0E68 64 R-Box Port 2 Mask/Match Config 1
Addres
Size
(bits)
s
Description
R_MSR_PORT1_XBR_SET2_MASK RW_NA 0x0E76 64 R-Box Port 1 Mask 2
R_MSR_PORT1_XBR_SET2_MATCH RW_NA 0x0E75 64 R-Box Port 1 Match 2
R_MSR_PORT1_XBR_SET2_MM_CFG RW_NA 0x0E74 64 R-Box Port 1 Mask/Match Config 2
R_MSR_PORT1_XBR_SET1_MASK RW_NA 0x0E66 64 R-Box Port 1 Mask 1
R_MSR_PORT1_XBR_SET1_MATCH RW_NA 0x0E65 64 R-Box Port 1 Match 1
R_MSR_PORT1_XBR_SET1_MM_CFG RW_NA 0x0E64 64 R-Box Port 1 Mask/Match Config 1
R_MSR_PORT0_XBR_SET2_MASK RW_NA 0x0E72 64 R-Box Port 0 Mask 2
R_MSR_PORT0_XBR_SET2_MATCH RW_NA 0x0E71 64 R-Box Port 0 Match 2
R_MSR_PORT0_XBR_SET2_MM_CFG RW_NA 0x0E70 64 R-Box Port 0 Mask/Match Config 2
R_MSR_PORT0_XBR_SET1_MASK RW_NA 0x0E62 64 R-Box Port 0 Mask 1
R_MSR_PORT0_XBR_SET1_MATCH RW_NA 0x0E61 64 R-Box Port 0 Match 1
R_MSR_PORT0_XBR_SET1_MM_CFG RW_NA 0x0E60 64 R-Box Port 0 Mask/Match Config 1
R_MSR_PMON_CTR15 RW_RW 0x0E3F 64 R-Box PMON Counter 15
R_MSR_PMON_CTL15 RW_NA 0x0E3E 64 R-Box PMON Control 15
R_MSR_PMON_CTR14 RW_RW 0x0E3D 64 R-Box PMON Counter 14
R_MSR_PMON_CTL14 RW_NA 0x0E3C 64 R-Box PMON Control 14
2-75
Page 88

INTEL® XEON® PROCESSOR 7500 SERIES UNCORE PROGRAMMING GUIDE UNCORE PERFORMANCE MONITORING
MSR
MSR Name Access
R_MSR_PMON_CTR13 RW_RW 0x0E3B 64 R-Box PMON Counter 13
R_MSR_PMON_CTL13 RW_NA 0x0E3A 64 R-Box PMON Control 13
R_MSR_PMON_CTR12 RW_RW 0x0E39 64 R-Box PMON Counter 12
R_MSR_PMON_CTL12 RW_NA 0x0E38 64 R-Box PMON Control 12
R_MSR_PMON_CTR11 RW_RW 0x0E37 64 R-Box PMON Counter 11
R_MSR_PMON_CTL11 RW_NA 0x0E36 64 R-Box PMON Control 11
R_MSR_PMON_CTR10 RW_RW 0x0E35 64 R-Box PMON Counter 10
R_MSR_PMON_CTL10 RW_NA 0x0E34 64 R-Box PMON Control 10
R_MSR_PMON_CTR9 RW_RW 0x0E33 64 R-Box PMON Counter 9
R_MSR_PMON_CTL9 RW_NA 0x0E32 64 R-Box PMON Control 9
R_MSR_PMON_CTR8 RW_RW 0x0E31 64 R-Box PMON Counter 8
R_MSR_PMON_CTL8 RW_NA 0x0E30 64 R-Box PMON Control 8
R_MSR_PORT7_QLX_CFG RW_NA 0x0E2F 32 R-Box Port 7 QLX Perf Event Cfg
R_MSR_PORT6_QLX_CFG RW_NA 0x0E2E 32 R-Box Port 6 QLX Perf Event Cfg
R_MSR_PORT5_QLX_CFG RW_NA 0x0E2D 32 R-Box Port 5 QLX Perf Event Cfg
R_MSR_PORT4_QLX_CFG RW_NA 0x0E2C 32 R-Box Port 4 QLX Perf Event Cfg
R_MSR_PORT7_IPERF_CFG1 RW_NA 0x0E2B 32 R-Box Port 7 RIX Perf Event Cfg 1
R_MSR_PORT6_IPERF_CFG1 RW_NA 0x0E2A 32 R-Box Port 6 RIX Perf Event Cfg 1
R_MSR_PORT5_IPERF_CFG1 RW_NA 0x0E29 32 R-Box Port 5 RIX Perf Event Cfg 1
R_MSR_PORT4_IPERF_CFG1 RW_NA 0x0E28 32 R-Box Port 4 RIX Perf Event Cfg 1
R_MSR_PORT3_IPERF_CFG1 RW_NA 0x0E27 32 R-Box Port 3 RIX Perf Event Cfg 1
R_MSR_PORT2_IPERF_CFG1 RW_NA 0x0E26 32 R-Box Port 2 RIX Perf Event Cfg 1
R_MSR_PORT1_IPERF_CFG1 RW_NA 0x0E25 32 R-Box Port 1 RIX Perf Event Cfg 1
R_MSR_PORT0_IPERF_CFG1 RW_NA 0x0E24 32 R-Box Port 0 RIX Perf Event Cfg 1
Addres
Size
(bits)
s
Description
R_MSR_PMON_OVF_CTL_15_8 RW1C_WO0x0E22 32 R-Box PMON Overflow Ctrl for ctrs 15:8
R_MSR_PMON_GLOBAL_STATUS_15_8 RO_WO 0x0E21 32 R-Box PMON Global Status for ctrs 15:8
R_MSR_PMON_GLOBAL_CTL_15_8 RW_NA 0x0E20 32 R-Box PMON Global Control Counters
R_MSR_PMON_CTR7 RW_RW 0x0E1F 64 R-Box PMON Counter 7
R_MSR_PMON_CTL7 RW_NA 0x0E1E 64 R-Box PMON Control 7
R_MSR_PMON_CTR6 RW_RW 0x0E1D 64 R-Box PMON Counter 6
R_MSR_PMON_CTL6 RW_NA 0x0E1C 64 R-Box PMON Control 6
R_MSR_PMON_CTR5 RW_RW 0x0E1B 64 R-Box PMON Counter 5
R_MSR_PMON_CTL5 RW_NA 0x0E1A 64 R-Box PMON Control 5
R_MSR_PMON_CTR4 RW_RW 0x0E19 64 R-Box PMON Counter 4
R_MSR_PMON_CTL4 RW_NA 0x0E18 64 R-Box PMON Control 4
R_MSR_PMON_CTR3 RW_RW 0x0E17 64 R-Box PMON Counter 3
R_MSR_PMON_CTL3 RW_NA 0x0E16 64 R-Box PMON Control 3
R_MSR_PMON_CTR2 RW_RW 0x0E15 64 R-Box PMON Counter 2
R_MSR_PMON_CTL2 RW_NA 0x0E14 64 R-Box PMON Control 2
15:8
2-76
Page 89

INTEL® XEON® PROCESSOR 7500 SERIES UNCORE PROGRAMMING GUIDE UNCORE PERFORMANCE MONITORING
MSR
MSR Name Access
R_MSR_PMON_CTR1 RW_RW 0x0E13 64 R-Box PMON Counter 1
R_MSR_PMON_CTL1 RW_NA 0x0E12 64 R-Box PMON Control 1
R_MSR_PMON_CTR0 RW_RW 0x0E11 64 R-Box PMON Counter 0
R_MSR_PMON_CTL0 RW_NA 0x0E10 64 R-Box PMON Control 0
R_MSR_PORT3_QLX_CFG RW_NA 0x0E0F 32 R-Box Port 3 QLX Perf Event Cfg
R_MSR_PORT2_QLX_CFG RW_NA 0x0E0E 32 R-Box Port 2 QLX Perf Event Cfg
R_MSR_PORT1_QLX_CFG RW_NA 0x0E0D 32 R-Box Port 1 QLX Perf Event Cfg
R_MSR_PORT0_QLX_CFG RW_NA 0x0E0C 32 R-Box Port 0 QLX Perf Event Cfg
R_MSR_PORT7_IPERF_CFG0 RW_NA 0x0E0B 32 R-Box Port 7 RIX Perf Event Cfg 0
R_MSR_PORT6_IPERF_CFG0 RW_NA 0x0E0A 32 R-Box Port 6 RIX Perf Event Cfg 0
R_MSR_PORT5_IPERF_CFG0 RW_NA 0x0E09 32 R-Box Port 5 RIX Perf Event Cfg 0
R_MSR_PORT4_IPERF_CFG0 RW_NA 0x0E08 32 R-Box Port 4 RIX Perf Event Cfg 0
R_MSR_PORT3_IPERF_CFG0 RW_NA 0x0E07 32 R-Box Port 3 RIX Perf Event Cfg 0
R_MSR_PORT2_IPERF_CFG0 RW_NA 0x0E06 32 R-Box Port 2 RIX Perf Event Cfg 0
R_MSR_PORT1_IPERF_CFG0 RW_NA 0x0E05 32 R-Box Port 1 RIX Perf Event Cfg 0
R_MSR_PORT0_IPERF_CFG0 RW_NA 0x0E04 32 R-Box Port 0 RIX Perf Event Cfg 0
R_MSR_PMON_OVF_CTL_15_8 RW1C_WO0x0E02 32 R-Box PMON Overflow Ctrl for ctrs 7:0
Addres
Size
(bits)
s
Description
R_MSR_PMON_GLOBAL_STATUS_7_0 RO_WO 0x0E01 32 R-Box PMON Global Status for ctrs 7:0
R_MSR_PMON_GLOBAL_CTL_7_0 RW_NA 0x0E00 32 R-Box PMON Global Control Counters
2.6.3.1 R-Box Performance Monitors To Port Mapping
Table 2-40. R-Box Port Map
Port ID
QPI1 0 L b000 NA 0xE24,0xE04 0xE0C 0xE72-0xE70,
QPI0 1 L b001 NA 0xE25,0xE05 0xE0D 0xE76-0xE74,
S-Box0 2 L b010 NA 0xE26,0xE06 0xE0E 0xE7A-0xE78,
B-Box0 3 L b011 NA 0xE27,0xE07 0xE0F 0xE7E-0xE7C,
QPI2 4 R NA b100 0xE28,0xE08 0xE2C 0xE92-0xE90,
QPI3 5 R NA b000 0xE29,0xE09 0xE2D 0xE96-0xE94,
S-Box1 6 R NA b001 0xE2A,0xE0A 0xE2E 0xE9A-0xE98,
U/B-Box1 7 R NA b010 0xE2B,0xE0B 0xE2F 0xE9E-0xE9C,
R-Box
Port#
L/R
Box
PMU Cnt
0-7
PMU Cnt
8-15
IPERF
Addresses
7:0
ARB_PERF
Addresses
Match/Mask
Addresses
0xE62-0xE60
0xE66-0xE64
0xE6A-0xE68
0xE6E-0xE6C
0xE82-0xE80
0xE86-0xE84
0xE8A-0xE88
0xE8E-0xE8C
2-77
Page 90

INTEL® XEON® PROCESSOR 7500 SERIES UNCORE PROGRAMMING GUIDE UNCORE PERFORMANCE MONITORING
2.6.3.2 R-Box Box Level PMON state
The following registers represent the state governing all box-level PMUs in the R-Box.
The _GLOBAL_CTL register contains the bits used to enable monitoring. It is necessary to set the
.ctr_en bit to 1 before the corresponding data register can collect events.
If an overflow is detected from one of the R-Box PMON registers, the corresponding bit in the
_GLOBAL_STATUS.ov field will be set. To reset the overflow bits set in the _GLOBAL_STATUS.ov field, a
user must set the corresponding bits in the _GLOBAL_OVF_CTL.clr_ov field before beginning a new
sample interval.
Table 2-41. R_MSR_PMON_GLOBAL_CTL_{15_8, 7_0} Register Fields
Field Bits
ctr_en 7:0 0 Must be set to enable each RBOX counter (bit 0 to enable ctr0, etc)
HW
Reset
Val
Description
NOTE: U-Box enable and per counter enable must also be set to fully
enable the counter.
Table 2-42. R_MSR_PMON_GLOBAL_STATUS_{15_8, 7_0} Register Fields
Field Bits
ov 7:0 0 If an overflow is detected from the corresponding RBOX PMON register,
HW
Reset
Val
Description
it’s overflow bit will be set.
Table 2-43. R_MSR_PMON_OVF_CTL_{15_8, 7_0} Register Fields
Field Bits
clr_ov 7:0 0 Writing bit in field to ‘1’ will clear the corresponding overflow bit in
HW
Reset
Val
Description
R_CSR_PMON_GLOBAL_STATUS_{15_8,7_0} to 0.
2.6.3.3 R-Box PMON state - Counter/Control Pairs + Filters
The following table defines the layout of the R-Box performance monitor control registers. The main
task of these configuration registers is to select the subcontrol register that selects the event to be
monitored by the respective data counter. Setting the .ev_sel fields performs the subcontrol register
selection. The .en bit must be set to 1 to enable counting.
Additional control bits include:
- .pmi_en governs what to do if an overflow is detected.
2-78
Page 91

INTEL® XEON® PROCESSOR 7500 SERIES UNCORE PROGRAMMING GUIDE UNCORE PERFORMANCE MONITORING
Table 2-44. R_MSR_PMON_CTL{15-0} Register – Field Definitions
Field Bits
ig 63 0 Read zero; writes ignored. (?)
rsv 62:61 0 Reserved; Must write to 0 else behavior is undefined.
ig 60:7 0 Read zero; writes ignored. (?)
pmi_en 6 0 When this bit is asserted and the corresponding counter overflows, a PMI
ev_sel 5:1 0 Event Select
en 0 0 Enable counter
HW
Reset
Val
Description
exception is sent to the U-Box.
For the R-Bo x this means choosing which sub register contain s the actual
event select. Each control regi ster c an red irect the ev ent sel ect to one of
3 sets of registers: QLX, RIX or Mask/Match registers. It can further
select from one of two subselect fields (either in the same or different
registers).
And finally , each control c an ‘listen’ to events occu rring on one of 4 ports.
The first 8 control registers can refer to the first 4 ports and the last 8
control
So, for example:
RP_CR_R_CSR_PMON_CTL9 can refer to R_CSR_PORT{4-7}_IPERF{0-
1}
2-79
Page 92

INTEL® XEON® PROCESSOR 7500 SERIES UNCORE PROGRAMMING GUIDE UNCORE PERFORMANCE MONITORING
Table 2-45. R_MSR_PMON_CTL{15-8} Event Select
Name Code Description
PORT4_IPERF0 0 x00 Select Event Configured in R_CSR_PORT4_IPERF0
PORT4_IPERF1 0 x01 Select Event Configured in R_CSR_PORT4_IPERF1
PORT4_QLX0 0x02 Select Event Configured in R_CSR_PORT4_QLX_EVENT_CFG[*0]
PORT4_QLX1 0x03 Select Event Configured in R_CSR_PORT4_QLX_EVENT_CFG[*1]
PORT4_XBAR_MM1 0x04 Set1 Port4 XBAR Mask/Match
PORT4_XBAR_MM2 0x05 Set2 Port4 XBAR Mask/Match
PORT5_IPERF0 0 x06 Select Event Configured in R_CSR_PORT5_IPERF0
PORT5_IPERF1 0 x07 Select Event Configured in R_CSR_PORT5_IPERF1
PORT5_QLX0 0x08 Select Event Configured in R_CSR_PORT5_QLX_EVENT_CFG[*0]
PORT5_QLX1 0x09 Select Event Configured in R_CSR_PORT5_QLX_EVENT_CFG[*1]
PORT5_XBAR_MM1 0x0A Set1 Port5 XBAR Mask/Match
PORT5_XBAR_MM2 0x0B Set2 Port5 XBAR Mask/Match
PORT6_IPERF0 0x0C Select Event Configured in R_CSR_PORT6_IPERF0
PORT6_IPERF1 0x0D Select Event Configured in R_CSR_PORT6_IPERF1
PORT6_QLX0 0x0E Select Event Configured in R_CSR_PORT6_QLX_EVENT_CFG[*0]
PORT6_QLX1 0x0F Select Event Configured in R_CSR_PORT6_QLX_EVENT_CFG[*1]
PORT6_XBAR_MM1 0x10 Set1 Port6 XBAR Mask/Match
PORT6_XBAR_MM2 0x11 Set2 Port6 XBAR Mask/Match
PORT7_IPERF0 0 x12 Select Event Configured in R_CSR_PORT7_IPERF0
PORT7_IPERF1 0 x13 Select Event Configured in R_CSR_PORT7_IPERF1
PORT7_QLX0 0x14 Select Event Configured in R_CSR_PORT7_QLX_EVENT_CFG[*0]
PORT7_QLX1 0x15 Select Event Configured in R_CSR_PORT7_QLX_EVENT_CFG[*1]
PORT7_XBAR_MM1 0x16 Set1 Port7 XBAR Mask/Match
PORT7_XBAR_MM2 0x17 Set2 Port7 XBAR Mask/Match
ILLEGAL 0x18-
(* illegal selection *)
0x1F
2-80
Page 93

INTEL® XEON® PROCESSOR 7500 SERIES UNCORE PROGRAMMING GUIDE UNCORE PERFORMANCE MONITORING
Table 2-46. R_MSR_PMON_CTL{7-0} Event Select
Name Code Description
PORT0_IPERF0 0 x00 Select Event Configured in R_CSR_PORT0_IPERF0
PORT0_IPERF1 0 x01 Select Event Configured in R_CSR_PORT0_IPERF1
PORT0_QLX0 0x02 Select Event Configured in R_CSR_PORT0_QLX_EVENT_CFG[*0]
PORT0_QLX1 0x03 Select Event Configured in R_CSR_PORT0_QLX_EVENT_CFG[*1]
PORT0_XBAR_MM1 0x04 Set1 Port0 XBAR Mask/Match
PORT0_XBAR_MM2 0x05 Set2 Port0 XBAR Mask/Match
PORT1_IPERF0 0 x06 Select Event Configured in R_CSR_PORT1_IPERF0
PORT1_IPERF1 0 x07 Select Event Configured in R_CSR_PORT1_IPERF1
PORT1_QLX0 0x08 Select Event Configured in R_CSR_PORT1_QLX_EVENT_CFG[*0]
PORT1_QLX1 0x09 Select Event Configured in R_CSR_PORT1_QLX_EVENT_CFG[*1]
PORT1_XBAR_MM1 0x0A Set1 Port1 XBAR Mask/Match
PORT1_XBAR_MM2 0x0B Set2 Port1 XBAR Mask/Match
PORT2_IPERF0 0x0C Select Event Configured in R_CSR_PORT2_IPERF0
PORT2_IPERF1 0x0D Select Event Configured in R_CSR_PORT2_IPERF1
PORT2_QLX0 0x0E Select Event Configured in R_CSR_PORT2_QLX_EVENT_CFG[*0]
PORT2_QLX1 0x0F Select Event Configured in R_CSR_PORT2_QLX_EVENT_CFG[*1]
PORT2_XBAR_MM1 0x10 Set1 Port2 XBAR Mask/Match
PORT2_XBAR_MM2 0x11 Set2 Port2 XBAR Mask/Match
PORT3_IPERF0 0 x12 Select Event Configured in R_CSR_PORT3_IPERF0
PORT3_IPERF1 0 x13 Select Event Configured in R_CSR_PORT3_IPERF1
PORT3_QLX0 0x14 Select Event Configured in R_CSR_PORT3_QLX_EVENT_CFG[*0]
PORT3_QLX1 0x15 Select Event Configured in R_CSR_PORT3_QLX_EVENT_CFG[*1]
PORT3_XBAR_MM1 0x16 Set1 Port3 XBAR Mask/Match
PORT3_XBAR_MM2 0x17 Set2 Port3 XBAR Mask/Match
ILLEGAL 0x18-
(* illegal selection *)
0x1F
The R-Box performance monitor data registers are 48b wide. A counter overflow occurs when a carry
out bit from bit 47 is detected. Software can force all uncore counting to freeze after N events by
48
preloading a monitor with a count value of 2
- N and setting the control register to send a PMI to the
U-Box. Upon receipt of the PMI, the U-Box will disable counting ( Section 2.1.1.1, “Freezing on Counter
Overflow”). During the interval of time between overflow and global disable, the counter value will wr ap
and continue to collect events.
In this way, software can capture the precise number of events that occurred between the time uncore
counting was enabled and when it was disabled (or ‘frozen’) with minimal skew.
If accessible, software can continuously read the data registers without disabling event collection.
Table 2-47. R_MSR_PMON_CTR{15-0} Register – Field Definitions
Field Bits
event_count 47:0 0 48-bit performance event counter
HW
Reset
Val
Description
2-81
Page 94

INTEL® XEON® PROCESSOR 7500 SERIES UNCORE PROGRAMMING GUIDE UNCORE PERFORMANCE MONITORING
2.6.3.4 R-Box IPERF Performance Monitoring Control Registers
The following table contains the events that can be monitored if one of the RIX (IPERF) registers was
chosen to select the event.
Table 2-48. R_MSR_PORT{7-0}_IPERF_CFG{1-0} Registers (Sheet
1 of 2)
Field Bits
FLT_SENT 31 0x0 Flit Sent
NULL_IDLE 30 0x0 Null Idle Flit Sent
RETRYQ_OV 29 0x0 Retry Queue Overflowed in this Output Port.
RETRYQ_NE 28 0x0 Retry Queue Not Empty in this Output Port
OUTQ_OV 27 0x0 Output Queue Overflowed in this Ouput Port
OUTQ_NE 26 0x0 Output Queue Not Empty in this Output Port
RCVD_SPEC_FLT 25 0x0 Special Flit Received
RCVD_ERR_FLT 24 0x0 Flit Received which caused CRC Error
ig 23:22 0x0 Read zero; writes ignored. (?)
MC_ROLL_ALLOC 21 0x0 Used with MC field. If set, every individual allocation of selected MC
MC 20:17 0x0 EOT Message Class Count
EOT_NE 16 0x0 Count cycles that EOT is not Empty
ARB_SEL 15:9 0x00 Allocation to Arb Select Bit Mask:
HW
Reset
Val
Description
into EOT is reported. If 0, a ‘rolling’ count is reported (count
whenever count overflows 7b count - val of 128) for selected MC’s
allocation into EOT.
1000: Data Response - VN1
0111: Non-Coherent Standard
0110: Non-Coherent Bypass
0101: Snoop
0100: Data Response - VN0
0011: Non-Data Response
0010: Home VN1
0001: Home VN0
0b1XXXXXX: Home VN0
0bX1XXXXX: Home VN1
0bXX1XXXX: Snoop
0bXXX1XXX: Non-Data Response
0bXXXX1XX: Data Response - VN0/VN1
0bXXXXX1X: Non-Coherent Standard
0bXXXXXX1: Non-Coherent Bypass
2-82
Page 95

INTEL® XEON® PROCESSOR 7500 SERIES UNCORE PROGRAMMING GUIDE UNCORE PERFORMANCE MONITORING
Table 2-48. R_MSR_PORT{7-0}_IPERF_CFG{1-0} Registers (Sheet
2 of 2)
Field Bits
IQA_READ_OK 8 0x0 Bid wins arbitration. Read flit from IQA and drains to XBAR.
NEW_PVN 7:6 0x0 New Packet VN Select: Anded with result of New Packet Class Bit
NEW_PC 5:0 0x0 New Packet Class Bit Mask: Bit mask to select which packet types to
HW
Reset
Val
Mask.
11: VNA | VN1 | VN0
10: VNA
01: VN1
00: VN0
count. Anded with New Packet VN Sel ect.
b1XXXXX: Snoop
bX1XXXX: Home
bXX1XXX: Non-Data Response
bXXX1XX: Data Response
bXXXX1X: Non-Coherent Standard
bXXXXX1: Non-Coherent Bypass
2.6.3.5 R-Box QLX Performance Monitoring Control Registers
Description
The following table contains the events that can be monitored if one of the ARB registers was chosen to
select the event.
Table 2-49. R_MSR_PORT{7-0}_QLX_CFG Register Fields (Sheet 1
of 2)
Field Bits
ig 31:16 Read zero; writes ignored.
ev1_sub 15 0x0 Performance Event 1 Sub-Class Select:
ev1_cls 14:12 0x0 Performance Event 1 Class Select:
HW
Reset
Val
Description
0: VN0
1: VN1
000: HOM
001: SNP
010: NDR
011: NCS
100: DRS
101: NCB
110: VNA - Small
111: VNA - Large
2-83
Page 96

INTEL® XEON® PROCESSOR 7500 SERIES UNCORE PROGRAMMING GUIDE UNCORE PERFORMANCE MONITORING
Table 2-49. R_MSR_PORT{7-0}_QLX_CFG Register Fields (Sheet 2
of 2)
Field Bits
ev1_type 11:8 0x0 Performance Event 1 Type Select:
ev0_sub 7 0x0 Performance Event 0Sub-Class Select:
ev0_cls 6:4 0x0 Performance Event 0 Class Select:
ev0_type 3:0 0x0 Performance Event 0 Type Select:
HW
Reset
Val
Description
0000: Queue Arb Bid
0001: Local Arb Bid
0010: Global Arb Bid
0011: Queue Arb Fail
0100: Local Arb Fail
0101: Global Arb Fail
0110: Queue Arb Home Order Kill
0111: Local Arb Home Order Kill
1000: Global Arb Home Order Kill
1001: Target Available
1010: Starvation Detected
1011-1111: Reserved
0: VN0
1: VN1
000: HOM
001: SNP
010: NDR
011: NCS
100: DRS
101: NCB
110: VNA - Small
111: VNA - Large
0000: Queue Arb Bid
0001: Local Arb Bid
0010: Global Arb Bid
0011: Queue Arb Fail
0100: Local Arb Fail
0101: Global Arb Fail
0110: Queue Arb Home Order Kill
0111: Local Arb Home Order Kill
1000: Global Arb Home Order Kill
1001: Target Available
1010: Starvation Detected
1011-1111: Reserved
2.6.3.6 R-Box Registers for Mask/Match Facility
In addition to generic event counting, each port of the R-Box provides two pairs of MATCH/MASK
registers pair that allow a user to filter packet traffic serviced (crossing from an input port to an output
port) by the R-Box according to the packet Opcode, Message Class, Response, HNID and Physical
Address. Program the selected R-Box counter and IPERF subcounter to capture FLITS to capture the
filter match as an event.
2-84
Page 97

INTEL® XEON® PROCESSOR 7500 SERIES UNCORE PROGRAMMING GUIDE UNCORE PERFORMANCE MONITORING
To use the match/mask facility :
a) Set the MM_CFG (see Table 2-50, “R_MSR_PORT{7-0}_XBR_SET{2-1}_MM_CFG Registers”) .dis
field (bit 63) to 0 and .mm_trig_en (bit 21) to 1.
NOTE: In order to monitor packet traffic, instead of the flit traffic associated with each packet, set
.match_flt_cnt to 0x1.
b) Program the match/mask regs (see Table 2-51, “R_MSR_PORT{7-0}_XBR_SET{2-1}_MATCH
Registers” and Table 2-52, “R_MSR_PORT{7-0}_XBR_SET{2-1}_MASK Registers”).
c) Set the counter’s control register event select to the appropriate IPERF subcontrol register and set
the IPERF register’s event select to 0x31 (TO_R_PROG_EV) to capture the mask/match as a
performance event.
Table 2-50. R_MSR_PORT{7-0}_XBR_SET{2-1}_MM_CF G
Registers
Field Bits
dis 63 0x0 Disable; Set to 0 to enable use by PMUs.
ig 62:22 0x0 Read zero; writes ignored. (?)
mm_trig_en 21 0x0 Match/Mask trigger enable
ig_flt_cnt 20 0x0 Ignore flit count
match_flt_cnt 19:16 0x0 Match flit count
match_71_64 15:8 0x0 upper 8 bits [71:64] of match data
mask_71_64 7:0 0x0 upper 8 bits [71:64] of mask data
HW
Reset
Val
Description
Set to 1 to enable mask/match trigger
Set to ignore match_flt_cnt field
Set number of flit count in a packet on which to trigger a match
event. Ex: Set to ‘0001’ to match on first flit.
The following table contains the packet traffic that can be monitored if one of the mask/match registers
was chosen to select the event.
Table 2-51. R_MSR_PORT{7-0}_XBR_SET{2-1}_MATCH Registe rs
(Sheet 1 of 2)
Field Bits
--- 63:52 0x0 Reserved; Must write to 0 else behavior is undefined.
RDS 51:48 0x0 Response Data State (valid when MC == DRS and Opcode == 0x0-
HW
Reset
Val
Description
2). Bit settings are mutually exclusive.
b1000 - Modified
b0100 - Exclusive
b0010 - Shared
b0001 - Forwarding
b0000 - Invalid (Non-Coherent)
--- 47:36 0x0 Reserved; Must write to 0 else behavior is undefined.
RNID 35:31 0x0 Remote Node ID
--- 30:18 0x0 Reserved; Must write to 0 else behavior is undefined.
DNID 17:13 0x0 Destination Node ID
2-85
Page 98

INTEL® XEON® PROCESSOR 7500 SERIES UNCORE PROGRAMMING GUIDE UNCORE PERFORMANCE MONITORING
Table 2-51. R_MSR_PORT{7-0}_XBR_SET{2-1}_MATCH Registe rs
(Sheet 2 of 2)
Field Bits
MC 12:9 0x0 Message Class
OPC 8:5 0x0 Opcode
VNW 4:3 0x0 Virtual Network
HW
Reset
Val
b0000 HOM - Requests
b0001 HOM - Responses
b0010 NDR
b0011 SNP
b0100 NCS
--b1100 NCB
--b1110 DRS
DRS,NCB:
[8] Packet Size, 0 == 9 flits, 1 == 11 flits
NCS:
[8] Packet Size, 0 == 1 or 2 flits, 1 == 3 flits
See Section 2.9, “Packet Matching Refere nce” for a listing of opcode s
that may be filtered per message class.
Description
b00 - VN0
b01 - VN1
b1x - VNA
--- 2:0 0x0 Reserved; Must write to 0 else behavior is undefined.
Table 2-52. R_MSR_PORT{7-0}_XBR_SET{2-1}_MASK Registers
Field Bits
--- 63:52 0x0 Reserved; Must write to 0 else behavior is undefined.
RDS 51:48 0x0 Response Data State (for certain DRS messages)
--- 47:36 0x0 Reserved; Must write to 0 else behavior is undefined.
RNID 35:31 0x0 Remote Node ID
--- 30:18 0x0 Reserved; Must write to 0 else behavior is undefined.
DNID 17:13 0x0 Destination Node ID
MC 12:9 0x0 Message Class
OPC 8:5 0x0 Opcode
VNW 4:3 0x0 Virtual Network
--- 2:0 0x0 Reserved; Must write to 0 else behavior is undefined.
HW
Reset
Val
Description
See Section 2.9, “Packet Matching Refere nce” for a listing of opcode s
that may be filtered per message class.
Following is a selection of common events that may be derived by using the R-Box packet matching
facility.
2-86
Page 99

INTEL® XEON® PROCESSOR 7500 SERIES UNCORE PROGRAMMING GUIDE UNCORE PERFORMANCE MONITORING
Table 2-53. Message Events Derived from the Match/Mask filters
Field
DRS.AnyDataC 0x1C00 0x1F80 Any Data Response message containing a cache line in
DRS.DataC_M 0x1C00
DRS.WblData 0x1C80 0x1FE0 Data Response message for Write Back data where cacheline is
DRS.WbSData 0x1CA0 0x1FE0 Data Response message for Write Back data where cacheline is
DRS.WbEData 0x1CC0 0x1FE0 Data Response message for Write Back data where cacheline is
DRS.AnyResp 0x1C00 0x1E00 Any Data Response message. A DRS message can b e eit her 9
DRS.AnyResp9flits 0x1C00 0x1F00 Any Data Response message that is 11 flits in length. An 11
DRS.AnyResp11flits 0x1D00 0x1F00 Any Non Data Response completion message . A NDR message
NCB.AnyMsg9flits 0x1800 0x1F00 Any Non-Coherent Bypass message that is 9 flits in length. A
NCB.AnyMsg11flits 0x190 0 0x1F00 Any Non-Coherent Bypass message that is 11 flits in length.
NCB.AnyInt 0x1900 0x1F80 Any Non-Coherent Bypass interrupt message. NCB interrupt
Match
[15:0]
Match
[51:48]
&&
0x8
Mask
[15:0]
0x1FE0
Mask
[51:48]
Description
response to a core request. The AnyDataC messages are only
sent to an S-Box. The metric DRS.AnyResp - DRS.AnyDataC
will compute the number of DRS writeback and non snoop
write messages.
Data Response message of a cache line in M state that is
response to a core request. The DRS.DataC_M messages are
&&
only sent to S-Boxes.
0xF
set to the I state.
set to the S state.
set to the E state.
flits for a full cache line or 11 flits for partial data.
flit DRS message contains partial data. Each 8 byte chunk
contains an enable field that specifies if the data is valid.
is 1 on flit.
9 flit NCB message contains a full 64 byte cache line.
An 11 flit NCB message contains either partial data or an
interrupt. For NCB 11 flit data messages, each 8 byte chunk
contains an enable field that specifies if the data is valid.
messages are 11 flits in length.
NOTE: Bits 71:16 of the match/mask must be 0 in order to derive these events (except where noted see DRS.DataC_M). Also the match/mask configuration register should be set to 0x00210000 (bits 21
and 16 set).
2.6.4 R-BOX Performance Monitoring Events
2.6.4.1 An Overview:
The R-Box events pro vide information on topics such as: a breakdown of traffic as it flows through each
of the R-Box’s ports (NEW_PACKETS_RECV) , raw flit traffic (i.e. FLITS_REC_ERR or FLITS_SENT),
incoming transactions entered into arbitration for outgoing ports (ALLOC_TO_ARB), transactions that
fail arbitration (GLOBAL_ARB_BID_FAIL), tracking status of various queues (OUTPUTQ_NE), etc.
In addition, the R-Box provides the ability to match/mask against ALL flit traffic that leaves the R-Box.
This is particularly useful for calculating link utilization, throughput and packet traffic broken down by
opcode and message class.
2.6.5 R-Box Events Ordered By Code
Table 2-54 summarizes the directly-measured R-Box events.
2-87
Page 100

INTEL® XEON® PROCESSOR 7500 SERIES UNCORE PROGRAMMING GUIDE UNCORE PERFORMANCE MONITORING
0
Table 2-54. Performance Monitor Events for R-Box Events
Symbol Name
RIX Events IPERF
NEW_PACKETS_RECV [5:0]0xX 1 New Packets Received by Port
INQUE_READ_WIN [8]0x1 1 Input Queue Read Win
ALLOC_TO_ARB [15:9]0xX 1 Transactions allocated to Arb
EOT_NE_CYCLES [16]0x1 1 Cycles EOT Not Empty
EOT_OCCUPANCY [21]0x0 1 EOT Occupancy
EOT_INSERTS [21]0x1 1 Number of Inserts into EOT
FLITS_RECV_ERR [24]0x1 1 Error Flits Received
FLITS_RECV_SPEC [25]0x1 1 Special Flits Received
OUTPUTQ_NE [26]0x1 1 Output Queue Not Empty
OUTPUTQ_OVFL [27]0x1 1 Output Queue Overflowed
RETRYQ_NE [28]0x1 1 Retry Queue Not Empty
RETRYQ_OV [29]0x1 1 Retry Queue Overflowed
NULL_IDLE [30]0x1 1 Null Idle Flits
FLITS_SENT [31]0x1 1 Flits Sent
QLX Events QLX[3:0]
QUE_ARB_BID 0x0 1 Queue ARB Bids
LOCAL_ARB_BID 0x1 1 Local ARB Bids
GLOBAL_ARB_BID 0x2 1 Global ARB Bids
QUE_ARB_BID_FAIL 0x3 1 Failed Queue ARB Bids
LOCAL_ARB_BID_FAIL 0x4 1 Failed Local ARB Bids
GLOBAL_ARB_BID_FAIL 0x5 1 Failed Global ARB Bids
TARGET_AVAILABLE 0x9 1 Target Available
STARVING 0xA 1 Starvation Detective
Event
Code
Max
Inc/Cyc
Description
2.6.6 R-Box Performance Monitor Event List
This section enumerates Intel Xeon Processor 7500 Series uncore performance monitoring events for
the R-Box.
ALLOC_TO_ARB
• Title: Transactions allocated to ARB
• Category: RIX
• [Bit(s)] Value: See Note, Max. Inc/Cyc: 1,
• Definition: Transactions entered into Entry Table (counts incoming messages); This also means they
are now available.
• NOTE: Any combination of Message Class [15:9] may be monitored.
2-88
 Loading...