

Page 1

Innotech Service & Event Analyser
INSTALLATION INSTRUCTIONS
Page 2

Proprietary
No part of this technical manual may be reproduced, transmitted, transcribed, stored in a retrieval
system, or translated into any language or computer language, in any form or by any means, without
prior written permission of Mass Electronics Pty Ltd.
Trademark
The term ‘Innotech’ used in this manual is a trademark of Mass Electronics Pty Ltd trading as
Innotech Control Systems Australia.
'Microso' and 'Windows' are registered trademarks of Microso Corporation in the United States
and other countries.
Disclaimer
While great eorts have been made to assure the accuracy and clarity of this document, Mass
Electronics Pty Ltd assumes no liability resulting from any omissions in this document, or from
misuse of the information obtained herein. The information in this document has been carefully
checked and is believed to be entirely reliable with all of the necessary information included. Mass
Electronics Pty Ltd reserves the right to make changes to any products described herein to improve
reliability, function, or design, and reserves the right to revise this document and make changes
from time to time in content hereof with no obligation to notify any persons of revisions or changes.
Mass Electronics Pty Ltd does not assume any liability arising out of the application or any use of any
product or circuit described herein; neither does it convey licence under its patent rights or the rights
of others.
Edition 3.1 dated 26.03.2014
Page 2
© Mass Electronics Pty Ltd 2011
Page 3

Document Management
Document Title:
Innotech® Service and Event Analyser
Installation Instructions
Revision History
Version
Number
1.0 December 2011 First Version of Document
1.1 February 2012 Added details for starting and stopping the iSEA service
1.2 September 2012 Document Updated for iSEA v1.1
2.0 April 2013
3.0 November 2013 Document style update, contact details update.
3.1 March 2014 Updated for iSEA v2.1.
Date Summary of Changes
Document Updated for iSEA v2.0. Added details for new
Configuration, Virtual Points and Notification windows.
Page 3
© Mass Electronics Pty Ltd 2011Edition 3.1 dated 26.03.2014
Page 4

This page has been le intentionally blank.
Edition 3.1 dated 26.03.2014
Page 4
© Mass Electronics Pty Ltd 2011
Page 5

Contents
Chapter 1 - Preliminary Information
1-1 Introduction ............................................................................................................. 10
1-1.1 Systems Covered by this Manual ............................................................................ 10
1-1.2 Scope of this Technical Manual...............................................................................10
1-2 System Requirements ............................................................................................. 11
1-2.1 Computer System Requirements ...........................................................................11
1-2.2 iSEA Soware Requirements ..................................................................................11
Chapter 2 - Functionality of iSEA
2-1 Introduction ............................................................................................................. 14
2-2 Installation of iSEA ................................................................................................... 14
2-3 Overview of iSEA ...................................................................................................... 14
2-3.1 Stopping and Restarting the iSEA Service ..............................................................16
2-3.2 Services and Process Status Monitoring ................................................................17
2-3.3 Notifications in iSEA ................................................................................................18
Chapter 3 - Configuring iSEA
3-1 Introduction ............................................................................................................. 20
3-1.1 iSEA Configuration Window ....................................................................................20
3-2 Configure iSEA .......................................................................................................... 25
3-2.1 Setup of Monitoring in iSEA ..................................................................................... 25
3-2.2 Advanced Setup (Tenant Target Monitoring) ......................................................... 34
3-2.3 Setup of Virtual Points in iSEA .................................................................................37
Customer Assistance ...................................................................................................... 44
Innotech Support ..............................................................................................................44
Page 5
© Mass Electronics Pty Ltd 2011Edition 3.1 dated 26.03.2014
Page 6

List of Illustrations
Figure 2-1:
Figure 2-2:
Figure 2-3:
Figure 2-4:
Figure 2-5:
Figure 2-6:
Figure 2-7:
Figure 2-8:
Figure 2-9:
Figure 3-1:
Figure 3-2:
Figure 3-3:
Figure 3-4:
Figure 3-5:
Figure 3-6:
Figure 3-7:
Figure 3-8:
iSEA icon in the Windows Taskbar .......................................................................... 14
Viewing hidden icons in Windows Taskbar ............................................................ 14
Windows XP Taskbar properties ............................................................................. 15
iSEA Right Click Context Menu ...............................................................................15
iSEA Program Group in the Windows 7 All Programs Menu .................................16
iSEA Program Group in the Windows XP All Programs Menu ................................ 16
iSEA Context Menu - Service Status .......................................................................17
Services and Programs monitored in iSEA............................................................. 17
Windows Application logs on Windows 7 and XP .................................................. 18
iSEA System Tray Icon Context Menu ..................................................................... 20
iSEA Configuration Window .................................................................................... 20
Notifications Configuration Settings ......................................................................21
iComm Points Configuration Settings .................................................................... 22
Process Monitoring Configuration Window ........................................................... 23
Monitored Processes Configuration Window ........................................................24
Creating a new TCP Connection in iComm ............................................................25
iComm TCP Connection General Properties ..........................................................26
Figure 3-9:
Figure 3-10:
Figure 3-11:
Figure 3-12:
Figure 3-13:
Figure 3-14:
Figure 3-15:
Figure 3-16:
Figure 3-17:
Figure 3-18:
Figure 3-19:
Figure 3-20:
Figure 3-21:
Figure 3-22:
Figure 3-23:
Figure 3-24:
Figure 3-25:
iComm TCP Connection Network Properties ........................................................26
Devices in iSEA Connection ....................................................................................26
iSEA Devices loaded in iComm ...............................................................................27
Open FM Builder ...................................................................................................... 27
FM Builder Alarm Groups Tab ................................................................................. 28
FM Builder - Create a new IO Server ....................................................................... 28
FM Builder - Create a new iSEA Device ................................................................... 29
Create a new Point called "Chronicle Running" ................................................... 29
FM Builder - Add Point to an Alarm Group .............................................................30
FM Builder Alarm Groups ........................................................................................ 32
FM Builder Messages Tab ....................................................................................... 32
FM Builder Sending Tab ..........................................................................................33
Chronicle Data Folder - Extract Tenant Target Point Addresses ...........................34
Enter the Location and Password of SQL Server ................................................... 34
Create a new Device for Tenant Points ...................................................................35
Create the required Tenant Points .........................................................................35
Setup Tenant Alarm Groups as required ................................................................ 36
Edition 3.1 dated 26.03.2014
Page 6
© Mass Electronics Pty Ltd 2011
Page 7

Figure 3-26:
Accessing Virtual Points configuration in iSEA ......................................................37
Figure 3-27:
Figure 3-28:
Figure 3-29:
Figure 3-30:
Figure 3-31:
Figure 3-32:
Figure 3-33:
Figure 3-34:
Figure 3-35:
Figure 3-36:
Figure 3-37:
Figure 3-38:
Virtual Points configuration - iComm Server settings ........................................... 37
Add New Virtual Points ...........................................................................................38
Enter Details for the Virtual Point ........................................................................... 38
New Virtual Points Created ..................................................................................... 38
Enabling / Disabling Virtual Points ......................................................................... 39
Permanently remove a Virtual Point ...................................................................... 39
Creation of Actual Points under Virtual Points ...................................................... 40
Creating Actual Points ............................................................................................40
Deletion of Actual Points under Virtual Points ......................................................41
Click OK to create the Virtual Points ......................................................................41
Virtual point creation notification ..........................................................................42
iComm with new virtual device ..............................................................................42
List of Tables
Table 1-1:
Table 1-2:
Table 2-1:
Table 2-2:
Table 3-1:
Table 3-2:
Table 3-3:
Table 3-4:
Table 3-5:
Table 3-6:
Chapter List .............................................................................................................10
iSEA Soware Requirements ..................................................................................11
iSEA Features and Functions .................................................................................. 15
Types of Notifications in iSEA .................................................................................18
Notification Settings ...............................................................................................21
iComm Points Settings ...........................................................................................22
Process Monitoring Settings ...................................................................................23
Monitored Processes Settings ................................................................................ 24
FM Alarm Group Activation Settings ......................................................................31
Elements of an Actual Point within a Virtual Point ................................................ 40
Page 7
© Mass Electronics Pty Ltd 2011Edition 3.1 dated 26.03.2014
Page 8

This page has been le intentionally blank.
Edition 3.1 dated 26.03.2014
Page 8
© Mass Electronics Pty Ltd 2011
Page 9

Innotech Service & Event Analyser
INSTALLATION INSTRUCTIONS
Preliminary Information
1
Page 10

Innotech Service & Event Analyser Installation Instructions
1-1 Introduction
This manual is intended to provide the customer with complete and comprehensive documentation
to set up and configure the Innotech Service and Event Analyser (iSEA) on a Building Management
System (BMS) computer.
iSEA is a Windows® based application that resides in the system tray. Its main purpose is to provide
notifications to the user of events that occur in Innotech Service based applications that may not
have a dedicated application status monitoring tool, such as Chronicle Server. It also facilitates
restarting Innotech services if they are unexpectedly terminated, in order to reduce the need for
human intervention.
Customers should familiarise themselves with the content of this manual before attempting
installation and setup of iSEA on their computer.
Throughout this manual there are icons to illustrate notes and points of caution, as illustrated below:
These notices indicate a piece of useful information which should be read.
IMPORTANT
These notices contain information about the soware that must be done before proceeding further to ensure
success.
1-1.1 Systems Covered by this Manual
The manual covers the preparation and configuration of iSEA and its features for use with the
Innotech Chronicle and iComm server programs.
1-1.2 Scope of this Technical Manual
This technical manual contains the following Chapters:
Table 1-1: Chapter List
Chapter Name Description
Contains initialisation related information
Chapter 1 - Preliminary Information
Chapter 2 - Functionality of iSEA
Chapter 3 - Configuring iSEA
of a general nature such as computer
requirements and pre-installation materials.
Contains information about the various
features of iSEA.
Contains instructions for configuring the
various features within iSEA.
Edition 3.1 dated 26.03.2014
Page 10
© Mass Electronics Pty Ltd 2011
Page 11

Innotech Service & Event Analyser Installation Instructions
1-2 System Requirements
1-2.1 Computer System Requirements
Minimum System Requirements:
• Intel® Pentium® Dual-Core 2.8GHz dual-core processor or equivalent
• 2GB of RAM
• 80GB Hard Disk Drive
• 1024 x 768 display with 16-bit video card
• CD-ROM or DVD-ROM drive
• Keyboard and mouse or compatible pointing device
Supported Operating Systems:
• Windows• ® Server 2008 R2 with Service Pack 1
• Windows 7 Professional (32-bit / 64-bit) with Service Pack 1
• Windows XP Professional 32-bit with Service Pack 3
1-2.2 iSEA Soware Requirements
The soware requirements for iSEA vary slightly depending on the functionality required. The various
functions of iSEA and the soware that each requires is listed below.
Table 1-2: iSEA Software Requirements
Functionality Soware Requirements
Monitoring Chronicle Server Status Chronicle Server 1.9 or greater
Virtual Points iComm 1.30R or greater
Chronicle 1.9 or greater
Alarm generation for Chronicle Server Status
Tenant Target Monitoring with Alarm
Generation
iComm 1.30R or greater
Facility Manager 1.10K or greater
Chronicle Server 1.9 or greater
ATOM 2.2 or greater
iComm 1.30R or greater
Facility Manager 1.10K or greater
Chapter 1 – Preliminary Information
Page 11
© Mass Electronics Pty Ltd 2011
Page 12

Innotech Service & Event Analyser Installation Instructions
This page has been le intentionally blank.
Edition 3.1 dated 26.03.2014
Page 12
© Mass Electronics Pty Ltd 2011
Page 13

Innotech Service & Event Analyser
INSTALLATION INSTRUCTIONS
Functionality of iSEA
2
Page 14
Innotech Service & Event Analyser Installation Instructions
2-1 Introduction
iSEA is a Windows® based application that resides in the system tray. Its main purpose is to provide
notifications to the user of events that occur in Innotech Service based applications that may not
have a dedicated application status monitoring tool. It also facilitates restarting of Innotech services
if they are unexpectedly terminated, in order to reduce the need for human intervention.
iSEA monitors Chronicle Server, iComm 1.30R & SQL Server.
2-2 Installation of iSEA
iSEA is automatically installed along with Chronicle Server 1.9 or greater. Therefore there are no
additional steps required for the installation of iSEA.
2-3 Overview of iSEA
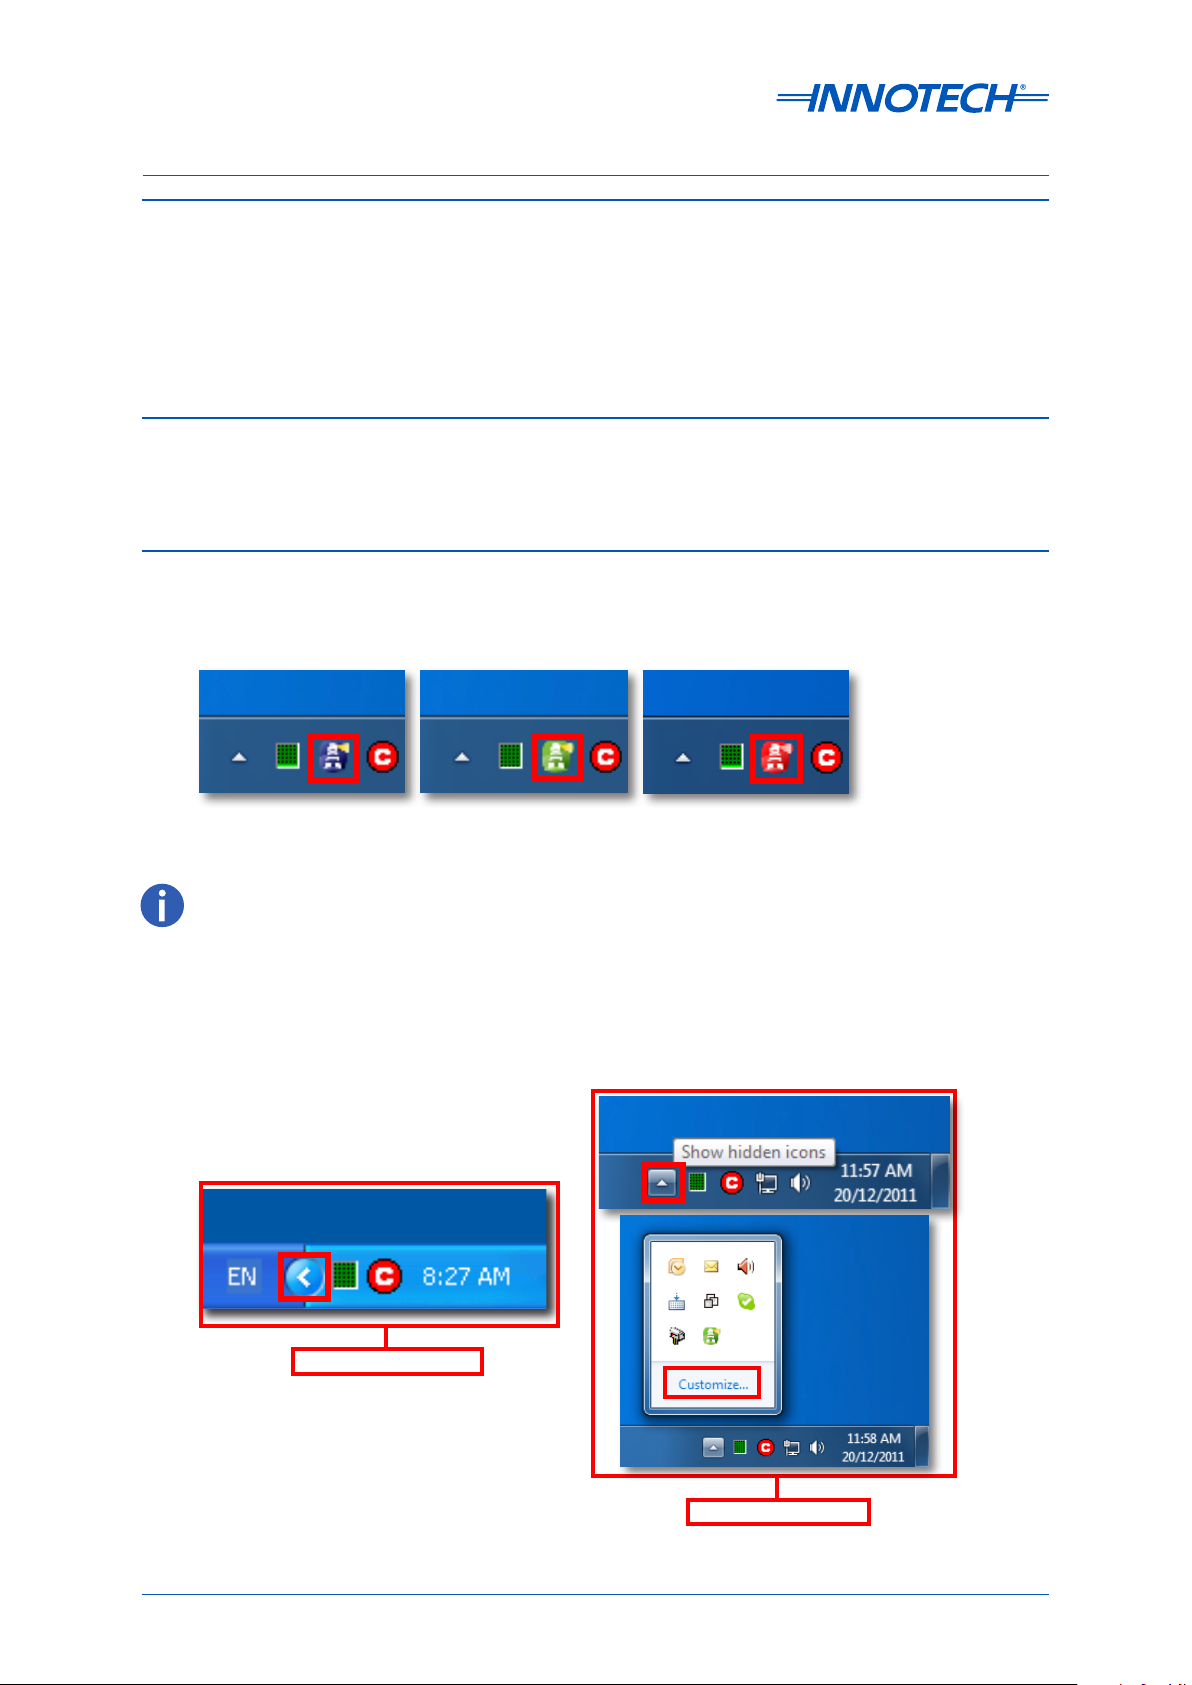
iSEA is automatically started when the user logs in. It is visible as a icon on the windows taskbar as
shown below in Figure 2-1.
Figure 2-1: iSEA icon in the Windows Taskbar
The iSEA icon is static blue if there are no notifications in the notification list. It flashes green/blue if there are
notifications in the notification list. It continually flashes red/green if there are active critical errors, but as soon as
the errors are resolved, it will return to flashing green/blue to advise you of new notifications.
The iSEA icon may be hidden due to the default settings in Windows. These hidden icons can be
viewed by expanding the task bar. The settings for individual elements may be set by selecting
customize.
Windows XP Taskbar
Figure 2-2: Viewing hidden icons in Windows Taskbar
Edition 3.1 dated 26.03.2014
Page 14
Windows 7 Taskbar
© Mass Electronics Pty Ltd 2011
Page 15

Innotech Service & Event Analyser Installation Instructions
Customise the taskbar settings in Windows XP by right clicking a blank area of the taskbar and
selecting properties. In the Taskbar and Start Menu Properties Window, uncheck the Hide Inactive
Icons box and then press OK as shown in Figure 2-3. All system icons will now be visible.
Figure 2-3: Windows XP Taskbar properties
Table 2-1: iSEA Features and Functions
ISEA Features Function
Configuration Change the port configuration for iSEA. Default is 21001.
Service Status Check the status of monitored applications.
This functionality enables monitoring of points so that timely notifications
Monitored Points
of excessive usage may be generated, and actions taken to notify
customers promptly.
Notifications View the monitored application notifications and alerts.
Virtual Points Create virtual points to perform calculations on real point values.
Configurable items for these features may be accessed via right clicking on the iSEA icon in the
windows system tray as shown below in Figure 2-4.
Figure 2-4: iSEA Right Click Context Menu
Chapter 2 – Functionality of iSEA
Page 15
iSEA Icon
© Mass Electronics Pty Ltd 2011
Page 16

Innotech Service & Event Analyser Installation Instructions
2-3.1 Stopping and Restarting the iSEA Service
The iSEA service automatically starts when you login to the computer. In the event that iSEA requires
manual stopping and restarting, such as when Innotech soware is being installed or upgraded, this
can be achieved from the iSEA shortcuts located in the iSEA program group.
IMPORTANT
If you are upgrading your soware, the iSEA service must be stopped before upgrading. The iSEA service must
be restarted aer upgrading your Innotech soware, to ensure correct operation of the Innotech services being
monitored.
Windows 7
• Click the windows icon on the taskbar.
• Click All Programs and navigate to the
iSEA folder.
• Click either "Start iSEA" or "Stop iSEA" as
required as shown in Figure 2-5.
Windows XP
• Click the Start Button on the taskbar.
• Highlight All Programs and navigate to
the iSEA folder.
• Click either "Start iSEA" or "Stop iSEA" as
required as shown in Figure 2-6.
Figure 2-5: iSEA Program Group in the Windows 7 All Programs Menu
Figure 2-6: iSEA Program Group in the Windows XP All Programs Menu
Edition 3.1 dated 26.03.2014
Page 16
© Mass Electronics Pty Ltd 2011
Page 17

Innotech Service & Event Analyser Installation Instructions
2-3.2 Services and Process Status Monitoring
iSEA monitors the status of the following programs and services:
• Chronicle Server
• iComm
• SQL Server Express
Right Click the iSEA icon and select the Service Status option in the iSEA menu as shown below in
Figure 2-7.
Figure 2-7: iSEA Context Menu - Service Status
Figure 2-8: Services and Programs monitored in iSEA
Chapter 2 – Functionality of iSEA
Page 17
© Mass Electronics Pty Ltd 2011
Page 18

Innotech Service & Event Analyser Installation Instructions
2-3.3 Notifications in iSEA
iSEA displays several types of notifications in order to provide the user with information regarding
the operation of Innotech Soware. See the configuration section for details on configuring iSEA
notifications.
Table 2-2: Types of Notications in iSEA
Notification
Icon
Notification Type Information covered by Notification
Indicates general information e.g. -
Information
• Database backup progress
• Starting of Services and Processes
• Virtual Point Creation
Indicated import information that may indicate a
Warning
potential problem e.g. -
• Disconnection from iComm
Indicates a problem with a monitored service or process
e.g. -
Error
• Disconnection from Chronicle Server
• Inability to connect to iComm
Important notifications such as Errors and other significant notifications will be written to the Windows Application
log. This log is accessible from the Windows Computer Management Interface.
Figure 2-9: Windows Application logs on Windows 7 and XP
To access Windows Computer Management:
Windows 7: Right click "Computer" in the Windows Menu and select Manage.
Windows XP: Right click "My Computer" in the Windows Start Menu and select Manage.
Edition 3.1 dated 26.03.2014
Page 18
© Mass Electronics Pty Ltd 2011
Page 19

Innotech Service & Event Analyser
INSTALLATION INSTRUCTIONS
Configuring iSEA
3
Page 20

Innotech Service & Event Analyser Installation Instructions
3-1 Introduction
This section provides the instructions on how to configure the functions of iSEA including the setup
of Virtual points and setup for Monitoring of Chronicle & iSEA using Facility Manager.
3-1.1 iSEA Configuration Window
Right click the iSEA icon in the system tray and select Configure from the context menu to open the
Configuration window.
Figure 3-1: iSEA System Tray Icon Context Menu
Figure 3-2: iSEA Conguration Window
Edition 3.1 dated 26.03.2014
Page 20
© Mass Electronics Pty Ltd 2011
Page 21

Innotech Service & Event Analyser Installation Instructions
3-1.1.1 Notifications
Table 3 -1 describes the function of each setting for the Notifications. These settings configure how
messages from iSEA are displayed.
Figure 3-3: Notications Conguration Settings
Table 3-1: Notication Settings
Setting Function
Display Popup Balloon
Max. Displayed Notifications
When checked, iSEA will display a notification balloon in the
Windows notification area.
Sets the number of notifications that can be displayed in the
notification balloon.
Popup Balloon Delay Amount of time that the notification balloon will be displayed for.
Save Notifications Interval
Current Notifications
Notifications will be saved to a backup file at the interval in this
setting.
Displays the current number of notifications in the Notification
Window.
Clear All Click to clear all notifications from the notification window.
Chapter 3 – Configuring iSEA
Page 21
© Mass Electronics Pty Ltd 2011
Page 22

Innotech Service & Event Analyser Installation Instructions
3-1.1.2 iComm Points
iSEA utilises a specific TCP Port in order to communicate with iComm. By default, iSEA utilises TCP
Port 21001. In order to specify a dierent TCP Port, type a new port number into the configuration
window. These settings are important as it is used in the setup of Monitored points and Virtual
Meters in iSEA and iComm.
Figure 3-4: iComm Points Conguration Settings
Table 3-2: iComm Points Settings
Setting Function
TCP/IP Port Sets the port number for iSEA connection to iComm.
Enable iComm Point Reporting Enables iSEA to send selected point values to iComm.
Tenant Target Monitoring Points
iSEA will report tenant target values for the local Chronicle server
on the target monitoring device.
Virtual Points iSEA will report virtual point values on the virtual point device.
Enables application specific devices to report to iComm.
ie iSEA's Internal Points.
iSEA:
• ChronicleRunning~Output
• SQL_Express~Output
Application Specific
Chronicle Server:
• DbConnected~Output
• iCommConnected~Output
• AllocatedDB~Output
• ReportingUsage~Output
• DongleConnected~Output
• DatabaseLogging~Output
Edition 3.1 dated 26.03.2014
Page 22
© Mass Electronics Pty Ltd 2011
Page 23

Innotech Service & Event Analyser Installation Instructions
3-1.1.3 Process Monitoring
These settings enable or disable monitoring of monitored processes and sets the delay in seconds for
process checking and restarting.
IMPORTANT
Disabling monitored processes will impact data integrity and should only be used for troubleshooting or
maintenance.
Figure 3-5: Process Monitoring Conguration Window
Table 3-3: Process Monitoring Settings
Setting Function
Enable Monitoring
iComm Comms Check
Click to enable or disable monitoring of selected Innotech processes
and services.
Time delay before iSEA reports a communications failure with
iComm, aer at least two failed attempts.
Time delay before iSEA terminates an unresponsive application. Only
Terminate Unresponsive App
applications with user interfaces (iComm) can be terminated and
restarted using this feature.
Minimum Restart Delay
Time delay before iSEA restarts an application that is detected as not
running.
Chapter 3 – Configuring iSEA
Page 23
© Mass Electronics Pty Ltd 2011
Page 24

Innotech Service & Event Analyser Installation Instructions
3-1.1.4 Monitored Processes
These settings enable or disable monitoring of selected Innotech processes and services. Check or
uncheck items as required.
IMPORTANT
Notifications and service status for disabled processes will not be displayed, nor will they be restarted if not
running.
Figure 3-6: Monitored Processes Conguration Window
Table 3-4: Monitored Processes Settings
Setting Function
Chronicle Server Allows Chronicle Server to be monitored by iSEA.
SQL Server Express Allows SQL Server Express to be monitored by iSEA.
iComm Allows iComm to be monitored by iSEA.
Edition 3.1 dated 26.03.2014
Page 24
© Mass Electronics Pty Ltd 2011
Page 25

Innotech Service & Event Analyser Installation Instructions
3-2 Configure iSEA
3-2.1 Setup of Monitoring in iSEA
The steps below describe how to enable Facility Manager (FM) to monitor the Chronicle Server
service and some of its components to ensure it is running, and setup an alarm if the service fails
unexpectedly.
Notifications in FM may be set up to alert maintenance sta of various potential faults that may occur
when Chronicle is logging data, such as if the database connection fails. Database usage may also be
monitored, so that precautions may be taken when the database approaches capacity to ensure no
data is lost.
This guide assumes that the Point Reporting settings in the iSEA Configuration window are enabled,
all soware detailed above has been installed and configured as specified in the relevant setup
guides, and that the user is familiar with the operation of a Microso Windows computer.
1. In the iComm window, right click a blank area in the top pane and add a new TCP/IP
connection.
Figure 3-7: Creating a new TCP Connection in iComm
To edit the connection later, right click the connection and select Connection Properties from the context menu.
IMPORTANT
Prior to setup, ensure that the configuration settings in iSEA are correct for your installation.
Chapter 3 – Configuring iSEA
Page 25
© Mass Electronics Pty Ltd 2011
Page 26
Innotech Service & Event Analyser Installation Instructions
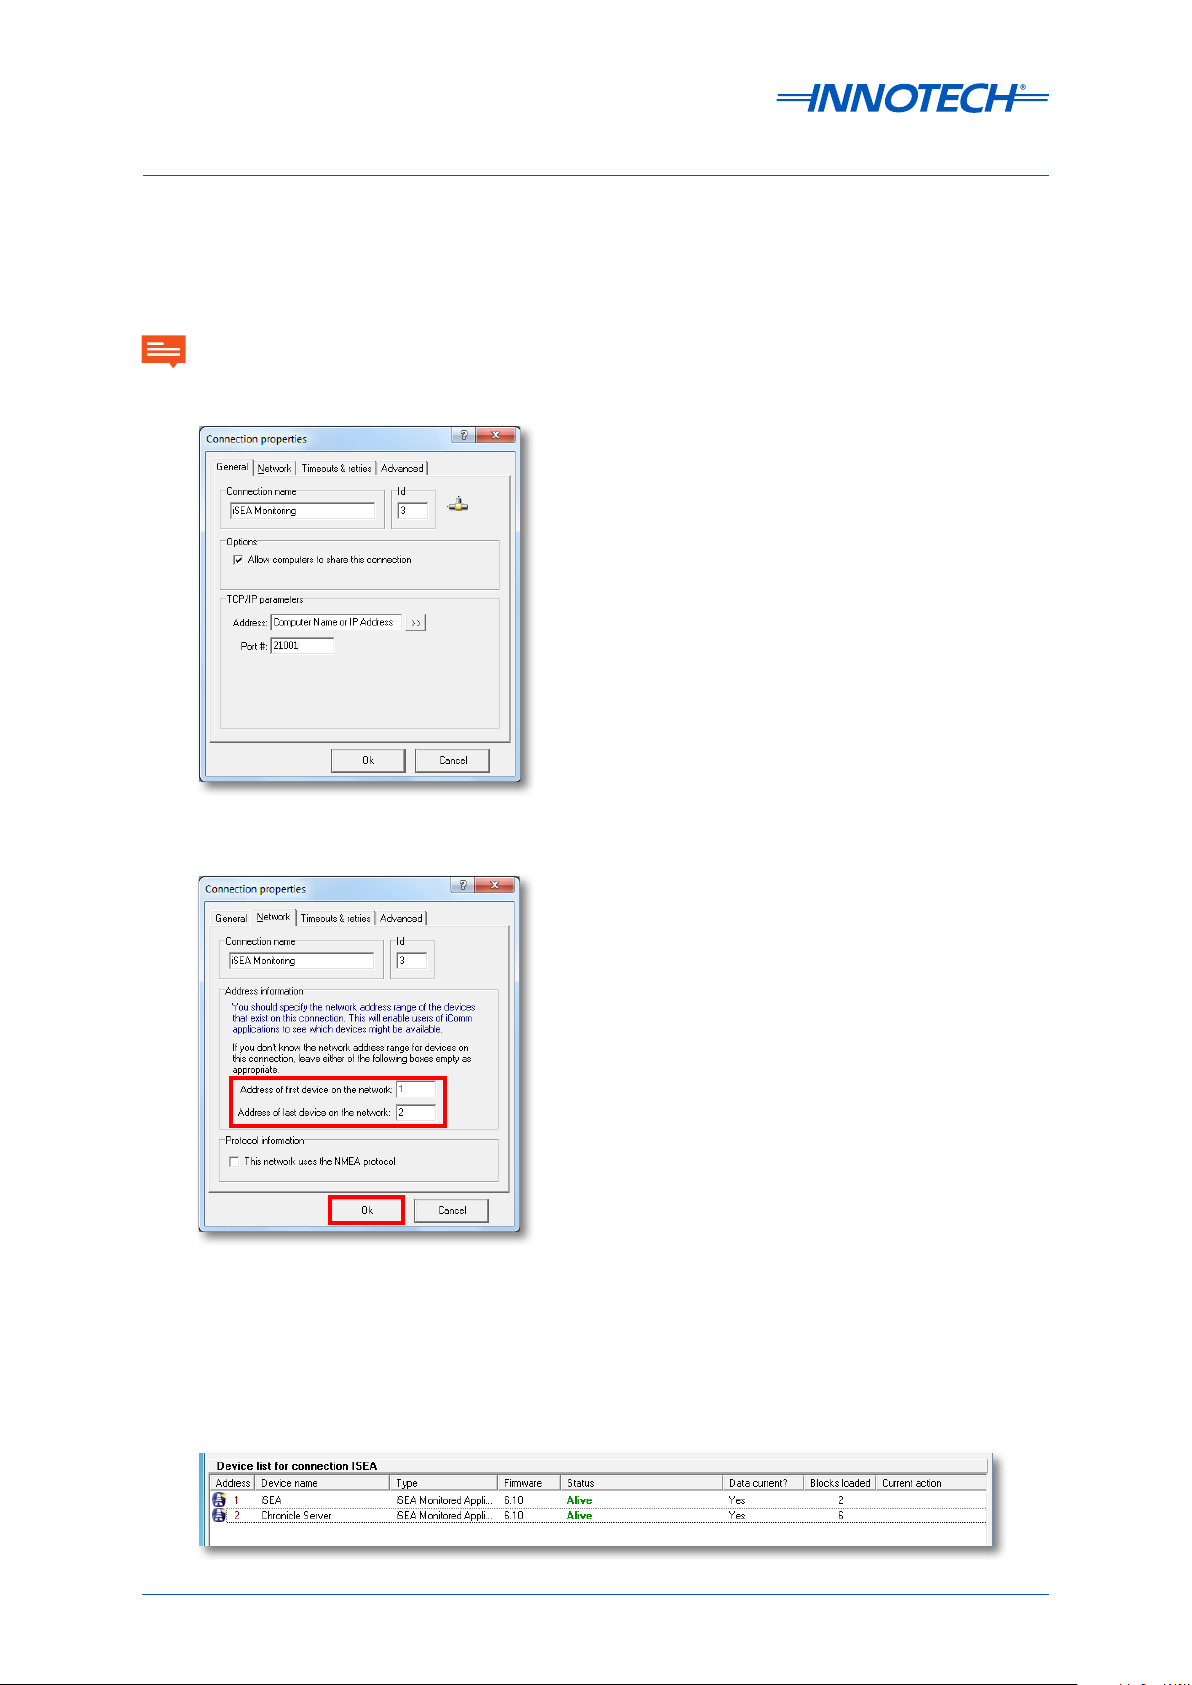
2. In the General tab, set the Connection name to ‘iSEA Monitoring’, the Address to the
computer name or IP address of the computer running iSEA, and the Port to 21001.
3. In the Network tab, set the Address of the first device to 1, and the Address of the last device
to 2.
4. Click the Ok button to confirm the settings as shown below in Figure 3-9.
IMPORTANT
If Process Monitoring is disabled for certain products, they will no longer show in iComm or have a device address
on the network.
Figure 3-8: iComm TCP Connection General Properties
Figure 3-9: iComm TCP Connection Network Properties
5. Two devices will be listed under the connection if the settings are correct and iSEA is
running. The first device will have the device name ‘iSEA’, and its Status will be Alive when
the connection to iSEA is successful. Two blocks will be loaded for this device.
Figure 3-10: Devices in iSEA Connection
Edition 3.1 dated 26.03.2014
Page 26
© Mass Electronics Pty Ltd 2011
Page 27

Innotech Service & Event Analyser Installation Instructions
6. The second device is named ‘Chronicle Server’, and will only be alive when iSEA has
connected to Chronicle Server. There will be 6 blocks loaded for this device as shown below
in Figure 3-11.
Connection List Window
Devices Loaded List Window
Figure 3-11: iSEA Devices loaded in iComm
7. Open FM Builder, and create a new project or open an existing one.
Figure 3-12: Open FM Builder
Chapter 3 – Configuring iSEA
Page 27
© Mass Electronics Pty Ltd 2011
Page 28
Innotech Service & Event Analyser Installation Instructions
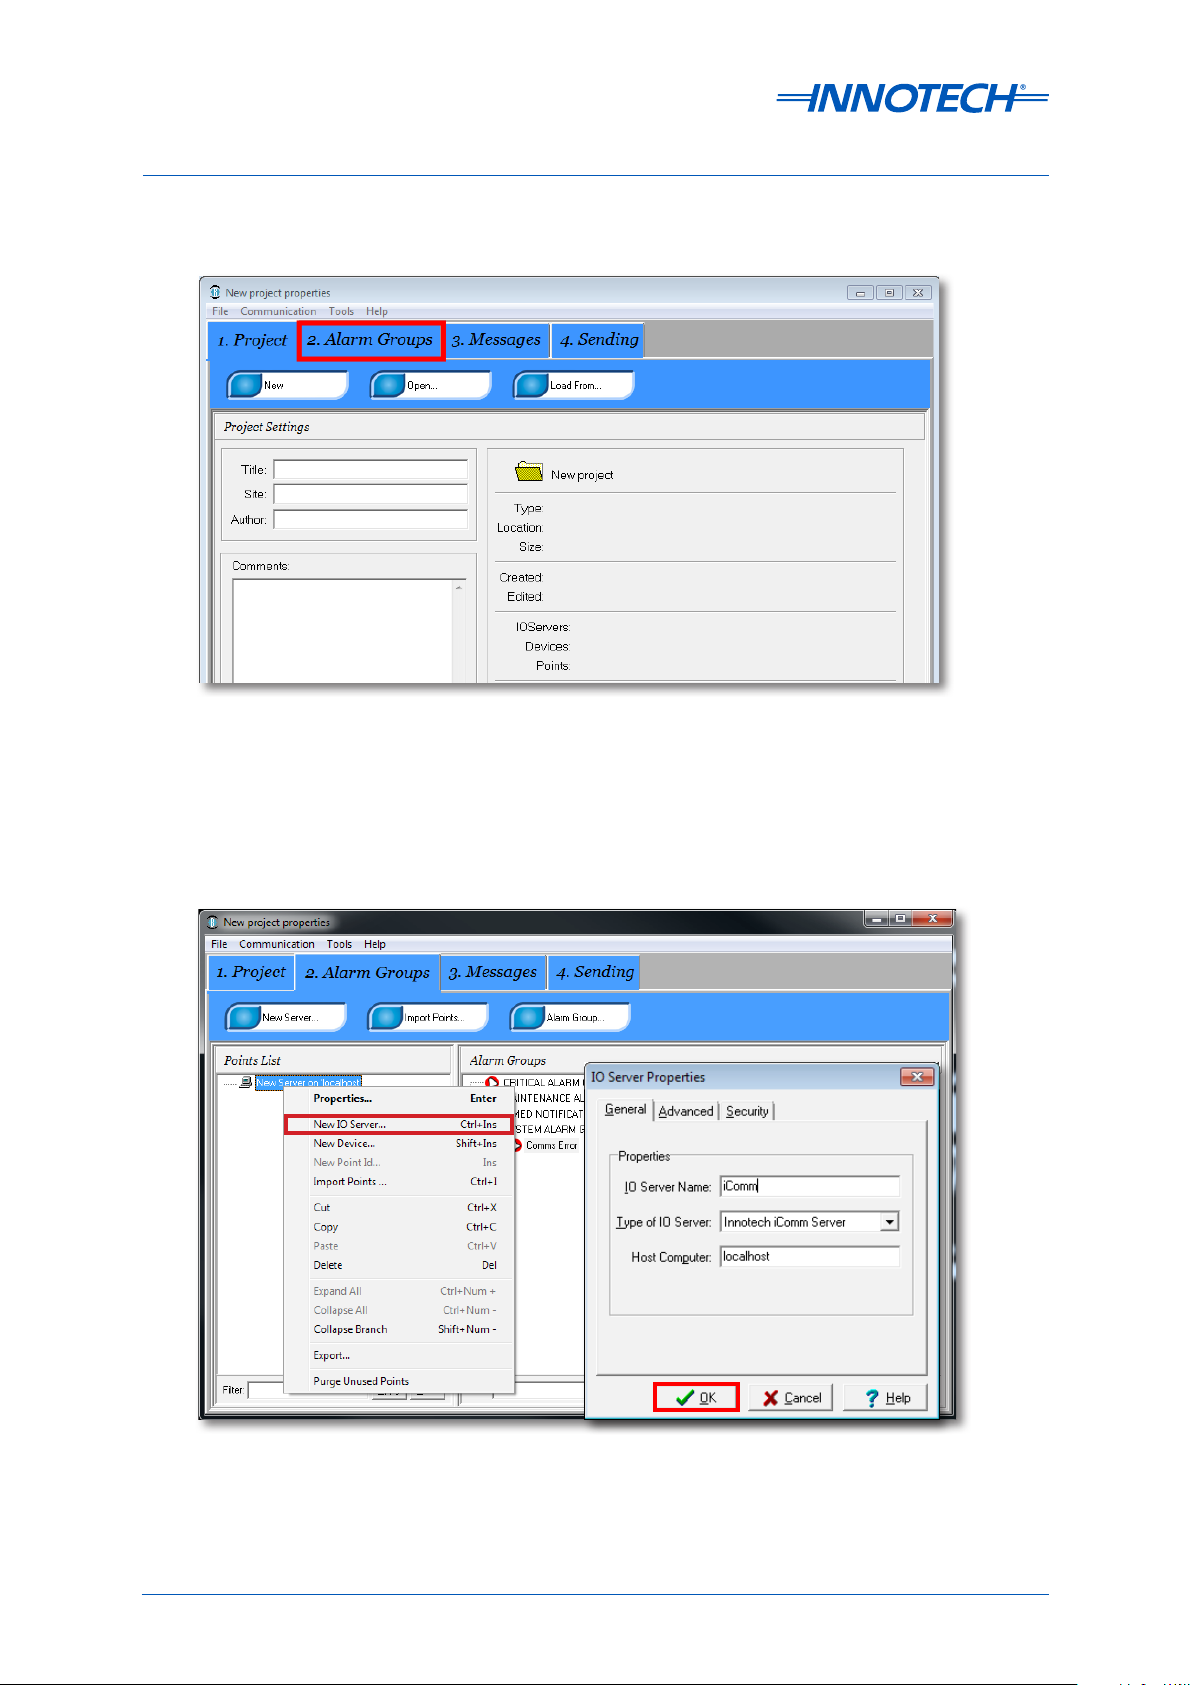
8. Click on the ‘Alarm Groups’ tab.
Figure 3-13: FM Builder Alarm Groups Tab
9. Add a new Server using the ‘New Server’ button if iComm does not already exist in the
project.
10. Enter a name for the server, and the address of the iComm computer, then click the ‘Ok’
button.
Figure 3-14: FM Builder - Create a new IO Server
Edition 3.1 dated 26.03.2014
Page 28
© Mass Electronics Pty Ltd 2011
Page 29
Innotech Service & Event Analyser Installation Instructions
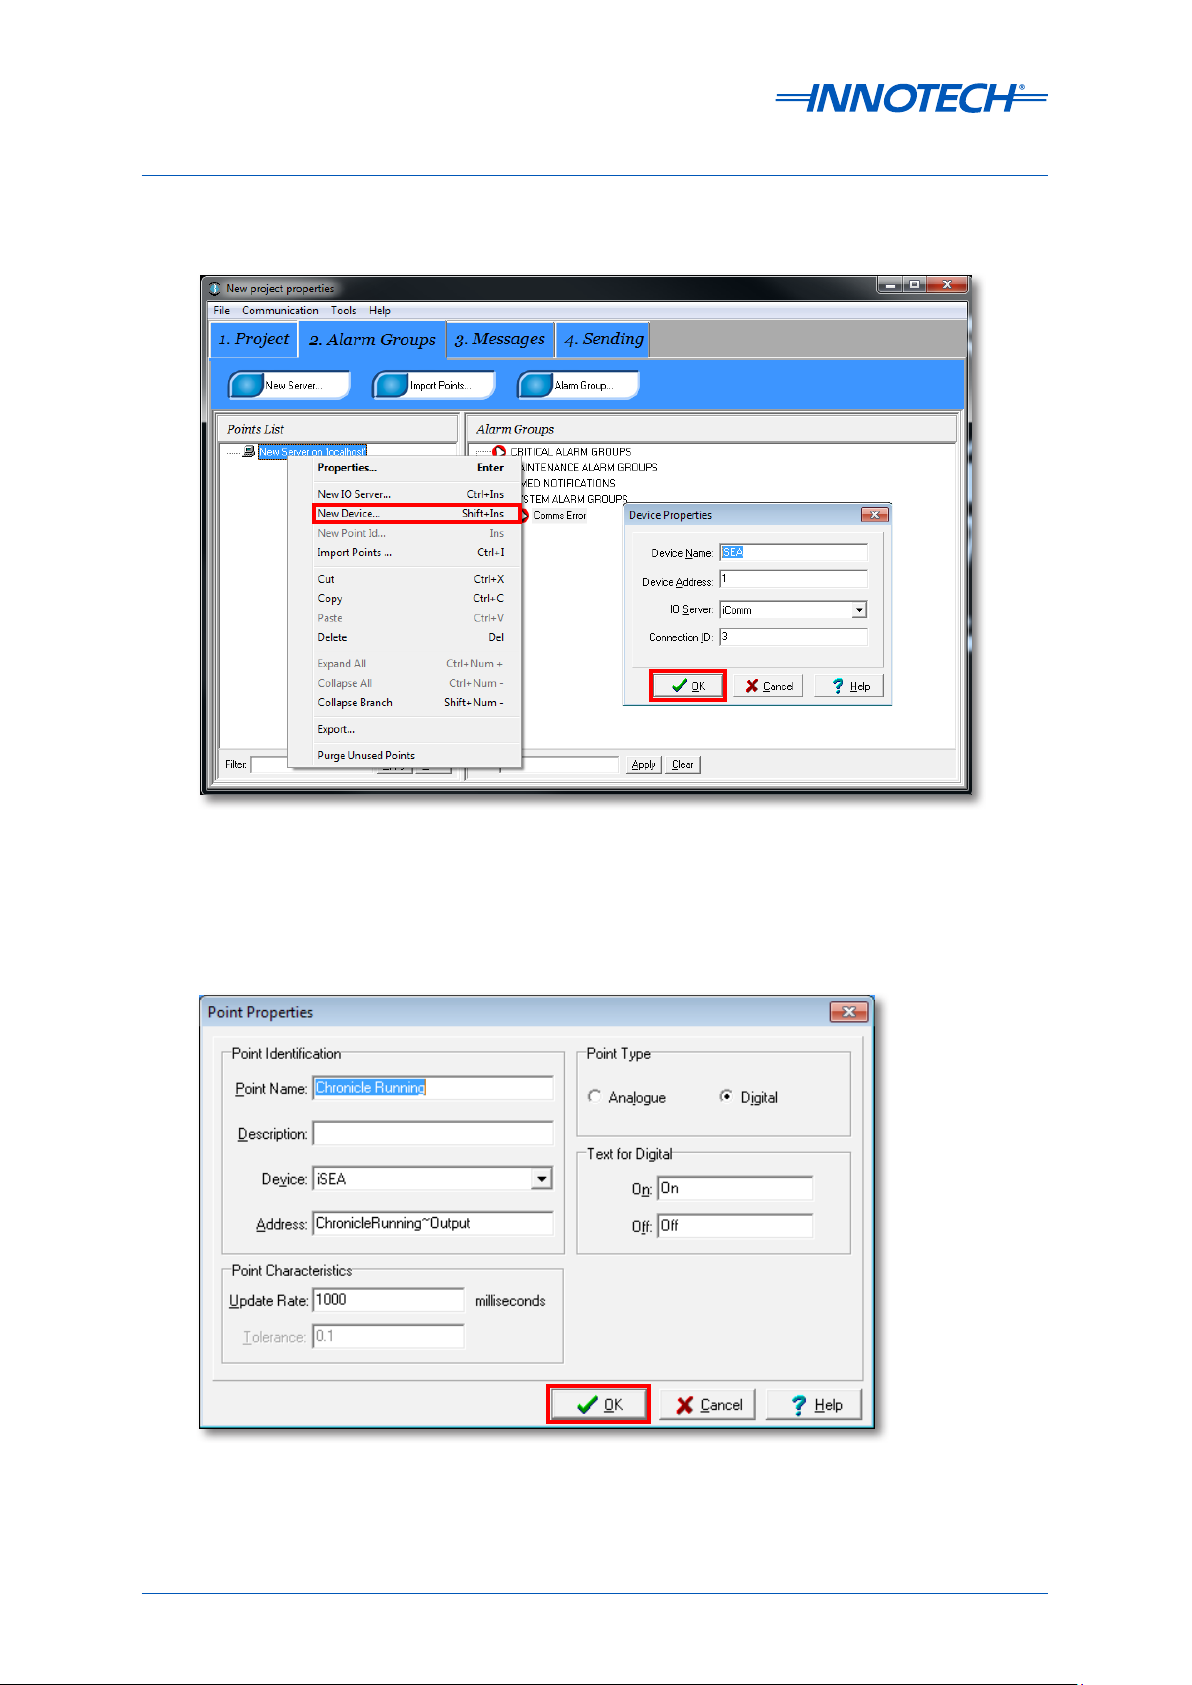
11. Create 2 new devices on this server using the Device ID and Connection ID as listed in
iComm.
Figure 3-15: FM Builder - Create a new iSEA Device
12. Create 1 digital point on the ‘iSEA’ device with the address ‘ChronicleRunning~Output’, and
a recommended update rate of 1 second (1000 milliseconds).
Figure 3-16: Create a new Point called ‘Chronicle Running’
Chapter 3 – Configuring iSEA
Page 29
© Mass Electronics Pty Ltd 2011
Page 30

Innotech Service & Event Analyser Installation Instructions
13. Drag the point to the required Alarm Group, and set the ‘Activation Settings’ to ‘Changes to
0 ’.
Figure 3-17: FM Builder - Add Point to an Alarm Group
14. Create 6 points on the ‘Chronicle Server’ device with the following addresses:
• DbConnected~Output (Digital).
• iCommConnected~Output (Digital).
• AllocatedDB~Output (Analogue).
• ReportingUsage~Output (Analogue).
• DongleConnected~Output (Only relevant when a Chronicle dongle for using 10GB SQL
database has been purchased - Digital).
• DatabaseLogging~Output (Only relevant when a Chronicle dongle for using 10GB SQL
database has been purchased - (Digital).
A point for SQL_ExpressRunning~Output can also be created if desired.
Edition 3.1 dated 26.03.2014
Page 30
© Mass Electronics Pty Ltd 2011
Page 31

Innotech Service & Event Analyser Installation Instructions
15. Drag each point to the required Alarm Group. The following ‘Activation Settings’ are
recommended values and may be customised as required:
Table 3-5: FM Alarm Group Activation Settings
Point Name Point Address Alarm Activation Settings
Set the ‘Activation Settings’ to ‘Changes to 0’.
DbConnected DbConnected~Output
iCommConnected iCommConnected~Output
AllocatedDB AllocatedDB~Output
ReportingUsage ReportingUsage~Output
A point value of 0 indicates that Chronicle
Server can no longer communicate with the
specified database.
Set the ‘Activation Settings’ to ‘Changes to 0’.
A point value of 0 indicates that Chronicle
Server can no longer communicate with an
iComm.
Set the ‘Activation Settings’ to ‘Changes’.
This value indicates the current maximum
size of the database. The value should be 4
if ‘SQL Express’ is selected as the Database
Server type in Chronicle Manager, or 10 if ‘SQL
Express 10GB’ is selected.
(Maintenance Alarm Group) set the ‘Activation
Settings’ to ‘Goes higher than 90’.
(Critical Alarm Group) set the ‘Activation Settings’ to ‘Goes higher than 97’.
This value indicates the percentage used of
the database allocated for reporting point
logging. See note blow.
Set the ‘Activation Settings’ to ‘Changes to 0’.
DongleConnected DongleConnected~Output
A value of 0 indicates that a valid dongle is not
connected to the Chronicle Server computer.
IMPORTANT
Once the ReportingUsage value exceeds 90, steps should be taken to ensure long term storage of backups are kept,
as the earliest records in the database will be overwritten once the usage reaches 95%.
The Maintenance alarm for this point may be removed if this occurs, as the usage will never reduce below 90%,
unless the reporting usage allocation is increased, or the Database type is changed from ‘SQL Express’ to ‘SQL
Express 10GB’ (requires dongle).
If the usage exceeds 97% there is a critical issue with the database which may cause logging to fail if the reporting
allocation is not increased.
Chapter 3 – Configuring iSEA
Page 31
© Mass Electronics Pty Ltd 2011
Page 32

Innotech Service & Event Analyser Installation Instructions
The newly created "Chronicle Running" points are shown in the Figure 3-18 below.
Figure 3-18: FM Builder Alarm Groups
16. Select the ‘Messages’ tab in FM, setup messages and recipients as required. Please refer to
FM Help for more information.
Figure 3-19: FM Builder Messages Tab
Edition 3.1 dated 26.03.2014
Page 32
© Mass Electronics Pty Ltd 2011
Page 33

Innotech Service & Event Analyser Installation Instructions
17. Select the ‘Sending’ tab, click ’Save’ and then click ’Send To’ to send the project to FM.
Figure 3-20: FM Builder Sending Tab
Chapter 3 – Configuring iSEA
Page 33
© Mass Electronics Pty Ltd 2011
Page 34

Innotech Service & Event Analyser Installation Instructions
3-2.2 Advanced Setup (Tenant Target Monitoring)
This functionality enables monitoring of specified tenants so that timely notifications of excessive
usage (per day/month/year) may be generated, and actions taken to notify customers promptly.
Setting up Tenant Target Monitoring requires that Chronicle Server has been configured and setup with a project,
and is logging data correctly. ATOM must also be commissioned first, with all tenants setup, and appropriate target
values set for each month per tenant.
Aer running through the basic setup and ensuring that all points are valid in FM, switch to iComm, modify the ‘iSEA
Monitoring’ connection’s ‘Address of last device’ to 3. This device may take up to 20 minutes to change Status to
‘Alive’ aer adding tenants to ATOM.
1. Navigate to the ‘C:\Program Files\Innotech\Chronicle Data’ directory (‘C:\Program Files
(x86)\Innotech\Chronicle Data’ on a 64 bit operating system).
Figure 3-21: Chronicle Data Folder - Extract Tenant Target Point Addresses
2. Run the ‘ExtractTenantTargetPointAddresses.cmd’ file, and enter the location or IP Address
of the SQL Server, and the password for the Innotech login when prompted. Note: the IP
shown below is an example.
Figure 3-22: Enter the Location and Password of SQL Server
This will create a file in the same directory called ‘Tenants.csv’, which may be opened with Notepad or Microso
Excel.
Edition 3.1 dated 26.03.2014
Page 34
© Mass Electronics Pty Ltd 2011
Page 35

Innotech Service & Event Analyser Installation Instructions
3. Open the ‘Tenants.csv’ file, and use the Tenants names listed in there to determine which
point addresses are needed for the FM project.
4. Each tenant has 3 point addresses associated, as there are 3 dierent targets that may be
monitored per tenant. These are Day targets, indicated in the point address by ‘_D’, Month
targets indicated by ‘_M’, and year targets indicated by ‘_Y’. Points only need to be created
for those which need to be monitored, but the address used when creating the point must
exactly match what is displayed in the ‘Tenants.csv’ file.
5. Create as many points as required, giving each point an easily identifiable name (such as
the tenant name listed in the ‘Tenants.csv’ file), as point addresses may be trimmed.
Figure 3-23: Create a new Device for Tenant Points
Figure 3-24: Create the required Tenant Points
Chapter 3 – Configuring iSEA
Page 35
© Mass Electronics Pty Ltd 2011
Page 36
Innotech Service & Event Analyser Installation Instructions
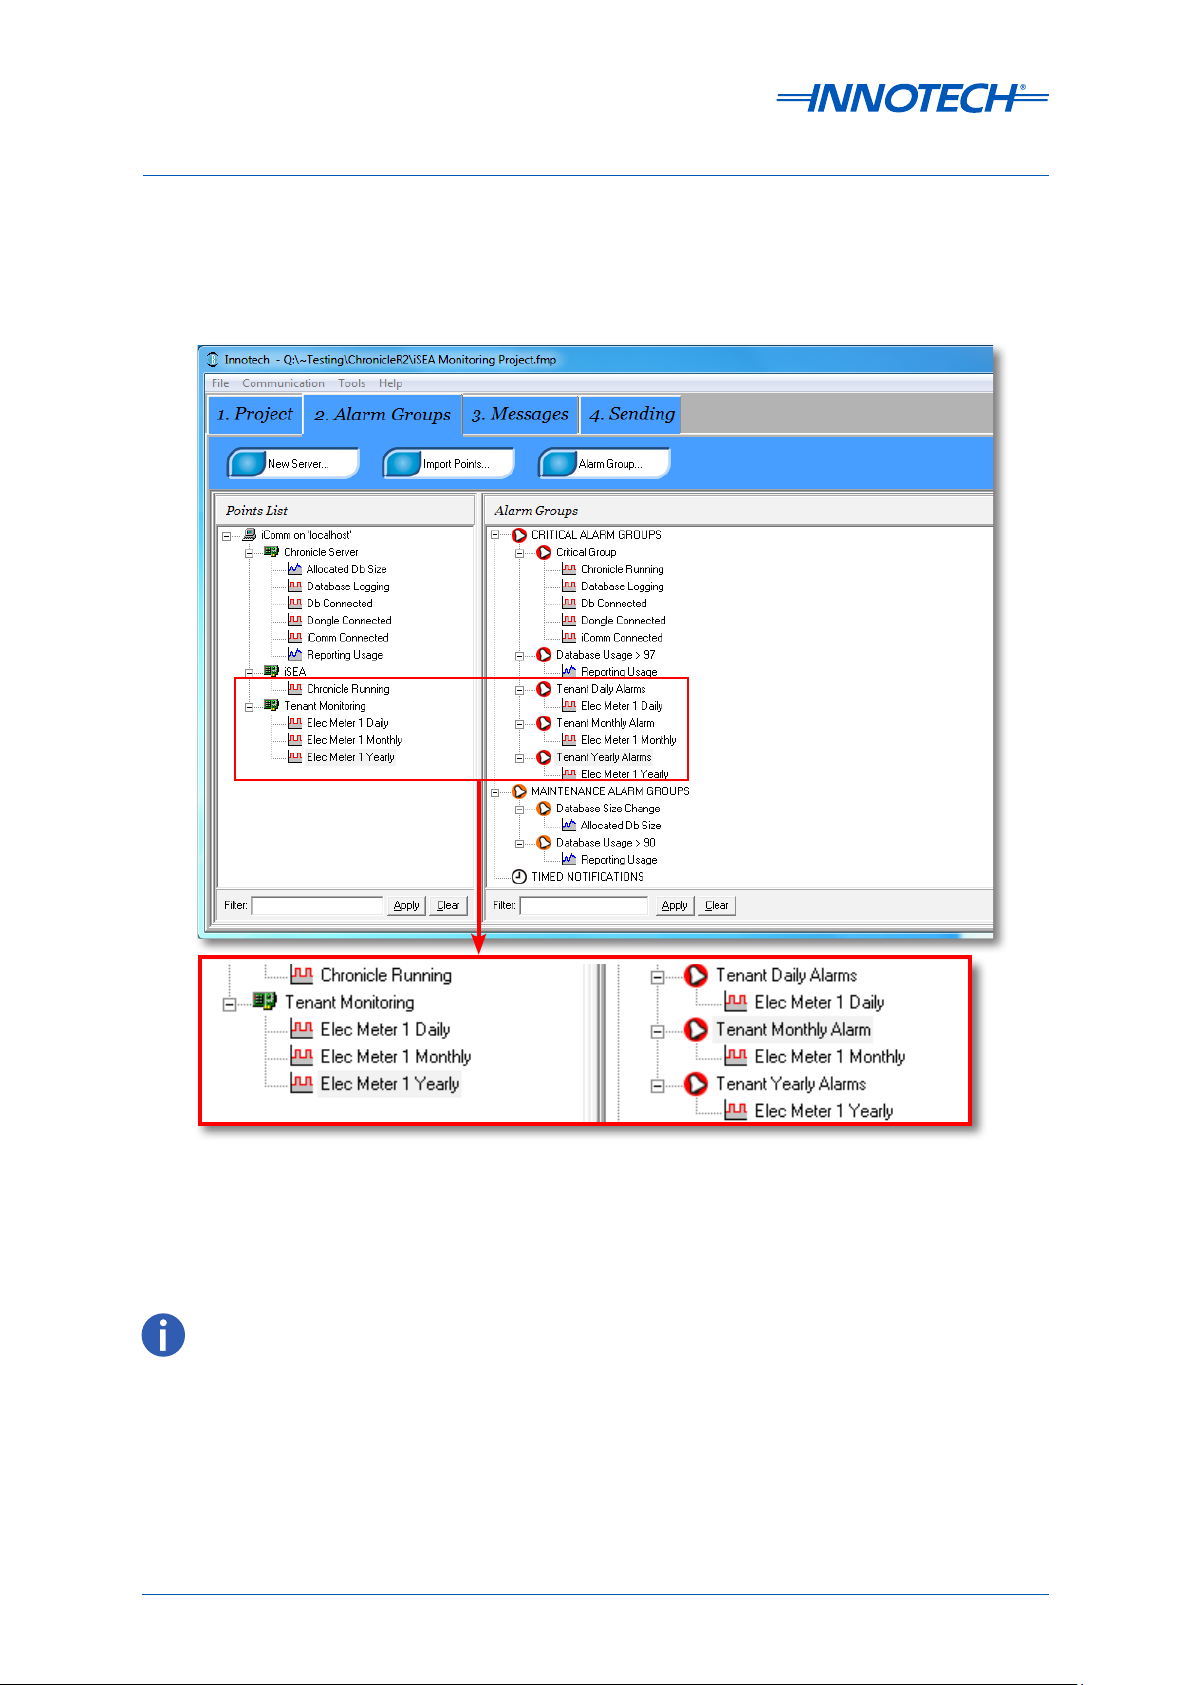
6. Drag each point to an appropriate Alarm Group and set the ‘Activation Settings’ to ‘Changes
to 1’ for each point. When a tenant target monitored point changes to 1, this indicates that
the tenant has exceeded their specified target for the period indicated by the point name
(day/month/year).
Figure 3-25: Setup Tenant Alarm Groups as required
7. Select the ‘Messages’ tab in FM, setup messages and recipients as required.
8. Select the ‘Sending’ tab, then save and send the project to FM.
The Tenant Target monitoring points are only updated every 15 minutes, to minimise the load on the database.
Edition 3.1 dated 26.03.2014
Page 36
© Mass Electronics Pty Ltd 2011
Page 37

Innotech Service & Event Analyser Installation Instructions
3-2.3 Setup of Virtual Points in iSEA
Virtual points provides the ability to derive a single value from a set of available real point values by
performing additions and subtractions as required. For example, multiple power meter values may
be added together to derive the total power usage value.
In order to ensure compatibility with dierent devices, a multiplication factor can be set to convert
between units, such as Watts to Kilowatts.
Virtual points are created by accessing the Virtual Points configuration interface within iSEA.
IMPORTANT
If a virtual point is created as an accumulated point, you can still log it as a reporting point in Chronicle but it is
advisable to disable accumulating for this point to ease the CPU load.
Figure 3-26: Accessing Virtual Points conguration in iSEA
1. In the Configure iComm Server section, enter the connection details for the iComm that
contains the points you wish to create Virtual Points from. You must enter an iComm
Address in order to use virtual points. The location of iComm may be configured as a DNS or
IP Address. If necessary add the Username and Password of the iComm Server.
Figure 3-27: Virtual Points conguration - iComm Server settings
Chapter 3 – Configuring iSEA
Page 37
© Mass Electronics Pty Ltd 2011
Page 38

Innotech Service & Event Analyser Installation Instructions
2. In the Virtual Points section, le click on the text “Click To Add New Point”. This will create a
new row for you to enter the details of a virtual point.
Figure 3-28: Add New Virtual Points
3. Enter a name for the virtual point under the Name column. By default, a Virtual Point is set
to an update rate of 60 seconds. This value may be modified to any value between 5 and 300
seconds. (All actual points linked to this virtual point will be updated by iComm at this rate
or faster).
Figure 3-29: Enter Details for the Virtual Point
4. Click in the Name and Update Rate field to edit details, press enter when done.
Figure 3-30: New Virtual Points Created
The Virtual point may not appear in iComm until the Update rate time interval has elapsed.
Edition 3.1 dated 26.03.2014
Page 38
© Mass Electronics Pty Ltd 2011
Page 39

Innotech Service & Event Analyser Installation Instructions
5. If you wish to temporarily disable a Virtual Point from sending values to iComm, uncheck
the checkbox in the Enabled column.
Figure 3-31: Enabling / Disabling Virtual Points
6. If you wish to permanently remove a Virtual Point from iSEA, click the rubbish bin icon at the
end of the row you wish to delete.
Figure 3-32: Permanently remove a Virtual Point
7. Aer creating a Virtual Point, you will be able to add Actual Points from which the value for
the Virtual Point will be calculated. The Actual Points only relate to the currently selected
virtual point.
Chapter 3 – Configuring iSEA
Page 39
© Mass Electronics Pty Ltd 2011
Page 40

Innotech Service & Event Analyser Installation Instructions
8. To link an Actual Point to a Virtual Point, select the virtual point, then in the Actual Points
panel, le click on the text “Click To Add New Point”.
Figure 3-33: Creation of Actual Points under Virtual Points
9. Enter the Connection ID, the Device ID and the Point Address as required in the appropriate
fields.
Figure 3-34: Creating Actual Points
Table 3-6: Elements of an Actual Point within a Virtual Point
Element Function Description
Addition The point is added to the Virtual point total.
Subtraction The point is subtracted from the Virtual point total.
Conversion
factor
Connection ID
and Device ID
Ranges between 1x10¹⁰ and 1x10⁹. This factor is multiplied with
the Actual point value.
This is the Connection and Device IDs of your Actual Points.
Auto Reset Default Setting. Accumulates at the highest
received value from a point.
Reset Options
Manual Reset The user defines the maximum value of the
meter reset.
Can't Reset This setting shows the "Live Value" of the
meter. No Accumulation.
Reset Value
This column will show the maximum meter value of the point
at which it was reset.
Edition 3.1 dated 26.03.2014
Advanced
Click the symbol to view or reset the Accumulated Reset Total
for the point.
Page 40
© Mass Electronics Pty Ltd 2011
Page 41

Innotech Service & Event Analyser Installation Instructions
10. Enter a Conversion Factor if the value of the Actual Point needs to be converted.
11. If the Actual Point is to be subtracted from the total value of this Virtual Point, click on the
+/- toggle switch in the first column of the current row.
12. Clicking the rubbish bin icon (see Figure 3-35) at the end of a row will delete that row. This
action cannot be undone.
Figure 3-35: Deletion of Actual Points under Virtual Points
13. Once all Virtual Points and Actual Points have been created, click the OK button to create
the new Virtual Points.
Figure 3-36: Click OK to create the Virtual Points
Chapter 3 – Configuring iSEA
Page 41
© Mass Electronics Pty Ltd 2011
Page 42

Innotech Service & Event Analyser Installation Instructions
14. When the Virtual Points manager connects to iComm, a notification will be displayed by
iSEA stating how many virtual points have been created. If the Virtual Points manager gets
disconnected from iComm, iSEA will also show a notification for this event.
Figure 3-37: Virtual point creation notication
In order to log virtual points, the iSEA connection must first be setup in iComm, following the
procedure specified in the Monitoring section, substituting the final device address with 4. This
fourth device on the iSEA connection will contain all the virtual points setup on this instance of iSEA.
These can then be imported into a Chronicle or Magellan project in the same way as standard device
points.
For details on editing the final device address, see section 3-2.2 Advanced Setup (Tenant Target
Monitoring) on page 34.
Figure 3-38: iComm with new virtual device
To ensure virtual points function correctly, the computer should be setup to automatically login aer start-up.
Edition 3.1 dated 26.03.2014
Page 42
© Mass Electronics Pty Ltd 2011
Page 43

Innotech Service & Event Analyser Installation Instructions
This page has been le intentionally blank.
Chapter 3 – Configuring iSEA
Page 43
© Mass Electronics Pty Ltd 2011
Page 44

Innotech Support
Innotech provides technical information on the Web to assist you with using its products.
At www.innotech.com.au, you can find technical manuals, user instructions, and data sheets for all our
products.
For direct product support or product information, contact your local distributor, or an Innotech
representative.
You can contact us via email, fax, or postal mail:
Website: www.innotech.com.au
Email: sales@innotech.com.au
Fax: +61 7 3421 9101
Mail: Innotech Control Systems
P.O. Box 292
Sunnybank
QLD 4109
Australia
Edition 3.1 dated 13.03.2014
© Mass Electronics Pty Ltd 2011Page 44
 Loading...