


R5000 series - Web GUI
Software Version: MINTv1.90.11
Last updated: 8/31/2014
User Manual

Important Notice
User Manual
R5000 series - Web GUI
ii
Legal Rights
© Copyright 2014 InfiNet Wireless. All rights reserved.
The information contained in this document is originated by, proprietary, confidential
and owned by InfiNet Wireless. No part of this document should be disclosed,
reproduced or distributed without the express written permission of InfiNet Wireless
Ltd.
InfiNet Wireless Ltd. reserves the right to change the information contained in this
document without prior notice. No part of this document may be considered as a part
of any contract or warranty.
Statement of Conditions
InfiNet Wireless Ltd. shall not be liable for errors contained herein or for incidental
or consequential damages in connection with the furnishing, performance or use of
this manual or equipment supplied with it.
Disclaimer
The software is sold on an "AS IS" basis. InfiNet Wireless, its affiliates or its licensors
make no warranties, whatsoever, whether express or implied, with respect to the
software and the accompanying documentation. Infinet Wireless specifically
disclaims all implied warranties of merchantability and fitness for a particular purpose
and non-infringement with respect to the software. Units of product (including all the
software) delivered to purchaser hereunder are not fault_ tolerant and are not
designed, manufactured or intended for use or resale in applications where the
failure, malfunction or inaccuracy of products carries a risk of death or bodily injury
or severe physical or environmental damage (“high risk activities”). High risk
activities may include, but are not limited to, use as part of on-line control systems
in hazardous environments requiring fail-safe performance, such as in the operation
of nuclear facilities, aircraft navigation or communication systems, air traffic control,
life support machines, weapons systems or other applications representing a similar
degree of potential hazard. Infinet wireless specifically disclaims any express or
implied warranty of fitness for high risk activities.
InfiNet Wireless hereby declares that R5000-Omx(b), R5000-Mmx(b), R5000Smn(c) and R5000-Lmn are in compliance with the essential requirements and other
relevant provisions of Directive 1995/5/EC. The declaration of conformity may be
consulted at http://www.infinetwireless.com/products-technologies/type-approvalcertificates/DoC_RTTE.pdf.

Important Notice
User Manual
R5000 series - Web GUI
iii
Indication of the countries
InfiNet Wireless equipment has no geographical limitations for selling and can be
supplied to any country of the world.
Limitation of Liability
Infinet Wireless shall not be liable to the purchaser or to any third party, for any loss
of profits, loss of use, interruption of business or for any indirect, special, incidental,
punitive or consequential damages of any kind, whether arising under breach of
contract, tort (including negligence), strict liability or otherwise and whether based
on this agreement or otherwise, even if advised of the possibility of such damages.
To the extent permitted by applicable law, in no event shall the liability for damages
hereunder of Infinet Wireless or its employees or agents exceed the purchase price
paid for the product by purchaser, nor shall the aggregate liability for damages to all
parties regarding any product exceed the purchase price paid for that product by that
party (except in the case of a breach of a party’s confidentiality obligations).
International Regulatory Information
This equipment has been tested and found to comply with the limits for a Class B
digital device.
Hereby, InfiNet Wireless declares that this equipment is in compliance with the
essential requirements and other relevant provisions of Directive 1999/5/EC.

About This Manual
User Manual
R5000 series - Web GUI
iv
About This Manual
This manual provides detailed technical information on the operation of the Web
interface (guidelines for the use of all sections and futures) of R5000 series. The
manual provides also step-by-step guides for the routine tasks and basic scenarios
like: setting up a basic PTP link, setting the MAC switching options, using “test”
configuration, firmware upgrade, etc.
This manual is designed for individuals who prefer using a graphical user interface
(GUI) for configuring and managing R5000 series devices. It is intended for the
following audiences:
Customers with technical knowledge of and experience with IP networks
Network administrators, who install, configure and manage R5000 series
devices

Contents, Figures and Tables
User Manual
R5000 series - Web GUI
v
Table of Contents
Getting started ............................................................................................................................ 1
1.1. Document structure ...................................................................................................... 2
1.2. Abbreviations ................................................................................................................ 2
1.3. Document marks ........................................................................................................... 3
Features set ................................ ................................................................................................ 4
2.1. Introduction ................................................................................................................... 5
2.2. R5000 unit access ........................................................................................................ 5
2.3. Device Status ............................................................................................................... 6
2.3.1. Interface Statistics ................................................................................................. 8
2.3.2. Wireless Links Statistics ........................................................................................ 9
2.3.3. Switch Statistics ................................................................................................... 10
2.3.4. Extended Interface Statistics................................................................................ 13
2.3.5. Extended Switch Statistics ................................................................................... 32
2.4. Basic Settings ............................................................................................................. 34
2.4.1. System Settings ................................................................................................... 35
2.4.2. Network Settings.................................................................................................. 37
2.4.3. Link Settings ........................................................................................................ 42
2.4.4. Static Links .......................................................................................................... 49
2.4.5. MAC Switch ................................ ................................................................ ......... 49
2.4.6. IP Firewall ................................................................ ............................................ 67
2.4.7. SNMP .................................................................................................................. 70
2.4.8. QoS Options ........................................................................................................ 74
2.4.9. Traffic Shaping .................................................................................................... 76
2.4.10. Extra Commands ............................................................................................. 78
2.4.11. Apply, Test and Preview the configuration ........................................................ 80
2.5. Maintenance ............................................................................................................... 80
2.5.1. Firmware ............................................................................................................. 81
2.5.2. Upload ................................................................................................................. 84
2.5.3. Download ............................................................................................................ 84
2.5.4. Bottom section of the page .................................................................................. 84
2.6. Spectrum Analyzer ..................................................................................................... 85
2.7. DFS ............................................................................................................................ 87
2.8. Command Line ........................................................................................................... 88

Contents, Figures and Tables
User Manual
R5000 series - Web GUI
vi
Configuration scenarios ............................................................................................................ 90
3.1. Introduction ................................................................................................................. 91
3.2. Setting up a basic PtP link .......................................................................................... 91
3.3. Creating a management VLAN interface ..................................................................... 94
3.4. Creating a basic PtMP configuration ........................................................................... 96
3.5. Configuring an SNMP v3 account ............................................................................. 107
3.6. Configuring radio profiles .......................................................................................... 109
Table of Figures
Figure 1 - GUI login ..................................................................................................................... 6
Figure 2 - HTTPS connection ...................................................................................................... 6
Figure 3 - Refresh option ............................................................................................................ 7
Figure 4 - Counters reset ............................................................................................................ 9
Figure 5 - Switch Statistics ................................................................................................ ........ 10
Figure 6 - Switch Statistics ................................................................................................ ........ 11
Figure 7 - System log ................................................................................................................ 12
Figure 8 - Extended Interface Statistics ..................................................................................... 13
Figure 9 - General Statistics ...................................................................................................... 14
Figure 10 - Radio Sources Analysis .......................................................................................... 15
Figure 11 - QoS Statistics ......................................................................................................... 17
Figure 12 - The Network Address Table for the local unit .......................................................... 18
Figure 13 - The Network Address Table for the remote unit ...................................................... 18
Figure 14 - Extended Link Diagnostic........................................................................................ 19
Figure 15 - Performance test .................................................................................................... 20
Figure 16 - Bi-directional performance test output ..................................................................... 21
Figure 17 - Bi-directional “Use MINT” performance test output ................................................. 21
Figure 18 - Alignment test ......................................................................................................... 22
Figure 19 - Alignment test - graphical indicator ......................................................................... 23
Figure 20 - Alignment test - graphical indicator - positive example ............................................ 25
Figure 21 - Alignment test - graphical indicator - negative example .......................................... 26
Figure 22 - Statistics graphs - balloon indicators ....................................................................... 27
Figure 23 - Statistics Graphs - RX/TX Ref. Level ...................................................................... 27
Figure 24 - Statistics Graphs - RX/TX Retries ........................................................................... 28
Figure 25 - Statistics Graphs - RX/TX Bitrate ............................................................................ 28
Figure 26 - Statistics Graphs - RX/TX Load .............................................................................. 29

Contents, Figures and Tables
User Manual
R5000 series - Web GUI
vii
Figure 27 - Statistics Graphs - CPU Load & unit temperature ................................................... 29
Figure 28 - Remote commands ................................................................................................. 31
Figure 29 - Link restart .............................................................................................................. 32
Figure 30 - Link restart - warning message ............................................................................... 32
Figure 31 - Extended Switch Statistics ...................................................................................... 33
Figure 32 - Switch DB Statistics ................................................................................................ 33
Figure 33 - Switch VLAN Statistics ............................................................................................ 33
Figure 34 - Basic settings warning message ............................................................................. 34
Figure 35 - System Settings default configuration ..................................................................... 35
Figure 36 - Google Map ............................................................................................................ 37
Figure 37 - Network Settings default interfaces ......................................................................... 39
Figure 38 - Static routing configuration ...................................................................................... 42
Figure 39 - Link Settings - Master node default configuration .................................................... 43
Figure 40 - Link Settings - SLAVE node default configuration ................................................... 44
Figure 41 - Chain # ................................................................................................................... 48
Figure 42 - Custom frequency grid ............................................................................................ 48
Figure 43 - Switching Groups .................................................................................................... 50
Figure 44 - Trunk Groups .......................................................................................................... 51
Figure 45 - Management configuration 1 ................................................................................... 52
Figure 46 - Management configuration 2 ................................................................................... 53
Figure 47 - MAC Switch default configuration ........................................................................... 62
Figure 48 - IP Firewall ............................................................................................................... 67
Figure 49 - QoS Options default configuration .......................................................................... 75
Figure 50 - Add a logical channel .............................................................................................. 76
Figure 51 - Extra commands ..................................................................................................... 79
Figure 52 - Apply, test and preview the configuration ................................................................ 80
Figure 53 - Firmware ................................................................................................................. 81
Figure 54 - New firmware warning message ............................................................................. 82
Figure 55 - New firmware availability......................................................................................... 82
Figure 56 - Firmware upgrade ................................................................................................... 83
Figure 57 - Firmware upgraded succesfully............................................................................... 83
Figure 58 - Latest firmware change log ..................................................................................... 84
Figure 59 - Unit reboot .............................................................................................................. 84
Figure 60 - Spectrum analyzer .................................................................................................. 85
Figure 61 - DFS ........................................................................................................................ 88
Figure 62 - Command line ......................................................................................................... 89

Contents, Figures and Tables
User Manual
R5000 series - Web GUI
viii
Figure 63 - Warning message – setup system login & password ................................ .............. 91
Figure 64 - Edit system settings ................................................................................................ 92
Figure 65 - Add IP address on svi1 interface............................................................................. 92
Figure 66 - Set the radio parameters for the Master unit ........................................................... 93
Figure 67 - Wireless link establisment ....................................................................................... 94
Figure 68 - Remove Management button .................................................................................. 95
Figure 69 - Create Management button .................................................................................... 95
Figure 70 - Vlan & svi interfaces ............................................................................................... 96
Figure 71 - Create a MAC switch rule ....................................................................................... 96
Figure 72 - PtMP configuration.................................................................................................. 97
Figure 73 - Create a VLAN rule ................................................................................................. 97
Figure 74 - Create a management VLAN .................................................................................. 98
Figure 75 - Creat an SVI interface ............................................................................................. 99
Figure 76 - Associate a Switch group to the SVI interface ......................................................... 99
Figure 77 - VLAN interface associated to the SVI interface ....................................................... 99
Figure 78 - Remove the default Switch group ......................................................................... 100
Figure 79 - In-Trunk mode, untagged traffic ............................................................................ 101
Figure 80 - In-Trunk mode, tagged traffic ................................................................................ 102
Figure 81 - Management Switch group ................................................................................... 102
Figure 82 - Creat an SVI interface ........................................................................................... 103
Figure 83 - Associate a Switch group to the SVI interface ....................................................... 103
Figure 84 - VLAN interface associated to the SVI interface ..................................................... 104
Figure 85 - SNMP access ....................................................................................................... 108
Figure 86 - Create SNMPv3 account ...................................................................................... 108
Figure 87 - Add radio profile .................................................................................................... 109
Figure 88 - Radio profile 1 configuration ................................................................................. 110
Figure 89 - Radio profile 2 configuration ................................................................................. 111
Figure 90 - First BS radio configuration ................................................................................... 112
Figure 91 - Second BS radio configuration .............................................................................. 113
Table 1 - Interface Statistics ........................................................................................................ 8
Table 2 - Wireless Links Statistics ............................................................................................. 10
Table 3 - Switch statistics parameters ....................................................................................... 12
Table 4 - Node types ................................................................................................................. 15
List of Tables

Contents, Figures and Tables
User Manual
R5000 series - Web GUI
ix
Table 5 - MINT priorities and WANFLeX queues ...................................................................... 17
Table 6 - MINT priority to 802.1p/TOS priority/DSCP map ........................................................ 17
Table 7 - System Settings ......................................................................................................... 36
Table 8 - Network Settings ........................................................................................................ 41
Table 9 - Link Settings .............................................................................................................. 47
Table 10 - Qualifiers .................................................................................................................. 55
Table 11 - Primitives ................................................................................................................. 61
Table 12 - MAC Switch ............................................................................................................. 64
Table 13 - Switch Groups Rules ................................................................................................ 65
Table 14 - IGMP Snooping ........................................................................................................ 66
Table 15 - IP Firewall ................................ ................................................................ ................ 70
Table 16 - SNMP Access .......................................................................................................... 72
Table 17 - SNMP Traps ............................................................................................................ 73
Table 18 - SNMP Trap Types ................................................................................................... 74
Table 19 - QoS ......................................................................................................................... 76
Table 20 - Logical channel parameters ..................................................................................... 77
Table 21 - Traffic shaping rules ................................................................................................. 78
Table 22 - Extra commands ...................................................................................................... 79
Table 23 - Firmware parameters ............................................................................................... 82
Table 24 - Spectrum Analyzer ................................................................................................... 87

Getting started
Chapter 1

Chapter 1 - Getting Started
User Manual
R5000 series - Web GUI
2
1.1. Document structure
This document consists of the following chapters:
“Getting started” - This chapter presents the information about this document’s
purpose and structure
“Features set” - This chapter provides descriptions and guidelines for the use of
all sections and views of the Web interface
“Configuration scenarios” - This chapter contains step-by-step guides for the
routine tasks and basic scenarios (e.g.: setting up a basic PTP link,
configuration examples, using “test” configuration, firmware upgrade, etc.)
1.2. Abbreviations
The following abbreviations are used in this document:
ATPC - Automatic Transmit Power Control
BS - Base Station
CINR - Carrier to Interference + Noise Ratio
CLI - Command Line Interface
CPU - Central Processing Unit
DFS - Dynamic Frequency Selection
DHCP - Dynamic Host Configuration Protocol
DNS - Domain Name System
GRE - Generic Routing Encapsulation
GUI - Graphical User Interface
HTTPS - Hyper Text Transfer Protocol Secured
ICMP - Internet Control Message Protocol
IGMP - Internet Group Management Protocol
IP - Internet Protocol
IPIP - IP-in-IP Protocol
LAG - Link Aggregation Group
MAC - Media Access Control
MIB - Management Information Base
MIMO - Multiple-Input and Multiple-Output

Chapter 1 - Getting Started
User Manual
R5000 series - Web GUI
3
CAUTION
All caution warnings are marked with a special warning sign. One should pay a great deal
of attention to what is written in the Caution section.
NOTE
All notes are marked with a special note sign. Notes usually contain useful comments or
hints to the described section of the document.
MINT - Mesh Interconnection Network Technology
MISO - Multiple-Input and Single-Output
POSIX - Portable Operating System Interface
PRF - Pseudo Radio Interface
PTMP - Point-to-Multipoint topology
PTP - Point-to-Point topology
QoS - Quality of Service
RSSI - Received signal strength indication
RTP - Real-time Transport Protocol
SID - System Identification Number
SNMP - Simple Network Management Protocol
SNR - Signal To Noise Ratio
SNTP - Simple Network Time Protocol
SSH - Secure Shell
STP - Spanning Tree Protocol
SVI - Switch Virtual Interface
TAP - Network TAP
TCP - Transmission Control Protocol
TUN - Network TUNnel
VLAN - Virtual Local Area Network
VPN - Virtual Private Network
1.3. Document marks

Features set
Chapter 2

Chapter 2 - Features set
User Manual
R5000 series - Web GUI
5
NOTE
By default (since v1.90.0), the access to the device is available through svi1 interface at
the IP address 10.10.10.1/24 (for further details about SVI interface see section 2.4.2 Network settings).
Make sure you have network connectivity to the unit.
NOTE
The system allows concurrent login sessions via Web interface.
2.1. Introduction
Web interface is a friendly management tool of R5000 unit. Using Web interface,
you can easily:
Monitor device interfaces statistics
Monitor radio link statistics
View and change device configuration
Access the graphical antenna alignment tool
Run wireless link throughput tests
Perform device maintenance and support
Access the Spectrum Analyzer tool
Access the system log
Monitor DFS operation
2.2. R5000 unit access
When you power on the unit, WANFleX OS starts automatically and Web
management is enabled by default so, in order to access the unit via Web browser
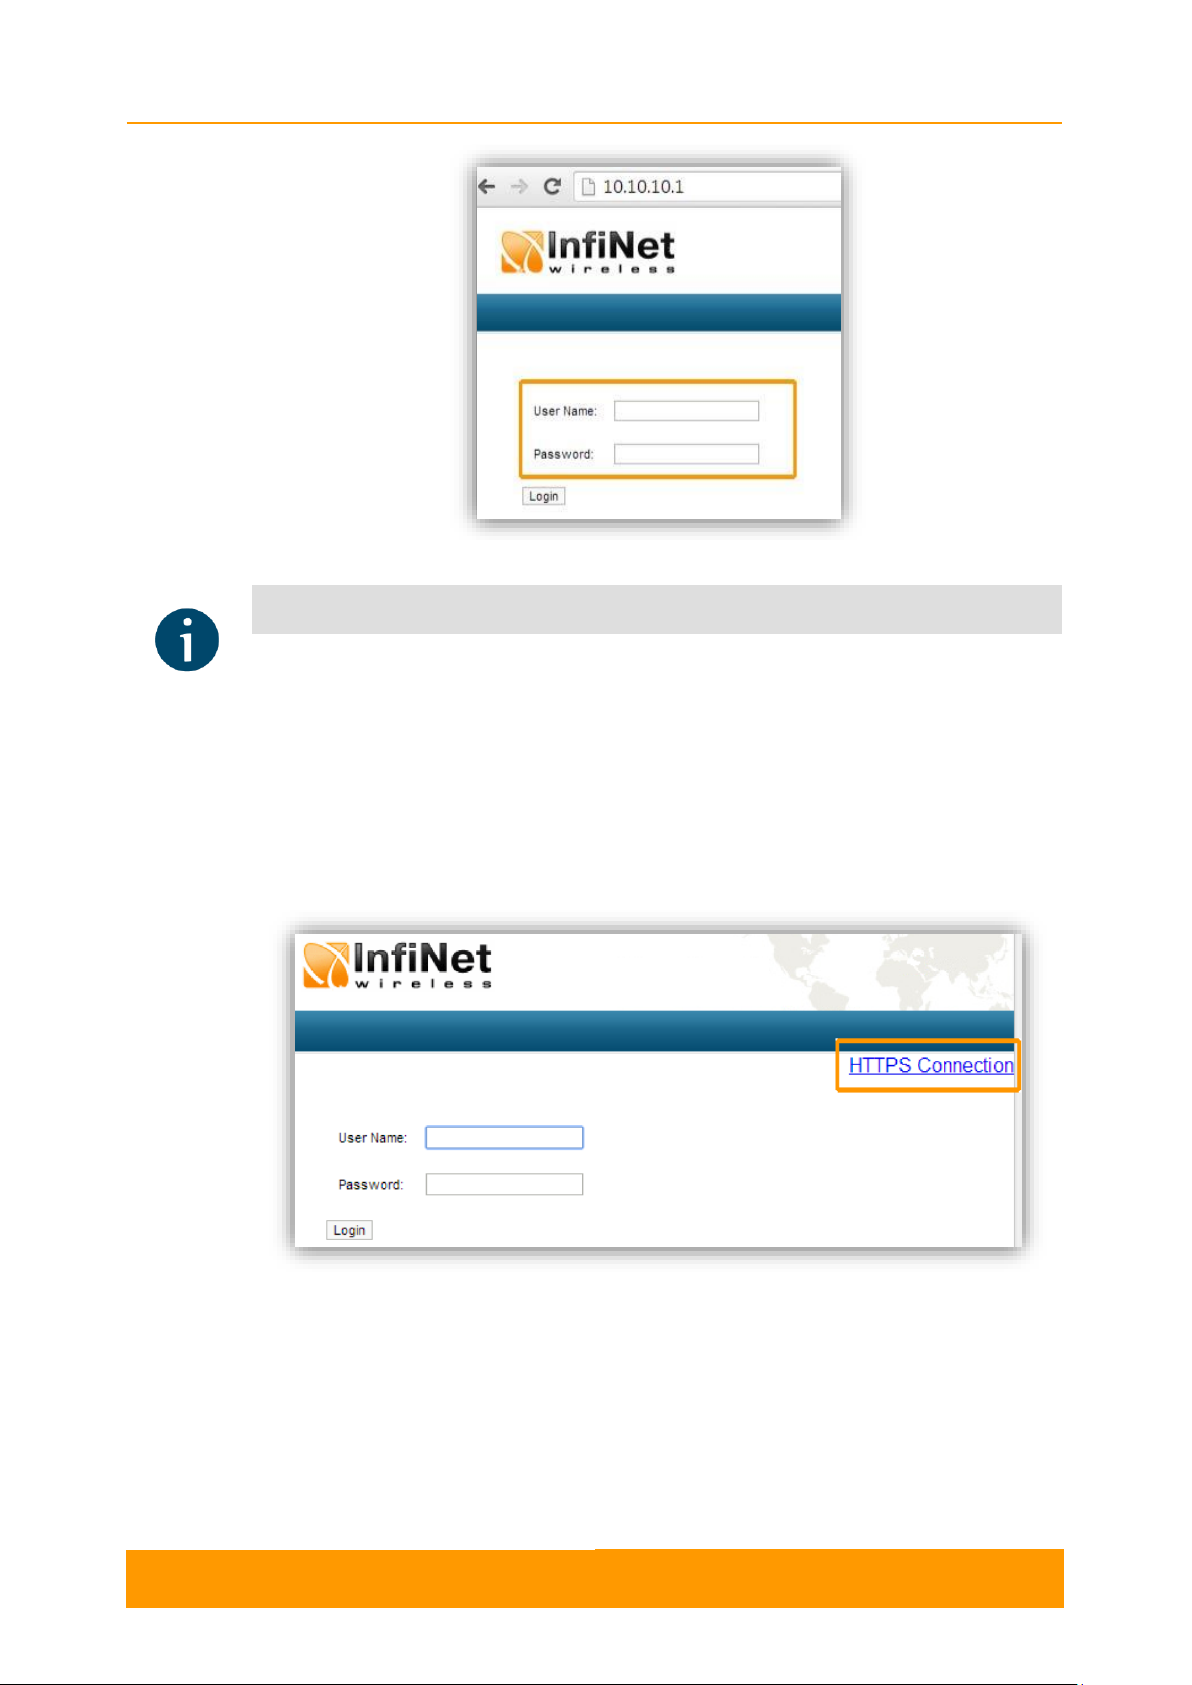
(start the graphical user interface), type in the address bar: http://<unit IP address>.
On the login page, you can type any username and any password and click Login:
Chapter 2 - Features set
User Manual
R5000 series - Web GUI
6
NOTE
Please change the credentials you have just inserted with a permanent username and
password for it after the first log in.
Figure 1 - GUI login
The default language is English. After the authentication step, the language can be
changed into Russian, French, Italian or Chinese.
You can access the unit via HTTPS (HTTP with SSL only) using InfiNet Wireless
self-signed certificate (from the Maintenance menu of Web interface). The «HTTPS
Connection» link is available in the right side of the login form:
Figure 2 - HTTPS connection
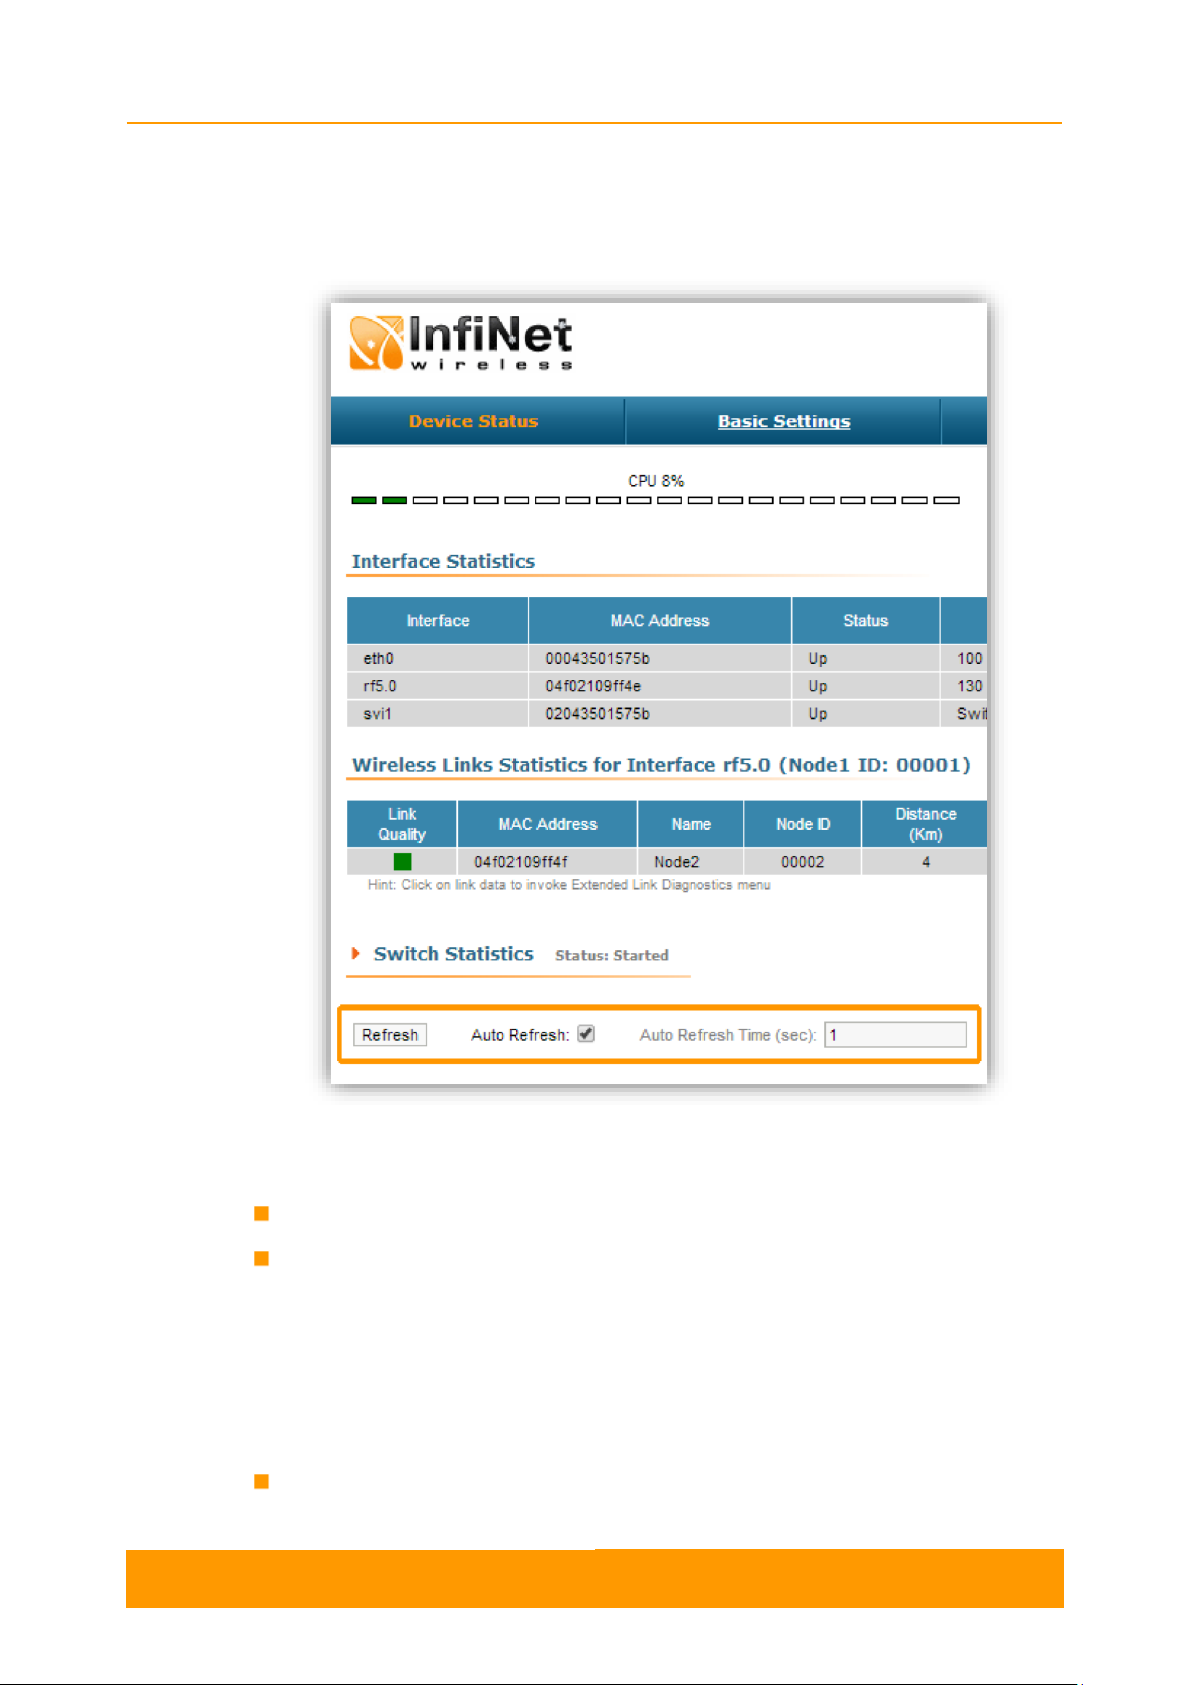
2.3. Device Status
The Device Status page is displayed by default after the authentication step. It
displays the main parameters of the unit in real-time. You can set the "Auto Refresh"
option to refresh the statistics automatically. Refresh frequency can be set by the
"Auto Refresh Time" parameter. The minimal possible value is “0” seconds and it
updates the information instantly.
Chapter 2 - Features set
User Manual
R5000 series - Web GUI
7
The device statistics can also be refreshed manually by pressing the «Refresh»
button.
These options are available in the bottom-left side of the Device Status screen:
Figure 3 - Refresh option
The Device Status page has the following sections:
CPU load - displays the load percentage of the CPU
Memory load:
- Memory (the data stored in volatile memory are valid only during the current
session, until the system reset) displays in real-time the total memory
available and the used memory by the running processes
- Flash memory (non-volatile memory) displays in real-time the total memory
available and the used memory by the WANFleX and configuration files
Interface Statistics - displays the main parameters of all configured interfaces
(physical and logical)

Chapter 2 - Features set
User Manual
R5000 series - Web GUI
8
Parameter
Description
Interface
Displays all physical and logical set interfaces
MAC
Address
Displays the MAC address of each interface
Status
Displays for each interface whether it is “up and running” or
not
Mode
Displays the operation mode of each interface. E.g.:
- 10,100 or 1000 Mbps and half or full duplex for the
Ethernet interface
- Bitrate, frequency and bandwidth for the Radio interface
- Switch Group number for the SVI
Packets
Displays the number of received and transmitted packets for
each interface since the unit is operational. The local system
packets are counted, too (and not only the ones that are
passing through the switching groups - data traffic)
Errors
Displays the number of received and transmitted error
packets for each interface since the unit is operational
Load
Displays the packet flow through each interface in real-time
(for the system and the data traffic)
Wireless Links Statistics - displays the main parameters of all wireless
connections between the device and the neighbor devices
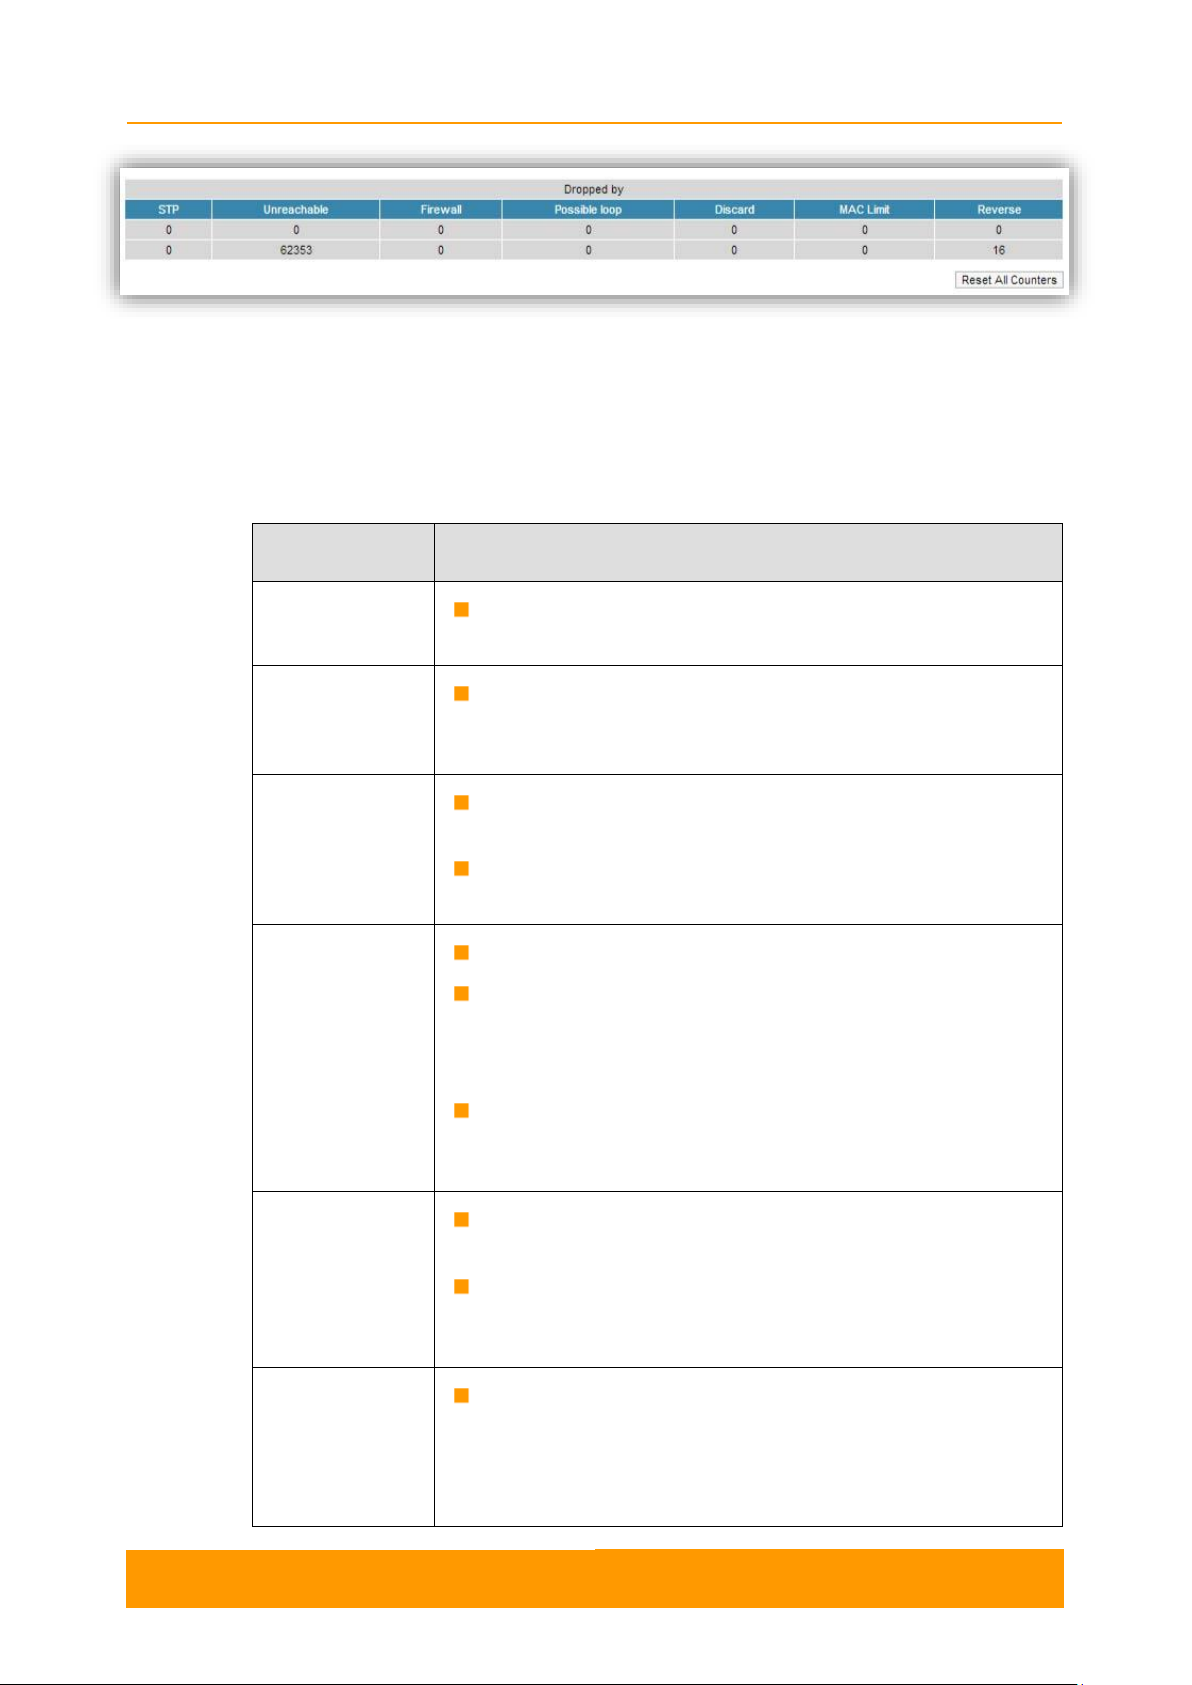
Switch Statistics - displays counters of the frames which have been switched
(e.g. the number of dropped packets and if they are dropped because of the
flood into their reachable destination, because of the STP, because of the
firewall, etc).
2.3.1. Interface Statistics
Table 1 - Interface Statistics
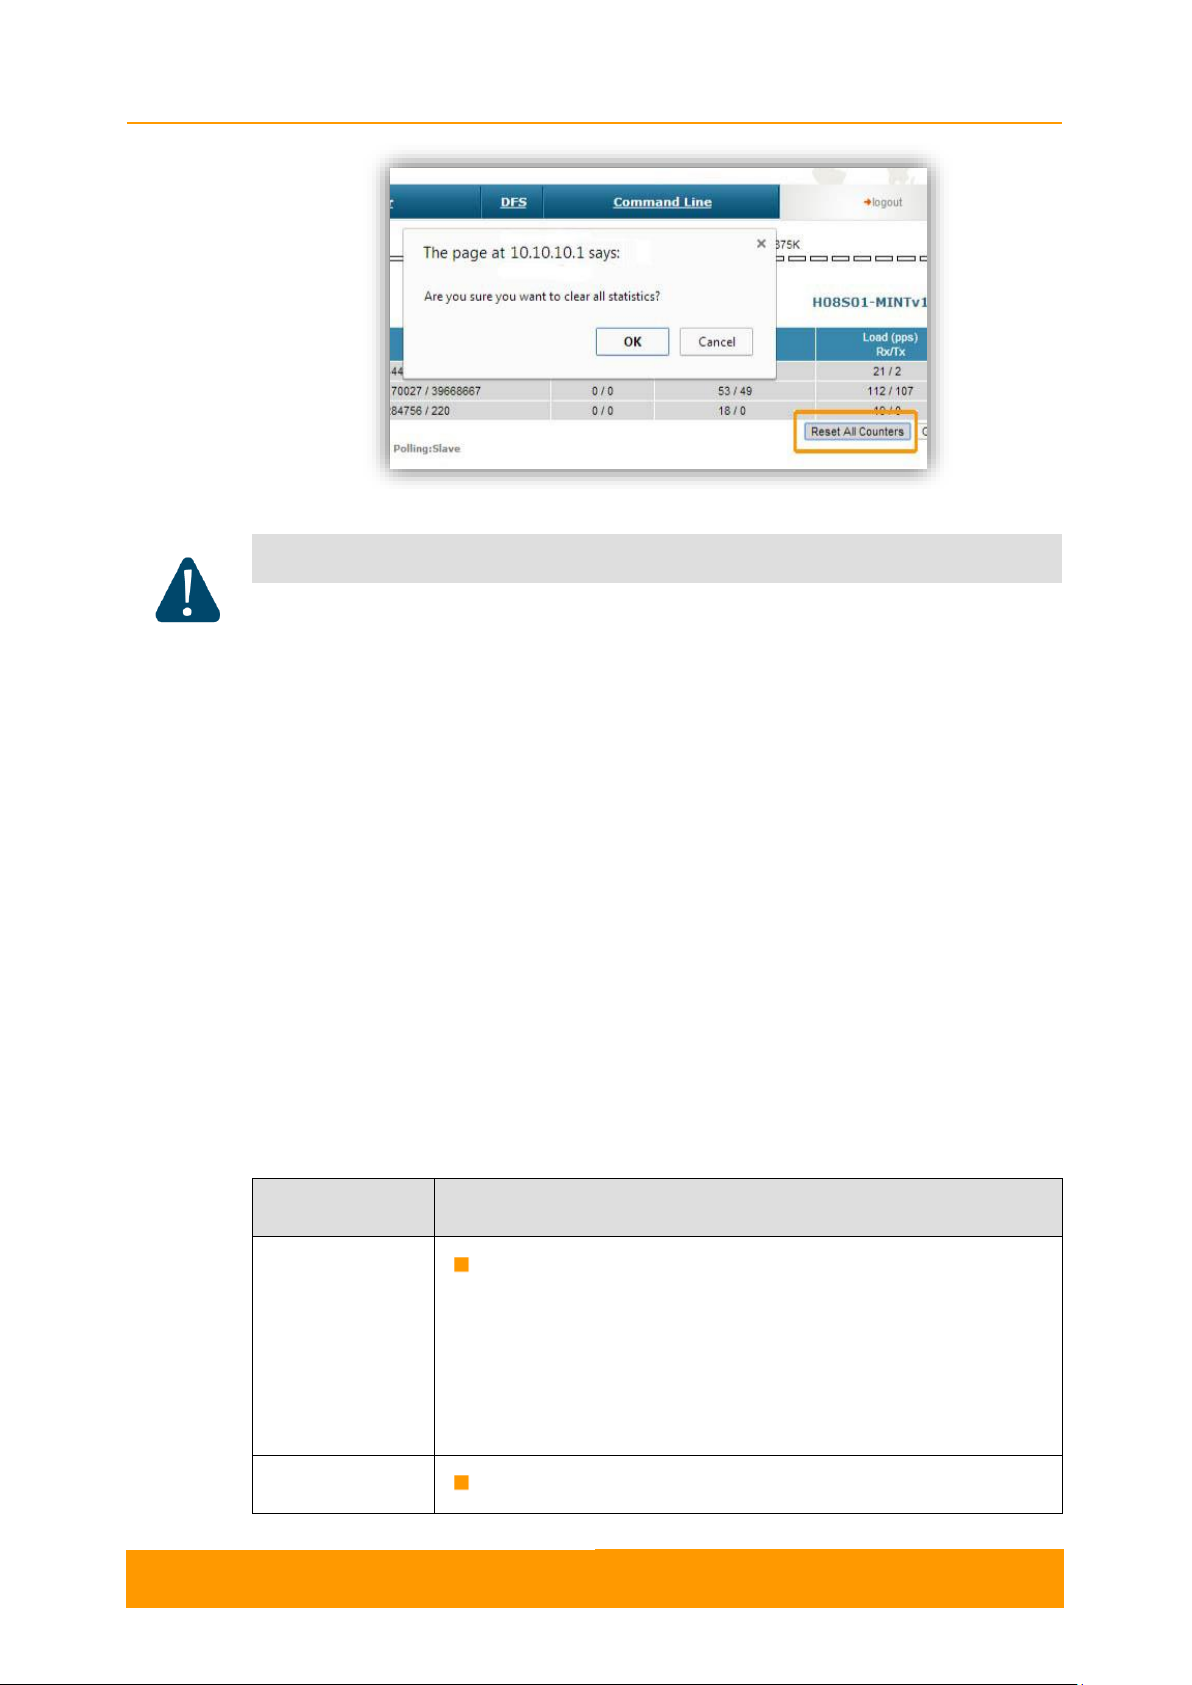
All these counters can be reset by pressing the «Reset All Counters» button:
Chapter 2 - Features set
User Manual
R5000 series - Web GUI
9
CAUTION
Clearing these counters by pressing the «OK» button in the pop-up page means losing the
history data about the functionality of your unit. Avoid this operation unless you are
completely sure you don’t need these data in the future.
Parameter
Description
Link Quality
Gives a color indication for the wireless connection quality
with the neighbor unit:
- Red: poor connection
- Yellow: good connection
- Green: excellent connection
MAC Address
Displays the neighbor’s MAC address
Figure 4 - Counters reset
The MINT version is displayed in the right side of Interface Statistics section (e.g.:
MINTv1.90.5).
2.3.2. Wireless Links Statistics
This section displays the following information for the radio interface of the unit:
- Node name and ID
- Noise level
- Number of established links
- ATPC status (activated or deactivated)
- Autobitrate status (activated or deactivated)
- Polling mode
Chapter 2 - Features set
User Manual
R5000 series - Web GUI
10
Name
Displays the neighbor’s name
Node ID
Displays the sequential number of the neighboring node
Distance
Displays the calculated (theoretical) distance to the
neighbor unit (in Km)
Power
Displays the power level of the Tx and Rx signals of the
neighbor unit (in dBm)
Ref. Level
Displays the Tx and Rx signals levels for the minimal
available bitrate of the neighbor unit (in dB)
Current Level
Displays the Tx and Rx signals levels for current bitrate
of the neighbor unit (in dB)
Bitrate
Displays the set bitrate value for the Tx and Rx signals of
the neighbor unit
Retries
Displays the percentage of Tx and Rx retries of the
neighbor unit
Errors
Displays the percentage of Tx and Rx errors of the
neighbor unit
Load
Displays the number of kbps and packets that are going
inbound and outbound the radio interface of the neighbor
unit (main data)
Table 2 - Wireless Links Statistics
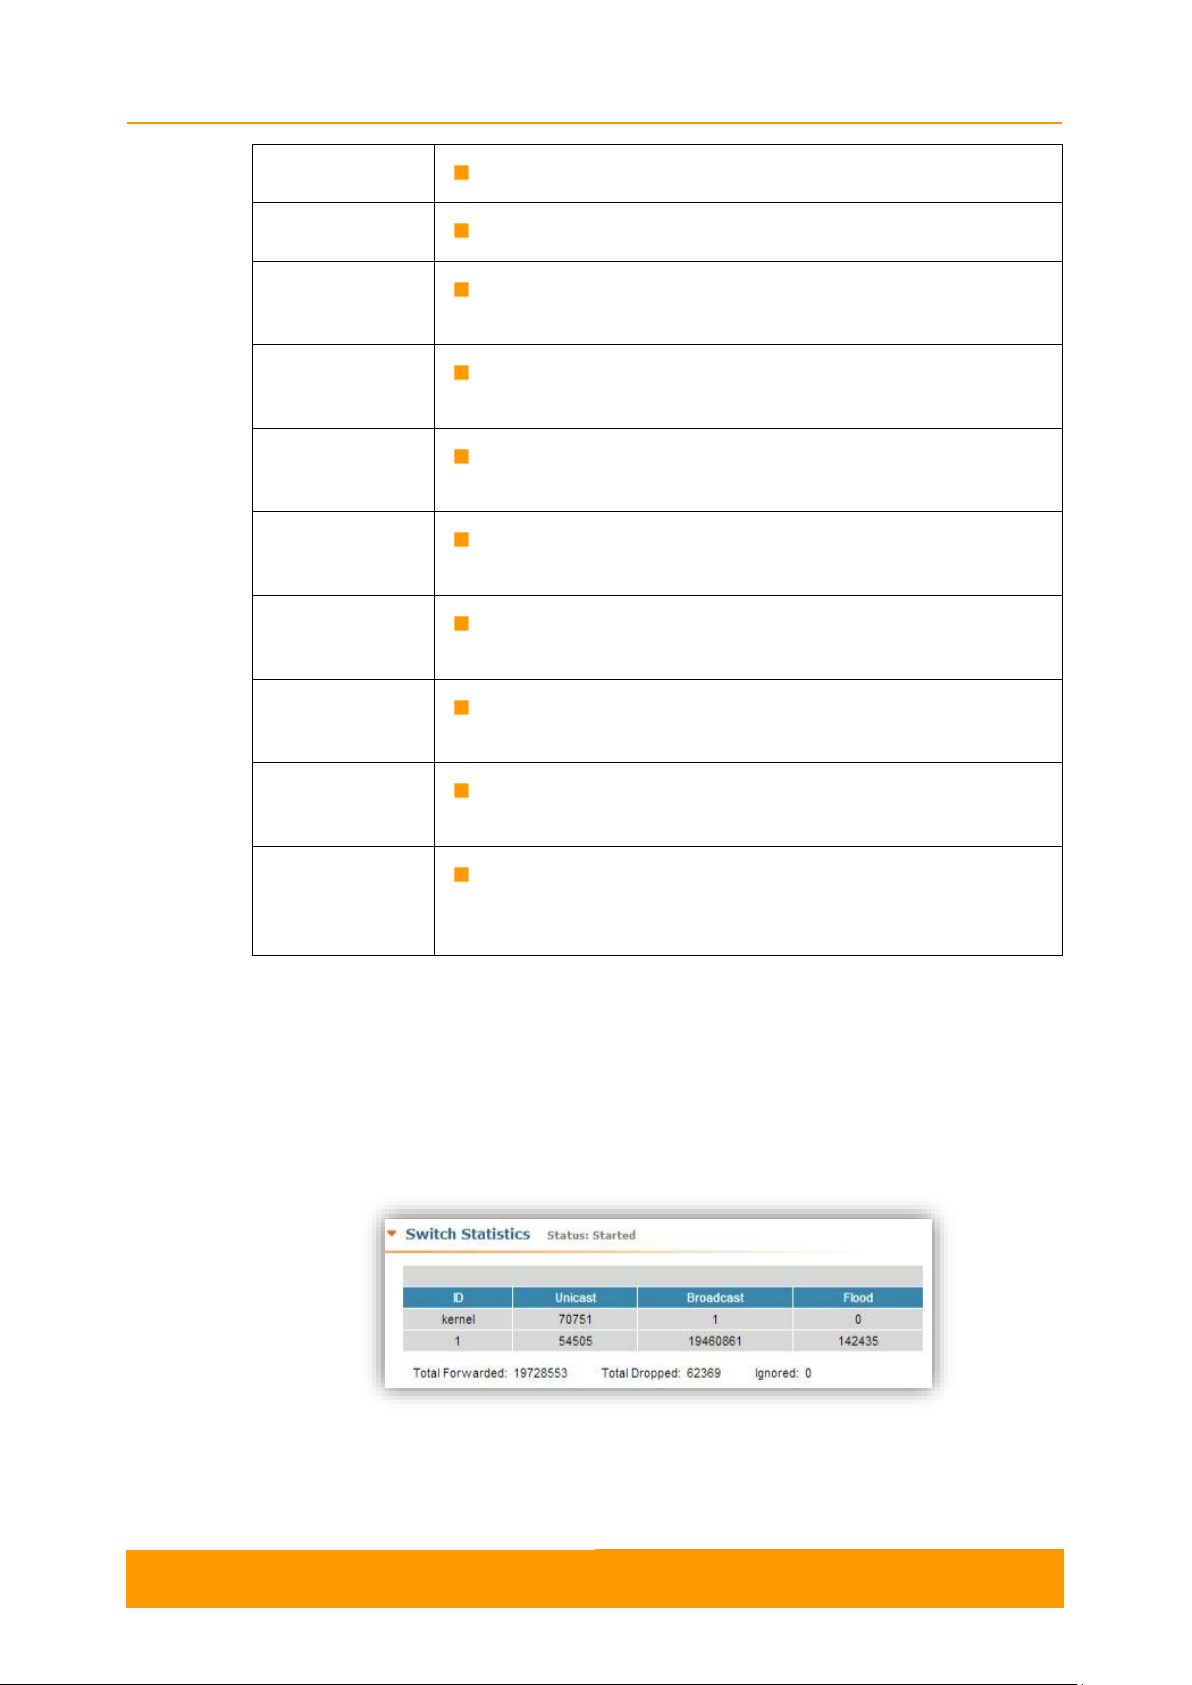
2.3.3. Switch Statistics
This section displays the number of unicast, broadcast and flood packets switched
within each Switch group and also within kernel system (internal traffic), in real-time
(since the last reboot):
It also displays the number of dropped packets for: STP, unreachable destination,
firewall, possible loop, discard, MAC limits and reverse, within each Switch group
and kernel, in real-time (since the last reboot):
Figure 5 - Switch Statistics
Chapter 2 - Features set
User Manual
R5000 series - Web GUI
11
Parameter
Description
Unicast
Sending a packet to a single host (network destination)
identified by a unique address
Broadcast
Sending a packet to all hosts (network destinations)
simultaneously (broadcasting is done by specifying a
special broadcast address on packets)
Flood
Sending a packet along the same link multiple times
(without specifying a destination address for the packets)
Several copies of the same packet would ultimately reach
all nodes in the network in flooding
STP
Spanning Tree Protocol - standardized as IEEE 802.1D
Creates a spanning tree within a network of connected
layer-2 bridges (typically Ethernet switches) and disables
those links that are not part of the spanning tree, leaving
a single active path between any two network nodes
The value displayed in the Switch Statistics table
represents the number of the packets blocked by the
Spanning Tree Protocol
Unreachable
The sender could not reach the specified network
destination
The value displayed in the Switch Statistics table
represents the number of the packets dropped because
they flood to unreachable destination
Firewall
A software or hardware-based network security system
that controls the incoming and outgoing network traffic by
analyzing the data packets and determining whether they
should be allowed through or not, based on applied rules
set
Figure 6 - Switch Statistics
Total forwarded, dropped and ignored packets are displayed in real-time, too.
All these counters can be reset by pressing the «Reset All Counters» button.
Switch Statistics parameters:
Chapter 2 - Features set
User Manual
R5000 series - Web GUI
12
The value displayed in the Switch Statistics table
represents the number of the packets dropped by the
firewall system in the network
Possible loop
A switching or bridging loop occurs in a network when
there is more than one Layer 2 path between two
endpoints
Because a physical topology that contains switching or
bridging loops is needed for the redundancy reasons, the
solution is to allow physical loops, but create a loop-free
logical topology using the spanning tree protocol (STP)
on the network switches
The value displayed in the Switch Statistics table
represents the number of the packets dropped because
they belong to a possible loop (more than one port
declares same packet source)
Discard
The value displayed in the Switch Statistics table
represents the number of the packets dropped by the
configuration (e.g. "switch group N start [discard]")
MAC Limit
MAC address-table limit reached (switch maxsources
(MAXSOURCES|0) # default 5000)
The value displayed in the Switch Statistics table
represents the number of the packets dropped because
the limit of MAC address-table was reached
Reverse
The value displayed in the Switch Statistics table
represents the number of the packets dropped because
they have the same source and destination port (the
frame came to the unit through one port and according to
the switching table it must leave through the same port)
Table 3 - Switch statistics parameters
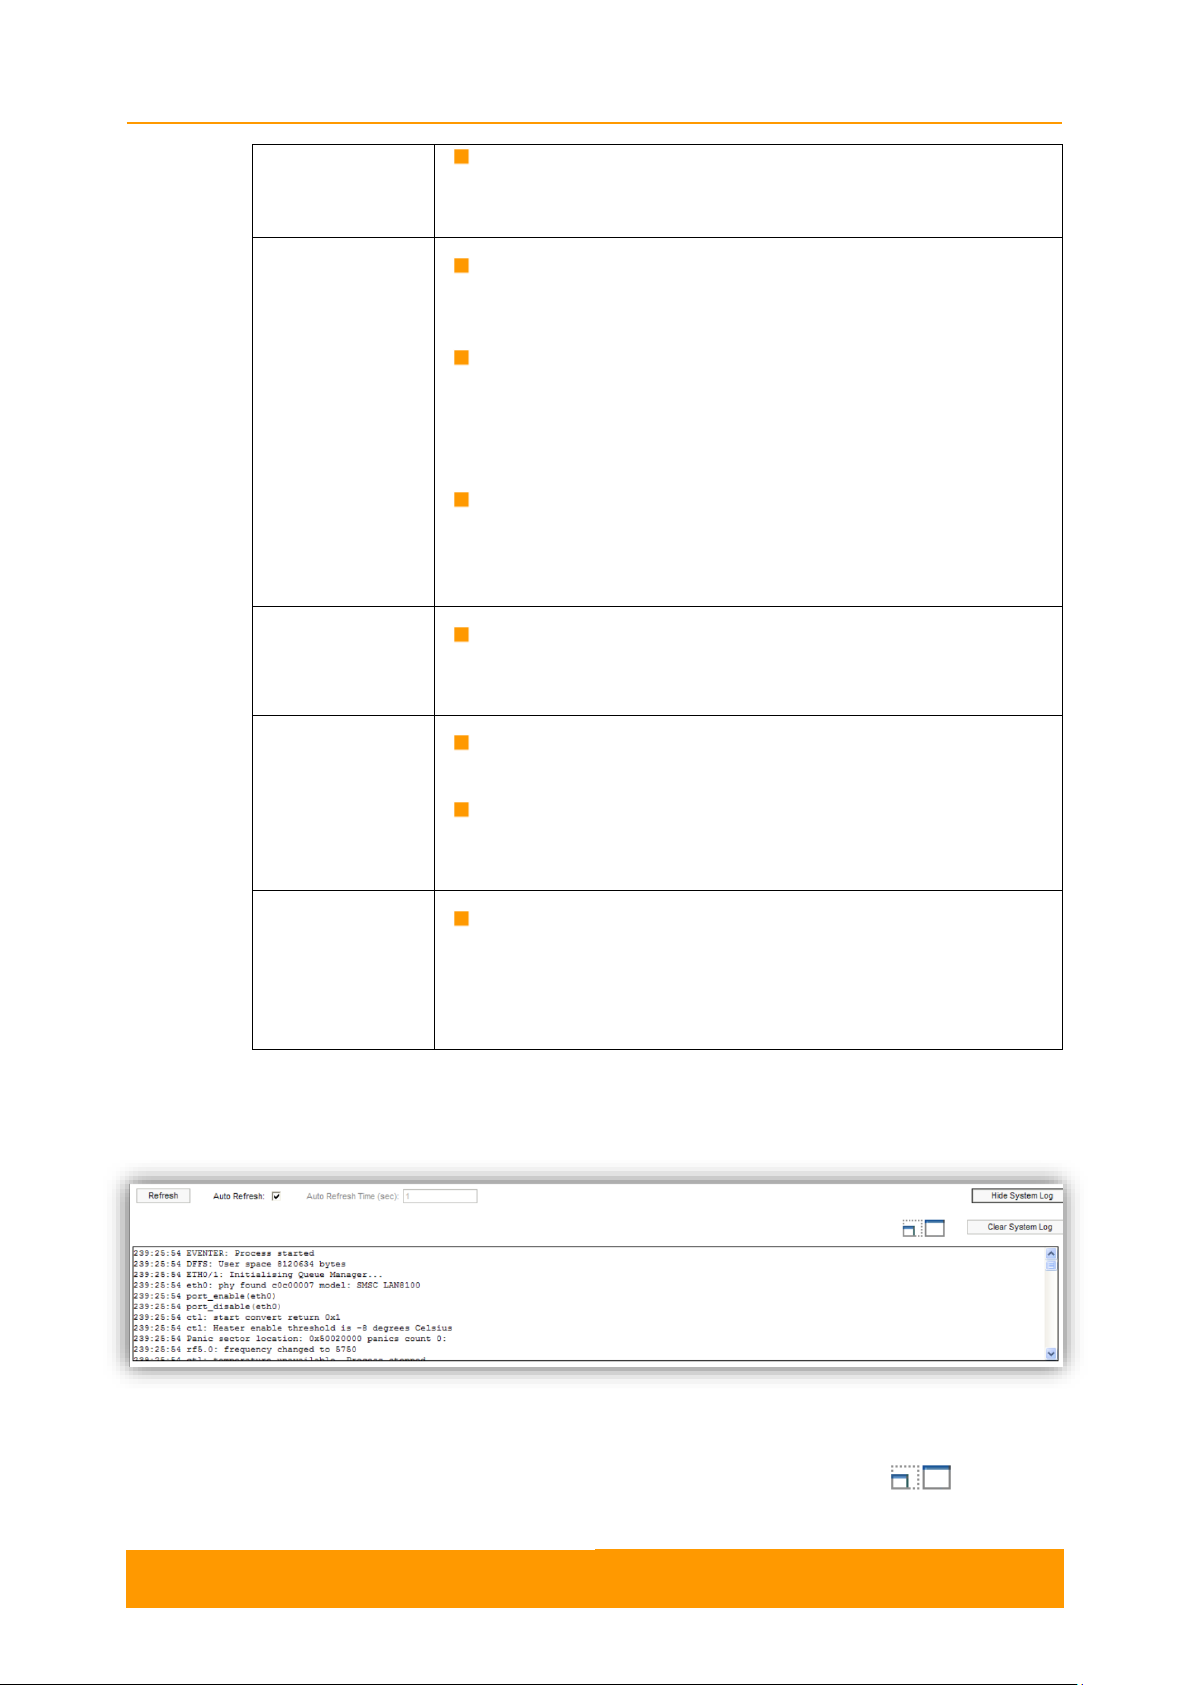
By pressing the «Show System Log» button, you can view the System Log section:
The System Log section allows browsing the unit’s system log. It is possible to
minimize/enlarge the system log window by pressing the buttons:
Figure 7 - System log
Chapter 2 - Features set
User Manual
R5000 series - Web GUI
13
You can delete all the information saved in the system log by pressing the «Clear
System Log» button. You can hide the System Log section by pressing the «Hide
System Log» button.
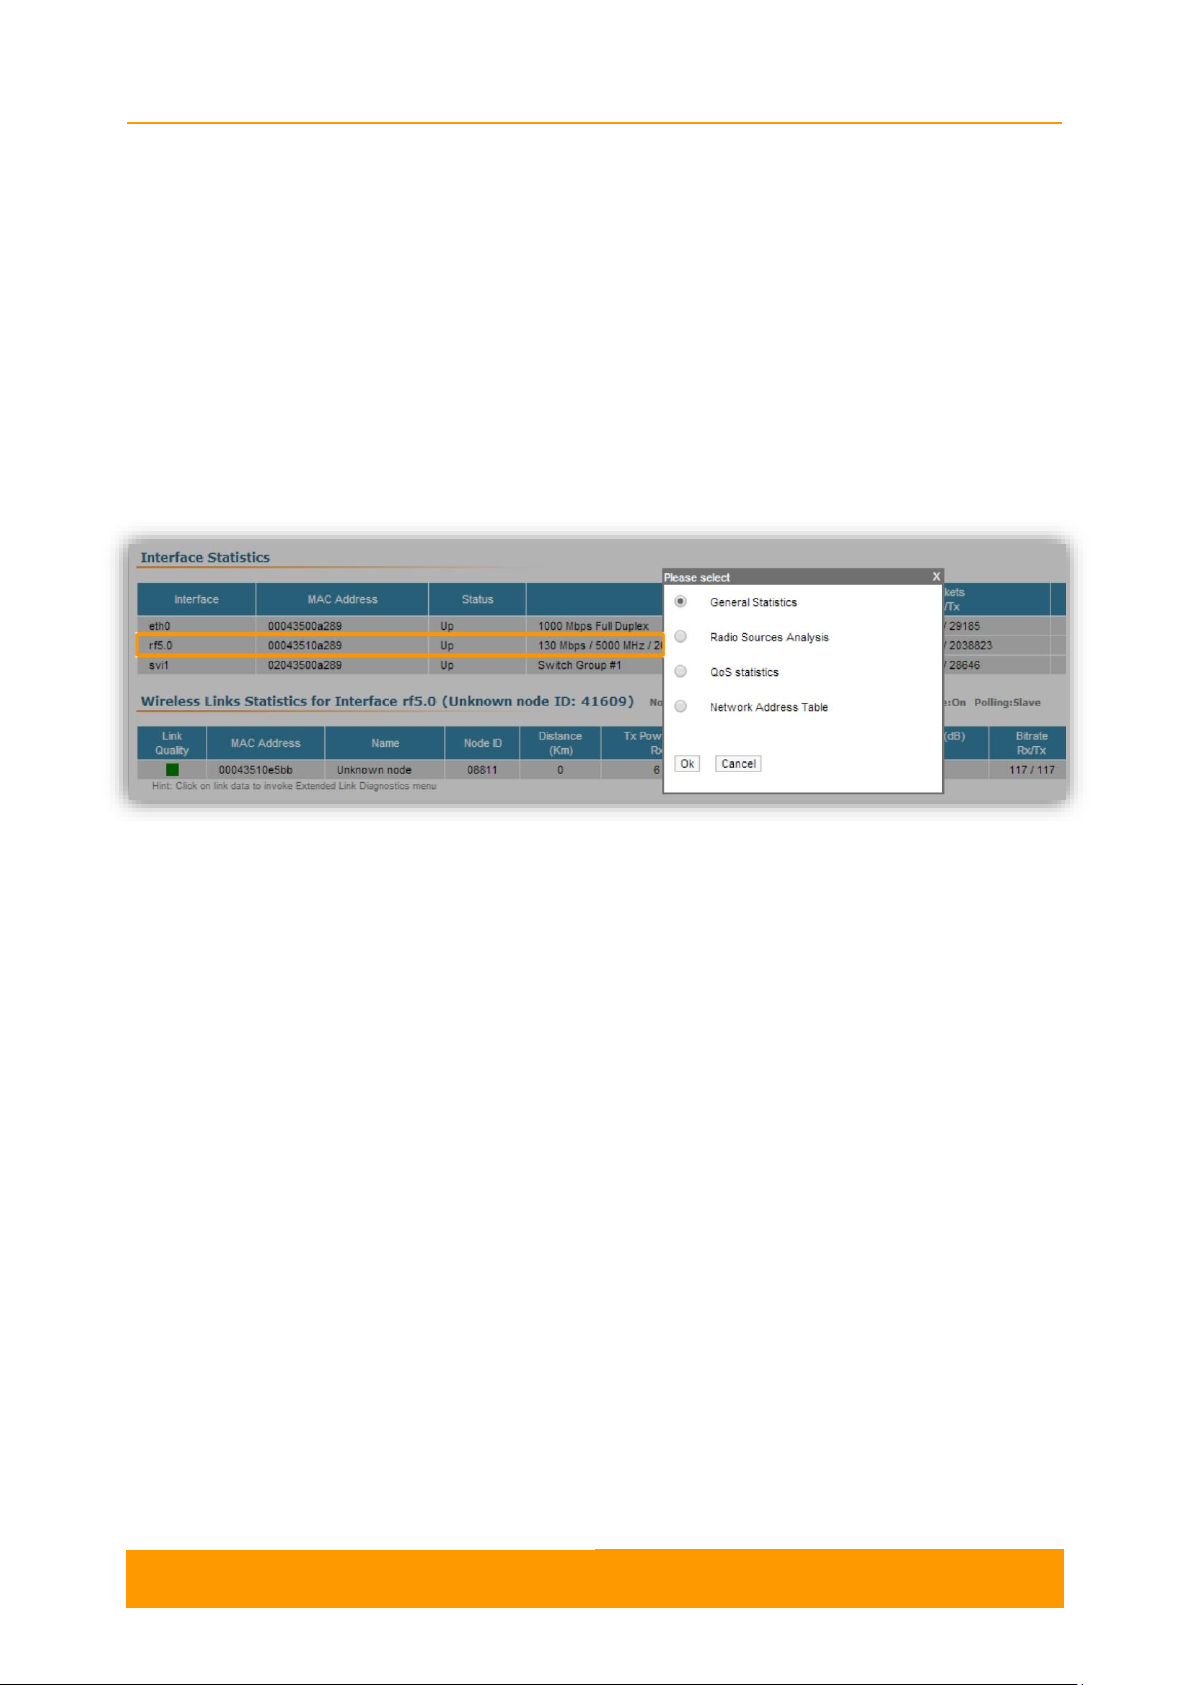
2.3.4. Extended Interface Statistics
Extended Interface Statistics tools gather complete information and enhanced
statistics for each interface of the unit. Each interface type has its own set of
available tools applicable to it.
In order to access the Extended Interface Statistics tools, click on the row of each
interface within the Interface Statistics section:
Figure 8 - Extended Interface Statistics
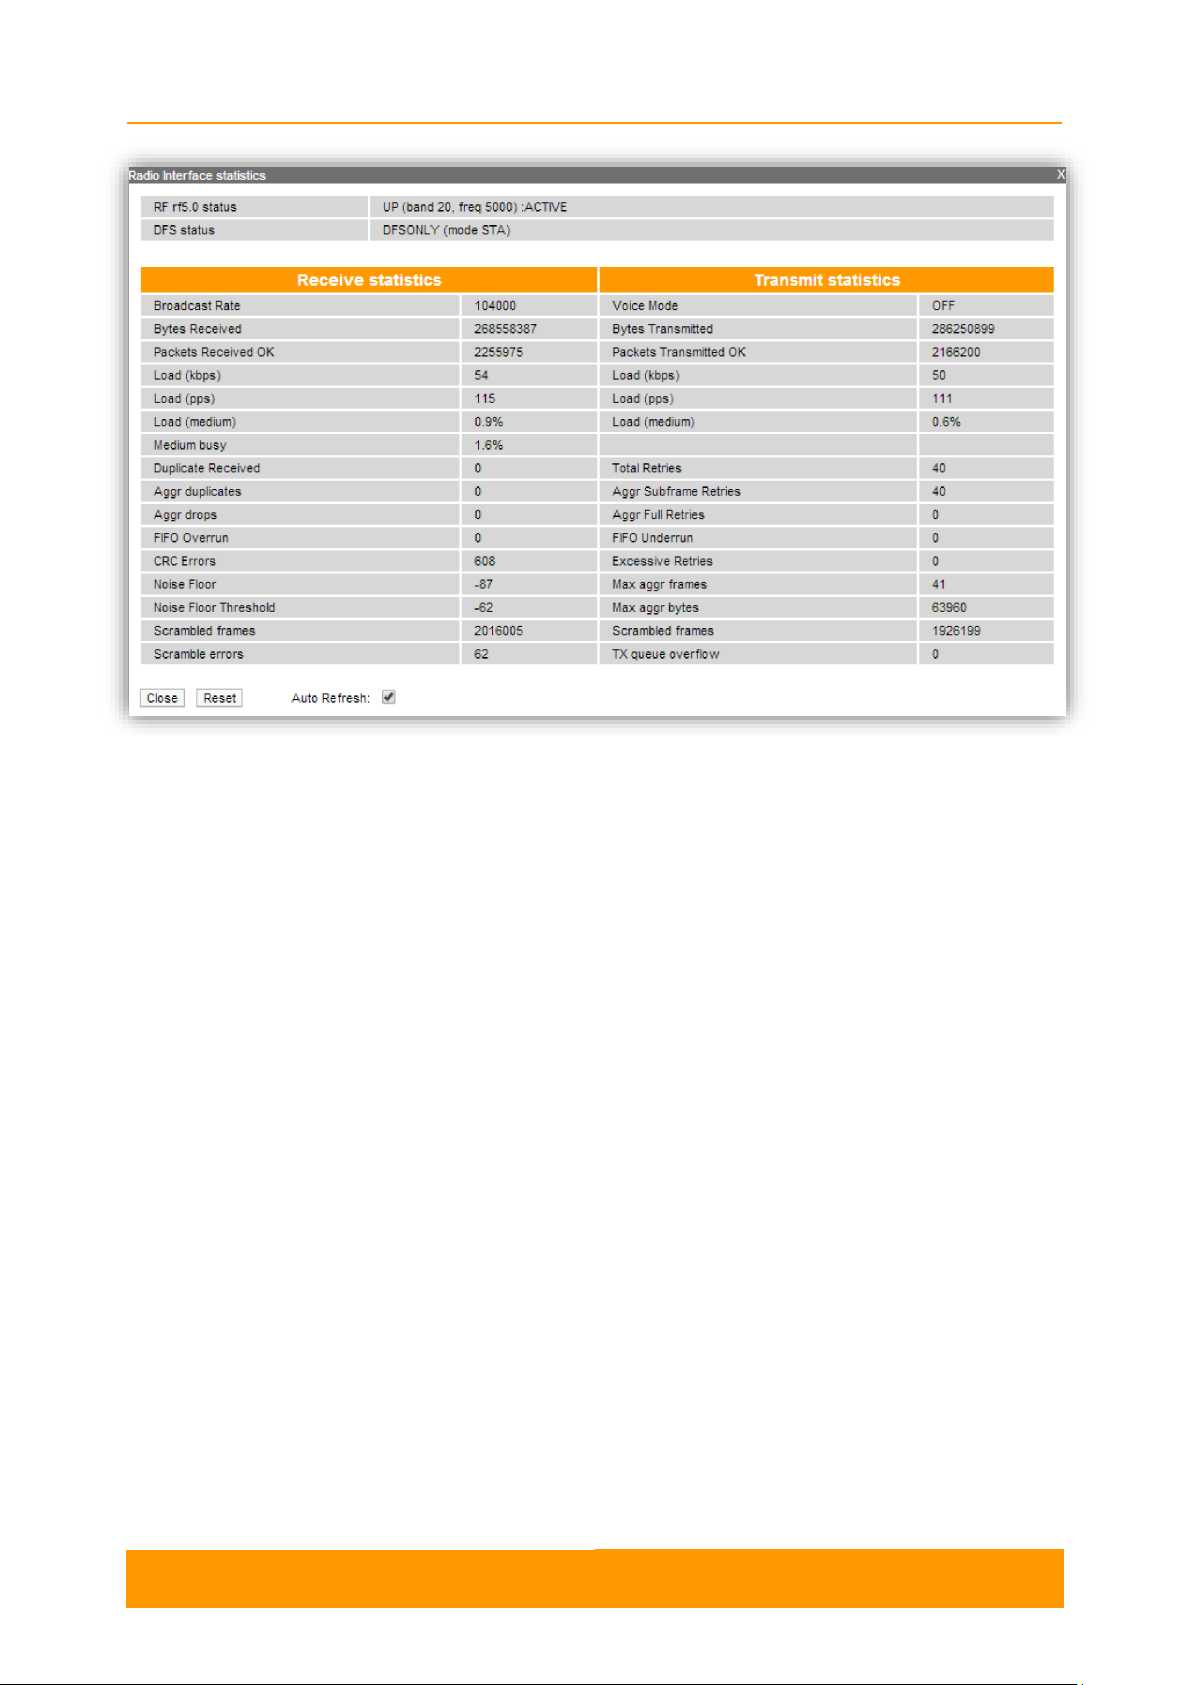
2.3.4.1. General Statistics
The General Statistics tool displays the information about the interface such as the
interface mode, current status, Rx and Tx statistics, etc. The actual statistics details
depend on the interface type.
By pressing the «Close» button, you return to the Device Status page.
By pressing the «Reset» button, you clear all counters displayed in the page.
The "Auto Refresh" option is active by default and refreshes the statistics
automatically. You can disable the auto refresh.
Chapter 2 - Features set
User Manual
R5000 series - Web GUI
14
Figure 9 - General Statistics
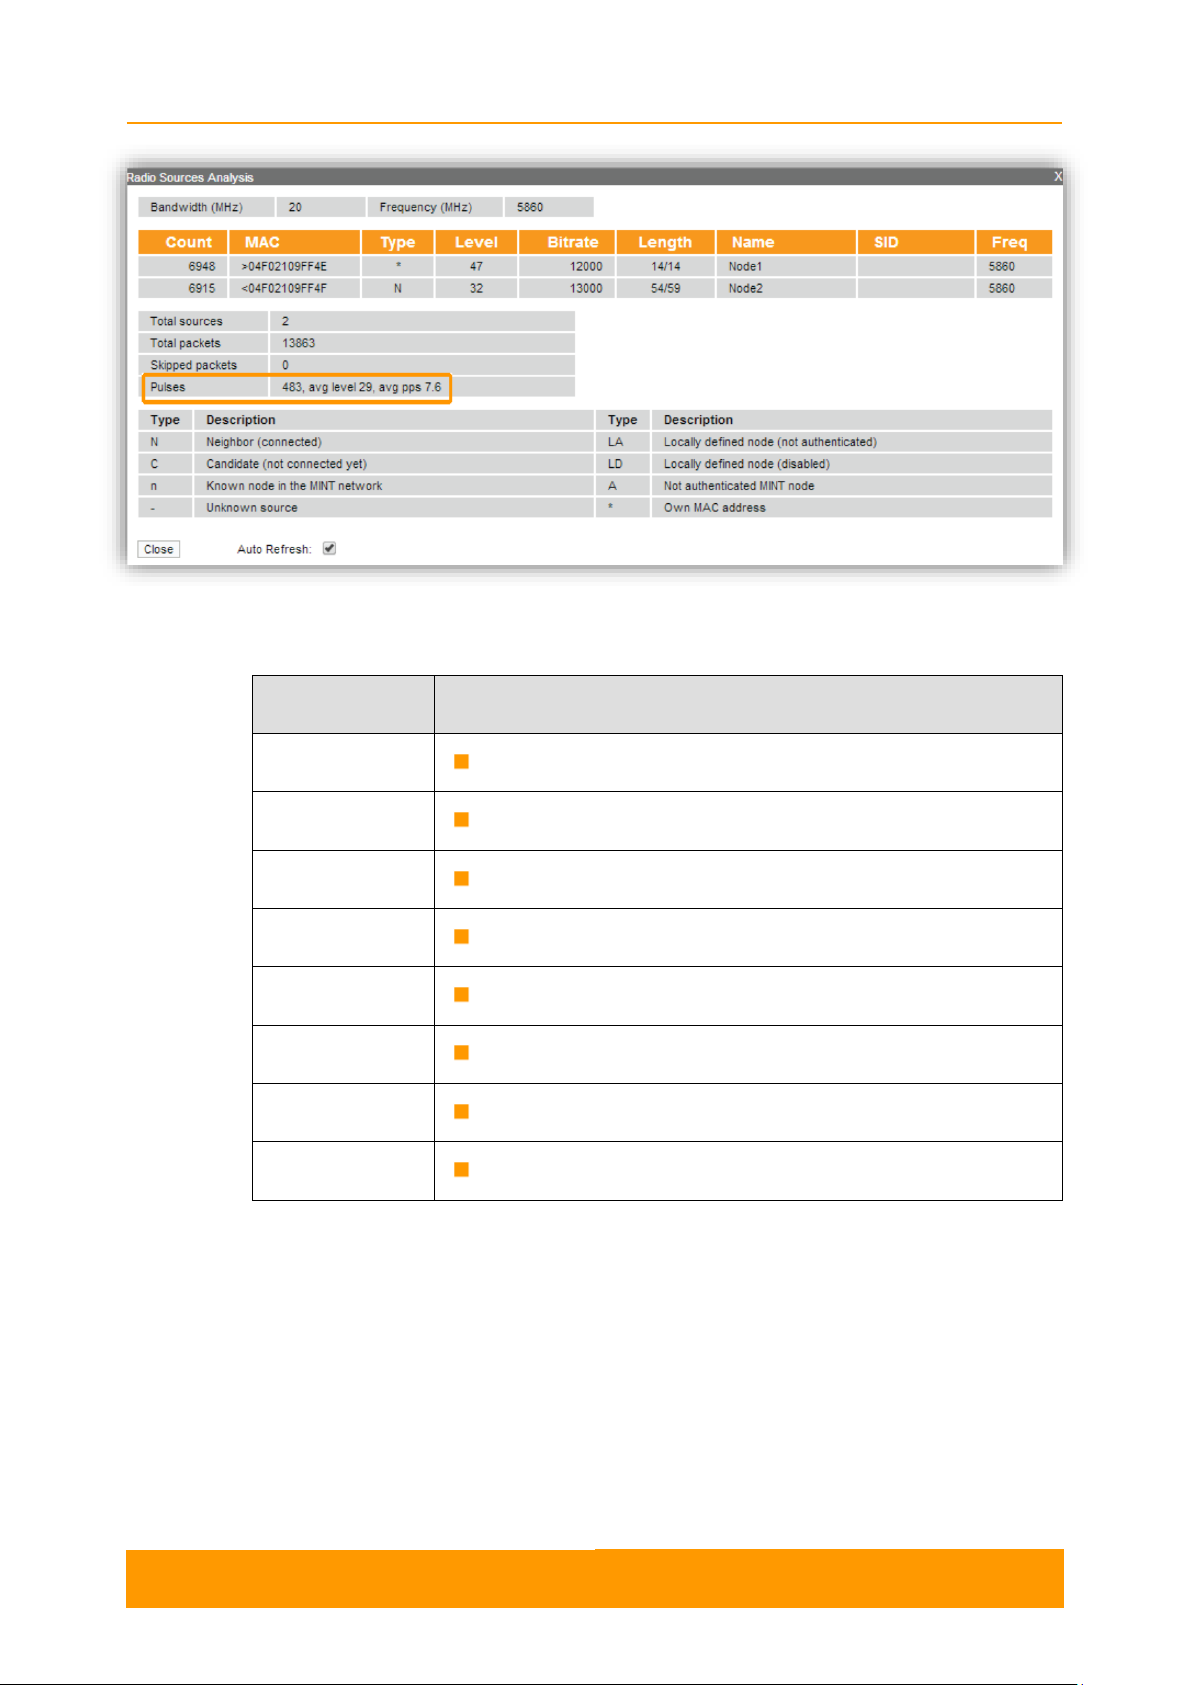
2.3.4.2. Radio Sources Analysis
The Radio Sources Analysis tool allows to estimate the efficiency of the radio links
utilization, analyzing the radio-frequency environment for the current frequency,
under the current channel bandwidth, without the radio link interruption and displays
the following statistics:
- Radio parameters of every source in the radio link
- Number of sources, number of packets, including the skipped ones
- Number of pulses, their average level and average number of pulses per second
Chapter 2 - Features set
User Manual
R5000 series - Web GUI
15
Type
Description
N
Neighbor (connected)
C
Candidate (not connected yet)
n
Known node in the MINT network
-
Unknown source
LA
Locally defined node (not authenticated)
LD
Locally defined node (disabled)
A
Not authenticated MINT node
*
Own MAC address
Figure 10 - Radio Sources Analysis
The abbreviations for each node type are also displayed in the interface:
By pressing the «Close» button, you return to the Device Status page.
The "Auto Refresh" option is active by default and refreshes the statistics
automatically. You can disable the auto refresh.
2.3.4.3. QoS statistics
QoS (Quality of Service) characterizes the entire network performance which is
defined by the parameters such as: throughput, latency, jitter, error rate, available
Table 4 - Node types

Chapter 2 - Features set
User Manual
R5000 series - Web GUI
16
Queue name
Priority/Queue number
QM_PRIO_NETCRIT
0
QM_PRIO_VOICE
1
QM_PRIO_RT1
2
QM_PRIO_VIDEO
3
QM_PRIO_RT2
4
QM_PRIO_QOS1
5
QM_PRIO_QOS2
6
QM_PRIO_QOS3
7
QM_PRIO_QOS4
8
QM_PRIO_BUSINESS1
9
QM_PRIO_BUSINESS2
10
QM_PRIO_BUSINESS3
11
QM_PRIO_BUSINESS4
12
QM_PRIO_BUSINESS5
13
QM_PRIO_BUSINESS6
14
QM_PRIO_BUSINESS7
15
QM_PRIO_BUSINESS8
16
bandwidth, etc. In order to provide the guaranteed Quality of Service for certain
applications, users or data flows, different prioritization methods are used.
The QoS statistics tool displays the statistics of the MINT priority queues for the
interface.
Priority is one of the parameters which define in what sequence, different types of
data traversing every InfiNet device in MINT network are treated. Each channel may
be assigned a priority (e.g. P01, P02 … P16).
Once assigned, a priority will be automatically recognized by every node inside the
MINT network. Each priority value corresponds to a device queue. Once in a queue,
every packet is scheduled according to the queuing algorithm set on the device. QM
manager supports Strict Priority Queuing and Weighted Fair Queuing scheduling
algorithms. Strict Priority Queuing means that the packets from queue with lower
priority are not processed until the queue with higher priority is not empty. Weighted
Fair Queuing uses weights for every queue of an interface and allows different
queues to have different service shares, depending on that weight.
Every channel is also characterized by the latency parameter. This parameter
determines the maximum time for the packets to stay in the channel. If a packet is
waiting in a queue of the channel more than the time specified in the latency
parameter, then it is discarded. Latency can be set for each channel in the Traffic
Shaping section.
Chapter 2 - Features set
User Manual
R5000 series - Web GUI
17
MINT priority
802.1p/TOS priority/DSCP
QM_PRIO_BUSINESS8
00/00/00 (CS0, 000000)
No priority
01/01/08 (CS1, 001xxx)
No priority
02/02/16 (CS2, 010xxx)
QM_PRIO_BUSINESS1
03/03/24 (CS3, 011xxx)
QM_PRIO_QOS3
04/04/32 (CS4, 100xxx)
QM_PRIO_VIDEO
05/05/40 (CS5, 101xxx)
QM_PRIO_VOICE
06/06/48 (CS6, 110xxx)
QM_PRIO_NETCRIT
07/07/56 (CS7, 111xxx)
Table 5 - MINT priorities and WANFLeX queues
Transparent packet prioritization is a WANFLeX feature which allows QM
manager to transparently map 802.1p/TOS/DSCP priority to MINT priority for the
ease of deployment.
You have to make sure that “Dot1p Tags” and/or “IP ToS” options are enabled in
the QoS section.
Table 6 - MINT priority to 802.1p/TOS priority/DSCP map
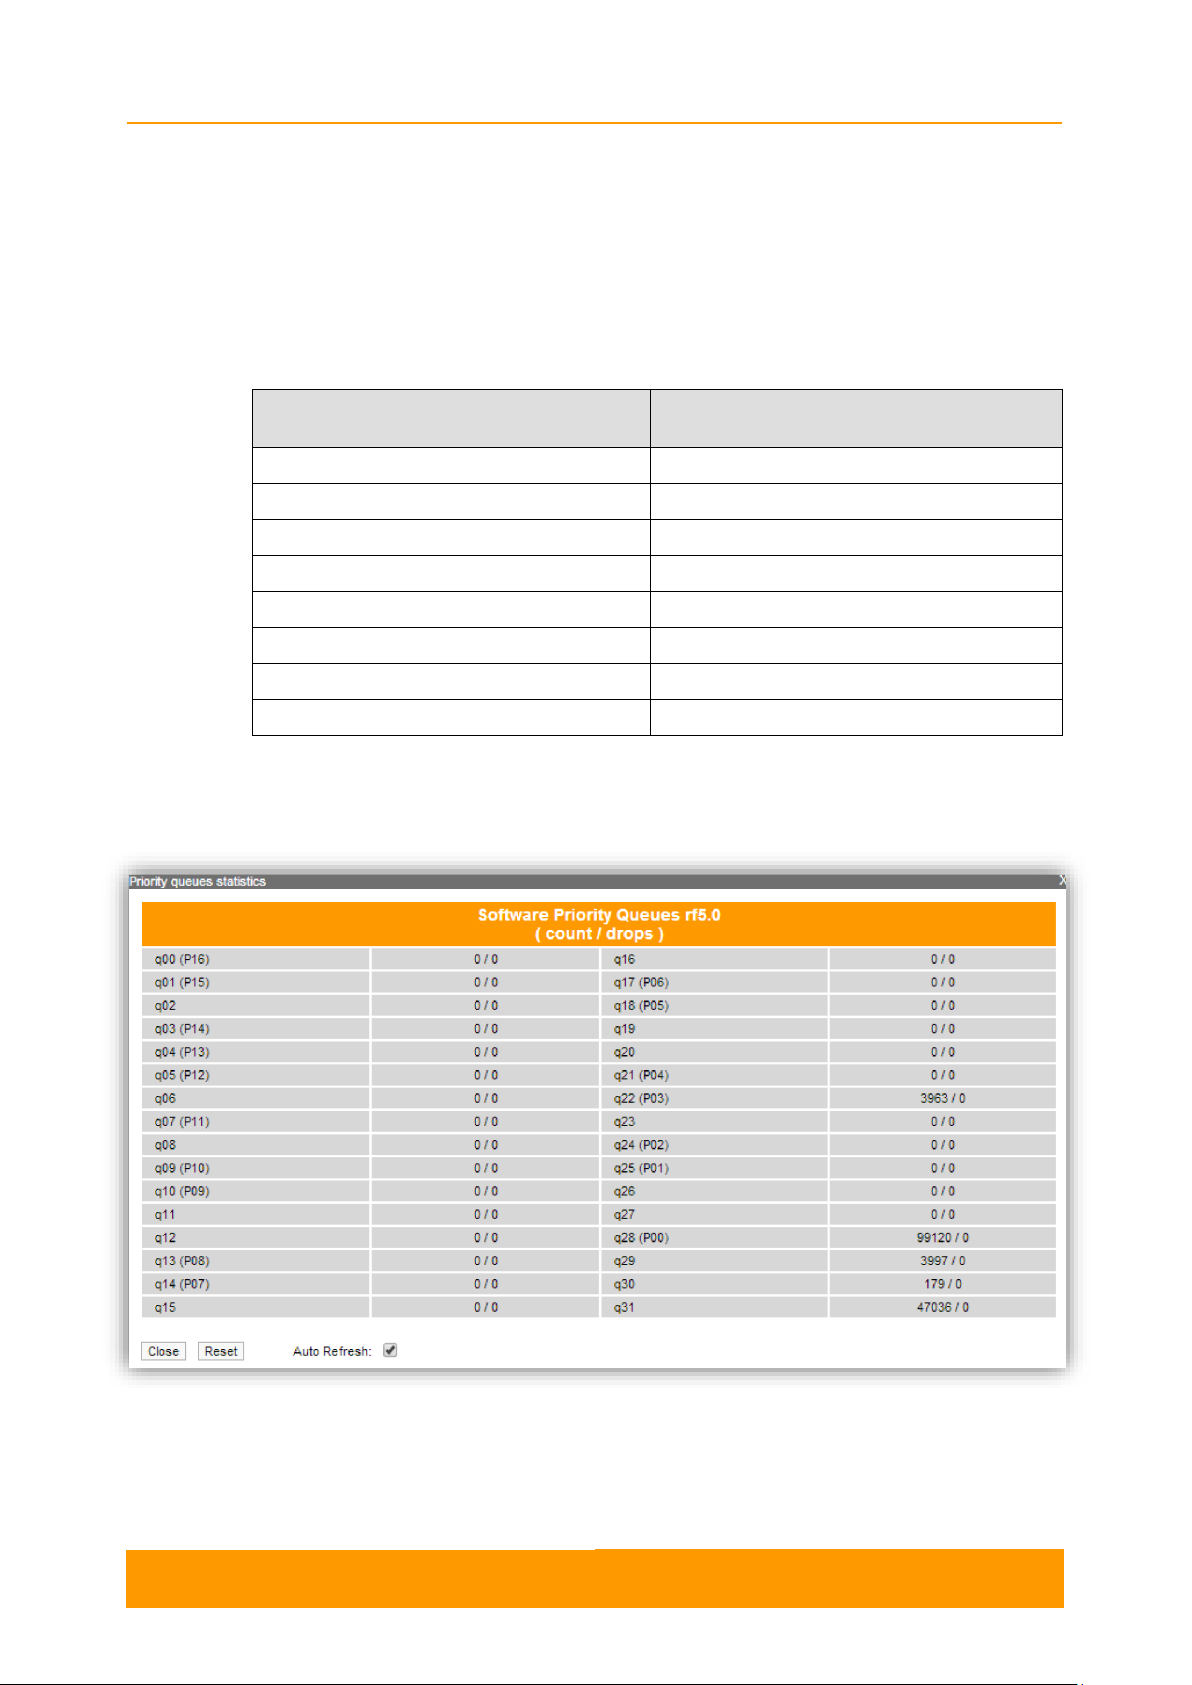
This section displays the number of inbound packets to each priority queue and the
number of dropped packets:
By pressing the «Close» button, you return to the Device Status page.
By pressing the «Reset» button, you clear all counters displayed in the page.
Figure 11 - QoS Statistics
Chapter 2 - Features set
User Manual
R5000 series - Web GUI
18
The "Auto Refresh" option is active by default and refreshes the statistics
automatically. You can disable the auto refresh.
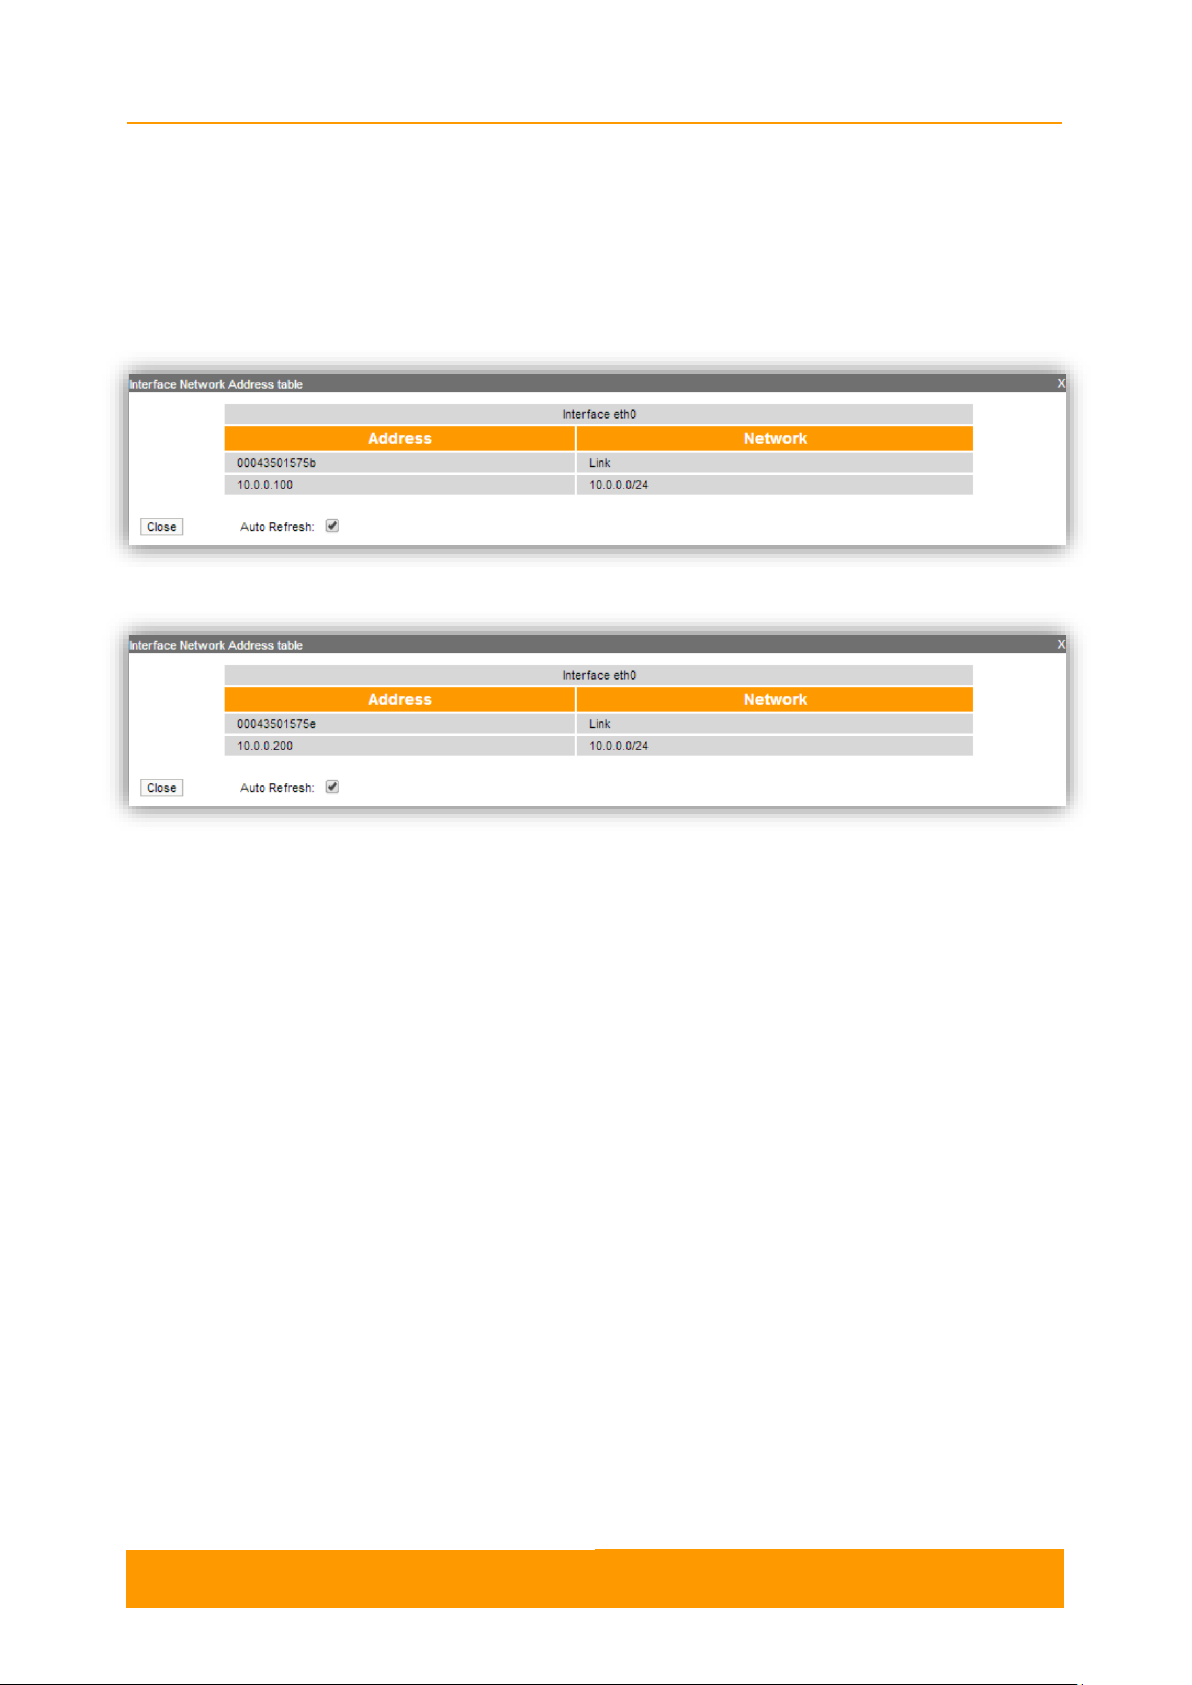
2.3.4.4. Network Address Table
The Network Address Table tool shows the network address table for the interface.
Figure 12 - The Network Address Table for the local unit
Figure 13 - The Network Address Table for the remote unit
By pressing the «Close» button, you return to the Device Status page.
The "Auto Refresh" option is active by default and refreshes the statistics
automatically. You can disable the auto refresh.
2.3.4.5. Extended Link Diagnostic
Once a wireless connection between the unit and the remote neighbor is
established, it is possible to make extended diagnostics and optimization for the
wireless link.
In order to access the Extended Link Diagnostic tools, click on the row of each
wireless link within the Wireless Links Statistics for Interface section:

Chapter 2 - Features set
User Manual
R5000 series - Web GUI
19
NOTE
All results are given in kilobits per second and retries levels are shown as a red chart.
Figure 14 - Extended Link Diagnostic
Five options are available: Performance Tests, Antenna Alignment Tool, Statistics
Graphs, Remote Commands and Link Restart.
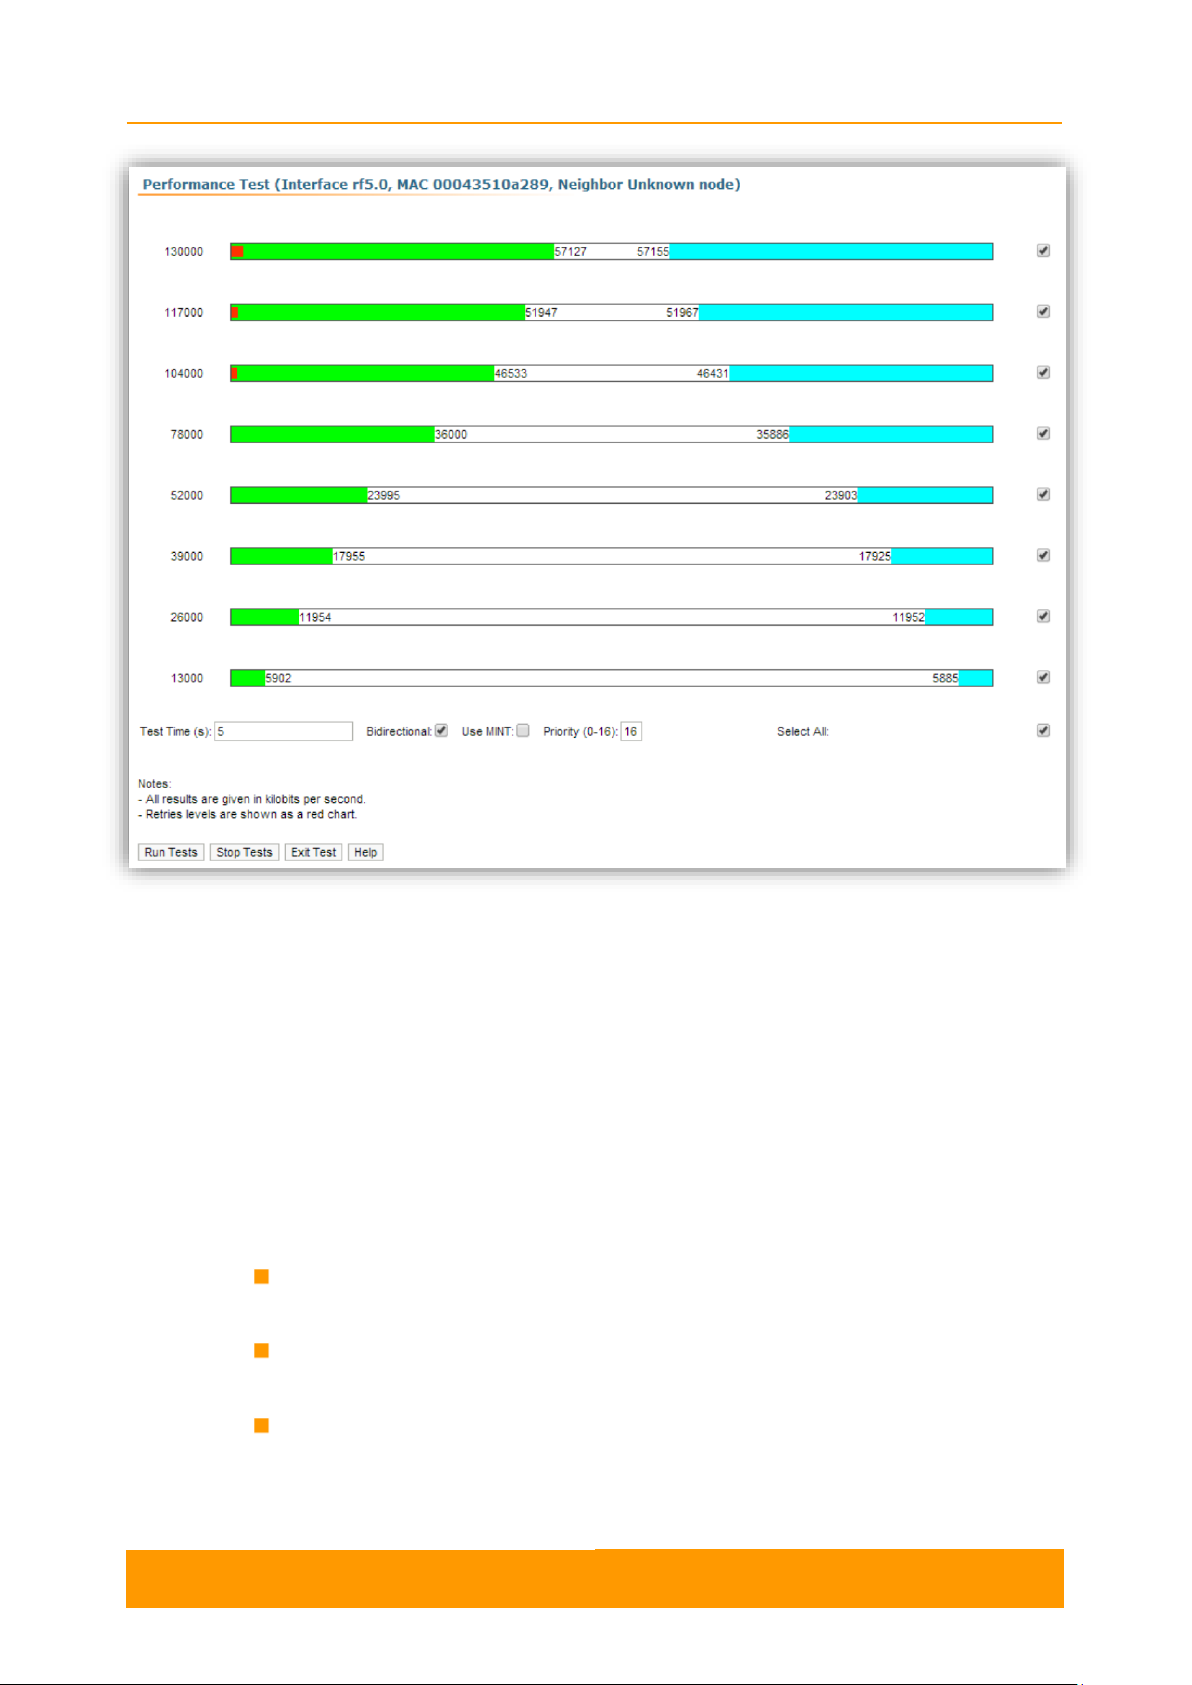
2.3.4.6. Performance tests
The Performance tests tool performs link throughput tests for the configured channel
bandwidth and on the current frequency, without radio link interruption.
The Performance tests tool generates traffic between the devices and displays the
channel throughput for the traffic with chosen priority. For the full throughput tests of
the channel, you must set the highest priority “0” for the test traffic. In this case, the
transmission of any other traffic will be stopped for the testing time and the traffic
generated by the tool will occupy all the channel.
The Performance tests tool displays the values of the full channel throughput which
is available under the current settings, for each bitrate.
Chapter 2 - Features set
User Manual
R5000 series - Web GUI
20
Figure 15 - Performance test
By pressing the «Run Tests»/«Stop Tests» buttons at the bottom of the page, you
can start/stop the performance tests.
By pressing the «Exit Test» button, you return to the Device Status page.
Each row corresponds to a certain bitrate value and can be selected or deselected
for participating in the performance test by marking/unmarking the corresponding
check-box on the right side. By marking “Select all” check-box, all the bitrates could
be selected or deselected at once.
Three more parameters are available for management:
“Test time” parameter - allows setting the duration (in seconds) of the test for
each bitrate (5s by default)
“Bi-directional” check-box - allows choosing between bi-directional (when
checked) and unidirectional (when unchecked) performance test
“Use mint” check-box - allows performing MINT-enabled test when all the traffic
and link parameters are controlled and managed by MINT functions such as
ATPC and auto-bitrate, which provide best throughput and minimal number of
retries (the statistics for errors and retries are not available in this mode because
Chapter 2 - Features set
User Manual
R5000 series - Web GUI
21
NOTE
The performance test with “Use MINT” option is very useful in case you want to get
estimation about the best wireless link throughput (excluding the information about the
bitrate, retries level, etc.).
the errors and retries are already taken into account in the throughput results,
at the optimal bitrate)
Priority (0-16) - By default, it is 16, which is lower than the data traffic that has
priority 15. You can increase the test priority by setting a lower value.
The bitrates list on the Performance test tool consists of the bitrates that correspond
to the channel bandwidth set on the unit (5/10/20/40MHz). To perform the tests for
the bitrates related to the other channel bandwidth, you need to reconfigure the
channel bandwidth (the “Channel Width” parameter in the Radio Setting section of
the Basic Settings page) on both units within the tested link.
Examples given:
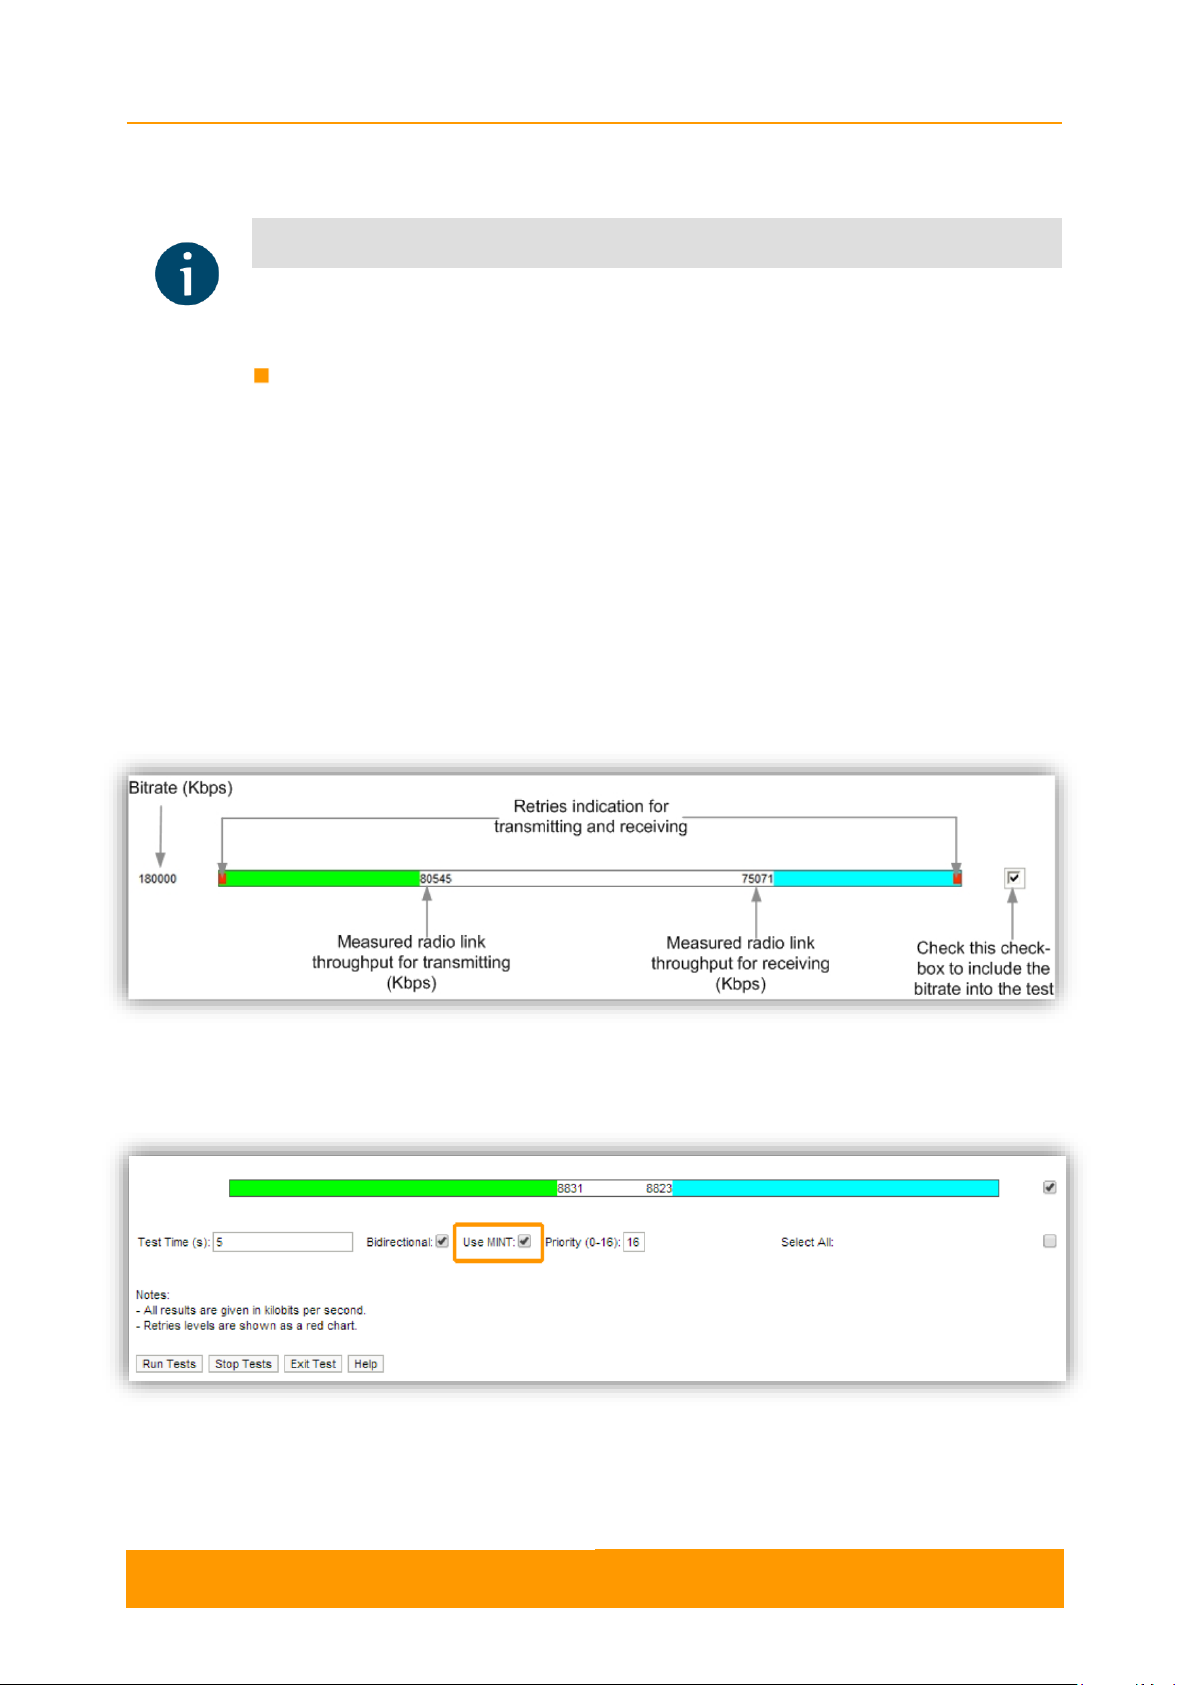
1. Bi-directional performance test output description for 180 Mbps bitrate (40 MHz
channel bandwidth):
Figure 16 - Bi-directional performance test output
2. Bi-directional “Use MINT” performance test output:
Figure 17 - Bi-directional “Use MINT” performance test output
In order to see detailed information about throughput, errors and retries, you can
move the mouse cursor over the indication strip of the required bitrate.

Chapter 2 - Features set
User Manual
R5000 series - Web GUI
22
2.3.4.7. Antenna alignment
The graphical antenna alignment tool allows to visualize the signal characteristics
on both sides of the link in order to make the antenna alignment process more
accurate and easier.
The accuracy of the antenna alignment at the neighbor device is very important for
the link quality.
Figure 18 - Alignment test
By pressing the «Start Test»/«Stop Test» buttons at the bottom of the page, you can
start/stop the alignment test.
By pressing the «Clear History» button, you delete all data stored from the moment
you pressed the «Start Test» button.
By pressing the «Exit Test» button, you return to the Device Status page.
Once the test is started, the antenna alignment can be monitored using the graphic
and text indicators. The indicators for both local and remote devices are displayed
together in the same page which allows viewing the alignment process for both sides
of the link.

Chapter 2 - Features set
User Manual
R5000 series - Web GUI
23
Each side of the link (local and remote) has two similar test indicator sets,
corresponding to each antenna polarization (one for Vertical polarization and
another for Horizontal). This allows controlling the alignment process for each
antenna polarization for the local and for the remote device simultaneously.
The text indicators are:
RSSI - indicates the power level of the received radio signal (measured in dBm)
Chain 0 Signal Level - input signal level (measured in dB) indicator of antenna
number 0 (vertical polarization)
Chain 1 Signal Level - input signal level (measured in dB) indicator of antenna
number 1 (horizontal polarization)
Error Vector Magnitude (EVM) - indicator of the measured input signal quality
(it should be as high as possible in absolute value; the recommended level is
not less than 21 dB; some old firmware had EVM value positive, but most the
firmware has negative value, so for the troubleshooting, evaluate the absolute
EVM value)
Retries - percentage of transmit packet retries
Tx bitrate - displays the current bitrate for the remote and local unit (measured
in Kbps)
Graphical indicator:
Figure 19 - Alignment test - graphical indicator
The main indicator is the Input Signal stripe.

Chapter 2 - Features set
User Manual
R5000 series - Web GUI
24
The height of the Input Signal stripe is measured in dB by the Input Signal Level
scale. The higher the stripe is, the stronger the signal is.
The stripe may change its position along the Cross Fading scale, showing how much
influence the corresponding device antenna has (e.g.: how much vertically and
horizontally polarized signals influence each other). Higher the value of the stripe
according to the Cross Fading scale (the farther stripe is from the 0 dB value), less
the influence antennas have on each other.
The top of the Input Signal stripe can be located in black (Good signal) or red (Bad
signal) background areas or somewhere in between them. This means the signal is
good, bad or average correspondingly. When aligning the antenna, it is
recommended to try achieving the stripe top to be located in the black area.
At the bottom of the Input Signal stripe may appear a special red sub-stripe. This
sub-stripe indicates the presence of the packet retries and the percentage of the
total number of transmitted packets.
During the alignment test, the Input Signal stripe may change its position along the
Cross Fading scale and increase or decrease in height, indicating the changes in
the received signal. When the top of the stripe changes its location, moving from one
point on the background area to another, it leaves pink and blue marks behind,
indicating the maximum and minimum measured levels of the signal at a particular
point. Thus, it makes possible to observe the “history” of the signal changes.
You can clear the marks by pressing the «Clear History» button at the bottom of the
page.
Main recommendations when using the “Antenna Alignment Tool”:
It is recommended to start antenna alignment with searching the maximum
signal level on a minimal possible bitrate. Afterwards, automatic MINT
mechanisms will set the most appropriate bitrate when “Autobitrate” mode will
be enabled
Input signal level should be between 12dB and 50dB. It is recommended that
ATPC to be disabled
If signal level is more than 50dB, it is recommended to lower the amplifier power
If maximal signal level is less than 12, it is recommended to lower the channel
width (e.g. from 20MHz to 10MHz)
In some cases, a signal level that is less than 12 may be enough for the radio
link operation. In this case, you should be guided by parameters such as the
number of retries and Error Vector Magnitude. If the number of retries is low
(close to “0”) and EVM is more than 21 (Input Signal stripe is green) then the
radio link is most likely, operating properly
Retries value should be zero or as low as possible (less than 5%)
The top of an Input Signal stripe should be located in the black area

Chapter 2 - Features set
User Manual
R5000 series - Web GUI
25
The signal quality should be good: EVM value should be more than 21
Input signals of the two antennas of the device should have similar Cross fading
values (Input Signal stripes should be symmetrically to the value of 0dB)
ALL described recommendations are applicable to both (Local and Remote)
sections.
Link samples:
Good link sample
Figure 20 - Alignment test - graphical indicator - positive example
Bad link sample

Chapter 2 - Features set
User Manual
R5000 series - Web GUI
26
Figure 21 - Alignment test - graphical indicator - negative example
2.3.4.8. Statistics Graphs
The Statistics Graphs tool has been developed based on “digraphs”, which is a fast,
flexible open source JavaScript charting library.
The Statistics Graphs tool allows you to monitor the device parameters represented
in the graphical charts. The following modes are available: real-time monitoring, daily
and monthly data logs display (use the dropdown menu from the top of the page to
change the mode).
The system displays, by default, the daily data logs. All charts support simultaneous
zoom to improve usability: the “zoom in” action in a certain region on any of the
charts reflects on all other charts that are re-scaled automatically to display the data
collected during the same period of time.
Critical events like link outages or frequency swaps are marked by small red balloons
on the bottom of each graph. Move the mouse over each balloon for details:

Chapter 2 - Features set
User Manual
R5000 series - Web GUI
27
Figure 22 - Statistics graphs - balloon indicators
Working with the charts:
- Select a chart region to zoom in
- Hold the «Shift» button and drag the graphs to the pan
- Double-click on any chart to reset the zoom
The parameters that can be monitored are:
Figure 23 - Statistics Graphs - RX/TX Ref. Level
This chart displays the measured RX (green) and TX (blue) signal levels. Red
regions represent link outages. The default graph uses the CINR measurement
method; however, the RSSI method can be selected from the drop-down menu.

Chapter 2 - Features set
User Manual
R5000 series - Web GUI
28
Figure 24 - Statistics Graphs - RX/TX Retries
This chart displays the retry percentage (it provides a quick estimation of the link
quality). Similar to the previous graph, RX retries are represented by the green lines,
TX retries by the blue lines and link outages by the red lines.
Figure 25 - Statistics Graphs - RX/TX Bitrate
The Bitrate chart displays the bitrate for each of the two units in the link. These
parameters indicate the link quality, too.

Chapter 2 - Features set
User Manual
R5000 series - Web GUI
29
Figure 26 - Statistics Graphs - RX/TX Load
The load charts display the actual link load information, either in real time or for a
set period of time. The yellow lines represent the total link load, the green lines
represent the RX load and the blue lines represent the TX load.
Figure 27 - Statistics Graphs - CPU Load & unit temperature
The last chart displays the current CPU load and unit temperature (only for the units
equipped with temperature sensors).
You can view the six graphs presented above into one or two columns per page by
pressing the «Change Layout» button.

Chapter 2 - Features set
User Manual
R5000 series - Web GUI
30
2.3.4.9. Remote Commands
The Remote Commands tool allows one MINT node to perform commands on
another or all MINT nodes in the network at L2 level using WANFleX OS CLI
commands.
Run the string you typed into the “Command” field by pressing the «Execute» button.
For the full list and description of WANFleX OS CLI commands, please refer to the
WANFleX OS User Manual.
You can set the key grant access to the remote node using the “Key” textbox and
pressing the «Execute» button. Please note that this key must be prior set at the
remote node via CLI (commands guestKey, fullKey - see details in the OS WanFlex
manual).
Erase the string you typed into the “Command” field and all output from the display
section by pressing the «Clear» button.
Stop a command execution during the execution phase by pressing the «Stop
Execution» button.
By pressing the «Close» button, you return to the Device Status page.
You can choose between plain and rich text format by marking/unmarking the
corresponding checkbox.
You can execute the same command from the BS to all CPEs in the network (to the
nodes that are linked to the BS) by marking “Send to all” checkbox before pressing
the «Execute» button.
You can upload the configuration file to the remote node by pressing the «Upload
Config…» button and you can reboot the remote node by pressing the «Reboot
Remote Unit» button (a warning message pops up before the reboot).
For the ease of usage of the Remote Commands tool, the corresponding buttons for
the most used WANFleX OS CLI commands are available in the right side of the
screen:

Chapter 2 - Features set
User Manual
R5000 series - Web GUI
31
Figure 28 - Remote commands
By pressing the «System Info» button, you fill in the “Command” field with system
version, system uptime and system cpu commands.
By pressing the «System Config» button, you fill in the “Command” field with system
uptime and config show commands.
By pressing the «System Log» button, you fill in the “Command” field with system
log show command.
By pressing the «Routing Table» button, you fill in the “Command” field with netstat
-r command.
By pressing the «ARP Table» button, you fill in the “Command” field with arp view
command.
By pressing the «Switch Statistics» button, you fill in the “Command” field with switch
statistics command.
By pressing the «Link Status» button, you fill in the “Command” field with mint map
detail command.
By pressing the «Interface Table» button, you fill in the “Command” field with netstat-
i command.
All commands are executed automatically after pressing one of the buttons
mentioned above.

Chapter 2 - Features set
User Manual
R5000 series - Web GUI
32
NOTE
All WANFleX OS CLI commands can be executed from the Remote Commands tool.
2.3.4.10. Link Restart
You can restart the wireless link (re-association, re-authentication and reconnection) by selecting the “Link Restart” radio button and then by pressing the
«OK» button in the link options.
A warning message pops up before the link restart. If the operation is executed, the
link disappears from Device Status page until it is reestablished again.
Figure 29 - Link restart
Figure 30 - Link restart - warning message
2.3.5. Extended Switch Statistics
Extended Switch Statistics tools allow gathering complete information and enhanced
statistics for each group of the unit.
In order to access the Extended Switch Statistics tools, click on the row of each
switch group or kernel within the Switch Statistics section:

Chapter 2 - Features set
User Manual
R5000 series - Web GUI
33
Figure 31 - Extended Switch Statistics
Two options are available: switch DB statistics and switch VLAN statistics.
2.3.5.1. Switch DB Statistics
Switch DB Statistics tool gathers complete information and enhanced statistics for
each switch group, including kernel:
Figure 32 - Switch DB Statistics
By pressing the «Close» button, you return to the Device Status page.
The "Auto Refresh" option is disabled by default. You can enable the auto refresh in
order to have the statistics automatically refreshed.
2.3.5.2. Switch VLAN Statistics
The Switch VLAN Statistics tool gathers complete information and enhanced
statistics for each VLAN created:
Figure 33 - Switch VLAN Statistics
By pressing the «Close» button you return to the Device Status page.

Chapter 2 - Features set
User Manual
R5000 series - Web GUI
34
NOTE
This message is not displayed in the default configuration, but only after the first
configuration via CLI.
The "Auto Refresh" option is disabled by default. You can enable the auto refresh in
order to have the statistics automatically refreshed.
2.4. Basic Settings
R5000 series units can be configured via Web interface, or via Command-line
interface.
The parameters for the majority of the Command-line interface commands are
displayed in the Web interface. Saving the configuration for these parameters in any
of the two interfaces (Command-line and Web) is reflected in both interfaces.
However, for some other commands, the most important parameters can be set via
Web interface, but the enhanced parameters of these commands can be set via
Command-line interface only. The commands that do not have the enhanced
parameters displayed in Web interface are: sys, ifconfig, prf, qm, tun, route, mint,
switch, svi, lag, sntp, dhcpc (please consult the information about the Extra
Commands section within the current chapter, below).
The settings of these enhanced parameters will be lost after saving the configuration
via Web interface.
The warning message below is displayed in the Basic Settings page from the Web
interface if the configuration has been previously created via CLI, in order to avoid
losing data for those only few commands that don’t reflect their parameters in the
Web interface:
Figure 34 - Basic settings warning message
The Basic Settings page has the following sections:
System Settings
Network Settings
Link Settings
Static Links

Chapter 2 - Features set
User Manual
R5000 series - Web GUI
35
NOTE
Read the information at the end of the Basic Settings page in order to find out the output
of the «Apply», «Test» and «Preview» buttons for the new configuration performed.
General
System
Parameter
Description
Device Name
You can set the device name
This parameter is displayed in the web-page header
User Name
Displays the username (Login) used to access the unit
management interfaces
You can change the current username
MAC Switch
IP Firewall
SNMP
QoS Options
Traffic Shaping
Extra Commands
2.4.1. System Settings
In this section, you can view and edit the basic system settings that are already
created.
Figure 35 - System Settings default configuration

Chapter 2 - Features set
User Manual
R5000 series - Web GUI
36
Password and
Confirm
Password
You can change the password set in the previous
configuration only after unmarking the option “keep current
system password" in the corresponding checkbox
You can return to the default settings for Password and
User Name (any values with non-zero length) by
unmarking the checkbox “Keep current system password”
and leaving the corresponding fields empty and save the
configuration at the bottom of the page
WEB Interface
language
You can change the default system language (English) into
Russian, French, Italian or Chinese language
HTTPS only
You can set that all HTTP connections to the unit to
perform via HTTPS (HTTP with SSL only) by marking the
option “HTTPS only” in the corresponding checkbox
By default, this option is disabled
Start SNTP
You can start SNTP service by marking the option “Start
SNTP” in the corresponding checkbox
By default, this option is disabled
SNTP IP
Address
You can set the IP address of a valid SNTP server
The unit must have an active connection with the SNTP
server in order to receive time services
Time Zone
You can set the time zone in POSIX format. E.g. GMT+4
Latitude
You can set the latitude of the geographical place where
the unit is installed
GPS latitude format is [N/S]YY.YYYYYY
Use the Google Map feature to automatically fill in this field
(follow the indications below)
Longitude
You can set the longitude of the geographical place where
the unit is installed
GPS longitude format is [E/W]XX.XXXXXX
Use the Google Map feature to automatically fill in this field
(follow the indications below)
Table 7 - System Settings
Press the «Open Map» button to open the Google map:

Chapter 2 - Features set
User Manual
R5000 series - Web GUI
37
Type the location name in the Address bar, press the «Find» button to search for it
and then move to the exact location where the unit is installed. Double click in that
position on the map and the Google pointer (see picture above) will be placed there.
After pressing the «Ok» button, “Latitude” and “Longitude” fields are automatically
filled in with the GPS coordinates.
2.4.2. Network Settings
In the Network Settings section, there are displayed all physical and logical network
interfaces that are already configured. The physical interfaces (eth0 and rf5.0) are
set by default and they cannot be removed. For these two interfaces, you are allowed
to change the parameters only.
For the following layer 2 and 3 logical interfaces, you are allowed to add (by pressing
the corresponding buttons and specifying the interface number), remove and change
the parameters of the interface:
- Pseudo Radio Interface - prfX can be attached to the Ethernet interface in
order to allow it to work as a radio interface using the MINT protocol, so that the
node can find its neighbors and establish the links with them through this
interface. The interface encapsulates MINT-frames into the Ethernet-frames
and allows connecting the units of the MINT network using wired interfaces.
Also, this interface can be joined with other interfaces;
Figure 36 - Google Map
- VLAN - vlanX can be assigned to a physical interface or to a virtual interface
sviX. It is used for the creation of the logical network topology regardless of the
physical topology of this network. VLAN allows creating groups of interfaces

Chapter 2 - Features set
User Manual
R5000 series - Web GUI
38
NOTE
Before making the configurations in Network Settings section, please read the information
presented in the MAC Switch section below.
which have a common set of requirements. It contributes to reducing the
multicast traffic in the network, as every VLAN is a separate multicast domain.
VLAN usage increases the network security and manageability;
- LAG - lagX can be assign to two physical interfaces in order to use them as
one logical interface for total throughput increasing and system reliability
improving. The total throughput of the logical channel represents the sum of the
capabilities of associated physical interfaces. In case of failure of any physical
channel included in the logical channel, the system will continue to operate,
using the rest operable physical channels. Interface allows creating high speed
links (between the unit and the network switch, for example) by means of
aggregation of the two available Ethernet-interfaces of the unit (it is intended for
Smn/Lmn units with 2 Ethernet ports);
- Switch Virtual Interface - sviX is an L3 interface that can be assigned to a
switching group for getting access to the unit management via this switching
group. This interface becomes part of this switching group and can participate
in the exchange of information with other group members so that any packets
received by the group (according to its rules), or addressed to the sviX directly,
or copies of multicast/broadcast packets, will be received by the unit through
the sviX. This interface allows getting the remote access to the unit
management. It is also used for the Management VLAN configuration;
- Tunnel - tunX is implemented like a PtP link between two routers that
encapsulates the flow into the IP packets and send it to the end point of the link
using the existing transport environment. It allows to unite two remote networks
(which are not directly connected) in an integrated logical structure (VPNs)
which use its own network address allocation and account policies, independent
from the ones supplied by the service providers for each of the separate network
segments;
- TAP - tapX interface simulates a link layer (L2) device and operates with
Ethernet frames. TAP interface is used for creating a network bridge.

Chapter 2 - Features set
User Manual
R5000 series - Web GUI
39
Interface type
Operations
ethX
Configure the IP address(es) and the mask of the interface
The IP address(es) of the ethX interface will be accessible
via Ethernet LAN segment only (it won't be accessible via
the rfX interface from other neighbor unit)
But, the IP address(es) of the ethX interface will be used
in the routing process
Enable/disable the interface
Enable/disable DHCP - obtain an IP address automatically
DHCP option is disabled by default
Set the interface description (up to 72 characters)
Set the interface mode (e.g. 1000BaseTX-fullduplex)
The default value is “Auto” (recommended)
rfX
Configure the IP address(es) and the mask of the interface
Enable/disable the interface
Enable/disable DHCP - obtain an IP address automatically
DHCP option is disabled by default
Set the interface description (up to 72 characters)
sviX
SVI interface is a logical L3 interface of the switch (solely
used for the management of the unit)
Configure the IP address(es) and the mask of the interface
(as the management IP address(es) of the unit)
Enable/disable the interface
Figure 37 - Network Settings default interfaces

Chapter 2 - Features set
User Manual
R5000 series - Web GUI
40
Enable/disable DHCP - obtain an IP address automatically
(as the management IP address(es) of the unit)
DHCP option is disabled by default
Set the interface description (up to 72 characters)
Remove the interface
Set the Switch group number which this interface is
assigned to (bind the SVI interface to a switch group)
prfX
PRF interface makes the Ethernet interface that it is
assigned to, to appear as a regular RF interface in terms
of the MINT network (for more information please refer to
the WANFleX OS User Manual)
Configure the IP address(es) and the mask of the interface
Enable/disable the interface
Enable/disable DHCP - obtain an IP address automatically
Set the interface description (up to 72 characters)
Remove the interface
Set the parent interface to be transmitted the encapsulated
packets (assign the PRF interface to the physical Ethernet
interface)
Set the channel number (from 0 to 3) on which the frames
are sent and received by the parent interface
Both PRF interfaces (of the two units in the link) must have
the same channel assigned in order to establish the
wireless link
vlanX
Configure the IP address(es) and the mask of the interface
in case you use this interface for the management of
the unit, only
Enable/disable the interface
Enable/disable DHCP - obtain an IP address automatically
Set the interface description (up to 72 characters)
Remove the interface
Set the parent interface to be transmitted the encapsulated
packets
Configure the VLAN tag (or VLAN ID) for the current
interface (from 1 to 4094)
Enable/disable Q in Q
lagX
Link aggregation interface is a logical interface used to
combine multiple physical channels into one logical

Chapter 2 - Features set
User Manual
R5000 series - Web GUI
41
channel in order to increase link capacity and redundancy
(for the units with two physical Ethernet ports)
Configure the IP address(es) and the mask of the interface
Enable/disable the interface
Enable/disable DHCP - obtain an IP address automatically
Set the interface description (up to 72 characters)
Remove the interface
Set the parent interface to be aggregated the encapsulated
packets
Enable/disable Fast Mode
tunX
Configure the IP address(es) and the mask of the interface
Enable/disable the interface
Enable/disable DHCP - obtain an IP address automatically
Set the interface description (up to 72 characters)
Remove the interface
Set the tunneling mode: IPIP or GRE
tapX
Configure the IP address(es) and the mask of the interface
Enable/disable the interface
Enable/disable DHCP - obtain an IP address automatically
Set the interface description (up to 72 characters)
Remove the interface
Table 8 - Network Settings
Press the «Create Pseudo-RF», «Create VLAN», «Create LAG» and «Create SVI»
buttons in order to create the corresponding interfaces in the unit configuration.
In the Network Settings section, Routing Parameters zone, you can configure the
static routes:

Chapter 2 - Features set
User Manual
R5000 series - Web GUI
42
NOTE
Read the information at the end of the Basic Settings page in order to find out the output
of the «Apply», «Test» and «Preview» buttons for the new configuration performed.
Figure 38 - Static routing configuration
- In the “Network” field, you can configure the destination network IP address
- In the “Gateway” field, you can configure the IP address of the router through
which the network address is reachable.
As all wireless MINT interfaces are in one virtual Ethernet segment, they can be
enumerated by assigning IP addresses from one IP subnet (manually or
automatically, via DHCP). Thus, getting to one node (via telnet, for example), you
can access all the other nodes. The access from the “outside” network can be
established by configuring the necessary routing, so that the “inner” MINT network
can be accessible from the administrator’s computer through the Ethernet port of the
MINT node which is connected to the “outside” network. From the “inner” MINT
network, the route to the administrator’s computer should go through the radiointerface to the border router.
2.4.3. Link Settings
In the Link Settings section, two node types can be configured:
Master: can establish connections with all other types of nodes. It is able to
form a network of any topology with other master nodes.
A master node is usually used in the configuration of the both sides of the PtP
links and in the configuration of the BS for the PtMP links.
For master node only, the marker access (polling) can be enabled. Only one
master node from a network segment can have this option enabled by means
of which it is forming a star-topology segment (point-to-multipoint). With this, all
other nodes break their connections with their respective neighbors (with
exception of connections formed by join). This node type is usually used for
static networks with no (or very small) nomadic or mobile clients.

Chapter 2 - Features set
User Manual
R5000 series - Web GUI
43
Slave: can only connect to the master type nodes (the connection cannot be
established between two slave nodes).
Polling mode is a method of accessing a common radio channel under the master
station control, which consists in centralized distribution of transmission
authorization markers by a master station to the slave stations. This mode greatly
improves operational stability and throughput of master stations under conditions of
heavy load and signal level misbalance between different slave units. It is particularly
useful when slave units are located at long distances from a base station and not in
the clear line of sight, so that they cannot avoid mutual collisions in the radio channel
by listening each other's transmission. The polling regime makes it possible to
establish reliable communication between subscribers when the ordinary
CSMA/CA wireless access method does not work at all. Despite a slight
decrease in the maximum transmission speed, the polling mode substantially
increases the total throughput of a base station and provides for its fair distribution
between client units. The polling algorithm is so designed as to minimize the protocol
overhead while maintaining high efficiency and robustness. The polling mode is
enabled on the master station only. Configuration of client units needs not to be
modified.
The Link Settings section is divided in two zones:
- The panel that describes global link settings, on the left side of the page
- The panel that describes the radio channel settings which are currently in use,
on the right side of the page
Figure 39 - Link Settings - Master node default configuration

Chapter 2 - Features set
User Manual
R5000 series - Web GUI
44
Radio
parameter
Description
Type
Set the node type to Master or Slave
Master node can establish connections with any node type
Slave node can only connect to the Master node type
Figure 40 - Link Settings - SLAVE node default configuration
The radio parameters are defined in profiles. Each profile consists of a fixed set of
radio interface parameters. The heuristic search algorithm can quickly evaluate the
general air media parameters and choose the profile which defines the most suitable
network.
Example given:
It is suitable to configure radio profiles on the slave units (with complete radio
parameters of each BS) in a PtMP deployment when the CPEs can be linked to more
than one BS either in fixed, nomadic or mobile situations, for the redundancy
purpose (different profile for each BS)
When the CPE tries to establish a wireless connection, it chooses the BS with better
radio parameters (e.g. better SNR, less retries, etc.). If the connected BS is down,
the CPE retries to connect to it and after a number of unsuccessful attempts, it
searches to connect to a new BS if the SNR allows it and if one of its radio profiles
matches with another BS radio parameters (in case of Multi BS option disabled)

Chapter 2 - Features set
User Manual
R5000 series - Web GUI
45
Polling
Turn On or Off polling mechanism (marker access mode
for improving stability and jitter)
It is strongly recommended to keep Polling on at all times
to maximize the link performance
Can be enabled on master node only
MultiBS
Enabled: the CPE will immediately initiate the search for a
new BS
Disabled: the CPE will have more attempts to re-establish
wireless connection to the lost BS
Polling is required for PtMP systems and long haul PtP
links
It is available for Slave node only
Radar
Detection
Enable/disable Radar Detection features (a special license
with the country code is necessary)
The DFS system performs radar detection and if a radar
signal is detected, that frequency is marked as occupied
and it can be used again only after a hold-down interval
(the link is switched automatically to another frequency)
Frequency
Range List
Set the frequencies that are allowed to be chosen by the
DFS mechanism (available only when the DFS system is
enabled)
It is available to support the legacy products
Note that this option is different from the Custom
Frequency Grid tool which allows narrowing down the
frequency range available in the Frequency option from the
Radio profile.
DFS
Enable/disable DFS (for master node only)
If “DFS only” is set, the DFS system monitors interferences
but does not perform radar detection
For the two radios base stations, the “Instant DFS” option
is available (one of the two radios is used for DFS
scanning, Radar detection and Spectrum analyzing)
The Frequency Range List must be configured
Tx Power
Set the output power of the radio interface (from -10 to 23
dBm)
Acts as a top limit for the output power control if the ATPC
mechanism is turned on
Two operating ranges of Tx power are available:

Chapter 2 - Features set
User Manual
R5000 series - Web GUI
46
- “-10...10” (if chosen top limit is 10dBm or less)
- “0...23” (if chosen top limit is from 10.5dBm to 23dBm)
By default, it is turned on (it is strongly recommended to
remains “on”)
The offset parameter is used to adjust the thresholds (the
range is from -32767 to 32767)
Node Name
Set the name for this node in the network
By default, it is the Unknown node
This node name will appear on the neighbor lists
Channel Width
Set the bandwidth of the radio interface: 5, 10, 20, 40 MHz
It must be the same at both ends of the link
Frequency
Set the radio interface frequency (in MHz)
It must be the same at both ends of the link
If it is set to “Auto”, the Slave node is scanning on all
frequencies for the Master nodes
Tx Bitrate
Set the maximum operating bitrate of the radio interface
(from 13000 to 130000 Kbps)
Acts as a top limit for the bitrate if the autobitrate
mechanism is turned on
By default, it is turned on (it is strongly recommended to
remains “on”)
Adjust the Autobitrate system thresholds when the remote
SNR doesn’t have the normal level
Channel Type
Set Dual (MIMO - recommended) or Single (MISO)
channel type
MIMO uses multiple antennas at both the transmitter and
receiver side to improve communication performance and
data is sent on both the horizontal and vertical
polarizations (data is space-time coded - spatial
multiplexing, to improve the reliability of data transmission
InfiNet MIMO 2x2 technology effectively doubles the
spectrum efficiency and allows to achieve a real
throughput up to 280 Mbps in 40 MHz band
MISO is a special mode of operation of MIMO devices,
used in NLOS conditions or in a noisy RF environment (in
MISO mode, the same data is transmitted over both
polarizations, lowering the performance of the link, but
enhancing the ability to transmit data in case of
interference or obstacles in transmission path)

Chapter 2 - Features set
User Manual
R5000 series - Web GUI
47
Enable/disable the Greenfield mode
When activated, the Greenfield mode increases the link
performance by 10-15%, by reducing the packet overhead
(optimizes the frames transmitted via the RF link)
It must be the same at both ends of the link
Network SID
Set the network system identifier (up to 8-digit HEX figure)
It must be the same at both ends of the link
Node ID
Set the device identification number
The parameter is optional
Node ID can be configured by the administrator for a better
representation of a neighbors table (nodes within a
wireless network)
Security Key
Set the secret key word for encoding of the protocol
messages
It must be up to 64 characters long, without spaces
It must be the same at both ends of the link
CAUTION
Please note that, in some countries, switching “DFS off” and/or failing to detect public
service radar signals are against the regulations and may result in legal action.
Table 9 - Link Settings
Beside the main radio parameters above, the following options are available in the
General Settings:
- Enable link - enable/disable the wireless link for the radio interface (by default,
it is turned on)
- Scrambling - enable/disable Scrambling of data which improves link stability (by
default, it is turned on)
- Trap gateway - enable/disable SNMP Trap relay
- Authentication Mode - “static” (the unit can establish the link only with the unit
that has the MAC address set in the “Static Link” table) or “public” (the unit can
establish the link with any other unit that has the same security key and radio
settings)
- Log Level - set the log type (off/normal/detailed)
On each radio profile, the following options are available (for the slave unit only):
- Disable a radio profile

Chapter 2 - Features set
User Manual
R5000 series - Web GUI
48
- Add a new radio profile by pressing the «Add Profile» button
- Copy the radio profile values to a new radio profile by pressing the «Copy»
button
- Remove the radio profile by pressing the «Remove» button
When “Single” mode is set, Tx or Rx of Chain #1 can be deactivated:
Figure 41 - Chain #
The licensed frequencies range per each bandwidth is displayed in the Link Settings
section. You can limit the licensed frequencies range per each bandwidth in “Custom
Frequency Grid” column. The range of frequencies set in “Custom Frequency Grid”
will be available in the “Frequency” dropdown list from the radio profiles and in DFS
page in “Frequency grid” field.
Figure 42 - Custom frequency grid

Chapter 2 - Features set
User Manual
R5000 series - Web GUI
49
NOTE
Read the information at the end of the Basic Settings page in order to find out the output
of the «Apply», «Test» and «Preview» buttons for the new configuration performed.
NOTE
Read the information at the end of the Basic Settings page in order to find out the output
of the «Apply», «Test» and «Preview» buttons for the new configuration performed.
2.4.4. Static Links
In the Static Links section, you can set up fixed links to the unit. Although the radio
parameters and security key match with other nodes, the node that has Static Links
set up is only linked with the nodes which are configured in this section. The
parameters are:
MAC - MAC address of the neighbor unit
Key - link security key (up to 64 characters long, without spaces)
Another two options are available:
Disable the link by marking the option “Disabled" in the corresponding checkbox
Add a link description in the “Note" field
By pressing the «Add» button, you create a new fixed link to the unit.
By pressing the «Remove» button, you can delete an already created fixed link.
2.4.5. MAC Switch
2.4.5.1. Switch configuration
The Switch configuration is based on a set of rules for the switching groups:
An unique numeric identifier (1-4095) for each group
Two or more local network interfaces (ethX, rfX, tunX, etc) and a set of rules
(filters) which allow placing different types of traffic into different switching
groups
Each node can have several switching groups. The same interfaces or group of
interfaces can be used in several groups simultaneously
Switching groups are activated on different nodes of the MINT network. The
nodes that have the same switching group identifier in their configurations
represent a "switching zone"
"Switching zone" exists only within the MINT network segment

Chapter 2 - Features set
User Manual
R5000 series - Web GUI
50
Group 2
Group 1
1
2
3
4
5
6
2.4.5.2. Switching groups
The MINT network can be viewed as one virtual distributed layer-3 switch, where
border nodes act as external ports of the virtual switch. The virtual switch task is to
transport frames from one external port to another. It is important to understand that
switching groups should be created only on the nodes where frames enter from or
leave to the "outside" network ("outside" relative to MINT). On the repeater nodes
(in mesh topology) there is no need to create switching groups.
In order to put an incoming frame into one of the switching groups, a set of flexible
rules is used, which allow sorting frames according to various criteria, like:
VLAN tag
Protocol type
Addresses (MAC/IP)
Ports
Any PCAP expressions
2.4.5.3. Trunk groups
Trunk group is a switching group in the Trunk mode.
Input flow from wired segment for Trunk group is divided into separate sub-groups
(switching groups within Trunk group) depending on VLAN-tag of the packet. The
group number of the switching group within Trunk group will be equal to the VLANnumber of packets which are switched to it.
Figure 43 - Switching Groups

Chapter 2 - Features set
User Manual
R5000 series - Web GUI
51
Group
x
Group
2
Group
1
VLAN
1
VLAN
2
VLAN
X
Trunk N
VLAN
1
Group
1
VLAN
2
Group
2
VLAN
X
Group
X
In-Trunk N
In-Trunk N
In-Trunk N
BS CPEs
The trunk groups are used for the ease of configuration, when VLAN flows are
transmitted to several subscribers.
If you enable the trunk group at the BS side to transmit several VLAN-flows to several
directions, then at the CPE side, you should use the In-Trunk option to specify the
group number of the trunk group that includes the required switching group.
Figure 44 - Trunk Groups
Trunk groups may also be used to solve the task of connecting several VLAN
segments.
Special rules on interfaces allow flexible manipulations with VLAN ID tags: deleting,
assigning and re-assigning (please consult the information provided in WANFleX OS
User Manual).
2.4.5.4. Management connection to the unit
For the management purposes, you can create a dedicated Switch Group for all
units in the MINT network, attached to the Switch Virtual Interface (SVI). Assign the
IP addresses directly on the SVI interface for native management or create an
additional VLAN interface attached to that SVI for Management VLAN. All packets
sent via SVI interface will be distributed only within the assigned switch group.

Chapter 2 - Features set
User Manual
R5000 series - Web GUI
52
vlanX
vlanY
svi 1
IP (tagged) IP (tagged)
IP (untagged)
Group 1
eth0
IP
rf5.0
IP
NOTE
Make sure that the group can and will accept traffic in vlanX and vlanY.
The universal way to configure Management VLAN via common switch group is
presented in the figure below (which illustrates the step by step sequence and not
the way of packet passing).
You have to assign the IP addresses to vlanX and vlanY which have the parent
interface svi1 (the management interface of Group 1), which includes eth0 and rf5.0
interfaces (see section 3.3. - Creating a Management VLAN interface):
An alternative way to configure Management VLAN via dedicated switch group is
presented in the figure below (which illustrates the step by step sequence and not
the way of packet passing).
You have to assign the Management IP addresses to sviM interface which is the
management interface of Group M and includes vlanX (with parent interface eth0)
and rf5.0 interface:
Figure 45 - Management configuration 1

Chapter 2 - Features set
User Manual
R5000 series - Web GUI
53
eth0
sviM Management IP
Group M
vlanX
rf5.0
NOTE
Using a dedicated management group is the preferred configuration method as the VLAN
interface is created only on one network device and the group does not require any
additional rules.
NOTE
Frames originated by MINT network nodes (e.g. containing RIP/OSPF, ping packets, etc)
do not belong to any of the switching groups. Therefore, they cannot leave MINT network
via switching through any of the external ports.
Figure 46 - Management configuration 2
2.4.5.5. Switch Group rules
Once assigned to one of the switching groups, a frame will never leave it until it
reaches one of the external ports. Switching group rules are applied only when the
frame enters to MINT network through one of its external ports. When leaving the
network, no rules are required as the frame already belongs to one of the switching
groups and it will be automatically forwarded to an external port(s) that belongs to
the corresponding switching group.
Rules are used for the following purposes:
Selecting an appropriate switching group when a packet is received through
ethX interface. The packet will be switched by the group the rules of which it
fully satisfies.

Chapter 2 - Features set
User Manual
R5000 series - Web GUI
54
CAUTION
A packet that cannot be associated with any switching group will not switched by the
device. If there is no group with appropriate rules for the packet, it will be discarded.
Single IP subnet:
net 192.168.1.0/24
Several IP subnets:
net 192.168.1.0/24 or net 192.168.100.0/24
Several IP subnets with exceptions:
net 192.168.1.0/16 and not net (192.168.100.0/24 or
192.168.200.0/24)
Several IP subnets inside VLAN:
vlan 50 and (net 192.168.1.0/24 or net 192.168.100.0/24)
PPPoE traffic:
pppoed or pppoes
which is synonym to:
ether proto 0x8863 or ether proto 0x8864
Disable IP multicast and broadcast:
not ip multicast
When the packet is assigned to a switching group, the group decides whether
the packet to be sent through one of the interfaces, or to discard it. The packet
will only be sent if it satisfies the rules of this interface.
The rules consist of a "rules list" and a decision (deny/permit). While parsing the list,
the switch checks whether a packet matches the rule. If it matches the rule, the
decision set for this rule is applied to the packet. Otherwise, the list of rules is viewed
further. Rules are taken one at a time. If a packet does not match to any rule, the
default decision for this group or interface is taken.
The expression selects which packets will fit into the group. Only the packets for
which the expression is “true” will be matched to the group. The expression consists
of one or more primitives. Primitives usually consist of an id (name or number)
preceded by one or more qualifiers.
Examples packet filter rules:

Chapter 2 - Features set
User Manual
R5000 series - Web GUI
55
Qualifier
Description
type
Qualifiers say to what the id name or number refers to
Possible types are: host, net, port, portrange
E.g.: “host foo”, “net 128.3”, “port 20”, “portrange 6000-6008”
If there is no type qualifier, host is assumed
dir
Qualifiers specify a particular transfer direction to and/or from
id
Possible directions are: src, dst, src or dst and src and dst
E.g.: “src 1.1.1.1”, “dst net 128.3”, “src or dst port 21”. If there
is no dir qualifier, src or dst is assumed
proto
Qualifiers restrict the match to a particular protocol
Possible protos are: ether, ip, ip6, arp, rarp, tcp and udp
E.g.: “ether src 00:12:13:14:15:16”, “arp net 128.3”, “tcp port
21”, “udp portrange 7000-7009”
If there is no proto qualifier, all protocols consistent with the
type are assumed
E.g., “src 1.1.1.1” means “(ip or arp or rarp) src foo” (except the
latter is not legal syntax), “net 1.2.3.0/24” means “(ip or arp or
rarp) net 1.2.3.0/24” and “port 53” means “(tcp or udp) port 53”
2.4.5.6. Detailed filter expression syntax description
The filter expression determines which packets will be selected by the filter for further
processing. If no expression is given, all the packets on the net will be selected.
Otherwise, only the packets for which expression is “true” will be selected.
There are three different kinds of qualifier:
Table 10 - Qualifiers
In addition to the above, there are some special “primitive” keywords that don’t follow
the pattern: broadcast, less, greater and arithmetic expressions. All of these are
described below (see the Table 11).
More complex filter expressions are built up by using the words “and”, “or” and “not”
to combine primitives. E.g.: “host foo and not port ftp and not port ftp-data”. To save
typing time, identical qualifier lists can be omitted. E.g., “tcp dst port ftp or ftp-data
or domain” is exactly the same as “tcp dst port ftp or tcp dst port ftp-data or tcp dst
port domain”.
Allowable primitives are:

Chapter 2 - Features set
User Manual
R5000 series - Web GUI
56
Primitives
Description
dst host host
True if the IPv4 destination field of the packet is host, which
may be either an address or a name
src host host
True if the IPv4 source field of the packet is host
host host
True if either the IPv4 source or destination of the packet
is host
Any of the above host expressions can be prefixed with the
keywords, ip, ip6, arp, rarp as in: “ip host host”
This is equivalent to: “ether proto \ip and host host”
ether dst
ehost
True if the Ethernet destination address is ehost
Ehost must have a numeric format: XX:XX:XX:XX:XX:XX
ether src
ehost
True if the Ethernet source address is ehost
ether host
ehost
True if either the Ethernet source or destination address is
ehost
dst net net
True if the IPv4 destination address of the packet has a
network number of net
src net net
True if the IPv4 source address of the packet has a
network number of net
net net
True if either the IPv4 source or destination address of the
packet has a network number of net
net net mask
netmask
True if the IPv4 address matches net with the specific
netmask. May be qualified with src or dst
net net/len
True if the IPv4 address matches net with a netmask len
bits wide
May be qualified with src or dst
dst port port
True if the packet is ip/tcp, ip/udp and has a destination
port value of port
src port port
True if the packet has a source port value of port
port port
True if either the source or destination port of the packet is
port

Chapter 2 - Features set
User Manual
R5000 series - Web GUI
57
dst portrange
port1-port2
True if the packet is ip/tcp, ip/udp and has a destination
port value between port1 and port2
port1 and port2 are interpreted in the same fashion as the
port parameter for port
src portrange
port1-port2
True if the packet has a source port value between port1
and port2
portrange
port1-port2
True if either the source or destination port of the packet is
between port1 and port2
Any of the above port or port range expressions can be
prefixed with the keywords, tcp or udp, as in: “tcp src port
port”
This matches only tcp packets whose source port is port
less length
True if the packet has a length less than or equal to length
This is equivalent to: “len <= length”
greater length
True if the packet has a length greater than or equal to
length
This is equivalent to: “len >= length”
ip proto
protocol
True if the packet is an IPv4 packet of protocol type
protocol
Protocol can be a number or one of the names icmp,
icmp6, igmp, igrp, pim, ah, esp, vrrp, udp, or tcp
The identifiers tcp, udp, and icmp are also keywords and
must be escaped via backslash (\), which is \\ in the C-shell
This primitive does not chase the protocol header chain
ip protochain
protocol
True if the packet is IPv4 packet, and contains protocol
header with type protocol in its protocol header chain
For example, “ip protochain 6” matches any IPv4 packet
with TCP protocol header in the protocol header chain
The packet may contain, for example, authentication
header, routing header, or hop-by-hop option header,
between IPv4 header and TCP header
The code emitted by this primitive is complex and cannot
be optimized, so this can be somewhat slow
ether
broadcast
True if the packet is an Ethernet broadcast packet
The ether keyword is optional

Chapter 2 - Features set
User Manual
R5000 series - Web GUI
58
ether
multicast
True if the packet is an Ethernet multicast (or broadcast)
packet
The ether keyword is optional
This is shorthand for “ether[0] & 1 != 0”
ip multicast
True if the packet is an IPv4 multicast (or broadcast)
packet
ether proto
protocol
True if the packet is of ether type protocol
Protocol can be a number or one of the names ip, ip6 ,arp,
rarp, atalk, aarp, sca, lat, mopdl, moprc, iso, stp, ipx,
or netbeui
These identifiers are also keywords and must be escaped
via backslash (\)
In the case of Ethernet, WANFleX checks the Ethernet
type field for most of those protocols
The exceptions are:
- iso, stp, and netbeui
WANFleX checks for an 802.3 frame and then checks
the LLC header as it does for FDDI, Token Ring, and
802.11
- atalk
WANFleX checks both for the AppleTalk etype in an
Ethernet frame and for a SNAP-format packet as it
does for FDDI, Token Ring, and 802.11
- aarp
WANFleX checks for the AppleTalk ARP etype in
either an Ethernet frame or an 802.2 SNAP frame with
an OUI of 0x000000
- ipx
WANFleX checks for the IPX etype in an Ethernet
frame, the IPX DSAP in the LLC header, the 802.3with-no-LLC-header encapsulation of IPX, and the
IPX etype in a SNAP frame
ip, arp, rarp,
atalk, aarp,
iso, stp, ipx,
netbeui
Abbreviations for “ether proto p”, where “p” is one of the
above protocols
svlan [vlan_id]
True if the packet is an IEEE 802.1Q Service VLAN packet
(ether proto 0x88a8)

Chapter 2 - Features set
User Manual
R5000 series - Web GUI
59
vlan [vlan_id]
True if the packet is an IEEE 802.1Q VLAN packet (ether
proto 0x8100)
If [vlan_id] is specified, only true if the packet has the
specified vlan_id
The first vlan or svlan keyword encountered in expression
changes the decoding offsets for the remainder of
expression on the assumption that the packet is a VLAN
packet
The vlan [vlan_id] expression may be used more than
once, to filter on VLAN hierarchies
Each use of that expression increments the filter offsets by
4
For example: “svlan 100 && vlan 200” filters on VLAN 200
encapsulated within Service VLAN 100, and “vlan 300 &&
ip” filters IPv4 protocols encapsulated in VLAN 300, and
“svlan 100” filters all packets encapsulated within Service
VLAN 100
mpls
[label_num]
True if the packet is an MPLS packet
If [label_num] is specified, only true is the packet that has
the specified label_num
The first mpls keyword encountered in expression
changes the decoding offsets for the remainder of
expression on the assumption that the packet is a MPLSencapsulated IP packet
The mpls [label_num] expression may be used more than
once, to filter on MPLS hierarchies
Each use of that expression increments the filter offsets by
4
For example: “mpls 100000 && mpls 1024 “ filters packets
with an outer label of 100000 and an inner label of 1024,
and “mpls && mpls 1024 && host 192.9.200.1” filters
packets to or from 192.9.200.1 with an inner label of 1024
and any outer label
pppoed
True if the packet is a PPP-over-Ethernet Discovery packet
(Ethernet type 0x8863)
pppoes
True if the packet is a PPP-over-Ethernet Session packet
(Ethernet type 0x8864)
The first pppoes keyword encountered in expression
changes the decoding offsets for the remainder of
expression on the assumption that the packet is a PPPoE
session packet

Chapter 2 - Features set
User Manual
R5000 series - Web GUI
60
For example: “pppoes && ppp proto 0x21” filters IPv4
protocols encapsulated in PPPoE
tcp, udp, icmp
Abbreviations for: “ip proto p”, where “p” is one of the
above protocols
iso proto
protocol
True if the packet is an OSI packet of protocol type protocol
Protocol can be a number or one of the names clnp, esis,
or isis
clnp, esis, isis
Abbreviations for: “iso proto p”, where “p” is one of the
above protocols
expr relop expr
True if the relation holds, where relop is one of >, <, >=,
<=, =, !=, and expr is an arithmetic expression composed
of integer constants (expressed in standard C syntax), the
normal binary operators [+, -, *, /, &, |, <<, >>], a length
operator, and special packet data accessors
Note that all comparisons are unsigned, so that, for
example, 0x80000000 and 0xffffffff are > 0
To access data inside the packet, use the following syntax:
“proto [ expr : size ]”
Proto is one of ether, fddi, tr, wlan, ppp, slip, link, ip,
arp, rarp, tcp, udp, icmp, and indicates the protocol layer
for the index operation (ether, fddi, wlan, tr, ppp, slip and
link all refer to the link layer)
tcp, udp and other upper-layer protocol types only apply to
IPv4
The byte offset, relative to the indicated protocol layer, is
given by expr
Size is optional and indicates the number of bytes in the
field of interest; it can be one, two, or four, and defaults to
one
The length operator, indicated by the keyword len, gives
the length of the packet
For example, “ether[0] & 1 != 0” catches all multicast traffic
The expression “ip[0] & 0xf != 5” catches all IPv4 packets
with options
The expression “ip[6:2] & 0x1fff = 0” catches only
unfragmented IPv4 datagrams and frag zero of fragmented
IPv4 datagrams
This check is implicitly applied to the tcp and udp index
operations

Chapter 2 - Features set
User Manual
R5000 series - Web GUI
61
For instance, tcp[0] always means the first byte of the TCP
header, and never means the first byte of an intervening
fragment
Some offsets and field values may be expressed as names
rather than as numeric values
The following protocol header field offsets are available:
icmptype (ICMP type field), icmpcode (ICMP code field),
and tcpflags (TCP flags field)
The following ICMP type field values are available: icmp-
echoreply, icmp-unreach, icmp-sourcequench, icmp-
redirect, icmp-echo, icmp-routeradvert, icmp-
routersolicit, icmp-timxceed, icmp-paramprob, icmp-
tstamp, icmp-tstampreply, icmp-ireq, icmp-ireqreply,
icmp-maskreq, icmp-maskreply
The following TCP flags field values are available: tcp-fin,
tcp-syn, tcp-rst, tcp-push, tcp-ack, tcp-urg
Table 11 - Primitives
Primitives may be combined using:
- A parenthesized group of primitives and operators (parentheses are special to
the Shell and must be escaped)
- Negation (`!' or `not')
- Concatenation (`&&' or `and')
- Alternation (`||' or `or')
Negation has highest precedence. Alternation and concatenation have equal
precedence and associate left to right. Note that explicit and tokens, not
juxtaposition, are now required for concatenation. If an identifier is given without a
keyword, the most recent keyword is assumed. For example, “not host 1.1.1.1 and
2.2.2.2” is short for “not host 1.1.1.1 and host 2.2.2.2” and should not be confused
with “not (host 1.1.1.1 or 2.2.2.2)”.
2.4.5.7. MAC Switch Group parameters
In the MAC Switch Group parameters section, you can view the Switch Groups and
Rules that are already created, including the management switch group; you can
change the parameters for these Switch Groups, delete them by pressing the
«Remove Group» button or create new ones by pressing the «Create Switch Group»
button. The same operations are available for the switching rules: add a new rule
within a switch group by pressing the «Add Rule» button (located within sub-menu
"Rules" of this group) or delete an existing rule by pressing the «Remove Rule»
button.

Chapter 2 - Features set
User Manual
R5000 series - Web GUI
62
CAUTION
Disabling the switch in the absence of routing settings can lead to termination of packet
transmitting through the device.
Switch
parameter
Description
Group #
Displays the Switch Group number
Assign the switch group identifier (must be unique within
the MINT network segment)
Status
Select the Switch Group status: started, stopped or discard
Interfaces
Add Ethernet or/and Radio as Switch Group interface(s)
via the «Ports» button
Select: pass (selected by default), strip or tag for VLAN tag
modification for each added interface
Figure 47 - MAC Switch default configuration
General options in this section:
- Enable Switch - this checkbox enables/disables global switch operation
- «Remove Management» - by pressing this button you can delete the sviX
interface, which is available in the default configuration, for the unit
management
- «Create Management» - by pressing this button you can add a vlanX and an
sviX interface for the unit management via Web interface (please consult the
configuration examples presented in chapter 3)
Switch Group configuration section:

Chapter 2 - Features set
User Manual
R5000 series - Web GUI
63
The Interfaces section provides the means to control the
VLAN tag processing mode, as each local interface
supports three different scenarios:
Pass - transparent mode, traffic remains unchanged.
Strip - all tags are stripped.
Tag - all packets are tagged with the specified VLAN tag
Another option in this field is to remove one or both added
interfaces
STP
Add an STP VLAN number in case that spanning tree
support is enabled
Repeater
Enable/disable repeater support
The unit acts as a simple switch, relaying packets to all
ports, except the source port
IGMP
Enable/disable IGMP snooping support
Please refer to the information provided in the next section
for details
Flood
Allow/deny unlimited unicast flood without protection filter
Inband
Allow/deny access to the device through in-band
broadcast/multicast management traffic
It is enabled by default
Mode
Set the working mode of the switching group: normal,
trunk, in-trunk (give it the trunk group number created on
the BS), upstream, downstream
Normal (standard mode) - the switch group operation is
based on the configured Rules, packets are processed
without modification (this is the default option)
Trunk - the inbound traffic is untagged and placed into
switch groups in accordance with its VLAN tag
In-Trunk - allows filtering out the traffic that belongs to a
certain switch group that is a member of a trunk Switch
Group
Upstream - used mainly in video surveillance systems for
upstream multicast flows
Downstream - used in video surveillance systems for
downstream traffic
Description
Type a description sentence for the current switch group

Chapter 2 - Features set
User Manual
R5000 series - Web GUI
64
Default Action
Set the default action: permit/deny
In the absence of any Switching rule, or if a packet does
not match to any Switching rule, the default action for this
group or interface is taken
Default QM
Channel
Allocate a default logical channel
The default logical channel must be prior created in the
Traffic Shaping section
In the absence of any Switching rule, or if a packet does
not match to any Switching rule, the default logical channel
is allocated
For the indications on how to create a logical channel,
please refer to the Traffic Shaping section below
Default Priority
Allocate the default priority for all the packets going
through the Switch group:
- “Up to” - used to increase the packet priority to the
specified value only if the processed packet has a
lower priority
- “Set” - used to assign a new priority regardless of the
value already assigned to the packet
In the absence of any Switching rule, or if a packet does
not match to any Switching rule, the default priority is
allocated
Switch Rules
parameter
Description
Action
Set the action for the packets that match this rule:
permit/deny
QM Channel
Allocate a logical channel if there are logical channels prior
created in the Traffic Shaping section
If you allocate a number for a logical channel that was not
prior created in the Traffic Shaping section, it has no effect
in the rule configuration
Table 12 - MAC Switch
You can change the list order of the switch group using the up/down arrows.
A set of rules are applied to all packets within a switch group. You can create several
switch rules within a switch group. The following parameters are available for switch
rules:

Chapter 2 - Features set
User Manual
R5000 series - Web GUI
65
For the indications how to create a logical channel, please
refer to the Traffic Shaping section below
Priority
Allocate the priority for all the packets going through the
new rule of the filter:
- “Up to” is used to increase the packet priority to the
specified value only if the processed packet has a
lower priority
- “Set” is used to assign a new priority regardless of the
value already assigned to the packet
Packet capture
filter
Set the packet capture filter for Switching
The syntax is called “PCAP expression”
Please refer to filter expression syntax description above
Validate rule by pressing the «Validate» button
VLAN list
Set the VLAN ID
It is available for the legacy configuration
It can be set also in “PCAP expression” option (e.g. VLAN
100 when “PCAP expression” is chosen)
Validate rule by pressing the «Validate» button
NOTE
In all three types of filters: Switching, IP Firewall and Traffic Shaping, there is the same
syntax called “PCAP expression” for setting a rule. It is a universal tool for creating filters.
Table 13 - Switch Groups Rules
2.4.5.8. IGMP Snooping
In this section you can set the IGMP-parameters for the groups for which support of
IGMP snooping is enabled (the IGMP check box is marked for these groups in the
MAC Switch section).
IGMP Snooping is a multicast constraining mechanism that runs on Layer 2 devices
to manage and control multicast groups. By listening to and analyzing IGMP
messages, the device running IGMP Snooping establishes mappings between ports
and multicast MAC addresses and forwards multicast data based on these
mappings.
In order for IGMP snooping to function, a multicast router must exist on the network
and generate IGMP queries. The tables created for snooping (holding the member
ports for each a multicast group) are associated with the multicast router. Without a
multicast router, the tables are not created and snooping will not work. Furthermore,

Chapter 2 - Features set
User Manual
R5000 series - Web GUI
66
IGMP
Snooping
parameter
Description
Router Port
Forwarding
Enable/disable forwarding to router ports
Flood IGMP
Reports
Enable/disable flood IGMP reports to all bridging ports, not
only to router ports
Permit Zero IP
Querier
Allow/deny query requests with source address 0.0.0.0
Replace
Source IP
Replace source IP in all IGMP reports/query packets
Last Member
Query Timeout
(LMQT)
Set the timeout (in seconds)
Group
Membership
Interval (GMI)
Set the interval (in seconds)
Multicast
Group Limit
Set the limit number for the multicast group
Enable Querier
Start/stop the IGMP querier
VLAN
Set the IGMP querier VLAN ID in case of a VLAN
broadcast domain
Disable
Election
Enable/disable the IGMP querier election process
Source IP
Set the IP address of the IGMP querier
By default, this is 0.0.0.0
Interval
Set the IGMP querier send interval (in seconds)
NOTE
Read the information at the end of the Basic Settings page in order to find out the output
of the «Apply», «Test» and «Preview» buttons for the new configuration performed.
IGMP general queries must be unconditionally forwarded by all switches involved in
IGMP snooping.
IGMP Snooping parameters can be set within MAC Switch section:
Table 14 - IGMP Snooping

Chapter 2 - Features set
User Manual
R5000 series - Web GUI
67
Incoming filters Outgoing filters
3
2
1
Incoming
packets
Packets addressed
to node 3
Packets starting
from node 1
Packets addressed
to node 2
2.4.6. IP Firewall
IP Firewall is a mechanism of filtering packets crossing an IP network node,
according to different criteria. System administrator may define a set of incoming
filters and a set of outgoing filters. The incoming filters determine which packets may
be accepted by the node. The outgoing filters determine which packets may be
forwarded by the node as a result of routing. Each filter describes a class of packets
and defines how these packets should be processed (reject and log, accept, accept
and log).
Packets can be filtered based on the following criteria:
Protocol (IP, TCP, UDP, ICMP, ARP)
Source address and/or destination address (and port numbers for TCP and
UDP)
The inbound network interface
Whether the packet is a TCP/IP connection request (a packet attempting to
initiate a TCP/IP session) or not
Whether the packet is a head, tail or intermediate IP fragment
Whether the packet has certain IP options defined or not
The MAC address of the destination station or of the source station
The figure below illustrates how packets are processed by the filtering mechanism
of the router:
Figure 48 - IP Firewall
There are two classes (sets) of filters - prohibiting (reject) and permitting (accept).

Chapter 2 - Features set
User Manual
R5000 series - Web GUI
68
NOTE
The rejected packet will be discarded without notification to the sender.
IP firewall rule
parameter
Description
Action
Set the action for the rule: permit/deny/pass:
- “Permit” - the packet will be processed by the system
(ignoring other firewall rules)
Furthermore, a filter may be applied to all inbound packets or only to packets arriving
via a specific interface. Each received packet is checked against all filters in the
order they are put in the set.
The first filter that matches the received packet determines how the packet will be
treated. If the filter is an accept filter, the packet is accepted, otherwise it is rejected.
If the packet matches no filter in the set, or if the set is empty, the packet is accepted.
2.4.6.1. Packet filtering rules
Every packet entering a router passes through a set of input filters (blocking filters).
The packets accepted by the input filter set are further processed by the IP layer of
the router kernel. If the IP layer determines that the packet should go further and not
landing here, it hands the packet to the set of outgoing filters (forwarding filters).
Information on packets rejected by any filter is displayed on the operator’s terminal
and the packets themselves are discarded without any notice to their sender.
A packet, "advancing through" a set of filters, is checked by every filter in the set,
from the first one till the end of the set, or until the first matching filter. The algorithm
is the following:
1. If the filter set is empty, the packet is accepted
2. Otherwise, the first matching filter decides what to do with the packet. If it is an
accept filter, the packet is accepted. If it’s a reject filter, the packet is rejected
(discarded)
3. If no filter has been found that matches the packet, it is accepted
2.4.6.2. IP Firewall parameters
In the IP Firewall parameters section, you can view the IP Firewall rules that are
already created; you can create a new rule for the current switch group by pressing
the «Add Rule» button, or you can permanently remove the rule from the
configuration by pressing the «Remove Rule» button.

Chapter 2 - Features set
User Manual
R5000 series - Web GUI
69
- “Deny” - the packet will be dropped
- “Pass” - the packet will be passed to the next rule in
the list and logged in the system log (only if the log
check box is marked)
Channel
Allocate a logical channel if there are logical channels prior
created in Traffic Shaping section (it is active only if the
action "permit" is selected)
If you allocate a number for a logical channel that was not
prior created in Traffic Shaping section, it has no effect in
the rule configuration
For the indications how to create a logical channel, please
refer to Traffic Shaping section below
Priority
Set the priority for the packets going through the new rule
of the filter:
- “Up to” - used to increase the packet priority to the
specified value only if the processed packet has a
lower priority
- “Set” - used to assign a new priority regardless of the
value already assigned to the packet
Log
Enable/disable filter actions logging in the system log
Direction
Set the input/output direction for applying the new rule:
- “Input” - the rule is used to process inbound traffic
- “Output” - the rule is used to process outbound traffic
and for post-routing packet filtering
Interface
Set the interface for applying the new rule
All the available interfaces are displayed in the dropdown
list (physical and logical)
If “any” option is used, the rule will be applied to all
available interfaces
Group
Set the Switch Group number for the applying of the new
rule
The Switch Group must be prior created
Rule
Set the packet capture filter for IP firewall
It is the same syntax called “PCAP expression”, as in the
Switching section
Refer to the filter expression syntax description above

Chapter 2 - Features set
User Manual
R5000 series - Web GUI
70
By pressing the «Validate» button, you can check the
syntax in the expression in the “Rule” field
NOTE
Read the information at the end of the Basic Settings page in order to find out the output
of the «Apply», «Test» and «Preview» buttons for the new configuration performed.
The «Up/Down» arrows allow you to organize rules list. The rules are processed one
by one in a top-down order.
2.4.7. SNMP
The SNMP protocol support is an important feature of all communication devices
because it allows the system administrator to manage the operation of a network as
a whole, as well as of each component.
Table 15 - IP Firewall
SNMP section contains a set of parameters to exchange data about network activity
of the device.
The SNMP Protocol has two sides, the agent and the management stations:
The agent sends data to the management station
The management station collects data from all the agents on the network. You
can set several destinations of traps with individual set of traps as well as
several users with individual access rights.
The agent sends alerts called traps (see Traps zone) and answers requests that
were sent by the management station
The management station captures and decodes the traps. The management
station also requests specific information from the agent.
The information is passed through requests and replies with the use of the MIB
The management station is responsible for decoding the SNMP packets and
providing an interface to the administrator. The interface can be a GUI or a
command line.
2.4.7.1. Access
In the Access section, you can view and edit the current SNMP access settings; you
can delete the current SNMP v.3 users by pressing the «Remove User» button or
create new ones by pressing the «Add SNMP v.3 User» button:

Chapter 2 - Features set
User Manual
R5000 series - Web GUI
71
SNMP access
parameter
Description
Start SNMP
Enable/disable SNMP daemon in the device
Version 1
enable
Enable/disable SNMP v.1 and v.2c support
The first version of the SNMP protocol lacks security in
the operation of the protocol itself, which hinders its use
for network management, so SNMP v.1 and v.2c works
only in read-only mode
By default, it is enabled
Community
Set the community name for read-only mode (SNMP v.1
and v.2c only)
The default SNMP v.1 and v.2c community name is
"public"
It is a security method for SNMP v.1 and v.2c, as Agents
can be set to reply only to queries received by accepted
community names
In SNMP v.1 and v.2c the community name passes along
with the data packet in clear text
Contact
Set the contact information
Used as a reference information about the device owner
Location
Set the geographical location where the unit is installed
Used as a reference information about physical device’s
location
User Name
Set the authorization user name of SNMP v.3
Password
Set the authorization password of SNMP v.3
Security
Set the security level:
- the lowest level means no authentication or privacy
(No Authorization No Privacy), you have to set the
User Name only
- the medium level means authorization and no
privacy (Authorization No Privacy), you have to set
User Name and Password
- the highest level means authorization and privacy
(Authorization and Privacy), you have to set the User
Name, Password and Privacy Password

Chapter 2 - Features set
User Manual
R5000 series - Web GUI
72
Read only
Enable/disable the read-only permission
Read/Write is the default value
Admin
Enable/disable the full access to the variables
E.g.: ability to reboot the device
Limited access is the default value
Privacy
Password
Set the privacy password
It is necessary when privacy is enabled for the required
security level
Privacy
Protocol
Set the encryption method for SNMP v.3: DES/AES128
SNMP traps
parameter
Description
Enable SNMP
Traps
Enable/disable to send SNMP traps
Agent IP
Set the IP address of the device which sends traps
Transport
Set the transport method
Two options are available:
- “IP” - all SNMP traps are sent to the server specified
in the “Destination” field below
- “MINT Gateway” - this option should be used when
the SNMP server is located beyond a gateway that
acts as an SNMP agent for the whole MINT network
Gateway MAC
Set the MAC address of the gateway in your MINT
network (relay device) if you selected “MINT Gateway”
option
2.4.7.2. Traps
Table 16 - SNMP Access
SNMP protocol operation requires a network agent instance to send asynchronous
messages (traps) whenever a specific event occurs on the controlled device (object).
InfiNet Wireless units have a built-in SNMP Traps support module (which acts as an
agent) that performs a centralized information delivery from unit internal subsystems
to the SNMP server. This zone focuses on SNMP Traps agent configuration.
In this section, you can view and edit the current SNMP traps settings. You can
clone, remove and clear target and traps by pressing the corresponding buttons:

Chapter 2 - Features set
User Manual
R5000 series - Web GUI
73
If there's no MAC address specified, all SNMP traps are
sent to the MINT SNMP relay
The relay can be specified by checking the Trap Gateway
check-box in the Link Settings section
Destination
Set the IP address of the server and the UDP port (162
port is commonly used)
SNMP trap types
Description
topoGroup
Events about topology changes in
MINT network
topoEvent
Number of neighbors or their status
has changed (full neighbor list)
newNeighborEvent
A new Neighbor has appeared
lostNeighborEvent
The Neighbor has been lost
radioGroup
Events which are related to changes of
radio link parameters
radioFreqChanged
The Frequency has changed
radioBandChanged
The Band has changed
mintGroup
Events about link quality changes in
MINT network
mintRetries
Retries has changed by more than
10%
mintBitrate
The Bitrate has changed
mintSignalLevel
Signal Level has changed by more
than 10%
ospfGroup
Events about OSPF table changes in
MINT network
2.4.7.3. SNMP trap types
The check boxes below specify traps or trap groups that are sent to the server:
Table 17 - SNMP Traps

Chapter 2 - Features set
User Manual
R5000 series - Web GUI
74
ospfNBRState
The State of the relationship with this
Neighbor has changed
ospfVirtNBRState
The State of the relationship with this
Virtual Neighbor has changed
ospfIFState
The State of the OSPF Interface has
changed
ospfVirtIFState
The State of the Virtual OSPF
Interface has changed
ospfConfigError
Parameters conflict in the
configuration of 2 routers
others
Other changes in MINT network
linkEvent
One of the communication links
represented in the agent’s
configuration has come up or come
down
trapdColdStartEvent
Cold Start event has occurred
snmpdAuthenticationFailureEvent
Not properly authenticated SNMP
protocol message has been received
syslog
Events about messages recorded in a
system log
NOTE
Read the information at the end of the Basic Settings page in order to find out the output
of the «Apply», «Test» and «Preview» buttons for the new configuration performed.
Table 18 - SNMP Trap Types
Press the «Clone» button if you need to setup multiple SNMP servers. Each server
can have an individual set of traps directed toward it.
Press the «Clear» button in order to clear all check-boxes for the current server.
2.4.8. QoS Options
QoS manager is a convenient and flexible mechanism to manipulate the data
streams going through the device. The user can create up to 200 logical QoS
channels characterized by different properties (such as priority levels and data
transfer rates) and then assign data streams to these logical channels according to

Chapter 2 - Features set
User Manual
R5000 series - Web GUI
75
CAUTION
All the settings for the QoS classes performed via CLI will be lost after saving any changes
in the WEB GUI.
QoS Parameter
Description
RTP Packets
Enable/disable automatic prioritization for all RTP
traffic, regardless of the source or the destination IP
Detect and prioritize the RTP packets (for example, if
the packet is recognized as a voice packet, then it gets
the priority 2, regardless of the previously assigned
priority)
Enabled by default
Dot1p Tags
Enable/disable automatic prioritization for the packets
tagged with IEEE 802.1p priority tags
Detect and prioritize the packets using 802.1p tags
Enabled by default
Tunnel
Prioritization
Enable/disable automatic prioritization for the tunnel
traffic
Allow prioritization within tunnels
IP ToS
Enable/disable automatic prioritization for the packets
with a non-zero “ToS” field
Detect and prioritize the packets using IP ToS tags
TCP
Acknowledgments
Enable/disable automatic prioritization for TCP ACK
packets
special rules of assignment. Packets going through different channels are thus
modifying their own properties as well as the properties of their respective data flows.
Figure 49 - QoS Options default configuration
The following QoS parameters can be selected for traffic prioritization:

Chapter 2 - Features set
User Manual
R5000 series - Web GUI
76
Automatically prioritize TCP acknowledgments
Strict Prioritization
Enable Strict Prioritization traffic control policy
By default, Weighted Fair Queue policy is used
Refer to WANFleX OS Manual for detailed policy
descriptions
Weighted fair queuing prioritization: unmark checkbox
ICMP Prioritization
Enable/disable automatic prioritization for ICMP
packets
Allow ICMP traffic prioritization
It does not increase the priority of "ping" packets
(although they are ICMP packets)
NOTE
Read the information at the end of the Basic Settings page in order to find out the output
of the «Apply», «Test» and «Preview» buttons for the new configuration performed.
Table 19 - QoS
2.4.9. Traffic Shaping
The Traffic Shaping section allows you to manipulate the data streams going through
the device. You can create up to 200 logical channels characterized by different
properties (such as priority levels and data transfer rates), and then to assign the
data streams to these logical channels according to the special rules, previously
created.
In the default configuration, there is no channel created. In order to prioritize the data
flows and/or to set the data transfer rates, you have to create the logical channels
by pressing the «Add Channel» button:
Figure 50 - Add a logical channel
The following parameters can be configured in the Traffic Shaping section for the
logical channels:

Chapter 2 - Features set
User Manual
R5000 series - Web GUI
77
Logical channel
parameter
Description
Channel
Logical channel number (1-200 allowed)
Max
Set the maximum transmit rate (in Kbps)
You can limit the data traffic within a logical channel to
a certain rate of kilobits per second
PPS
Set the maximum packet per second rate (in pps)
You can limit the data traffic within a logical channel to
a certain rate of packets per second
Latency
Set the maximum packet latency (in ms)
Leave it empty for default
Priority
Allocate the priority for all the packets going through
a specific rule:
- “Up to” - used to increase the packet priority to the
specified value only if the processed packet has a
lower priority
- “Set” - used to assign a new priority regardless of
the value already assigned to the packet
Redirect To
Set the gateway IP address (only for the router mode)
The whole stream is redirected to the specified IP-
address regardless of the current routing configuration
It may be useful when the router serves as a network
access unit and two or more different clients want to
access different providers through one unit
Information
Set a description for the logical channel created
Traffic
shaping rule
parameter
Description
Channel
Select the logical channel from the dropdown list
Table 20 - Logical channel parameters
You can delete an existed logical channel by pressing the corresponding «Remove
Channel» button.
You can create a traffic shaping rule by pressing the «Add Rule» button.

Chapter 2 - Features set
User Manual
R5000 series - Web GUI
78
All the parameters of this rule will be applied to this channel
Priority
Set the priority for the packets going through the new rule
of the filter:
- “Up to” - used to increase the packet priority to the
specified value only if the processed packet has a
lower priority
- “Set” - used to assign a new priority regardless of the
value already assigned to the packet
Log
Enable/disable filter actions logging in the system log
Direction
Set the input/output direction for applying the new rule:
- “Input” - the rule is used to process inbound traffic
- “Output” - the rule is used to process outbound traffic
and for post-routing packet filtering
Interface
Set the interface for applying the new rule
All the available interfaces are displayed in the dropdown
list (physical and logical)
If “any” option is used, the rule will be applied to all
available interfaces
Group
Set the Switch Group number for the applying of the new
rule
The Switch Group must be prior created
Rule
Set the packet capture filter
It is the same syntax called “PCAP expression”, as in the
Switching section
Refer to the filter expression syntax description above
Validate the rule by pressing the «Validate» button
Table 21 - Traffic shaping rules
You can delete an existed traffic shaping rule by pressing the corresponding
«Remove Rule» button.
2.4.10. Extra Commands
The Extra Commands section allows you to take advantage of the CLI configuration
flexibility within the Web interface. While the Web interface is simple to use and
understand, there are several parameters that can be configured via CLI only.

Chapter 2 - Features set
User Manual
R5000 series - Web GUI
79
CAUTION
If any configuration changes are introduced via the Web interface later on, the
configuration re-initializes and all CLI configured parameters are reset to default. Use this
section to add CLI specific commands to the configuration in order to preserve the finetuning settings.
Parameter
Description
Command
Select the command to add it to the device
configuration
Parameters
Insert the string to specify the command parameters
and options
Please refer to WANFleX OS User Manual for the full
explanation of all command parameters and options
Disabled
Check this option in order to disable the command
temporarily
The commands that do not have the enhanced parameters displayed in Web
interface are: sys, ifconfig, prf, qm, tun, route, mint, switch, svi, lag, sntp, dhcpc:
Figure 51 - Extra commands
Table 22 - Extra commands
Up/Down arrows allow you to organize the command list
Press the «Remove Command» button if you want to delete the command from
the list permanently
Press the «Add command» button if you want to add the command to the list
Example given: choose “sys” command from the dropdown menu, type “no indicator”
in the parameter field and then press the «Apply» button; this command will be saved

Chapter 2 - Features set
User Manual
R5000 series - Web GUI
80
into the configuration (and not only executed) and will be applied (switch off the LEDs
of the unit) after reboot.
In the Command Line menu, the commands are only executed, but not saved into
the configuration, while in Extra commands section from Basic Settings menu, the
commands are executed and saved into the configuration.
2.4.11. Apply, Test and Preview the configuration
After performing the needed configuration in the Basic Settings menu, you must save
all the new parameters by pressing the «Apply» button. If you are not sure about the
effect of the new configuration performed, you can apply the new configuration
temporarily by pressing the «Test» button. The previous configuration is
automatically restored after a grace period of 180 seconds (3 minutes). You have
the options to extend the grace period, or immediately accept/reject the changes.
By pressing the «Preview Configuration» button, you can view the configuration
results in CLI-style format.
A warning message is displayed in this section to inform about the consequences of
saving configuration via Web or CLI interfaces:
Figure 52 - Apply, test and preview the configuration
After pressing the «Apply» button for saving the new configuration, the system will
redirect you to the login page. After a 5 seconds timer you can log in back to the unit
and check the new configuration.
2.5. Maintenance
The Maintenance menu allows you to perform service tasks for the device
maintenance and to check the hardware and software version, reason for the last
reboot, system uptime, current configuration, license, diagnostic card, etc.
Maintenance page has the following sections:
Firmware
Upload
Download
Bottom section of the page with the «Reboot», «Restore Factory Settings»,
«View Current License», «View Current Configuration» and «Create Diagnostic
Card» buttons

Chapter 2 - Features set
User Manual
R5000 series - Web GUI
81
Parameter
Description
Firmware Version
Displays the current firmware version
The firmware string contains also the hardware
platform type
Build Date
Displays the firmware build date
Serial Number
Displays the serial number of the unit
Part Number
Displays the part number of the unit
It contains information about the unit type
Platform
Displays the processor model
Uptime
Displays the system up time since the last reboot
Last Reboot
Reason
Displays the reason for the last reboot of the unit
The options are:
- Software fault
- Unexpected restart
- Manual restart
- Manual delayed restart
- Firmware upgrade
- SNMP managed restart
2.5.1. Firmware
Figure 53 - Firmware

Chapter 2 - Features set
User Manual
R5000 series - Web GUI
82
- Test firmware loaded
NOTE
It is not mandatory for the unit to have access to the Internet for this feature to work.
However, the PC that is used to initialize the upgrade procedure must have access to
InfiNet Wireless website (both http and ftp).
Table 23 - Firmware parameters
By pressing the “Download Certificate for upgrade over SSL” link, you can download
InfiNet Wireless self-signed certificate. This allows you to upgrade the unit software
version when you are connected to the Web interface via HTTPS.
The system checks automatically for the firmware updates on the InfiNet Wireless
repository and displays a warning message for 10s at each login to the Web interface
if a new software version is available:
Figure 54 - New firmware warning message
In case of new software version availability, after pressing the «Check Latest
Release» button, the system provides the following options:
Figure 55 - New firmware availability
By pressing the «Upgrade Firmware» button, the system starts the firmware upgrade
process automatically:

Chapter 2 - Features set
User Manual
R5000 series - Web GUI
83
Figure 56 - Firmware upgrade
After the firmware upgrade process ends, you have to reboot the unit before using
the new software version:
Figure 57 - Firmware upgraded succesfully
By pressing the «Save New Firmware» button, you download the new firmware file
locally on your PC.
If no new firmware version is available, the system provides a full change log for the
latest firmware release after pressing the «Check Latest Release» button:

Chapter 2 - Features set
User Manual
R5000 series - Web GUI
84
The process above is the same in case of Beta firmware version. Press the «Check
Latest Beta» button for it.
2.5.2. Upload
The Upload section allows you to upload other license, firmware and configuration
files to the unit.
For each of the three options, press the «Choose File» button, followed by the
«Upload» button after the file has been picked up.
After pressing the «Upload» button, the system performs three operations:
uploading, saving and validating the new file uploaded and indicates if each of the
operation succeeded or failed. In case that the process succeeded, you have to
reboot the unit in order to apply the new changes.
2.5.3. Download
Figure 58 - Latest firmware change log
The Download section allows you to download locally, to the management PC, the
current license, firmware and configuration files, by pressing the corresponding
buttons: «Download License», «Download Firmware» and «Download
Configuration».
2.5.4. Bottom section of the page
The following buttons are available:
«Reboot» button - reboots the device. A warning message pops up asking for
the permission before the operation to start. During the restart process, you are
redirected to the login page and the timeout period of 35 seconds counts down
before the new login:
Figure 59 - Unit reboot
«Restore Factory Settings» button - restores the factory default configuration.
A warning message pops up, asking for the permission before the operation to
start. During the reset to factory process, you are redirected to the login page
and the timeout period of 30 seconds counts down before the new login:

Chapter 2 - Features set
User Manual
R5000 series - Web GUI
85
CAUTION
When running spectrum scan on a unit accessible via the RF interface, connection will be
lost during scan time (the radio-link will be disconnected). Use "Last Snapshot" button to
see scan results.
«View Current License» button - shows the current device license parameters
in a new window
«View Current Configuration» button - shows the current device configuration
in text format in a new window
«Create Diagnostic Card» button - Tech Support Reports Generator. By
pressing this button, the system downloads to the local PC a text file that
contains the complete information (for the technical support specialists) set from
the device such as: full device configuration listing, system log output, license
information, “mint map detail” command output, interfaces statistics, etc.
2.6. Spectrum Analyzer
In Spectrum Analyzer menu, you can perform a deep analysis of the radio emissions
in the environment where the unit is placed. The unit scans the radio spectrum on
all available frequencies. In order to obtain the information as accurate as possible,
the scanning process may take a while.
Figure 60 - Spectrum analyzer
The following parameters are available in order to operate the Spectrum Analyzer:

Chapter 2 - Features set
User Manual
R5000 series - Web GUI
86
Parameter
Description
Interface
rf5.0 radio interface is the only option available, but it
is showed for the backward compatibility with the dual
radio legacy products
Start Frequency
Set the first frequency for scanning (in MHz)
Stop Frequency
Set the last frequency for scanning (in MHz)
Band
Set the bandwidth (in MHz)
Step
Set the scanning frequency step (in MHz)
It is recommended to set 1 MHz “step” value to get
more precise scanning results
Channel Mask
Select which antenna to be used for scanning the radio
environment
“Auto” parameter is set by default - scanning is
performed by both antennas (this parameter is
applicable only to “R5000-Xm” models)
Scan Duration
Set the time period for the scanning process (in
seconds)
After the end of this time period, scanning will be
stopped and the radio interface will be back to its
normal mode operation
Enable Grid
Mark/unmark the corresponding checkbox to
display/hide the grid lines and highlight the special
frequency channel on the scan output
The highlighted frequency channel can be used to
mark the channel which the device is currently working
on or which it plans to use
Grid Width
Set the bandwidth value for the highlighted frequency
channel (in MHz)
Grid Frequency
Set the central operating frequency for the highlighted
frequency channel
RSSI mode
Select the gradient-color type for the “Max RSSI”
values to be displayed on the Spectrum Analyzer
output screen
The options are:
- Normal (by default)

Chapter 2 - Features set
User Manual
R5000 series - Web GUI
87
- Gradient
- Max Hold
- Peak Hold
Table 24 - Spectrum Analyzer
Start/stop Spectrum Analyzer by pressing the «Start Sensor Test»/«Stop Sensor
Test» buttons.
By pressing the «Last Snapshot» button, you get the final scanning results. The most
common usage of this feature is when you perform a spectrum scan at the remote
unit on the other side of the radio link. When running a spectrum scan at such a unit
(accessible via the RF interface), connection to this unit will be lost for a scan time.
"Last Snapshot" option allows viewing scan results when the connection gets up
again.
When you run spectrum scan on a local unit and the link is interrupted, the remote
unit will not disappear from the spectrum picture. So you should silence the remote
unit in order to have a real picture without it, otherwise you will always see noise
signal on the operating frequency generated by the remote unit.
You can get detailed information about the scanned radio signals on a specific
frequency. Just point a cursor on the needed frequency and you will see a hint with
exact Signal level (dBm), Frequency (MHz), Noise Floor (dBm), RSSI (dBm), High
RSSI (dBm), Max RSSI (dBm) values.
2.7. DFS
The DFS page provides the monitoring and management of the DFS operation. The
DFS status and availability indicators are shown for each frequency for the given
band and grid. The indicators are described in the Legend at the bottom of the page.
By pressing the «Clear NOL» button, you clear the non-occupation list with the
blocked frequencies (due to the radars detected on these frequencies). The DFS
subsystem rescans those frequencies and if they are still not available, the scanning
starts after the time period displayed in the right bottom corner of the frequency
indicator.
By pressing the «Re-select Channel» button, you restart the DFS scanning.

Chapter 2 - Features set
User Manual
R5000 series - Web GUI
88
2.8. Command Line
The Command Line page emulates CLI (command line interface) in the Web
interface. This allows managing and monitoring the device by using all the
commands and functions that are available via standard CLI.
In order to run one or a set of WANFleX commands, type them in the “Command”
field and then press the «Execute» button. The output of the commands is displayed
in the section above the “Command” field:
Figure 61 - DFS

Chapter 2 - Features set
User Manual
R5000 series - Web GUI
89
Figure 62 - Command line
In the Command Line menu, the commands are only executed, but not saved into
the configuration, while in Extra commands section from Basic Settings menu, the
commands are executed and saved into the configuration.

Configuration scenarios
Chapter 3

Chapter 3 - Configuration scenarios
User Manual
R5000 series - Web GUI
91
3.1. Introduction
This chapter provides step by step instructions for some basic configurations of
R5000 units.
3.2. Setting up a basic PtP link
For this example, we have two R5000 units with the default factory configuration.
Step 1
In order to access each of the units, we have to make sure that there is network
connectivity between the PC used for the configurations and the units on their default
Ethernet IP address which is 10.10.20.1/24.
Step 2
Connect to the first unit using a Web browser and type any username and any
password in the corresponding fields. Let’s use in this example “test” for both
username and password. After the authentication, a warning message pops up and
requests us to change these initial authentication credentials:
Figure 63 - Warning message – setup system login & password
Step 3
In order to change the initial credentials, we have to go to Basic Settings → System
Settings and fill in the “User Name” and “Password” fields with the permanent
authentication credentials. Let’s use in this example “Node1” user name and “Infi1”
password for the first unit and “Node2” user name and “Infi2” password for the
second unit.
In the same section, we set the “Device Name” parameter for each unit. Let’s name
in this example “Node1” the first unit and “Node2” the second unit:
 Loading...