

Page 1
2100 Central Ave, Suite 106, Boulder, CO 80301
www.indevr.com | 303.402.9100 | indevr@indevr.com
Imaging and Analysis System
Operation Manual
© Copyright 2014-2018, InDevR, Inc.
All rights reserved
Page 2

Page 2 VaxArray® Imaging and Analysis System Operation Manual CF-0159 R004
Model : VaxArray Imaging and Analysis System V1.0
Software : V1.0 or newer
Document : VaxArray® Imaging and Analysis System Operation Manual R004
Revised : June 2018
InDevR continuously optimizes products as new technologies are developed. For this reason, the right to make
technical changes is reserved. Defects caused by unauthorized alterations to the product by the user voids the
warranty. InDevR shall not be held liable for damages caused by unauthorized modifications.
This document applies only to the specified product and model number and replaces all previous revisions and
publications.
Copying, distribution and utilization without authorization are prohibited.
© 2018 InDevR, Inc.
2100 Central Avenue
Suite 106
Boulder, CO 80301
Phone: 303-402-9100
Fax: 303-402-9300
E-mail: indevr@indevr.com
Page 3

Page 3 VaxArray® Imaging and Analysis System Operation Manual CF-0159 R004
Table of Contents
GENERAL .......................................................................................................................................................5
DOCUMENT CONVENTIONS ...........................................................................................................................................5
SAFETY INSTRUCTIONS ..................................................................................................................................................5
CONFORMITY TO STANDARDS, NORMS AND REGULATIONS ..................................................................................................6
REGULATORY ..............................................................................................................................................................6
21 CFR Part 11 and Annex 11 ..............................................................................................................................6
INTENDED USE OF VAXARRAY IMAGING AND ANALYSIS SYSTEM ..........................................................................................6
LEGAL NOTICE .............................................................................................................................................................6
IMAGING SYSTEM OVERVIEW ........................................................................................................................................6
PACKAGE CONTENTS ....................................................................................................................................................7
OPERATING REQUIREMENTS ..........................................................................................................................................7
INSTALLATION ...............................................................................................................................................8
INSTALLATION .............................................................................................................................................................9
FRONT PANEL .............................................................................................................................................................9
Status Indicator LEDs ...........................................................................................................................................9
Power Button .......................................................................................................................................................9
Imaging Door .................................................................................................................................................... 10
REAR PANEL ............................................................................................................................................................ 10
Main Power Switch ........................................................................................................................................... 10
Transportation Lock Placeholders .................................................................................................................... 10
Hardware and Peripheral Connectors .............................................................................................................. 11
Imaging Tray Open Button ............................................................................................................................... 11
IMAGING TRAY AND SLIDE HOLDER.............................................................................................................................. 11
VAXARRAY IMAGING AND ANALYSIS SOFTWARE .......................................................................................... 12
SOFTWARE OPERATING INSTRUCTIONS ........................................................................................................ 12
SOFTWARE NAVIGATION: ........................................................................................................................................... 12
IMAGING AND ANALYZING A VAXARRAY EXPERIMENT ................................................................................. 13
STANDARD WORKFLOW ............................................................................................................................................ 13
1. START NEW EXPERIMENT ....................................................................................................................................... 14
2. SETUP EXPERIMENT .............................................................................................................................................. 15
3. PREVIEW & IMAGE ............................................................................................................................................... 17
4. REVIEW CALIBRATION CURVES ................................................................................................................................ 19
5. REVIEW RESULTS SUMMARY ................................................................................................................................... 20
6. RESULTS WORKSHEET ........................................................................................................................................... 22
7. GENERATING A REPORT ......................................................................................................................................... 22
OPENING PREVIOUSLY RUN EXPERIMENTS ................................................................................................... 24
ACCESSING VAXARRAY IMAGING AND ANALYSIS SYSTEM SETTINGS & INFORMATION ................................... 26
MANAGING USER ACCOUNTS ....................................................................................................................... 28
Adding a new User ........................................................................................................................................... 28
Removing a User .............................................................................................................................................. 28
Adding a User to a Specific User Group ............................................................................................................ 28
Changing Administrator Privileges ................................................................................................................... 29
PERMISSIONS ........................................................................................................................................................... 29
GROUPS .................................................................................................................................................................. 29
RECOMMENDED GROUPS .......................................................................................................................................... 30
Basic user .......................................................................................................................................................... 30
Service Level User ............................................................................................................................................. 30
Administration Level User ................................................................................................................................ 30
Page 4

Page 4 VaxArray® Imaging and Analysis System Operation Manual CF-0159 R004
TROUBLESHOOTING, CLEANING, AND SERVICE ............................................................................................. 31
FAILURE TO FIND AN ARRAY ....................................................................................................................................... 31
CLEANING ............................................................................................................................................................... 31
SERVICE .................................................................................................................................................................. 31
SHIPPING ................................................................................................................................................................ 32
PROPER DISPOSAL OF THE INSTRUMENT ....................................................................................................................... 32
TRADEMARKS .............................................................................................................................................. 33
SPECIFICATIONS ........................................................................................................................................... 33
Page 5
Page 5 VaxArray® Imaging and Analysis System Operation Manual CF-0159 R004
General
This manual provides all information for the setup and use of the InDevR VaxArray Imaging and Analysis System.
Document Conventions
This symbol is used to indicate safety instructions and similar important information. Follow
these instructions to avoid personal injury or damage to the instrument.
This symbol is used to indicate additional useful information.
Next
The names of keys, menus or buttons are underlined.
Safety Instructions
Caution:
1. Improper use of the instrument can impair the protective functions of the instrument.
2. The instrument may only be used by qualified personnel.
3. Do not use the instrument if any parts are damaged, e.g. mains lead, fan, fuses etc.
4. Check all electrical cords regularly for frays, broken plugs, damaged wires, knots, or
melted insulation.
5. Do not open the housing of the instrument.
6. Do not attempt any repairs or alterations except as expressly instructed in this
manual.
7. Always disconnect power before moving or cleaning the instrument.
Please follow these instructions for your own safety and the proper operation of your
instrument:
1. Read the user manual fully and completely.
2. The main supply source must meet the national regulatory requirements.
3. The power cord of the instrument must be connected to a wall outlet with a grounded
conductor.
4. The mains voltage must correspond to the range given in the specifications.
5. External devices which will be connected to the instrument must be compliant to
IEC/EN 60950-1.
6. The environment must be clean, stable and vibration-free.
7. No objects should be placed on top of the instrument.
8. Keep liquids away from the instrument.
9. Do not allow liquids to get inside of the instrument.
10. Adequate space must be available for the imaging tray when it is fully extended from
the front of the instrument.
11. Keep enough space in the back and sides of the instrument to allow access to the
power switch and proper ventilation.
12. Do not touch the imaging tray when the imaging door is open.
13. Do not open the imaging door manually.
Page 6

Page 6 VaxArray® Imaging and Analysis System Operation Manual CF-0159 R004
Conformity to standards, norms and regulations
This product complies with the essential requirements of the following European Directives, and carries the
CE marking accordingly:
Low Voltage Directive 2006/95/EC
Electromagnetic Compatibility Directive 2004/108/EC
Moreover, the instrument conforms to the following product standards:
IEC 61010-1 (Ed. 2.0) IEC 6100-3-3 (Ed. 2.0, 2008-06) IEC 6100-4-5 (Ed. 2.0, 2005-11)
IEC 61010-2-081 (Ed. 1.0); am1 IEC 6100-4-2 (Ed. 2.0, 2008-12) IEC 6100-4-6 (Ed. 3.0, 2008-10)
IEC 61326-1 (Ed. 1.0, 2005-12) IEC 6100-4-3 (Ed. 2.0, 2008-08)
IEC 6100-3-2 (Ed. 3.2, 2009-04) IEC 6100-4-4 (Ed. 2.0, 2004-07)
A copy of the Declaration of Conformity can be obtained by contacting InDevR.
Regulatory
The VaxArray Imaging and Analysis System has been designed and manufactured according to ISO9001:2000 and EN-ISO-13485:2003 standards. The product is CE marked.
21 CFR Part 11 and Annex 11
The VaxArray Imaging and Analysis System is designed to operate within FDA 21 CFR Part 11 and Annex 11
compliant facilities. Please reference VaxArray Enabling Compliance with 21 CFR Part 11 and Annex 11 for
further details.
Intended Use of VaxArray Imaging and Analysis System
The VaxArray Imaging and Analysis System is intended for imaging and analysis of VaxArray assays
(www.indevr.com/vaxarray). The imaging system delivers images and/or calculated information relating to the
arrays imaged. The VaxArray Imaging and Analysis System is not for diagnostic or therapeutic use.
Legal Notice
The VaxArray Imaging and Analysis System is designed for the imaging and analysis of VaxArray assays. The use
of this product in combination with third party intellectual property may have implications according to patent
law. We strongly advise customers to procure appropriate licensing where required.
Imaging System Overview
The VaxArray Imaging and Analysis System is a compact desktop imaging instrument suitable for imaging and
analysis of VaxArray assays. The VaxArray Imaging and Analysis System comes with an integrated PC and built
in X/Y/Z positioning system which places the slide holder in the optimum position. The instrument employs a
fluorescence imaging system consisting of LED excitation sources and a camera to acquire images. Green
(525nm) LED excitation is integrated with accompanying excitation and emission filters. The imaging system
Page 7

Page 7 VaxArray® Imaging and Analysis System Operation Manual CF-0159 R004
includes the VaxArray Imaging and Analysis Software to manage operation of the instrument, record
experimental information, and analyze the arrays and resulting data.
The user has complete access to the PC and operating system in order to govern all access rights and enable
compliance with FDA 21 CFR Part 11 or Annex 11 guidance.
The VaxArray Imaging and Analysis System has been validated for use with the Windows 7 operating system.
Use with other operating systems has not been validated and may effect system performance.
The VaxArray Imaging and Analysis System has not been validated for use with third party software. Addition
of third party software or peripherals may effect system performance.
Updates to the VaxArray Imaging and Analysis Software will be provided at the discretion of InDevR, Inc.
Package Contents
The standard VaxArray Imaging and Analysis System package is supplied with:
• VaxArray instrument with monitor, keyboard, and mouse
• Power cord 125 V, 15A, 2.0m
• Plastic cap for transportation lock hole
• 4 Slide Holder
• VaxArray Imaging and Analysis Software
• VaxArray Imaging and Analysis System Operation Manual
Operating Requirements
• Clean laboratory environment
• Sturdy surface able to support 45 lbs (~20 kg)
• Approximate desktop space required (W x D x H): 18 x 22 x 9 inches (440 x 540 x 210 mm)
• A minimum distance of 2 inches (50 mm) on the left side and 4 inches (100 mm) on the back and front
sides of the instrument to allow for proper ventilation
• Appropriate ambient conditions, see Specifications section on page 30.
• Ethernet connection for remote support (optional)
Page 8

Page 8 VaxArray® Imaging and Analysis System Operation Manual CF-0159 R004
Installation
This section provides a description of the instrument (Figure 1) and instructions for installation. For a detailed
explanation of instrument maintenance and service, please refer to
Page 9
Page 9 VaxArray® Imaging and Analysis System Operation Manual CF-0159 R004
Troubleshooting, Cleaning, and Service.
Installation
A. The VaxArray Imaging and Analysis System is shipped with two transportation locks to avoid damage
during shipment. The two lock screws fix the position of the imaging tray during transport. One is
placed on the right side and one on the rear of the system. Remove the two transportation lock
screws and place them in the threads on the rear panel (Figure 2).
B. Install the provided transparent plastic cap into the hole of the transportation lock on the right side
of the instrument.
If the instrument is to be moved or shipped, the imaging tray must be locked to avoid
damage during transport. Please refer to
Troubleshooting, Cleaning, and Service for detailed instructions on re-installing the lock
screws.
C. Connect the USB cables of the mouse and keyboard to the USB outlets on the rear panel (Figure 2).
D. Connect the VGA monitor cable to the VGA connector on the rear panel (Figure 2).
E. Plug power cords for the instrument and monitor into grounded outlets.
F. Turn on the main instrument power source using the power switch on the rear of the instrument
(Figure 2), and power on the monitor.
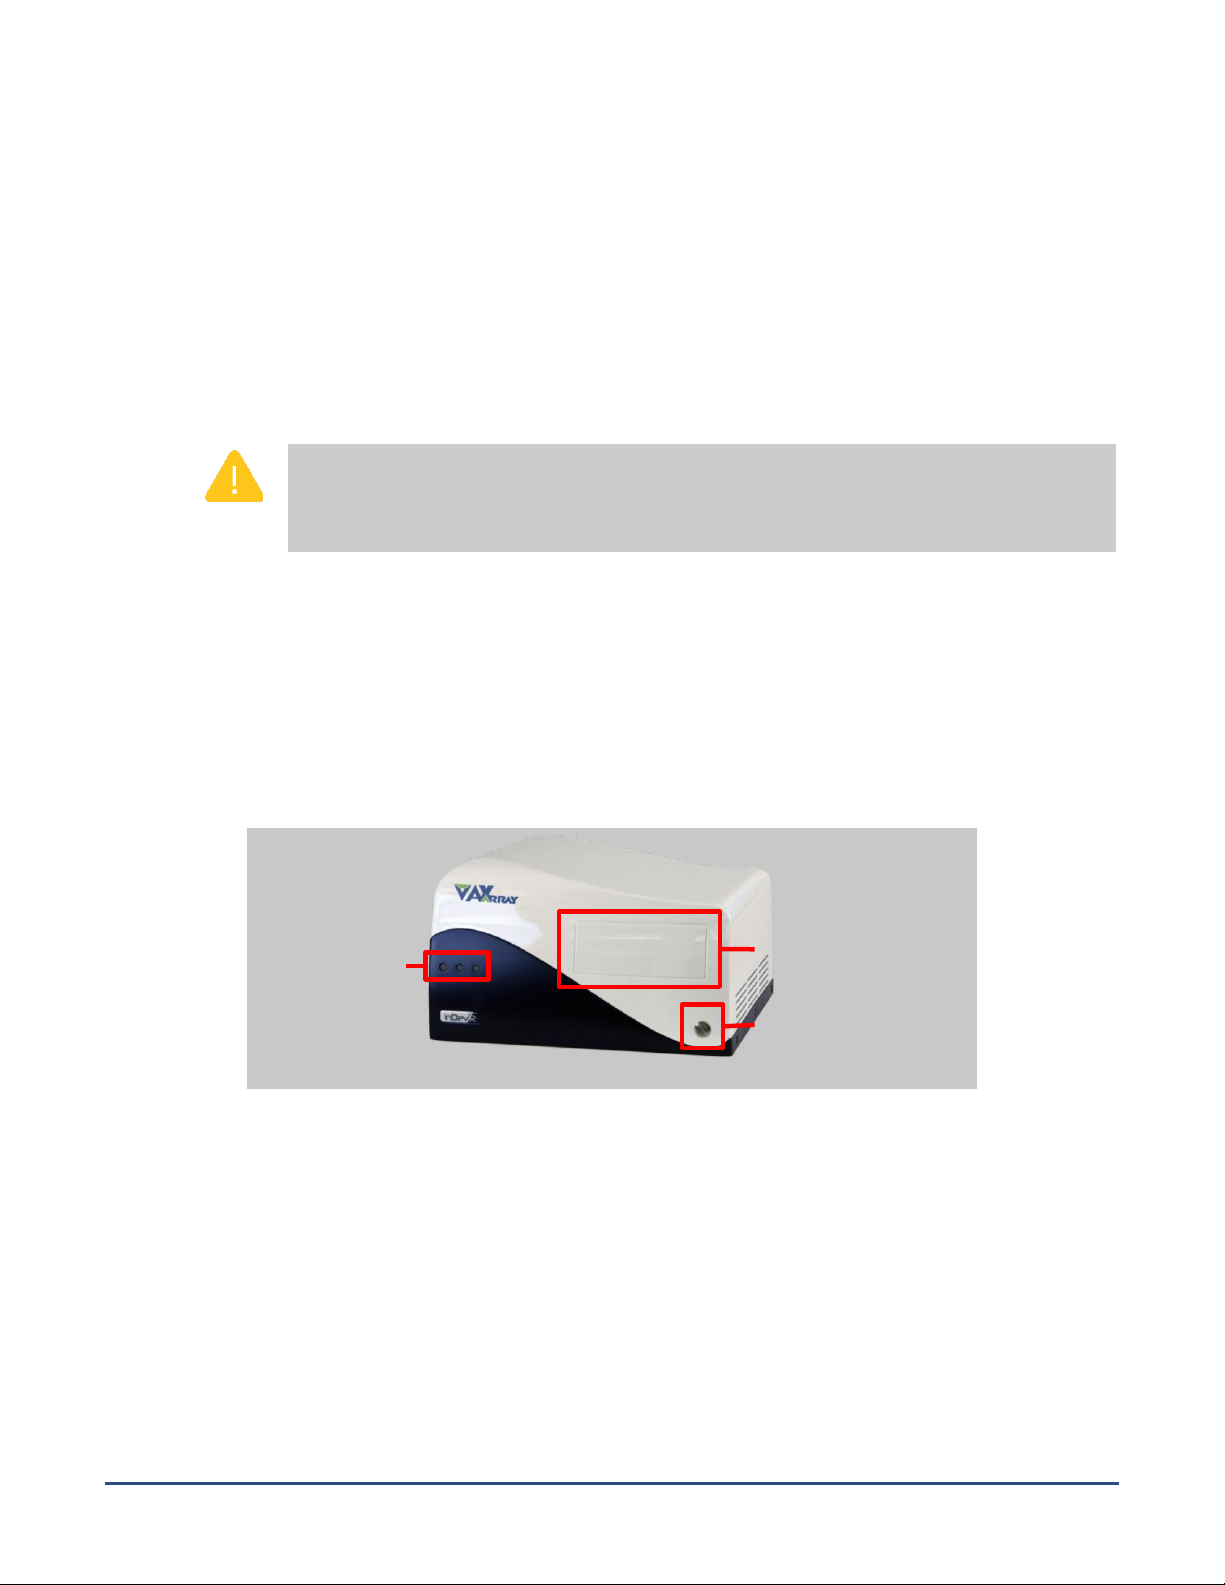
Front Panel
The front panel of the VaxArray Imaging and Analysis System is shown in Figure 1.
Status Indicator LEDs
The LEDs provide the following information:
Green / Orange (left) Power on / Standby
Red (right) Error
Power Button
The instrument is switched on by pressing the power button which also turns on the internal PC.
Figure 1: Front View of VaxArray Imaging and Analysis System.
Status Indicator
LEDs
Imaging Door
Power Button
Page 10
Page 10 VaxArray® Imaging and Analysis System Operation Manual CF-0159 R004
The power switch on the rear panel must be switched on first.
Imaging Door
The self-opening and closing door provides access to the imaging tray for insertion and removal of VaxArray
slides. The opening and closing of the imaging door is initiated within the software interface.
Do not move the imaging tray manually or insert your fingers into the front door unless
you are re-installing the transportation locks (see
Troubleshooting, Cleaning, and Service for the proper procedure).
In case of system failure, the imaging tray can be opened without software control via the
rear panel (See Imaging Imaging Tray Open Button).
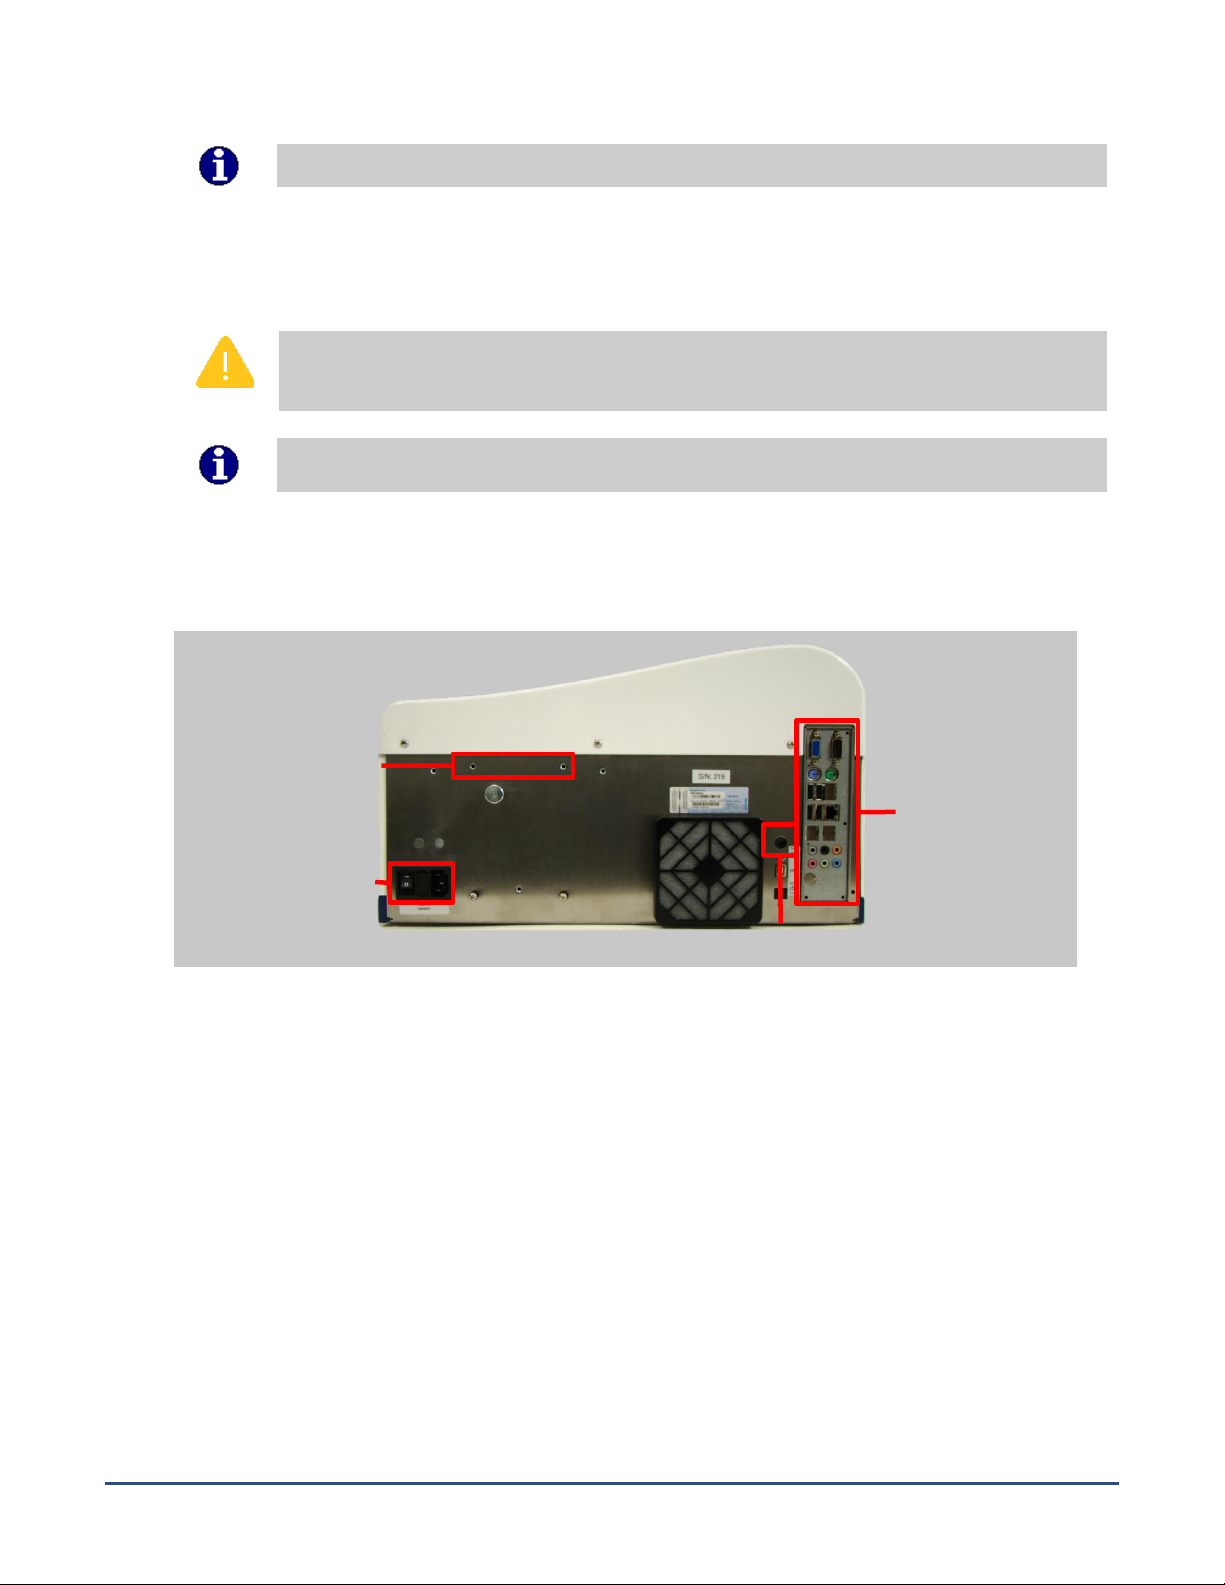
Rear Panel
The rear panel is shown in Figure 2.
Main Power Switch
This switch turns the main power on or off.
Transportation Lock Placeholders
The transportation locks should be stored in these placeholders for easy retrieval should the instrument
need to be shipped or moved in the future (see
Figure 2: Rear View of VaxArray.
Main Power Switch
Transportation Lock
Placeholders
Hardware &
Peripheral
Connectors
Imaging Tray Open Button
Page 11

Page 11 VaxArray® Imaging and Analysis System Operation Manual CF-0159 R004
Troubleshooting, Cleaning, and Service).
Hardware and Peripheral Connectors
Multiple connection options, including VGA and USB, are provided to connect the provided mouse,
keyboard and monitor along with any other hardware or peripherals.
Imaging Tray Open Button
In the event of a system failure or other instance in which the imaging tray cannot be opened via the
software interface, this button may be used as outlined below:
• Shut down the system and switch the main power switch off.
• Switch the main power on again.
• Press the Imaging Tray Open button on the rear panel while pressing the power button on the
front panel.
• The imaging door will open and the imaging tray will extend.
Imaging Tray and Slide Holder
The four slide holder should be placed into the imaging tray with the A1 engraved on the slide holder positioned
toward the top left near the A1 of the imaging tray. The slide(s) are to be placed in the 4 slide holder with the
first slide in the left-most “Mount 1” position with the A1 well of the slide located in the top left (Figure 3).
Note that if you are performing a standard VaxArray analysis that provides a quantitative (μg/mL) result, the
leftmost slide in Mount 1 should contain the standards comprising the calibration curve in slide wells A1
through H1.
Figure 3: Imaging Tray & Slide Holder.
A1 Location
Page 12

Page 12 VaxArray® Imaging and Analysis System Operation Manual CF-0159 R004
VaxArray Imaging and Analysis Software
The VaxArray Imaging and Analysis System is preinstalled with the VaxArray Imaging and Analysis Software,
which has a graphical user interface to enable user-friendly information entry, imaging, analysis and export. The
software can be opened by selecting the VaxArray icon from the desktop.
This software has been developed to allow a user to image and analyze VaxArray slides. Settings for the imaging
operation, such as focus position and exposure time, are managed through the software interface. The user can
enter and store reagent concentrations, lot numbers, and other assay information for each analysis. The
software processes the fluorescent images to report assay-specific signal intensities and calculated protein
concentrations, as well as alerting the user to saturated signals, analysis errors, and other quality control
metrics. User restrictions, audit trails, and electronic signatures maintain data integrity and support laboratories
that are compliant with FDA 21 CFR Part 11 and Annex 11.
Software Operating Instructions
Software Navigation:
In every software view, icons for action items are displayed across the bottom of the page or view (Figure 4).
In sequence from left to right, these icons are:
a. Home Page: Return to the home page
b. Open/Close: Open the imaging door and extend the imaging tray or retract the imaging tray
and close the imaging door
c. Edit (pencil): Allows modification of experimental information (not active for unauthorized
users)
d. Save (floppy disk): Saves experimental information
e. Excel: Open an Excel file containing experimental results
f. Report (folded corner page): Open the results and experimental information in a formatted
report
g. Left Arrow: Return to previous view
h. Right Arrow: Proceed to next view
Icons in the bottom bar are colored white or gray depending on whether the icon is active or inactive at that
particular time. For example, the right arrow may be gray when the operator has not yet completed a required
action in the current view.
Figure 4: Bottom bar of software views.
Page 13

Page 13 VaxArray® Imaging and Analysis System Operation Manual CF-0159 R004
Imaging and Analyzing a VaxArray Experiment
Notes: The VaxArray Imaging and Analysis System is compatible with all commercially-available VaxArray
assays. This manual will use the VaxArray Influenza Seasonal Hemagglutinin Potency Assay v1.2 to
illustrate the use of the system.
Standard Workflow
Execute Assay
According to Assay
Operation Manual
Click New
Experiment and
select assay
Enter experiment
information
Preview to
adjust/optimize
exposure time
Image Slide(s)
Review Calibration
Curves
View Results
Page 14

Page 14 VaxArray® Imaging and Analysis System Operation Manual CF-0159 R004
1. Start New Experiment
To image and analyze a VaxArray slide, first process the slide(s) according to the applicable VaxArray Influenza
Potency Assay Operation Manual. When complete, start up the VaxArray Imaging and Analysis System and open
the software. Initially the home screen will be displayed (Figure 5), allowing the user to initiate a New
Experiment. Additionally, the home screen will display the instrument status in the lower left corner along with
the imaging tray open/close button.
Select New Experiment on the home screen. A pop-up will appear that allows the user to select the VaxArray
assay to be analyzed (Figure 6). Additionally, the user may select to analyze the assay in Raw Analysis Mode,
which provides results as RFU (relative fluorescent unit) values instead of determining protein concentrations.
Standards (used to construct a calibration curve) are not required for use of Raw Analysis Mode.
Once the appropriate selections have been made, click the Green Check to proceed.
Note: Please ensure that you have selected the correct assay for the slide that is being
analyzed.
Figure 5: VaxArray Software Home Screen.
Figure 6: New Experiment Assay Selection.
Page 15

Page 15 VaxArray® Imaging and Analysis System Operation Manual CF-0159 R004
2. Setup Experiment
The Setup Experiment view allows the user to enter relevant experimental information prior to imaging and
analysis of the assay as follows (Figure 7):
A. Enter Experiment Name and Number of Slides: Enter the experiment name (required) and select
the number of slides to be analyzed (required) in the top bar.
Required information entry will be indicated by a red outline or red lettering. For example,
the Experiment Name box is surrounded with a red outline until a name is entered and the
cursor moved to the next action. Similarly, Slide 1 is marked in red letters until the slide is
opened and the contents are approved.
B. Analysis Variables: Variables for assay analysis may be edited by selecting Analysis Variables, but
this is usually not required and changes are not recommended. Edits to these variables are
restricted to users with sufficient permissions.
a. Analysis Methodology: Analysis with the VaxArray Imaging and Analysis Software can be
performed using either a sequence of four point linear fits or a sequence of five point linear fits.
The selection is made via a dropdown menu.
b. R2 Cutoff: This variable is the minimum value for a given linear range which must be satisfied in
order to use this range in the analysis. This value can be set between zero and one. The higher
the value, the more stringent the analysis.
c. Slope Cutoff: This variable is the minimum value of the slope of a linear range that must be
satisfied in order for that linear range to be used in the analysis. A higher value is more limiting
and will result in a more stringent analysis.
d. QL Multiplier: This variable is the number the standard deviation in the blank well is multiplied
by before being added to the average of the blank to determine the quantitation limit. A higher
value will result in a more stringent analysis.
Figure 7: Setup Experiment.
Page 16

Page 16 VaxArray® Imaging and Analysis System Operation Manual CF-0159 R004
C. Select Target Antibodies: The 3 x 3 figure illustrates the location and type of antibodies in the array.
The antibodies on the array layout image may be selected or deselected if the user knows only
specific proteins are in the sample or if only specific antibodies are known to be reactive. Selecting
only the appropriate antibodies can simplify the appearance of the user interface and eliminate
visualizing extraneous data, but all antibodies will be analyzed regardless of the selection and a
deselected antibody may be reselected later.
D. Fill in Sample info: Click on each slide to fill in reagent lot information, slide IDs, sample IDs and
dilution factors (Figure 9). The slide(s) must be clicked on and the Green Check selected in order to
proceed to further operations.
Figure 8: Edit Analysis Variables.
Figure 9: Sample, Reagent & Slide Information.
Page 17

Page 17 VaxArray® Imaging and Analysis System Operation Manual CF-0159 R004
Mismatched information entry will also be indicated by a red outline. For example,
dilution factors are restricted to positive real numbers. Entering text or negative numbers
will be indicated by a red outline until a positive number is entered. Other numeric
entries, like standard concentrations, have similar restrictions.
E. Enter Standard Concentrations: The table at the bottom of the Setup Experiment view records the
concentrations of the protein standards (μg/mL) used for the calibration curve. During the VaxArray
assay procedure, these standards are processed in Column 1 of the slide. The user must enter
concentrations that match their specific experiment. Concentrations can be entered using several
different methods. The user can manually enter concentrations into every cell. Alternatively, if the
InDevR recommended dilution series was used during standard preparation, the user can manually
enter the highest concentrations, and the autopopulate feature of the table automatically fills in the
remaining standard concentrations. For example, entering a concentration value into Std 1 (High)
cell of H1(i) autofills the same concentration in all H1 Std 1 (High) cells. In addition, the lower
concentrations are autofilled following the fractional dilution series recommended by InDevR (0.8,
0.6, 0.4, 0.2, 0.1, and 0.05 multipliers). Any value can be overwritten by the operator. Another
option is to use a Standards Template. Once the appropriate standard concentrations are added to
the table, choose Create New and name the standards template for use in subsequent experiments.
a. When operating in Raw Analysis Mode, the table is grayed out to indicate that raw analysis
does not apply a standard curve to determine protein concentrations. Raw Analysis Mode
provides the measured fluorescence signals of each antibody.
F. Once all relevant information has been entered: select the Right Arrow to proceed to Preview &
Image.
3. Preview & Image
The Preview & Image screen allows the user to preview an array in order to set the optimal exposure time as
well as to initiate an imaging event while providing real time array images (Figure 10).
Figure 10: Preview & Image.
Page 18

Page 18 VaxArray® Imaging and Analysis System Operation Manual CF-0159 R004
A. Open the Imaging Tray: In the box below the Preview button, select the open/close icon. This icon
opens and closes the imaging door and extends/retracts the imaging tray. The pyramid in the
bottom bar can also be used to open the imaging tray. If not already in position, place the four slide
holder such that the A1 indicator of the slide holder matches up with the A1 indicator of the tray.
Place the first slide in the left-most position with the A1 well matched to the A1 indicator. The first
slide must include the standards in wells A1 through H1 in order to accurately analyze samples in
standard analysis (Raw Analysis Mode does not require the use of standards). Click the open/close
button to close the imaging tray.
B. Preview Array Image: Click the Preview button to open the preview window (Figure 11). The
Preview operation allows adjustment of the exposure time, if necessary. Select the slide and well to
be used for the preview, then select the Camera button to display an image of the selected array.
When performing standard VaxArray analysis for protein quantitation, slide 1/well A1 is
recommended for preview, as well A1 contains the highest concentration standard and is therefore
likely to be the highest concentration sample on the entire slide. The exposure time should be
adjusted to provide large, but not saturated, signals in well A1. Signals in the range of 30,000 to
55,000 RFUs are ideal. The exposure time should be decreased if any signals are above 65,000 RFU
(saturated). After each change in exposure time, re-click the camera icon to generate a new image.
Select the Green Check once complete to preserve the specified exposure time and close the
Preview window.
a. The user may select Show Enhanced Image to generate a cropped image with false color
applied to help differentiate the antibody microarray spots.
b. If the spots appear out of focus, open the imaging tray and confirm proper placement of the
slide in the tray. If necessary, the instrument focus can be adjusted (refer to Accessing
VaxArray Imaging and Analysis System Information & Settings). The focus position is stable
during normal use, and will likely only require focus adjustment after shipping or other
instrument transport.
C. Image and Analyze VaxArray Experiment: On the Preview & Imaging view, click the Play button
(right arrowhead within double circle) to initiate imaging. As the individual wells are imaged, they
will appear in the composite to the right. Imaging progress is also indicated by the expanding arc
around the imaging circle.
Figure 11: Preview.
Enhanced Image
Page 19

Page 19 VaxArray® Imaging and Analysis System Operation Manual CF-0159 R004
a. After imaging, any errors or alerts relative to the event will be displayed in the Image QC panel
on the lower left.
b. The right side of the Preview & Imaging view (Figure 12) can be used to obtain an expanded
view of individual arrays. Clicking on an array in the slide montage (the montage is the
organized 2x8 assembly of images analogous to the scanned slide) causes the false color
image of that array to be expanded and displayed on the right side. This process may be
helpful to identify features in the image.
D. Export Raw Data: The Save Images button in the Preview & Image view (Figure 10) allows the user
to save TIFF format images of every array. The TIFF format images are the original 16-bit images. In
addition, the user is allowed to export a PNG image of each array that appears as a 24-bit RGB, or
false color, image of each array. A false color montage of 16 array images is also available for export
as a PNG file.
E. Select the Right Arrow to proceed to the Calibration Curves screen.
4. Review Calibration Curves
The Calibration Curves view generates a graph for each detection antibody to assess the general reactivity of the
antibody with the proteins contained within the standard (Figure 13). This screen will not be generated in Raw
Analysis Mode.
Figure 12: Expanded view of individual arrays. Clicking on a specific array is illustrated by the red circle.
Page 20

Page 20 VaxArray® Imaging and Analysis System Operation Manual CF-0159 R004
A. Select Target Antibodies: The antibodies on the array layout image may be selected or deselected
to show/hide the calibration curves of specific antibodies. In general, antibodies with little or no
dynamic range may be hidden as the samples will not be able to be quantitated against these
antibodies.
a. The vertical axis in the graphs is scaled based on the maximum signal for all antibodies of the
same type. For example, the vertical axis scale in Figure 11 has the same scale for the H1
antibodies and a different scale for the H3, B/Y, and B/V antibody types.
b. Hovering the mouse pointer over the graphs will allow the user to see the signal value (RFU)
for each individual data point.
c. The signals corresponding to the quantitation limit (QL) for each antibody are shown in a table
at the bottom left.
B. Standards and Samples: The calibration curves plot the signals from the standards as black
crosses/plus signs, and the signals from the samples are superimposed on the calibration curves as
colored circles.
When sample signals are near the quantitation limit or on a “plateau” region, users should
repeat the assay with modified dilution factors to place the signals closer to the middle of
the calibration curve.
C. Select the Right Arrow to proceed to the Results Summary screen.
5. Review Results Summary
The Results Summary view provides a table of results for each sample and array antibody (Figure 14). Standard
analysis will provide results in μg/mL units while Raw Analysis Mode will provide RFU (relative fluorescence unit)
values.
Figure 13: Calibration Curves.
Page 21

Page 21 VaxArray® Imaging and Analysis System Operation Manual CF-0159 R004
A. Select Target Antibodies: As with previous screens, antibodies may be selected or deselected as
necessary. Additionally, the results for specific slides can displayed or hidden.
B. Approve and Annotate: Results may be approved by selecting the Approve and Annotate button.
The user may supply a comment (“annotate”) with their approval. Approval status is displayed next
to the Approve and Annotate button. Results that have been approved are read-only and cannot be
edited.
C. Out of Quantitation Range: In some cases, numeric values for the calculated concentrations will
not be displayed in the results table. The term OQR (Out of Quantitation Range) is displayed when
the calculated concentration is less than the quantitation limit (QL). QL is based on the standard
deviation of the median signals for the blank analysis multiplied by the QL multiplier in the Analysis
Variables view (Figure 8). A value of 5 is the recommended QL multiplier. OQR is also displayed
when the sample signal falls in a section of the calibration curve that does not satisfy R2 and/or
slope cutoff requirements. OQR typically occurs when the calibration curve has an extended plateau
and the signal from the sample falls in the plateau region. Relatively flat plateau regions are prone
to large error in determining concentration, so a minimum slope criterion is applied. Similarly, poor
regression among the points in the calibration curve reduces confidence in the curve. An R2 and
Figure 14: Results Summary.
Page 22

Page 22 VaxArray® Imaging and Analysis System Operation Manual CF-0159 R004
slope cutoff are set in the Analysis Variables menu as criteria for the linear fit to the calibration
curve.
D. OFF: Occasionally the term OFF (offscale) will be listed in the results. OFF indicates that the signal
of the corresponding sample is higher than the maximal signal of the corresponding standards. In
other words, the sample signal exceeds the upper limit of the standards.
6. Results Worksheet
To export a worksheet of results, click on the Excel icon in the bottom bar highlighted in Figure 15. This will
automatically open an Excel file with all raw data, calculations, and final concentrations.
A. Excel Results in Raw Analysis Mode: Raw Analysis Mode reports the RFU signals measured by the
instrument for the different antibodies. These are reported in a table of results titled “Sample Signal
Values, Relative Fluorescent Units (RFUs)”. In addition to RFUs, a corresponding table of results is
presented that normalizes the RFU signals by the maximum fluorescence value (65535), then
multiplies by the dilution factor associated with each sample. Dilution factors are entered when
setting up the experiment. This table is referred to as “Normalized Signals (Dilution Factor
Adjusted)” and is selectable in the results view via a toggle button. The table of raw and normalized
values is included in both the Excel file and the pdf report described below.
7. Generating a Report
To generate a formatted report of the experiment, click on the Report icon (highlighted in Figure 16) on the
bottom bar. This will automatically open the report as a pdf file.
Figure 15: Export Results.
Page 23

Page 23 VaxArray® Imaging and Analysis System Operation Manual CF-0159 R004
Figure 16: Generate a Report.
Page 24

Page 24 VaxArray® Imaging and Analysis System Operation Manual CF-0159 R004
Opening Previously Run Experiments
On the Home Page, the middle button is labeled Experimental Records. Clicking on Experimental Records opens
access to the experiments database for quick retrieval of previous analyses (Figure 17). This list is searchable via
a text string or date range entered at the top of the table. Experiments can be opened by double clicking on the
associated line. The experiment will then be opened at the Calibration Curves view. The operator can review
the calibration curves and proceed to the Results Summary view. Antibodies can be selected or deselected.
Excel and Report functions are available for the re-opened experiment.
A. Annotation: The Experimental Records view also allows annotation to be added to an existing
experiment. The upper right side of the view includes a pencil icon that can be selected for
additional comments to be added to the experimental record.
B. Export Raw Data: Images of previously scanned arrays can be exported using Experimental Records.
After opening a record, the user can click the left arrow to navigate back to the Preview & Imaging
view where the Export Images button is available.
C. Delete Experiment: A user with the appropriate permissions can delete a record from the database
by right clicking on the record to be deleted and then clicking Delete Experiment. A dialogue box
prompting the user to confirm their decision to delete will be displayed. Clicking the green check will
delete the record permanently.
D. Reprocess Experiment: A user with sufficient permissions can reprocess a previous experiment with
different variables for analysis. This includes: Dilution Factors, Standard Concentrations, Analysis
Methodology, Slope Cutoff, R2 Cutoff, and QL Multiplier. These changes will be recorded as a new
entry in the results database. To reprocess an experiment, right click on the experiment you wish to
reprocess in the results database and click on Reprocess Experiment. The experimental setup screen
will appear and you can change the desired variables.
E. Delete Images: A user with sufficient permissions can delete the raw images associated with an
individual experiment. This is intended to help manage hard drive space. Once the Images for a
Figure 17: Experimental Records.
Page 25

Page 25 VaxArray® Imaging and Analysis System Operation Manual CF-0159 R004
particular experiment have been deleted, the experiment can no longer be reprocessed. To delete
the images for an experiment right click on an experiment in the database view and click Delete
Images. A dialogue box will be displayed prompting the user to confirm their decision, clicking the
green check will permanently delete the images.
F. Experiment Log: On the right side of the screen in the Experimental Records view there will be a list
of events that have occurred for the selected experiment. This record shows times and data as well
as user names for specific events corresponding to that experiment. In addition, this log will contain
any annotations recorded by users of the system.
Page 26

Page 26 VaxArray® Imaging and Analysis System Operation Manual CF-0159 R004
Accessing VaxArray Imaging and Analysis System Settings & Information
The right button on the Home Page is labeled Settings & Information. The Settings & Information screen allows
the user to access the Audit Trail, Adjust Focus, set the default Analysis Variables, and view software license
information. The audit trail can be exported as a PDF report. After opening the Settings & Information view, the
Audit Trail, Adjust Focus, and Analysis Variables buttons are in the upper left of the view.
A. Audit Trail: The Audit Trail tracks events that occur during operation of the software. Events included
in the Audit Trail are software startup, changes to instrument settings (focus, exposure time), slide
imaging, results review, experimental modification and result calculation, experimental reprocessing
and added annotations. The name of the operator and timestamp for each recorded event are also
documented (see Figure 18.)
B. Adjust Focus: Instrument focus must be checked upon receiving an instrument and after moving the
instrument. The focus position of the VaxArray Imaging and Analysis System is stable during routine
use, but periodic focus checks should be included as part of standard laboratory operations.
a. Instrument focus is based on optimizing the focus at wells positions A1, A2, and H2. To set the
instrument focus (see Figure 19):
i. Open the tray and insert a previously processed VaxArray slide in the left-most
position in the 4-slide holder
ii. Within the Settings & Information screen, select Adjust Focus
iii. If necessary, wait for the instrument to initialize
iv. To begin the focusing procedure, click the camera icon next to position A1 to bring up
an image of the microarray in position A1
v. The large screen will show an array image and a yellow square in the upper left corner
vi. With the mouse, drag the yellow square to a section of spots on the array to magnify
the selected spots in the window to the right. Move the yellow square to position the
red line through the middle of the selected spots to analyze the intensity of the spots
at the current focus position
vii. Re-click the camera icon, and several features of the view will be updated.
1. In a graph below the right window image, the intensity (red line) and first
derivative, or rate of change of the intensity (blue line) are plotted.
Figure 18: Audit Trail
Page 27

Page 27 VaxArray® Imaging and Analysis System Operation Manual CF-0159 R004
2. Next to the camera icon, the peak values of the intensity and first derivative
are displayed. These values are for the specific camera/imaging event just
performed.
3. Further to the right are the maximum peak intensity and first derivative values
obtained during this focusing process. The goal is to optimize the focus
position to yield the highest first derivative (the steepest slope change from
areas of low intensity to areas with high intensity).
viii. If the operator chooses to test alternative focus positions, change the focus position
by using the up and down arrows adjacent to the focus position number (or
highlighting the number and typing a new value).
ix. Click the camera icon and check the new visual image, peak intensity and first
derivative values for improved focus.
x. General recommendations are to avoid placing the red line across spots with odd
appearance, such as partial circles or containing bright microspots. Optimal focus can
be obtained by a combination of the visual appearance and the first derivative value.
xi. The exposure time may also be adjusted within the focus window. This may be
necessary to create sufficiently bright spots for visual focus optimization.
xii. Repeat the process for all three arrays (A1, H1, H2). After all three arrays have been
imaged, the Green Check will be displayed.
xiii. During focus adjustment, a warning message may appear (lower right, in red lettering)
if the difference between two focus position values is 0.3 (mm) or larger. This warning
can be ignored if it is a temporary condition while the operator is still adjusting focus.
If the final optimized settings are different by 0.3 (mm) or larger, contact InDevR.
xiv. When all three arrays have been focused, select the Green Check to complete the
adjustment. If no adjustment is desired, then select the Red X mark to cancel focus
adjustment.
C. Analysis Variables: This menu allows a user with sufficient permissions to set the default variables
used in analysis. The variables that can be set in this menu are: Analysis Methodology, R2 Cutoff, Slope
Cutoff, and QL Multiplier. See section 2B for a description of these variables.
Figure 19: Adjust Focus.
Page 28

Page 28 VaxArray® Imaging and Analysis System Operation Manual CF-0159 R004
Managing User Accounts
Adding a new User
1. Log-in to the computer with an Administrator account
2. Within the Windows search field, type “lusrmgr.msc” (See Figure 20) and press Enter
3. Right click on the Users folder
4. Select New User
5. Enter in appropriate information (i.e. usernames/passwords)
6. Select Create
Removing a User
1. Log-in to the computer with an Administrator account
2. Within the Windows search field, type “lusrmgr.msc” and select Enter
3. Double click on the Users folder
4. Right click on the user to be deleted
5. Select Remove
6. Select Yes in the prompted dialog
Adding a User to a Specific User Group
1. Log-in to the computer with an Administrator account
2. Within the Windows search field, type “lusrmgr.msc” and select Enter
3. Double click on the Groups folder
4. Double click the desired group (i.e. VaxArrayOperator, VaxArraySetupExperiment, etc…)
5. Select Add
6. Type the user name you wish to add in the field labeled ‘Enter the object names to select’
7. Select Check Names
8. Verify the user name is underlined
9. Select OK
Figure 20: User Manager
Page 29

Page 29 VaxArray® Imaging and Analysis System Operation Manual CF-0159 R004
Changing Administrator Privileges
1. Log-in to the computer with an Administrator account
2. Select the Windows Start icon
3. Select Control Panel
4. Select the link Add or remove user accounts under the User Accounts header
5. Select the user that requires a change
6. Select Change the Account Type
7. Select the appropriate radio button to change the user account type
Permissions
By default there are two users created on the VaxArray System:
Username
Password
Admin
58gs31tw
ArrayReader (VaxArray)
02fe79bc
Each of the groups in the following list permits the users to perform a single action or group of related
actions. Members in any single group are not explicitly permitted to perform any of the actions in another
group. In other words, the listed groups are not inclusive where a “higher level” group includes actions
permitted by a “lower level” group. For example, a member of VaxArrayRunExperiment is allowed to
perform imaging, but is not permitted to enter experimental variables unless also added to
VaxArraySetupExperiment group. To perform all functions of the software, a user would need to be added
to all groups.
Note: Windows security groups and users are organized in a hierarchical manner. In order to make
administration of VaxArray permissions easier, you can alternatively create your own groups that batch
several types of VaxArray groups together. For instance, you could create a group called VaxArrayUsers, and
add to it the groups VaxArrayOperators, VaxArraySetupExperiment and VaxArrayRunExperiment. Then any
users added to VaxArrayUsers would be allowed to run the software, create experiments and run them.
Groups
Group: VaxArrayOperators
Description: These users are allowed to open the software.
Group: VaxArraySetupExperiment
Description: These users are allowed to create an experiment and setup initial values in the
Experiment Setup View. They are not explicitly allowed to perform scans and obtain results for the
experiment.
Group: VaxArrayRunExperiment
Description: These users are allowed to open an already created experiment and perform imaging
(and obtain results). They are not explicitly allowed to create a new experiment.
Group: VaxArrayModifyExperiment
Page 30

Page 30 VaxArray® Imaging and Analysis System Operation Manual CF-0159 R004
Description: These users are allowed to edit the parameters of an experiment before it is closed or
saved. They are not explicitly allowed to run or create an experiment.
Group: VaxArrayAdjustFocus
Description: These users are allowed to enter the focus adjustment dialog and make changes to
the focus settings.
Group: VaxArrayAnnotateRecords
Description: These users are allowed to add annotations to experiments.
Group: VaxArrayReviewers
Description: These users are allowed to mark experiments as reviewed.
Group: VaxArrayDeleteRecords
Description: These users are allowed to delete experimental records.
Group: VaxArrayChangeAnalysisVariables
Description: These users are allowed to change the analysis variables of an experiment. They are
also allowed to change the default analysis variables.
Group: VaxArrayReprocess
Description: These users are allowed to reprocess old experiments using new variables.
Recommended Groups
The following section details recommendations about which user permissions are assigned to different user
profiles. These are only recommendations and the exact details of which user permissions are assigned to
each user will be dependent on the individual requirements of each customer.
Basic user
This user will be able to open the software, setup and run an experiment, generate results and modify
experiments that have been setup (but not yet run), and add notes to experiments.
Add these users to the following groups: VaxArrayOperators, VaxArraySetupExperiment,
VaxArrayRunExperiment, VaxArrayModifyExperiment, VaxArrayAnnotateRecords
Service Level User
This user will have access to all of the above functions, but will also have permission to adjust the focus of
the instrument and delete records.
Add these users to the following groups: VaxArrayOperators, VaxArraySetupExperiment,
VaxArrayRunExperiment, VaxArrayModifyExperiment, VaxArrayAnnotateRecords,
VaxArrayDeleteRecords, VaxArrayAdjustFocus, VaxArrayReprocess
Administration Level User
This user will have access to all of the above functions but will also have permission to mark the results of an
experiment as Reviewed.
Add these users to the following groups: VaxArrayOperators, VaxArraySetupExperiment,
VaxArrayRunExperiment, VaxArrayModifyExperiment, VaxArrayAnnotateRecords,
VaxArrayDeleteRecords, VaxArrayAdjustFocus, VaxArrayReviewers,
VaxArrayChangeAnalysisVariables, VaxArrayReprocess
Page 31

Page 31 VaxArray® Imaging and Analysis System Operation Manual CF-0159 R004
Troubleshooting, Cleaning, and Service
Failure to Find an Array
The VaxArray Imaging and Analysis Software automatically finds the antibody spots in the arrays and uses the
spot locations to determine signal intensities. Occasionally, the antibody spots are not automatically located
within an array. Several alerts indicate when this occurs. During Preview, failure to find spots of the selected
array (usually A1) is indicated by the error message Image Processing Failure shown in the QC alerts. In
addition, the selection text Show Enhanced Image will be inactive (gray) indicating that a cropped false color
image cannot be shown. During imaging of the full slide, failure to find spots is indicated by similar alerts.
For the specific arrays that fail, “Image Processing Failure” is displayed as a QC alert, and the composite
image of each slide will have boxes with the red text “Error!” for arrays where the false color images would
normally be shown.
When the antibody spots of an array are not found, the signals are not measured. Therefore, no information
is present for analysis of those arrays.
Several factors can cause spots within an array to not be found. Some examples are:
• The fiducial spots may be inadequate or non-existent due to:
o Insufficient amount of fiducial label in the label mix
o Short exposure times resulting in low fiducial signals
o Array printing errors
o Pipette tip or other damage to the microarray surface in the area(s) of the fiducial spots.
• Image artifacts due to:
o Large numbers of bright spots throughout the image background
o Pseudo-fiducial spots similar in location and size to actual fiducial spots. These can be caused
by “lint” or other significant artifacts that may cause scattering, and can lead to spot finding
failure or misalignment. The spots may be found but the determined locations are actually
incorrect.
Any array can be viewed in the Preview mode, and viewing arrays that failed spot finding may help
troubleshoot the cause of the failure.
Cleaning
The outside surface of the housing can be cleaned with a damp cloth or with one of the following cleaning
agents or their equivalent:
• Dishwashing detergent
• Isopropyl alcohol (70% solution)
• Bleach (10% solution)
• Window cleaning solution (with isopropyl alcohol and ammonia)
• Hydrogen peroxide (3% solution)
Service
There are no user-serviceable parts inside the VaxArray Imaging and Analysis System. If the instrument does
not work properly contact InDevR service for assistance or to obtain an RMA number.
Page 32

Page 32 VaxArray® Imaging and Analysis System Operation Manual CF-0159 R004
If you need to ship your instrument, please contact InDevR service for further instructions at
techsupport@indevr.com or by calling 303-402-9100.
Shipping
To prevent damage during movement or shipment, the transportation lock screws for the
imaging tray must be in place. When shipping, use of the original manufacturer packaging is
recommended.
To prepare the instrument for shipment or movement, proceed as follows:
A. Switch off the power switch at the rear of the instrument and remove the power cord.
B. Remove the monitor, mouse, keyboard, Ethernet, and power connections from the instrument.
C. Remove the transparent plastic cap which covers the opening for the lock screw on the right side of
the housing.
D. Manually open the imaging door and use fingers to gently push the motorized stage into the rear right
position. The threads should now be in the correct position to insert the lock screws.
E. Remove the two lock screws from their placeholders on the rear of the instrument.
F. Lock the motorized stage by tightly screwing the two knurled screws into the openings on the right
and rear side of the housing.
G. Repack the instrument into the original packaging in the same way it was delivered.
H. If returning the instrument to InDevR, fill out the RMA (contact InDevR for this form).
Proper Disposal of the Instrument
You must dispose of the VaxArray Imaging and Analysis System properly according to local
laws and regulations. Because the instrument contains electronic components, it must be
disposed of separately from laboratory waste. When the instrument reaches its end of life,
take it to a collection point designated by local authorities for the recycling of electronic
equipment. The improper disposal of waste electronic equipment from the consumer may be
subject to fines. The separate collection and recycling of the instrument will help conserve
natural resources and ensure that it is recycled in a manner that protects human health and the environment.
Page 33

Page 33 VaxArray® Imaging and Analysis System Operation Manual CF-0159 R004
Trademarks
Windows and Windows 7 are registered trademarks of Microsoft Corporation in the United States and other
countries. VaxArray is a registered trademark of InDevR.
Specifications
Imaging System:
Resolution on the sample
6.7 μm/Pixel
Camera pixel resolution
1.3 Mpixel
Excitation/Emission:
High Power LEDs
Model
Excitation wavelength (singleband) in nm
Emission detection wavelength
(dual-band resp. triple-band) in nm
Green/Red
510 – 540
570 – 600
Mechanical dimensions:
Width
440 mm
Depth
340 mm
Height
200 mm
Weight (without monitor)
15 kg
An additional 4 inches (100 mm) of space must be provided in front and back of the instrument and
an additional 2 inches (50 mm) on the left for cables and ventilation.
Ambient conditions:
Pollution degree
2 Operation:
Environmental conditions
Indoor use only
Temperature
+15°C to +35°C
Relative humidity
10% to 75% non-condensing
Altitude
Operating at max. 2000 m above sea level
Barometric pressure
795 hPa to 1060 hPa
Storage:
Temperature
+5°C to +40°C
Relative humidity
10% to 95% non-condensing
Barometric pressure
700 hPa to 1060 hPa
Waiting time until operation
8 hr
Shipping:
Temperature
-40°C to +60°C
Relative humidity
10% to 95% non-condensing
Barometric pressure
700 hPa to 1060 hPa
Waiting time until operation
24 hr
Electrical:
Page 34

Page 34 VaxArray® Imaging and Analysis System Operation Manual CF-0159 R004
AC input
Installation category
100-240V, 47-63 Hz
II
Input mains fluctuation
Max. 10%
Input power
Max. 150 W
Fuse type and rating
Two fuses, 5x20 mm, T4H250V (4A slow-blow)
Result data:
Image storage format
16 bit TIFF grayscale
Results storage format
CSV spreadsheet, pdf files, .xml spreadsheet
Internal PC specifications:
Embedded PC
miniITX PC
Operating system
Windows 7 embedded, pre-installed
Processor
Intel Celeron Dual-Core T3100 1.9 GHz (or
higher)
RAM
2 x 2 GByte DDR3
Hard Disk
250 GByte or larger
Interfaces
4x USB2 (4 internal)
VGA Monitor output,
PS/2 for keyboard and mouse
RS-232 Serial
1000 Base-T Ethernet
 Loading...