

Implen NanoPhotometer, P 330, P-Class, P 300, P 360 User Manual
telephone: + 49-89-726 3718 0 Fax. + 49-89-726 3718 54 Email: info@implen.de www.implen.de
NanoPhotometer® P-Class
User Manual
P 300 / P 330 / P 360
Version 2.1
P 360
P 300
P 330

NanoPhotometer® P-Class User Manual
Version 2.1 Page 2 / 70
Implen GmbH Schatzbogen 52 D-81829 Germany
Declaration of conformity for the NanoPhotometer® P-Class (P300/P330/P360)
This is to certify that the Implen NanoPhotometer® P-Class conforms to the requirements of the following Directives:
2014/35/EU Low Voltage directive (LVD)
2014/30/EU Electromagnetic Compatibility directive (EMC)
2011/65/EU Restriction on the use of certain hazardous substances in Electrical and Electronical
Equipment directive (RoHS)
2012/19/EU Waste electrical and electronic equipment directive (WEEE)
By ensuring this product is disposed of correctly, you will help prevent potential
negative consequences for the environment and human health, which could otherwise
be caused by inappropriate waste handling of this product.
2006/42/EC Machinery directive
1995/5/EC Radio and Telecommunications Terminal Equipment Directive (instruments fitted with
Bluetooth accessory only).
Standards to which conformity is declared, where relevant, are as follows:
EN 61010-1:2010 Safety requirements for electrical equipment for measurement, control and laboratory
use, General Requirements
EN 61010-2-101:2002 Safety requirements for electrical equipment for measurement, control and laboratory
use. Particular requirements for in vitro diagnostic (IVD) medical equipment
IEC 61010-1(ed. 3) Report: TRA-006858; CB Certificate: GB-TRAC 0246
UL 61010-1/CSA C22.2 No. 61010-1 Report: 25436; Listing: E113393
EN 61326-1:2013 Electrical equipment for measurement, control and laboratory use –EMC
requirements (class B)
EN ISO 12100:2010 Safety of machinery-General principles for design, risk assessment and risk reduction
For further information, including unpacking, positioning and installation of the products please refer to the user
manual.
Signed: Dated: June 21, 2016
Dr. Thomas Sahiri
Managing Director
Implen GmbH

NanoPhotometer® P-Class User Manual
Version 2.1 Page 3 / 70
TABLE OF CONTENTS
1. ESSENTIAL SAFETY NOTES ............................................................................................................................................... 5
Unpacking, Positioning and Installation ..................................................................................................... 5
2. INTRODUCTION .................................................................................................................................................................. 6
2.1 Your spectrophotometer ..................................................................................................................... 6
2.2 Sample handling tips .......................................................................................................................... 6
2.3 Keypad and display for NanoPhotometer® P 300 ............................................................................. 7
2.4 Keypad and display for NanoPhotometer® P 330 /P 360 ................................................................. 8
2.5 Menu/Options ....................................................................................................................................... 9
3. THE NANOPHOTOMETER® P-CLASS SUBMICROLITER CELL ........................................................................................ 10
3.1 Technical instructions ...................................................................................................................... 10
3.2 Software instructions ........................................................................................................................ 11
4. NANOVOLUME APPLICATIONS AND CUVETTE APPLICATIONS .................................................................................... 13
4.1 Characterization of DNA, RNA and Oligonucleotides ................................................................... 13
4.1.1 General Information ................................................................................................................ 13
4.1.2 Analysis of dsDNA, ssDNA and RNA ..................................................................................... 15
4.1.3 Analysis of Oligonucleotides ................................................................................................... 16
4.1.4 Dye incorporation for dsDNA, ssDNA, RNA and Oligonucleotides ......................................... 17
4.2 Protein Determination ....................................................................................................................... 19
4.2.1 General Information ................................................................................................................ 19
4.2.2 Protein UV Method .................................................................................................................. 20
4.2.3 Protein UV Dye Method .......................................................................................................... 22
7.3.4 BCA Assay .............................................................................................................................. 24
7.3.5 Bradford Assay ........................................................................................................................ 27
7.3.6 Lowry Assay ............................................................................................................................ 30
7.3.7 Biuret Assay ............................................................................................................................ 33
4.3 Bacterial Cell Culture Measurement (OD600) ................................................................................. 36
4.3.1 General Information ................................................................................................................ 36
4.3.2 Analysis of Bacterial Growth ................................................................................................... 37
5. FUNCTIONS ...................................................................................................................................................................... 38
5.1 Single Wavelength – Abs and %T .................................................................................................... 39
5.2 Concentration .................................................................................................................................... 41
5.3 Wavescan ........................................................................................................................................... 43
5.4 Kinetics ............................................................................................................................................... 46
5.5 Standard Curve .................................................................................................................................. 48
5.6 Multiple Wavelength .......................................................................................................................... 51
5.7 Absorbance Ratio .............................................................................................................................. 53
6. USER METHODS .............................................................................................................................................................. 55
7. UTILITIES .......................................................................................................................................................................... 56
7.1 Date and Time .................................................................................................................................... 57
7.2 Regional .............................................................................................................................................. 57
7.3 Output Options / Printer .................................................................................................................... 57
7.3.1 NanoPhotometer® P 300 ......................................................................................................... 57
7.3.2 NanoPhotometer® P 330 /P 360 ............................................................................................. 58
7.3.3 Loading / changing the printer paper ...................................................................................... 59
7.4 Preferences ........................................................................................................................................ 60
7.5 Contrast .............................................................................................................................................. 60
7.6 About .................................................................................................................................................. 60
8. MAINTENANCE ................................................................................................................................................................. 61
8.1 Maintenance-free Technology .......................................................................................................... 61
8.2 Lamp Replacement ............................................................................................................................ 61
8.3 Mixer replacement ............................................................................................................................. 61
8.4 Exchange of the gaiter ...................................................................................................................... 61
8.5 Cleaning and general care of the instrument ................................................................................. 62
8.6 Error messages ................................................................................................................................. 63

NanoPhotometer® P-Class User Manual
Version 2.1 Page 4 / 70
8.7 Trouble shooting ............................................................................................................................... 64
9. ACCESSORIES .................................................................................................................................................................. 64
10. SPECIFICATION AND WARRANTY .................................................................................................................................. 65
11. SOLVENT COMPATIBILITY ............................................................................................................................................... 66
12. APPENDIX ........................................................................................................................................................................ 67
12.1 Nucleic acid quantification ............................................................................................................... 67
12.2 Nucleic acid fluorescent dye incorporation .................................................................................... 67
12.3 Protein quantification ........................................................................................................................ 69
12.4 Protein fluorescent dye incorporation ............................................................................................ 69

NanoPhotometer® P-Class User Manual
Version 2.1 Page 5 / 70
1. ESSENTIAL SAFETY NOTES
There are a number of warning labels and symbols on your instrument. These are there to inform you where potential
danger exists or particular caution is required. Before commencing installation, please take time to familiarise yourself
with these symbols and their meaning.
Caution (refer to accompanying documents).
Background colour yellow, symbol and outline black.
Unpacking, Positioning and Installation
Check the contents of the package against the delivery note. If any shortages are discovered, inform your supplier
immediately.
Inspect the instrument for any signs of damage caused in transit. If any damage is discovered, inform your supplier
immediately.
Ensure your proposed installation site conforms to the environmental conditions for safe operation:
Indoor use only.
Temperature range 5°C to 35°C. Note that if you use the instrument in a room subjected to extremes of
temperature change during the day, it may be necessary to recalibrate (by switching off and then on again) once
thermal equilibrium has been established (2-3 hours).
Maximum relative humidity of 80% up to 31°C decreasing linearly to 50% at 40°C.
The instrument must be placed on a stable, level bench or table that can take its weight (< 4.5 kg) so that air can
circulate freely around the instrument.
The equipment should be positioned such that in the event of an emergency the mains plug can be easily located
and removed
This equipment must be connected to the power supply with the power cord supplied. It can be used on 90 – 240
V, 50-60 Hz supplies.
If the instrument has just been unpacked or has been stored in a cold environment, it should be allowed to come to
thermal equilibrium for 2-3 hours in the laboratory before switching. This will prevent calibration failure as a result
of internal condensation.
Switch on the instrument via the keypad ( ) after it has been plugged in. The instrument will perform a series of
self-diagnostic checks.
Please read through this user manual prior to use.
Please contact your original supplier in the first instance if you experience technical or sample handling difficulties.
If this equipment is used in a manner not specified or in environmental conditions not appropriate for safe operation,
the protection provided by the equipment may be impaired and instrument warranty withdrawn.
NanoPhotometer® P-Class User Manual
Version 2.1 Page 6 / 70
2. INTRODUCTION
2.1 Your spectrophotometer
Your spectrophotometer is a simple-to-use UV/Visible instrument with a CCD array detector (1024 pixels). It has no
moving parts, which is the basis of the rapid scanning operating system.
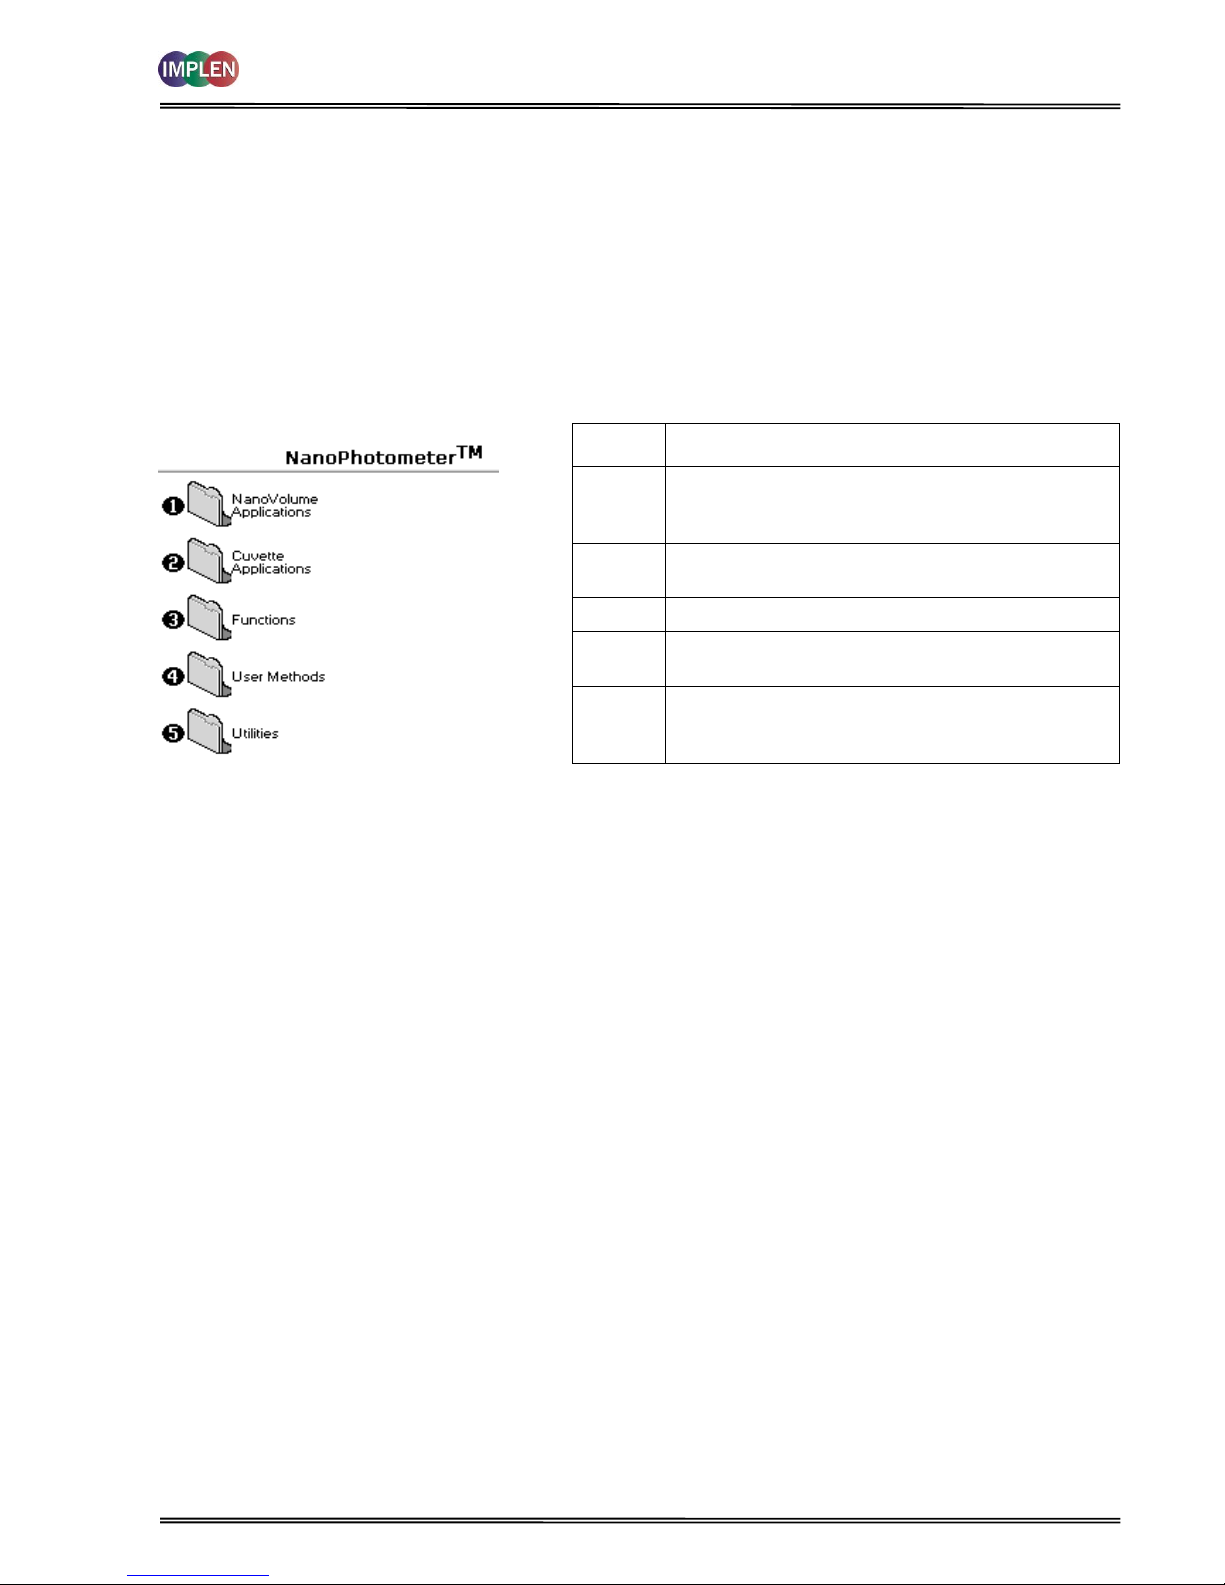
The user interface is built around folders which are displayed on the main screen when the instrument is switched on.
Different folders are numbered and opened by using the associated number key on the keypad. After switch ing on the
NanoPhotometer® a self-calibration check is performed and the default main screen "NanoPhotometer®” is offering
the choice of:
Keypad
number
Description
1
Life Science methods such as nucleic acid assays
and protein assays using the NanoPhotometer® PClass Submicroliter Cell
2
Life Science methods such as nucleic acid assays,
protein assays and cell density using cuvettes
3
General spectroscopic methods
4
Contains nine folders that can store user adapted
methods (up to 81)
5
Instrument set up (date, time, number format),
Output Options and Baseline Compensation set up.
The instrument is equipped with a standard USB port (back) and the P330/P360 also with a USB flash drive port (right
side). The NanoPhotometer® P-Class Software Package is necessary to connect the NanoPhotometer® P-Class to a PC
or to read the saved data on the USB flash drive. The software enables the user to “print through” the PC directly to the
printer that is connected to it. Data may be stored as Excel spreadsheet (report and/or table format), EMF graphics file,
a comma delimited (csv) data file, a tab delimited (txt) data file or in native NanoPhotometer® P-Class Software format
for later access (see also NanoPhotometer® P-Class PVC Installation and User Manual).
Alternatively, results may be saved on a SD Memory Card (P300 only) or sent to the PC via a Bluetooth (P300 only)
accessory; these can either be supplied pre-installed or are available as an optional accessory if the need for the use
arises after installation of the product.
A thermal built-in printer is available for the instrument; this may either be supplied pre-installed or is available as an
optional accessory if the need for its use arises after installation of the product.
2.2 Sample handling tips
The NanoPhotometer
®
P-Class includes an integrated vortexer (P 330 / P 360 only) to assure a good homogeneity
of the sample. It is recommended to mix every sample before a measurement.
Note that the light beam is directed from RIGHT to LEFT through the cell chamber; therefore please ensure the
measurement cell is inserted in the correct alignment.
Insert the measurement cell always in the same direction.
The cell holder supplied with the instrument accepts the NanoPhotometer
®
P-Class Submicroliter Cell and standard
10 mm pathlength quartz, glass or plastic cells.
The optical height of the NanoPhotometer
®
P-Class is 15 mm.
The minimum volume that can be used is 0.3 µl with the NanoPhotometer
®
P-Class Submicroliter Cell.
12 mm test tubes may be used (e.g. for cell cultures), however they are not recommended as higher quality data is
produced by using disposable cuvettes for the analysis. If used, align the indicator line on 12 mm test tubes in the
same direction to ensure reproducible positioning of the tube. Note that test tubes do not last forever, and that the
surface becomes scratched and blemished through repetitive use; if this is the case they should be replaced.
NanoPhotometer® P-Class User Manual
Version 2.1 Page 7 / 70
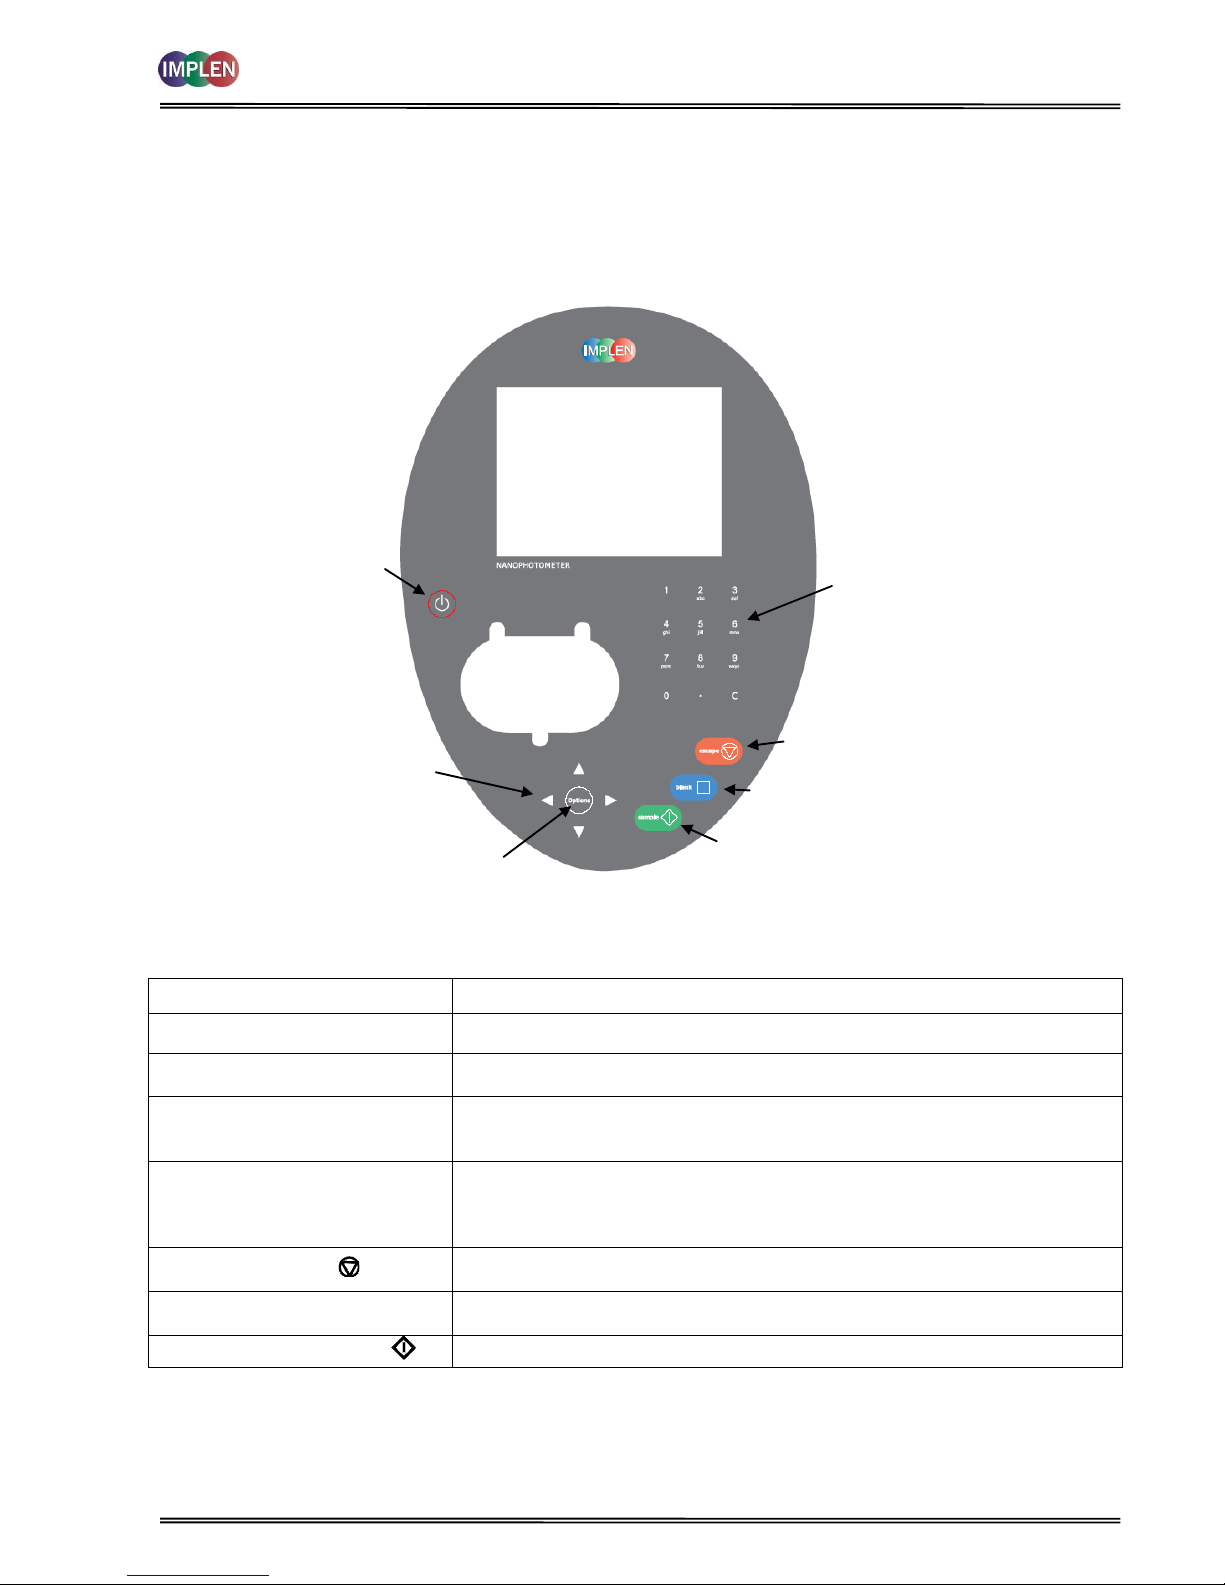
2.3 Keypad and display for NanoPhotometer
®
P 300
The back-lit liquid crystal display is very easy to navigate around using the alphanumeric entry and navigation arrow
keys on the hard wearing, spill proof membrane keypad.
Key
Action
On/off key
Turns the instrument on/off.
Arrow keys
Use the four arrow keys to navigate around the display and select the required
setting from the active (highlighted) option.
View Options
View options for that application mode. Some of these are common to all
applications and described on page 8. Menu unique to an application are
described in the relevant section of the NanoPhotometer® P-Class User Manual.
Alphanumeric keys
Use these to enter parameters and to write text descriptions where appropriate,
or required. Use repeated key presses to cycle through lower case, number and
upper case. Leave for 1 second before entering next character. Use C button to
backspace and 1 to enter a space.
Escape/Cancel/Back:
Escape from a selection and return to the previous folder. Cancel a selection.
Stop making measurements.
Blank/Reference
Set reference to 0.000 A or 100%T on a reference solution at the current
wavelength in the mode selected. When in scan mode, does a reference scan.
Sample/Enter selection/OK:
Enter, or confirm a selection. Take a measurement.
ON/OFF key
Arrow keys
View options
Alphanumeric keys
Escape/Cancel/Back
Blank/Reference
Sample/Enter selection/OK
LCD Display
Cellholder
NanoPhotometer® P-Class User Manual
Version 2.1 Page 8 / 70
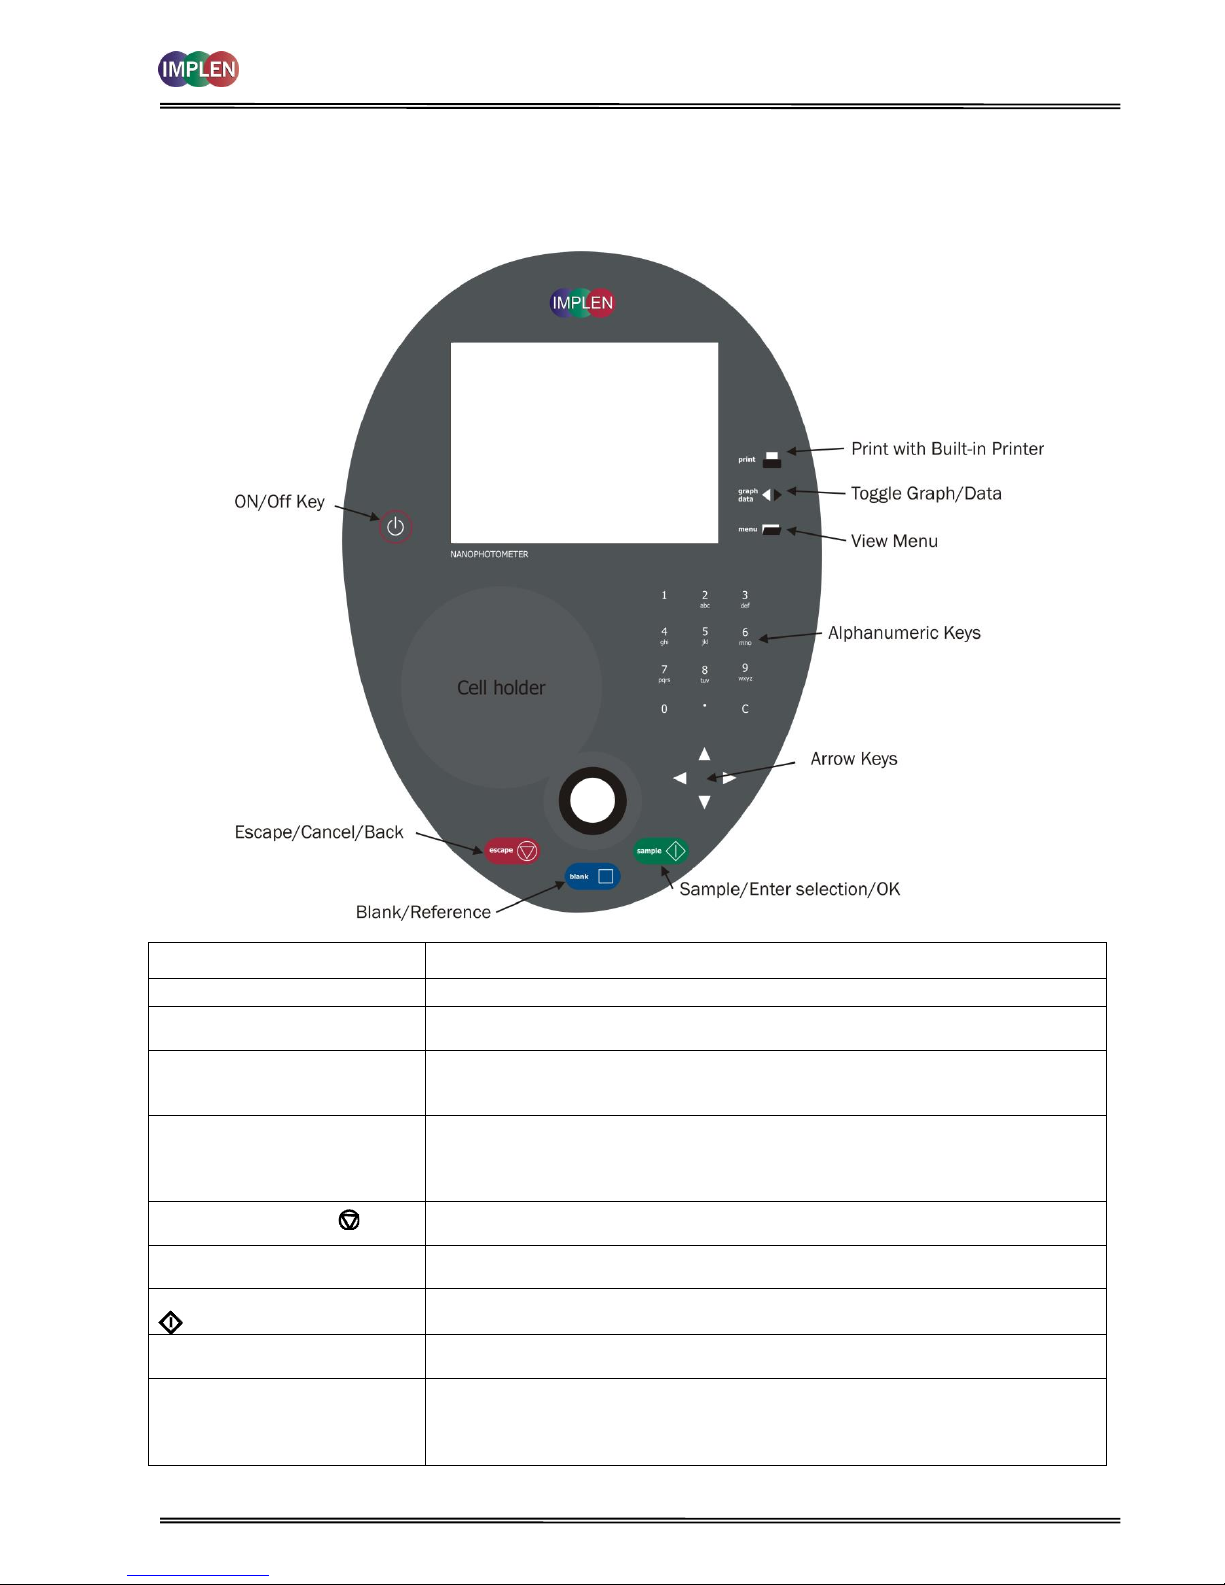
2.4 Keypad and display for NanoPhotometer
®
P 330 /P 360
The back-lit liquid crystal display is very easy to navigate around using the alphanumeric entry and navigation arrow
keys on the hard wearing, spill proof membrane keypad.
Key
Action
On/Off Key
Turns the instrument on/off.
Arrow Keys
Use the four arrow keys to navigate around the display and select the required
setting from the active (highlighted) option.
View Menu
View menu for that application mode. Some of these are common to all
applications and described on page 8. Menu unique to an application are
described in the relevant section of the NanoPhotometer® P-Class User Manual.
Alphanumeric Keys
Use these to enter parameters and to write text descriptions where appropriate,
or required. Use repeated key presses to cycle through lower case, number and
upper case. Leave for 1 second before entering next character. Use C button to
backspace and 1 to enter a space.
Escape/Cancel/Back:
Escape from a selection and return to the previous folder. Cancel a selection. Stop
making measurements.
Blank/Reference
Set reference to 0.000 A or 100%T on a reference solution at the current
wavelength in the mode selected. When in scan mode, does a reference scan.
Sample/Enter Selection/OK:
Enter, or confirm a selection. Take a measurement.
Print
(P 330 and P 360 only)
Prints the results shown on the screen on the built-in printer, if a built-in printer is
connected to the NanoPhotometer®.
Graph/Data
(P 330 and P 360 only)
Toggle graph on/off. The graph shows a wavescan plot across the range 220 nm
to 400 nm (for Dye methods 220 nm to 750 nm) with cursors denoting 230, 260,
280 and 320 nm (Nucleic Acid methods) and 260, 280 and 320 nm (Protein
methods).
vortexer
NanoPhotometer® P-Class User Manual
Version 2.1 Page 9 / 70
2.5 Menu/Options
(select using key pad numbers)
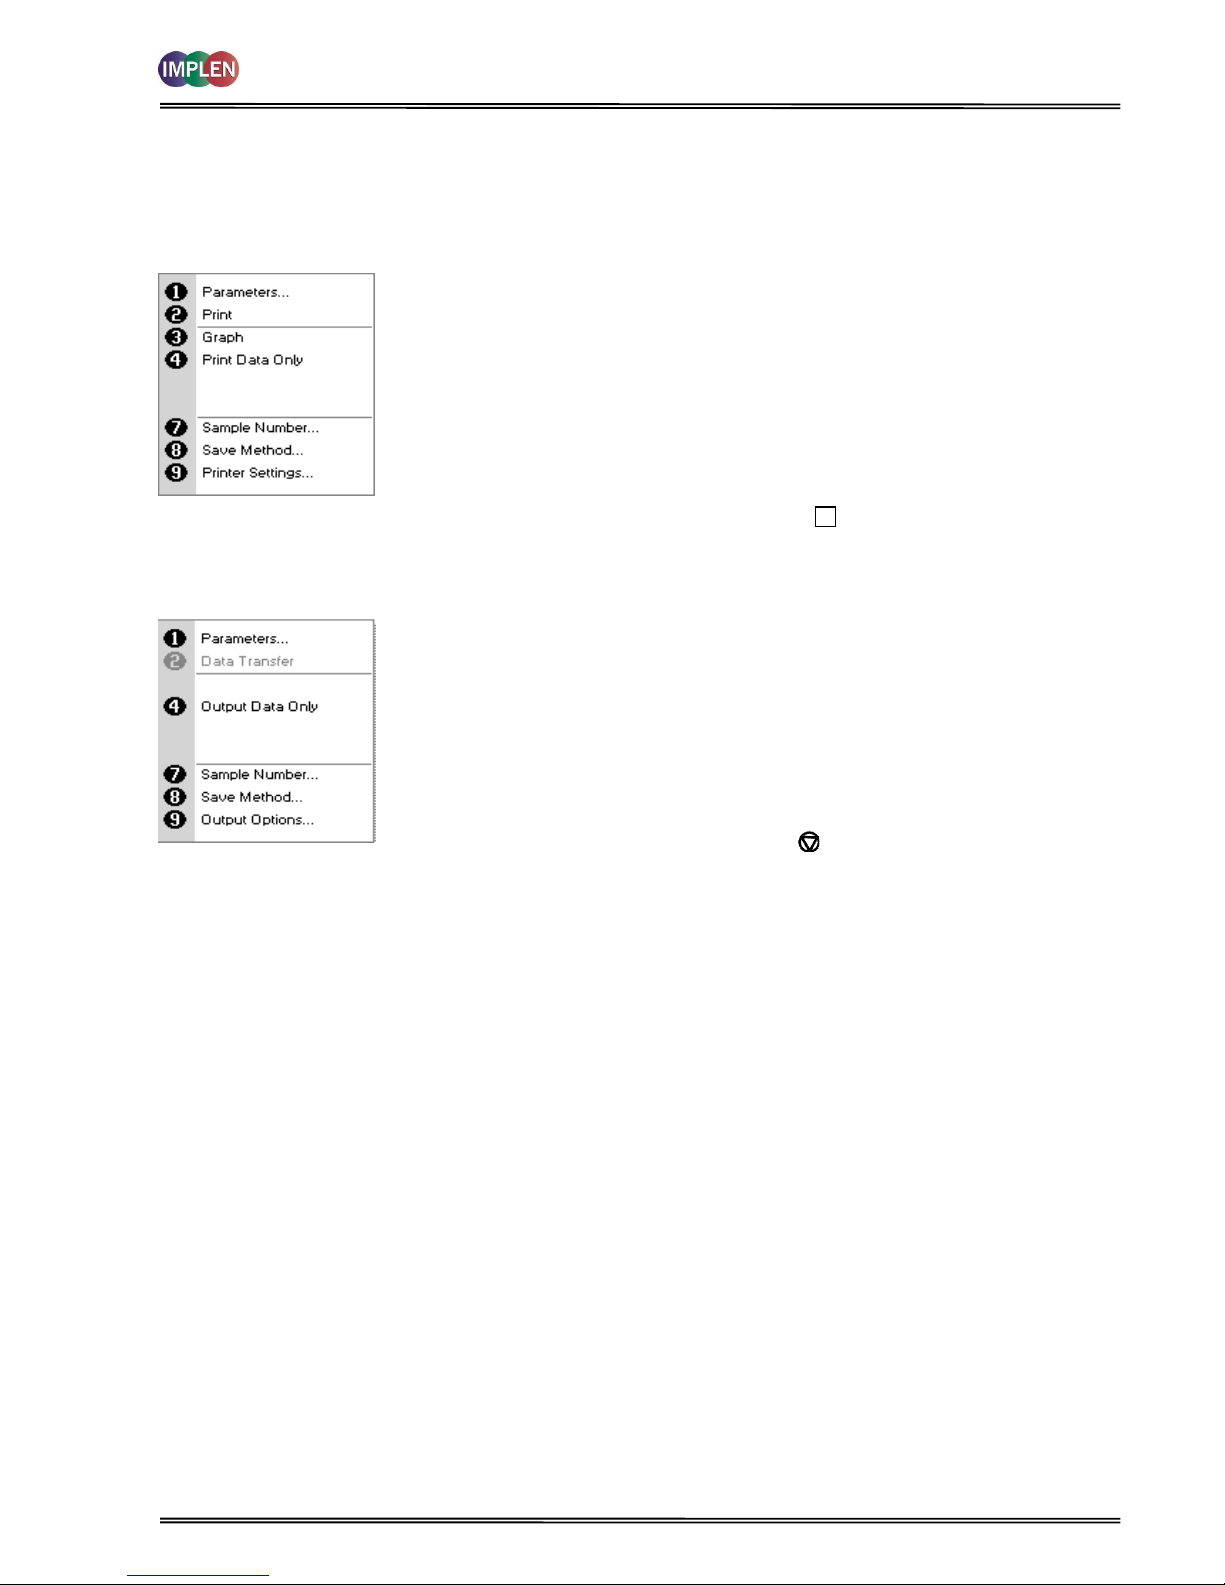
Options for P 300:
After each measurement the following Options are possible:
1) Return to parameter screen.
2) Print the results via selected method.
3) Toggle graph on/off. Graph shows a wavescan plot across the
range 220 nm to 400 nm (for Dye methods 220 nm to 750 nm)
with cursors denoting 230, 260, 280 and 320 nm
4) Toggle on/off the graph in the print-out or saved file.
7) Define the sample number you wish to start from.
8) Save the parameters as a method.
9) Open printer settings, possibility to change the printer settings
within the method as described in 7.3 Output Options / Printer.
Exit Options by pressing Escape , OR wait
Menu options for P 330/P 360:
After each measurement the following options are possible in the
Menu:
1) Return to parameter screen.
2) Transfer the results via selected Output Option.
4) Toggle on/off the graph in the print-out or saved file.
7) Define the sample number you wish to start from.
8) Save the parameters as a method.
9) Open Output Options settings, possibility to change the Output
Options settings within the method as described in 7.3 Output
Options / Printer
Exit Menu by pressing Escape , OR wait
NanoPhotometer® P-Class User Manual
Version 2.1 Page 10 / 70
3. THE NANOPHOTOMETER
®
P-CLASS SUBMICROLITER CELL
With its innovative optical pathway the cell is designed for optimum measurement results with submicroliter samples
ranging from 0.3 µl up to 5 µl of undiluted sample. Due to a pathlength of 0.04 mm, 0.1 mm, 0.2 mm, 1 mm and 2
mm the cell is offering an automatic dilution of 1/250, 1/100, 1/50, 1/10 and 1/5 in comparison to a standard
cuvette measurement. Because the measurements are processed with undiluted samples, the reproducibility of the
results is extremely high. If desired, samples can be retrieved after the measurement for further processing. The
NanoPhotometer® P-Class Submicroliter Cell can be used for all UV/Vis analysis utilizing the wavelength range of
190 nm to 1,100 nm.
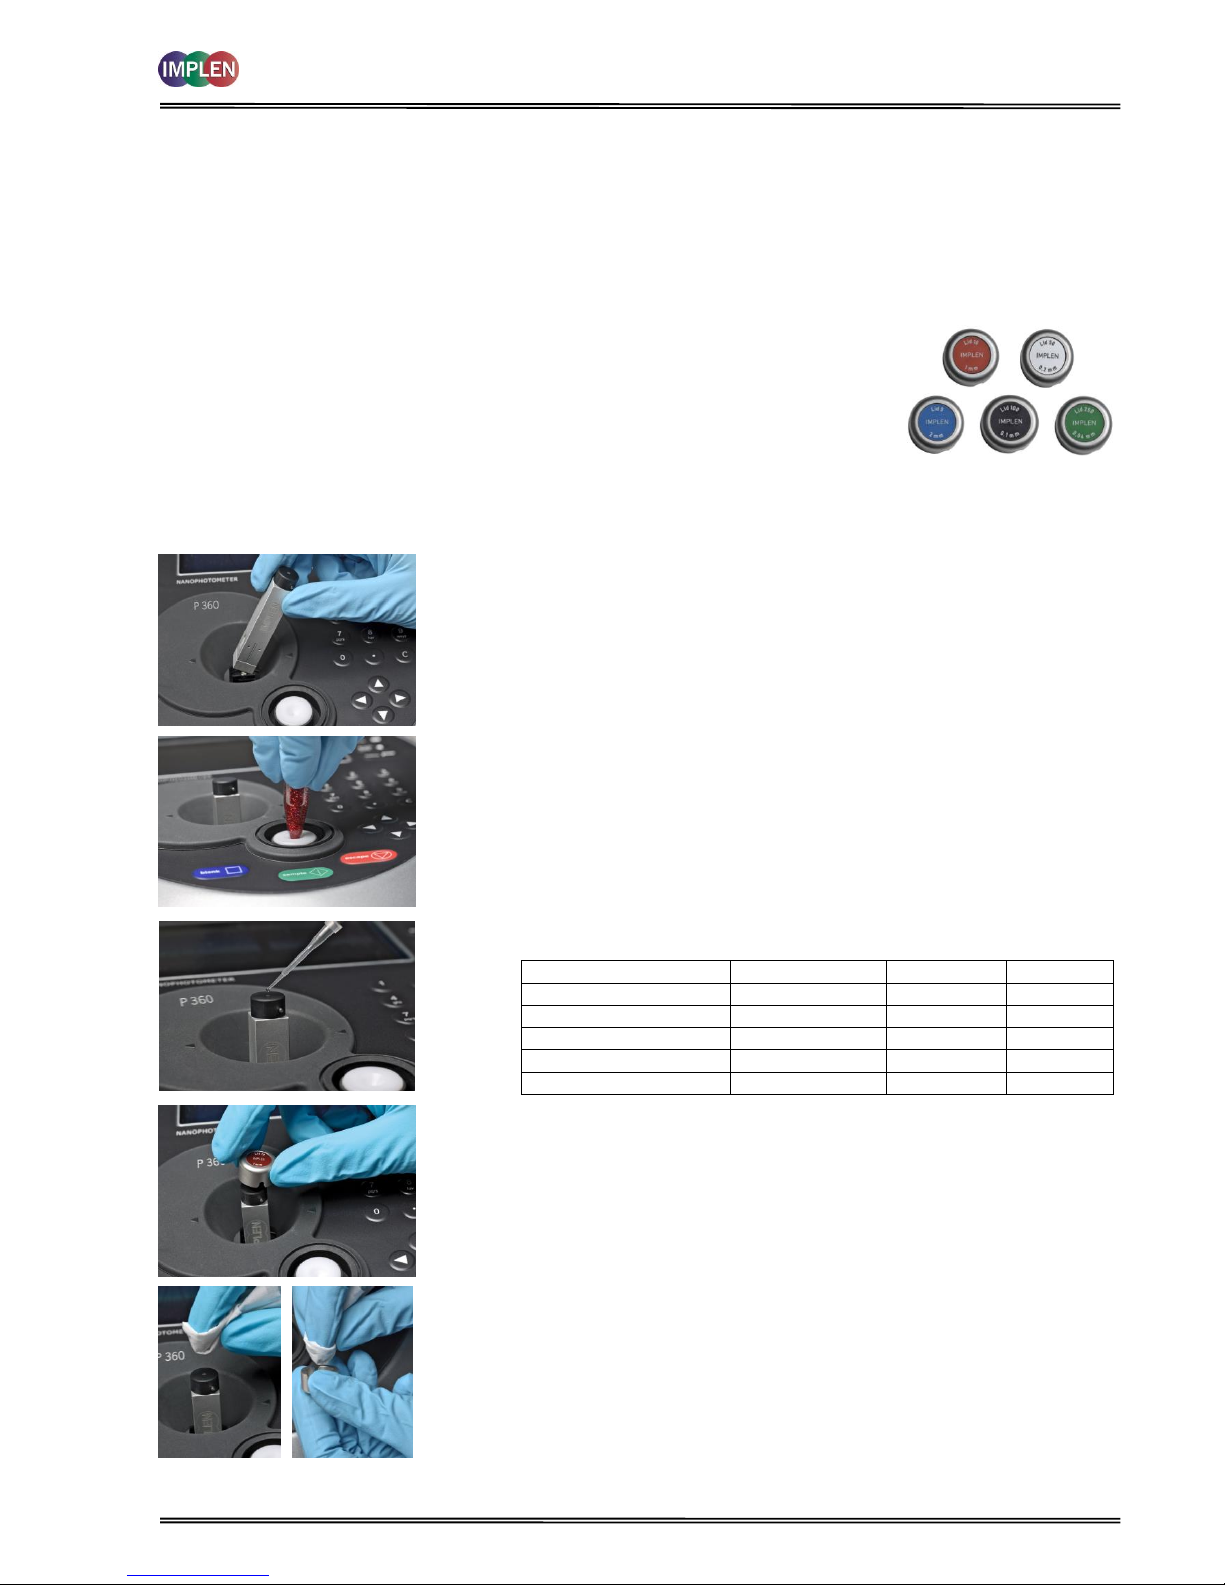
The NanoPhotometer® P-Class Submicroliter Cell is delivered for version P 300 with one lid
with a pathlength of 0.2 mm (Lid 50), for version P 330 with two lids pathlength 0.2 mm
(Lid 50) and 1 mm (Lid 10) and for version P 360 with three lids pathlength 0.04 mm (Lid
250), 0.2 mm (Lid 50) and 0.1 mm (Lid 10). Lid 5 (2 mm pathlength), Lid 100 (0.1 mm
pathlength) and Lid 250 (0.04 mm) can be ordered optionally. The dilution factor (lid
factor) is printed on the lid. Please make sure that you use the appropriate lid for your
sample.
3.1 Technical instructions
Step 1
Insert the NanoPhotometer® P-Class Submicroliter Cell into the cell
holder with the cell windows facing the light beam. We recommend
facing the Implen logo to the front. The light beam is directed from
RIGHT to LEFT as indicated with small arrows. Insert the
NanoPhotometer® P-Class Submicroliter Cell always in the same
direction.
Step 2
Use the integrated vortexer (P 330 / P 360 only) to mix your sample well
to achieve an accurate homogeneity of the sample.
Step 3
Pipette the appropriate sample volume onto the centre of the measuring
window. Warning!! Do not overfill the well.
Lid
Sample volume
Pathlength
Dilution
5 (optional)
3.5 – 5 µl
2 mm
1:5
10 (optional for P300)
1 – 3 µl
1 mm
1:10
50
0.3 – 2 µl
0.2 mm
1:50
100 (optional)
0.3 – 2 µl
0.1 mm
1:100
250 (optional)
0.3 – 2 µl
0.04 mm
1:250
Step 4
Make sure that for the measurements the lid fits exactly onto the
positioning supports mounted to the body of the cell. Take
measurement. Remember to consider the lid factor in your instrument
software. Please refer to the NanoPhotometer® P-Class User Manual for
detailed information.
Step 4
Take the lid off and retrieve the sample with a pipette for further
applications if desired. Remove sample residues from the measurement
window and the mirror in the lid. Clean the measurement window and
mirror in the lid well with a slightly wet fluff-free tissue. Use water, 70%
ethanol or isopropanol. Do not use aggressive solvents like strong acids
or bases or organic solvents at any time.
Important Note: Residual fluffs must be removed for optimum
performance
Your cell is ready for the next sample.
NanoPhotometer® P-Class User Manual
Version 2.1 Page 11 / 70
Operation Limitations: Do not autoclave the unit! Do not use an ultrasound bath to clean! Do not drop in water or
solvent bath. The unit is water resistant, but not water proof!
3.2 Software instructions
The NanoVolume Applications and Cuvette Applications are very similar concerning the analysis of dsDNA, ssDNA, RNA,
Oligonucleotides, protein UV and protein dye analysis. This section describes the specific features which have to be
considered using the NanoPhotometer® P-Class Submicroliter Cell. For general information please follow the detailed
instructions under Nanovolume Applications and Cuvette Applications.
The procedure is as follows:
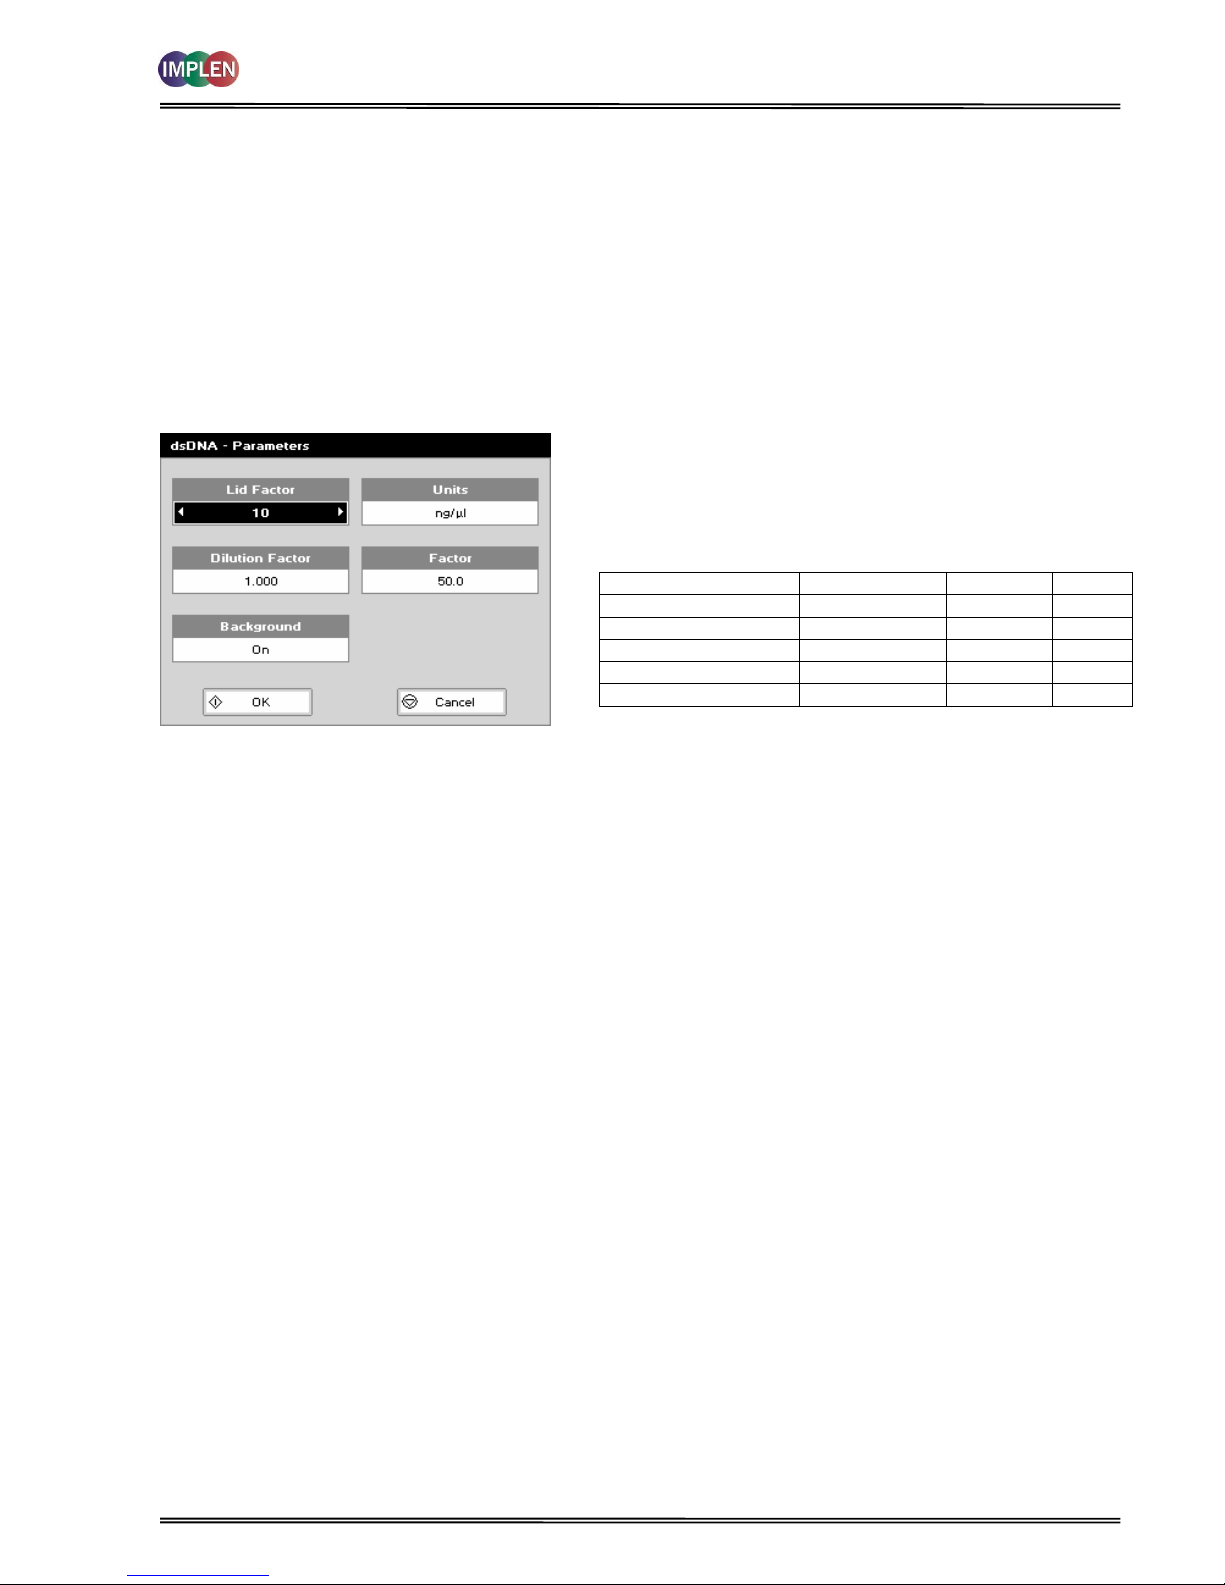
Exemplary Parameter Screen
Parameter Screen
Step 1 Press 1 to select NanoVolume Applications folder
Step 2 Press 1 to select Nucleic Acids folder OR 2 to select
Protein folder.
Step 3 Select the method you want to use by pressing the
corresponding number.
Step 4 Select the Lid Factor using the left and right arrows.
Lid
Sample volume
Pathlength
Dilution
5 (optional)
3.5 – 5 µl
2 mm
1:5
10 (optional for P 300)
1 – 3 µl
1 mm
1:10
50
0.3 – 2 µl
0.2 mm
1:50
100 (optional)
0.3 – 2 µl
0.1 mm
1:100
250 (optional)
0.3 – 2 µl
0.04 mm
1:250
Step 5 Select subsequent parameters and specifications as
described under 4. Nanovolume Applications and
Cuvette Applications.
After the selections are confirmed the results screen displays in
top left corner the chosen Lid and the required sample volume.
NanoPhotometer® P-Class User Manual
Version 2.1 Page 12 / 70
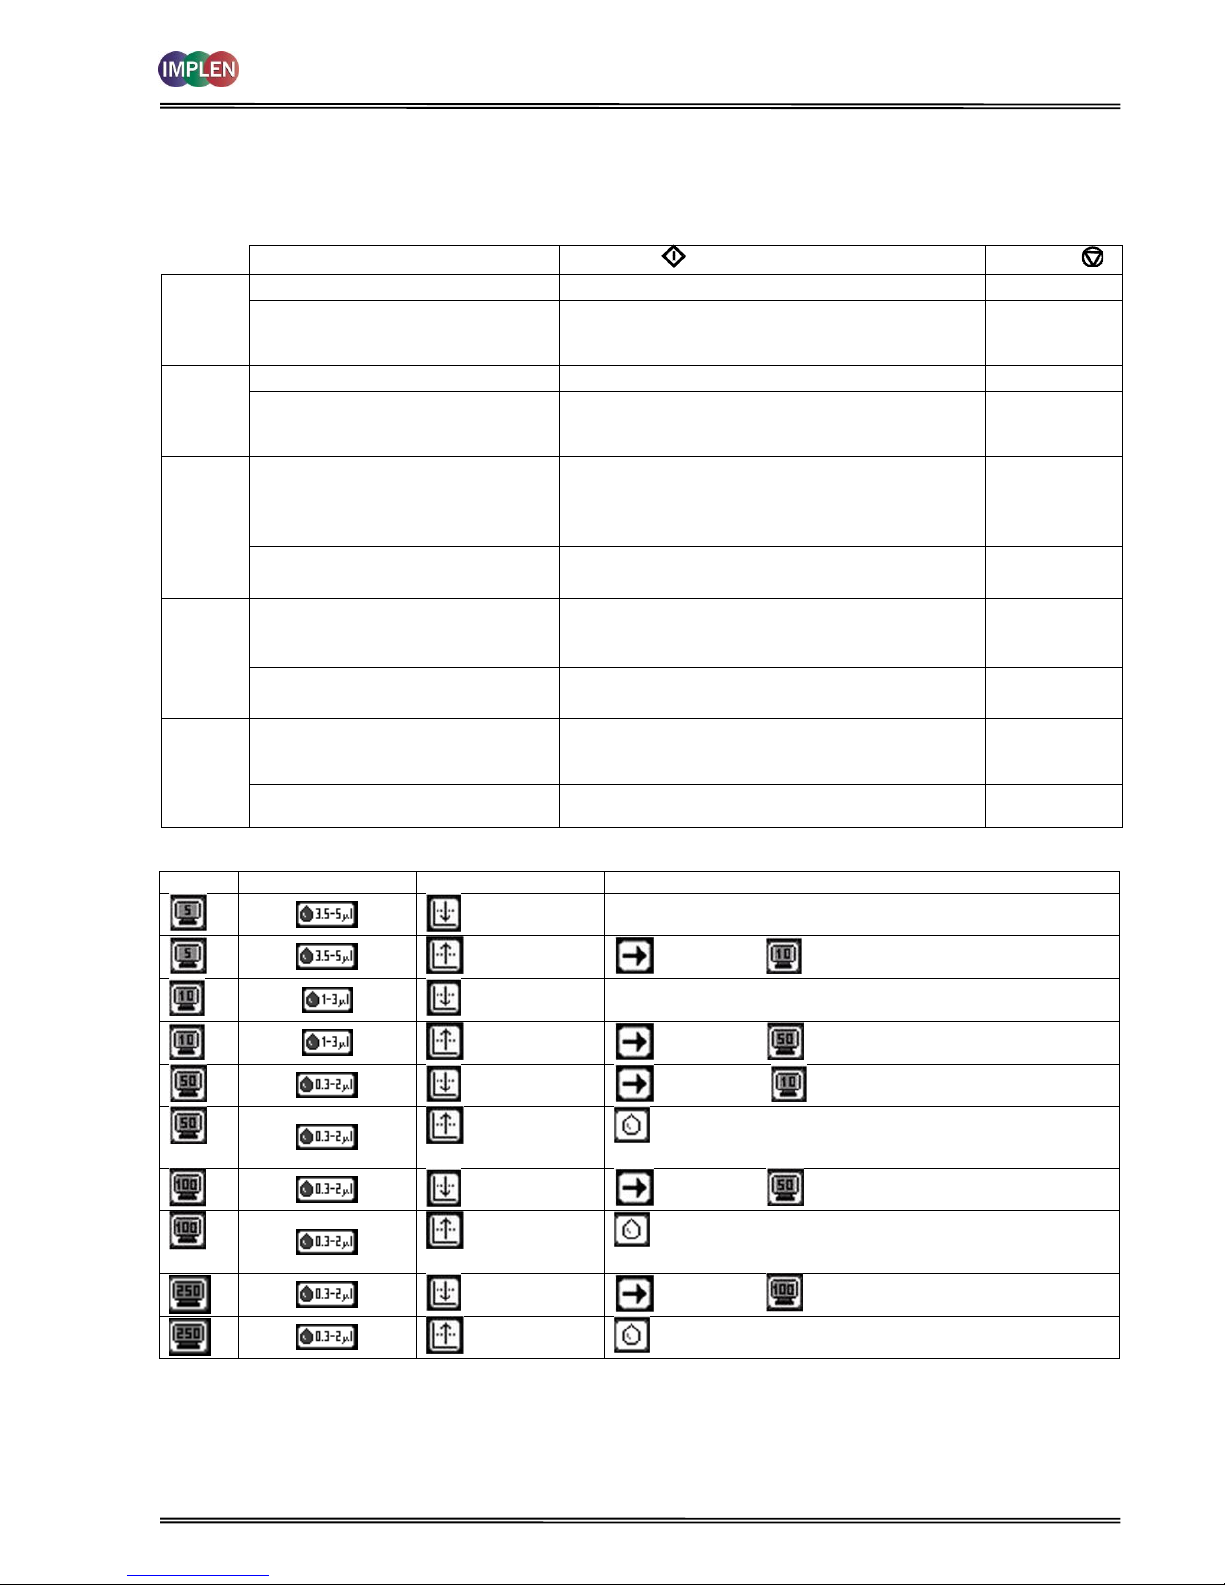
Important Information:
If the absorbance value of the sample is not in the linear range the following “Warning messages” will appear and
“Instruction” will be displayed in the top left corner of the result screen.
Message:
Answer YES :
Answer NO :
Lid 5
Concentration too low.
Concentration too high.
Do you want to change the lid factor?
Please change to lid 10 and press sample.
(automatic change of lid factor lid 5 to lid 10 in the
software for calculation)
No changes
Lid 10
Concentration too low.
Concentration too high.
Do you want to change the lid factor?
Please change to lid 50 and press sample.
(automatic change of lid factor lid 10 to lid 50 in the
software for calculation)
No changes
Lid 50
Concentration too low.
Do you want to change the lid factor?
Please change to lid 10, apply a minimum of 1µl of
sample and press sample. (automatic change of lid
factor lid 50 to lid10 in the software for calculation)
No changes
Concentration too high.
Dilute sample or change to lid 100.
Lid 100
Concentration too low.
Do you want to change the lid factor?
Please change to lid 50 and press sample.
(automatic change of lid factor lid 100 to lid 50 in
the software for calculation)
No changes
Concentration too high.
Dilute sample or change to lid 250.
Lid 250
Concentration too low.
Do you want to change the lid factor?
Please change to lid 100 and press sample.
(automatic change of lid factor lid 250 to lid 100 in
the software for calculation)
No changes
Concentration too high.
Dilute sample.
Lid
Required volume
Warning message
Instruction
Abs too low
Sample concentration is too low
Abs is too high
change to lid
Abs too low
Sample concentration is too low (or change to lid 5 if
available)
Abs is too high
change to lid
Abs too low
change to lid
Abs is too high
Physical dilution of the sample is necessary (or change
to lid 100 if available)
Abs too low
change to lid
Abs is too high
Physical dilution of the sample is necessary (or change
to lid 250 if available)
Abs too low
change to lid
Abs is too high
Physical dilution of the sample is necessary
*Some of the lids are only optional available. Lid delivery content for P 300 is Lid 50, for P 330 Lid 10 and Lid 50 and
for P360 is Lid 10, Lid 50 und Lid 250.

NanoPhotometer® P-Class User Manual
Version 2.1 Page 13 / 70
4. NANOVOLUME APPLICATIONS AND CUVETTE APPLICATIONS
The NanoPhotometer® P-Class offers a complete solution for NanoVolume and standard volume applications. With the
NanoPhotometer® P-Class Submicroliter Cell the required sample volume ranges from 0.3 µl to a maximal sample
volume of 5 µl. Standard volume applications can be performed with 10 mm pathlength quartz, glass or plastic
cuvettes.
Note:
Within the Utilities folder the user has the possibility to select various options that define data output (please see also
7.3 Output Options / Printer).
The NanoVolume Applications folder and the Cuvette Applications folder contain different sub folders:
Nucleic Acids, Protein and OD 600 (Cell Density). Contents of these sub folders are detailed below.
4.1 Characterization of DNA, RNA and Oligonucleotides
4.1.1 General Information
Nucleic Acid Quantification (NAQ)
Nucleic acids can be quantified at 260 nm because it is well established that a solution of dsDNA in a 10 mm
pathlength cell with an optical density of 1.0 has a concentration of 50 µg/ml, ssDNA of 37 µg/ml or 40 µg/ml in
the case of RNA. Oligonucleotides have a corresponding factor of 33 µg/ml, although this does vary with base
composition; this can be calculated if the base sequence is known. Please refer to 12.1 Nucleic acid quantification
for further details.
The instrument uses factors 50, 37, 40 and 33 as default settings for dsDNA, ssDNA, RNA and Oligonucleotides,
respectively, and compensation factors for dilution and use of cells which do not have 10 mm pathlength. Dilution
factor and cell pathlength can be entered.
Nucleic Acid Purity Checks
Nucleic acids extracted from cells are accompanied by protein, and extensive purification is required to separate
the protein impurity. The 260/280 ratio gives an indication of purity; it is only an indication, however, and not a
definitive assessment. Pure DNA and RNA preparations have expected ratios of 1.8 and 2.0, respectively;
deviations from this indicate the presence of impurity in the sample, but care must be taken in interpretation of
results.
The 260 nm reading is taken near the top of a broad peak in the absorbance spectrum for nucleic acids, whereas
the 280 nm reading is taken on a steep slope (i.e. small changes in wavelength cause large changes in
absorbance). Consequently, small variations in wavelength at 280 nm will have a greater effect on the 260/280
ratio than variations will at 260 nm. Thus different instruments of the same and different types may give slightly
Folder
Application
Recommended Measurement Cell
Nucleic Acids
DNA
Concentration, purity check and dye incorporation for
DNA samples
Submicroliter Cell / Cuvette
RNA
Concentration, purity check and dye incorporation for
RNA samples
Submicroliter Cell / Cuvette
Oligo
Concentration, purity check and dye incorporation for
Oligo samples
Submicroliter Cell / Cuvette
Protein
Protein UV
(Christian-Warburg)
Protein determination at 280 nm
Submicroliter Cell / Cuvette
Protein Dye
Protein determination at 280 nm and dye
incorporation
Submicroliter Cell / Cuvette
BCA
Protein determination at 562 nm
Cuvette
Bradford
Protein determination at 595 nm
Cuvette
Lowry
Protein determination at 750 nm
Cuvette
Biuret
Protein determination at 546 nm
Cuvette
Cell Count
OD600
Cell density at 600 nm
Cuvette
NanoPhotometer® P-Class User Manual
Version 2.1 Page 14 / 70
Pure Nucleic Acid Poly dAdT
0.0
0.1
0.2
0.3
0.4
0.5
0.6
0.7
0.8
210.0 260.0 310.0 360.0 410.0
Wavelength (nm)
Absorbance (A)
Wave = 260.0 Abs = 0.567
Wave = 280.0 Abs = 0.409
Pure Nucleic Acid Poly dAdT
0.0
0.1
0.2
0.3
0.4
0.5
0.6
0.7
0.8
210.0 260.0 310.0 360.0 410.0
Wavelength (nm)
Absorbance (A)
Wave = 260.0 Abs = 0.567
Wave = 280.0 Abs = 0.409
different ratios due to variations in wavelength accuracy. But each instrument will give consistent results within
itself.
Concentration also affects 260/280 readings. If a solution is too dilute, the readings will be at the instrument’s
detection limit, and results may vary as there is less distinction of the 260 peak and the 280 slope from the
background absorbance. This is one reason why the Abs 260 value by using the submicroliter cell (NanoVolume
applications) should stay between than 0.01 and 1.50 for accurate measurements.
An elevated absorbance at 230 nm can indicate the presence of impurities as well; 230 nm is near the absorbance
maximum of peptide bonds and also indicates buffer contamination since TRIS, EDTA and other buffer salts absorb
at this wavelength. When measuring RNA samples, the 260/230 ratio should be > 2.0; a ratio lower than this is
generally indicative of contamination with guanidinium thiocyanate, a reagent commonly used in RNA purification
and which absorbs over the 230 - 260 nm range. A wavelength scan of the nucleic acid is particularly useful for
RNA samples.
The instrument can display 260/280 and 260/230 ratios.
Fluorescent dye incorporation
To determine the dye incorporation rate, the absorbance reading at the wavelength reported for maximum
absorbance of the fluorescence dye is used. The corresponding extinction coefficient of the dye is used in the
Lambert-Beer Law to determine the dye concentration (c = A / (e * d)). Comparing these values with the DNA
concentration gives a dye incorporation rate. For further details please refer to 12.2 Nucleic acid fluorescent dye
incorporation.
Use of Background Correction
Background correction at a wavelength totally separate from the nucleic acid and protein peaks at 260 and 280
nm, respectively, is sometimes used to compensate for the effects of background absorbance. The wavelength
used is 320 nm and it can allow for the effects of turbidity, high absorbance buffer solution and th e use of reduced
aperture cells.
If it is used, there will be different results from those when unused, because Abs 320 is subtracted from Abs 260
and Abs 280 prior to use in equations:
Concentration = (Abs 260 - Abs 320) * Factor
Abs ratio = (Abs 260 - Abs 320) / (Abs 280 - Abs 320)
Abs ratio = (Abs 260 - Abs 320) / (Abs 230 - Abs 320)
If your laboratory has not used background correction before, set this option to OFF.
The use of background correction can remove variability due to handling effects of low volume disposable cells.
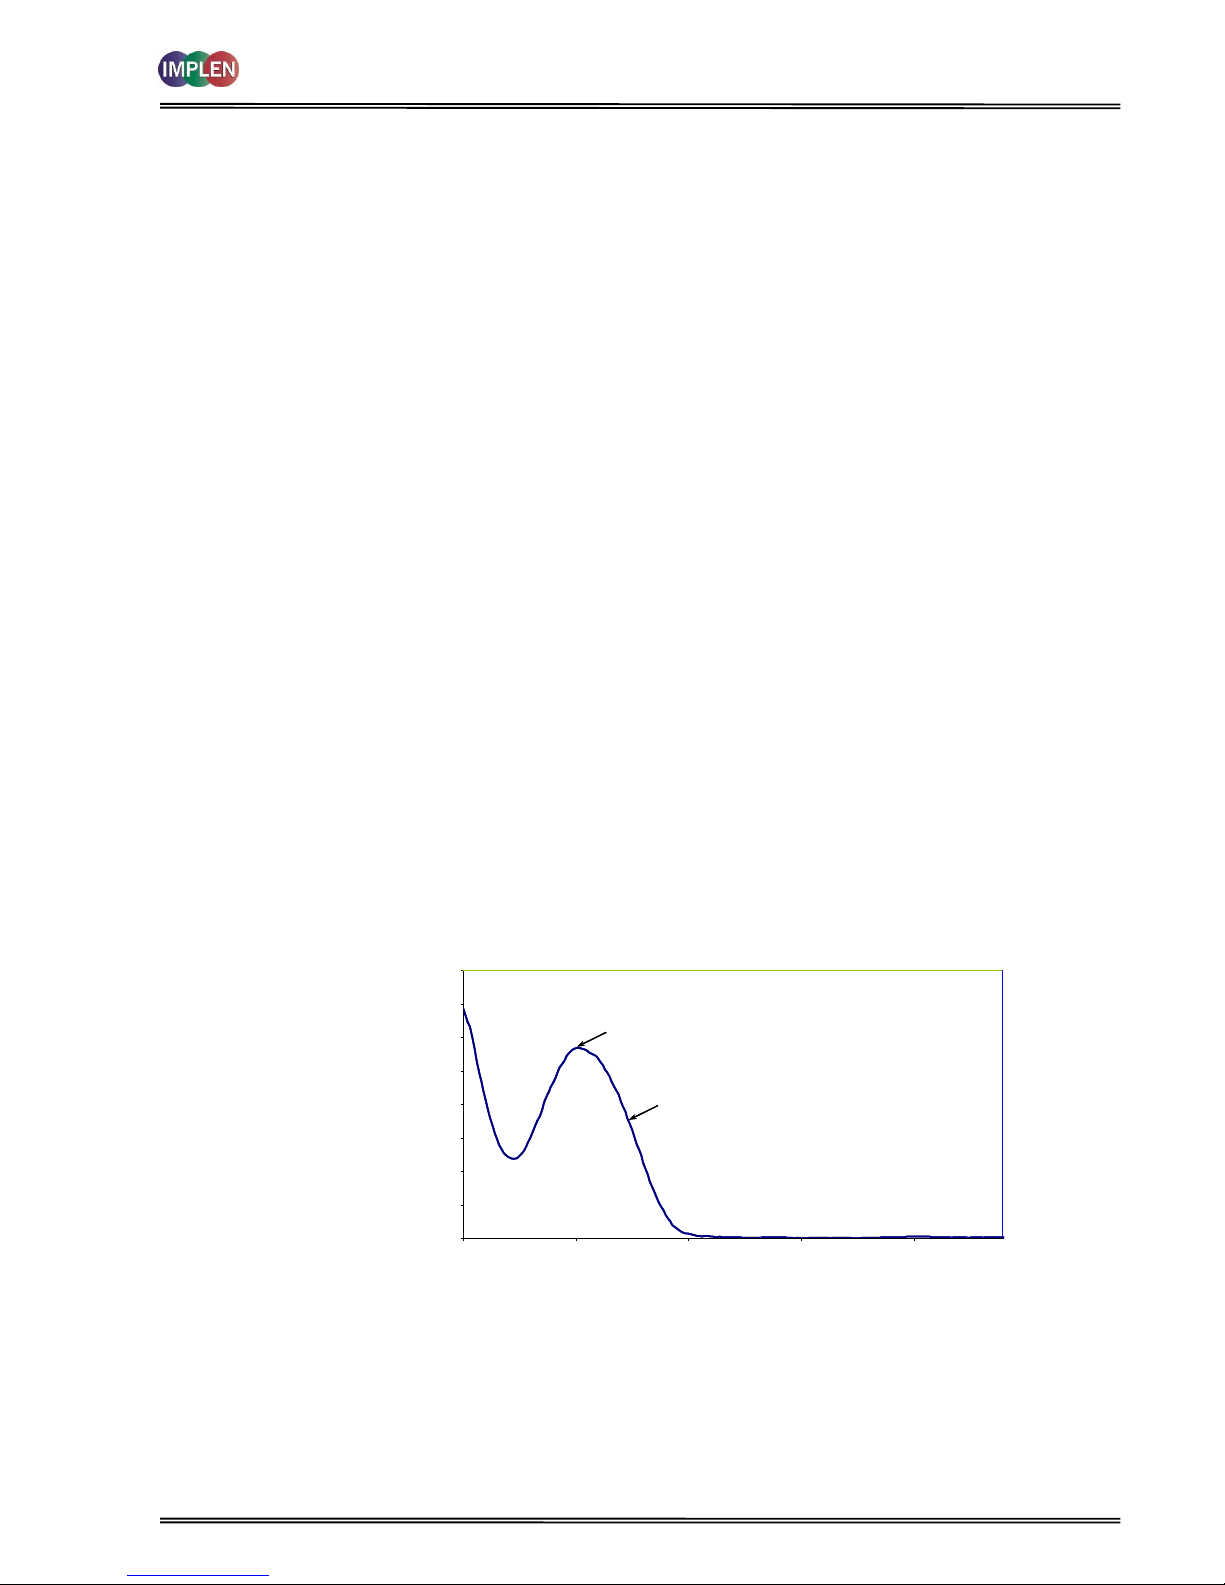
Spectral scan of nucleic acid
Note:
absorbance maximum near 260 nm and absorbance minimum near 230 nm
flat peak near 260 nm and steep slope at 280 nm
very little absorbance at 320 nm
Operation of the instrument for Nucleic Acid measurements is described in the following sections.
DNA and RNA are very similar, whilst in Oligo it is possible to calculate the factor from the composite bases by entering
the proportions of the 4 bases.
NanoPhotometer® P-Class User Manual
Version 2.1 Page 15 / 70
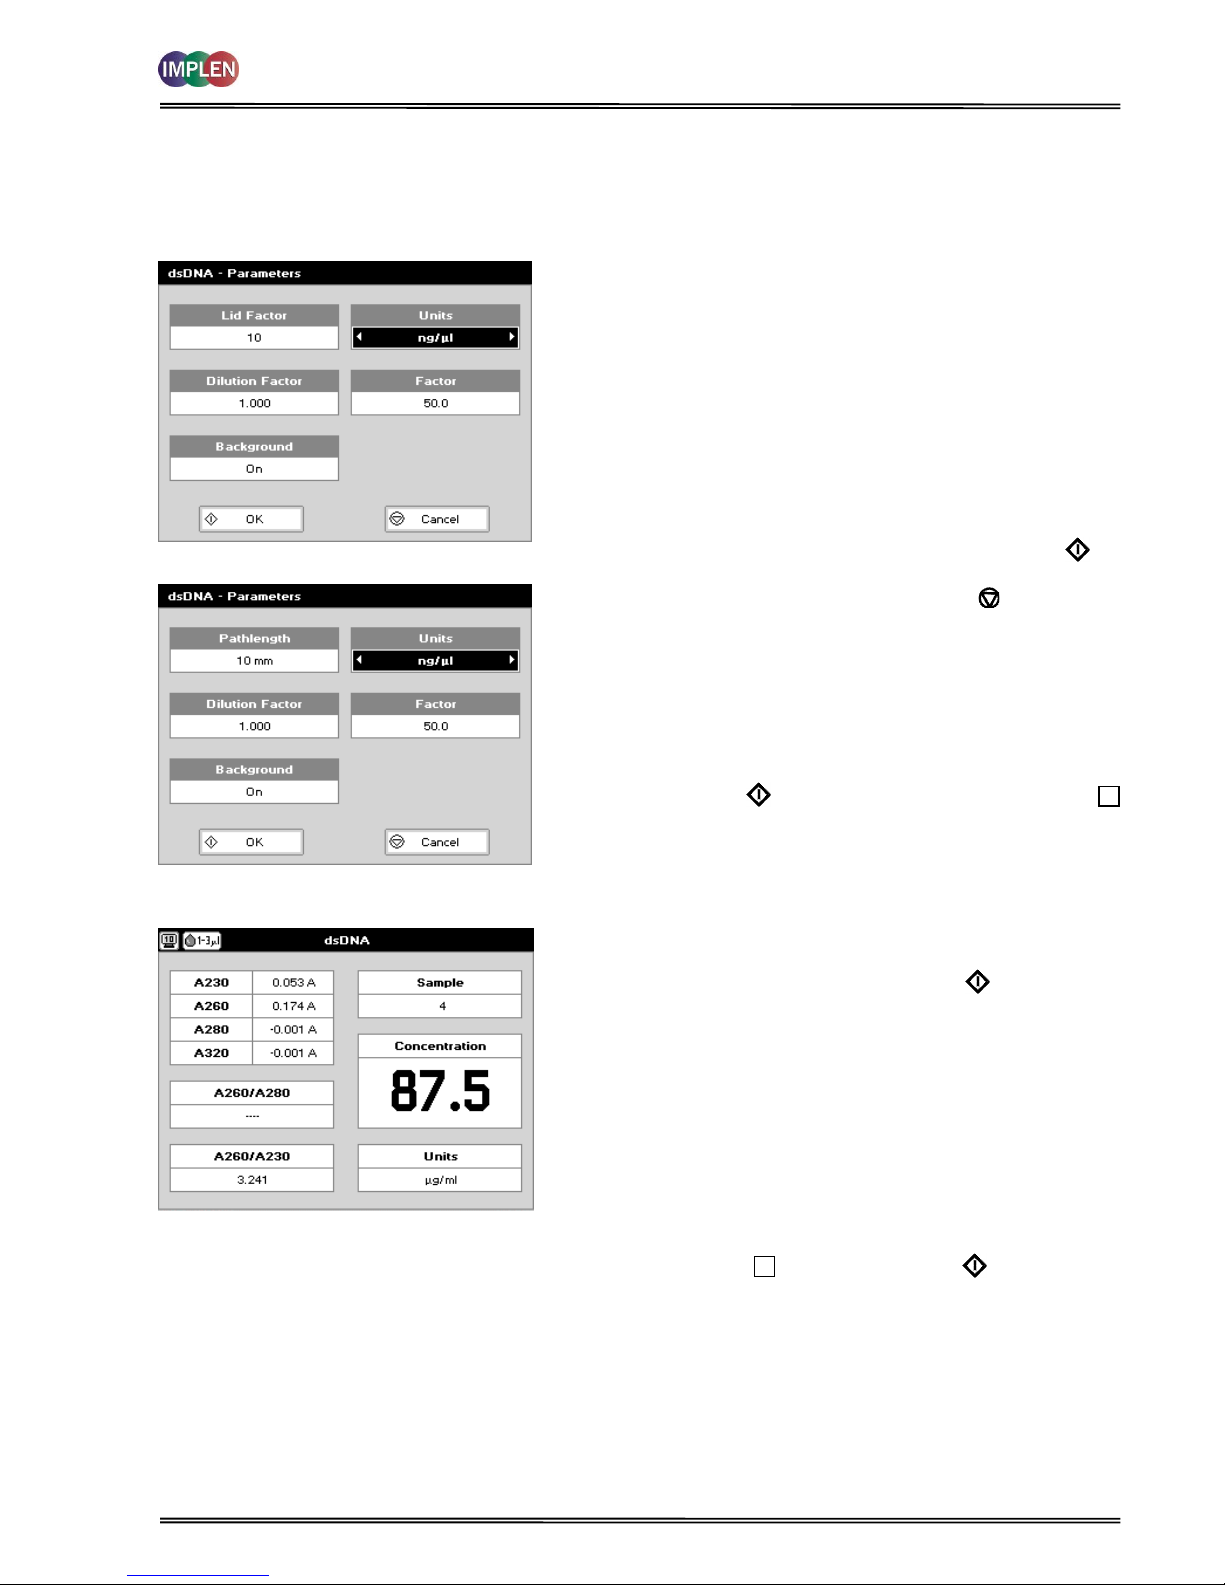
4.1.2 Analysis of dsDNA, ssDNA and RNA
The procedure is as follows:
Parameter Screen
NanoVolume Applications
Cuvette Applications
Parameter Screen
Step 1 Press 1 for NanoVolume OR 2 for Cuvette folder
Step 2 Press 1 to select Nucleic Acids folder
Step 3 Press 1 to select dsDNA mode OR 2 to select ssDNA
mode OR 3 to select RNA mode
Step 4 Using the NanoVolume Applications select the Lid
Factor as described in the “Average Detection Range
Sheet” and under 3.2.
Step 5 Enter the Dilution Factor using the keypad numbers.
Range 1.00 to 9,999. Use the C button to backspace
and clear the last digit entered OR press Menu/Options
to enter the dilution factor screen. Enter the volume of
the sample using the keypad numbers. Range 0.01 to
9,999. Enter the volume of the diluent using the keypad
numbers. Range 0.01 to 9,999. Press OK to
calculate the dilution factor and return to the
Parameters screen OR press Cancel to cancel the
selections and return to the Parameters screen.
Step 6 Background correction at 320 nm is recommended to
be switched On.
Step 7 Select the Units of measurement using the left and right
arrows. Options: μg/ml, ng/μl, μg/μl.
Step 8 Enter the Factor using the keypad numbers. Default
value is 50 for dsDNA, 37 for ssDNA and 40 for RNA,
range is 0.01 to 9,999.
Step 9 Press OK to enter the Results screen OR Cancel
to return to the Nucleic Acids folder.
Results Screen
Results Screen
Step 10 Apply/insert the reference sample. Press the Blank Key.
This will be used for all subsequent samples until changed.
Step 11 Apply/insert sample and press Sample . This measures
at the selected wavelengths and displays the results. The
sample concentration, the ratio of A260/A280 and
A260/A230 are calculated (corrected by the background
wavelength value if selected).
Step 12 If the absorbance value of the sample is not in the linear
range a “Warning message” will pop up and “Instruction”
will be displayed in the top left corner of the result screen.
Please refer to 3.2 Software instructions/important
information on page 11 for further information.
Step 13 Repeat for all samples.
Step 14 Press Menu/Options to display available options which are
described on page 8.
Step 15 Press Escape and confirm with Yes to return to the
Nucleic Acids folder.
To change parameters, print or save methods press the Menu/Options button. The options menu will be opened. For
further explanation please see 2.3 Keypad and display on 6 (P 300) and 7 (P330 / P 360).
NanoPhotometer® P-Class User Manual
Version 2.1 Page 16 / 70
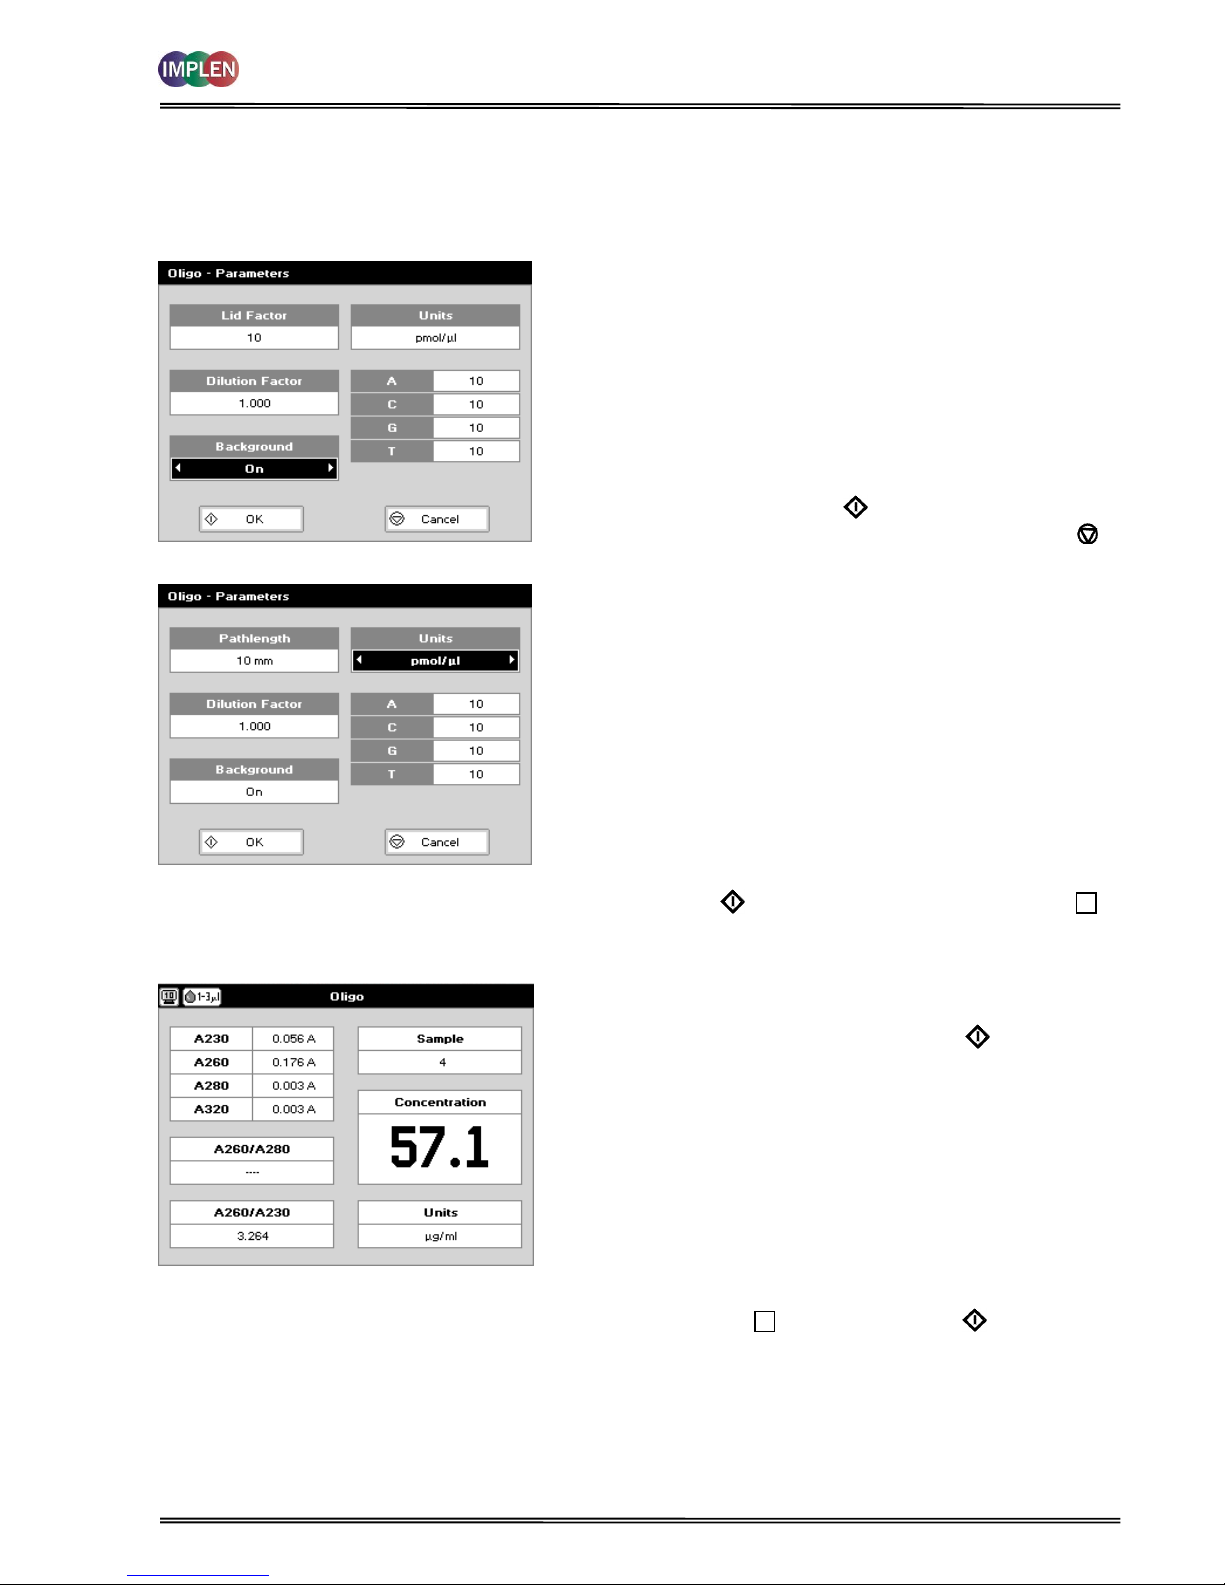
4.1.3 Analysis of Oligonucleotides
The procedure is as follows:
Parameter Screen
NanoVolume Applications
Cuvette Applications
Parameter Screen
Step 1 Press 1 for NanoVolume OR 2 for Cuvette folder.
Step 2 Press 1 to select Nucleic Acids folder.
Step 3 Press 4 to select Oligo mode.
Step 4 Using the NanoVolume Applications select the Lid Factor as
described in the “Average Detection Range Sheet” and
under 3.2.
Step 5 Enter the Dilution Factor using the keypad numbers. Range
1.00 to 9,999. Use the C button to backspace and clear the
last digit entered OR press Menu/Options to enter the
dilution factor screen. Enter the volume of the sample
using the keypad numbers. Range 0.01 to 9,999. Enter the
volume of the diluent using the keypad numbers. Range
0.01 to 9,999. Press OK to calculate the dilution factor
and return to the Parameters screen OR press Cancel to
cancel the selections and return to the Parameters screen.
Step 6 Background correction at 320 nm is recommended to be
switched on.
Step 7 Select the Units of measurement using the left and right
arrows. Options: μg/ml, ng/μl, μg/μl and pmol/μl.
Step 8 Enter the Factor using the keypad numbers. Default value
is 33, range is 0.01 to 9,999.
Step 9 If pmol/μl is selected there are two options to set the factor
1. A selection table denoting the ratios of the 4 bases
according to the oligo sequence. Enter the proportions of
bases present using the keypad numbers and up and down
arrows to move between boxes. Default is 10 for each,
range is 0 to 9,999.
2. Enter the known extinction factor of the oligo used:
factor range 0.01 to 9,999 for ratio = [1 / extinction
coefficient *10-6].
Step 10 Press OK to enter the Results screen OR Cancel to
return to the Nucleic Acids folder.
Results Screen
Results Screen
Step 11 Apply/insert the reference sample. Press Blank Key. This
will be used for all subsequent samples until changed.
Step 12 Apply/insert sample and press Sample . This measures
at the selected wavelengths and displays the results. The
sample concentration and the ratio of A260/A280 and
A260/A230 are calculated (corrected by the background
wavelength value if selected).
Step 13 If the absorbance value of the sample is not in the linear
range a “Warning message” will pop up and “Instruction”
will be displayed in the top left corner of the result screen.
Please refer to 3.2 Software instructions/important
information on page 11 for further information.
Step 14 Repeat for all samples.
Step 15 Press Menu/Options to display available Options which are
described on page 8.
Step 16 Press Escape and confirm with Yes to return to the
Nucleic Acids folder.
To change parameters, print or save methods press the Menu/Options button. The options menu will be opened. For
further explanation please see 2.3 Keypad and display on page 6 (P 300) and 7 (P330 / P 360).
NanoPhotometer® P-Class User Manual
Version 2.1 Page 17 / 70
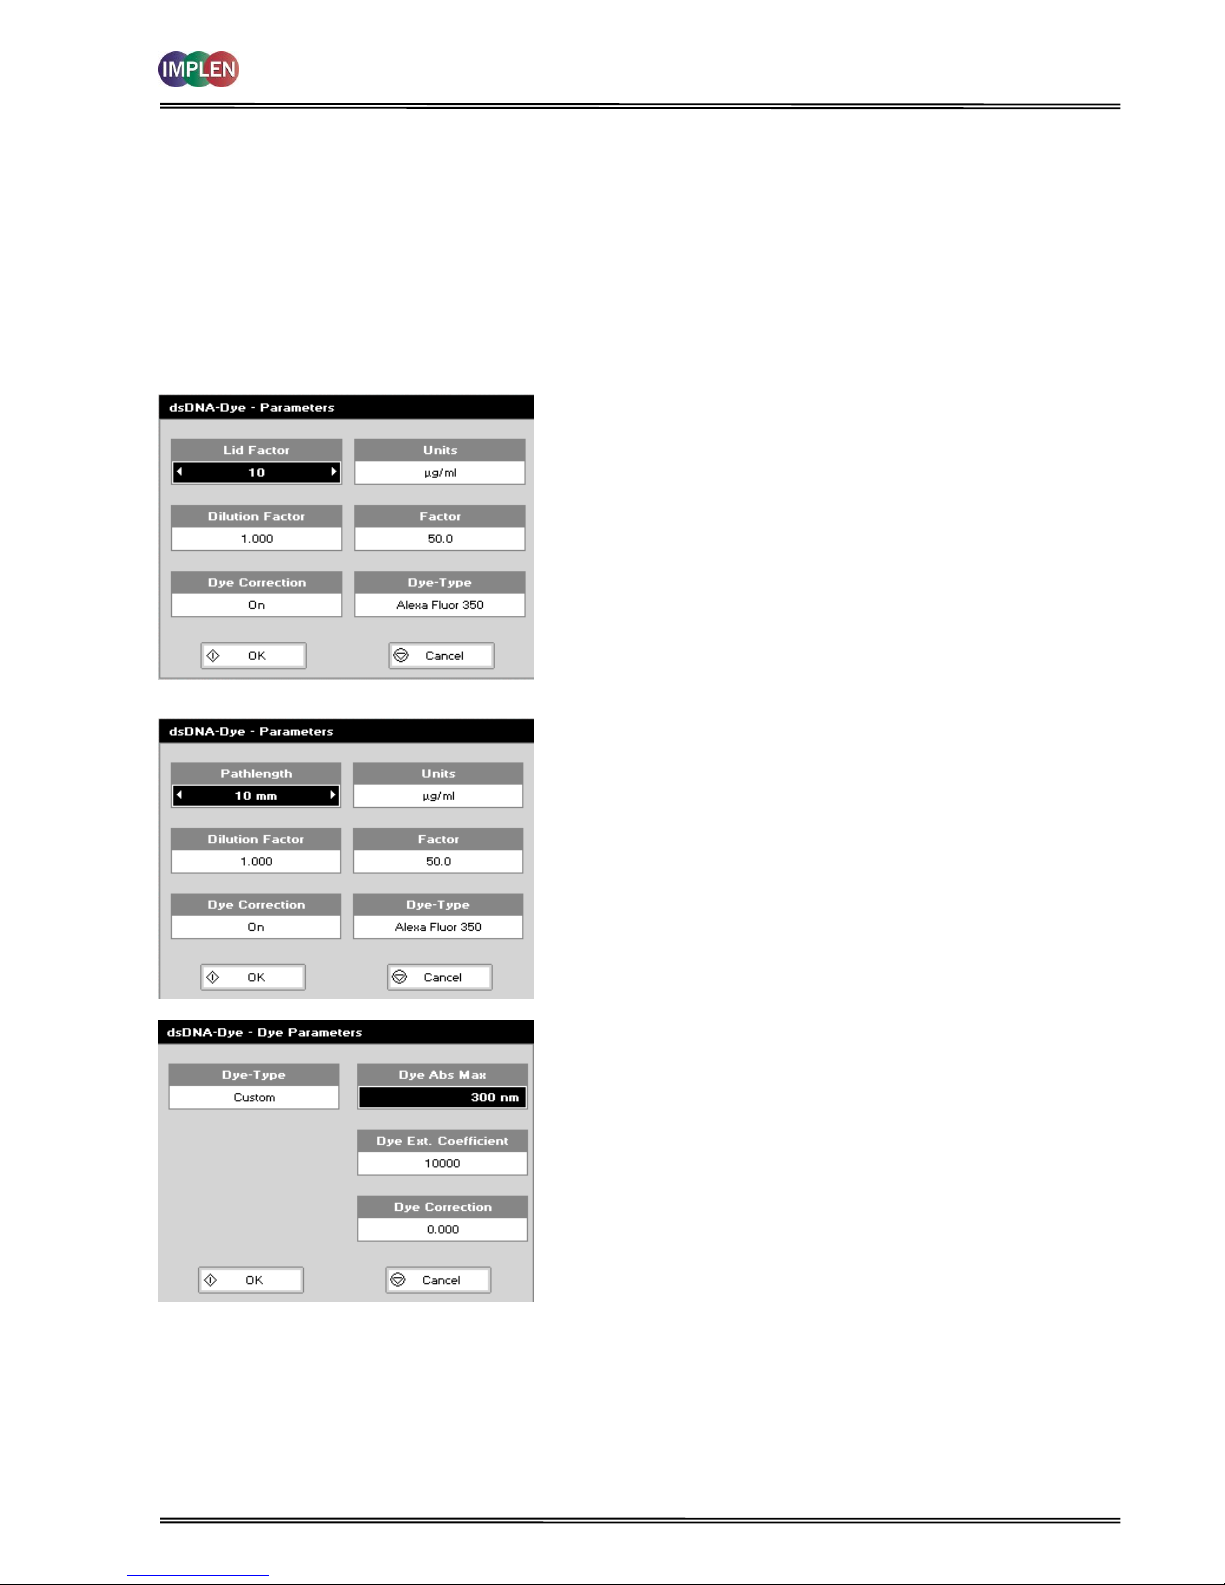
4.1.4 Dye incorporation for dsDNA, ssDNA, RNA and Oligonucleotides
The dye incorporation methods are similar to the dsDNA, ssDNA, RNA and Oligonucleotide methods. This section
describes the specific features concerning the dye incorporation. For general information please follow the detailed
instructions under Analysis of dsDNA, ssDNA and RNA and Oligonucleotides.
To determine the dye incorporation rate, the absorbance reading at the wavelength reported for maximum absorbance
of the fluorescence dye is used. For further details please refer to 12.2 Nucleic acid fluorescent dye incorporation.
The procedure is as follows:
Parameter Screen
NanoVolume Applications
Cuvette Applications
Parameter Screen
Step 1 Press 1 for NanoVolume OR 2 for Cuvette folder.
Step 2 Press 1 to select Nucleic Acids folder.
Step 3 Press 5, 6, 7 or 8 to select one of the dye incorporation
methods.
Step 4 Using the NanoVolume Applications select the Lid Factor as
described in the “Average Detection Range Sheet” and
under 3.2.
Step 5 Select Dilution Factor, Units and Factor as described under
4.1.2.
Step 6 Select whether the Dye correction (calculation of the dye-
dependent correction factor) is used or not with the left and
right arrows. The Background correction is always
calculated in the Dye methods.
Step 7 Select the appropriate Dye Type. 10 different Alexa Fluors,
4 Cy-Dyes, 6 Oyster-Dyes and Texas Red are programmed
with their corresponding maximum absorbance
wavelength, dye-dependent correction factor at 260 nm
and dye-dependent extinction coefficient. For further details
please refer to 12.2 Nucleic acid fluorescent dye
incorporation.
Step 8 If using Custom Dye maximum absorbance wavelength of
the custom dye, dye-dependent extinction coefficient and
dye-dependent correction factor at 260 nm have to be
entered.
Ranges are:
Dye Abs Max: 300 nm to 950 nm
Dye Ext. Coefficient: 10,000 to 9,999,999
Dye Correction: 0.000 to 0.999
NanoPhotometer® P-Class User Manual
Version 2.1 Page 18 / 70
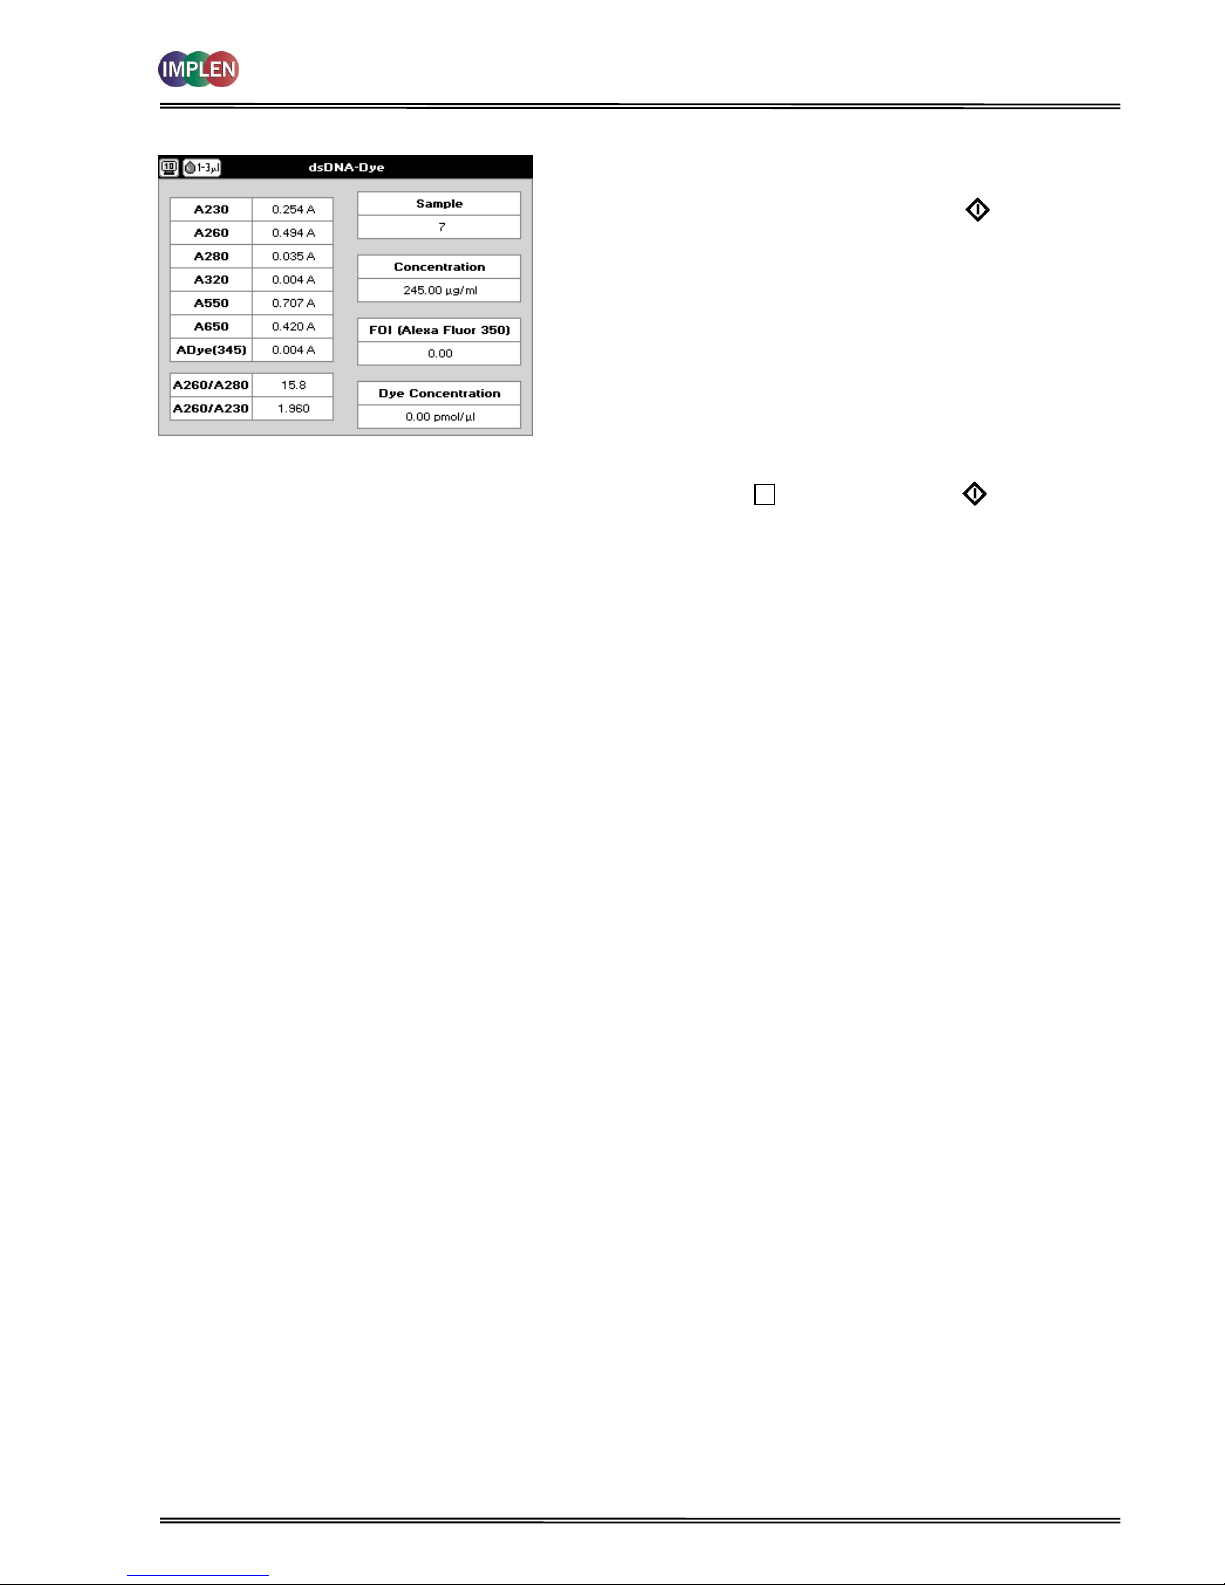
Results Screen
Results Screen
Step 9 Apply/insert the reference sample. Press Blank Key. This
will be used for all subsequent samples until changed.
Step 10 Apply/insert sample and press Sample . This measures
at the selected wavelengths and displays the results. The
sample and dye concentration, the FOI and the ratio of
A260/A280 and A260/A230 are calculated (corrected by
the background if selected).
Step 11 If the absorbance value of the sample is not in the linear
range a “Warning message” will pop up and “Instruction”
will be displayed in the top left corner of the result screen.
Please refer to 3.2 Software instructions/important
information on page 11 for further information.
Step 12 Repeat for all samples.
Step 13 Press Menu/Options to display available Options which are
described on page 8.
Step 14 Press Escape and confirm with Yes to return to the
Nucleic Acids folder.
To change parameters, print or save methods press the Menu/Options button. The options menu will be opened. For
further explanation please see 2.3 Keypad and display on page 6 (P 300) and 7 (P330 / P360).

NanoPhotometer® P-Class User Manual
Version 2.1 Page 19 / 70
4.2 Protein Determination
4.2.1 General Information
Protein determination at 280 nm (NanoVolume Applications and Cuvette Applications)
Protein can be determined in the near UV at 280 nm due to absorption by tyrosine, tryptophan and phenylalanine
amino acids; Abs 280 varies greatly for different proteins due to their amino acid content, and consequently the
specific A280 factor for a particular protein must be determined.
The protein concentration can be calculated the following way:
c
prot.
= Abs. 280 * A280 factor * lid factor * dilution factor
With background correction:
c
prot.
= (Abs. 280 – Abs. 320) * A280 factor * lid factor * dilution factor
This equation can be applied to other proteins if the corresponding factors are known (please note that the factor
used by the NanoPhotometer® P-Class is the reciprocal value of the extinction coefficient (l/g*cm) from a protein).
The instrument can determine protein concentration at 280 nm and uses the above equation as default; the
factors can be changed, and the use of background correction at 320 nm is optional.
The A280 Factor is based on the extinction coefficient of the protein [molecular weight/molar extinction coefficient
(M-1*cm-1) or 1/extinction coefficient (l/g*cm)].
In the software are the following protein A280 factors pre-programmed:
BSA (bovine serum albumin), serum albumin (mouse and human), lysozyme, IgG and OD 1 for more information
about the factors see 11.3 Protein quantification.
There is also the possibility to enter custom factors. For correct calculation the following settings are needed, either
the extinction coefficient (l/g*cm) or the molar extinction coefficient (M-1*cm-1) and the molecular weight (g/mol)
of the protein.
Rapid measurements such as this at 280 nm are particularly useful after isolation of proteins and peptides from
mixtures using spin and HiTrap columns by centrifuge and gravity, respectively.
Protein determination at 280 nm and degree of labelling (NanoVolume Applications and Cuvette Applications)
To determine the degree of labelling, the absorbance reading at the wavelength reported for maximum absorbance
of the fluorescence dye is used. The corresponding extinction coefficient of the dye is used in the Lambert -Beer
Law to determine the dye concentration (c = A / (e * d)). Absorbance values and extinction coefficients are used to
calculate the dye per protein ratio. For further details please refer to 12.4 Protein fluorescent dye incorporation.
Colorimetric Bradford, Biuret, BCA and Lowry protein determination (Cuvette Applications)
The Bradford method depends on quantifying the binding of a dye, Coomassie Brilliant Blue, to an unknown protein
and comparing this binding to that of different, known concentrations of a standard protein at 595 nm; this is
usually BSA (bovine serum albumin).
The Biuret method depends on reaction between cupric ions and peptide bonds in an alkali solution, resulting in
the formation of a complex absorbing at 546 nm.
The BCA method also depends on reaction between cupric ions and peptide bonds, but in addition combines this
reaction with the detection of cuprous ions using bicinchoninic acid (BCA), giving an absorbance maximum at 562
nm. The BCA process is less sensitive to the presence of detergents used to break down cell walls.
The Lowry method is based on the Biuret reaction. Under alkaline conditions the divalent copper ion forms a
complex with peptide bonds in which it is reduced to a monovalent ion. Monovalent copper ion and the radical
groups of tyrosine, tryptophan, and cysteine react with Folin reagent to produce an unstable product that becomes
reduced to molybdenum/tungsten blue. Bound reagent changes colour from yellow to blue. This binding is
compared with those derived from a standard protein at 750 nm; this is usually BSA (bovine serum albumin).
Detailed protocols are supplied with these assay kits, and must be closely followed to ensure accurate results are
obtained.
A linear regression analysis of the calibration standard data points is calculated; the result, together with the
correlation coefficient, can be printed out. A correlation coefficient of between 0.95 and 1.00 indicates a good
straight line.
NanoPhotometer® P-Class User Manual
Version 2.1 Page 20 / 70
4.2.2 Protein UV Method
The procedure is as follows:
Parameter Screen
NanoVolume Applications
Cuvette Applications
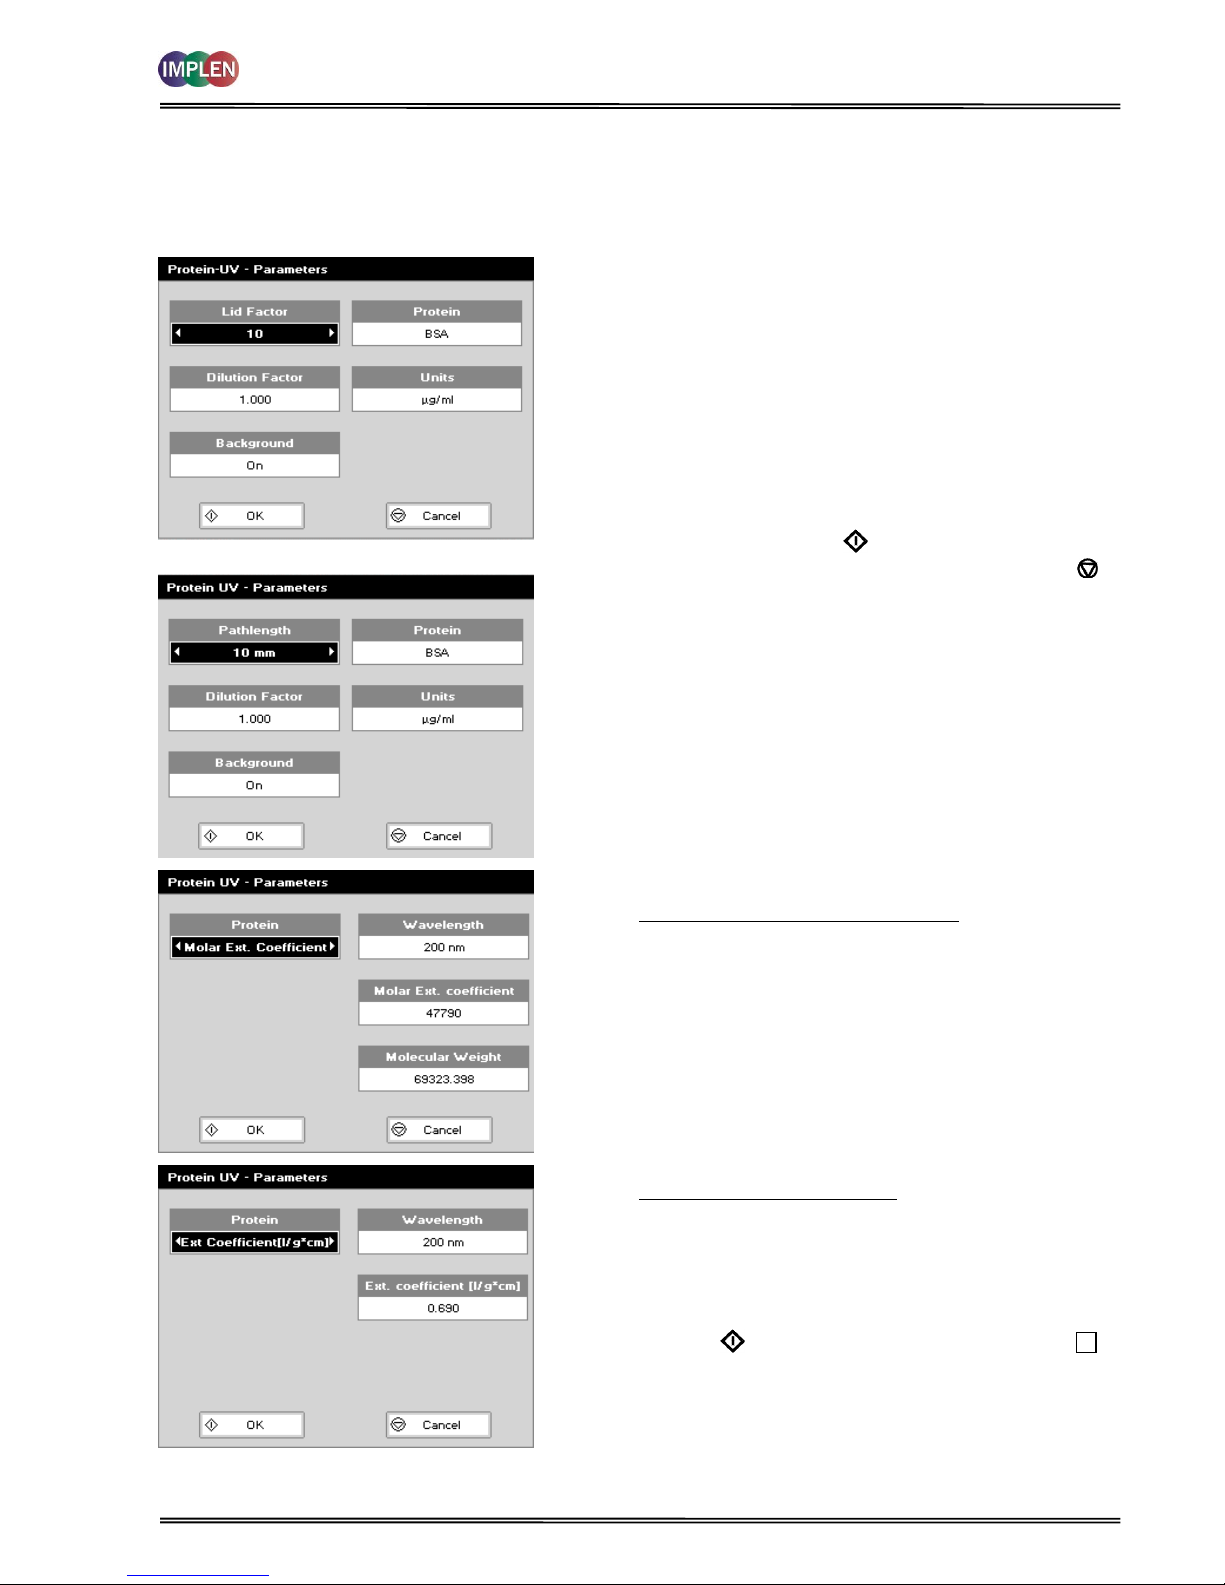
Parameter Screen
Step 1 Press 1 for NanoVolume OR 2 for Cuvette folder.
Step 2 Press 2 to select Protein folder.
Step 3 Press 1 to select Protein UV mode.
Step 4 Using NanoVolume Applications select the Lid Factor as
described in the “Average Detection Range Sheet” or under
3.2. A minimum of 1.5 µl sample volume (for lid 10) is
recommended.
Step 17 Enter the Dilution Factor using the keypad numbers. Range
1.00 to 9,999. Use the C button to backspace and clear the
last digit entered. OR press Menu/Options to enter the
dilution factor screen. Enter the volume of the sample
using the keypad numbers. Range 0.01 to 9,999. Enter the
volume of the diluent using the keypad numbers. Range
0.01 to 9,999. Press OK to calculate the dilution factor
and return to the Parameters screen OR press Cancel to
cancel the selections and return to the Parameters screen.
Step 5 Select whether the Background correction at 320 nm is
used or not with the left and right arrows. It is
recommended to switch on the Background correction.
Step 6 Select the Protein (BSA (default), Serum Albumin (mouse),
Serum Albumin (human), IgG, Lysozyme, Custom or OD 1).
Step 7 If using Custom Protein there are two possibilities to enter
the correct factors:
Molar extinction coefficient (M-1 * cm-1):
Ranges are:
Wavelength: 200 nm to 340 nm
Molar extinction coefficient (M-1 * cm-1): 10,000 to
9,999,999
Molecular weight: 0.001 to 9,999,999
Extinction coefficient (l/g * cm):
Ranges are:
Wavelength: 200 nm to 340 nm
Extinction coefficient (l/g * cm): 0.001 to 9,999
Step 8 Select the Units of measurement using the left and right
arrows. Options: mg/ml, μg/ml, ng/μl and μg/μl.
Step 9 Press OK to enter the Results screen OR Cancel to
return to the Protein folder.
NanoPhotometer® P-Class User Manual
Version 2.1 Page 21 / 70
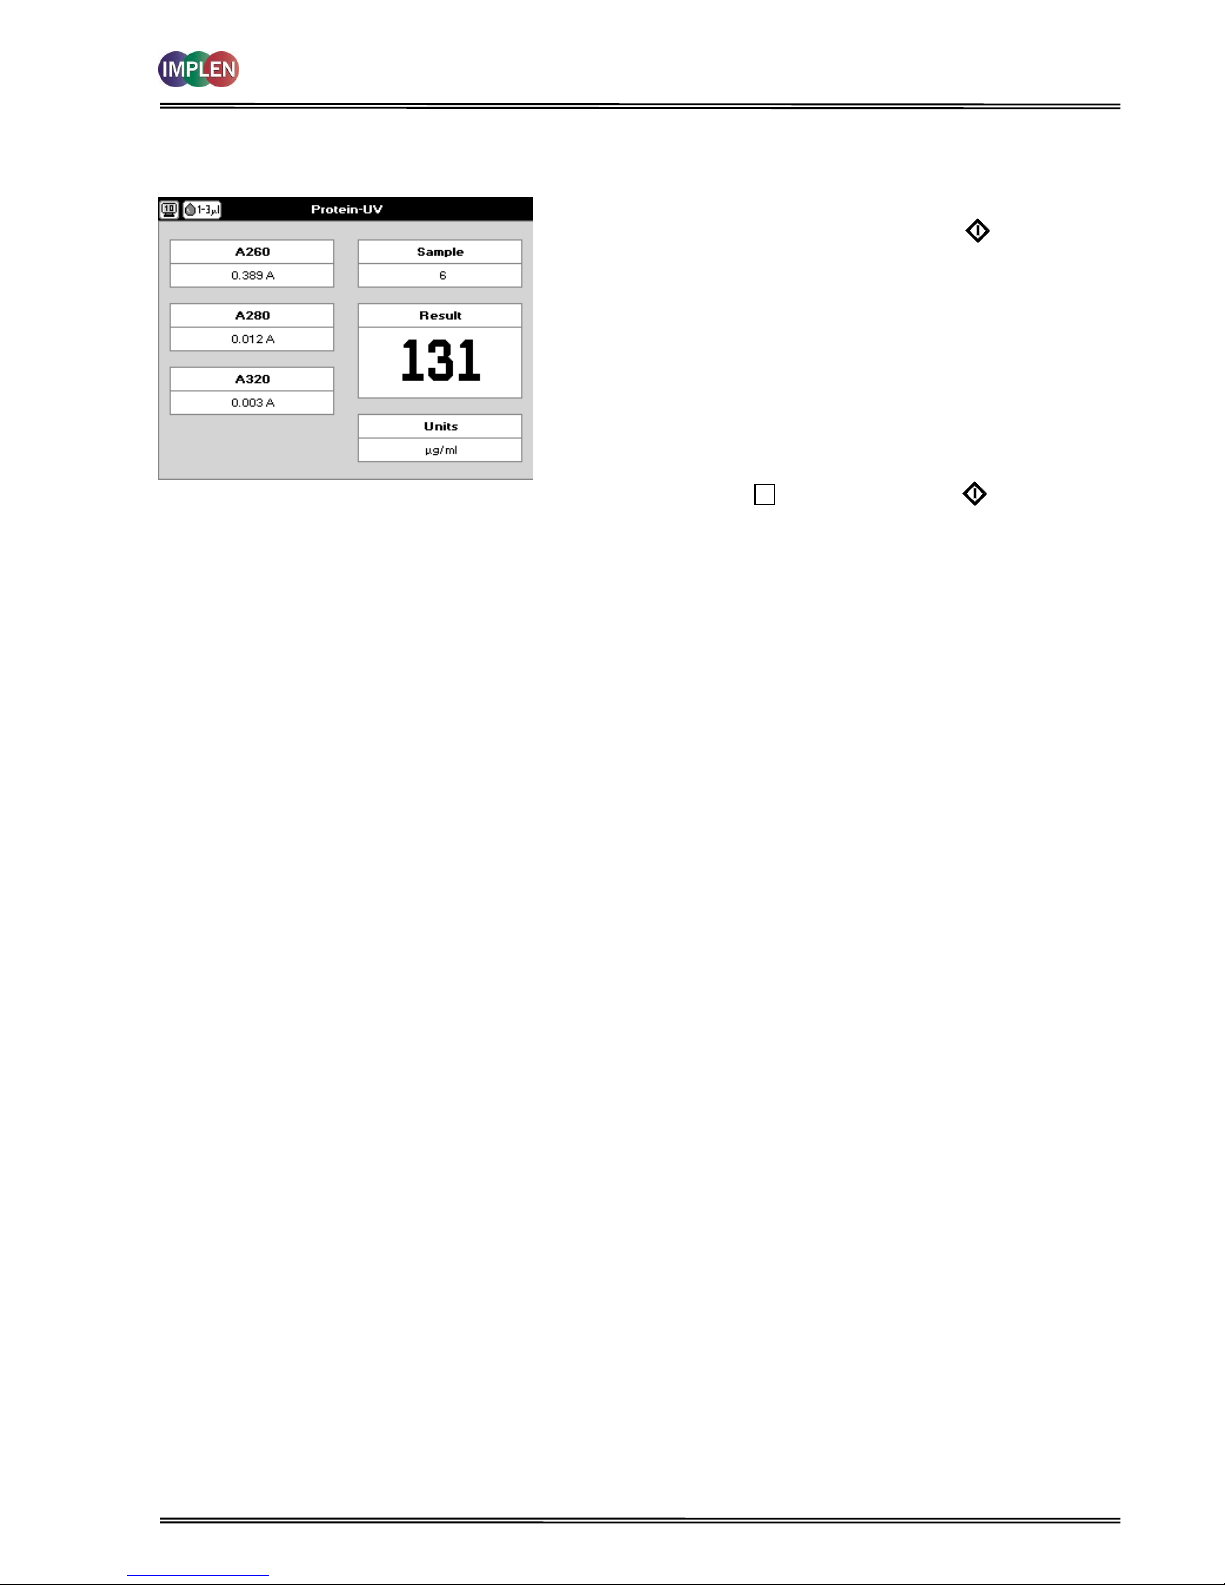
Results Screen
Results Screen
Step 10 Apply/insert the reference sample. Press Blank Key. This
will be used for all subsequent samples until changed.
Step 11 Apply/insert sample and press Sample . This measures
at both 260 and 280 nm wavelengths and displays the
result. Protein concentration is calculated (corrected by
background wavelength value if selected).
Step 12 If the absorbance value of the sample is not in the linear
range a “Warning message” will pop up and “Instruction”
will be displayed in the top left corner of the result screen.
Please refer to 3.2 Software instructions/important
information on page 11 for further information.
Step 13 Repeat for all samples.
Step 14 Press Menu/Options to display available Options which are
described on page 8.
Step 15 Press Escape and confirm with Yes to return to the
Protein folder
To change parameters, print or save methods press the Menu/Options button. The options menu will be opened. For
further explanation please see 2.3 Keypad and display on page 6 (P 300) and 7 (P330 / P 360).
 Loading...