

Page 1

UniPRO MGig1
User Guide
152810 Iss 1
UniPRO SEL1
Page 2

IDEAL INDUSTRIES LTD.
Stokenchurch House
Oxford Road
Stokenchurch
High Wycombe
Buckinghamshire
HP14 3SX UK
www.idealnwd.com
COPYRIGHT NOTICE
The information contained in this document is the property of IDEAL INDUSTRIES Ltd. and is
supplied without liability for errors and omissions. No part of this document may be reproduced or
used except as authorized by contract or other written permission from IDEAL INDUSTRIES Ltd.
The copyright and all restrictions on reproduction and use apply to all media in which this information
may be placed.
IDEAL INDUSTRIES Ltd. pursues a policy of continual product improvement and reserves the right
to alter without notice the specification, design, price or conditions of supply of any product or
service.
© IDEAL INDUSTRIES LTD. 2013
All rights reserved
Publication ref: 152810
Issue 1 - 05/13
(Applies to software revision 0.0.77 onwards)
Page 3

CONTENTS
Introduction ............................................................................................................................... 5
Product care ............................................................................................................................. 6
Final Disposal ........................................................................................................................... 6
Safety Information .................................................................................................................... 6
Connector Safety ................................................................................................................... 6
Power........................................................................................................................................ 7
Power Management, battery pack and power module .......................................................... 7
Battery Pack and Power Module Recharging ....................................................................... 7
Switching ON and OFF ......................................................................................................... 8
Power Saving ........................................................................................................................ 8
Master Reset ......................................................................................................................... 8
Replaceable insert – RJ-45 socket ........................................................................................... 9
Functional overview .................................................................................................................. 9
Handset Controls, Indicators and Ports – MGig1 ..................................................................... 10
Handset Controls, Indicators and Ports – SEL1 ....................................................................... 11
Menu Navigation ....................................................................................................................... 12
MGig1 .................................................................................................................................... 12
SEL1 ...................................................................................................................................... 13
Transmission testing concepts ................................................................................................. 14
General .................................................................................................................................. 14
Ethernet frame structure and Layers ..................................................................................... 15
Loopback and Layers ............................................................................................................ 16
Connection Establishment ..................................................................................................... 18
Targets and Services ............................................................................................................ 18
Traffic Impairments ................................................................................................................ 19
Ethernet transmission testing methods .................................................................................... 19
BERT ..................................................................................................................................... 19
SLA-Tick ................................................................................................................................ 19
RFC2544 ............................................................................................................................... 19
Y.1564 (NetSAM) .................................................................................................................. 20
Modes of Operation .................................................................................................................. 21
Endpoint ................................................................................................................................ 21
Through ................................................................................................................................. 21
Ports ......................................................................................................................................... 22
Setup ........................................................................................................................................ 23
Targets .................................................................................................................................. 24
Services ................................................................................................................................. 26
Test data/Error inject ............................................................................................................. 27
Remote control ......................................................................................................................... 28
MGig1 to MGig1 .................................................................................................................... 28
MGig1 to SEL1 ...................................................................................................................... 29
SEL1 Loop layer .................................................................................................................... 29
Tools ......................................................................................................................................... 30
Ping4 and Ping6 .................................................................................................................... 30
TRoute4 and TRoute6 ........................................................................................................... 31
PoE ........................................................................................................................................ 31
Blink ....................................................................................................................................... 32
Traffic generation .................................................................................................................. 33
Transmission tests – set up and run ........................................................................................ 36
BERT ..................................................................................................................................... 36
SLA Tick ................................................................................................................................ 38
RFC2544 ............................................................................................................................... 40
NetSAM ................................................................................................................................. 48
continued
UniPRO 152810
User Guide Page 3
Page 4

CONTENTS (continued)
Auto test ................................................................................................................................... 53
Statistics ................................................................................................................................... 54
Stats menu description .......................................................................................................... 54
Jobs .......................................................................................................................................... 56
Using the Jobs menu ............................................................................................................. 57
Change the active Job ........................................................................................................... 57
Managing Jobs ...................................................................................................................... 58
Generating Reports .................................................................................................................. 59
MGig1 software updates and configuration .............................................................................. 59
SEL1 software updates and configuration ............................................................................... 60
General .................................................................................................................................. 60
Update software .................................................................................................................... 60
Upload configuration (for transfer to other SEL1 handsets) .................................................. 60
Download configuration ......................................................................................................... 60
Reset SEL1 to factory default ................................................................................................ 60
Specifications – UniPRO MGig1 .............................................................................................. 61
Glossary, abbreviations and acronyms .................................................................................... 63
152810 UniPRO
Page 4 User Guide
Page 5

MGig1
MGig1 PLUS
MGig1 PRO
Copper port
Optical port
Multi-service
Bidirectional
Y.1564
MPLS
VLAN Levels
3 3 8
Introduction
This guide provides operating information and principles of operation for the UniPRO handsets MGig1 and
SEL1. The transmission tester, MGig1, is the handset from where all tests are run and stored. The SEL1
is a loopback terminal that enables testing over four layers.
MGig1 SEL1
Fig 1 UniPRO handsets
The MGig1 is available in the variants that follow and with the features indicated:
The range listed above is also available in ‘Duo’ format which adds a second copper and optical port
making a total of six MGig1 variants. The additional ports extend functionality to include:
Dual-port through-mode capability
Loopback capability on the second port
Traffic generation on the second port
UniPRO 152810
User Guide Page 5
Page 6

DO NOT CONNECT ANY TELECOMMUNICATIONS
NETWORK TO ANY OF THE TESTER’S PORTS
Product care
Although light and portable, UniPRO handsets are robust and have been designed to operate in a
protected outdoor working environment.
To ensure reliable operation:
Avoid very high or low temperatures – UniPRO handsets are designed to operate between 0°C
and +45°C, although you should only charge the batteries between +10°C and +30°C. They
may be safely stored between -20°C and +70°C.
To avoid damage, when they are not in use we recommend that you keep both UniPRO MGig1
and UniPRO SEL1 in their carrying case.
Do not use solvents, strong detergents or abrasive materials to clean any part of the handsets.
Use only cleaning agents approved for use on ABS and polycarbonate plastics.
Final Disposal
When your UniPRO MGig1 or UniPRO SEL1 has reached the end of its life you must dispose of the
complete unit in accordance with local environmental regulations.
Safety Information
When using UniPRO handset, always take basic safety precautions to reduce the risk of fire, electric
shock and injury to persons. These precautions include:
When connecting to the line, special care must be taken as high voltages may be present on the
line and there may be a danger of electrocution.
Avoid using UniPRO MGig1 and UniPRO SEL1 during an electrical storm - there is a remote
risk of electric shock by lightning.
Use only the mains electricity adaptor supplied with your handset.
CLASS 1 LASER PRODUCT. Light output from the fiber optic port can damage eyesight even though it is
invisible. Never stare into open optical ports or the end of a fiber to see if light is coming out.
Connector Safety
The connectors listed below conform to EN60950 SELV safety status:
RJ-45 Ethernet port.
USB port.
DC inlet port.
152810 UniPRO
Page 6 User Guide
Page 7

Power
UniPRO MGig1 can be powered from:
A rechargeable battery pack,
AA alkaline batteries (not supplied) in an optional holder,
Directly from power connected to the DC inlet.
UniPRO SEL1 can be powered from:
A rechargeable power module,
AA alkaline batteries (not supplied) in an optional holder,
Directly from power connected to the DC inlet built in to the power module.
Power Management, battery pack and power module
A fully charged battery pack or power module will support up to five hours of heavy, continuous use of a
single port, or 3.5 hours continuous use of two ports. For maximum life of the unit, it is recommended to
discharge it fully and then recharge it fully at least once a month.
The rechargeable battery pack and the power module are not user-serviceable. When they have reached
the end of their life, contact your local IDEAL representative for service.
Battery Pack and Power Module Recharging
The battery pack or power module can be fully recharged in three hours with the handset switched ON or
OFF. To recharge, connect the supplied power adaptor to the DC inlet. For convenience the power
module may be removed from, or left attached to, the UniPRO SEL1 for charging. The Power LED next
to the DC inlet glows green to show that the battery is being charged, and flashes green to show that it is
not being charged.
The UniPRO MGig1’s battery pack charge state is indicated at FULL, 2/3, 1/3 and EMPTY by the
graphical power meter shown in the display’s information bar at the top of its LCD display.
Fig 2 Power indications
UniPRO 152810
User Guide Page 7
Page 8

Power LED
Status
Green
Power ON. Battery level sufficient for use
Red
Power ON. Battery charge level low but still operational
Off
Power OFF
In the unlikely event of a system lock-up which
prevents MGig1 from being switched OFF, it may
be necessary to perform a master reset. This will
not delete any stored data.
Remove the battery pack (Fig 3) to
access a small aperture in the case
molding.
Insert a paper clip into the reset hole and
press the internal reset switch.
Replace the battery pack.
Fig 3 MGig1 master reset
The SEL1’s power module charge state is indicated by an LED directly below the Layer button. LED
indications are:
Switching ON and OFF
To switch ON the units, press the ON/OFF button:
UniPRO MGig1 displays a splash screen with the IDEAL logo and model identity followed by the
home screen.
UniPRO SEL 1 performs a brief lamp test and is ready for you to choose the Layer you wish to
test over.
To switch OFF either unit, press and hold the Power button for approximately 1/2 second. The SEL1
shuts down immediately, the MGig1 displays a shutdown message on the screen and the currently stored
setup is saved. If either unit does not switch OFF within five seconds, see Master Reset. Always switch
OFF either unit before removing the battery pack or power module.
CAUTION
EQUIPMENT DAMAGE. Do NOT remove the battery pack or power module when the unit is
switched on.
Power Saving
UniPRO MGig1 has power saving preferences that are selected from SETUP>SYSTEM>PREF. Auto Off
can be Disabled (unit remains ON indefinitely), or set to switch the unit OFF after three, 10 or 30 minutes
of inactivity. The backlight can be set to Always On, or to dim to 50% brightness after three minutes of
inactivity. Note that when mains power is connected the display is always on full brightness and the unit
remains ON indefinitely.
UniPRO SEL 1 remains ON indefinitely whether on battery or mains power.
Master Reset
152810 UniPRO
Page 8 User Guide
Page 9

Function
MGig1
Solo
MGig1
Solo
PLUS
MGig1
Solo
PRO
MGig1
Duo
MGig1
Duo PLUS
MGig1
Duo
PRO
Transmission testing over copper
IPv4 & IPv6
Cable test
PoE detection and load test
Ping test
Traceroute test
Hub blink
No. of VLANS supported
3 3 8 3 3
8
Traffic generation
Results storage & export
Transmission testing over fiber
Loopback mode
Multistream
Bi-directional
MPLS
BERT
RFC2544
NetSAM (Y.1564)
SLA-Tick
Replaceable insert – RJ-45 socket
To replace a damaged or worn RJ-45 socket insert proceed as follows:
Equipment required: Kit, IDEAL part number 150058 – includes Tool x1 and Replacement Insert x10.
Switch the UniPRO handset OFF and remove all attached cables.
Carefully push the tool STRAIGHT into the socket. Fig 4A. BE CAREFUL - DO NOT MOVE
THE TOOL VERTICALLY!
Keep the tool STRAIGHT and give a firm pull on the insert until it is out of the socket. Fig 4B.
Hold the replacement insert between your fingers and carefully align it with the socket. Push it
STRAIGHT into the socket with your finger until it is secure. Fig 4C.
Fig 4
Functional overview
The MGig1 range offers six models. The available functions are listed below. The information throughout
this publication details the functions available to MGig1 Duo PRO. Please check this table to confirm the
functions available on your tester.
Duo models can generate traffic or loop on the A and the B ports
UniPRO 152810
User Guide Page 9
Page 10

1
2
RJ 45 port
6
1,2
Optical link LED
11
Escape key
2 2 RJ 45 activity LED
7
Autotest button
12
Cursor and ENTER keys
3 2 RJ 45 link LED
8
USB port
13 Charger LED
4
1,2
Optical port (SFP)
9
LCD color display
14 ON/OFF button
5
1,2
Optical activity LED
10
Function keys F1 to F4
15 DC in connector
Handset Controls, Indicators and Ports – MGig1
Primary ports (‘A’) Secondary ports (‘B’)
Fig 5
1
Fig 5 items 4, 5 & 6 – MGig1 PLUS & PRO models only.
2
Fig 5 items 1 to 6 on right hand view – MGig1 Duo models only.
152810 UniPRO
Page 10 User Guide
Page 11

1
RJ 45 port
10
Layer 2 LED
2
RJ 45 activity LED
11
Layer 1 Regenerate LED
3
RJ 45 link LED
12
Layer 1 Physical LED
4 Optical port (SFP)
13 Layer button
5 Optical activity LED
14 Power status indicator LED
6
Optical link LED
15 ON/OFF button
7
USB port
16
Power module
8
Layer 4 LED
17
Charger LED
9
Layer 3 LED
18
DC in indicator
Handset Controls, Indicators and Ports – SEL1
Fig 6
UniPRO 152810
User Guide Page 11
Page 12

Cursor and ENTER keys. The arrowed cursor keys are
intuitively marked to move the highlighted field between all
menu icons, settings fields and drop-down menus that
appear on the display. ENTER selects the currently
highlighted option.
Escape key. Returns to previous screen or hides the
options of a drop-down menu. Note that when a value in a
settings field is changed, if the Escape key is pressed before
the soft key ‘APPLY’, the value will not be stored.
Autotest key. Immediately runs pre-stored tests. A new
tester will have factory stored tests in memory. These are
easily changed using the SETUP menu.
Function keys. F1 to F4 are to select the corresponding
soft keys at the lower edge of the display.
Fig 8 Keypad navigation
Menu Navigation
MGig1
Touch screen. The soft keys, menu icons and items on drop-down lists can be selected by pressing the
touch screen. Although the touch screen can be activated with your finger, we recommend using the
nylon stylus provided.
Fig 7 Touch screen navigation
Alternatively, MGig1 may be operated with the key pad alone:
Soft keys. The soft keys appear along the bottom edge of the display. Their function changes and is
dependent on the screen currently shown on the display.
152810 UniPRO
Page 12 User Guide
Page 13

Fig 9
Data entry. When you navigate to and select
a field that requires a value or text to be
entered, such as a customer’s name or a
URL, a QWERTY keyboard will be shown on
the display (Fig 9). All data is entered using
the QWERTY keyboard. The touch screen
makes the keyboard particularly easy to use.
Alternatively, move the key that is highlighted
on the keyboard using the tester’s cursor
keys. ENTER selects the currently
highlighted key which will now appear in the
text window directly above the keyboard. Key
stroke errors are corrected using the
backspace key ( <− ). Press the UP cursor
key to move the cursor into the text window
for editing.
Press the blue Layer button on the front of the handset to
cycle through all loop options available. Each time the
button is pressed a green LED lights next to the Layer
selected. The LED directly below the blue button indicates
that SEL1 is dormant but still powered on. The loop options
available are:
Layer 4 UDP
Layer 3 IP
Layer 2 MAC
Layer 1 Regenerative
Layer 1 Physical
No loop
Fig 10 SEL1 indications
Press the QWERTY keyboard’s SHIFT key to change the display from lower to upper case. Press SHIFT
a second time to display symbols and punctuation characters.
SEL1
UniPRO 152810
User Guide Page 13
Page 14
Transmission testing concepts
General
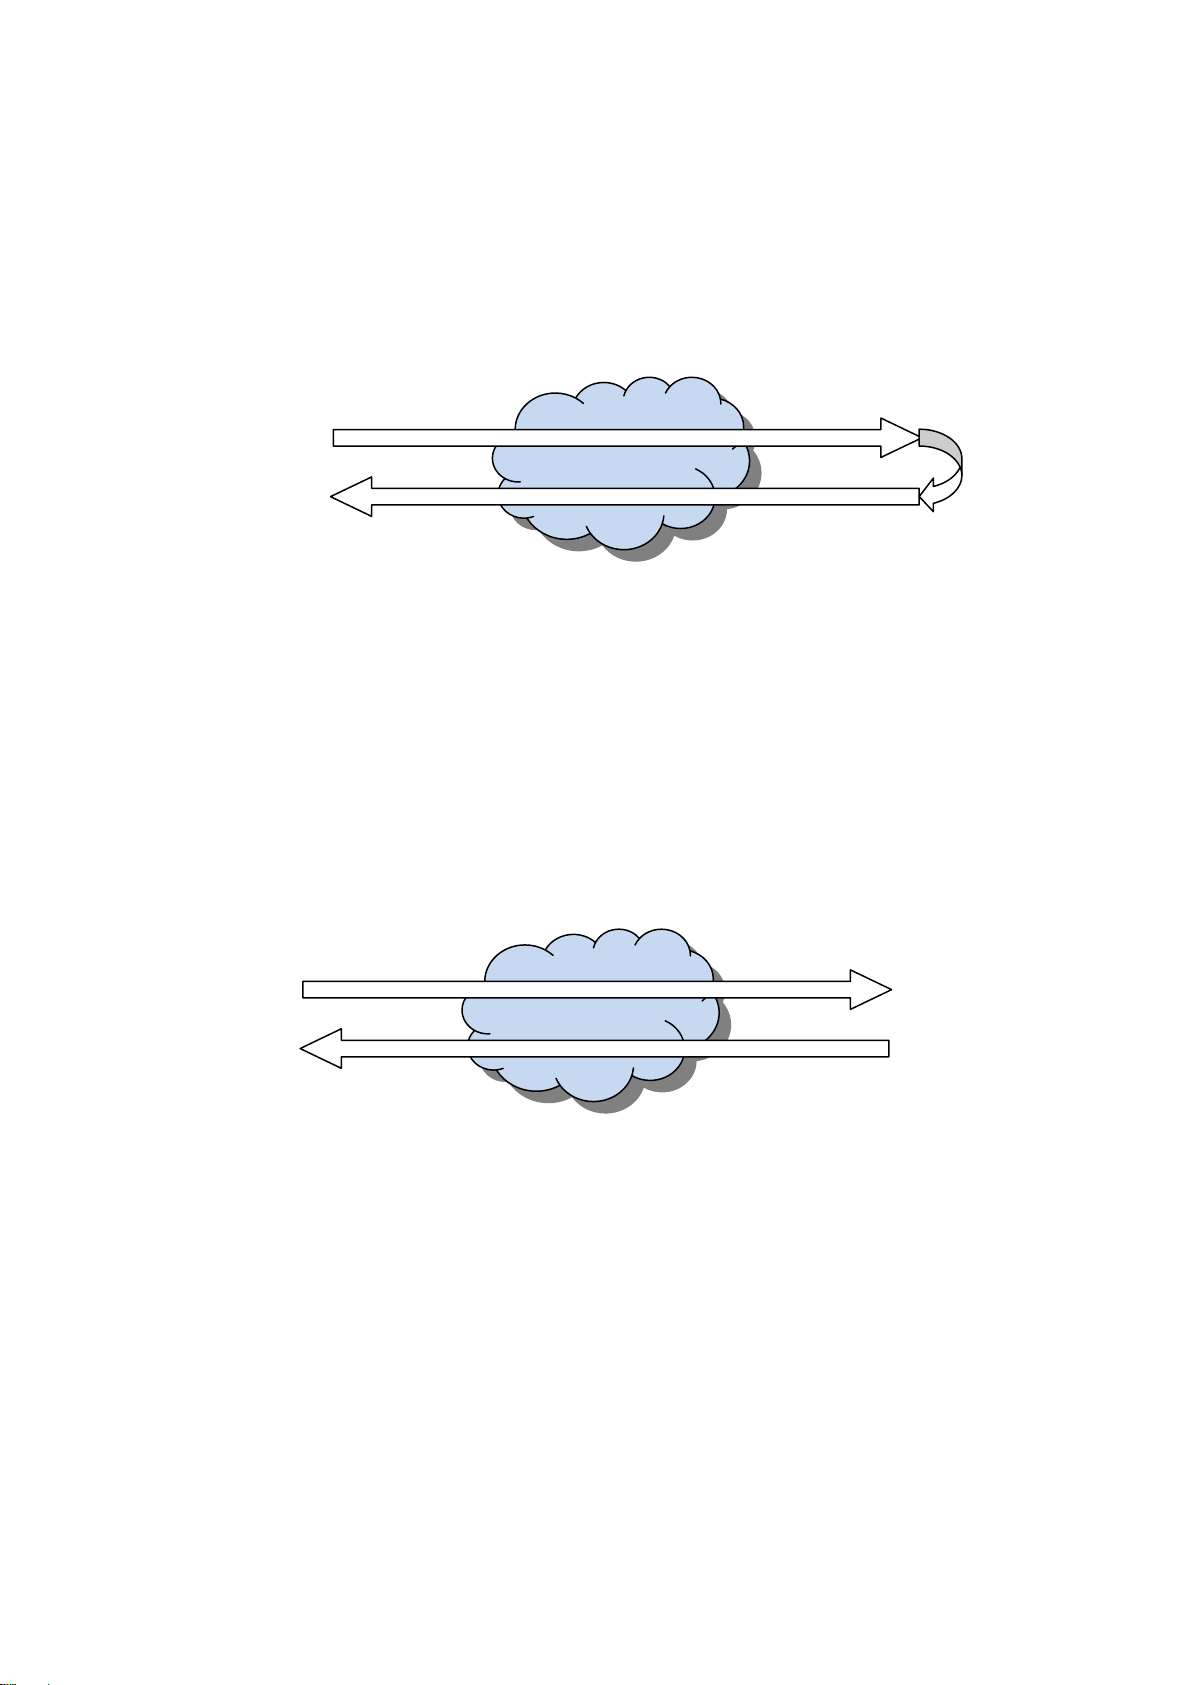
The principle of Ethernet transmission testing is that traffic is sent through a network and checked at the
other end. For single-ended testing, traffic is sent through the network to a device that loops it back to the
sending device. Therefore, traffic is generated and checked at the same location.
Fig 11 Single-Ended test method with loopback
This method is very easy to set up. A loopback device, such as SEL1, can be installed at the remote end
of the transmission loop with minimum skill requirements, and can be controlled by the tester at the local
end.
Alternatively, the sending device and the checking device may be in different locations.
Fig 12 Bi-Directional test method
Unlike the loopback method, bi-directional tests confirm the direction as well as the nature of errors. As
two full test devices are required to run a bi-directional test, set up is more complicated. However, when
they are set in Master-Slave mode, one device can control the other and so only one operator is needed.
152810 UniPRO
Page 14 User Guide
Page 15

Ethernet frame structure and Layers
Ethernet frames comprise a payload (the user data) inside a number of layers of control elements. The
higher the layer, the greater the frame’s inherent ability to enable the network to deliver frames to the
correct destination. Each layer adds to the complexity of the frames and to the amount of overhead. This
reduces the space available for the payload.
When the payload is tested with procedures such as BERT, it is recommended to use the lowest layer
frame type that will propagate through the transmission path under test. This makes sure the maximum
payload is available for the test data.
Layer 1 frames begin after a Preamble (PRE) and a Start of Frame Delimiter (SFD) which are used for
frame alignment. These frames are separated from one another by an Inter Frame Gap (IFG). Layer 1
Ethernet frames contain the maximum amount of BERT / Quality of Service (QoS) test data (the Payload
equals the Frame size) but they can only pass through a physical connection, and not through switches
or routers. Layer 1 frames do not have the ability to check frame errors.
Fig 13 Layer 1 Frame
Layer 2 frames have a Destination and Source MAC address added that follows the SFD. The MAC
addresses enable the frames to be sent to a specific destination through Layer 2 switches. Layer 2
frames may also have VLAN and/or MPLS tags added after the source MAC (sometimes this is called
“Layer 2.5”). They end with a Frame Check Sequence (FCS) used to check the frame for errors. The
Layer 2 Payload is everything between the end of the source MAC (or VLAN / MPLS tags if present) and
the start of the FCS.
Fig 14 Layer 2 Frame
Layer 3 frames add a Source and Destination IP address after the source MAC; this enables them to be
sent through Layer 3 switches and routers. The Layer 3 Payload is everything between the end of the IP
header and the start of the FCS.
Fig 15 Layer 3 Frame
Layer 4 frames add a Protocol header (PROT) after the IP header. This defines the transport layer
protocol (TCP / UDP) followed by Destination and Source Port numbers. This allows traffic to be routed to
a particular Port. The Layer 4 Payload is everything between the end of the Layer 4 header and the start
of the FCS.
Fig 16 Layer 4 Frame
UniPRO 152810
User Guide Page 15
Page 16

Loopback and Layers
When traffic is looped, the type of loop may need to be determined by the type of traffic and the structure
of the transmission path to be tested. Usually, the Loop type is the same as the Layer type of the traffic –
e.g. Layer 3 traffic is looped at Layer 3.
When (a) the loopback device is connected to a dedicated port, or, (b) when the network segment to
which the loopback unit is connected carries only test traffic, the device can be set to loop all traffic
received. When the network segment carries both test traffic, and non-test traffic that should not be
looped, the loopback unit can be set to only loop traffic that is specifically addressed to it.
Loop types are as follows:
Layer 1 (Physical) Loop. Every bit received is immediately re-transmitted to its source with minimal
delay and exactly as received even when it contains errors. This loop type can only be used over a
physical medium with no active network elements.
Layer 1 (Regenerate) Loop. Errored frames are dropped. Good frames are retransmitted exactly as
received. To determine if a frame contains an error it is necessary to receive and check the complete
frame before it is retransmitted. This introduces at least one frame of delay in the retransmission.
Therefore the loopback operation introduces some latency that must be allowed for in latency
measurements. Furthermore, if the frame size varies (e.g. if the traffic contains multiple streams with
different frame lengths) the latency will vary and this will appear as jitter, which must be allowed for in jitter
measurements. (This also applies to all the higher layer loops.)
Layer 2 (MAC). Good frames are retransmitted, as in L1 (Regenerate), but are altered so that the Source
and Destination MAC addresses are swapped. This makes sure that frames sent to the loopback device’s
MAC address (Destination MAC in the received frame) are returned to the sender’s MAC address (Source
MAC in the received frame). This loop type can be used over a physical connection or over a switched
network using Layer 2 switching.
Fig 17 Layer 2 Loop
152810 UniPRO
Page 16 User Guide
Page 17

Layer 3 (IP). Good frames are retransmitted and altered so that the Source and Destination MAC
addresses, and, the Source and Destination IP addresses are swapped. This is so that frames sent to the
loopback device’s IP address (Destination IP in the received frame) are returned to the sender’s IP
address (Source IP in the received frame). This loop type can be used over (a) a physical connection or
(b) over a switched network using Layer 2 or Layer 3 switching or (c) over a routed network.
Fig 18 Layer 3 Loop
Layer 4 (UDP). Good frames are retransmitted and altered so that the Source and Destination MAC
addresses and the Source and Destination IP addresses are swapped as at Layer 3. In addition this loop
type swaps the UDP Source and Destination Port numbers, so that traffic sent to a particular port is
returned from that same port back to the originating port. This loop type can be used over any type of
connection or network.
Fig 19 Layer 4 Loop
UniPRO 152810
User Guide Page 17
Page 18

Connection Establishment
To make a connection between a tester and a loopback device, or between two testers becomes
progressively more complicated the higher the Layer used.
Layer 1 is sufficient to test a physical medium, such as a copper or fiber cable, or a radio link. Higher
layers can be used, and their settings, such as addresses and VLAN/MPLS tags, have no effect apart
from reducing the amount of frame space available for the payload. The only requirement is that the
tester is set to use the attached loopback device (or slave tester) as its target.
Layer 2 is required in a LAN environment to connect via Layer 2 switches. The tester can be commanded
to DETECT all compatible IDEAL devices (loopback units or testers) on the network. The detected
devices can be added to the tester’s Target list and one of them selected as the target for tests. The test
frames will have the target’s MAC address in their destination field. Higher layer information that may be
present in the frames will have no effect on the communication between the tester and the target.
Layer 3 must be used when tests are run over a routed environment in the WAN outside of the local LAN.
The tester needs to identify its target by a public IP address. When the target is located in the WAN, it will
need to be assigned a known address so that the tester can be set up to communicate with it. It is not
possible to automatically DETECT compatible IDEAL devices/targets that are outside of the LAN. The
test frames will have the target’s IP address in the destination field. Frames retransmitted by the loopback
device will have the tester’s IP address in their destination field. The destination MAC will be replaced by
the MAC of the gateway.
Layer 4 is used when the target is located in another LAN that is connected to the tester’s LAN by a WAN
connection, on the far side of an edge router. The target will not have a public IP address, but instead a
private one assigned, either automatically or manually, by its local network. The test frames will have the
public IP address of the edge router in their Destination fields, and in addition the port number of the port
to which the target is connected. The router will need to be set up with port forwarding to forward the
frames to the target using the correct port number. The frames retransmitted by the loopback device will
have the LAN address of the router in their destination field. This will be translated by the router using its
Network Address Translation (NAT) table so that the frames eventually arrive back at the originating
tester.
In addition to the increased complexity of the setup at the higher layers, the issues that follow can arise
and must be overcome before testing can proceed.
Firewalls in LAN edges are designed specifically to block the type of traffic that testers generate. Test
traffic can only pass through a firewall that has an open port, or a Demilitarized Zone (DMZ), to which the
target is connected.
Ethernet transmission tests can generate large amounts of traffic and are designed to stress networks to
the point of failure. This must be taken into account when setting up the tests in order to avoid disrupting
other network traffic or causing network elements to block the overload situation.
Loopback devices that are configured to Layer 1 (Physical) loop cannot be automatically detected or
remote controlled because they do not receive or respond to Ethernet frames. They only retransmit them.
Targets and Services
Targets are destinations for test traffic. They can be (a) loopback units that retransmit the traffic back to
the source or, (b) other testers that receive and check the traffic and also generate and send traffic back
the other way.
A service is a stream of traffic with specific characteristics. Up to eight services, each with different
characteristics, can be used simultaneously for testing a network’s ability to carry multiple types of traffic,
to different destinations and, for example, over different VLANs. Each service is sent to a defined target.
This may be a common target for all services, selected from the Targets list, or the destination addresses
(MAC & IP) may be set individually for each service. By default a service will use the destination MAC
and IP of the target and source MAC and IP of the tester.
152810 UniPRO
Page 18 User Guide
Page 19

Traffic Impairments
Transmission tests check for impairment to Ethernet traffic in the form of Errors, Latency and Jitter.
Frame errors are either Lost Frames (frames that were transmitted but were lost in the network)
or Corrupted frames (frames that were received but were found to contain errors).
Payload errors are errors in the data part of the Ethernet frames.
Latency is network propagation delay.
Jitter is short term variations in network propagation delay.
To detect the above listed impairments, tests are run under specific, user defined conditions, e.g. with
different frame sizes and frame rates, and in the presence of varying levels of traffic loading. Some tests
determine the maximum performance that a network connection can achieve without exceeding predefined limits on impairment levels.
Ethernet transmission testing methods
Various methods of Ethernet transmission testing have been developed over the years. Each
development brought additional sophistication and value to the knowledge about the performance of the
network being tested. More sophistication increased the test times. Some tests can run for days or
weeks. The most recent developments have sought to reduce test times without losing valuable
information about the network performance.
BERT
Bit Error Ratio Test (sometimes incorrectly referred to as “Bit Error Rate Test”) is a traditional test method
used for many types of telecommunications transmission system. In Ethernet environments, it focuses on
testing the frame payload, putting pre-defined patterns of test data into the frames and checking them bitby-bit at the receiver. Individual bit errors are counted and expressed as a ratio to the total data received,
and periods of time during which the error ratio exceeds pre-defined limits are recorded. Errors of
different types can be forced into the frames or the payload data in order to confirm that the error checking
mechanism is working correctly and to determine how the network responds to errored data.
SLA-Tick
Service Level Agreements (SLAs) are commonly used to define a contractual commitment to provide
specified minimum performance of network connections. They normally define minimum Information Rate
and maximum Latency and Jitter. For the SLA-Tick test, multiple services can be selected to occupy the
available bandwidth, each with its own fixed frame size and each having its own performance limits. This
test always uses Layer 4 framing, because it can propagate through all types of network and because the
reduced payload is not relevant.
RFC2544
The Internet Engineering Task Force defined this testing methodology which comprises the following subtests, each of which can be included or omitted from the overall test sequence. (Note, however, that some
of the sub-tests rely on the results of others before they can be run.) A full RFC2544 test with all sub-tests
at all frame sizes can take a long time to complete, so the tester provides a choice of test profiles relating
to the time needed to complete the tests. Layer 4 framing is used.
Throughput This is a test of achievable Information Rate at different frame sizes. The maximum
theoretical Information Rate decreases with decreasing frame size, because the overhead becomes more
significant compared to the payload. This sub-test compares the actual performance against theoretical
and target limits.
UniPRO 152810
User Guide Page 19
Page 20

Latency Latency increases with increasing frame size because frames have to be buffered in
network equipment prior to onward transmission and the bigger the frame the longer it takes before it can
be forwarded. The Latency sub-test measures latency against theoretical and target limit for different
frame sizes.
Jitter This should be independent of frame size, and the jitter sub-test is designed to confirm this
and to reveal any network impairments which might be introducing jitter dependent on frame size.
Frame Loss As frame rate increases, networks will start to drop frames. For each frame size, this
sub-test varies the frame rate until the point is found at which frames just start to be dropped.
Back-to-Back Each Ethernet frame must be separated from the next by a minimum Inter Frame
Gap (IFG). For each frame size, the Back-to Back sub-test assesses the ability of the network to handle
frames separated by the minimum IFG, measuring the longest burst of these frames that can be
successfully propagated without errors.
System Recovery When network elements are overloaded by excessive traffic, they can take some
time to recover to a condition in which they are ready to transmit traffic again. For each frame size, the
System recovery sub-test generates traffic at the rate found by the Throughput sub-test and measures the
recovery time of the network.
Y.1564 (NetSAM)
In an attempt to overcome some of the limitations of RFC2544, notably the long test times, the sequential
nature of the tests and the unrealistic single-service traffic method, the International Telecommunications
Union defined a new Ethernet service activation test methodology - Y.1564. The first phase in this method
is a Service Configuration Test, which evaluates the ability of the network to achieve the Committed
Information Rate (CIR) and Excess Information Rate (EIR) without error for each of a multitude of
services, one at a time. The Service Performance Test then measures the Frame Transfer Delay
(Latency), the Frame Delay Variation (Jitter), the Frame Loss Ratio and the Service Availability
simultaneously for each service at the CIR. By doing this, the NetSAM test evaluates all of the Key
Performance Indicators of the network at once over multiple services simultaneously, much more
accurately simulating real-world traffic than RFC2544. It also polices the ability of the network to control
and handle traffic which is marked in color to indicate its priority in relation to the CIR and EIR defined in
the SLA. Layer 4 framing is used.
152810 UniPRO
Page 20 User Guide
Page 21

Fig 21
Through mode is for viewing statistics. Select
PORTS and choose Through Mode from the
dropdown menu and select APPLY (F3). MGig1
will detect the connected services and show them
on the display (Fig 21). It will attempt to negotiate
the highest connection rate between the two
networks.
Select STATS to view current traffic as graphs and
tables. Traffic is categorized as Top Users, Top
VLANs, MAC and LINK data. For further
information on STATS see Statistics on page 54.
For further information on Jobs see Jobs on
page 56.
Modes of Operation
MGig1 has two modes of operation, Endpoint and Through Mode. To change between Endpoint and
Through Mode, from the home screen select PORTS (F2), choose the mode from the dropdown menu
and select APPLY (F3). Each time you change modes the detected services are PoE (802.3af/at. Not
Cisco pre-standard), ISDN S, PBX and Unknown. The IPv4 and IPv6 addresses assigned to the tester
(when available) are shown on the ‘Endpoint’ screen.
Endpoint mode
Endpoint is the mode from where all transmission tests and tools are run (Fig 20A).
Before a transmission test is run, a far end loopback must be set. Configuration of a SEL1 handset that
has been discovered as a target can be set remotely from the MGig1, see page 29.
A B
Through mode
Fig 20
UniPRO 152810
User Guide Page 21
Page 22

From the home screen select the PORTS icon. The
Ports screen is shown on the display (Fig 22).
Choose the required ports, copper or optical, from
the dropdown lists and press APPLY (F3). Modes
are explained on page 21.
When you select APPLY (F3) MGig1 detects
connected services and shows them on the display.
Tick the check box to always see this screen at
startup.
NOTE
Fig 22 shows the Ports screen from the
MGig1 Duo PRO. Port and mode options are
dependent on the model.
Fig 22
Ports
152810 UniPRO
Page 22 User Guide
Page 23

Page 24
Page 26
Page 36
Page 40
Page 48
Page 38
Page 27
Set addressing type
Set level, ID & PCP
Port settings inc. max/min frame size
Set addressing type
Port id and max/min frame size
Enter tester owner’s details
Page 56
Set language preference
Set user preferences
Set time and date
Product information
Update software
Restore factory defaults
Page 30
Page 30
Page 31
Page 31
Page 31
Set cable type & NVP
Set Loopback type
Set IR, frame size & Profile for Traffic gen
Set Loopback type
Set IR, frame size & Profile for Traffic
Manage current and stored configurations
Setup
User-defined settings and preferences for MGig1 can be set from the SETUP menu illustrated at Fig 23.
Net B and Tools B refer to Duo models. Check your model’s range of functions against the table
on page 9.
UniPRO 152810
User Guide Page 23
Fig 23
Page 24

Targets
Select this option to access a table from where you may enter, edit, delete and remotely configure up to
10 targets. The targets you save here can be quickly selected when running tests.
A B
Fig 24
To add targets proceed as follows: From the home screen select SETUP>TARGETS – the ‘Targets’
screen is shown on the display (Fig 24A). Select ADD (F1) and a pop up dialog gives you the choice of
searching for IDEAL targets or to configure the search manually. Select SEARCH from the pop up dialog
and after a scan the Discover screen is shown on the display, Fig 24B.
A B
Fig 25
On the Discover screen, highlight the target you wish to add and select SELECT (F3). The new target
screen appears, Fig 25A, where you can reconfigure some of the new targets details before you add it to
the target list. Select APPLY (F3) and the ‘Targets’ screen is shown on the display again but with the new
target added, Fig 25B.
152810 UniPRO
Page 24 User Guide
Page 25

To make a visual confirmation of a SEL1 target,
from the ‘Targets’ screen (Fig 25B):- Highlight the
SEL1 and select EDIT (F3) and the display shows
the ‘Target #’ screen for the SEL1’s details (Fig 26).
Select FLASH LEDS (F4) and the five Layer LEDs
on the SEL1 handset will flash together. This
quickly enables you to physically identify the unit.
Fig 26
To delete a target from the Targets list use the tester’s arrow keys to highlight the device to be removed
and then select DELETE (F2), a pop up dialog asks for confirmation, select ‘Yes’ and the target is
removed from the list.
To reconfigure a SEL1 target see Remote Control, MGig1 to SEL1 on page 29.
UniPRO 152810
User Guide Page 25
Page 26
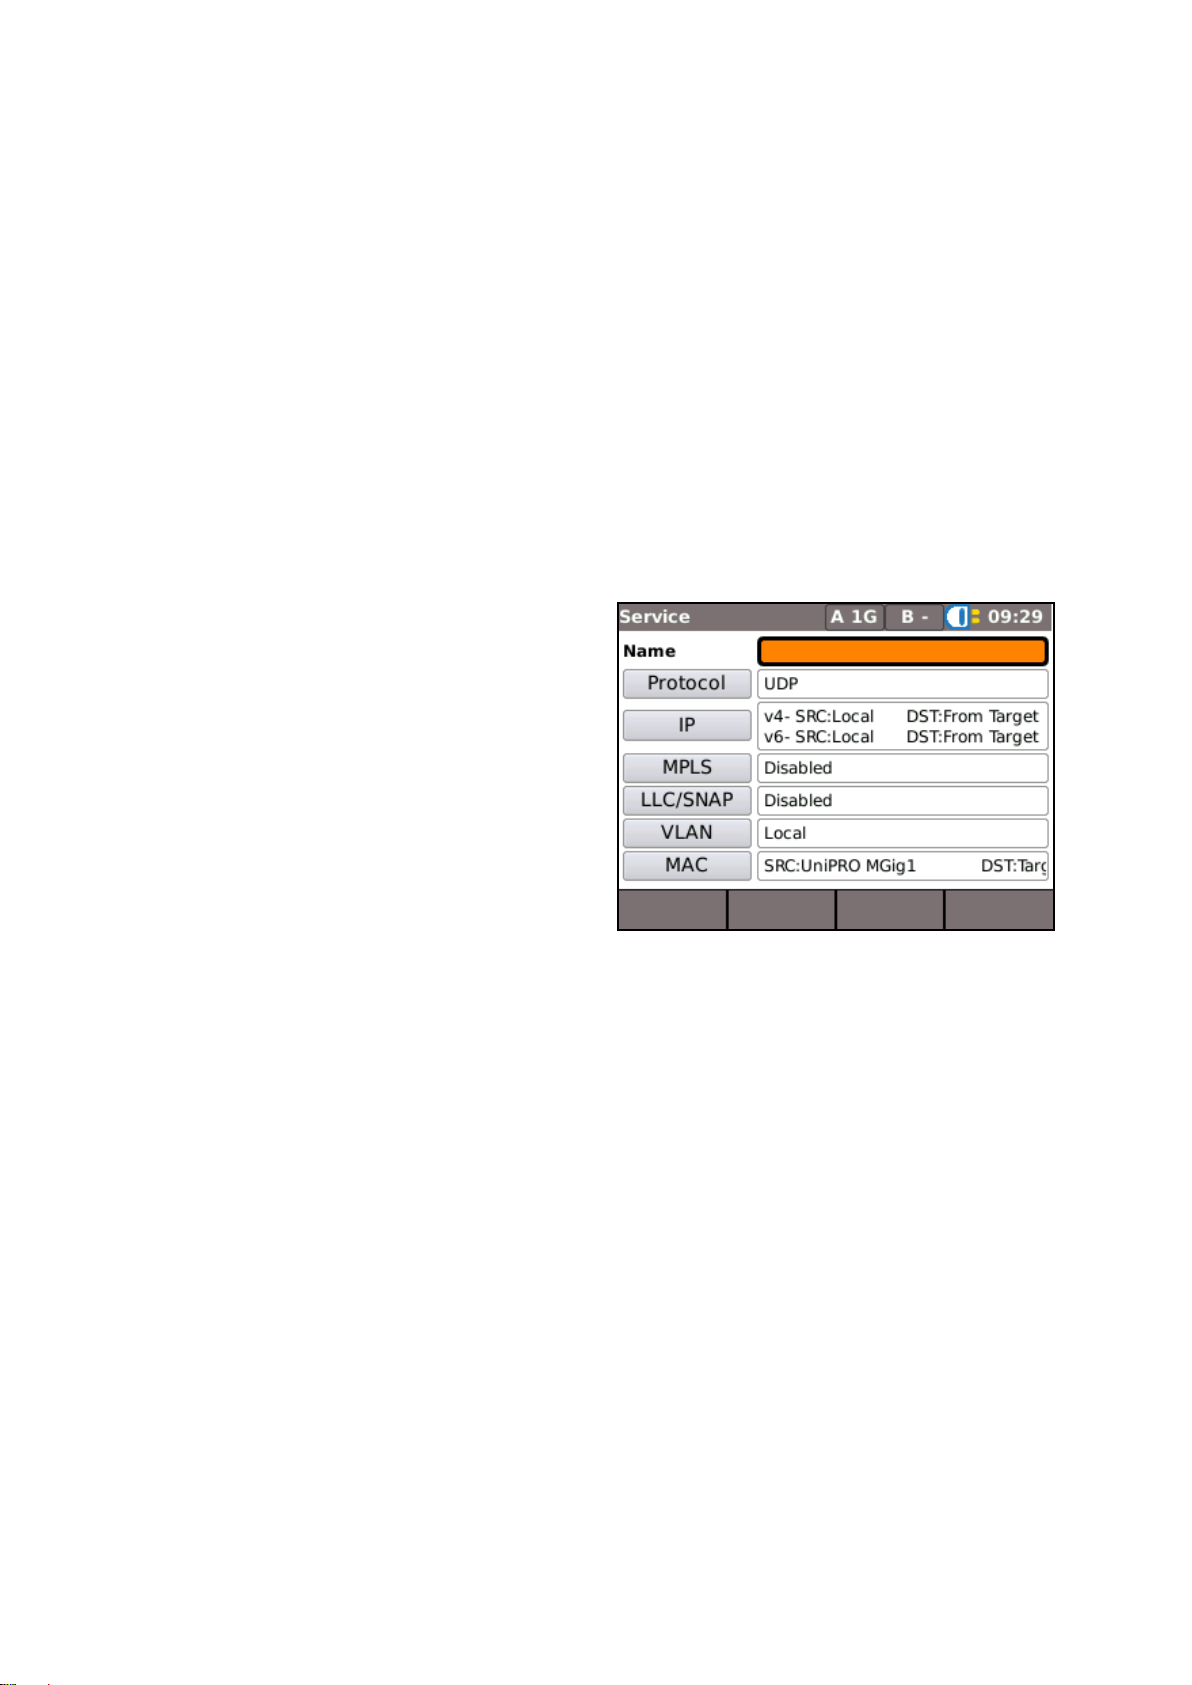
Name Allocate a name to each service when
required. E.g. CCTV, Email, Video etc.
Protocol Choose from TCP, UDP, ICMP.
IP Set source/destination as local/from target or
define your own. W hen you define your own
destination (Custom) it overrides the target selected
in a test. When required, each service may be set
with a different address, i.e. eight separate targets.
You must manually enter the address for each.
MPLS Enable or disable.
LLC/SNAP Enable or disable.
VLAN Set VLAN to Local or Custom.
MAC Set source/destination as local/from target or
define your own.
Fig 27
Services
Select SETUP>SERVICES; the ‘Services’ screen is shown on the display. From here you may define the
characteristics of up to eight services. Select a service from the list, the screen changes from ‘Services’ to
‘Service’ (Fig 27) and shows the factory default settings. Once you have entered your own settings they
will remain unchanged until edited. Settings can be exported to, or imported from another MGig1 handset
via the CONFIG facility, see page 59.
The choices made and values entered here will define the composition of each Ethernet frame generated
by MGig1 – see Ethernet frame structure and Layers on page 15.
By default the source IP/MAC will be taken from the Target and the destination IP/MAC will be taken from
the tester itself. These can be overridden to simulate traffic coming from multiple sources (editing the
source IP/MAC) or to force traffic to multiple destinations (editing the destination IP/MAC).
152810 UniPRO
Page 26 User Guide
Page 27

Each of the four transmission tests allow for errors
to be injected while the tests run.
To set up Error Inject, from the home screen select
SETUP>TESTS>ERROR and the ‘Setup:Inject’
screen is shown on the display (Fig 28). From the
three dropdown lists set:
Error type:
FCS (Frame Check Sequence) helps determine the
way the network responds to errors – expect
frames with FCS errors to be discarded.
Pattern is a bit error. Frames that contain these
errors should return. A reason to inject pattern
errors is to confirm that the tester is counting bit
errors correctly – e.g. if two errors are injected, two
should be recorded.
Oversize or Undersize will inject frames of a size
that is one byte greater than the maximum or, one
byte less than the minimum set in
SETUP>NET>RJ45.
Errors: Single or Ratio.
Select ‘Single’ and while a test runs, each time you
press INJECT (F3) (Fig 29) one error is injected.
Select ‘Ratio ’and while a test runs, when INJECT
(F3) is pressed errors are injected until you press
F3 again to stop them (Fig 30).
Ratio: Can be set from 1 in 10 to 1 in 1013 (steps
in powers of 10). Sets the limit for ratio of errors to
be injected – e.g. if set to 1 in 10, then one error is
injected for every 9 good frames or bits.
Fig 28
Fig 29
Fig 30
Test data/Error inject
UniPRO 152810
User Guide Page 27
Page 28

A second MGig1 can be set in slave mode. In
slave mode, MGig1 can replicate a SEL1 and be
used as a loopback unit, or it can be remotely
configured and used as a second tester in bidirectional tests – see Transmission testing
concepts, General, on page 14.
To put the second MGig1 in Slave Mode:
From the home screen select TESTS and then
select the SLAVE icon. Select RUN (F1) to enter
Slave Mode (Fig 31). This MGig1 is now the slave.
From the master MGig1:
Select SETUP>TARGETS and the ‘Targets’ screen
is shown on the display. Select ADD (F1) and a
pop up dialog gives you the choice of searching for
IDEAL targets or to configure the search manually.
Select SEARCH from the pop up dialog and after a
scan the ‘Discover’ screen is shown on the display.
Highlight the MGig1-Slave and select SELECT
(F3). The ‘Target #’ screen is shown on the
display. Select APPLY (F3) and the tester returns
to the ‘Targets’ list which now includes the recently
discovered MGig1 (Fig 32).
For Bi-directional tests you must set the slave
MGig1 to ‘No Loop’ as follows:
Select SETUP>TARGETS, the ‘Targets’ screen is
shown on the display.
Use the arrow keys to navigate to the slave MGig1
and select EDIT (F3), the ‘Target #’ screen is
shown on the display (Fig 33). Select No Loop
from the dropdown list and then select APPLY (F3).
NOTES
1. When MGig1 is in slave mode and used as
a loopback device, it can be remotely
configured in the same way as a SEL1. See
MGig1 to SEL1 on page 29.
2. To exit slave mode select the MASTER
icon.
Fig 31
Fig 32
Fig 33
Remote control
MGig1 to MGig1
152810 UniPRO
Page 28 User Guide
Page 29

From the home screen select SETUP (F4) and
then select the TARGETS icon. All SEL1
handsets (and any other devices) previously
discovered will appear on the Targets list as
illustrated in Fig 34. Highlight the SEL1 you wish
to control and select EDIT (F3), the screen
changes from ‘Targets’ to ‘Target #’, Fig 35, and
the SEL1s main details are listed. Select
CONFIG SEL1 (F2) and all of the SEL1s
configurable details appear, Fig 36. Configure
SEL1 as required and select APPLY (F3). The
SEL1’s configuration will be updated and the
SEL1 handset will reboot.
Fig 34
Fig 35
Fig 36
When an additional SEL1(s) has been connected to
the network and it does not appear on the Targets
list:- Select ADD (F1) and a pop up dialog gives you
the choice of searching for IDEAL targets or configure
the search manually. Select SEARCH from the pop
up dialog and after a scan the ‘Discover’ screen is
shown on the display, highlight the additional SEL1
and select SELECT (F3). A new target screen
appears where you can reconfigure some of the new
target’s details before you add it to the target list.
Select APPLY (F3) and the ‘Targets’ screen is shown
on the display again but with the new target added.
SEL1 Loop layer
The SEL1’s loop layer can be changed without the
need to reconfigure as follows: Highlight the SEL1 on
the Targets list (Fig 34), select EDIT (F3) and the
‘Target #’ screen is shown on the display, Fig 35.
Loop Type can be set from a drop down menu.
Choose the Loop type you require and whether to
loop all traffic, select APPLY (F3) and the loop layer
on the SEL1 changes immediately.
MGig1 to SEL1
UniPRO 152810
User Guide Page 29
Page 30

Fig 37
To set up Ping select SETUP>TOOLS A>PING4
(or PING6). From here you can:
Set the target URL/Numerical address
(select from up to 10 targets stored in the
IPv4 or v6 TARGET look up table or edit
the URL currently shown on the display),
Count (Number of times to repeat the
Ping - 1 to 999999),
Pause (Interval between successive
Pings - 1 to 5 seconds),
Length (Number of bytes in Ping frame
payload - 8 to 1000 bytes).
Fig 38
The results of a ping test are shown in Fig 38. The
range of possible results are:
Info: READY, IN PROGRESS, PASSED,
NETWORK UNREACHABLE,
UNKNOWN HOST.
Tx: Count of transmitted ping frames: 1
to 999999.
Rx: Count of successfully received Ping
responses: 1 to 999999.
Delay: Round trip delay in ms between
transmitting Ping and receiving response.
Shown on the display as Minimum,
Average and Maximum.
Tools
Ping4 and Ping6
Ping will test the availability and measure the response times of URLs and detected devices.
Both IPv4 and IPv6 addresses can be pinged. The figures below show a Ping4 set up and test screen.
Set up and test results for Ping6 are similar.
152810 UniPRO
Page 30 User Guide
Page 31

Fig 39
Select an individual hop to view its
statistics.
The soft keys PREV (F1) and
NEXT (F3) and are used to
navigate between individual hops.
Each hop is traced three times.
The time recorded during each
trace is shown on the display in ms
as T1, T2 and T3.
PoE
When MGig1 is connected to a port it
automatically detects PoE voltage (when
present). In addition, running a PoE test
will apply a resistive load and measure the
power available at the connected port.
MGig1 identifies which pairs are carrying
power, and displays the voltage(V),
current(mA) and power(W). The PoE test
result screen at Fig 40 shows that pair one
and two, and pair three and six are carrying
11 Watts. The port tested is capable
of powering devices that require upto
11 Watts.
The test is PASSED because the power
available is ≥ the minimum power value
entered at set up.
Fig 40
TRoute4 and TRoute6
Trace Route will display the route and measure transit delays of frames across an IP network.
Press the soft key SETUP (F4) to enter the target or select one from the IPv4 or v6 Target list, and to view
or amend the test settings.
UniPRO 152810
User Guide Page 31
Page 32

Blink
A Hub Blink test forces the connected port of a network device to blink. MGig1 also changes the speed
and therefore LED color (on supporting devices) making it easier to identify the correct port. Select the
BLINK icon from the Tests screen, the test is started and stopped with the soft key F1 which displays as
RUN or STOP accordingly.
152810 UniPRO
Page 32 User Guide
Page 33

To set up traffic generation proceed as follows:
From the home screen select: SETUP (F4). Select
the TOOLS A icon to set up traffic on the primary
ports, or the TOOLS B icon to set up traffic on the
secondary ports. Select the TRAFFIC icon and the
‘Setup:Traffic’ screen (Fig 41) is shown on the
display.
For models with secondary ports traffic can be
generated on the B port while tests are run from the
A port.
Select a target from the dropdown list and set the
duration you wish to generate traffic for.
Targets are added, edited or deleted from
SETUP>TARGETS; page 24 refers.
Fig 41
Info Rate: Enter a value in Mb/s. MGig1 will
calculate the maximum info rate per service based
on the info rate of other services, and the frame
size. You may enter less than the maximum.
When Services set up is complete, the percentage
bandwidth used is displayed at the bottom of the
‘Setup:Traffic’ screen under ‘Used’.
Free Info Rate and Bandwidth Rate are
calculated and displayed for information only (Free
Info Rate is the maximum rate that you can allocate
to the particular service).
Bandwidth Utilization: The bandwidth used by the
particular service, displayed as a percentage.
Fig 42
Frame Size: Choose from the dropdown list. A larger frame size means less frames and therefore less
overhead and more space for payload.
Pattern Data (Hex): Choose the pattern of data to fill the payload from the dropdown list.
Traffic generation
The addressing and protocol for each service is set at SETUP>SERVICES. The service settings available
from the Setup:Traffic screen (Fig 41) are related to how much bandwidth each service takes and the
information rate, frame size and fill. To adjust the settings for each of the eight services, select the
Service, 1 to 8, and the Limits screen for that service is shown on the display, Fig 42.
UniPRO 152810
User Guide Page 33
Page 34

For Service 1 only, select MORE (F1) and choose from three Traffic profiles:
Continuous: This profile will generate traffic evenly and continuously for the entire duration set at the
‘Setup:Traffic’ screen.
Ramp: Sets MGig1 to generate traffic at an information rate that increases or decreases at stepped
intervals. The ramp can be set with the controls that follow.
Start Info Rate – set from 0.1 to 1,000 Mb/s
Stop Info Rate – set from 0.1 to 1,000 Mb/s
Gap – set from 1 to 1,000,000 µs (interval between steps)
Steps – set from 1 to 10,000 (No of steps)
Step Size – set from 1 to 1,000,000 frames
Because the Step Size is set as a number of frames rather than a time period, the ramp profile is nonlinear.
If the Stop Info Rate is higher than the Start Info rate, the ramp increases the Info rate over time.
If the Stop Info Rate is lower than the Start Info rate, the ramp decreases the Info rate over time.
Burst: This profile propagates traffic of a set size and interval:
Size – set from 2 to 1,000,000,000 frames (duration of burst)
Gap – set from 1 to 1,000,000 µs (interval between bursts)
The selected Traffic profile remains until it is reset by you.
152810 UniPRO
Page 34 User Guide
Page 35

To generate Traffic, from the home screen select the TESTS>TOOLS (A or B)>TRAFFIC - the ‘Traffic’
screen Fig 43A is shown on the display.
NOTE
MGig1 Duo models have TOOLS A or TOOLS B, choose whether to generate traffic on the
primary (A) or secondary (B) ports.
A B
Fig 43
From the ‘Traffic’ screen, Fig 43A, select RUN (F1) to start generating traffic. The Traffic Generation
Utilization Plot will indicate the bandwidth utilization for each service (Fig 43B). Select MORE (F2) to
display the same data as a table.
UniPRO 152810
User Guide Page 35
Page 36

Transmission tests – set up and run
There are four transmission tests available on MGig1 - BERT, SLA-Tick, RFC2544 and NetSAM. MGig1
offers numerous options for the set-up of each test and the descriptions that follow are not exhaustive but
a general guide to the user.
BERT
Bit Error Ratio Test (BERT) checks the frame’s payload for bit errors and reports them as a ratio of the
total data received. For additional information see BERT on page 19.
To set up BERT on MGig1 proceed as follows: From the home screen select SETUP (F4). Select the
TESTS and then the BERT icon – the ‘Setup:BERT’ screens (Fig 44) are shown on the display. Select
MORE (F1) to toggle between screens.
A B
Fig 44
Target Select a target from the dropdown list. When testing over Layer 1 a target is not required.
Service BERT runs on one service only. Choose a service from the dropdown list. Note that when the
service selected has been setup with a Custom target (via SETUP>SERVICES) different to that chosen
from the Target list (above), then the target associated to the service will be used.
Test pattern Choose one of the test patterns from the dropdown list to fill the payload. When the ‘Word’
pattern is selected, enter a 4-digit hexadecimal number in Word.
Layer Select Layer 1 for physical, non-addressable loop. Select Layers 2 to 4 according to the size of
payload required. See Ethernet frame structure and Layers, paragraphs 1 & 2, page 15.
Info Rate Enter the Information Rate in Mb/s to set how much of the bandwidth you want to use for
BERT.
Frame Size Select frame size from the dropdown list. The larger the frame size, the more bandwidth
remains for payload.
Duration Choose ‘continuous’ when you want the test to run until you select STOP (F1). Choose ‘User’
and then specify a period of up to 24 hours in User Duration.
152810 UniPRO
Page 36 User Guide
Page 37

To RUN BERT: from the home screen select the
TESTS icon and then the BERT icon – the BERT
test screen ‘BERT’ is shown on the display.
Select RUN (F1) to start the test.
Status should read ‘In Sync’. If it reads ‘Out of
sync’ make sure that the Layer chosen at BERT
setup matches the Layer set on the SEL1 (or other
loopback device).
Last Sync Time is a counter that runs from the last
time that sync was regained after a Sync Loss.
When sync is not lost by the time the test is
complete (or stopped), Last Sync Time will equal
Total Sync Time.
Total Sync Time is the total time that the test was
in sync – expressed as a percentage of the test
duration, and also in hours, minutes and seconds.
When no errors/sync losses occur during the test,
Total Sync Time will be equal to Time (test
duration). Each error/sync loss will cause the
counter to stop until sync is regained.
Err Time is the time that the BERT pattern was out
of sync since the start of the test – expressed as
both a percentage of the test duration, and in hours,
minutes and seconds.
Sync Losses Number of times the pattern has
gone out of sync.
Fig 45
Fig 46
Error Limit, Error Ratio and Absolute Error
Set the Error Limit to ‘Ratio’ and then choose a ratio from the range 1 in 10 to 1 in 1013 (steps in
powers of 10). The chosen ratio becomes the limit beyond which the test is failed.
Set the Error Limit to ‘Absolute’ and then enter the error limit as a value from 1 to 999.
Rx Sync bits Number of received bits that have remained in sync, expressed in powers of 10, e.g.
6.46168e+08 = 6.46168 x10⁸.
Rx Err bits and Rx Err Ratio Received errored bits as an absolute value or as a ratio. When these
values exceed the limit you entered at setup the test is failed.
Target, Service, Test Pattern and Layer are confirmation of the choices made at setup.
Severely Err Seconds Number of severely errored seconds counted during the test.
Fig 45 and Fig 46 show the BERT test screens after a test has been run. The results show that the test
ran for 60 seconds and that for four seconds the BERT pattern was out of sync. Although errors were
recorded, the error ratio of 0.0076576 does not exceed the error ratio limit of 1 in 100 specified at set up –
see Fig 44B. Therefore, the test is passed.
The summary LED in the information bar at the top of the screen lights green when sync is achieved. It
will change to red on error or sync loss, then orange to indicate historic error.
UniPRO 152810
User Guide Page 37
Page 38

To set up SLA-Tick on MGig1 proceed as follows:
From the home screen select SETUP (F4). Select
the TESTS and then the SLA-TICK icon – the
‘Setup:SLA-TICK’ screen is shown on the display
(Fig 47).
Select a Target from the dropdown list and set the
Duration that you require. Note that the
addressing and protocol for each service is set at
SETUP>SERVICES.
Select MORE (F1) and set the Wait Time – i.e. the
time that the tester waits at the end of each sub-test
for the last frames to arrive before it starts the next
sub-test.
Fig 47
SLA Tick
The Service Level Agreement (SLA) Tick test can use up to eight services, the utilization of each service
is chosen at set up.
For each Service that you wish to use, proceed as follows:
Select the service, e.g. Service 1, the ‘Limits’ screen is shown on the display (Fig 48 A & B). Enter the
Info Rate, Frame Size and Pattern Data. As you set the Info Rate, both the percentage used by that
service (Bandwidth Utilization) and the percentage that remains available for other services are shown.
Bandwidth Utilization is affected by Frame Size as well as Info Rate – a larger frame size means fewer
frames and therefore less overhead.
The second Limits screen, Fig 48B, allows you to set the values that may be stated in the Service Level
Agreement. E.g. if you have set the characteristics of Service 1 to mimic Video Transmission applications,
the values you set for Info Rate, Latency and Jitter etc. against that service, could represent the SLA.
A B
Fig 48
152810 UniPRO
Page 38 User Guide
Page 39

The values permitted for the Limits shown on Fig 48B are:
Max Latency – 0 to 10,000,000 µs.
Max Jitter – 0 to 2,000,000 µs.
Frame Loss Ratio 0 to 1.
Frame Loss Count – 0 to 1,000,000,000.
Results
Fig 49 shows SLA Tick test result screens. The screen, ‘A’, confirms the target and that the test is
Passed, i.e. is below all limits and meets all criteria specified at set up. Select the buttons shown on
screen ‘B’, and test results are shown on the display as a series of graphs and tables. MORE (F2) toggles
between the two screens.
A B
Fig 49
SLA Frame Error, Rx Tx Frame Counts, Rx Tx Layer Payload, Rx Frame Size, Rx Frame Types, Rx
Errors and Rx Errored Time are shown as tables only, all other results are shown as tables and graphs.
For each of the graphs (Latency results are shown at Fig 50), the x-axis represents each of the eight
services, the y-axis records the quality being measured. TABLES (F3) present the same information but
values are shown in numerals.
A B
Fig 50
UniPRO 152810
User Guide Page 39
Page 40

Fig 51
Fig 52
Fig 53
Select a Target and Service from the drop down
lists and enter Pattern Data for the frame’s payload
– up to eight hexadecimal characters.
Direction is reported as Single Ended or
Bidirectional dependent on whether a second
MGig1 is selected as the target.
Select PROFILE (F2) to set the test to
Super-Fast, Fast or Full.
Select MORE (F1), Fig 52, and tick the check
boxes against the subtests you require; throughput
must be selected.
Select F4 to choose between:
SINGLE – Single Ended (loopback), or
BIDIR – Master to Slave and Slave to
Master.
RFC2544
RFC2544 is a testing methodology that comprises six subtests. RFC2544 uses Layer 4 frame headers.
Background information for the subtests can be found under the RFC2544 section of Ethernet
transmission testing methods on page 19. Set the test’s main parameters as follows: From the home
screen select SETUP>TESTS>RFC2544 and the ‘Setup:RFC2544’ screen is shown on the display (Fig
51).
Select MORE (F1), Fig 53, and below Frame Size tick the checkboxes next to the frame size(s) that you
want the test traffic to comprise of. The standard frames sizes are shown in Fig 53, for systems that
support larger frame sizes check the ‘User’ Frame Size and enter the size in the adjacent field. All
subtests are run separately for each selected frame size.
152810 UniPRO
Page 40 User Guide
Page 41

Below Test Rate enter a value in the range, 0.1 to 1000 Mb/s. When the test is run, MGig1 will find the
maximum rate that the network can support in the chosen range by using a binary search pattern.
Set the parameters for the individual subtests from the EDIT button next to the subtest’s name as
illustrated in Fig 52.
When all general and subtest parameters are set, the RFC2544 test can be run. From the home screen
select TESTS>RFC2544 – The ‘RFC2544’ screen is shown on the display (Fig 54).
Fig 54
The Service, Target and Direction that you have entered at set up are listed. The Direction is determined
by the target. If target is MGig1 Slave then Bidirectional will be selected otherwise single ended will be
selected. The estimated duration is shown as a range in hours, minutes and seconds. In addition to the
test PROFILE, the duration is proportional to the parameters you have entered. Changing the test
PROFILE and the values entered for each subtest will affect the duration of the test.
UniPRO 152810
User Guide Page 41
Page 42
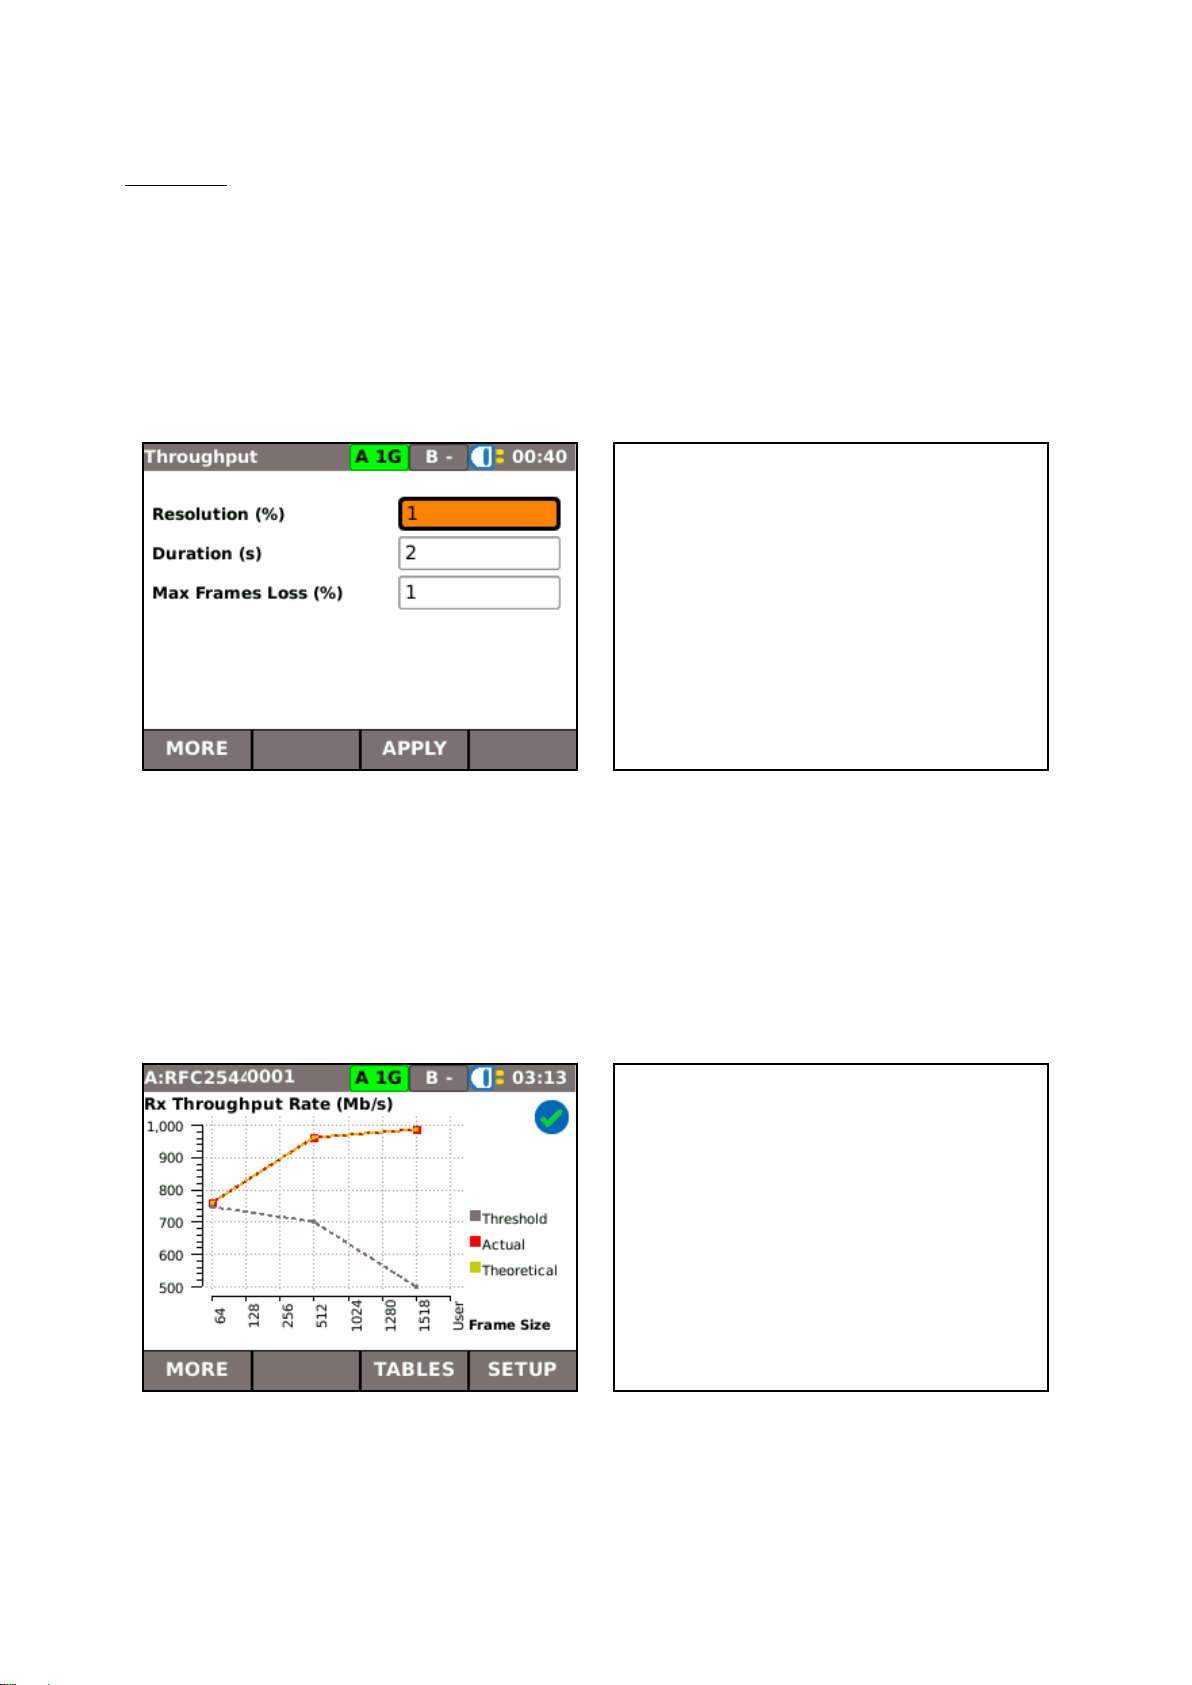
Throughput
Throughput uses a binary search to discover the maximum frame rate at which the network under test will
operate without excessive lost frames. The test starts by sending frames at the maximum value in the
range ‘Test Rate’ as described above. If too many frames are lost, the test is repeated at a lower frame
rate. This process continues until the maximum throughput is determined. The binary search reduces the
throughput value by decreasing steps: 50%, 25%, 12.5%, 6.25% etc. The throughput is increased or
decreased depending on the results of the previous test. MGig1 continues the binary search until
throughput is calculated to within the specified Resolution – 0 to 50% (Fig 55A). The Duration can be
set from 1 to 300 seconds; it is the period that each batch of frames is sent for. Set the percentage of lost
frames that is acceptable for the test in ‘Max Frames Lost’. Set from 0 to 10%.
A B
Fig 55
Choose the frame size(s) and throughput rate limit; see (Fig 55B). Tick the checkbox adjacent to the
frame sizes you require for the throughput test and enter a rate limit in the field. When a value from a
previous test remains in the field, it will be ignored if the checkbox is not ticked.
Throughput is calculated for each of the selected frame sizes and the test results are displayed as
graphs and tables. The Rx Throughput Rate graph (Fig 56A) and table (Fig 56B) are shown below.
Rx Frame Rate, Utilization and Frame Loss are also available as graphs and tables.
A B
Fig 56
152810 UniPRO
Page 42 User Guide
Page 43

Latency
The Latency subtest measures the round-trip time taken by a test frame to travel across a network,
through the loopback device and back to the tester. For protocols such as Voice over Internet Protocol
(VoIP), a variable or long latency can cause degradation in voice quality.
A B
Fig 57
The throughput test will determine the throughput rate for the latency test. Set the Repetitions, 1 to 100,
and the Duration, 1 to 300 seconds. Select MORE (F1) and tick the check boxes next to the frame sizes
required for the test. Against each frame size, set the Latency Limit in µs, 0 to 10,000,000.
MGig1 presents Latency results as a graph that plots time (µs) against Frame size, and a table that shows
the values for throughput against each frame size and the round trip time (min, average & max) in µs.
A B
Fig 58
UniPRO 152810
User Guide Page 43
Page 44

Jitter
Jitter is defined as variation in latency which can cause pixilation during video conferencing and
degradation of sound quality to VoIP communications.
A B
Fig 59
The test measures the minimum, maximum and average variation in latency for the frame sizes selected
at set up.
Set the number of Repetitions (1 to 10) to test the network for Jitter and the Duration (1 to 300 seconds)
for each repetition (Fig 59A). Select MORE (F1) and tick the check boxes next to the frame sizes required
for the test (Fig 59B). Against each frame size, set the Jitter Limit in µs, 0 to 2,000,000.
Results are provided as a graph that plots jitter in µs against frame sizes, and as a table that lists the Min,
Avg and Max time for each selected frame size (Fig 60).
A B
Fig 60
152810 UniPRO
Page 44 User Guide
Page 45
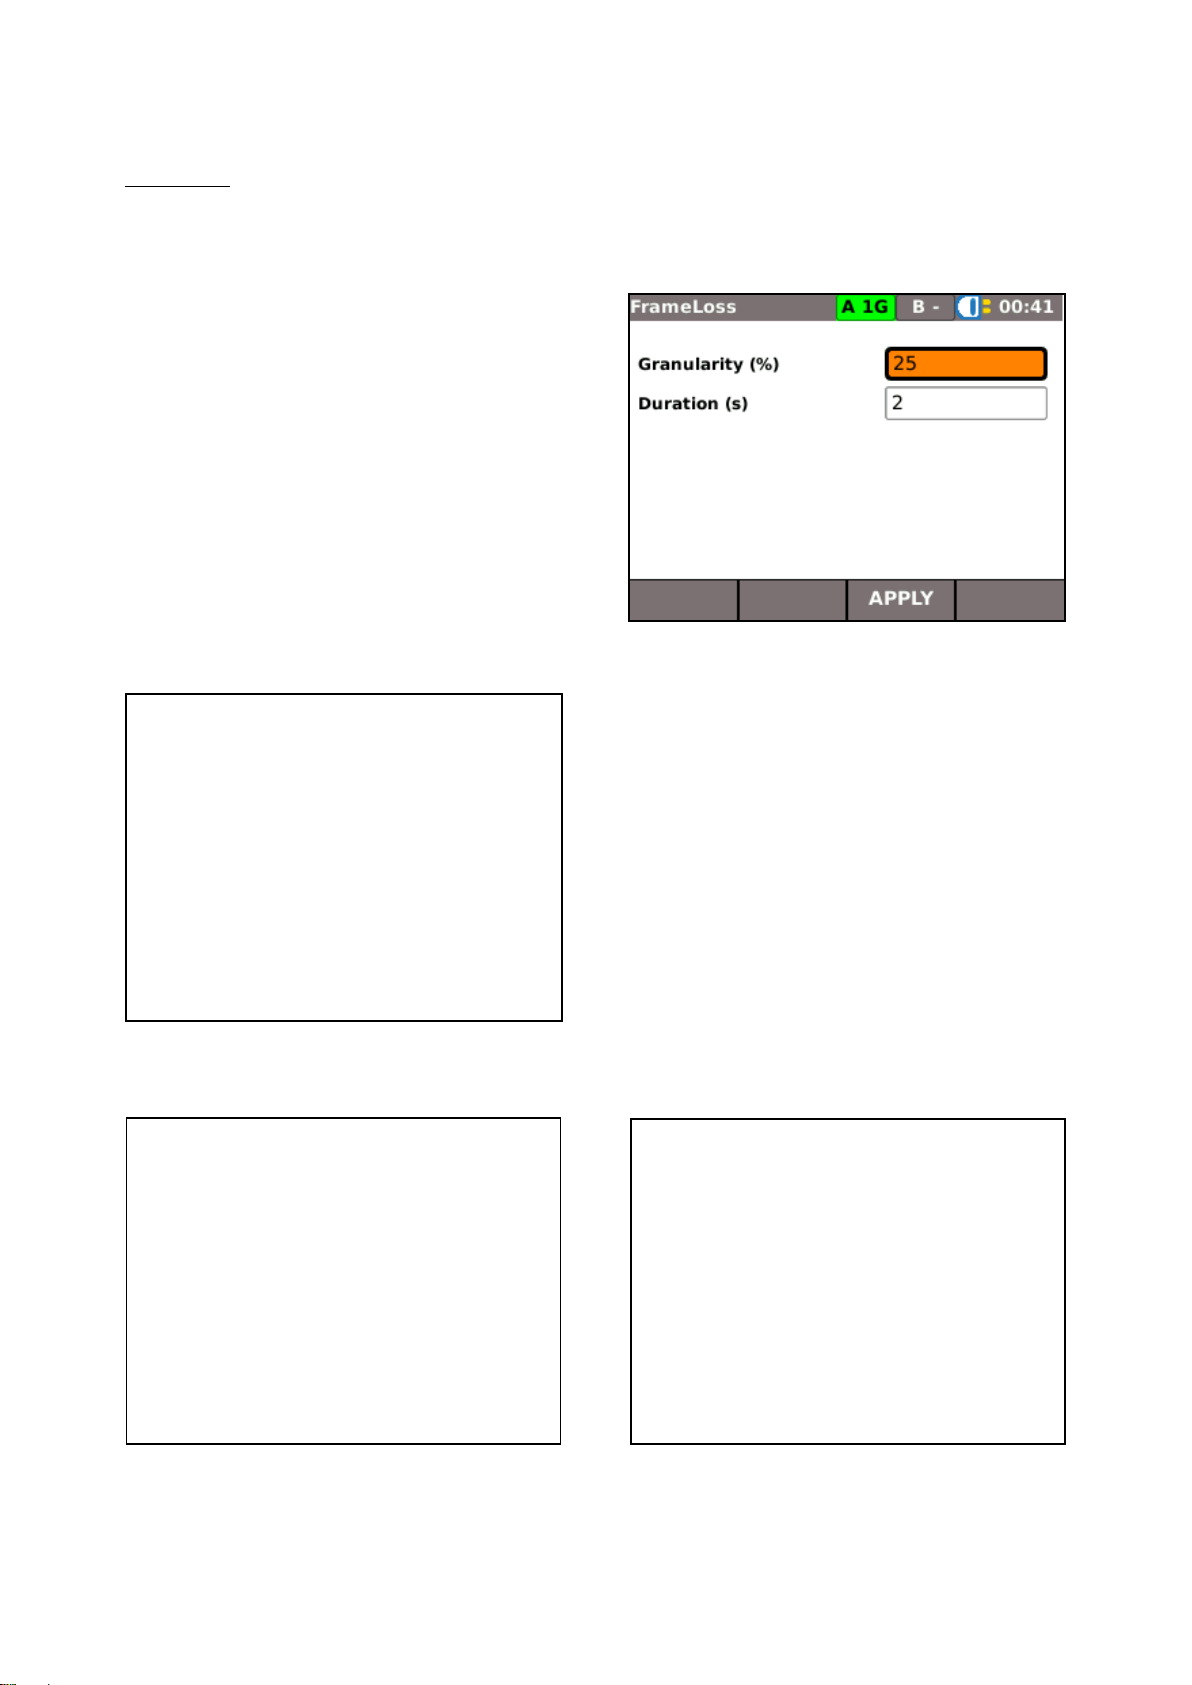
The frame loss test has the settings that follow:
Granularity – 0 to 50%. The space
between steps in utilization.
Duration – 1 to 300 seconds. The period
for which frames are transmitted.
Fig 61
Fig 62
The frame loss test presents results as a graph that
plots percentage Frame Loss against percentage
Frame Rate (Fig 62). The function key F3 toggles
between the graph and a table that lists percentage
frame loss for each frame size at different network
utilizations. The table is displayed over two
screens, Fig 63A & B. The function key F1 toggles
between the two screens.
The test finds the rate at which there is no frame
loss. If this cannot be achieved the test fails.
Frame Loss
Frame Loss is the percentage of frames that were not forwarded by the network due to lack of resources.
This measurement can be used to report the performance of a network in an overloaded state and is a
useful indication of how a network would perform in extreme conditions.
A B
UniPRO 152810
User Guide Page 45
Fig 63
Page 46
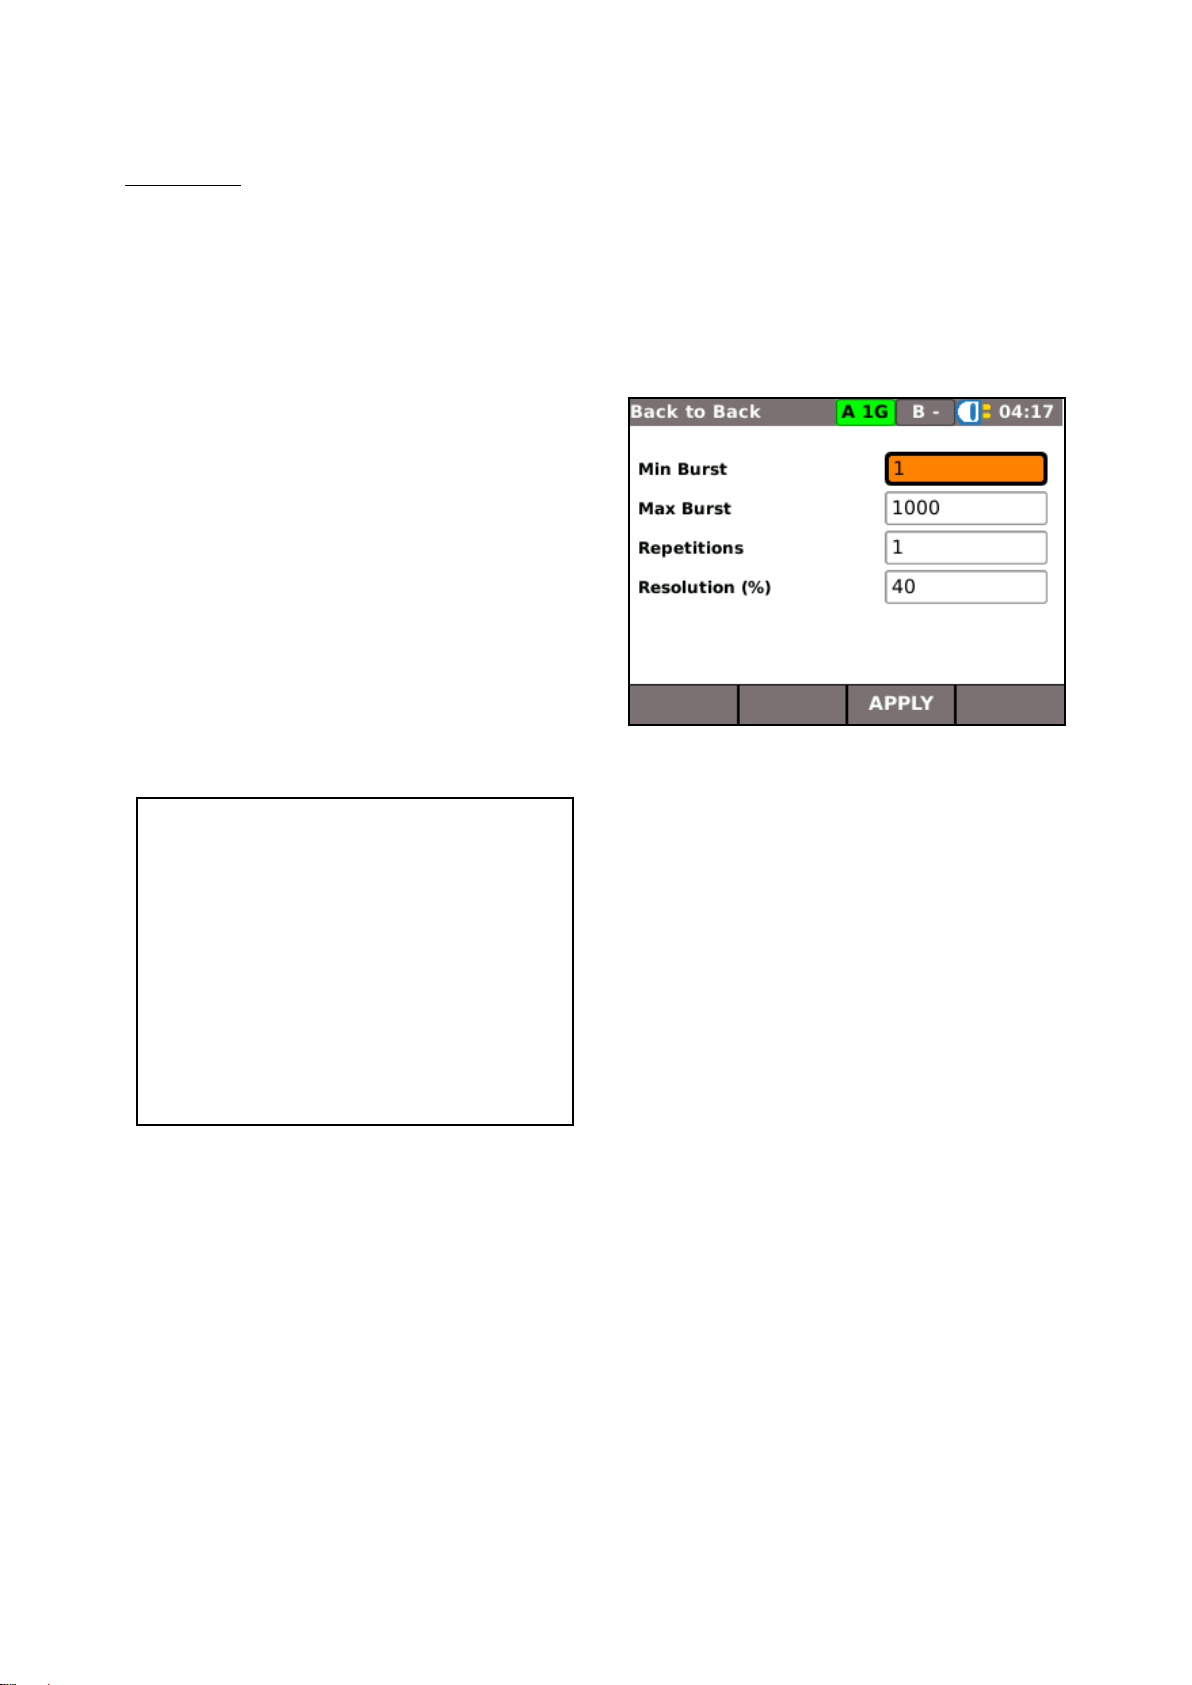
Min Burst and Max Burst are the minimum and
maximum number of frames in each burst.
Repetitions is the number of times that a series of
bursts are sent. Resolution is a percentage of the
specified number of frames.
The range for each variable is as follows:
Min Burst – 1 to 1,000,000,000 frames
Max Burst – 1 to 1,000, 000,000 frames
Repetitions – 1 to 100
Resolution – 0 to 50%
Fig 64
Fig 65
MGig1 presents the Back to Back test results as a
table (Fig 65) that lists the average and maximum
number of back to back frames, for each frame size
tested, that the network can support.
Back to Back
This test determines the maximum number of back-to-back frames, with a minimal Inter-Frame Gap (IFG),
that the network can support without losing frames.
For each frame size chosen at set up (Fig 53), the test sends a series of ‘bursts’. The first burst contains
a specified number of frames, subsequent bursts are then sent with more, or fewer, frames until MGig1
calculates the maximum number returned without error. The minimum and maximum number of frames in
each burst is specified at the ‘Back to Back‘ set up screen, Fig 64.
152810 UniPRO
Page 46 User Guide
Page 47
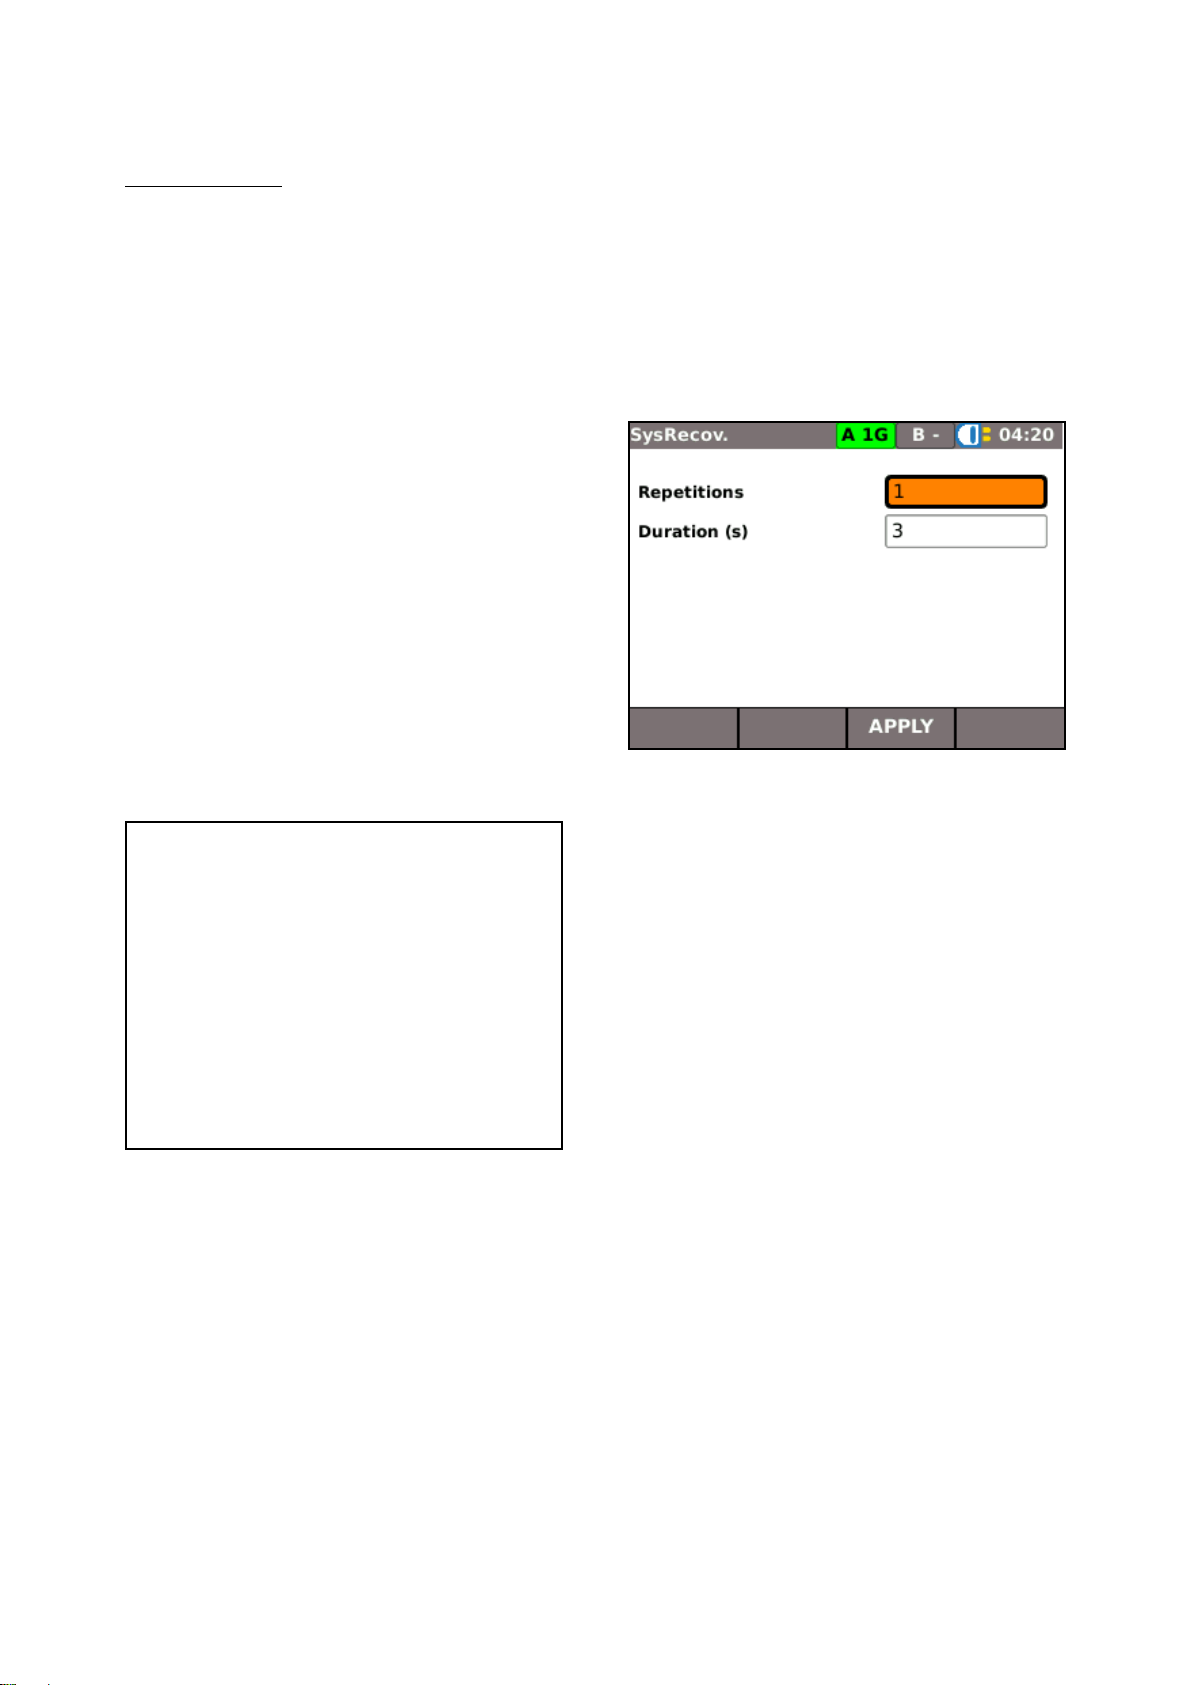
The range for each variable is as follows:
Repetitions – 1 to 100. The number of
test runs.
Duration – 1 to 300. Period, in seconds,
that excess traffic is generated.
Fig 66
Fig 67
MGig1 presents the System Recovery test results
as a table (Fig 67) that lists system recovery time in
µs for each frame size tested. The information rate
shown is the rate MGig1 transmits in excess of
maximum throughput.
System Recovery
The system recovery time is the time the network takes to stop losing frames when the frame rate is
reduced from a stressed to a normal state. For a period specified at set up, MGig1 will generate traffic at
a rate that is higher than the network can support, i.e. greater than the rate calculated at the throughput
test. This causes the network to lose frames. Then, the traffic is reduced to less than the pre-determined
throughput. The time between the drop in frame rate to the last lost frame is averaged over a user
specified number of test runs for each frame size.
UniPRO 152810
User Guide Page 47
Page 48

NetSAM
NetSAM is IDEAL INDUSTRIES’ implementation of the International Telecommunication Union’s
specification - ‘Ethernet service activation test methodology’ – Y.1564.
NetSAM comprises seven subtests, six designed to test service configuration, and one to test service
performance. Services are selected and their characteristics configured at setup. Configuration is tested
one service at a time, performance is tested with all services generated simultaneously. Refer to the
Network under test’s Service Level Agreement (SLA) as a guide to set up the tests and to help you decide
the values you choose as limits to determine when the test is passed or failed.
Configuration test results are presented as tables that list the criteria that follow:
IR - Information Rate (Mb/s)
Frame Loss (as a count of lost frames - FL, and as a ratio - FLR)
FTD - Frame Transfer Delay (Min, Mean and Max)
FDV - Frame Delay Variation (Min, Mean and Max)
When a configuration test is complete, the results are shown on the display as four tables, one for each of
the criteria above. MORE (F1) scrolls through the criteria. As up to eight services can be used within
each sub-test, the soft keys NEXT and PREV are used to navigate between results for all services tested.
When errors in network configuration are identified they must be corrected and verified before
performance tests are run.
In addition to the four configuration test criteria, the performance test measures Network Availability which
a result table presents as percentage ‘Available’ time and percentage ‘Unavailable’ time. When the
performance test is run, all services selected at setup are tested at the same time and the results for each
service are shown as rows in the same table.
Unavailable time is defined as a period that begins at the start of not less than 10 consecutive Severely
Errored Seconds (SES). A new period of available time begins at the start of 10 consecutive non-SES.
Fig 68 illustrates the definition of criteria for a network’s transition to/from an unavailable state.
Fig 68
A Severely Errored Second is defined as one second of transmission time in which the number of lost
frames (expressed as a ratio – FLR) is greater than a user defined value. For tests, this value is entered
at set up. In its specification Y.1563, the ITU propose a value of 0.5.
152810 UniPRO
Page 48 User Guide
Page 49

The NetSAM subtests are as follows. The prefixes A1, A2 etc., refer to the sub-clauses of paragraph
8.1.2 in Y.1564 where the definitions for each subtest are defined.
A1 CIR
This is a simple Committed Information Rate (CIR) validation test. It verifies that the proper data rate has
been configured in the network. MGig1 generates and transmits frames, at constant intervals, at the CIR.
If the IR, FLR, FTD and FDV are within Service Acceptance Criteria (SAC) limits the test is passed.
A2 Step Load CIR
This test is similar to A1 but generates and transmits frames in steps of 10, 20, 25 or 50% of the CIR, up
to the CIR. The duration of each step is user defined up to 60 seconds. If the FLR, FTD and FDV are
within SAC limits and 100% of the CIR is reached, the test is passed.
B1 EIR Color
MGig1 transmits frames marked green at a rate equal to the CIR, and yellow at a rate equal to the Excess
Information Rate (EIR). All frames are transmitted at constant intervals. The tester allows you to choose
how priority is specified - IP, VLAN or MPLS. If the FLR, FTD and FDV for the green marked frames are
all within the SAC limits, the test is passed.
B2 EIR Non Color
Frames are transmitted at constant intervals at a rate equal to CIR + EIR. If the FLR, FTD and FDV are
within SAC limits and the measured IR is greater than the CIR, the test is passed.
C1 Police Color
The C1 Police Color test checks that the network drops frames transmitted at a rate greater than the EIR.
The method is to transmit frames marked green at a rate equal to the CIR, and frames marked yellow at a
rate of 125% EIR. All frames are transmitted at constant intervals. If the FLR, FTD and FDV for the green
marked frames are all within the SAC limits, and if the total information rate (IR for both green and yellow
marked frames) is less than or equal to the CIR + EIR + M factor the test is passed. For a definition of
M factor see page 50. The IR results are shown on a table that presents values for Green, Yellow and
Total IR on separate rows.
C2 Police Non Color
This test is similar to C1 but frames are not color marked. It checks that the network drops frames
transmitted at a rate greater than the EIR. The test is passed when the measured IR is less than or equal
to CIR + EIR + M factor.
The network is configured correctly when the configuration tests have be run satisfactorily. A service
performance test can now be run.
Service Performance
This test validates the quality of services over time. All services are generated to their configured CIR
simultaneously. IR, FLR, FTD, FDV and Available Time (network availability) are monitored for each
service simultaneously. All results are shown on tables that present each service as a separate row. For
bidirectional tests, the test is considered passed only when the criteria are satisfied for both directions.
UniPRO 152810
User Guide Page 49
Page 50

Subtests screen - Fig 69. Choose from the seven
subtests – note that service configuration tests
should be run before the performance test. This is
to prevent the time wasted when a performance
test is run over an incorrectly configured service.
Tick the check box next to the test you require. All
four can be ticked but only one radio button, e.g.
either A1 or A2, can be selected. The EDIT buttons
reveal further settings for each test as follows:
A1 – Select duration from 5, 15, 30 secs
or user defined up to 24 hours.
A2 – Set step sizes to 10, 20, 25 or 50%
of the CIR, and set the duration to
transmit at each step from 1 to 60secs.
B1 & B2 – Select duration from 5, 15,
30 secs or user defined up to 24 hours.
C1 & C2 – Select duration from 5, 15,
30 secs or user defined up to 24 hours,
and -
Fig 69
Set M-Factor in Mb/s. The M-Factor is a value in Mb/s that is added to the IR to allow for the
effect of the traffic policer’s CBS and EBS. Select MORE (F1) to access Services selection and
setup.
Services selection screen - Fig 70. Tick the check
box against the services required. The left column
is for Single Ended Tests, the right for Bi-directional
tests. For Bi-directional tests another MGig1 set to
Slave Mode is required – see page 28.
Select the EDIT button next to a service to reveal
three further screens where you can:
Set the characteristics of the service such
as CIR, EIR, frame size and pattern data.
See Fig 71.
Set the color mode (when required).
See Fig 72.
Set the pass/fail limits for the test based
on FLR, FTD, FDV and Availability.
See Fig 73.
Fig 70
Severely Errored Second screen For any second, when the FLR is greater than the value entered here
MGig1 defines it as a Severely Errored Second. Enter a value from 0 to 1 (4 decimal places).
Setup and run NetSAM as follows:
From the home screen select SETUP>TESTS>NetSAM. Alternatively, select TESTS>NetSAM>SETUP.
At this menu level, MORE (F1) will cycle through four setup screens: the Target screen, Subtests screen,
Services screen and SES Frame Loss Ratio screen.
Target screen Select a Target from the dropdown list of 10 targets. To add, amend, edit or delete targets
from the list, see Targets on page 24. Test direction is confirmed as Single Ended or Bi-directional (see
‘Services screen’ below). Select MORE (F1) to access Subtest selection and setup.
152810 UniPRO
Page 50 User Guide
Page 51

Service setup screen
Frame size can be set in the ways that follow:
Select Frame Size and choose from the dropdown
list. When a specific size, such as 64, is selected,
that size will be used for all frames transmitted on
that service. Select User or MTU and specify your
own size between 60 and 10,000 bytes. EMIX will
generate and transmit a variety of frame sizes
throughout the test duration. The default EMIX
Pattern is ‘abceg’ and is shown in Fig 71. The
characters are designators for the frame sizes listed
in the table shown on the screen. Select ‘EMIX
Pattern’ and you may add or subtract from the
pattern using the appropriate designators.
CIR Set CIR for the service.
EIR Set EIR for the service. Values entered here
are ignored for subtests A1 & A2.
Pattern Data Enter up to eight hexadecimal
characters.
Color Mode screen
Select the Color Mode from the drop down list – IP,
VLAN or MPLS dependent on where network
priority for EIR should be. Now set a value for both
the Green and Yellow indicators by selecting the
data entry box next to the color – For IP select the
COS Type and Precedence, or DSCP Mode and
Class in accordance with the SLA and select
APPLY (F3).
For VLAN and MPLS set a value from 1 to 7.
Limits screen Fig 73.
The values entered here should be those found in
the SLA.
Set the Frame Loss Ratio from
0 to 1 (3 decimal places).
Set the Frame Transfer Delay from
0 to 10,000,000.
Set the Frame Delay Variation from
0 to 2,000,000.
Set Availability from 0 to 100%.
Fig 71
Fig 72
Fig 73
UniPRO 152810
User Guide Page 51
Page 52

To view graphs and tables of a live test, select
MORE (F2) from the subtest screen as the test is in
progress. A list of available statistics is shown on
the display, select from the list and the live result is
shown. Fig 74 shows the Rx Info Rate of a
performance test over three services set at 30, 20
and 10 Mb/s. Select TABLES (F3) to view
numerical results presented in a table.
When a test is complete select VIEW and all results
are presented as tables and shown on the display.
Select MORE (F1) to navigate between all result
criteria. Fig 75 shows the IR results for an A2 Step
Load CIR test – note that the result for each step is
shown on a separate row. This test was setup with
steps set at 10% CIR, therefore there are 10 steps;
scroll down to see the last five.
The results shown are for Service 1, indicated by
S-1 on the screen. Select NEXT (F4) to view the
other services tested.
Select MORE (F1) to view the Frame Loss, Frame
Transfer Delay and Frame Delay Variation.
Fig 74
Fig 75
Performance is checked on all services simultaneously and the results for each service shown on a
separate row. Fig 76 shows that FTD on all three services tested is 2µ which is within limits for the setup
of this test. An example of the Availability criterion from a Performance test over three services is
illustrated in Fig 77.
Note that when one criterion is not met the whole test is failed. E.g. if IR, FTD, FDV and Availability test
successfully but Frame Loss exceeds the limit chosen at setup, the test is failed.
Fig 76
Fig 77
152810 UniPRO
Page 52 User Guide
Page 53

MGig1 can be set up to run a predefined range of
tests when the yellow Autotest button, found on the
front of the handset, is pressed. The range of tests
is set from TESTS>AUTOTEST>SETUP by ticking
the check boxes next to your choice. Fig 78 refers.
Select APPLY (F3) to save your choices and a
screen showing the selected tests is shown on the
display with a ready symbol adjacent to each test,
Fig 79.
Fig 78
Fig 79
Select RUN (F1) and the tests will start. MGig1 will
decide in which order to run the tests.
When all tests are complete, select any of the tests
from the screen to view the results. To save the
results, press the Escape key to exit to the Tests
screen and then select SAVE ALL (F3).
Auto test
UniPRO 152810
User Guide Page 53
Page 54

•Only a single set of Transmission stats will be
maintained. These are started at the
beginning of a test and stopped at the end of a
test. In the case of an AUTOTEST the stats
span all the tests executed as part of the
AUTOTEST and not stopped and started for
each of the individual tests. Transmission
statistics are available from within RFC2544,
NetSAM and SLA-Tick tests
Fig 80
Statistics
From the home screen in Endpoint mode select the STATS icon, the Stats screen is shown on the
display, Fig 80.
NOTE
When a test result is saved, all Stats data available at the time of the test is also saved to the same
Result.
Stats menu description
For each port (only Duo models have a ‘B’ port), select from the three buttons on the Stats screen to
provide the information that follows:
IP The F1 soft key is used to toggle between IPv4 and Ipv6 data.
The IPv4 data listed is:
Info: IP Assigned successfully or, Listening or, DHCP failed.
Also listed are: IP Address, Gateway, Subnet Mask, Primary & Secondary DNS, DHCP Server.
The IPv6 data listed is:
Info: IP Assigned successfully or, Listening or, DHCP failed.
Also listed are: IP Address, Prefix-64 or 128 bit, Link Address, Gateway, Primary & Secondary DNS
DHCP Server.
152810 UniPRO
Page 54 User Guide
Page 55

A graph shows Traffic Utilization and %utilization
against time. Select SCALE (F2) to change the
time axis between 60secs, 10mins and 60mins.
For Duo models select the F3 key to toggle
between Port A (blue plot), Port B (red plot) and
Both.
Top Users – Select Top Users to show a table
listing the top ten talkers, their IP address and
usage.
Top VLANs – Select Top VLANs to show a table
listing the top VLANs, their ID and their usage.
MAC and LINK data lists the same criteria as
Endpoint mode above.
Fig 81
MAC
Tx and Rx data listed is:
Frames, Total Bytes, Unicast frames, Broadcast frames, Multicast frames, Max Frames/sec, Current,
Average and Maximum rate in b/s, Current, Average and Max Utilization as %, frame Size Distribution.
Discovery data listed is:
LLDP/CDP/EDP, Protocol, MAC Address, Hostname/address, Port Name.
LINK
Port data listed is:
PoE Voltage: 0 to 60V, PoE Pairs: 12/36 or 45/78, Speed, Duplex, MDI or MDIX,
Polarity.
Error data listed is:
Collisions, FCS Errors, Undersize and Oversize (set in RJ45 SETUP – applies to both RJ45 and Optical
ports), Jabbers, Bad Length.
Partner data listed is:
10M-HD, 10M-FD, 100M-HD, 100M-FD, 1000M-HD, 1000M-FD.
From the home screen in Through mode select the STATS icon, the Stats screen is shown on the
display, Fig 81.
UniPRO 152810
User Guide Page 55
Page 56

Jobs
MGig1 provides a system that enables the storage and organization of test results and statistics. Test
results can be exported via a USB key and used to produce reports.
The two elements of this storage and organization system are Jobs and Results. A Job is a named
repository for a collection of Results. A Result is a group of test results. It may contain the saved results
of one or several tests. Therefore, a Job may be understood as a folder, a Result as the file(s) held within
that folder. MGig1 can store up to five Jobs each containing 50 Results.
At any time, one Job is always ‘active’. Test results are saved to the active Job. Any existing Job can be
activated, at any time, via the menu on the Jobs Options screen. The currently active Job is indicated in
the information bar shown at the top of the display.
Every time test results are saved, they are saved to a Result which is assigned a sequential number. In
turn, each Result is allocated to the currently active Job.
The structure in which Jobs, Results and test results are stored is shown in Fig 82.
Fig 82 Example of Job storage structure
When creating a new Job, you can store:
The customer’s contact, address and telephone details. This information will appear on reports
that are compiled from exported test results.
A prefix (relates to all associate Results). It will appear at the front of every Result number, e.g.
ABC0001, where ABC is the user-defined prefix and 0001 is the system-allocated Result
number. The prefix must be an alphanumeric string (no spaces or punctuation). Adding a prefix
for Result numbers is optional.
A Job title (user defined). Enables Jobs to be named. The Job title must be an alphanumeric
string (no spaces or punctuation).
152810 UniPRO
Page 56 User Guide
Page 57

Fig 84 Options screen
The display will show a dialogue stating:
‘MyJob is set as current job’
To change the active Job List from Acme to MyJob
Press ENTER to confirm.
The display returns to the Job List screen, and the
new active Job is now shown in the information bar.
Using the Jobs menu
From the home screen select the JOBS icon. The display will show the Job List screen, Fig 83. The Job
List screen lists all currently stored Jobs. The column ‘Tests’ indicates the number of Results saved to
each Job. The column ‘Pass %’ indicates the percentage of the total number of tests in all Results
allocated to a Job that have passed.
Change the active Job
In the example of a Job List screen shown at Fig 83, the active Job is ‘Acme’ as indicated on the display’s
information bar. To change the active Job, scroll to the Job required (e.g. My Job) and select OPTIONS
(F2); the display will show the Options screen, Fig 84. Select the ACTIVATE icon.
Fig 83 Job List screen
UniPRO 152810
User Guide Page 57
Page 58

Create a new Job. Up to five Jobs can be stored. Data entry fields are:
Prefix. Enter an alphanumeric string which will be prefixed to all Results stored
under the new Job.
Job. Enter an alphanumeric string which will be the title of the new Job. For
example, your customer’s name.
Customer details. Fields are provided for – Company, Address, City, State,
ZIP, Phone No.
NOTES:
(1) When a new Job is created it automatically becomes the Active Job.
(2) When five Jobs have been created the NEW icon is not shown on the Options
screen. An existing Job must be deleted for the NEW icon to reappear.
Amend any details of an existing Job. Select APPLY (F3) to save the changes.
Delete a Job and all its associated Results. When DELETE is selected, the dialogue
‘Are you sure you want to delete ‘Job’ will appear.
once deleted, a job cannot be restored
Selects the Job to be currently active. All test results are saved to the active Job. Full
details of this function are described on page 57.
When selected, the display will show the Results screen. The Results are shown as a
list and can be viewed, deleted or exported to a USB key. The soft key SHOW (F3)
toggles between Status (pass/fail), and the Date and Time that the test was saved.
Exports the selected Job List to USB. Information on how to generate reports is detailed
below.
Managing Jobs
Select one of the icons from the Job List screen to manage Jobs as follows:
152810 UniPRO
Page 58 User Guide
Page 59

Generating Reports
Reports can be generated using test results exported via a USB key.
To generate a report:
Insert a USB key into the MGig1 USB port.
From the home screen select the JOBS icon. The display will show the Job List screen.
Highlight the Job to be exported and select OPTIONS (F2). The display will show the Options
screen.
Highlight the TO USB icon and press Enter. The dialogue ‘Job saved to USB’ appears.
Alternatively, an individual Result from a Job may be exported:
Insert a USB key into the MGig1 USB port.
From the home screen select the JOBS icon. The display will show the Job List screen.
Highlight the Job required and press ENTER. The display shows all Results contained within the
Job.
Highlight the Result you require and press the soft key TO USB (F4). The dialogue ‘Result
saved to USB’ appears.
Test results and statistics are now saved on the USB key and can be viewed as a report on any PC
installed with Microsoft Internet Explorer™, Mozilla Firefox™ or other suitable browser.
Files are saved to the USB key, the test results are stored as an XML document and a report template is
stored as an XSLT file. Open the XML document to view the report.
MGig1 software updates and configuration
Update software
To update the software, download the latest version from idealnwd.com and copy it to the root directory on
a USB flash drive. From the tester’s home screen, go to SETUP>SYSTEM>UPDATE; the ‘Update’ screen
is shown on the display. Follow the instructions listed on the Update screen.
MGig1 can save up to 30 different configurations. A previously saved configuration can be loaded at any
time.
Configurations
Configurations can be:
Named and saved to MGig1’s local memory,
loaded from MGig1’s local memory,
exported to USB flash drive,
imported from a USB flash drive.
CAUTION
When a configuration is exported, previously saved Configurations on the USB flash drive will be overwritten.
UniPRO 152810
User Guide Page 59
Page 60

SEL1 software updates and configuration
General
SEL1 can have its loop layer changed, or be completely reconfigured, via a remote connection to MGig1.
See page 29 for details.
SEL1 can be reconfigured using the software – UPSEL1Config.xls. This can be downloaded from
idealnwd.com. Instructions are included on the file.
Update software
To load a software update to SEL1, download the software update from idealnwd.com and proceed as
follows, Fig 6 refers.
Copy the software update to the root directory of a USB flash drive. Make sure that there are no
SEL1 configurations saved on the USB flash drive.
With SEL1 switched OFF, insert the flash drive into the USB socket (item 7) at the top of the
SEL1 handset.
Press and hold down the blue Layer button (item 13). With the blue Layer button held down,
press the ON/OFF button (15) until the LEDs glow. Release both buttons.
The LEDs will flash for about 30 seconds. When they stop, remove the flash drive from the USB
port. SEL1 is ready for use, a restart is not required.
Upload configuration (for transfer to other SEL1 handsets)
To upload SEL1’s current configuration to a USB flash drive, proceed as follows, Fig 6 refers:
With SEL1 switched OFF, insert an empty (no files) flash drive into the USB socket (item 7) at
the top of the SEL1 handset.
Press and hold down the blue Layer button (item 13). With the blue Layer button held down,
press the ON/OFF button (15) until the LEDs glow. Release both buttons.
The LEDs will flash for a brief period. When they stop, remove the flash drive from the USB port.
The configuration is saved to the root directory of the flash drive and ready for download to
another SEL1.
Download configuration
To download a SEL1’s configuration that is saved in the root directory of a USB flash drive, proceed as
follows, Fig 6 refers:
With SEL1 switched OFF, insert the flash drive into the USB socket (item 7) at the top of the
SEL1 handset.
Press and hold down the blue Layer button (item 13). With the blue Layer button held down,
press the ON/OFF button (15) until the LEDs glow. Release both buttons.
The LEDs will flash for a brief period. When they stop, remove the flash drive from the USB port.
SEL1 is ready for use, a restart is not required.
Reset SEL1 to factory default
To reset SEL1 to factory default, proceed as follows, Fig 6 refers:
Make sure SEL1 is switched OFF. A flash drive must NOT be inserted into the USB socket.
Press and hold down the blue Layer button (item 13). With the blue Layer button held down,
press the ON/OFF button (15) until the LEDs glow. Release both buttons.
The LEDs will flash for a brief period. When they stop, SEL1 is restored to factory defaults and
is ready for use, a restart is not required.
152810 UniPRO
Page 60 User Guide
Page 61

Term
Description
Test interface
RJ45: 10, 100, and 1000 Mb/s. Optical: 1000Mb/s with auto-negotiation and
optional SFP. UniPRO MGig1 Solo and UniPRO SEL1: x1 port. UniPRO
MGig1 Duo: x2 ports.
Operation mode
End point (terminated), pass through (monitor) for UniPRO MGig1 Duo only.
SLA-Tick
Items: frame loss, jitter (delay variation), delay (latency, loop test only), service
disruption time, information rate, error performance (SES, unavailability).
Mode: single-ended with remote loop or double-ended two way test. Tests up
to eight configurable services (streams) simultaneously with parameters on
each service, pass/fail limits, error injection: single, rate with frame.
RFC2544
Items: throughput, latency, frame loss, jitter, back to back, system recovery.
Table and graph results, frame size. Mode: single end loopback test or double
end Bi-Directional test. Pass/fail limits.
Y.1564 (NetSAM)
Configuration test on CIR (Committed Information Rate), EIR (Excess
Information Rate), color mode, traffic policing. Performance test up to 8
services simultaneously on utilization, FTD (delay), FDV (jitter), FLR (frame
loss), SES, availability measurement with fixed or mixed frame size, loop or BiDirectional test, pass/fail limits.
BERT
BER at L1 to L4 frame payload, test pattern on PRBS ITU or
Non ITU @ 2n-1 n=11,15,20,23,31. SCRTPAT, CRPAT,CJTPAT, CSPAT,
LFPAT, HFPAT, MFPAT, fixed: all 1s, 0s, 1100,1000, 1010. Word: 4 digit Hex,
Control: manual or user defined duration. Error injection: single, rate on frame
or bit.
Multi services (streams)
Up to eight services simultaneously generated and measured on FLR, FTD,
FDV, IR with independent IP, MAC, VLAN, MPLS, TCP or UDP ports setup on
each service for SLA-Tick, NetSAM (Y.1564) test.
Target finding & remote
loop control
Auto detection of target devices (IDEAL NETWORKS’ products only) with
remote control of loopback (L1 to L4) via in band Ethernet test link. Targets
can also be manually controlled locally.
Traffic generation
Profile: continuous, ramp (service one only), burst (service one only).
Information rate, frame size, test pattern.
Frame size (byte)
64,128, 256, 512, 1024, 1280, 1518, user defined up to 10000.
VLAN
Level: up to eight including QinQ. VLAN ID, TPID, CFI, on each service.
MPLS
Level: up to three. Label, Class, TTL for each service.
MAC, IP & payload
Setup: MAC address, IP address: static, DHCP. DNS, netmask, gateway.
Version: IPv4, IPv6. CoS: ToS, DSCP.Payload: UDP & TCP ports, ICMP type
& code.
Service Disruption Time
(SDT)
Service protection switch time measurement (SDT) on each service with
resolution 1ms.
Error insertion
Items: FCS, oversize, undersize, pattern. Type: single, ratio.
MAC frame statistics
Per service based - Rx frame rate, Rx information rate, Rx frame size, Tx/Rx
frame counts, Tx/Rx layer payload accumulated byte count. VLAN ID, per port
based - frame type: unicast, multi cast, broadcast. Pause frames. Protocol
discovery: LLDP / CDP / EDP. Frame errors: collision (10/100Mb/s only),
FCS, undersize, oversize, jabbers, errored, % errored.
Specifications – UniPRO MGig1 and UniPRO SEL1
The specifications listed below are for the MGig1 Duo PRO. To confirm the functionality of other models
refer to the Functional overview table on page 9.
UniPRO 152810
User Guide Page 61
Page 62

Term
Description
Link status
Port: speed, duplex, auto negotiation. Optical power, PoE detection.
Tools
Ping & Traceroute (IPv4, IPv6). Cable test, port blink, PoE & PoE+ (current,
voltage, power and pair).
Loopback (UniPRO
MGig1 & UniPRO
SEL1)
Level: L1 (Physical), L1 (Regenerate), L2 (MAC), L3 (IP), L4 (UDP) unfiltered.
Control: local or remote by another master unit via Ethernet test path.
Auto sequence test
Multi test items running sequentially. Test items can be defined by user.
Top ten bandwidth
users
Through mode only, VLAN users, source and destination MAC or IP address
users.
Storage
Internal configuration profile: MGig1: 30, SEL1: 1. Internal reports: 250
(MGig1 only). Format: xml. External storage: USB.
Display
3.5" TFT color touch screen (UniPRO MGig1), 5 LEDs (UniPRO SEL1).
Battery
NiMH Rechargeable; auto power off 3,10, 30 min (MGig1), continuous use
>4hrs (MGig1), > 3.5hrs (SEL1), power adaptor: 100-240VAC IN /12VDC OUT.
System interface
USB 1.1 for external storage on software upgrade, test report and configuration
upload.
Physical
Dimension: 205x98x45 mm (MGig1), 175x80x40 mm (SEL1).
Weight including batteries: 650g (MGig1), 400g (SEL1).
Environmental
Temperature: 0°C to 45°C (operation), -20°C to 70°C (storage).
Humidity: 5% - 90% no condensation.
Accessories included
(UniPRO MGig1 &
UniPRO SEL1
1 x NiMH battery, 2 x Patch cables - 30cm, Cat 5e STP, 1 x PSU with
EU/UK/US adaptors, 1 x User manual CD, 1 x English quick reference guide,
1 x Carry case.
Specifications – UniPRO MGig1 and UniPRO SEL1 (continued)
152810 UniPRO
Page 62 User Guide
Page 63

Term
Description
10M-HD
10 Mb/s Half Duplex
10M-FD
10 Mb/s Full Duplex
100M-HD
100 Mb/s Half Duplex
100M-FD
100 Mb/s Full Duplex
1000M-HD
1000 Mb/s Half Duplex
1000M-FD
1000 Mb/s Full Duplex
BERT
Bit Error Ratio Test (often incorrectly called “Bit Error Rate Test”)
Bi-Directional
Tests which use two testers, each transmitting to the other
Broadcast
Communication from single sender to all connected receivers
CBS
Committed Burst Size
CFI
Canonical Format Indicator. A flag in the Ethernet frame indicating the
MAC format
CIR
Committed Information Rate
CJTPAT
Long Compliant Jitter Test Pattern. A special-purpose test data pattern
CoS
Class of Service
CRC
Cyclic Redundancy Check
CRPAT
Compliant Supply Noise Data Pattern. A special-purpose test data pattern
DHCP
Dynamic Host Configuration Protocol
Discovery data
LLDP
Link Layer Discovery Protocol
CDP
Cisco Discovery Protocol
EDP
Extreme Discovery Protocol
DNS
Domain Name System
EBS
Excess Burst Size
EIR
Excess Information Rate
Errored Second
Any second containing one or more lost or errored frames
Errored Time
Number of Errored Seconds expressed as hours, minutes and seconds
EMIX
Ethernet mix – Set of frame sizes used for Y.1564 configuration tests
FCS
Frame Check Sequence. The last section of the Ethernet frame structure
before the IFG. Used to check the frame for errors
FDV
Frame Delay Variation
FLR
Frame Loss Ratio
Frame rate
The number of frames per second. High frame rates have a short IFG
Frame size
The length of the Layer 1 payload
FTD
Frame Transfer Delay
HFPAT
High Frequency Test Pattern. Special-purpose test data pattern
ICMP
Internet Control Message Protocol
IETF
Internet Engineering Task Force
Glossary, abbreviations and acronyms
UniPRO 152810
User Guide Page 63
Page 64

Term
Description
IFG
Inter-Frame Gap. The gap between Ethernet frames. Traffic with a low
frame rate has long gaps between frames
Information rate
The Layer 1 payload rate. The number of Layer 1 payload bits per second
IP
Internet Protocol
IPv4
Internet Protocol version 4
Static
IP address assigned manually by the operator
Dynamic
IP address assigned automatically using DHCP
Ipv6
Internet Protocol version 6
Stateful
IP address assigned automatically using DHCPv6
Stateless
IP address assigned automatically using ICMPv6
Static
IP address assigned manually by the operator
ITU
International Telecommunications Union
Jitter
Measurement of short term variations in network propagation delay
Key Mgmt
802.1x Key Management
LAN
Local Area Network
Latency
Measurement of network propagation delay
Layer1 (L1)
The Physical layer of the ISO 7-layer model. Includes the SFD, the
Preamble and the IFG parts of the Ethernet structure
Layer 1 Payload
Everything in the Ethernet frame between, but not including, the SFD and
the IFG. Includes the MAC and the FCS
Layer 2 (L2)
The Data link layer of the ISO 7-layer model. Includes the MAC and FCS
parts of the Ethernet frame
Layer 2 Payload
Everything in the Ethernet frame between, but not including, the MAC and
the FCS
Layer 2 Payload rate
Number of L2 Payload bits per second
Layer 3 (L3)
The Network layer of the ISO 7-layer model. Includes the IP part of the
Ethernet frame and, optionally, the VLAN, MPLS and LLC/SNAP parts
Layer 3 Payload
Everything in the Ethernet frame between, but not including, the IP (and
VLAN, MPLS or LLC/SNAP if present) and the FCS
Layer 3 Payload rate
The number of L3 Payload bits per second
Layer 4
The Transport layer of the ISO 7-layer model. Includes the Transport
Protocol header (TCP/UDP/ICMP) and user data parts of the Ethernet
frame
Layer 4 Payload
Everything in the Ethernet frame between but not including the Protocol
header and the FCS. The user test data
Layer 4 Payload rate
The number of L4 Payload bits per second
Glossary, abbreviations and acronyms (continued)
152810 UniPRO
Page 64 User Guide
Page 65

Term
Description
LFPAT
Low Frequency Test PATtern. Special-purpose test data pattern
Line rate
The nominal speed of the media link – 10/100/1000Mb/s
LINK error data
Collisions
Collisions on the Ethernet frame transmission
FCS errors
Frame Check Sequence errors
Undersize
Frames smaller than the minimum set in SETUP>RJ45 or
SETUP>OPTICAL
Oversize
Frames longer than 1522 bytes
Jabbers
Frames longer than 1518 bytes with bad CRC
Bad length
Frames with actual length different from the length specified in their
ethertype field
LLC/SNAP
Logical Link Control / Sub-Network Access Protocol
MAC
Media Access Control
Mb/s
Megabits per second
MDI
Medium Dependent Interface
MDIX
Medium Dependent Interface Crossover
MFPAT
Mixed Frequency Test PATtern. Special-purpose test data pattern
MPLS
Multi-Protocol Label Switching protocol
MTU
Maximum Transmission Unit
Multicast
Communication between single sender and multiple receivers
NetSAM
IDEAL INDUSTRIES special name for Y.1564
NVP
Nominal Velocity of Propagation of signals in a cable, expressed as a
percentage of the speed of light in a vacuum. Can be determined using
cable manufacturers’ data or experimentally using a known cable length.
PCP
Priority Code Point (used to control VLAN priority)
PoE
Power over Ethernet
PRBS
Pseudo-Random Binary Sequence. Standard patterns of test data
contained in the Layer 4 payload
PRE
Preamble. The first part of the Ethernet frame before the SFD
QinQ
Ethernet frame format that allows multiple VLAN headers to be inserted
into a single frame
QoS
Quality of Service
RFC2544
An IETF standard (Request For Comments) that specifies a benchmarking
methodology for network interconnect devices
RJ45
Registered Jack standard for a modular connector using 8 conductors
Rx
Receive
SAC
Service Acceptance Criteria
SCRTPAT
Short Continuous Random Test Pattern. Special-purpose test data
pattern
SDT
Service Disruption Time
Glossary, abbreviations and acronyms (continued)
UniPRO 152810
User Guide Page 65
Page 66

Term
Description
Service
A specific traffic flow or stream that can be simultaneously carried over the
same Ethernet link as other services
SES
Severely Errored Second - Any one-second period during which 30% or
more of frames are lost or errored
SFD
Start of Frame Delimiter
SFP
Small Form-factor Pluggable
SLA
Service Level Agreement
SLA-Tick
A special Throughput/Latency/Jitter test with constant frame size
STP
Shielded Twisted Pair
TPID
Tag Protocol Identifier (Used in VLAN control)
TTL
Time To Live. Limits the lifetime of stray Ethernet frames to avoid build-up
in networks
Tx
Transmit
UDP
User Datagram Protocol
Unavailable Time
Any period of ten seconds or more during which every second is a
Severely Errored Second
Unicast
Communication between single sender and single receiver
URL
Uniform Resource Locator
USB
Universal Serial Bus
Utilization
The ratio of Information Rate to Line Rate
UTP
Unshielded Twisted Pair
VLAN
Virtual Local Area Network
WAN
Wide Area Network
XML
Extensible Markup Language
XSLT
Extensible Stylesheet Language Transformations
Y.1564
An ITU standard which specifies an Ethernet service activation test
methodology that allows for complete validation of Ethernet service-level
agreements (SLA) in a single test
Glossary, abbreviations and acronyms (continued)
152810 UniPRO
Page 66 User Guide
Page 67

Page 68

A subsidiary of IDEAL INDUSTRIES INC.
 Loading...