

Page 1

ICP DAS PMC/PMD
(Power Meter Concentrator) Series
User Manual
[Version 3.1.8]
Page 2

ICP DAS PMC/PMD Series User Manual
Warning
ICP DAS Inc., LTD. assumes no liability for damages consequent to the use of
this product. ICP DAS Inc., LTD. reserves the right to change this manual at any time
without notice. The information furnished by ICP DAS Inc. is believed to be accurate
and reliable. However, no responsibility is assumed by ICP DAS Inc., LTD. for its use,
or for any infringements of patents or other rights of third parties resulting from its
use.
Copyright and Trademark Information
© Copyright 2017 by ICP DAS Inc., LTD. All rights reserved worldwide.
Trademark of Other Companies
The names used for identification only maybe registered trademarks of their
respective companies.
License
The user can use, modify and backup this software on a single machine. The user
may not reproduce, transfer or distribute this software, or any copy, in whole or in
part.
Page 3

ICP DAS PMC/PMD Series User Manual
Table of Contents
1 System Introduction .................................................................................... 1
2 Before Installation ....................................................................................... 5
3 System Login .............................................................................................. 6
4 System Main Page ....................................................................................... 7
4.1 System function area ......................................................................... 8
4.1.1 Rules management toolbar ...................................................... 8
4.1.2 Real-time information area.................................................... 11
4.1.3 System function toolbar ........................................................ 11
4.2 Sub-function area ........................................................................... 12
4.3 Data review/System setting area ....................................................... 12
5 Main Page ................................................................................................ 15
5.1 Power Meter Information ................................................................ 15
5.1.1 Power Meter Information Overview ....................................... 15
5.1.2 Power Meter Statistics Information Overview ......................... 19
5.1.3 Other Information ................................................................ 20
5.1.4 I/O Information ................................................................... 20
5.2 Power Data Information .................................................................. 21
5.2.1 Overview ............................................................................ 21
5.2.2 Group Overview .................................................................. 22
5.3 Realtime Chart ............................................................................... 23
5.3.1 Power Meter Mode .............................................................. 23
5.3.2 Group Mode ........................................................................ 25
5.4 Historical Chart .............................................................................. 27
5.5 Historical Data Report..................................................................... 29
5.6 Historical Electricity Analysis .......................................................... 32
5.6.1 Energy Usage Analysis by Trend ........................................... 32
5.6.2 Energy Usage Analysis by Time Period .................................. 34
5.6.3 Energy Usage Breakdown by Circuit/Group ........................... 36
5.7 PUE Information ............................................................................ 39
5.7.1 Real-Time ........................................................................... 39
5.7.2 History ............................................................................... 39
5.8 I/O Information .............................................................................. 41
5.9 I/O Realtime Chart ......................................................................... 42
5.10 I/O Historical Chart ................................................................ ........ 43
5.11 Event Log ...................................................................................... 45
Page 4

ICP DAS PMC/PMD Series User Manual
5.12 Polling Time Information ................................................................ 46
5.13 Modbus Table Information .............................................................. 46
5.14 UID Information ............................................................................. 47
6 System Setting .......................................................................................... 49
6.1 Time Setting .................................................................................. 50
6.2 Network Setting ............................................................................. 52
6.3 VPN Setting (This function is for PMC-5151 only.) ........................... 56
6.4 SNMP Setting ................................................................................ 60
6.5 Security Setting .............................................................................. 63
6.6 I/O Interface Setting ....................................................................... 65
6.7 Other Setting .................................................................................. 68
6.8 Power Meter Group Setting ............................................................. 69
6.8.1 Group and Subgroup Viewing ............................................... 69
6.8.2 Group and Subgroup Setting ................................................. 70
6.8.3 Group and Subgroup configuration ........................................ 71
6.8.4 Setup the loops/phases of the subgroup .................................. 72
6.8.5 Loop/Phase of group configuration ........................................ 73
6.9 Firmware Update ............................................................................ 75
7 Power Meter & I/O Module Setting ............................................................. 78
7.1 Power Meter Setting ................................ ................................ ....... 79
7.1.1 Scan to add Modbus RTU Power Meters ................................ 80
7.1.2 Add Modbus RTU Power Meter Manually .............................. 81
7.1.3 Add Modbus TCP Power Meter Manually .............................. 83
7.1.4 Power Meter List Interface .................................................... 84
7.1.5 Modbus RTU Power Meter Setting ........................................ 85
7.1.6 Modbus TCP Power Meter Setting ......................................... 88
7.2 XW-Board/XV-Board Setting (PMD series does not support this function.)
90
7.2.1 XW-Board/XV-Board DI Channel Settings ............................. 90
7.2.2 XW-Board/XV-Board DO Channel Settings............................ 91
7.2.3 XW-Board/XV-Board AI Channel Settings ............................. 93
7.2.4 XW-Board/XV-Board AO Channel Settings ............................ 96
7.3 I/O Module Setting ......................................................................... 97
7.3.1 Scan to Add ICP DAS M-7000/DL Modules ........................... 98
7.3.2 Add Modbus RTU Module (or M-7000/DL Module) Manually
100
7.3.3 Add Modbus TCP Module Manually .................................... 101
7.3.4 I/O Module List Interface ................................................... 102
Page 5

ICP DAS PMC/PMD Series User Manual
7.3.5 M-7000/DL Module Setting ................................................ 103
7.3.6 Modbus RTU Module Setting .............................................. 108
7.3.7 Modbus TCP Module Setting .............................................. 120
8 Logger Setting ........................................................................................ 122
8.1 Data Logger Setting ...................................................................... 123
8.2 Event Logger Setting .................................................................... 126
8.3 FTP Upload Setting ...................................................................... 127
8.4 Cloud Upload Setting .................................................................... 128
8.5 The Path of Data Log File ............................................................. 129
8.6 The format of the Power Data Logger file ....................................... 131
8.7 The format of the Power Report file ............................................... 133
8.8 The Format of User-Defined Data File ............................................ 136
9 IoT Platform Setting ................................................................................ 137
9.1 Microsoft Azure Setting ................................................................ 137
9.2 IBM Bluemix Setting .................................................................... 142
9.3 MQTT Setting .............................................................................. 144
9.3.1 Broker Setting ................................................................... 144
9.3.2 Topic Import/Export Setting ................................................ 150
10 Advanced Setting .................................................................................... 153
10.1 Email Setting ............................................................................... 153
10.2 SMS Setting ................................................................................. 157
10.2.1 SMS Alarm Setting ............................................................ 157
10.2.2 SMS Command Setting ...................................................... 159
10.3 SNMP Trap Setting ....................................................................... 163
10.4 LINE Notify Setting ..................................................................... 168
10.4.1 Message Setting ................................................................. 168
10.4.2 Chat Room Setting ............................................................. 170
10.5 Timer Setting ............................................................................... 173
10.6 Schedule Setting ........................................................................... 175
10.7 PUE Setting ................................................................................. 178
10.8 Internal Register Setting ................................................................ 180
11 Rules Setting .......................................................................................... 183
11.1 IF Condition Setting ..................................................................... 185
11.1.1 ICP DAS Module ............................................................... 186
11.1.2 Modbus Module ................................................................ 190
11.1.3 Power Meter ...................................................................... 193
11.1.4 Microsoft Azure ................................ ................................ . 194
11.1.5 IBM Bluemix .................................................................... 195
Page 6

ICP DAS PMC/PMD Series User Manual
11.1.6 MQTT .............................................................................. 196
11.1.7 Connection Status .............................................................. 198
11.1.8 Timer ................................................................................ 198
11.1.9 Schedule ........................................................................... 199
11.1.10 Mobile Network Signal Strength .......................................... 199
11.1.11 FTP Upload Status ............................................................. 200
11.1.12 SD Card Status .................................................................. 201
11.1.13 Rule Status ........................................................................ 201
11.1.14 Internal Register ................................................................ 202
11.2 THEN/ELSE Action Setting .......................................................... 203
11.2.1 ICP DAS Module ............................................................... 204
11.2.2 Modbus Module ................................................................ 207
11.2.3 Power Meter ...................................................................... 209
11.2.4 Microsoft Azure ................................ ................................ . 209
11.2.5 IBM Bluemix .................................................................... 210
11.2.6 MQTT .............................................................................. 212
11.2.7 Timer ................................................................................ 213
11.2.8 Email ................................................................................ 213
11.2.9 SMS Alarm ....................................................................... 214
11.2.10 SNMP Trap ....................................................................... 215
11.2.11 LINE Notify ...................................................................... 215
11.2.12 Data Logger ...................................................................... 216
11.2.13 Rule Status ........................................................................ 216
11.2.14 Internal Register ................................................................ 217
Appendix I:Modbus Address Table ................................................................ 219
Appendix II:Reset to Factory Default Setting and Send Password to Administrator
297
Appendix III:Setup the GTM-203M-3GWA with PMC-5151 and PMD ............. 300
Appendix IV:The configuration setting of M-7000/DL module ......................... 301
Appendix V:The AI Channel setting of XW310C ............................................ 305
Appendix VI:The SNMP Variables for PMC/PMD .......................................... 306
Appendix VII:Change the value of output channel of module or Internal Register by
MQTT protocol .............................................................................................. 317
Appendix VIII:The JSON format for the communication with IoT Platform ....... 319
Appendix IX:PMC-52xx/PMD Connection setting for IoTstar .......................... 324
Page 7

ICP DAS PMC/PMD Series User Manual
List of Figures
Figure1-1 : PMC/PMD System Architecture ..................................................... 2
Figure3-1 : PMC/PMD Login page .................................................................. 6
Figure4-1 : PMC/PMD Main Page ................................................................... 7
Figure4-2 : System Function Area (login as a Administrator) .............................. 8
Figure4-3 : System Function Area(login as a General user) ................................ 8
Figure4-4 : Rules management toolbar (login as a Administrator) ....................... 8
Figure4-5 : Rules management toolbar (login as a General user) ......................... 9
Figure4-6 : Confirm to clear settings ................................................................ 9
Figure4-7 : Confirm to load settings ................................................................. 9
Figure4-8 : Confirm to save settings............................................................... 10
Figure4-9 : Confirm to logout (The settings are saved) ..................................... 10
Figure4-10 : Confirm to logout (The settings are not saved) ............................... 10
Figure4-11 : Real-time information area ........................................................... 11
Figure4-12 : Real-time information list ............................................................ 11
Figure4-13 : Current function path ................................................................... 12
Figure4-14 : Power data Overview page ........................................................... 13
Figure4-15 : Select the classification of Power data ........................................... 13
Figure4-16 : Display power data of the selected classification ............................ 14
Figure5-1 : Information display options on Main Page ..................................... 15
Figure5-2 : Power Meter Information Overview .............................................. 16
Figure5-3 : The attribute of PM-3133 Power Meter ......................................... 16
Figure5-4 : The attribute of PM-3133-MTCP Power Meter............................... 17
Figure5-5 : Real Time Power Information of PM-3133 .................................... 17
Figure5-6 : Real Time Power Information of PM-3114 .................................... 18
Figure5-7 : Real Time Power Information of PM-3112 .................................... 18
Figure5-8 : Power Meter Statistics Information ............................................... 19
Figure5-9 : Power Meter Other Information Page ............................................ 20
Figure5-10 : Power Meter I/O Information Page ............................................... 20
Figure5-11 : Power Data Overview Mode ........................................................ 21
Figure5-12 : Change Display List Button ......................................................... 22
Figure5-13 : The Power Meter List .................................................................. 22
Figure5-14 : Power Data Group Overview Mode .............................................. 22
Figure5-15 : Realtime Chart (Power Meter Mode) ............................................. 24
Figure5-16 : Realtime Chart (Group Mode) ...................................................... 26
Figure5-17 : Historical Chart Inquiry ............................................................... 27
Page 8

ICP DAS PMC/PMD Series User Manual
Figure5-18 : Historical Data Chart for power data ............................................. 28
Figure5-19 : Historical Data Table for power data ............................................. 29
Figure5-20 : Historical Data Report inquiry ...................................................... 29
Figure5-21 : Daily Report for PM-3133 ........................................................... 31
Figure5-22 : Daily Report for PM-3114 ........................................................... 31
Figure5-23 : "Total Accu. Electricity" report for Power Meters Group ................. 31
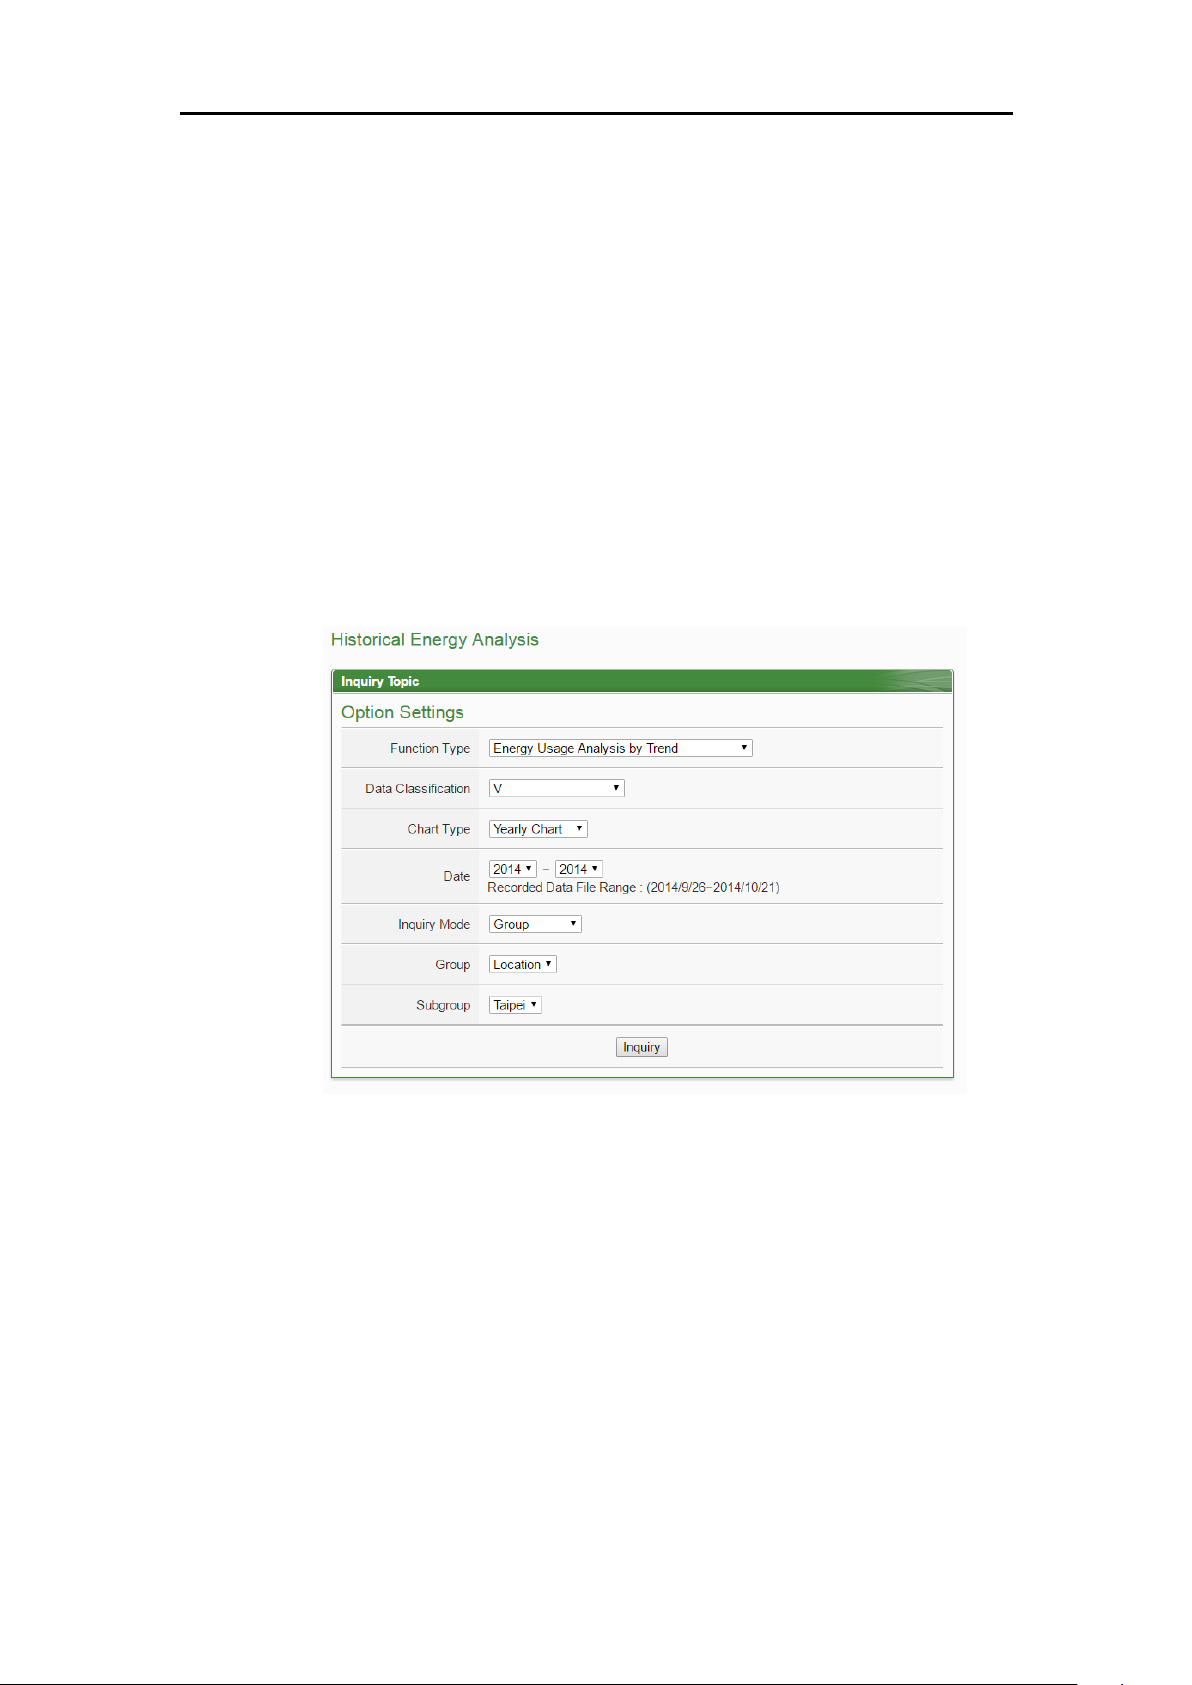
Figure5-24 : Energy Usage Analysis by Trend .................................................. 32
Figure5-25 : Inquiry by Group Mode ............................................................... 33
Figure5-26 : Inquiry by User-defined Mode ...................................................... 33
Figure5-27 : PM-3114 Energy Usage Analysis Trend Chart ................................ 34
Figure5-28 : Energy Usage Analysis by Time Period ......................................... 35
Figure5-29 : Time Histogram Chart for PM-3114 Loop 1 ................................... 36
Figure5-30 : Energy Usage breakdown by Circuit/Group ................................... 36
Figure5-31 : Inquiry by Group Mode ............................................................... 37
Figure5-32 : Energy Usage Breakdown by Circuit/Group Chart .......................... 38
Figure5-33 : PUE information - Realtime ......................................................... 39
Figure5-34 : PUE information - History(1) ....................................................... 40
Figure5-35 : PUE information - History(2) ....................................................... 40
Figure5-36 : I/O Information(login as Administrator) ........................................ 41
Figure5-37 : I/O Information(login as General User) ......................................... 41
Figure5-38 : I/O Realtime Chart ...................................................................... 42
Figure5-39 : I/O Channel Historical Chart ........................................................ 43
Figure5-40 : User-Defined Historical Chart ...................................................... 43
Figure5-41 : I/O Historical Data Chart ............................................................. 44
Figure5-42 : Event Log information display ..................................................... 45
Figure5-43 : Polling Time Information ............................................................. 46
Figure5-44 : The Interface of Modbus Table Information ................................... 46
Figure5-45 : Inquiry result of Modbus Table Information ................................... 47
Figure5-46 : Power Meter UID Information Page .............................................. 48
Figure6-1 : System Setting Overview Page ..................................................... 49
Figure6-2 : Time Setting Page ....................................................................... 50
Figure6-3 : Time Synchronization Setting ....................................................... 51
Figure6-4 : PMC-52xx/PMD Network Setting Page ........................................ 52
Figure6-5 : PMC-5151 Network Setting Page ................................................. 53
Figure6-6 : Signal Strength level and IP address for Mobile Network ................ 54
Figure6-7 : DDNS Setting Page ..................................................................... 55
Figure6-8 : IoTstar connection setting page ..................................................... 56
Figure6-9 : Setting interface of VPN function ................................................. 57
Page 9

ICP DAS PMC/PMD Series User Manual
Figure6-10 : Setting interface of VPN function ................................................. 58
Figure6-11 : Security setting interface of VPN function ..................................... 59
Figure6-12 : SNMP Setting Page ..................................................................... 60
Figure6-13 : SNMP Manager List .................................................................... 61
Figure6-14 : The Address Setting for SNMP Manager ....................................... 61
Figure6-15 : The Working Model Setting for SNMP Manager ............................ 61
Figure6-16 : Save the SNMP Manager Setting .................................................. 62
Figure6-17 : Security Setting Page ................................................................... 63
Figure6-18 : Password Setting Page ................................................................ . 64
Figure6-19 : Local FTP Server Setting Page ..................................................... 64
Figure6-20 : Idle Time Setting Page ................................................................. 65
Figure6-21 : I/O Interface Setting Page ............................................................ 65
Figure6-22 : Function setting to connect to HMI or SCADA .............................. 66
Figure6-23 : Function setting to connect to Modbus RTU slave device ................ 67
Figure6-24 : I/O Function setting about LAN.................................................... 68
Figure6-25 : Other setting page ....................................................................... 68
Figure6-26 : Power Meter Group Setting .......................................................... 69
Figure6-27 : Group and Subgroup Viewing ...................................................... 70
Figure6-28 : Group Setting ............................................................................. 70
Figure6-29 : Subgroup Setting ........................................................................ 70
Figure6-30 : Subgroup Setting Window ........................................................... 71
Figure6-31 : Configurations for Subgroup ........................................................ 71
Figure6-32 : Loops/Phases of subgroup Setting ................................................. 72
Figure6-33 : Choose Loops/Phased of Subgroup ............................................... 73
Figure6-34 : Add Loops/Phases for Subgroup ................................................... 73
Figure6-35 : Configurations for Loops/Phased of Subgroup ............................... 73
Figure6-36 : Firmware Update(1) .................................................................... 75
Figure6-37 : Firmware Update(2) .................................................................... 76
Figure6-38 : Firmware Update(3) .................................................................... 76
Figure6-39 : Firmware Update(4) .................................................................... 76
Figure6-40 : Firmware Update(5) .................................................................... 77
Figure6-41 : Firmware Update(6) .................................................................... 77
Figure7-1 : Meter / Module Setting Page ........................................................ 78
Figure7-2 : Power Meter Setting Page ............................................................ 79
Figure7-3 : The “Scan” button to search Power Meter ...................................... 80
Figure7-4 : Set up the Scanning Range for the Power Meters ............................ 80
Figure7-5 : Scanning the Power Meters .......................................................... 81
Figure7-6 : The Power Meter List after Scan operation .................................... 81
Page 10

ICP DAS PMC/PMD Series User Manual
Figure7-7 : Select the actual Power Meter connected to PMC/PMD .................. 81
Figure7-8 : Set up the No and Address of the power meter ............................... 82
Figure7-9 : Select Modbus RTU Power Meter model ....................................... 82
Figure7-10 : Add the Modbus RTU Power Meter manually ................................ 83
Figure7-11 : Add Modbus TCP Power Meter .................................................... 83
Figure7-12 : Select Modbus TCP Power Meter model........................................ 84
Figure7-13 : Add the Modbus TCP Power Meter manually ................................ 84
Figure7-14 : Power Meter List Interface ........................................................... 84
Figure7-15 : PM-3133 Setting Page ................................................................. 85
Figure7-16 : PM-3114 Setting Page ................................................................. 87
Figure7-17 : PM-3114-MTCP Setting Page ...................................................... 88
Figure7-18 : XW-Board Setting Page ............................................................... 90
Figure7-19 : XW-Board DI attribute setting page .............................................. 91
Figure7-20 : XW-Board DO attribute setting page ............................................. 92
Figure7-21 : XW-Board AI attribute setting page .............................................. 93
Figure7-22 : AI Deadband Operation(> or >= a numerical value) ........................ 94
Figure7-23 : AI Deadband Operation(< or <= a numerical value) ........................ 95
Figure7-24 : AI Deadband Operation(= a numerical value) ................................ 95
Figure7-25 : XW-Board AO attribute setting page ............................................. 96
Figure7-26 : I/O Module Setting Page .............................................................. 97
Figure7-27 : The “Scan” button to search M-7000/DL module ........................... 98
Figure7-28 : Set up the Scanning Range for the M-7000/DL module ................... 98
Figure7-29 : Scanning the M-7000/DL modules ................................................ 99
Figure7-30 : The M-7000/DL List after Scan operation ...................................... 99
Figure7-31 : Select the actual M-7000/DL modules connected to PMC/PMD ....... 99
Figure7-32 : Set up the No and Address of the Modbus RTU module ................ 100
Figure7-33 : Select the model of the Modbus RTU Module .............................. 100
Figure7-34 : Add the Modbus RTU Module manually ..................................... 101
Figure7-35 : Add Modbus TCP Module ......................................................... 101
Figure7-36 : Add the Modbus RTU Power Meter manually .............................. 102
Figure7-37 : Modbus module List Interface .................................................... 102
Figure7-38 : M-7000 DI Channel Setting Page ................................................ 104
Figure7-39 : M-7000/DL DO Channel Setting Page......................................... 105
Figure7-40 : M-7000/DL AI Channel Setting Page .......................................... 106
Figure7-41 : M-7000 AO Channel Setting Page .............................................. 107
Figure7-42 : Modbus RTU Slave Module Setting Page .................................... 108
Figure7-43 : Coil Output Setting Page............................................................ 110
Figure7-44 : Coil Output Setting Example for Modbus RTU Module ................ 111
Page 11

ICP DAS PMC/PMD Series User Manual
Figure7-45 : Discrete Input Setting Page ........................................................ 112
Figure7-46 : Discrete Input Setting Example for Modbus RTU Module ............. 113
Figure7-47 : Input Register Setting Page ........................................................ 114
Figure7-48 : Input Register Setting Example for Modbus RTU Module ............. 116
Figure7-49 : Holding Register Setting Page .................................................... 117
Figure7-50 : Input Register Setting Example for Modbus RTU Module ............. 119
Figure7-51 : Modbus TCP Slave Module Setting Page(1)................................. 120
Figure7-52 : Modbus TCP Slave Module Setting Page(2)................................. 121
Figure8-1 : Data Logger Setting Page ........................................................... 122
Figure8-2 : Data Logger Setting Page ........................................................... 123
Figure8-3 : Event Logger Setting Page ......................................................... 126
Figure8-4 : FTP Upload Setting Page ........................................................... 127
Figure8-5 : Cloud Upload Setting Page ........................................................ 128
Figure9-1 : Microsoft Azure Setting Page ..................................................... 137
Figure9-2 : Microsoft Azure Publish Message setting page ............................. 139
Figure9-3 : “User-Defined Data” Setting Interface of IoT Platform ................. 140
Figure9-4 : Microsoft Azure Subscribe Topic setting page .............................. 140
Figure9-5 : IBM Bluemix Setting page ......................................................... 142
Figure9-6 : IBM Bluemix Subscribe Message setting page ............................. 143
Figure9-7 : MQTT Setting Page (Broker) ..................................................... 145
Figure9-8 : MQTT Broker Parameter setting page ......................................... 145
Figure9-9 : Publish Message and Subscribe Topic setting page ....................... 147
Figure9-10 : Publish Message Setting Page .................................................... 148
Figure9-11 : Subscribe Topic Setting Page...................................................... 150
Figure10-1 : Email setting page ..................................................................... 154
Figure10-2 : Email setting page(Name & Description)) ................................... 154
Figure10-3 : Email setting page(SMTP Server) ............................................... 155
Figure10-4 : Email setting page(Email Address) ............................................. 155
Figure10-5 : Email setting page(Email Content) .............................................. 156
Figure10-6 : SMS Setting Page (1) ................................................................ 157
Figure10-7 : SMS Setting Page (2) ................................................................ 158
Figure10-8 : SMS Command Setting Page (1)) ............................................... 159
Figure10-9 : SMS Command Setting for GET Command ................................. 161
Figure10-10 : SMS Command Setting for SET Command ................................. 161
Figure10-11 : SMS Command list ................................................................... 161
Figure10-12 : SNMP Trap Setting Page ........................................................... 163
Figure10-13 : SNMP Trap Parameter Setting Page ............................................ 163
Figure10-14 : “Channel Data”Type Setting Page ............................................... 164
Page 12

ICP DAS PMC/PMD Series User Manual
Figure10-15 : Example of “Channel Data” Type Variable Binding List ................ 165
Figure10-16 : “User-Defined Data” Type Setting Page ...................................... 165
Figure10-17 : “User-Defined Data” Interface in Edit Mode ................................ 166
Figure10-18 : “User-Defined Data” Interface in View Mode .............................. 167
Figure10-19 : SNMP Trap setting with variable bindings list .............................. 167
Figure10-20 : LINE Notify Message Setting page (1) ........................................ 168
Figure10-21 : LINE Notify Message Setting page (2) ........................................ 169
Figure10-22 : LINE Notify Message Setting page (3) ........................................ 169
Figure10-23 : LINE Notify Message Setting page (4) ........................................ 170
Figure10-24 : LINE Notify Chat Room Setting page (1) .................................... 171
Figure10-25 : LINE Notify Chat Room Setting page (2) .................................... 171
Figure10-26 : LINE Notify Chat Room Setting page (3) .................................... 172
Figure10-27 : LINE Notify Chat Room Setting page (4) .................................... 172
Figure10-28 : LINE Notify Chat Room Setting page (5) .................................... 172
Figure10-29 : Timer creating Page................................................................... 174
Figure10-30 : Timer setting Page(Assign Period) .............................................. 174
Figure10-31 : Timer setting page(Internal Register) .......................................... 175
Figure10-32 : Schedule setting page ................................................................ 175
Figure10-33 : Calendar mode of Schedule setting ............................................. 176
Figure10-34 : Repeat mode of Schedule setting ................................................ 177
Figure10-35 : PUE Setting Page(1) .................................................................. 179
Figure10-36 : PUE Setting Page(2) .................................................................. 180
Figure10-37 : Internal Register setting page(1) ................................................. 181
Figure10-38 : Internal Register setting page(2) ................................................. 181
Figure11-1 : Rules overview page ................................................................. 183
Figure11-2 : Rules setting page ..................................................................... 184
Figure11-3 : DI condition setting page ........................................................... 186
Figure11-4 : DI Counter condition setting page ............................................... 187
Figure11-5 : AI condition setting page ........................................................... 188
Figure11-6 : Discrete Input condition setting page ........................................... 190
Figure11-7 : Coil Output condition setting page .............................................. 191
Figure11-8 : Input Register condition setting page ........................................... 192
Figure11-9 : Holding Register condition setting page ...................................... 192
Figure11-10 : Power Meter condition setting page ............................................ 193
Figure11-11 : Microsoft Azure Connection Status condition setting .................... 194
Figure11-12 : Microsoft Azure Subscribe Message condition setting ................... 195
Figure11-13 : IBM Bluemix Connection Status condition setting ........................ 195
Figure11-14 : IBM Bluemix Subscribe Message condition setting ...................... 196
Page 13

ICP DAS PMC/PMD Series User Manual
Figure11-15 : Broker Connection Status condition setting .................................. 197
Figure11-16 : Subscribe Topic condition setting................................................ 197
Figure11-17 : Connection Status condition setting page ..................................... 198
Figure11-18 : Timer condition setting page ...................................................... 199
Figure11-19 : Schedule condition setting page .................................................. 199
Figure11-20 : Mobile Network Signal Strength condition setting page ................ 200
Figure11-21 : FTP Upload Status condition setting page .................................... 200
Figure11-22 : SD Card Status condition setting page ......................................... 201
Figure11-23 : Rule Status condition setting page ............................................... 201
Figure11-24 : Internal register condition setting page ........................................ 202
Figure11-25 : DI Counter action setting page ................................................... 204
Figure11-26 : DO action setting page............................................................... 204
Figure11-27 : AO action setting page............................................................... 205
Figure11-28 : Coil Output action setting page ................................................... 208
Figure11-29 : Holding Register action setting page ........................................... 208
Figure11-30 : Power Meter Relay Action setting page ....................................... 209
Figure11-31 : Microsoft Azure Function Status action setting ............................. 210
Figure11-32 : Microsoft Azure Publish Message action setting ........................... 210
Figure11-33 : IBM Bluemix Function Status action setting ................................ 211
Figure11-34 : IBM Bluemix Publish Message action setting .............................. 211
Figure11-35 : Broker Function action setting page ............................................ 212
Figure11-36 : Publish Message action setting page ............................................ 212
Figure11-37 : Timer action setting page ........................................................... 213
Figure11-38 : Email action setting page ........................................................... 214
Figure11-39 : SMS Alarm action setting page ................................................... 214
Figure11-40 : SNMP Trap Action Setting Page ................................................. 215
Figure11-41 : LINE Notify action setting page ................................................. 216
Figure11-42 : Data Logger action setting page .................................................. 216
Figure11-43 : Rule Status action setting page ................................................... 217
Figure11-44 : Internal Register action setting page ............................................ 217
Page 14

ICP DAS PMC/PMD Series User Manual
1
1 System Introduction
The PMC(Power Meter Concentrator)/PMD(Power Meter Concentrator with Display)
is an intelligent Power Meter Concentrator developed by ICP DAS. It features various
functions such as: power data management, logic control, data logger and alarm
notification functions. By using PMC/PMD solution; it is no longer required to write
programming for power management system. It takes only a few clicks on the specific
Web HMI Interface provided by PMC/PMD to complete power management and
logic control settings for monitoring the power meters connected to the system. This
easy-to-use solution will dramatically reduce the labor and cost spent on power
monitoring and management system.
PMC/PMD series products are including following models:
PMC-5231: Industrial IoT Power Meter Concentrator without local display.
PMC-5231M-3GWA : 3G Industrial IoT Power Meter Concentrator
without local display.
PMC-5231M-4GE:4G Industrial IoT Power Meter Concentrator without
local display.
PMC-5231M-4GC:4G Industrial IoT Power Meter Concentrator without
local display (Only support China).
PMC-5151: Power Meter Concentrator without local display.
PMD-2201: Power Meter Concentrator with 7' local display.
PMD-4201: Power Meter Concentrator with 10' local display.
PMC/PMD allows connections to ICP DAS power meters via RS-485 or Ethernet
interface to read the power data of the devices measured by the power meters; and
then real-time record the power data in the data file. PMC/PMD also provides data
logger file auto send-back function; together with PMC Data Server software or
SCADA software, it allows collection and analysis of the power data.
Page 15
ICP DAS PMC/PMD Series User Manual
2
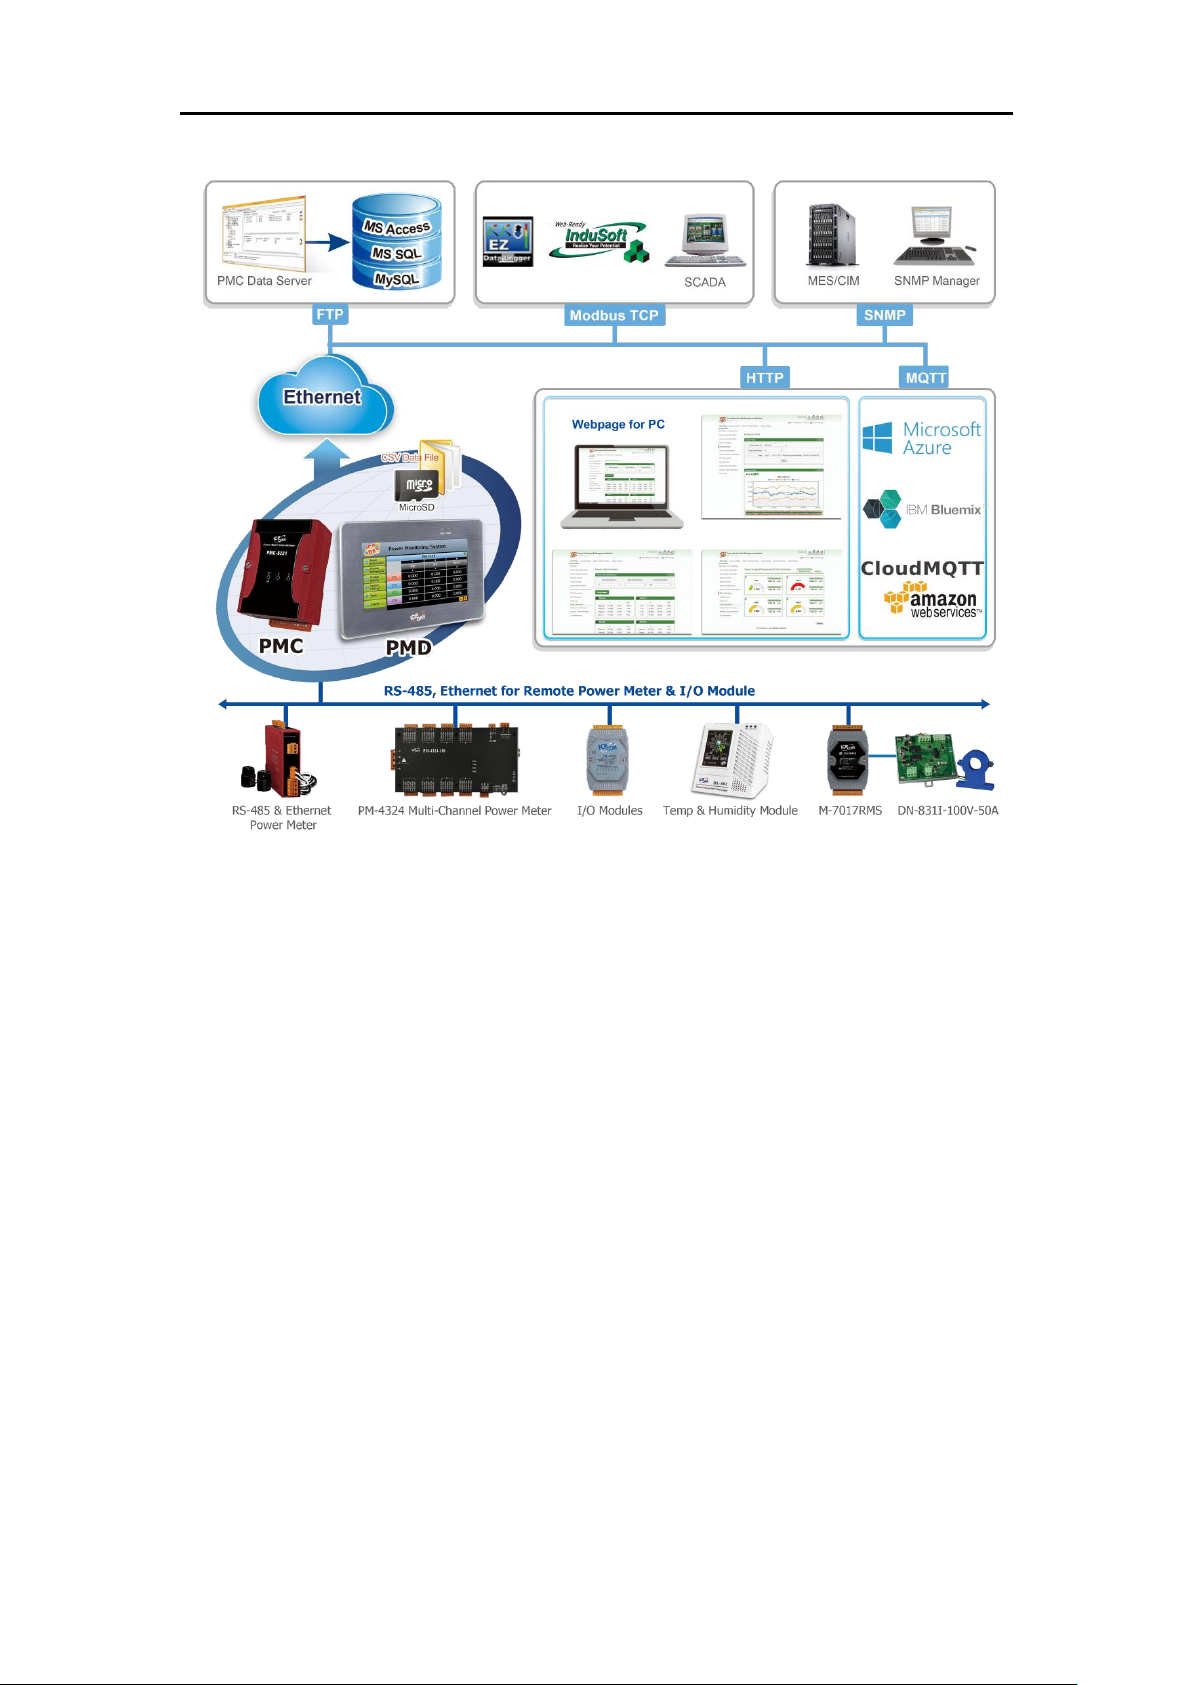
Figure1-1 : PMC/PMD System Architecture
With the built-in Web Server, it allows connection to PMC/PMD for power meter
parameters and system settings via browser and allows viewing the real time or
historical power data of the power meters. In addition to power data monitoring
function, the PMC/PMD also could connect to ICP DAS XW-Board, XV-Board ,
M-7000/DL I/O modules and standard Modbus RTU/TCP Slave modules. By working
with the I/O modules, and functions such as IF-THEN-ELSE logic rule execution and
Email/SMS Alarm Notification, PMC/PMD offers more thought-out power demand
management and alarm notification functions, and is able to perform load shedding of
the devices if required, and enables real-time monitoring and control of the power
consumption of the devices. At the same time, with the Data Logger function on
microSD card, the PMC/PMD could real-time record the power data and I/O channel
data, and automatically sends back the data file to management center for further
statistics and analysis; PMC/PMD also offers Modbus TCP/RTU Slave function that
allows SCADA software or HMI devices to connect to PMC/PMD to get real-time
power data of the devices via Modbus TCP/RTU protocol. In addition,
PMC-52xx/PMD series also support the MQTT protocol to connect with the MQTT
broker for the message publishing and subscribing mechanism, and the connection
Page 16

ICP DAS PMC/PMD Series User Manual
3
with the IoT service which Microsoft Azure and IBM Bluemix provide. The flexible
integration ability with the SCADA/IoT/IT system make PMC-52xx/PMD a perfect
concentrator of power meter in the Energy monitoring and management
application of Industry 4.0 age.
When using PMC/PMD to build a power management and monitoring system, during
the whole process of system development, no programming is required; it takes a few
clicks on web page to complete all settings; it is easy for the user to quickly view the
power data of the devices and furthermore process the data for statistics and analysis.
The PMC/PMD is an easy-to-use and easy-to-build total solution for power
management and monitoring that makes more efficient energy usage.
PMC/PMD features:
Web-Based Operation
No extra software tool is required; all operations can be done through the Web
browsers to build a power monitoring & management solution.
Built-in Web Server allows to set up the parameters of the power meters and
view power data via browsers.
Power Data Display
Support ICP DAS Modbus TCP/RTU power meters.
Display real-time or historical power data (in data table or chart form).
Provides Daily and Monthly power data report.
Power Data Log
Provides real-time power data log of the power meters (in csv format).
Automatically send back power data files at scheduled time via FTP.
Allow to recover Data Log files when the network is resumed after temporary
network disconnection.
Together with PMC Data Server software, it allows to import the content of
the power data files into the Database system.
Power Demand Management and Alarm Notification
With built-in IF-THEN-ELSE logic engine that enables thought-out power
demand management functions.
Support ICP DAS XW-Board, XV-Board, M-7000/DL modules and standard
Modbus RTU/TCP Slave modules for real-time I/O control and monitoring.
Provides Schedule function for device operation control.
Provides alarm message notification function via Email/SMS message/LINE
message.
Local Display for On-Site operations (PMD only)
Page 17

ICP DAS PMC/PMD Series User Manual
4
PMD is equipped with local side TFT LCD (with Touch Panel). It provides an
easy way for viewing the power data and setting the system parameters on
sites.
Connection with SCADA/IT/IoT system
Support Modbus TCP/RTU Slave protocol that allows seamless integration
with SCADA software.
PMC-52xx/PMD support the MQTT protocol. It can publish the power data
of the power meter which connect to PMC-52xx/PMD to the MQTT broker,
and receive the message of the Subscribe MQTT Topics which is published
by others MQTT device for the using in the IF-THEN-ELSE logic rule.
PMC-52xx/PMD support the connection ability with the IoT Cloud Platform
as Microsoft Azure, IBM Bluemix, etc. It work as the power meter
concentrator in the IoT application to connect with power meters, collect and
transfer the power data to the Cloud platform for future data analysis.
PMC-52xx/PMD also can receive the message which is published from the
Cloud platform for the corresponding actions at the field side.
Others
Offers access management for logic rule settings and encoded function for the
content to avoid unauthorized access to the system.
PMC-5231M-4GE/4GC & PMC-5231M-3GWA supports 4G/3G Wireless
data communication. With the 4G/3G SIM card, it can send the data logger
files and Email alarm message back to the control center by 4G/3G Wireless
Network.
PMC-5231M-4GE/PMC-5231M-4GC/PMC-5231M-3GWA/PMC-5151/PMD
equips SMS command receiving and alarm message notification function. It
allows to include SMS alarm sending action into logic rules to send a pre-set
SMS message to related personnel when an event occurs. In addition, these
power meter concentrators also allows to receive the SMS commands sending
by specific phones numbers to perform tasks such as real-time channel
monitoring, channel data modification and logic rules execution (triggered by
SMS), etc. (for SMS message operation, PMC-5151/PMD must connect with
GTM-203M-3GWA).
This document is intended to give you a full-range operations of web page to
PMC/PMD. You will be able to learn how to connect to power meters and I/O
modules, how to display and log the power data, how to edit logic of the rules and
how to download the rules to the PMC/PMD for conditional execution. For the
operations of the local display of PMD series, please refer to "PMD user manual for
Page 18

ICP DAS PMC/PMD Series User Manual
5
local operations".
2 Before Installation
Modify PMC/PMD‘s network settings to fit current network environment settings,
and the default network settings of PMC/PMD is as follow:
IP:192.168.255.1
Subnet mask:255.255.0.0
Gateway address:192.168.0.1
DNS Server address:8.8.8.8 (default: Google DNS Server)
Steps
(1) Modify the network settings of the PC or Notebook to be the same network
segment as PMC/PMD. For example:
IP:192.168.255.10
Subnet mask:255.255.0.0
Gateway address:192.168.0.1
(2) Connect PMC/PMD LAN1 to PC by network cable. (PMC/PMD is capable
of auto-crossover)
(3) Start the browser and input http://192.168.255.1 in the address bar.
(4) Input default administrator password “Admin” to login into the page.
(5) After login in PMC/PMD web page, go to System Setting Network Setting,
modify the network setting to fit current network environment. More detailed
setting information please refer to 6.2 Network Setting.
(6) Save the settings and connect PMC/PMD to the network.
Please Note:
1. Before installing PMC/PMD, please finish the hardware installation of the
ICP DAS Power meter modules, and make sure all wiring connections are
accurate.
2. If there are the M-7000/DL modules or Modbus TCP/RTU Slave modules
which will connect with PMC/PMD, please also finish the hardware
installation of the M-7000/DL modules or Modbus TCP/RTU Slave modules,
and make sure all wiring connections are accurate.
3. One PMC/PMD allows connections to at most 24 ICP DAS Modbus power
meters (including Modbus RTU and Modbus TCP power meters.).
4. One PMC/PMD allows connections to at most 8 Modbus TCP/RTU Slave
I/O modules.
Page 19
ICP DAS PMC/PMD Series User Manual
6
5. A single I/O interface allows connections to at most 16 devices (Power
meters and I/O modules).
3 System Login
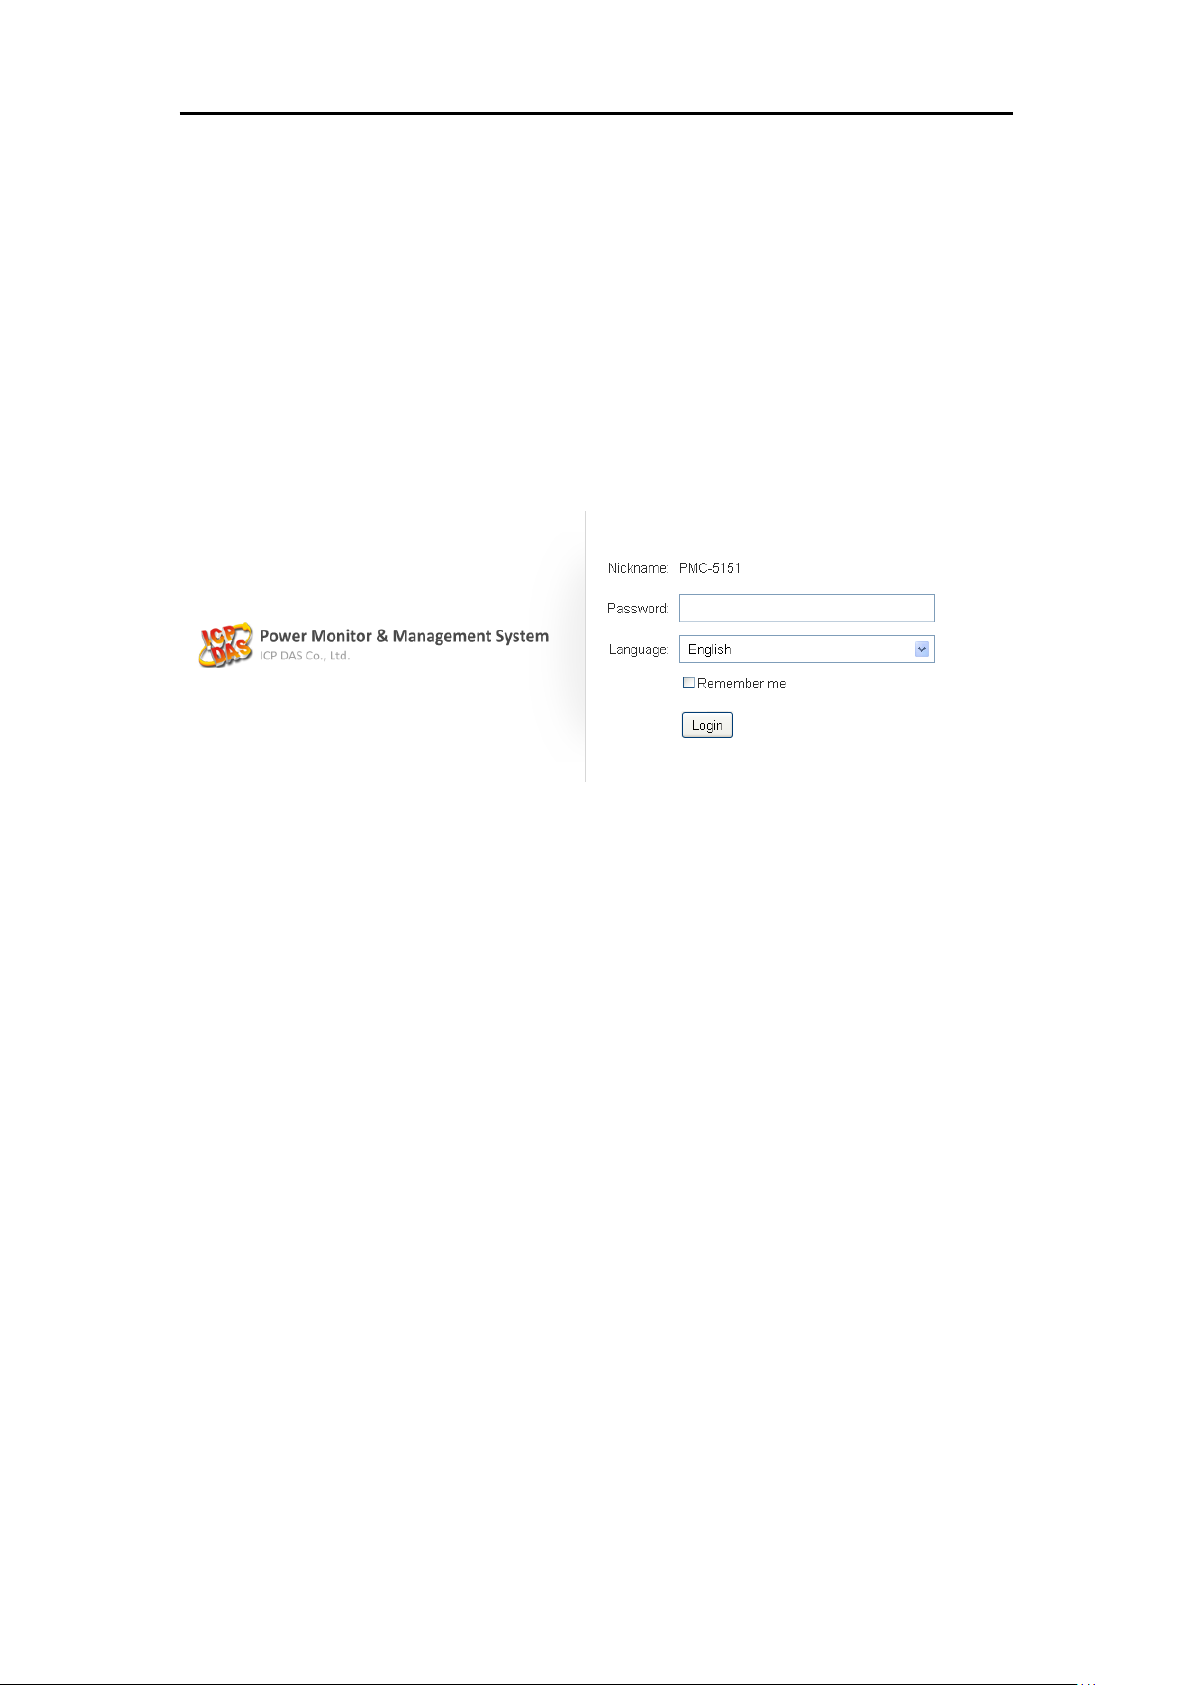
When connect to PMC/PMD webpage server via Web browser (IE 8 / Firefox 3.6 /
Chrome 14.0.8 version or above are recommended), in order to get a better operation
experience, 1280x1024 resolution is recommended. The Login page of PMC/PMD is
shown as below:
Figure3-1 : PMC/PMD Login page
By inputting different passwords, two levels of authority are granted as follow:
Administrator (Default password: Admin)
Login as an administrator allows performing settings and reviewing of system
information, power meter information and I/O modules information, it also
allows performing Logic rule edition. Only one administrator is allowed to login
into the system at the same time.
General User (Default password: User)
General users are allowed to view power meter data and I/O module information
only; they are not allowed to perform any settings. It allows maximum 5 general
users to login and get into the system at the same time.
Select your preferred language from the dropdown list in the “Language” field for the
Web page user interface (English, Traditional Chinese, Simplified Chinese). After
login into the system, if the user want to change the language again, logout and
re-select the language on the Login page.
Please note: Before starting the system, please make sure the browser you are using
already enable JavaScript support, otherwise the system will not function properly.
Page 20
ICP DAS PMC/PMD Series User Manual
7
A
B
C
4 System Main Page
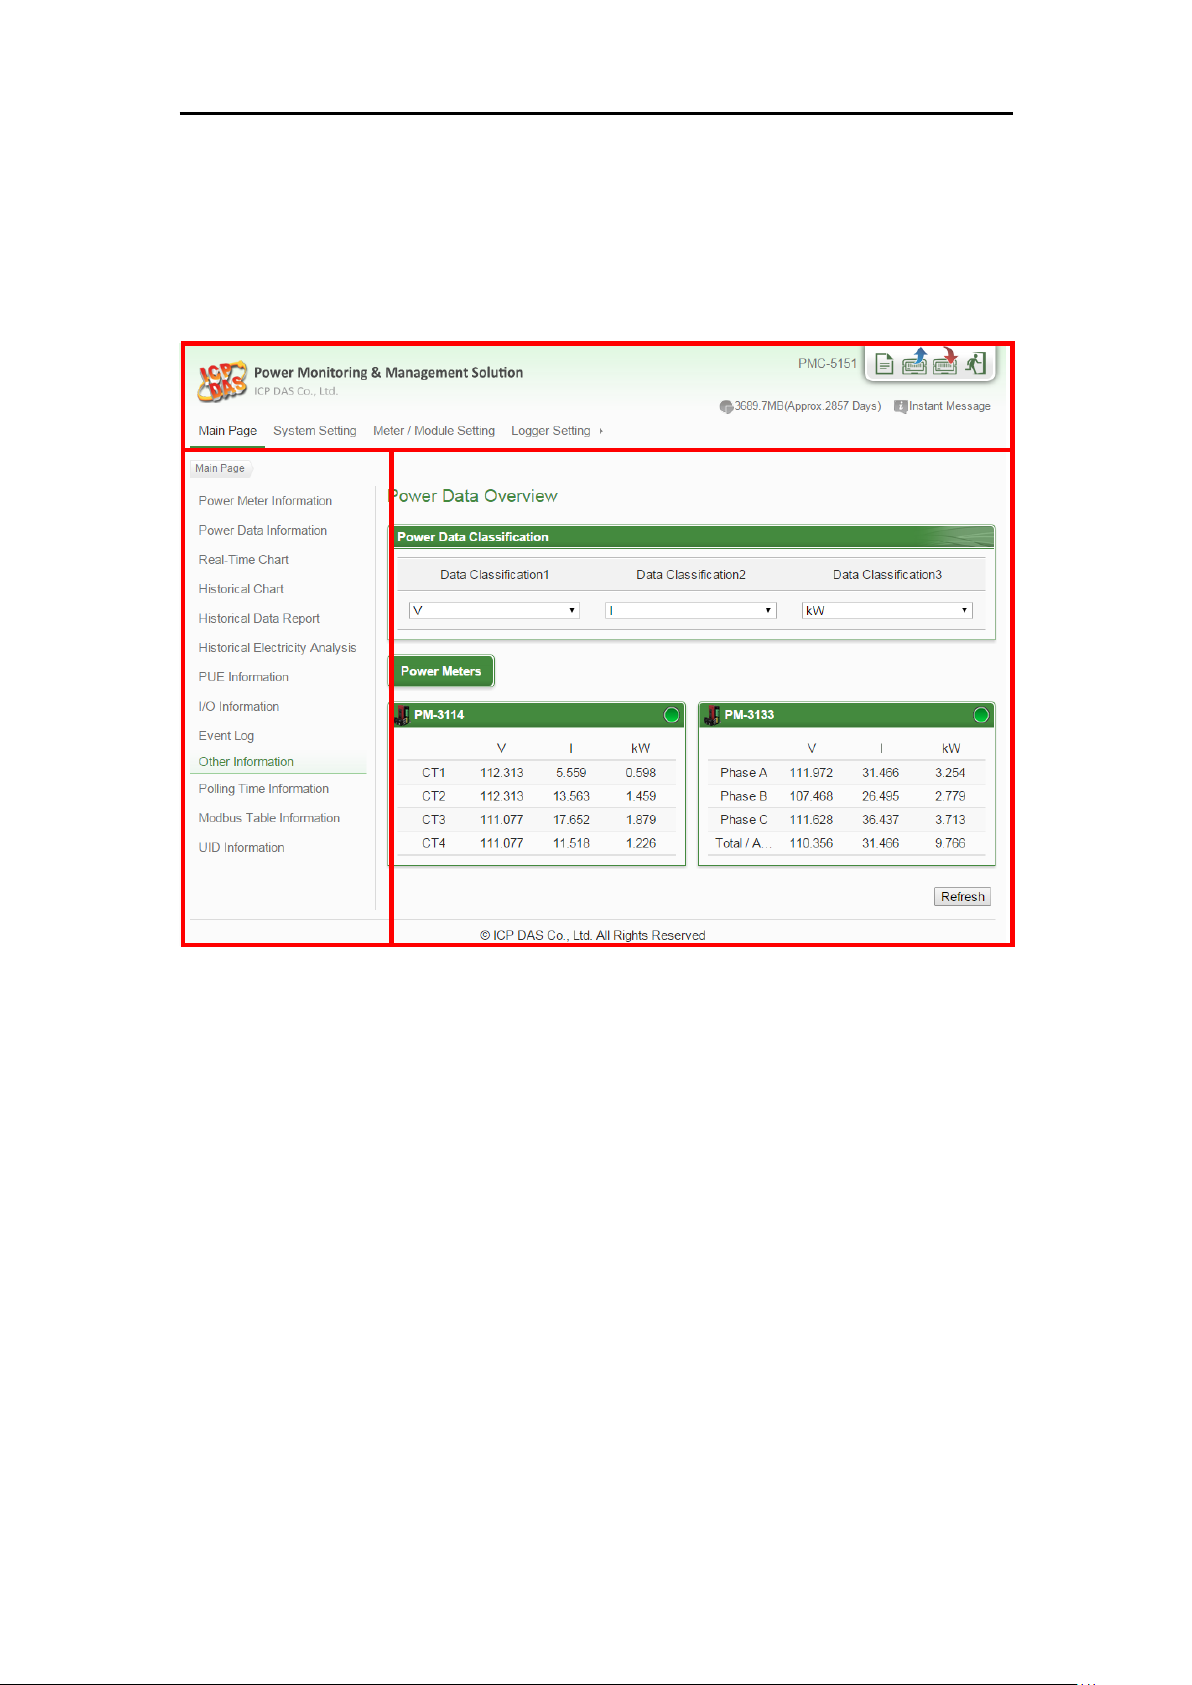
After login into the system, PMC/PMD default home page will be displayed, and will
automatically read settings of the PMC/PMD to the webpage.
Figure4-1 : PMC/PMD Main Page
PMC/PMD main page could be divided into 3 areas:
A. System function area
B. Sub-function area
C. Data review/System setting area
More detailed information for each area will be given in the following section.
Page 21
ICP DAS PMC/PMD Series User Manual
8
A1
A2
A3
4.1 System function area
System function area provides immediately access to the main functions of
PMC/PMD, such as: system settings, system real-time information display,
rule files management, etc, shown as below:
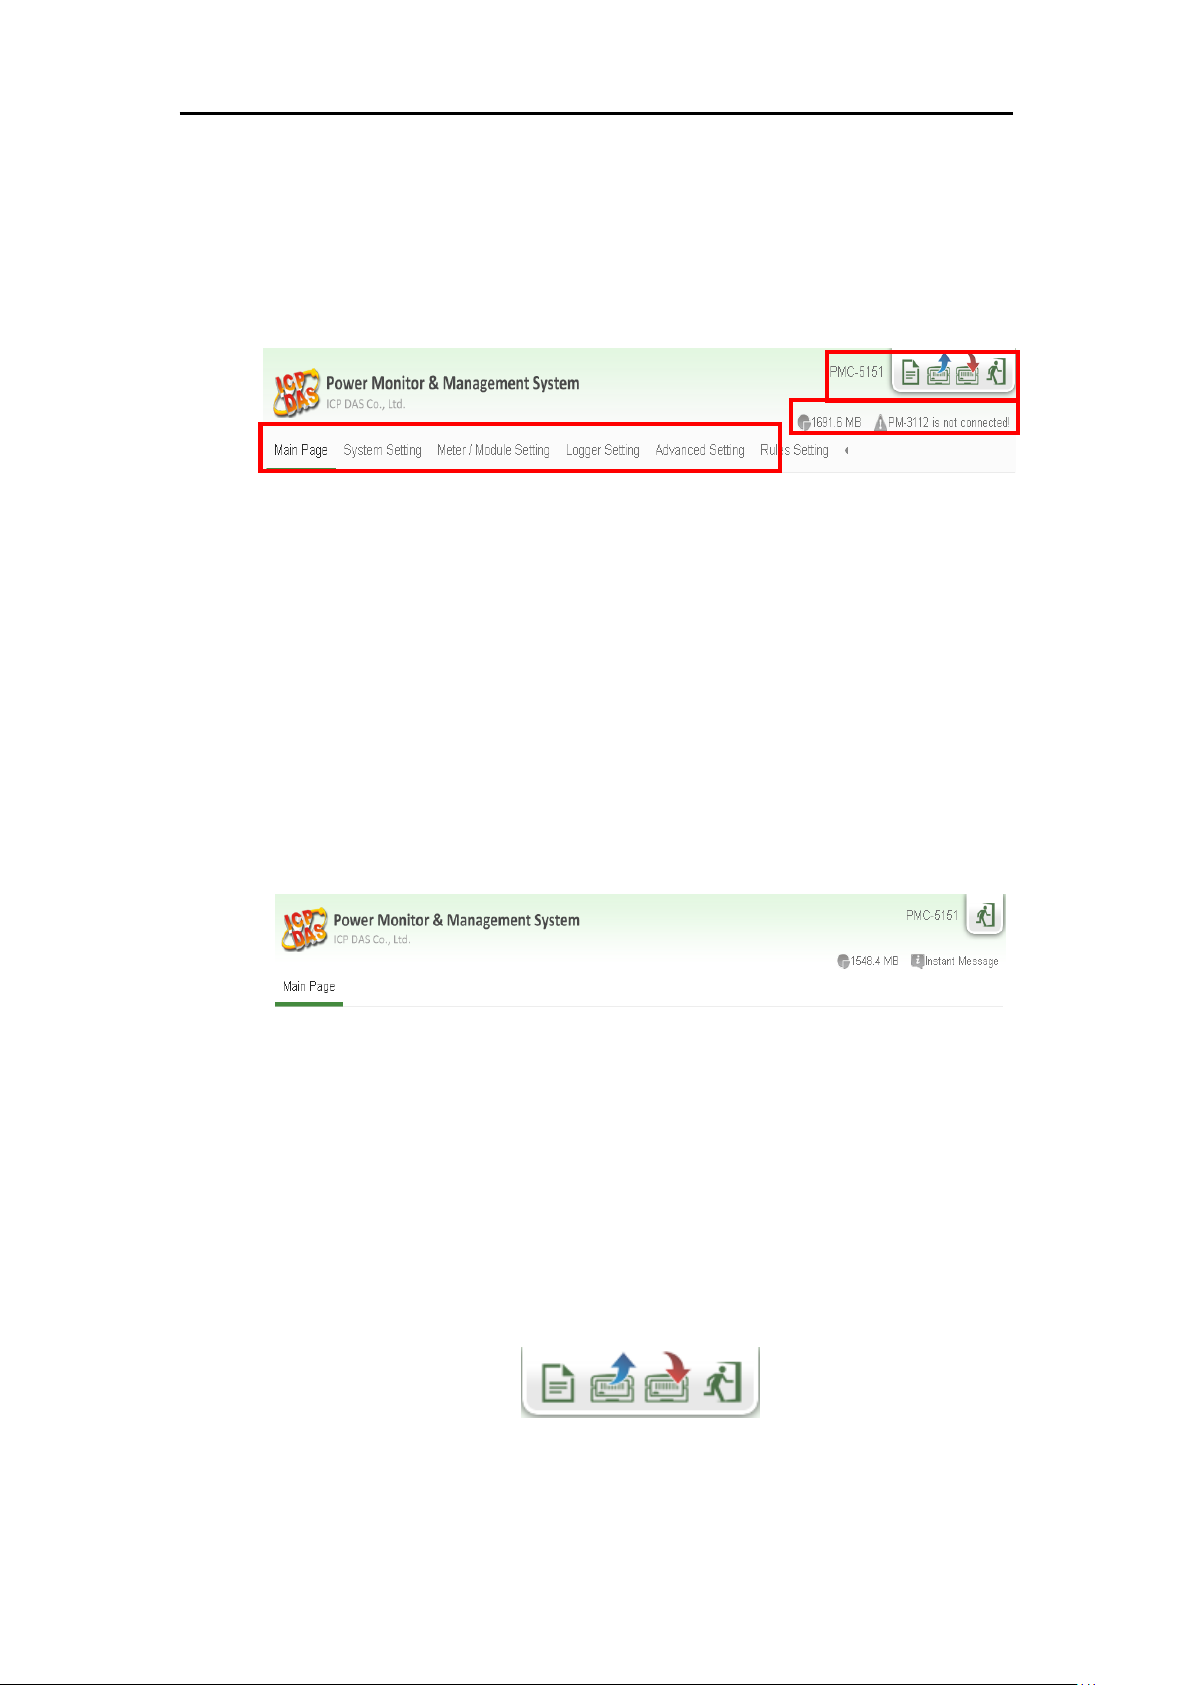
Figure4-2 : System Function Area (login as a Administrator)
System function area includes the following areas:
A1. Rules management toolbar
A2. Real-time information area
A3. System function toolbar
When login as a general user, the setting functions in Rules management
toolbar and System function toolbar will be locked, and only allows
viewing the power meter data, the I/O module data and Real-time system
information. The interface is shown as below:
Figure4-3 : System Function Area(login as a General user)
Each function in system function area is as the flowing:
4.1.1 Rules management toolbar
Rules management toolbar allows user to perform different functions.
When login into the system as the administrator, the rule management
toolbar will be shown as below:
Figure4-4 : Rules management toolbar (login as a Administrator)
Page 22
ICP DAS PMC/PMD Series User Manual
9
If login as a general user, the rule management toolbar will be shown
as below:
Figure4-5 : Rules management toolbar (login as a General user)
The functions of the Rules management toolbar are as follow:
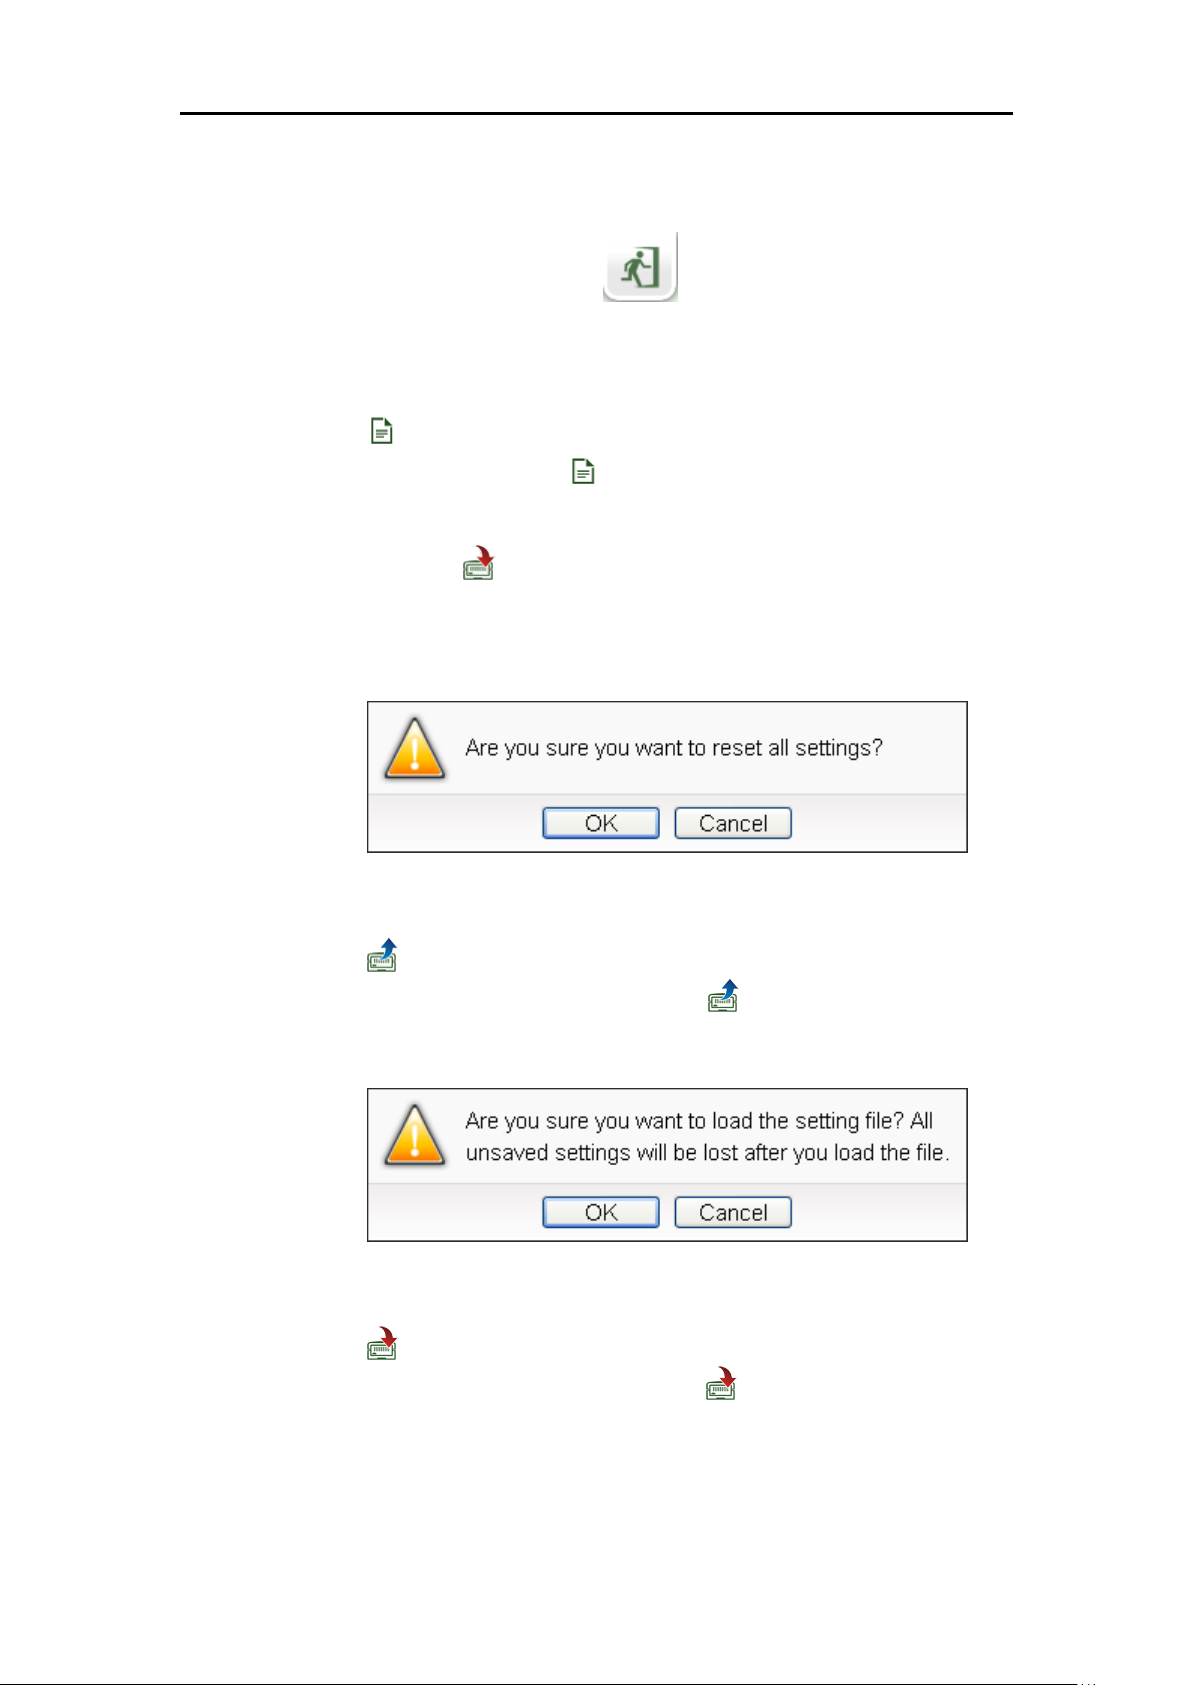
“New” button allows resetting the settings of all parameters
and Rules. Click on button and click on “OK”, the settings on
PMC/PMD webpage on the browser will be cleared. If the user
would like to clear the setting on PMC/PMD, then continue to
click on “Save” button to save the new settings (cleared
settings) to the PMC/PMD.
Please note: once the settings are cleared and save to the
PMC/PMD, the settings will be cleared permanently.
Figure4-6 : Confirm to clear settings
“Load” button allows to load all parameter settings and rule
settings on PMC/PMD. Click on button and click “OK” to
load all parameter settings and rules settings from PMC/PMD to
the web page for further edition.
Figure4-7 : Confirm to load settings
“Save” button allows to save all parameter settings and Rule
settings to PMC/PMD. Click on button and click “OK” to
save all parameter settings and Rule settings from the web page of
PMC/PMD to the PMC/PMD.
Page 23
ICP DAS PMC/PMD Series User Manual
10
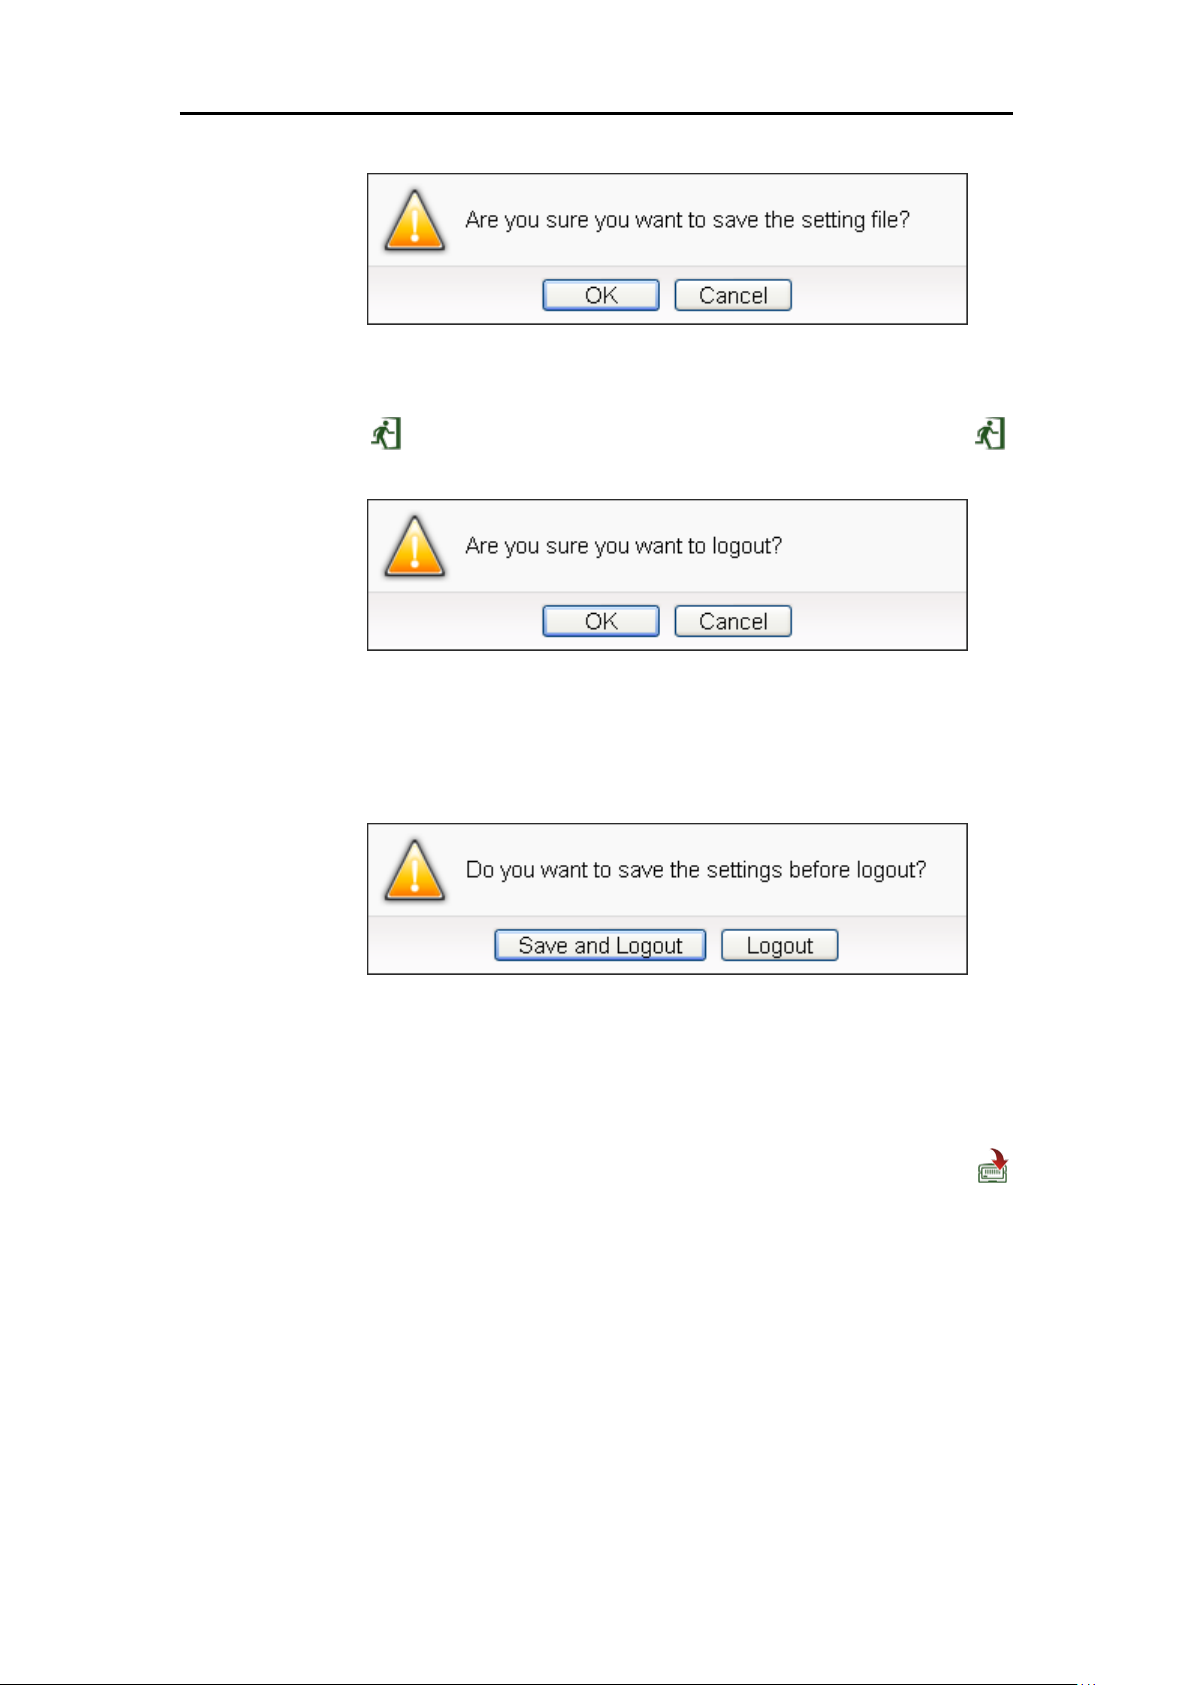
“Logout” button allows to log out the system, click on
button and click “OK” to logout the system.
Figure4-8 : Confirm to save settings
Figure4-9 : Confirm to logout (The settings are saved)
If the settings are not saved to the PMC/PMD before performing
logout, a warming message will appear as below:
Figure4-10 : Confirm to logout (The settings are not saved)
Please note:
1. All the edited settings on the webpage have to be saved to
PMC/PMD to make all settings take effect; before click on
button, the settings will only be saved on the Web page site, not in
the PMC/PMD.
2. Please DO NOT logout or close the web page during the process
of the edition, otherwise all pre-set settings on the page will be
disappeared.
In addition, on the left side of the Rules management toolbar, the user
could give a nickname for this PMC/PMD in the nickname field for
easy recognition.
Page 24
ICP DAS PMC/PMD Series User Manual
11
4.1.2 Real-time information area
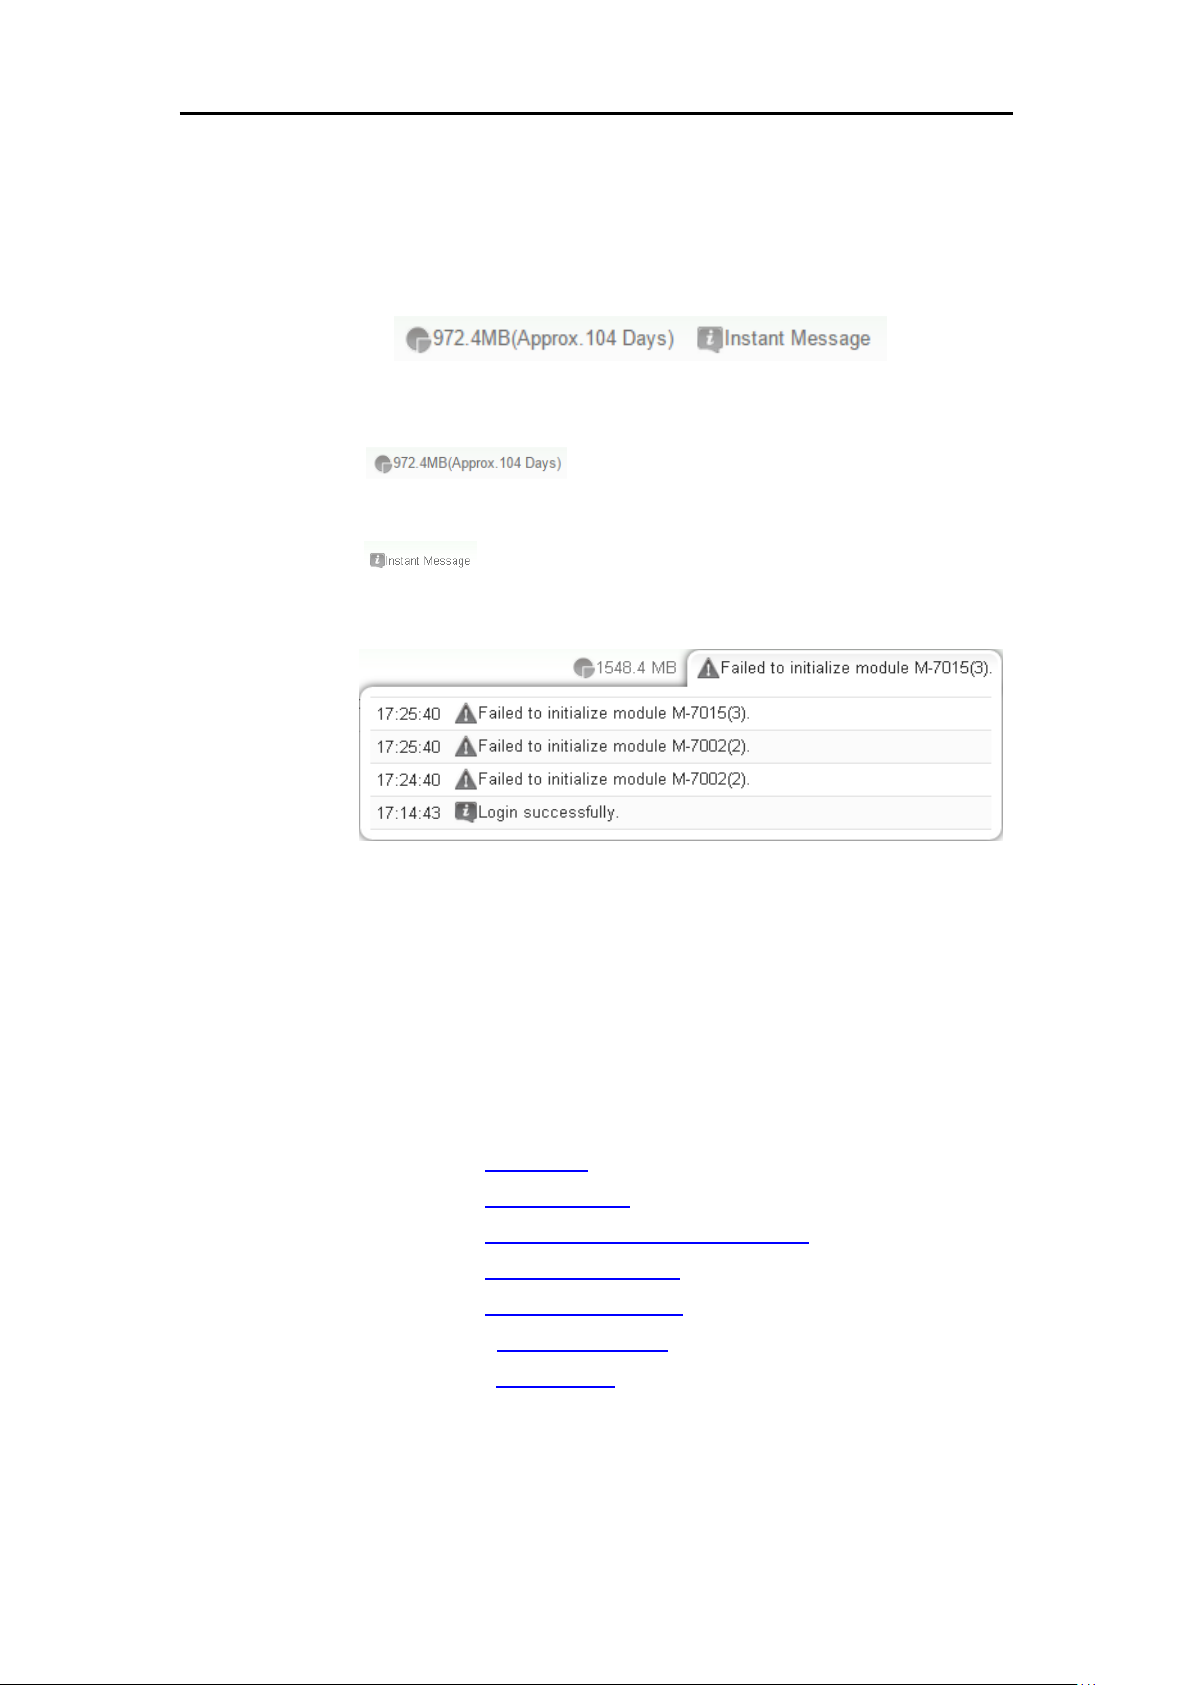
Real-time information area allows display of current free space and
approximate number of days available to save of the microSD card of
the PMC/PMD and the real-time system information, shown as below:
Allows display of the current free space and
approxmiate number of days available to save of the micro SD
card in PMC/PMD.
Allows display of real-time system information, click
on “Instant Message”to open up the list of real-time information,
maximum 10 information will be kept on the list.
Figure4-11 : Real-time information area
Figure4-12 : Real-time information list
4.1.3 System function toolbar
According to the level of login permission, the System function toolbar
will be different. If login as an administrator, all parameter settings and
data review function will be enabled; more detailed information of the
functions will be give in the following sections.
The System function toolbar includes the following function options:
Chapter 5: Main Page
Chapter 6: System Setting
Chapter 7: Power Meter/ I/O Module Setting
Chapter 8: Data Logger Setting
Chapter 9: IoT Platform Setting
Chapter 10: Advanced Setting
Chapter 11: Rule Setting
If login as a general user, they are allowed to view real-time
information on Main Page only; they also do not have the permission
to edit the settings of the parameters and the rules.
Page 25
ICP DAS PMC/PMD Series User Manual
12
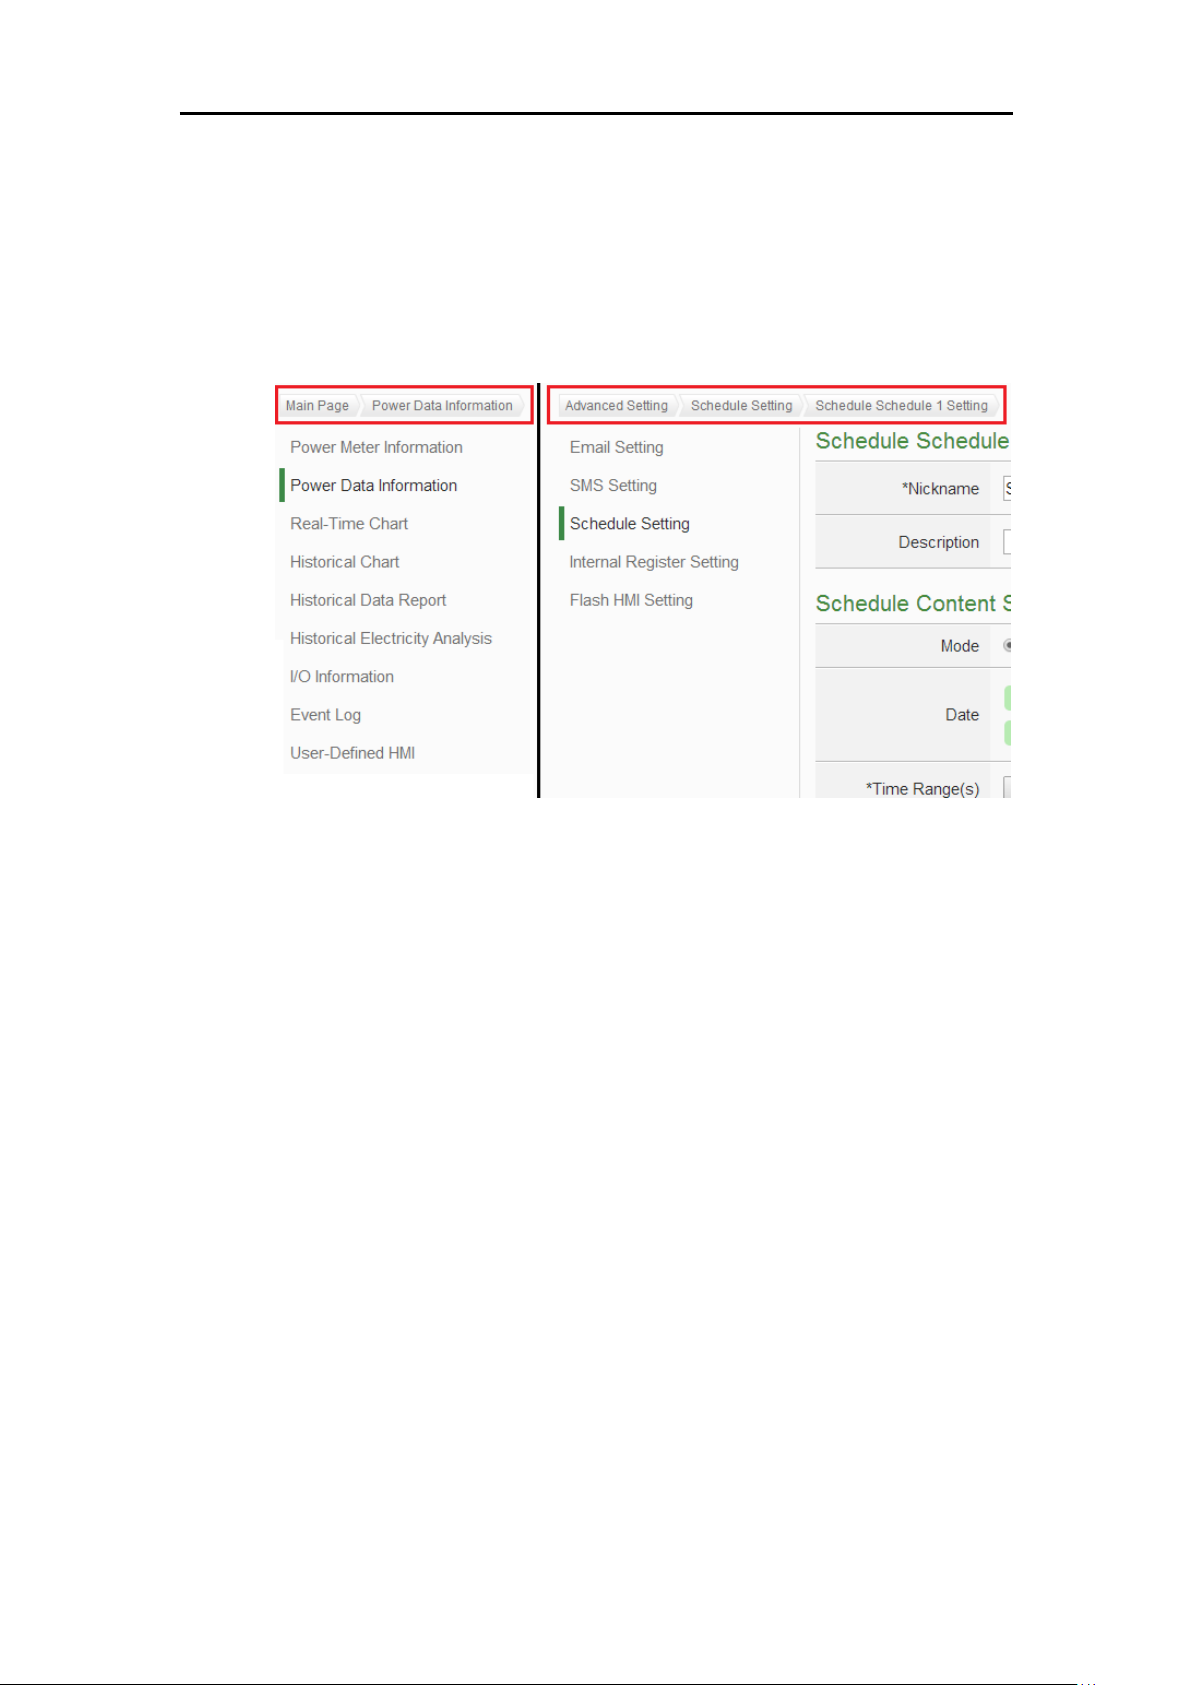
4.2 Sub-function area
Sub-function area will display detailed functions under the selected System
function. The user could edit or review detailed function options in the
Sub-function area. On the upper Sub-function area, the path of current
function will be displayed to show the current function path.
4.3 Data review/System setting area
Data review/System setting area allows to set system parameters and data
review of PMC/PMD, the content of this area will be varied according to
the sub-function selected. When the user login into the page, the Data
review/System setting Area of the Main Page will be Power Data overview
page, it will display all power information of the power meters that are
connected to the PMC/PMD, shown as below:
Figure4-13 : Current function path
Page 26
ICP DAS PMC/PMD Series User Manual
13
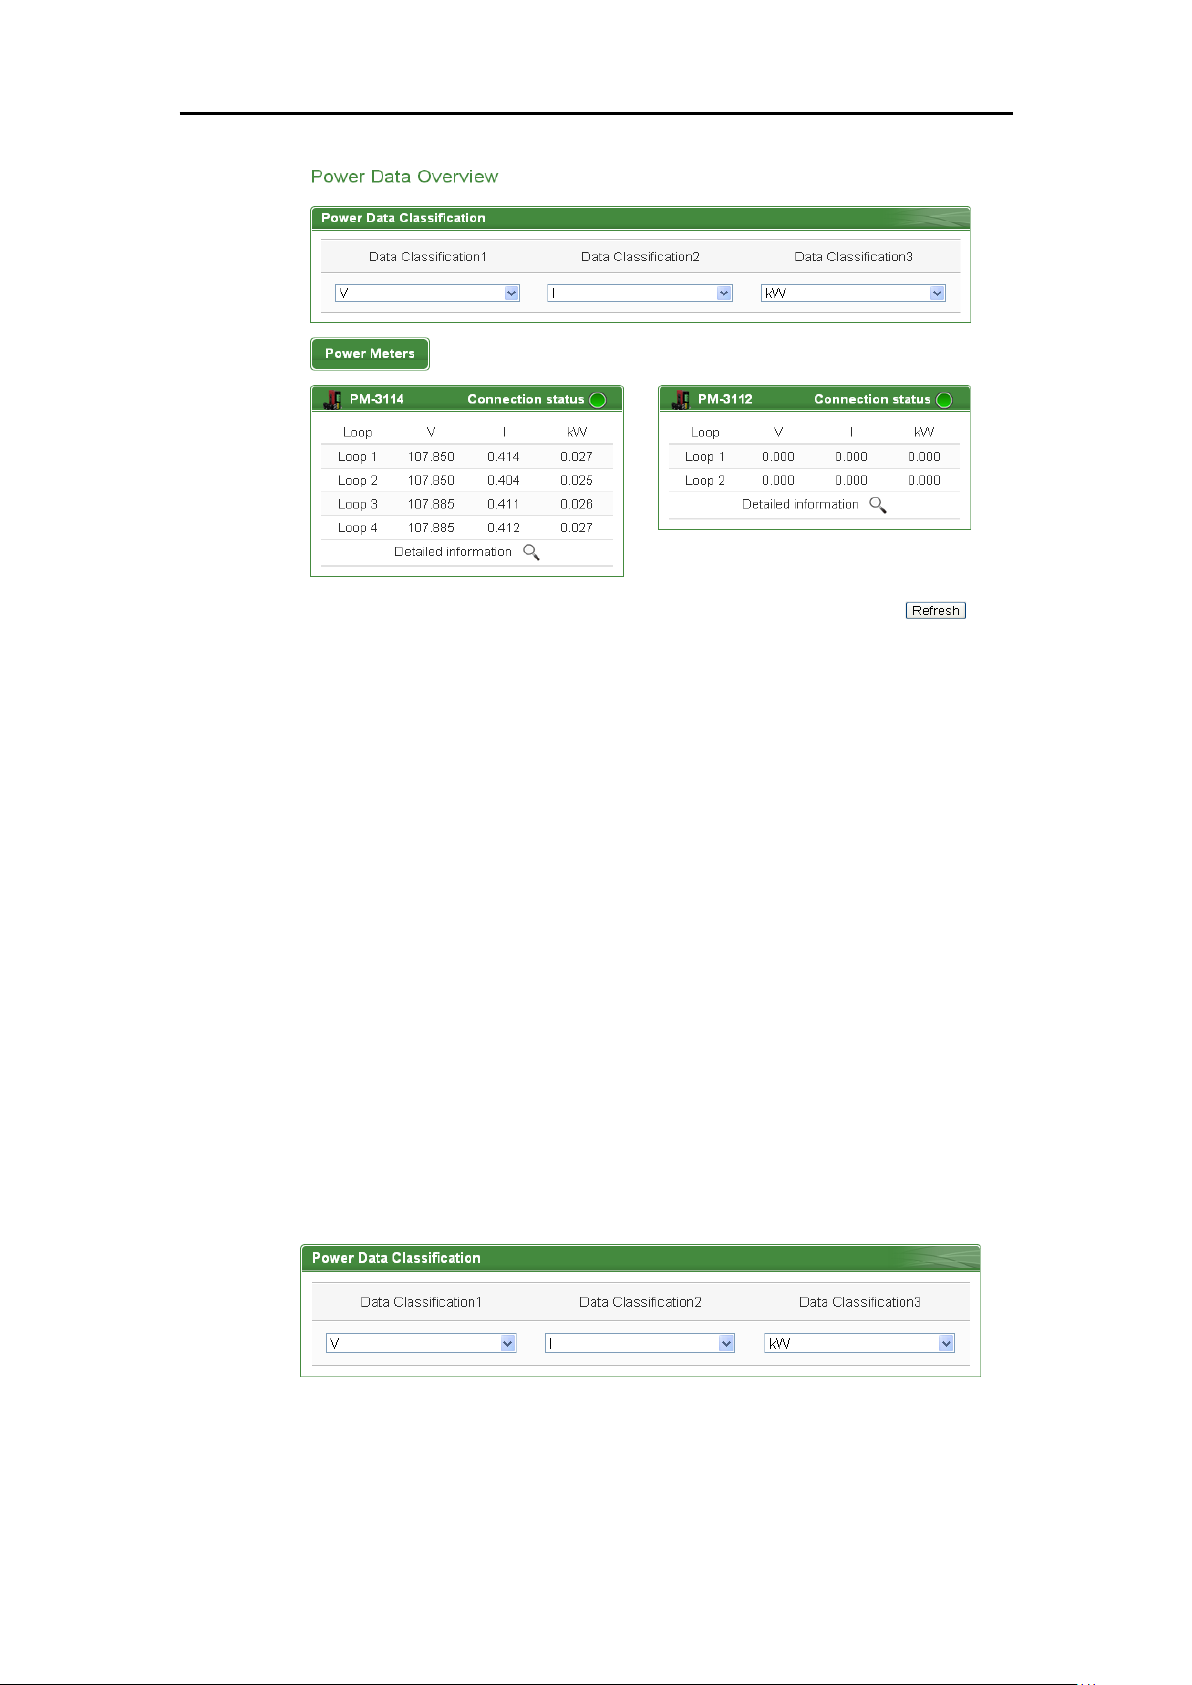
Figure4-14 : Power data Overview page
Power data overview page display the power data of the power meters that
connected to the PMC/PMD. Depend on the requirement to select the
desired classification of the power data to display the desired power data.
The page refreshes every 20 sec, the user could also click “Refresh” button
to refresh the data immediately.
The power data classification includes the following options:
V(Voltage), I(Current), kW(Real Power), kvar (Reactive Power), kVA
(Apparent Power), PF (Power Factor), kWh, kvarh, kVAh, Daily
Accumulated Electricity, Monthly Accumulated Electricity, Yearly
Accumulated Electricity, Daily Carbon Emissions, Monthly Carbon
Emissions, Yearly Carbon Emissions, Hourly Maximum Demand, Daily
Maximum Demand, Monthly Maximum Demand, Actual Demand and
Forecast Demand. The displayed power data will be varied according to the
selected power data classification.
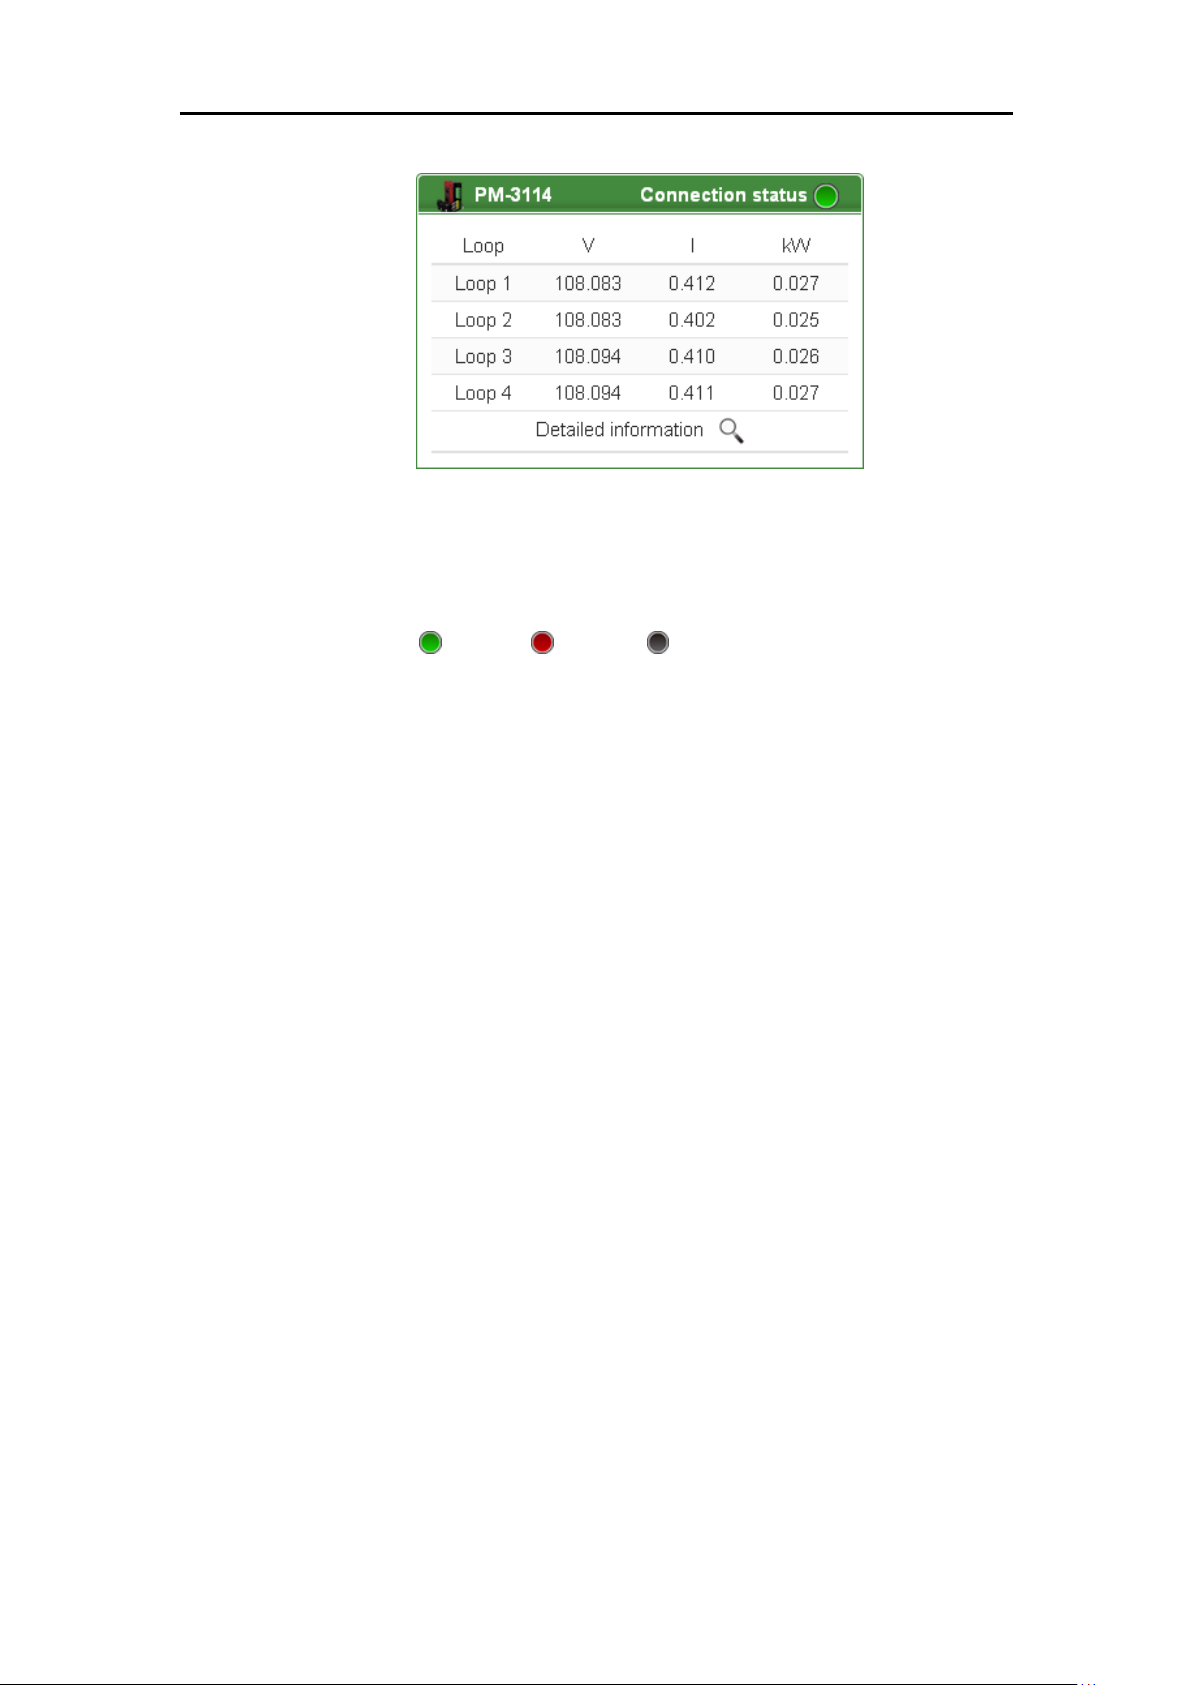
Figure4-15 : Select the classification of Power data
Page 27
ICP DAS PMC/PMD Series User Manual
14
Figure4-16 : Display power data of the selected classification
“Connection Status” will reveal the connection status between the
power meter and PMC/PMD, the graphic indicators are as follow:
: Online : Offline : Connecting
Page 28
ICP DAS PMC/PMD Series User Manual
15
5 Main Page
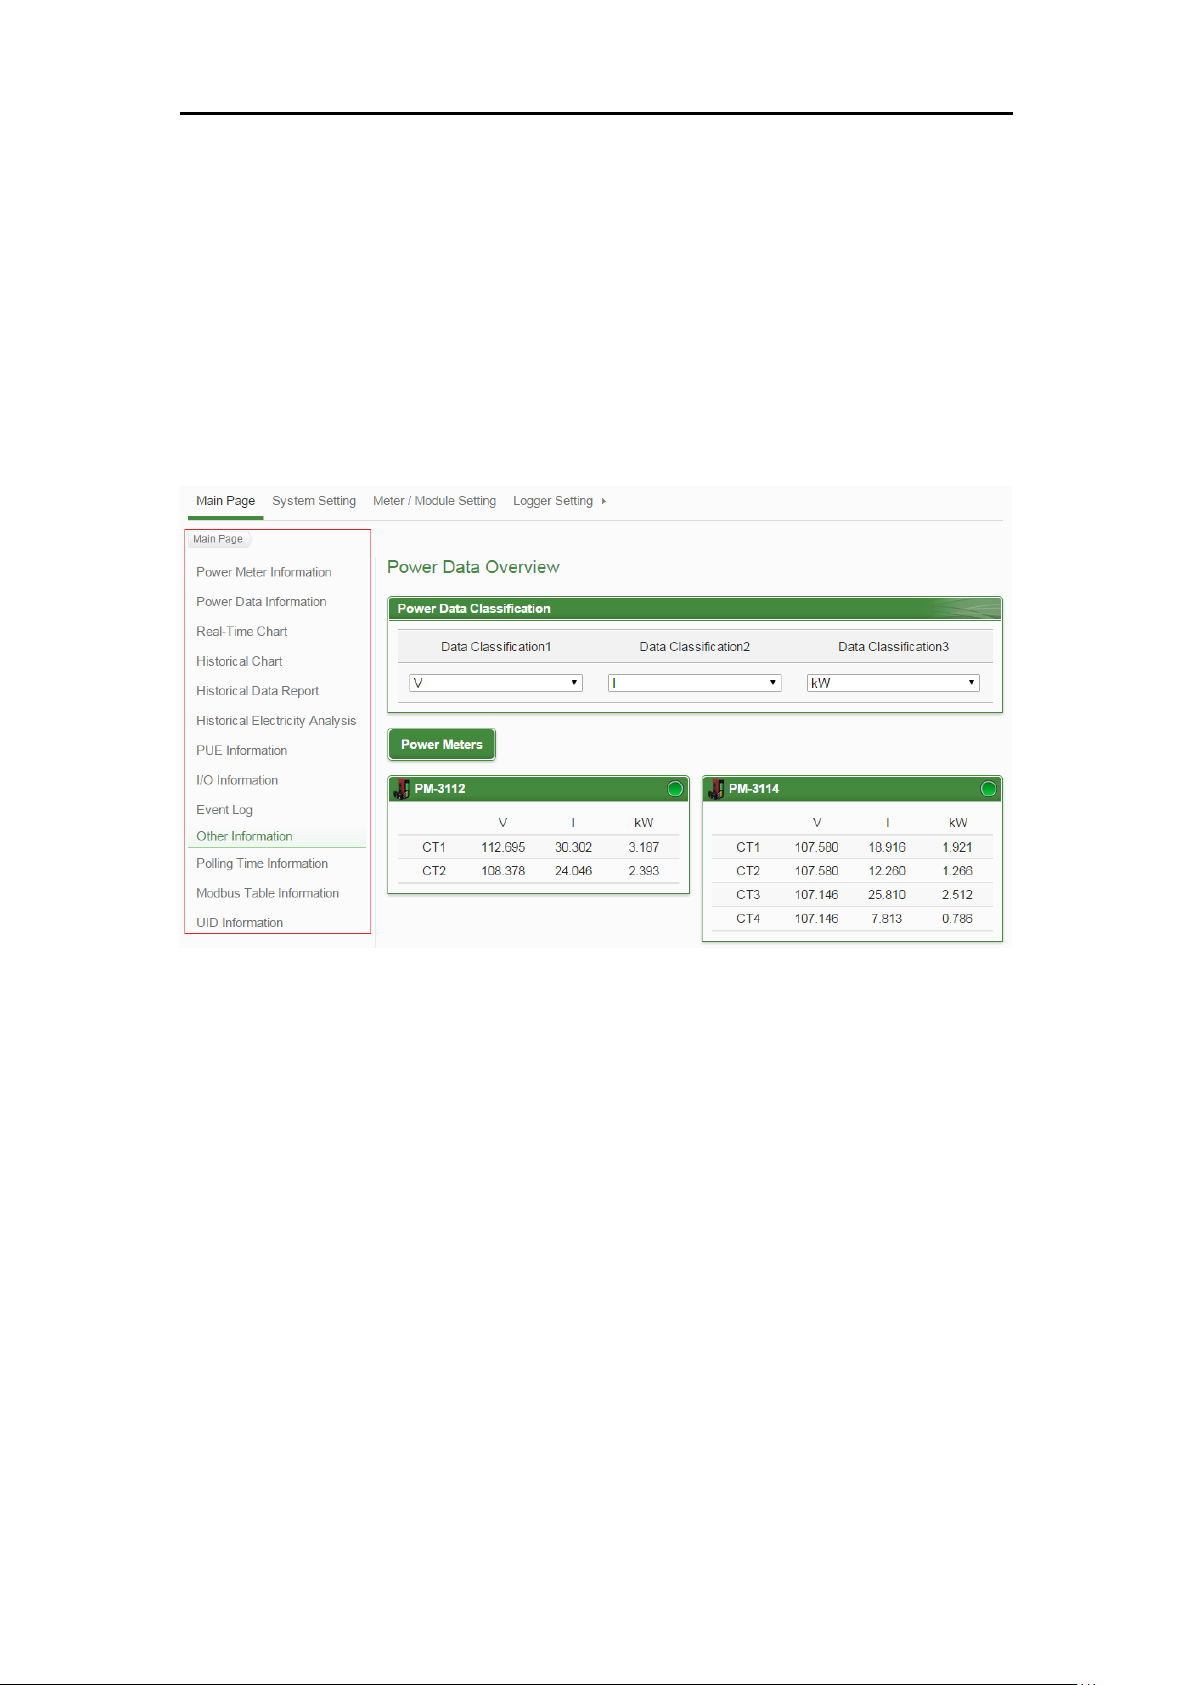
On the Main Page, 10 information display options are as follow: Power Meter
Information, Power Data Information, Realtime Chart, Historical Chart, Historical
Data Report, Historical Electricity Analysis, PUE Information, I/O Information, Event
Log, Polling Time Information, Modbus Table Information and UID information,
shown as follow:
5.1 Power Meter Information
Power Meter Information page displays detailed power data information
including: Power Meter Information Overview and Power Meter Statistics
Information Overview.
5.1.1 Power Meter Information Overview
After getting into this page, the system will display real-time power
information of the selected power meter. To display desired power
meter data information, select the power meter from the dropdown list
of the “Power Meter List”. The page refreshes every 20 seconds, the
user could also click “Refresh” button to refresh the data immediately.
Power Meter Information Overview includes the following sections:
Figure5-1 : Information display options on Main Page
Page 29
ICP DAS PMC/PMD Series User Manual
16
Power Meter Attribute
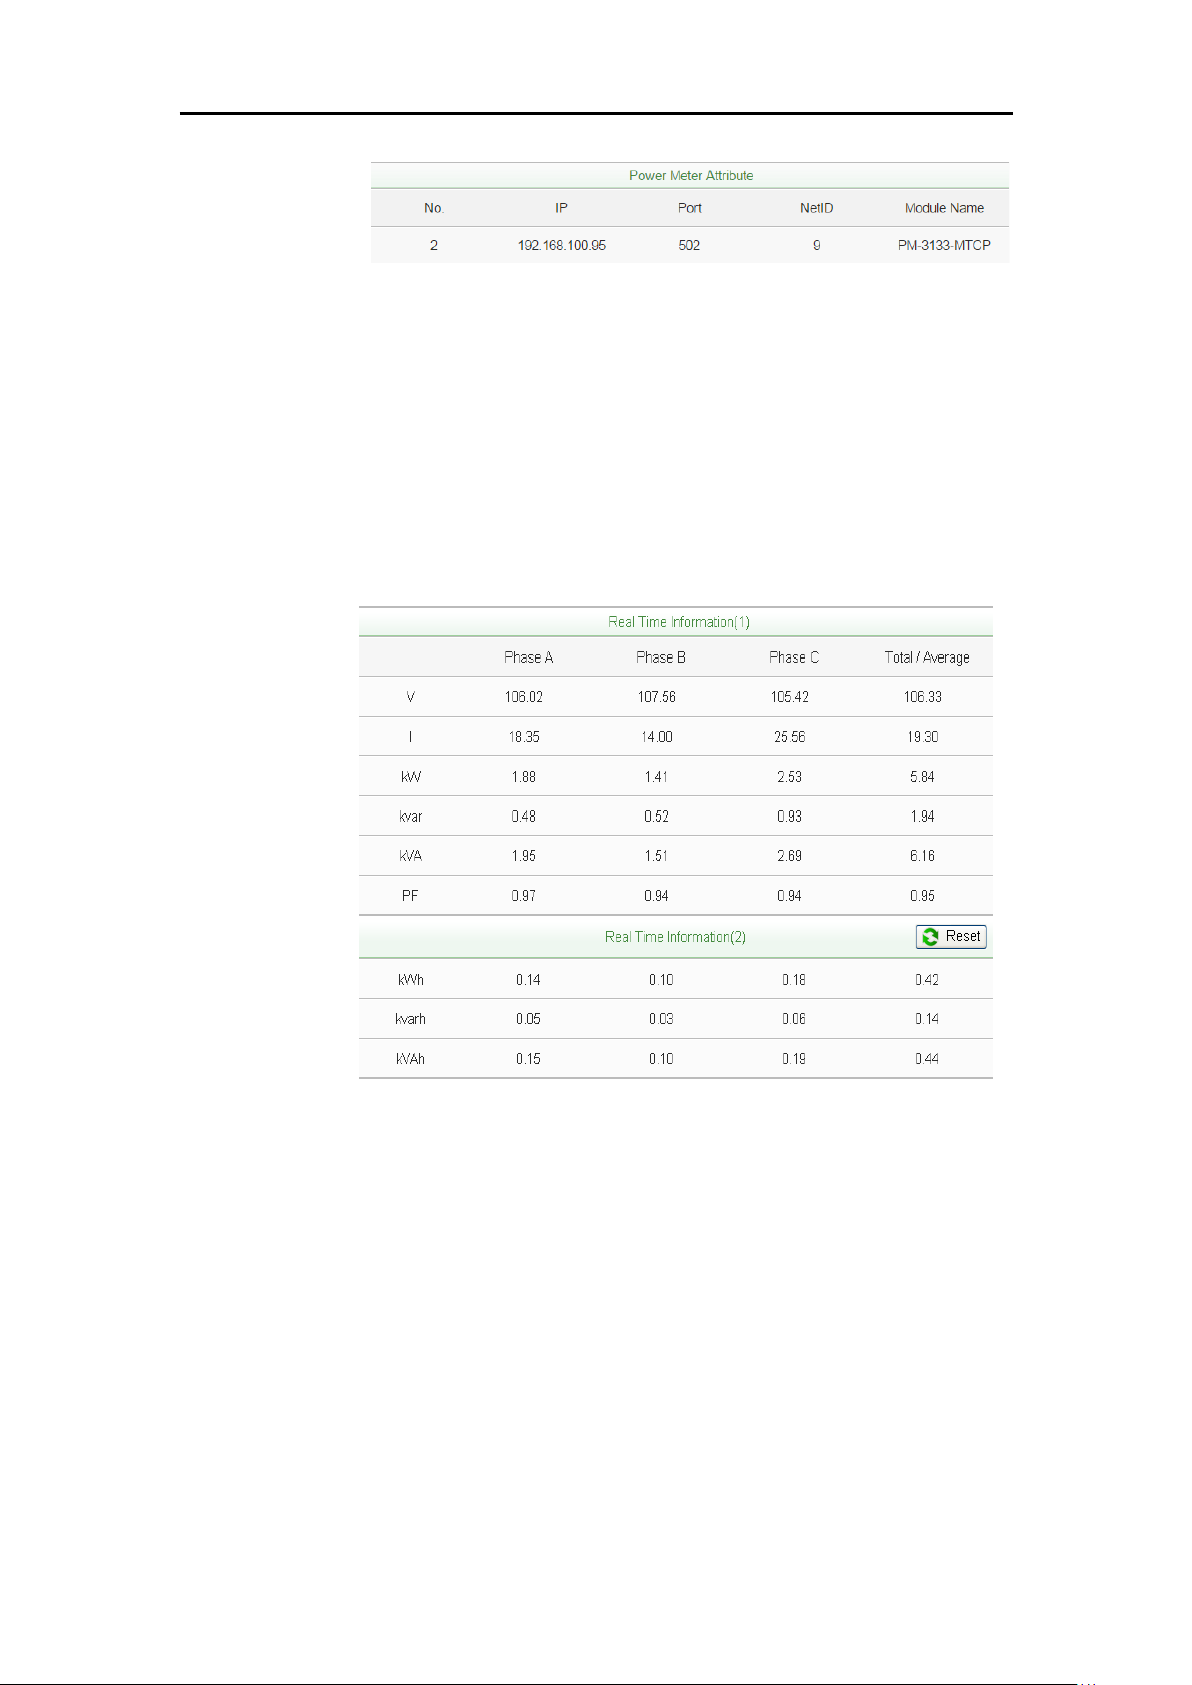
The Power Meter Attribute section will display different information
according to different power meters and the ways they are connected
to the PMC/PMD. Currently PMC/PMD supports connecting to
power meter via Modbus RTU (Figure 5-3) or Modbus TCP(Figure
5-4). If the power meter is connected via Modbus RTU, it will
display the Power Meter Number (No.), Com Port, Address, Module
Name. If the power meter is connected via Modbus TCP, it will
display the Power Meter Number (No.), IP, Port, NetID, Module
Name.
Figure5-2 : Power Meter Information Overview
Figure5-3 : The attribute of PM-3133 Power Meter
Page 30
ICP DAS PMC/PMD Series User Manual
17
Figure5-4 : The attribute of PM-3133-MTCP Power Meter
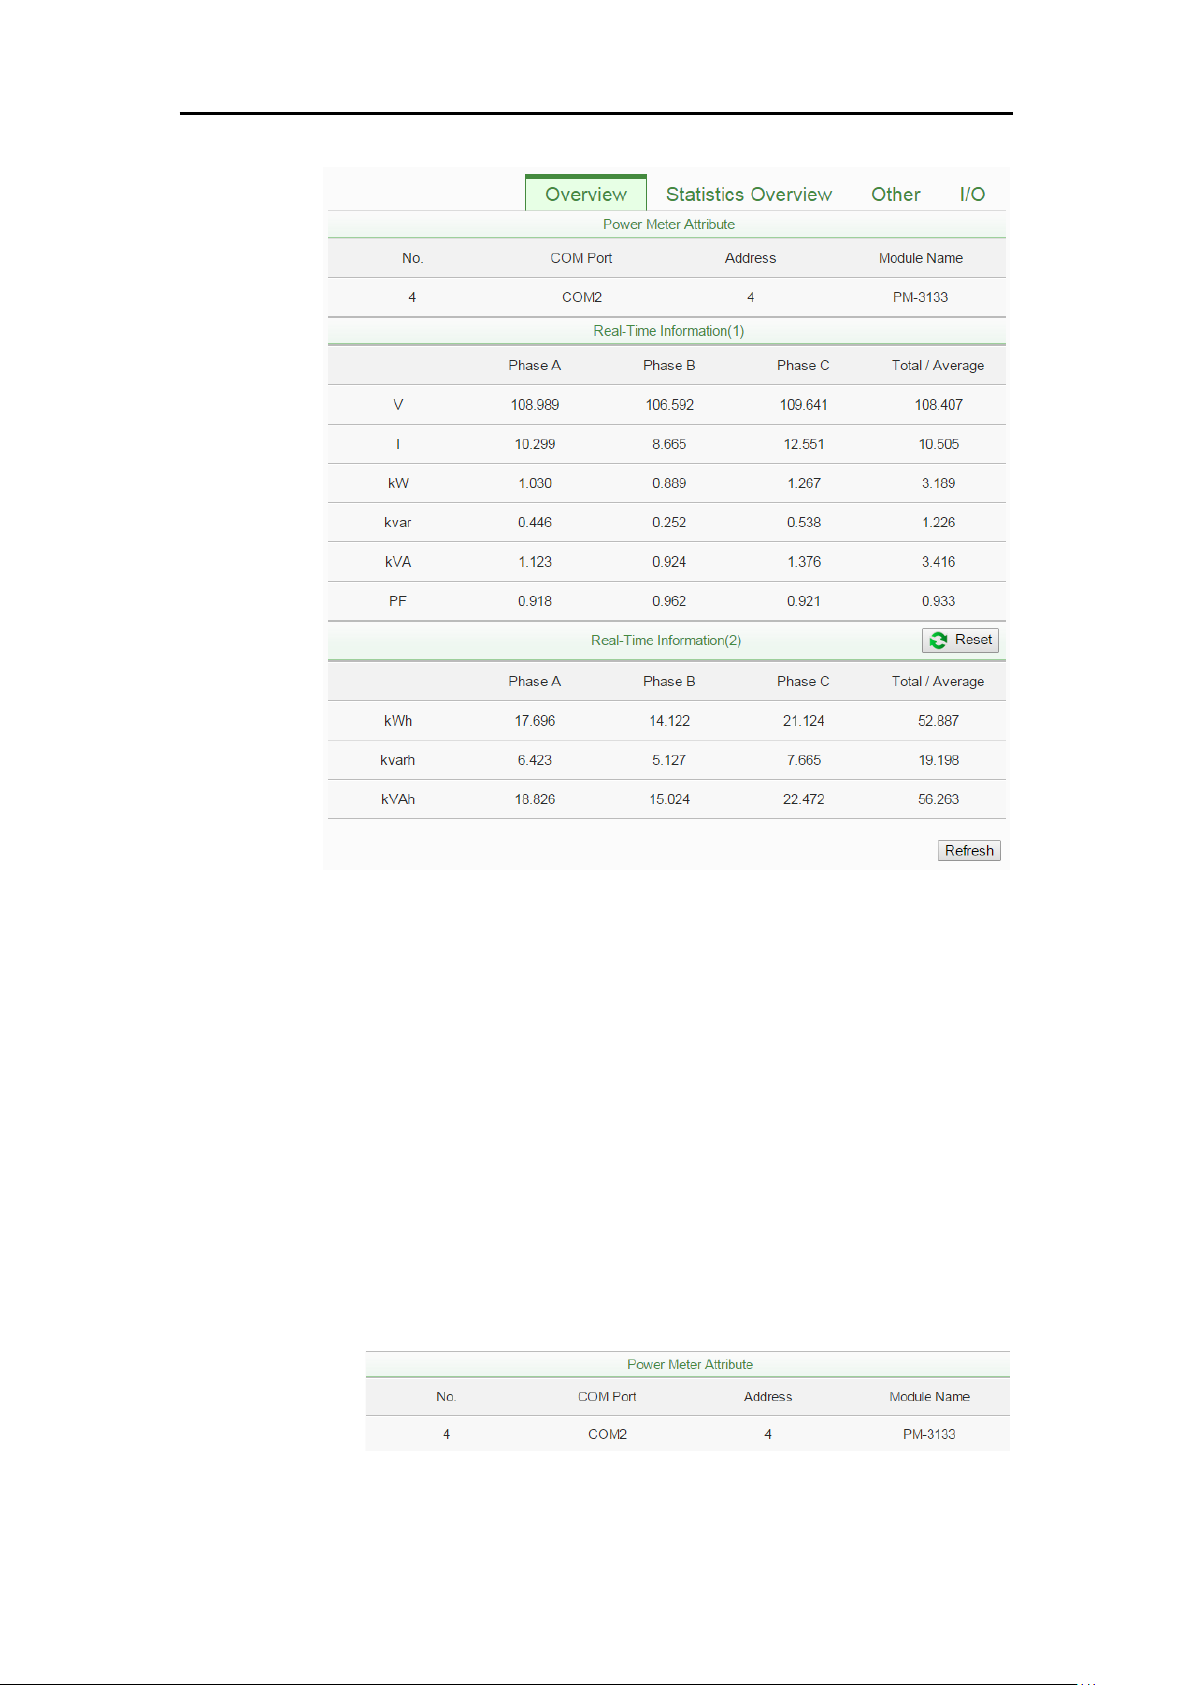
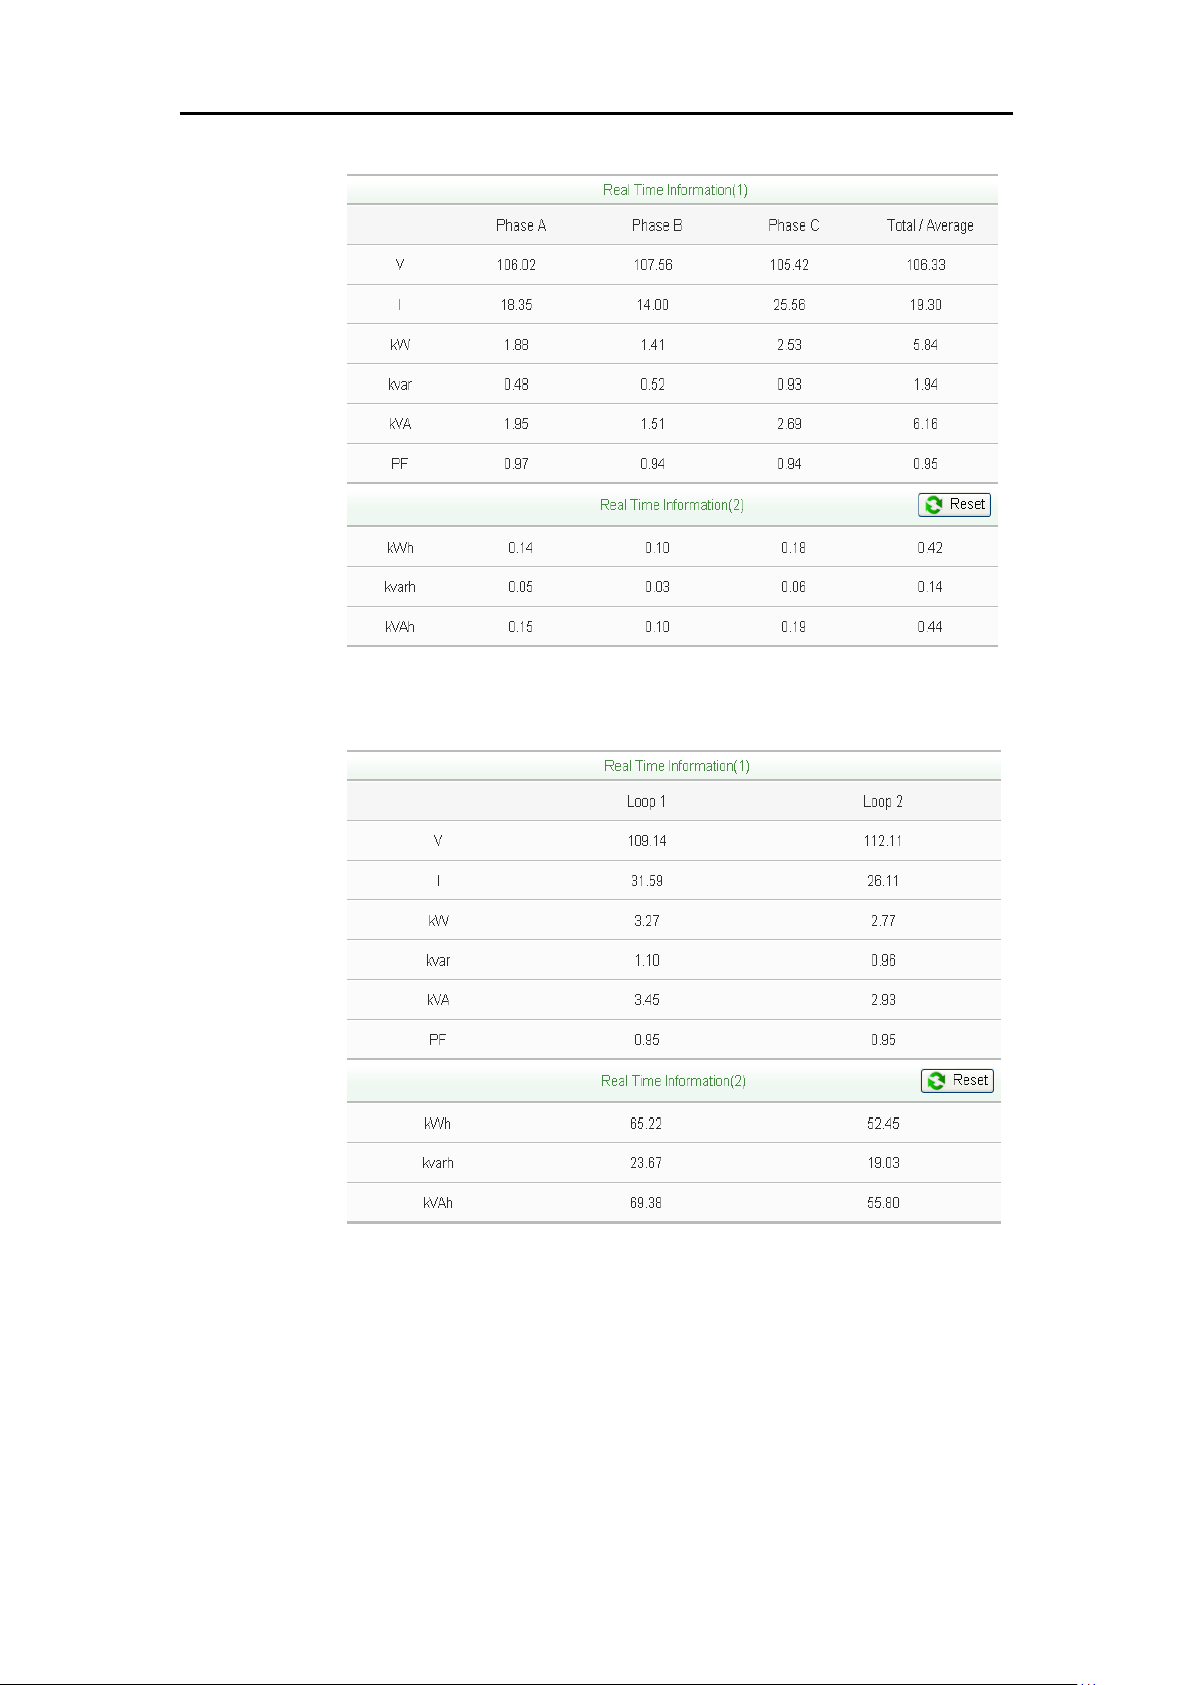
Real Time Power Information
In this section, it provides real time power data information of the
selected Power Meter. For 3 phase power meter, it will display real
time information of Phase A, Phase B and Phase C(Figure 5-5).For
single phase power meter, it will display real time information of
Loop 1, Loop2, Loop3, and Loop4(Figure 5-6). For PM-3112 will
display real time information of Loop 1 and Loop2 (Figure 5-7).
Figure5-5 : Real Time Power Information of PM-3133
Page 31
ICP DAS PMC/PMD Series User Manual
18
Figure5-6 : Real Time Power Information of PM-3114
Figure5-7 : Real Time Power Information of PM-3112
Reset Accumulated Value of the Power Meter
When login as the Administrator, it allows to click on “Reset” to
reset the value of kWh, kvarh, and kVAh to be 0 if required.
Please Note: After performing the reset function to reset the value of
the kWh, kvarh, and kVAh of the selected power meter, the resetting
operation is irreversible.
Page 32
ICP DAS PMC/PMD Series User Manual
19
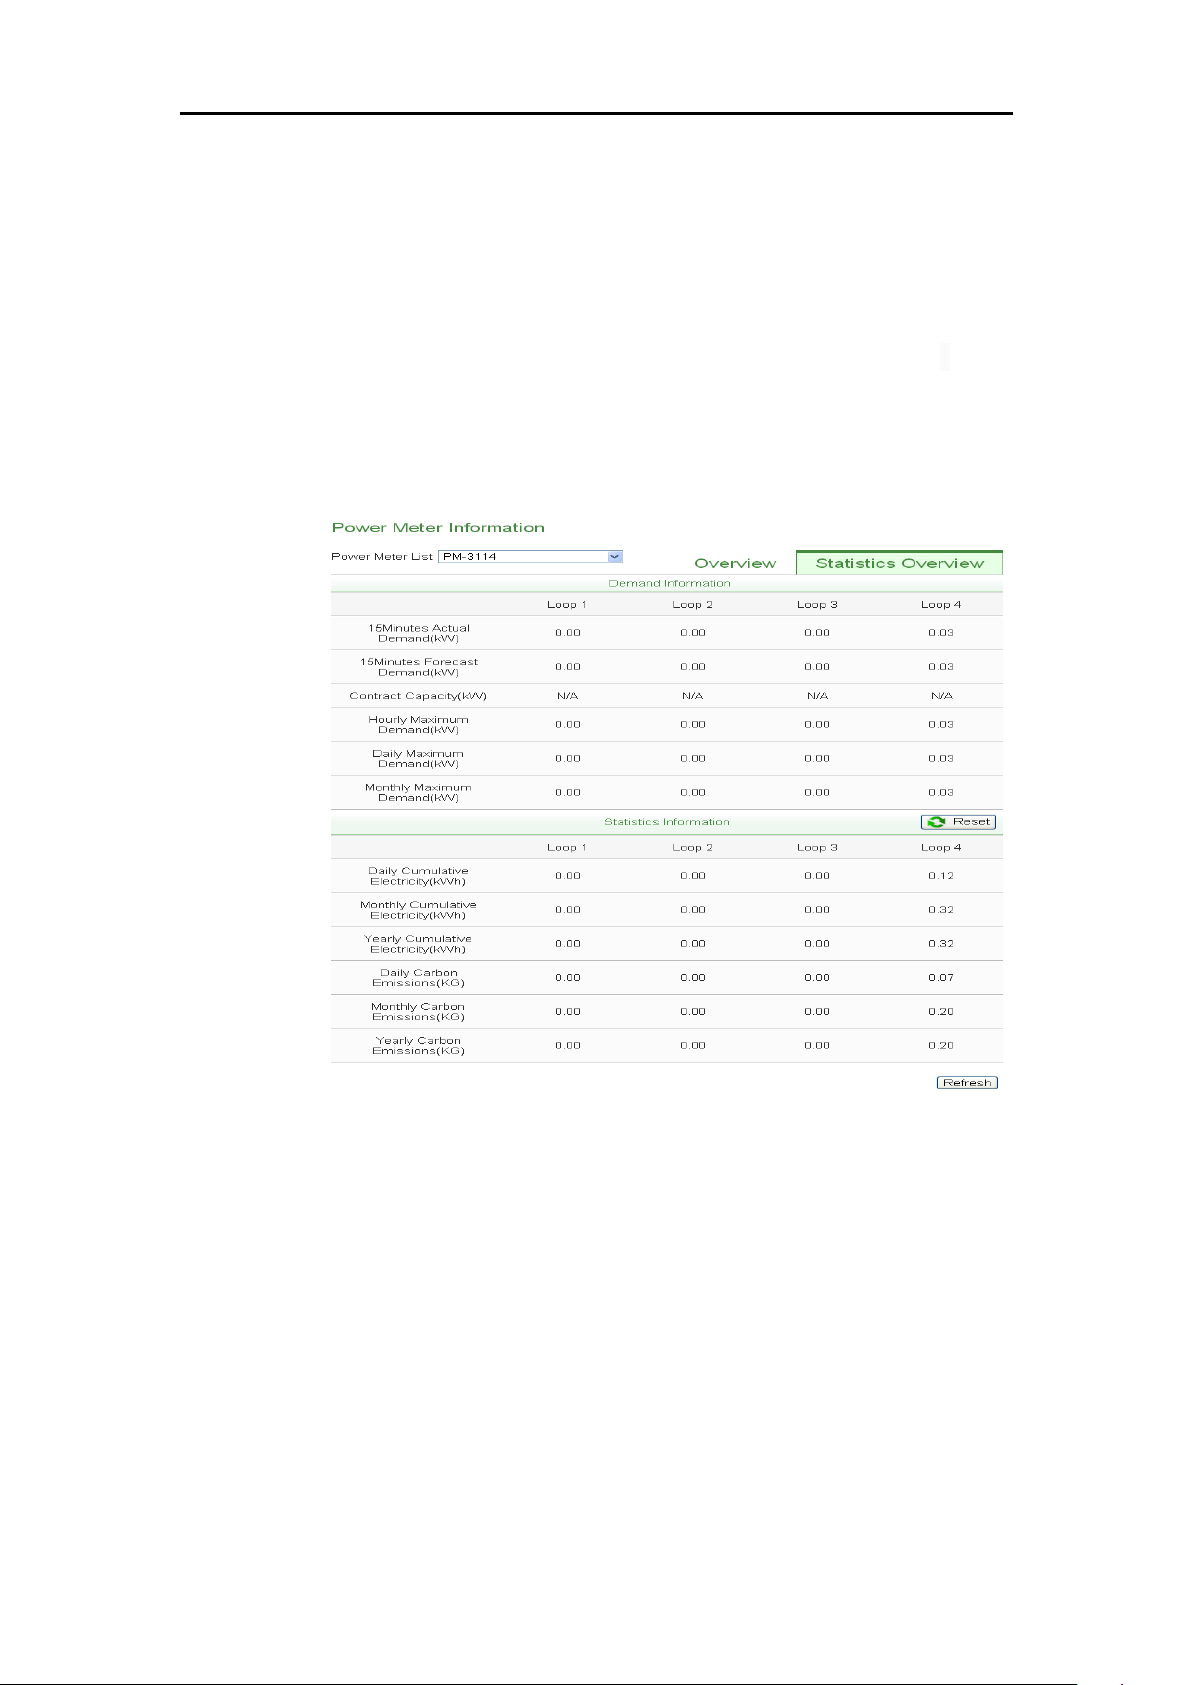
5.1.2 Power Meter Statistics Information Overview
On the Power Meter Statistics Information Overview page, the
Demand Information section will display the Actual Demand, Forecast
Demand, Contract Capacity, Hourly Maximum Demand, Daily
Maximum Demand and Monthly Maximum Demand, etc. In the
Statistics Information section, the Daily/Monthly/Yearly Accumulated
Electricity and Daily/Monthly/Yearly Carbon Emissions for each loop
will be displayed.
Figure5-8 : Power Meter Statistics Information
Reset Power Meter Statistics information
When login as an administrator; the user could click on “Reset”
button to set the values such as: Daily/Monthly/Yearly Accumulated
Electricity and Daily/Monthly/Yearly Carbon Emissions to default
values if required.
Page 33
ICP DAS PMC/PMD Series User Manual
20
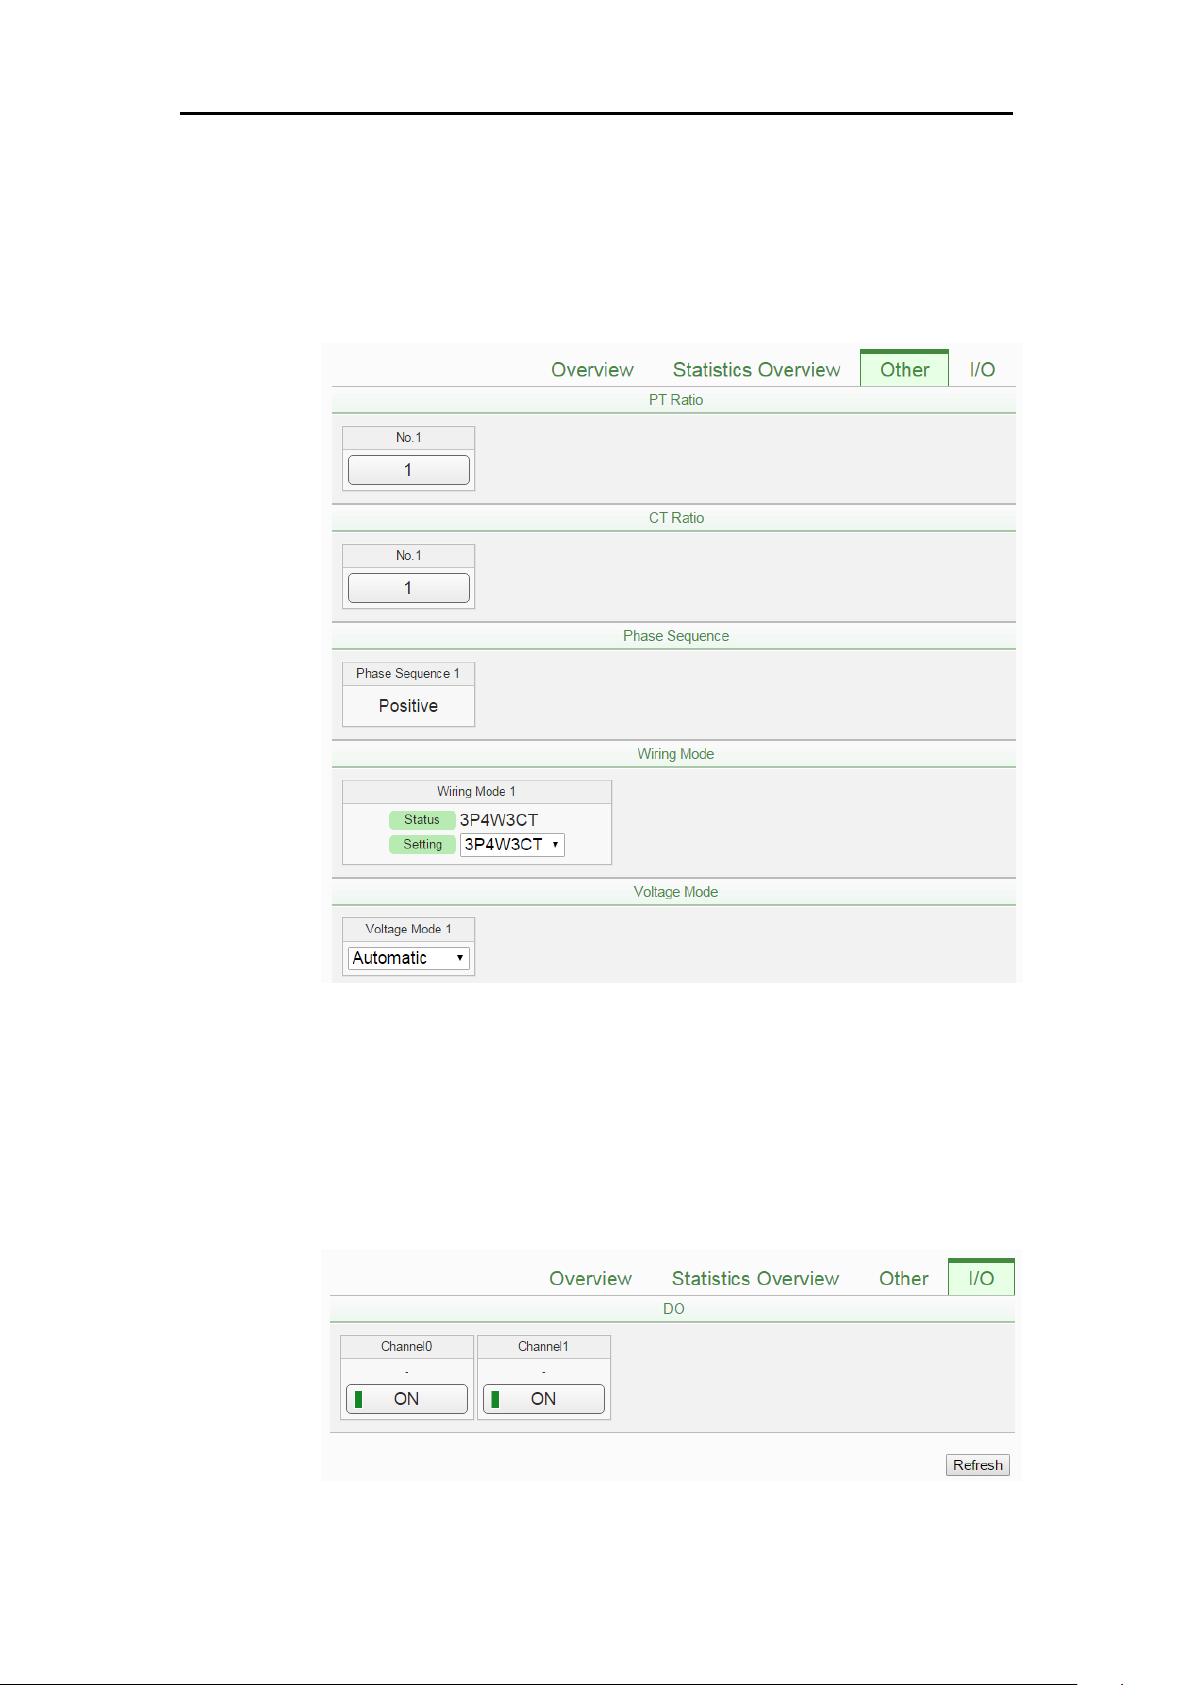
5.1.3 Other Information
In the "Other" information page, users can view or setup the PT
Ratio、CT Ratio、Phase Sequence、Wiring Mode、Voltage Mode and
other specific parameters of the power meter.
Figure5-9 : Power Meter Other Information Page
5.1.4 I/O Information
In the "I/O" information page, the I/O status of the power meter will be
listed. When login as the Administrator, it allows click on “Status” to
perform output operations. When login as a general user, it only allows
to view I/O status, the output operation is not allowed.
Figure5-10 : Power Meter I/O Information Page
Page 34
ICP DAS PMC/PMD Series User Manual
21
5.2 Power Data Information
Power data information can be displayed in two modes (Overview and
Group Overview), user can change the viewing mode according to the
requirements; more detailed information will be introduced in the following
sections.
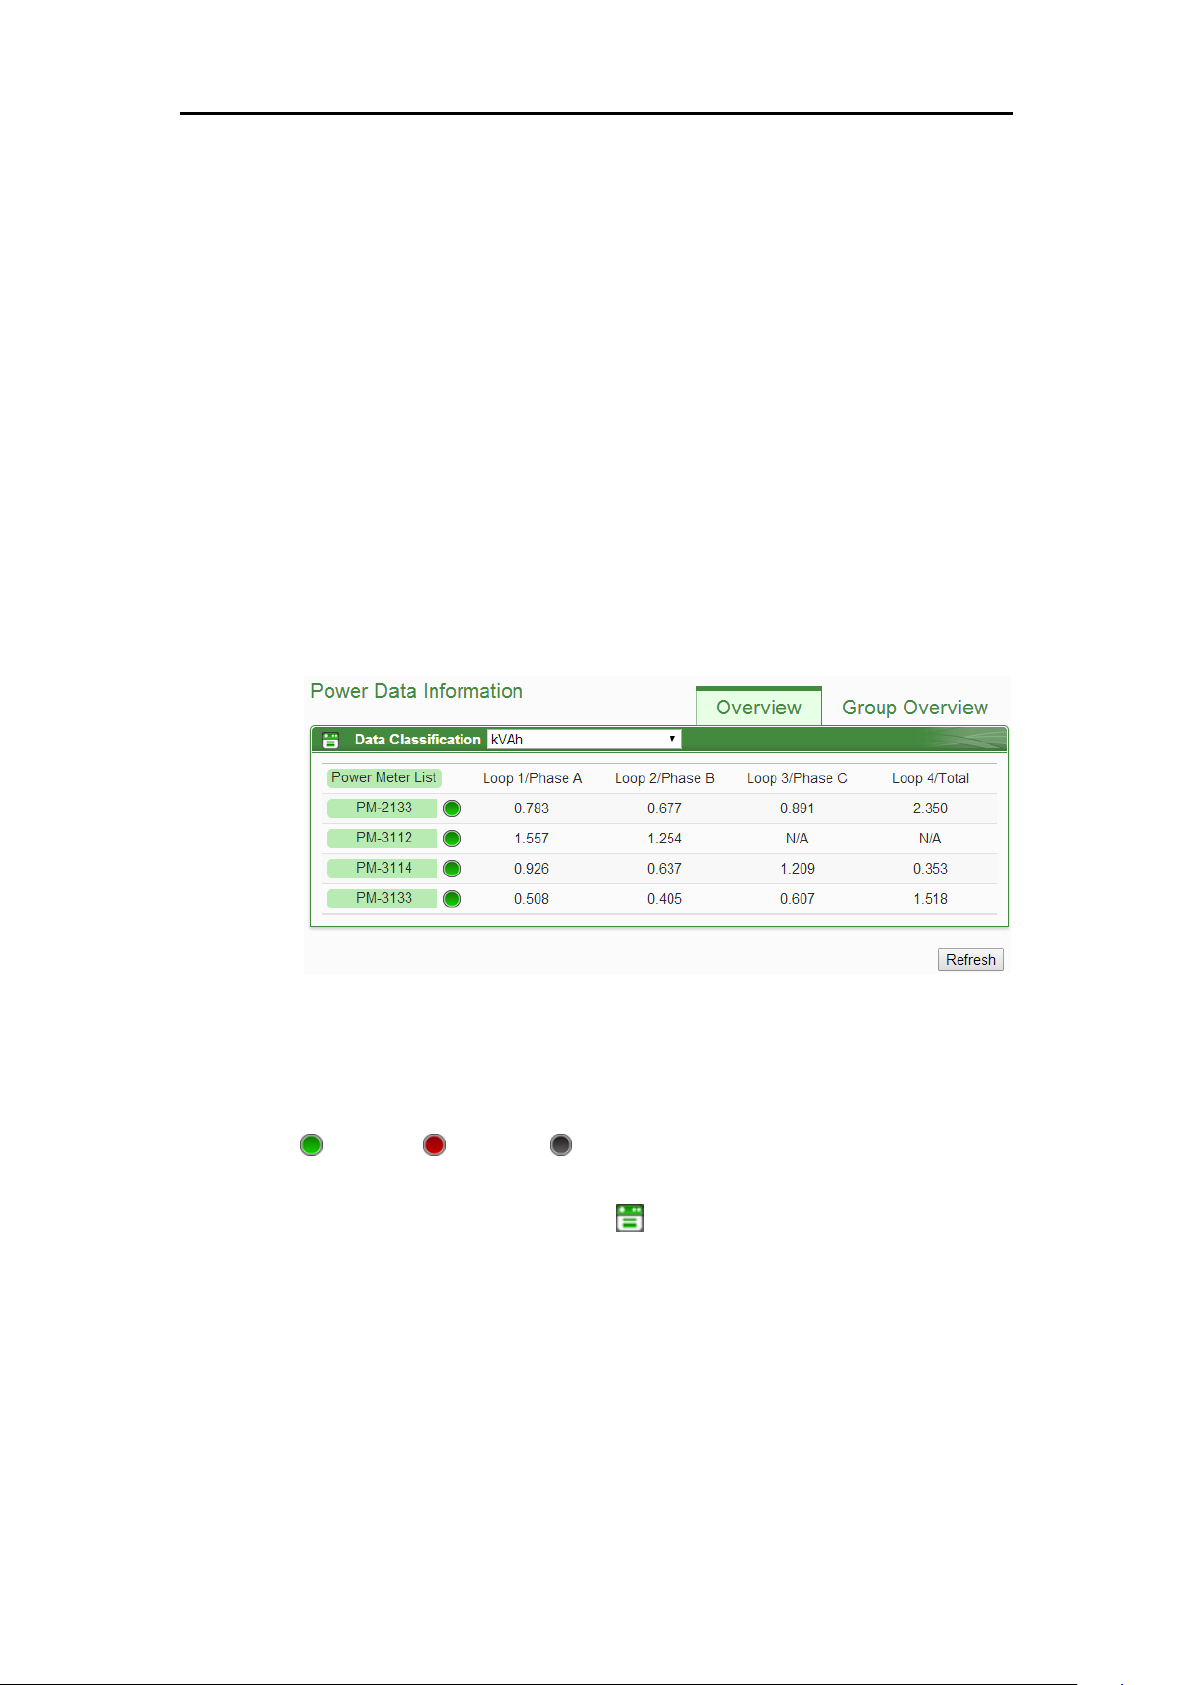
5.2.1 Overview
Power Data Information overview mode allows display of power data of
different power meters at the same time. Select the classification from
the dropdown list of the Data Classification field; it will list the
requested data from various power meters for easy comparison. The page
refreshes every 20 seconds, the user could also click “Refresh” button to
refresh the data immediately.
Figure5-11 : Power Data Overview Mode
The graphic indicators next to the power meter will reveal the connection
status of the power meter, the indicators are as follow:
:Online :Offline :Connecting
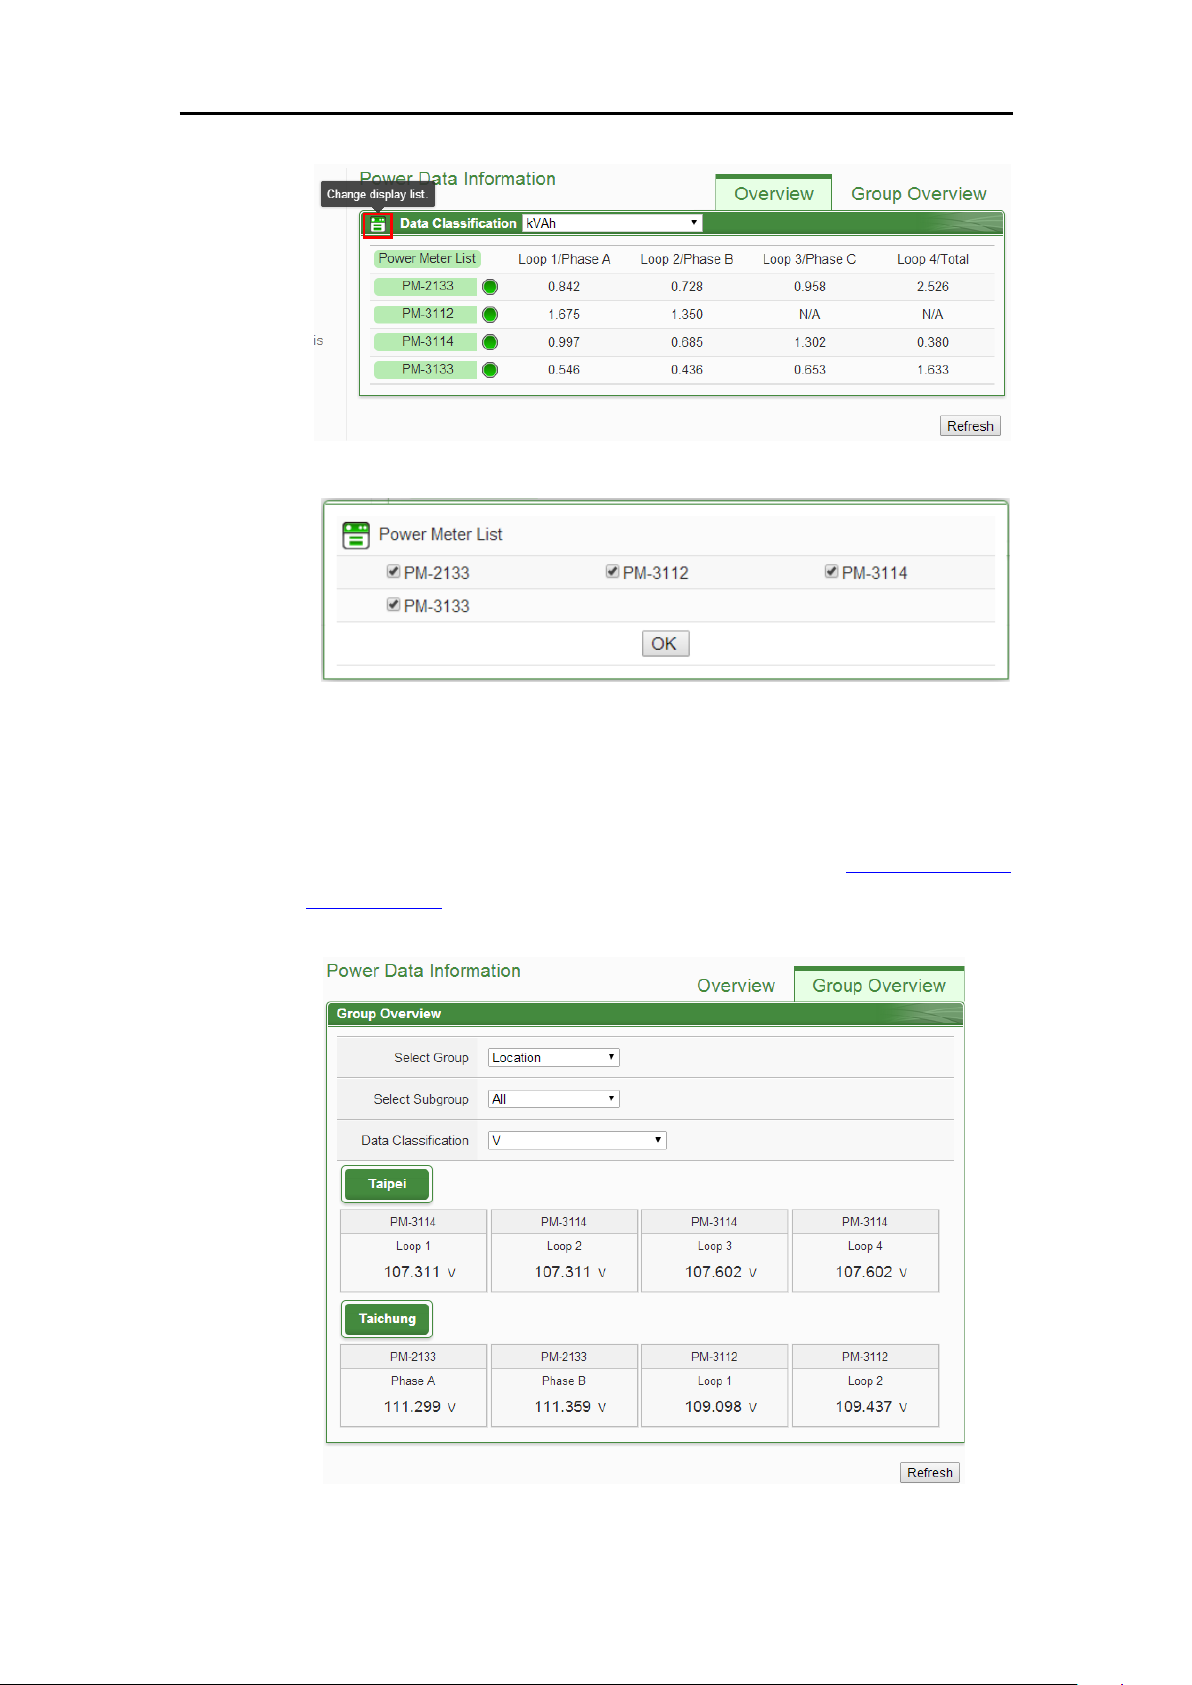
Click on “Change display list” (Figure 5-12) to bring up the Power
Meter List window(Figure 5-13). Select the power meter to be displayed
in the power meter list, click “OK” to complete the settings.
Page 35
ICP DAS PMC/PMD Series User Manual
22
Figure5-12 : Change Display List Button
Figure5-13 : The Power Meter List
5.2.2 Group Overview
Power Data Information group overview mode allows display of power
data of pre-set group of power meters (please refer to 6.8 Power Meter
Group Setting). The page refreshes every 20 seconds, the user could also
click “Refresh” button to refresh the data immediately.
Figure5-14 : Power Data Group Overview Mode
Page 36

ICP DAS PMC/PMD Series User Manual
23
Select Group
Select the group from the dropdown list in the “Select Group” field. If
no group is pre-set, the inquiry operation will be disabled.
Select Subgroup
Select the subgroup from the dropdown list in the “Select Subgroup”
field. User can select one subgroup to view or select “All” to view
power data of all subgroups.
Data Classification
The power data classification includes the following options:
V(Voltage), I(Current), kW(Real Power), kvar (Reactive Power), kVA
(Apparent Power), PF (Power Factor), kWh, kvarh, kVAh, Daily
Accumulated Electricity, Monthly Accumulated Electricity, Yearly
Accumulated Electricity, Daily Carbon Emissions, Monthly Carbon
Emissions, Yearly Carbon Emissions, Hourly Maximum Demand,
Daily Maximum Demand, Monthly Maximum Demand, Actual
Demand and Forecast Demand. The displayed power data will be
varied according to the selected power data classification.
5.3 Realtime Chart
Realtime Chart allows display of power information of the power meter in
real-time trend and pie chart. Realtime Chart can be displayed in two modes
(Power Meter mode and Group mode). The users can change the viewing
mode according to their requirements. The detailed description is as follow:
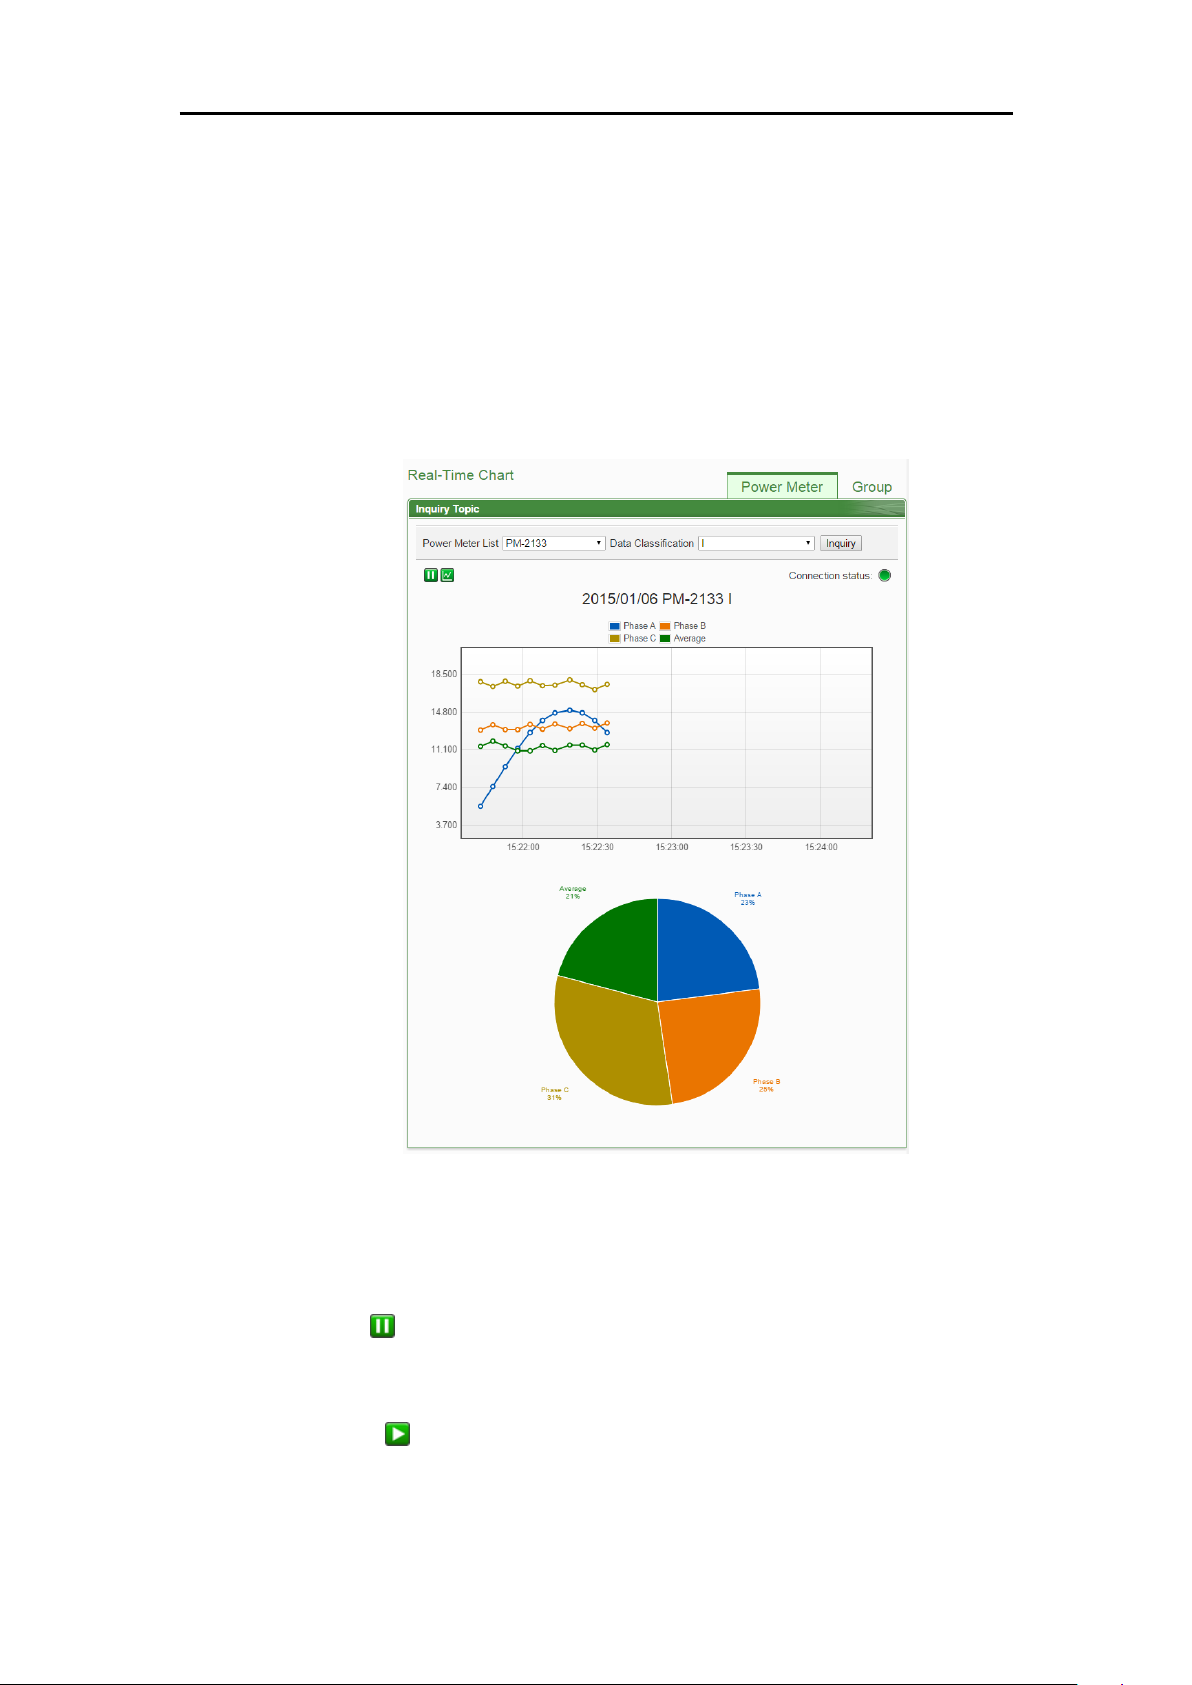
5.3.1 Power Meter Mode
Select the power meter from the dropdown list of the Power Meter List
and select the classification from the dropdown list of the Data
Classification field, and then click on “Inquiry” button, it will show the
chart.
Power Meter List
All power meter connected to the PMC/PMD will be list on the
dropdown list of the Power Meter List, if no power meter is connected,
the inquiry operation will not be able to perform.
Data Classification
Data Classification allows to inquire various power data options,
including: V(Voltage), I(Current), kW(Real Power), kvar (Reactive
Power), kVA (Apparent Power), PF (Power Factor), kWh, kvarh, kVAh,
Page 37
ICP DAS PMC/PMD Series User Manual
24
Daily Accumulated Electricity, and Actual Demand.
Please refer to Figure 5-15 for an example of Realtime Chart for “Power
Meter Mode”. Each time the Realtime Chart displays only one power
information classification. If a different power information classification is
inquired, previously displayed chart will be closed automatically. The user
could choose desired power data classification to view the corresponding
Realtime Chart. The chart refreshes every 5 seconds.
Figure5-15 : Realtime Chart (Power Meter Mode)
There are three function icons on the upper area of the Power Meter
Realtime Chart:
The icon allows to pause the update of the chart, only the data
within the 25 minutes will be displayed. The user could click and drag
on the chart and move forward or backward to show desired time zone.
Click to resume the update of the chart. To view the data on a
specific marker, move the mouse over the marker to display the data
value.
Page 38

ICP DAS PMC/PMD Series User Manual
25
icon allows to hide the markers on the chart; click on button to
show the markers on the chart.
“Connection Status” will reveal the connection status of the power
meter, the graphic indicators are shown as follow:
: Online : Offline : Connecting
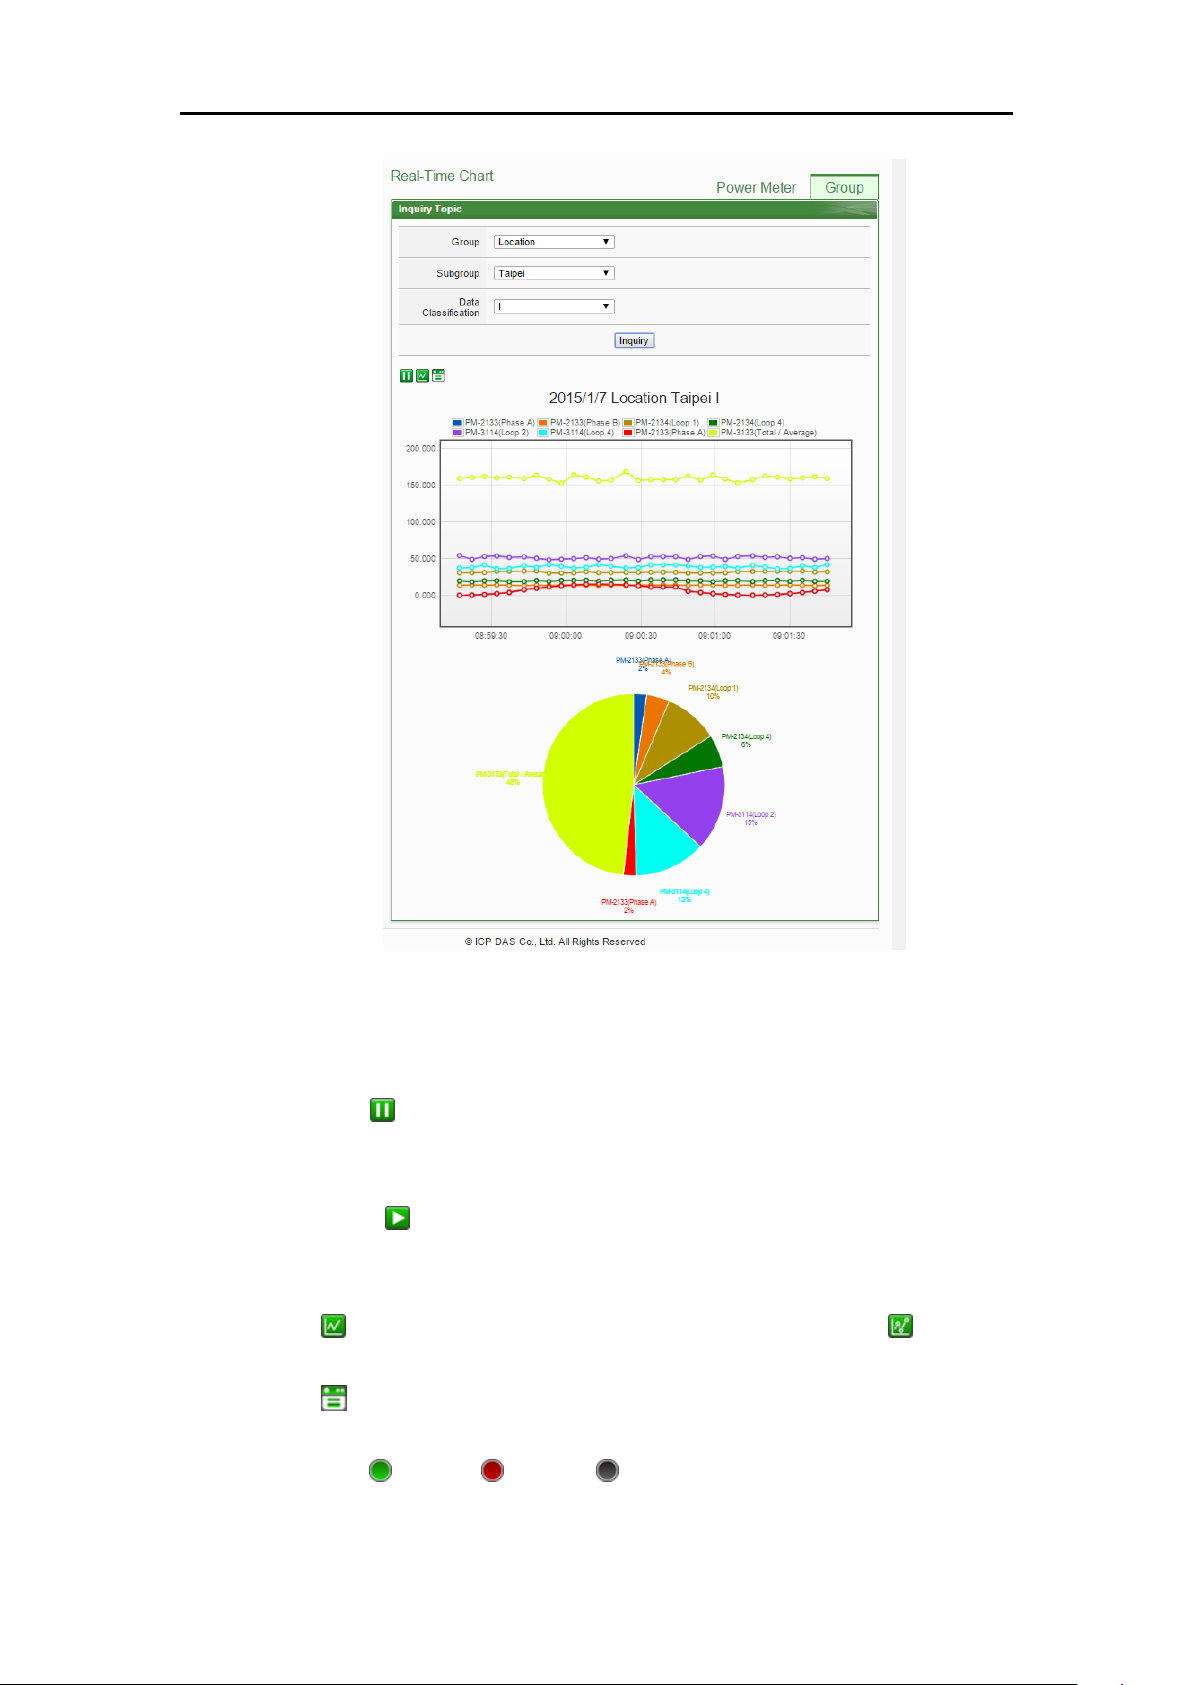
5.3.2 Group Mode
Select the option from the dropdown lists of the Group, Subgroup and
the Data Classification field, and then click on “Inquiry” button, it will
show the chart.
Group
The preset group lists will be shown on the dropdown list of the
Group, if no group is pre-set, the inquiry operation will not be able to
perform.
Subgroup
According to the selected Group option, the corresponding subgroups
will be listed. If the selected Group contains no subgroup or the
subgroup doesn’t setup any loop/phase of the power meter, the
inquiry operation will not be able to perform.
Data Classification
Data Classification allows to inquire various power data options,
including: V(Voltage), I(Current), kW(Real Power), kvar (Reactive
Power), kVA (Apparent Power), PF (Power Factor), kWh, kvarh,
kVAh, Daily Accumulated Electricity, and Actual Demand.
Please refer to Figure 5-16 for an example of Realtime Chart for “Group
Mode”. Each time the Realtime Chart displays only one power
information classification. If a different power information classification
is inquired, the previously displayed chart will be closed automatically.
The user could choose desired power data classification to view the
corresponding Realtime Chart. The chart refreshes every 5 seconds.
Page 39
ICP DAS PMC/PMD Series User Manual
26
Figure5-16 : Realtime Chart (Group Mode)
There are three function icons on the upper area of the Power Meter
Realtime Chart:
The icon allows to pause the update of the chart, only the data
within the 25 minutes will be displayed. The user could click and drag
on the chart and move forward or backward to show desired time zone.
Click to resume the update of the chart. To view the data on a
specific marker, move the mouse over the marker to display the data
value.
icon allows to hide the markers on the chart; click on button to
show the markers on the chart.
icon will show the connection status of the power meters of the
subgroup, the graphic indicators are shown as follow:
: Online : Offline : Connecting
Page 40
ICP DAS PMC/PMD Series User Manual
27
5.4 Historical Chart
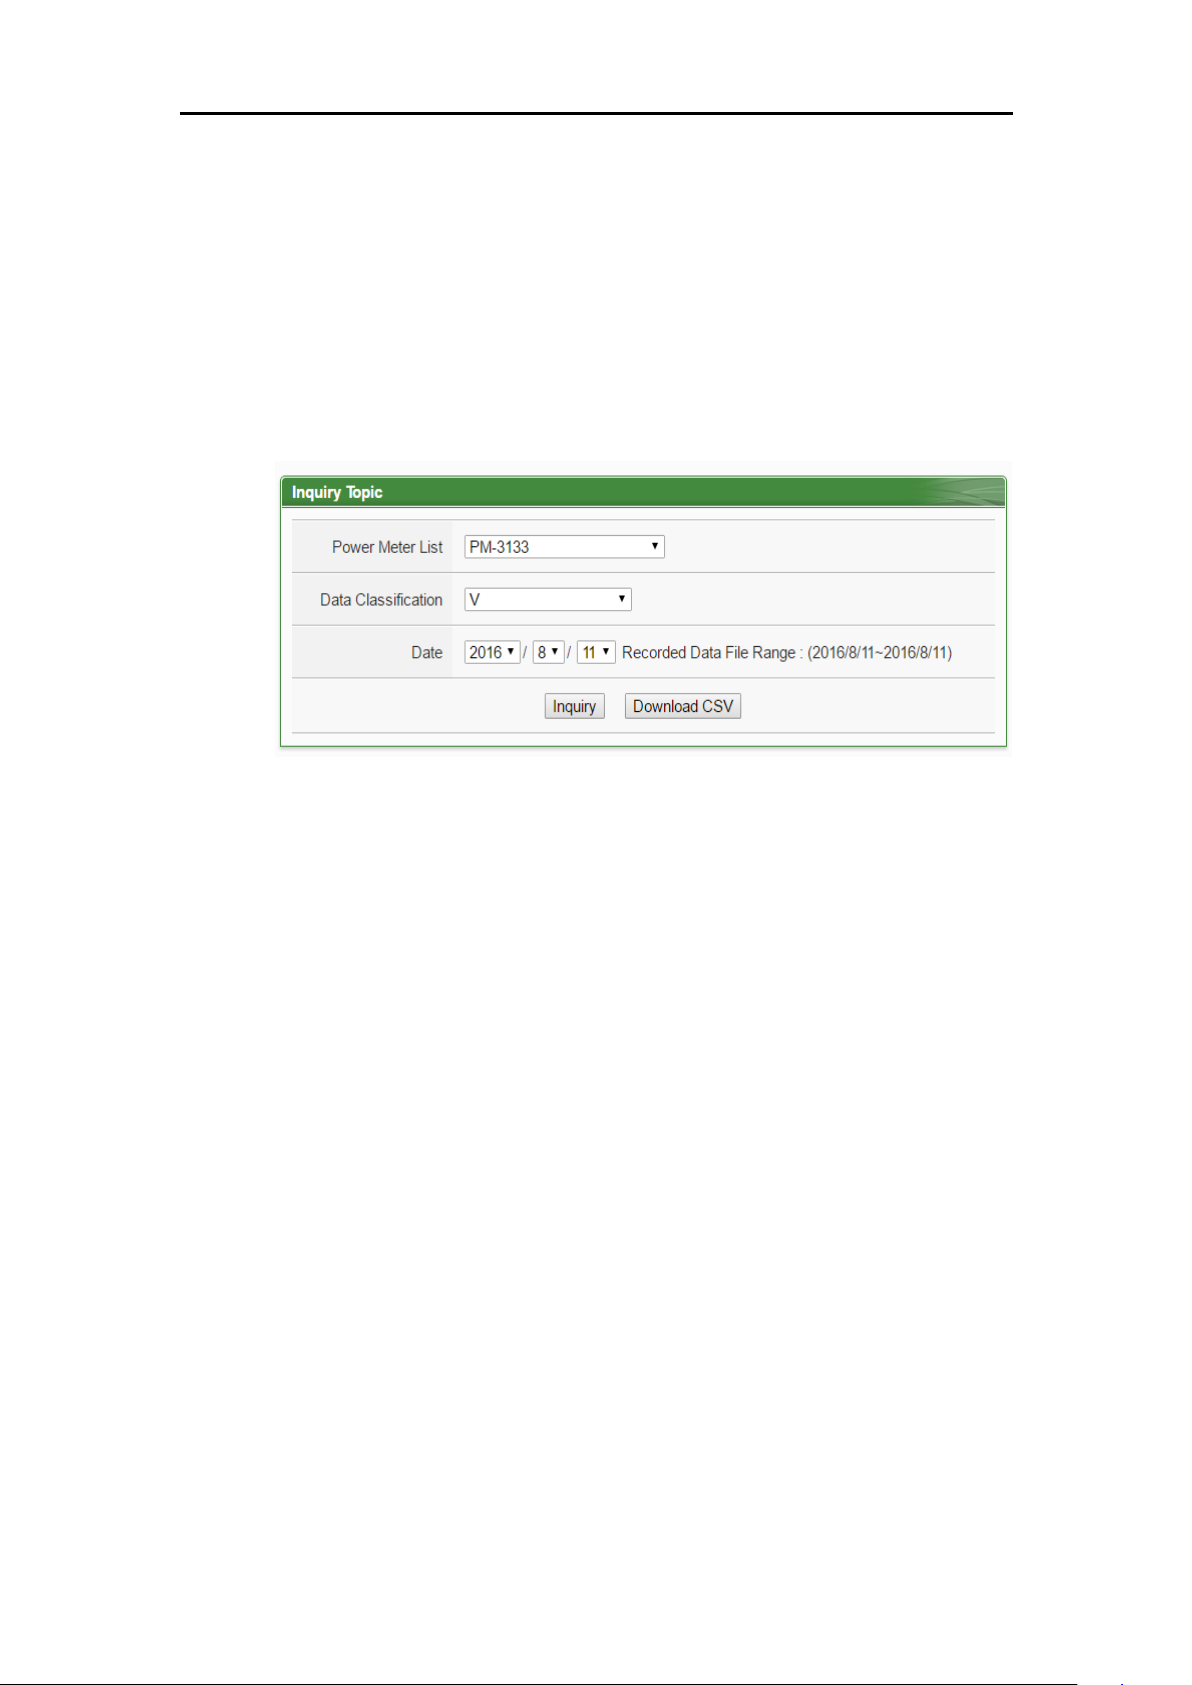
Historical Chart allows display of the value and chart of power data in
historical trend. Select the power meter from the dropdown list of the Power
Meter List, choose the classification from the dropdown list of the Data
Classification and then specify the date from the dropdown list of the Date.
The interface is shown as below. User also can click the "Download CSV"
button to download the csv file of the specify power meter for the specify
the date.
Figure5-17 : Historical Chart Inquiry
Power Meter List
All power meter connected to the PMC/PMD will be list on the
dropdown list of the Power Meter List, if no power meter is connected,
the inquiry operation will not be able to perform.
Data Classification
Data Classification allows to inquire various power data options,
including: V(Voltage), I(Current), kW(Real Power), kvar (Reactive
Power), kVA (Apparent Power), PF (Power Factor), kWh, kvarh, kVAh,
Daily Accumulated Electricity, and Actual Demand.
Date
The dates that are available for power data retrieval will be displayed.
Please note, if no log file is available, the inquiry operation will not be
performed.
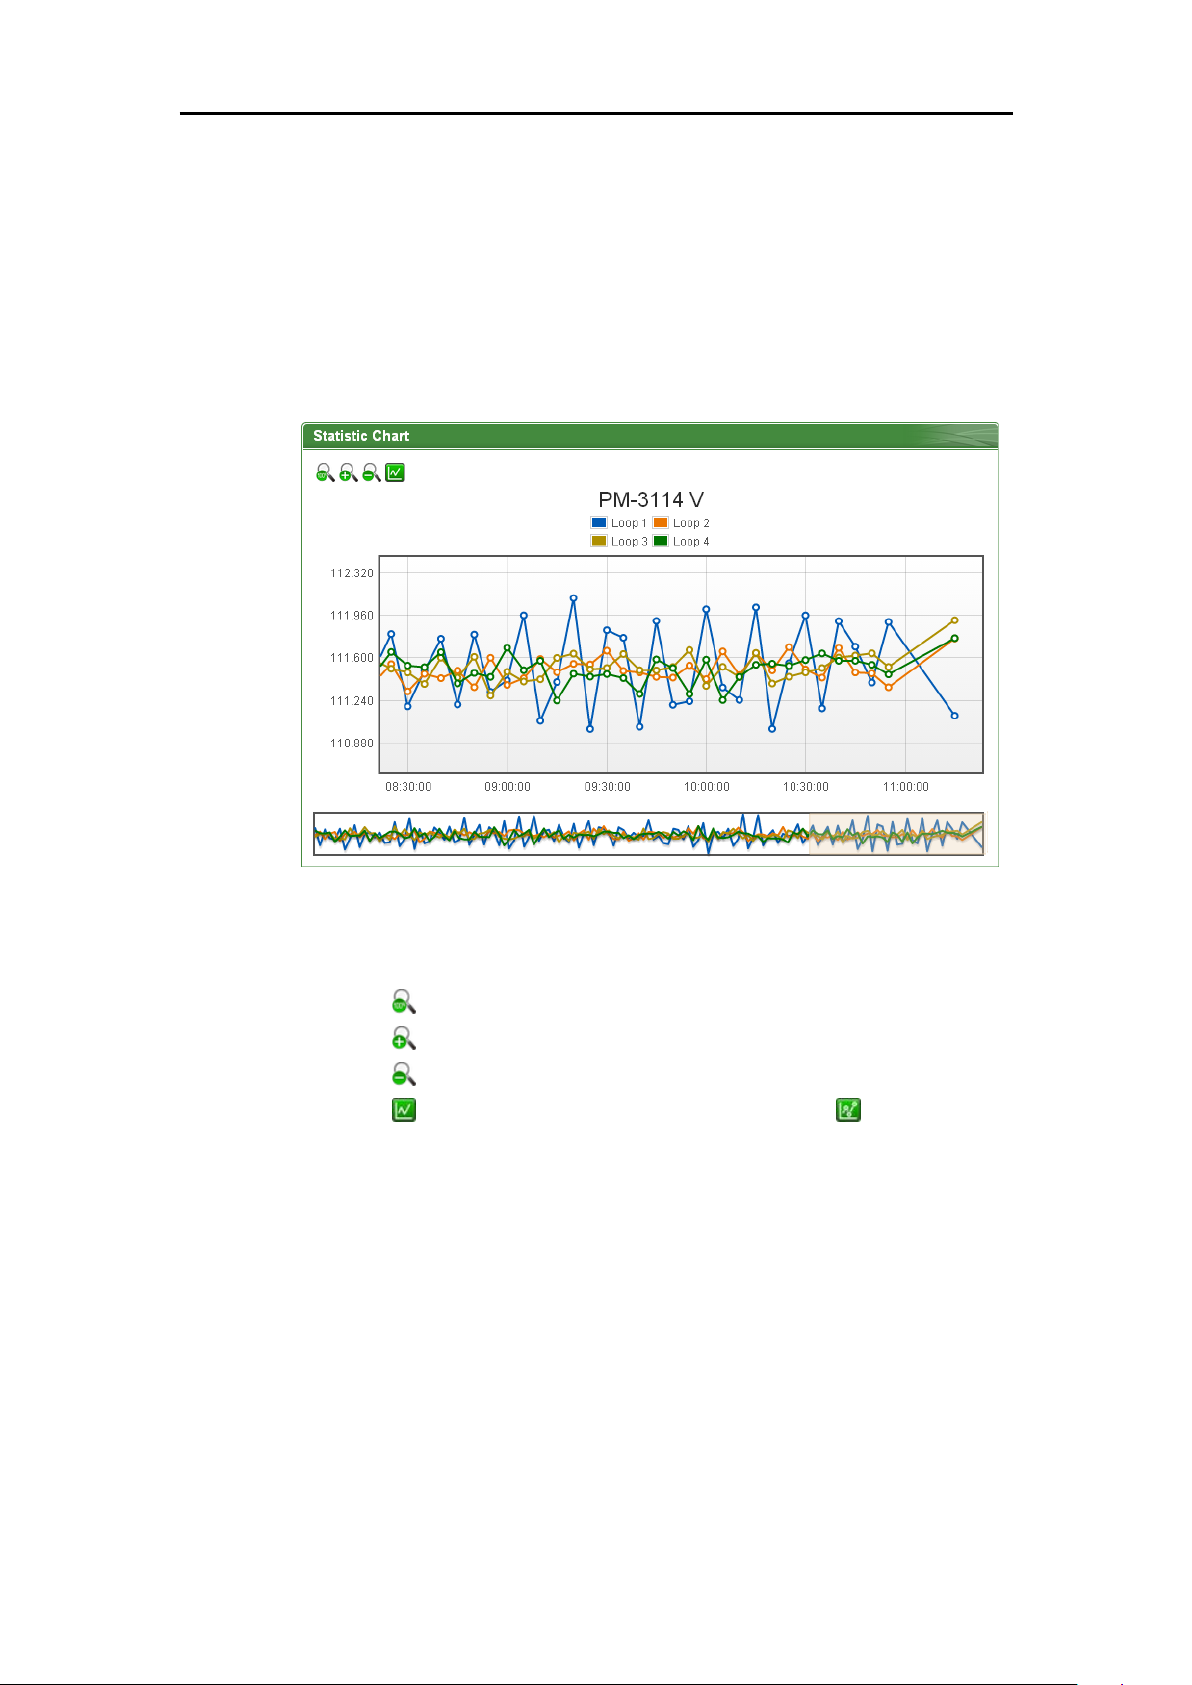
Click on “Inquiry” to display the power data historical statistic chart (Figure
5-18) and table (Figure 5-19) of the selected date range. If the selected date
does not contain the file or exceeds the date of the file storage range, a
message “No file exists” will be displayed. The Historical Data Chart and
Historical Data Table are shown as below:
Page 41
ICP DAS PMC/PMD Series User Manual
28
Historical Data Chart
The historical power data of specified classification will be displayed
in historical chart. The user could select the range on the below region
or drag and move on the chart to adjust the viewing range. Move the
mouse cursor close to the marker, the value will be displayed.
Figure5-18 : Historical Data Chart for power data
On the upper left of the Historical Chart, there are 4 function icons.
Set the Historical Chart to be default status.
Zoom in the Y-axis of the Historical Chart
Zoom out the Y-axis of the Historical Chart
Hide the markers on the Historical Chart. Show the
markers on the Historical Chart
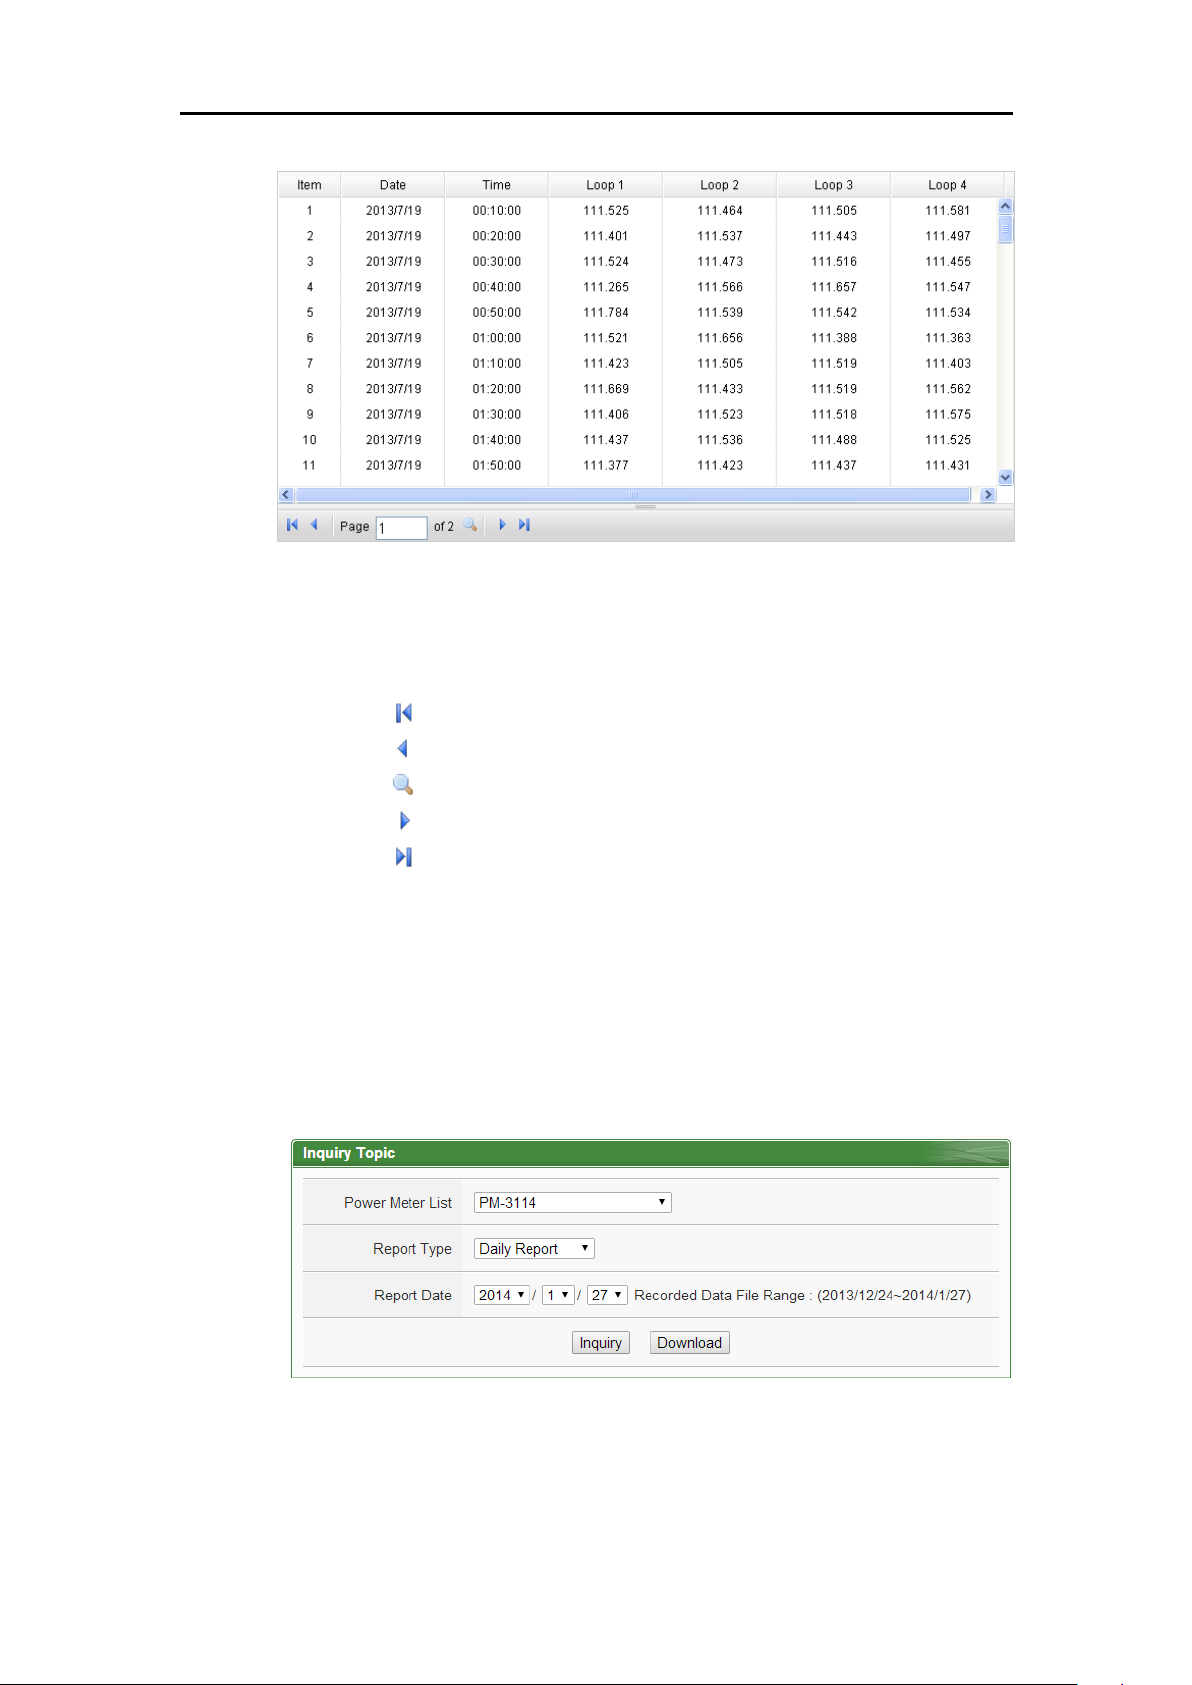
Historical Data Table
Historical Data Table will display the requested historical power data;
the historical power data of selected classification of each loop (or
phase) will be listed.
Page 42
ICP DAS PMC/PMD Series User Manual
29
Figure5-19 : Historical Data Table for power data
On the lower left of the Historical Data Table, there are 5 function
icons.
Go to the first page.
Go to previous page.
Go to specific page.
Go to next page.
Go to last page.
5.5 Historical Data Report
The Historical Data Report allows display of the power data report of
desired power meter; specify the power meter, power classification and date
range to inquire the data, shown as below:
Figure5-20 : Historical Data Report inquiry
Power Meter List
All power meter connected to the PMC/PMD and the Power Meter
Page 43

ICP DAS PMC/PMD Series User Manual
30
Groups will be listed on the dropdown list of the Power Meter List.
When a single power meter is selected, a power data report of the
specified power meter will be generated. If a power meter group is
selected, a report of the "Total accumulative electricity" of all power
meters in this group will be generated. If no power meter is connected
to PMC/PMD, the inquiry operation will not be able to perform. About
the setting of Power Meter Group, please refer to 6.8 Power Meter
Group section.
Report Type
Allow to inquire Daily Report, Weekly Report, Monthly Report or
Annual Report options.
Report Date
The dates that are available for data retrieval will be displayed.
Please note: if no log file is available, the inquiry operation will not be
performed.
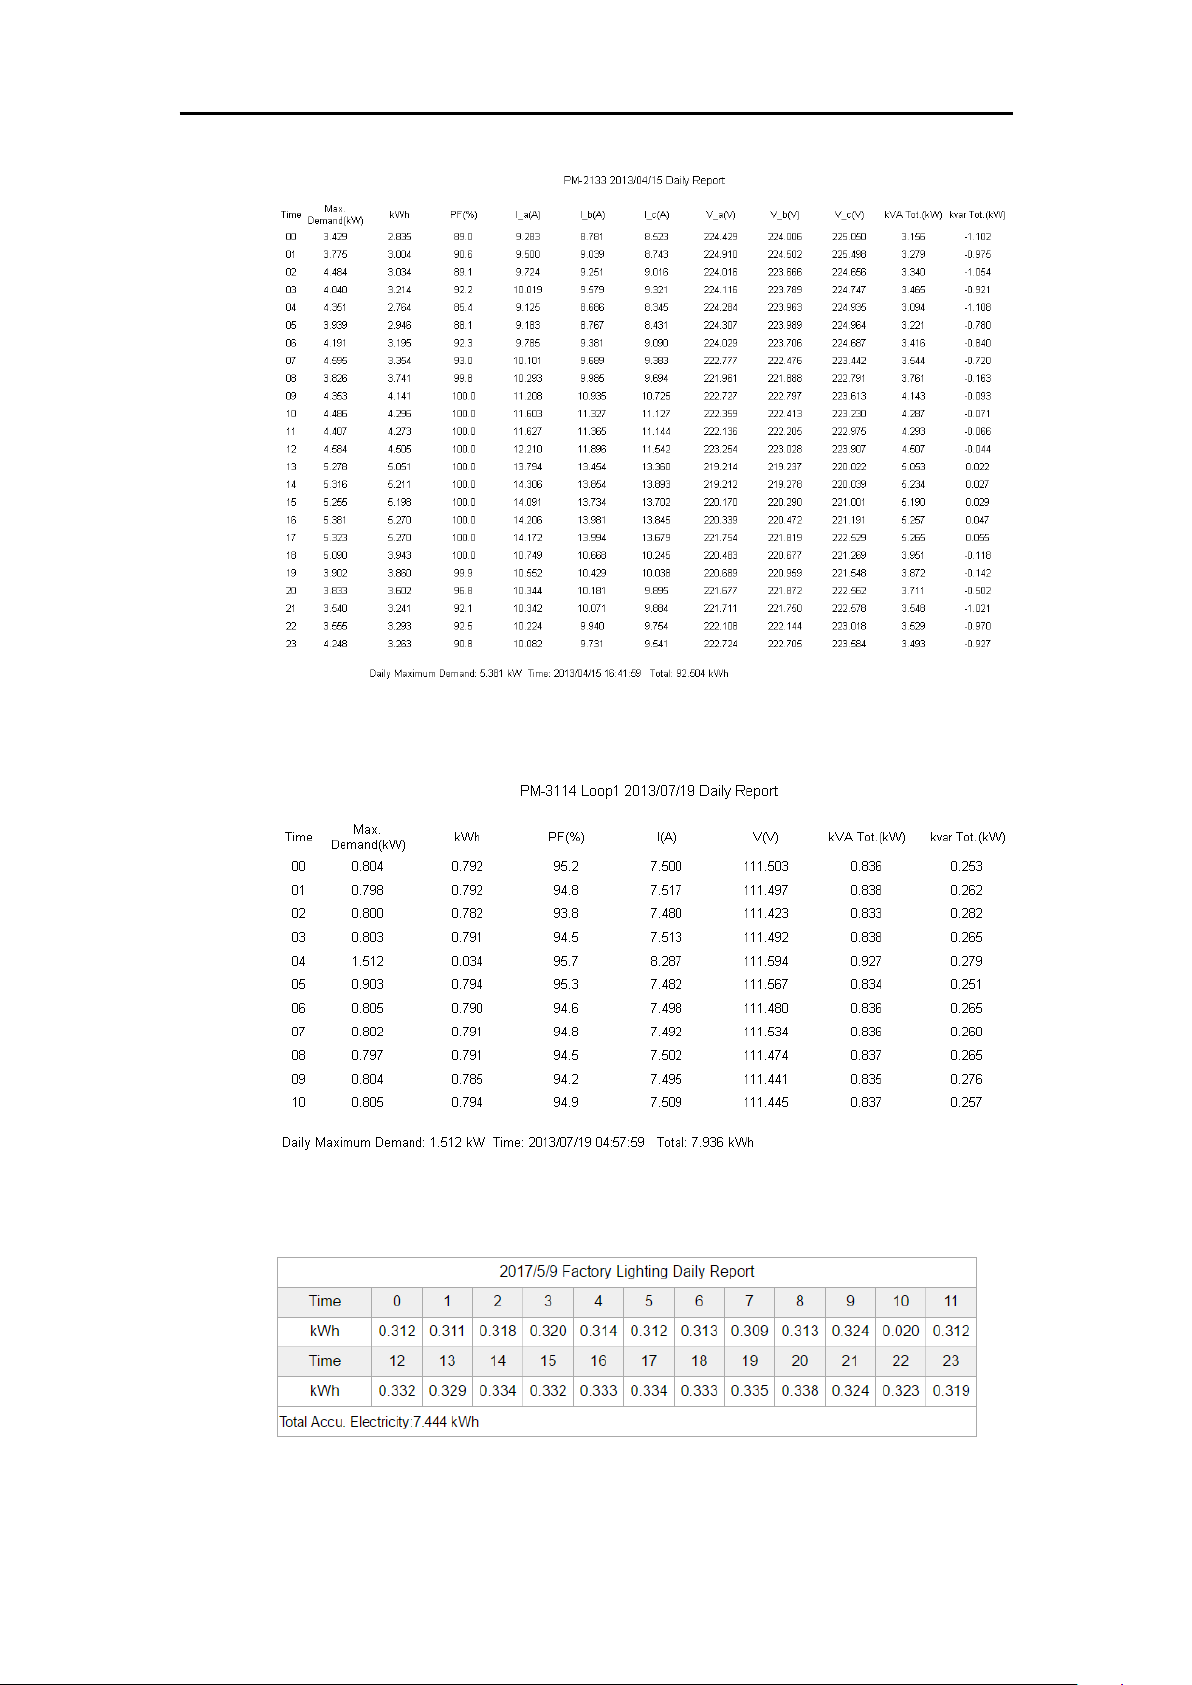
Click on “Inquiry” or ”Download” to display/download the Historical Data
Report of the selected date range. If the selected date does not contain the
file or exceeds the date of the file storage range, a message “No file exists”
will be displayed. For the number of loops of power meters are different,
the data report will be in different format, please refer to Figure 5-21 for the
Daily Report of 3-phase power meter and Figure 5-22 for the Daily Report
of single phase power meter.
Page 44
ICP DAS PMC/PMD Series User Manual
31
Figure5-21 : Daily Report for PM-3133
Figure5-22 : Daily Report for PM-3114
Figure5-23 : "Total Accu. Electricity" report for Power Meters Group
Page 45
ICP DAS PMC/PMD Series User Manual
32
5.6 Historical Electricity Analysis
Historical Electricity Analysis can be done in 3 ways: Energy Usage Analysis
by Trend, Energy Usage Analysis by Time and Energy Usage Breakdown by
Circuit/Group. The user can query electricity analysis for specific date by
selecting Chart Type, Data Classification, Date and Loop(s)/Phase(s); the
following section will provide more detailed information:
5.6.1 Energy Usage Analysis by Trend
The users could specify the data classification and the time range under
this section, and then select the loop(s)/phase(s) to be inquired; the
corresponding Energy Usage Analysis will be displayed in Trend chart
format.
Figure5-24 : Energy Usage Analysis by Trend
Function Type: The user can select one of the following three options
for electricity analysis: Energy Usage Analysis by Trend, Energy
Usage Analysis by Time Period and Energy Usage Breakdown by
Circuit/Group.
Data Classification: includes V (voltage), I (current), PF (power
factor), Energy Usage (KWh), and Maximum Demand.
Chart Type: Provides Yearly Chart、Monthly Chart and Daily Chart.
Date: Select the date range to be queried (the system will provide the
date range can be queried)
Inquiry Mode:The user can select one of the following two options
Page 46
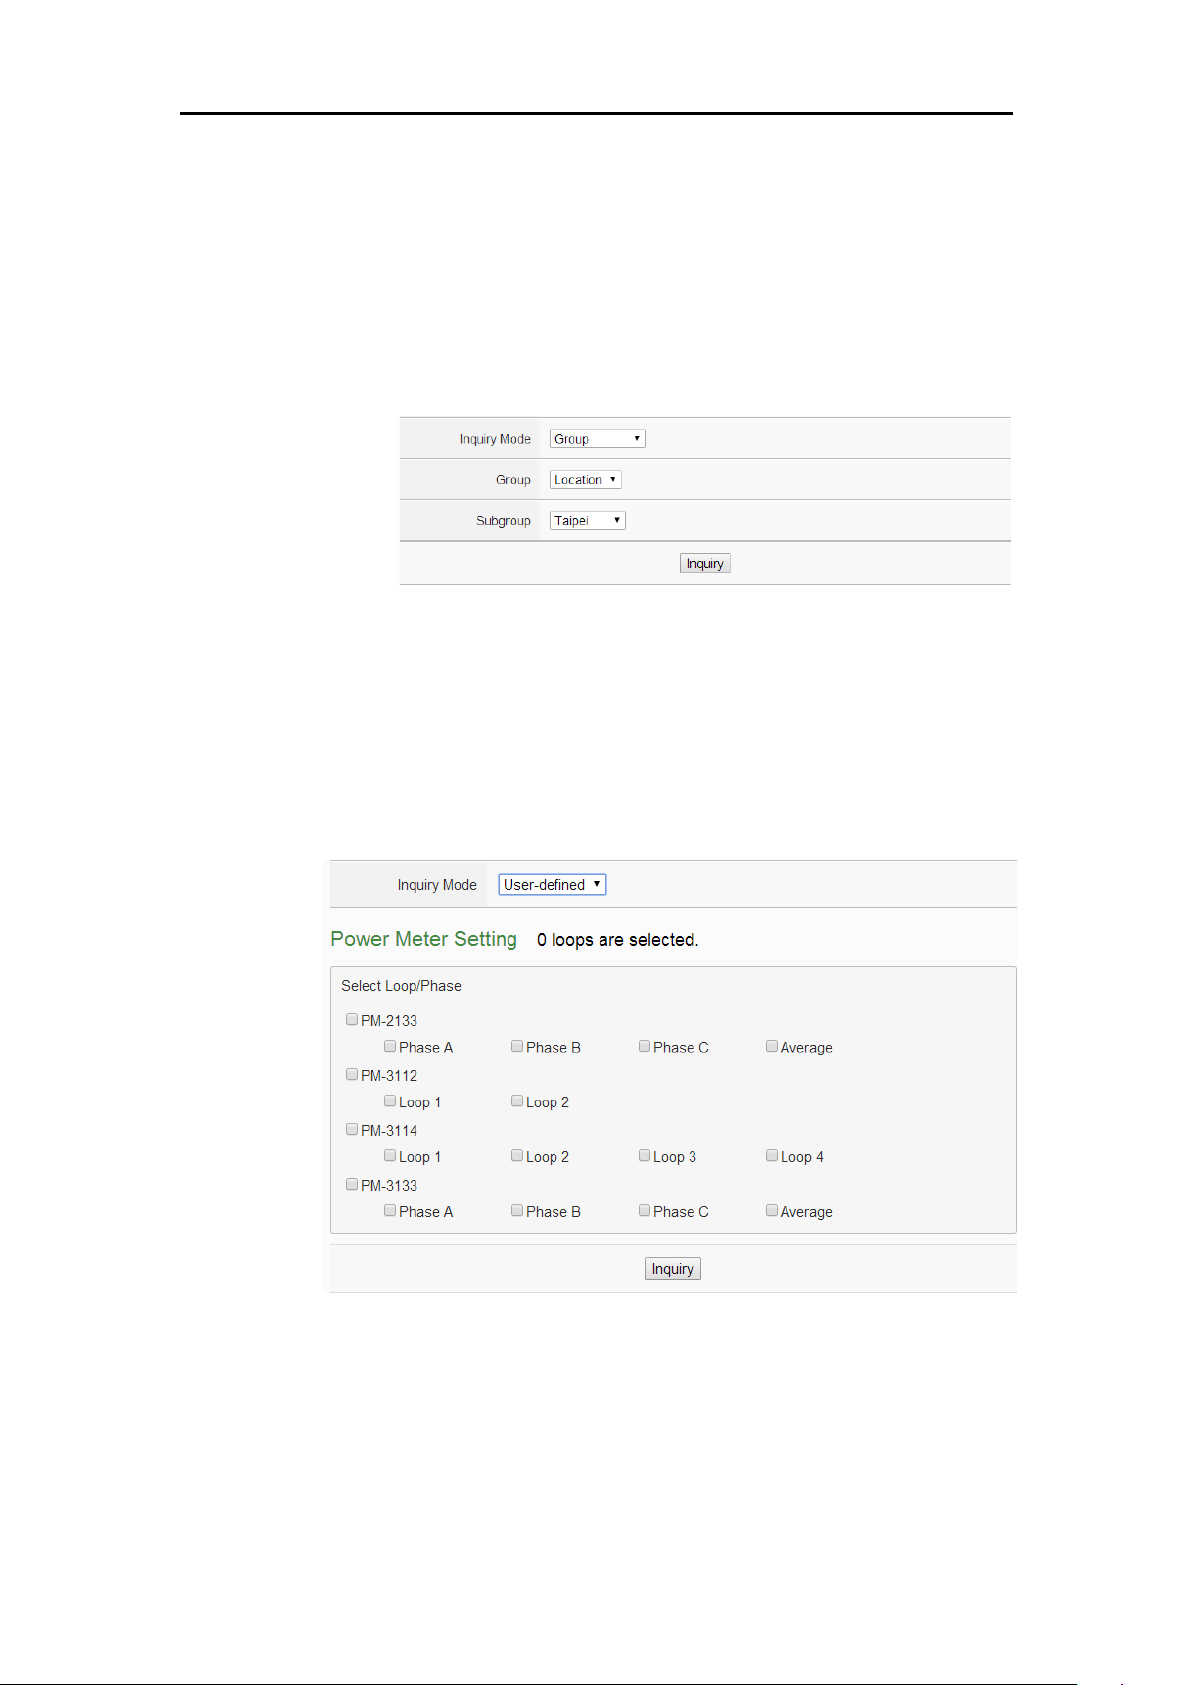
ICP DAS PMC/PMD Series User Manual
33
for inquiring: group mode and user-defined mode.
Group:
In group mode, the user can select group and subgroup to
inquire the energy usage analysis of loops/phases of the power
meters in the format of trend chart. If no group is pre-set, the
user will not be able to perform inquiry operation.
Figure5-25 : Inquiry by Group Mode
User-defined:
In user-defined mode, all power meters connected to the
PMC/PMD will be listed. If no power meter is connected, the
user will not be able to perform inquiry operation. The
minimum loop/phase to be queried is 1 loop/phase.
Figure5-26 : Inquiry by User-defined Mode
Click on “Inquiry” button to display the trend of Energy Usage Analysis
for the specified date range. If the selected date does not contain the file
or exceeds the date of the file storage range, a message “No file exists”
will be displayed. The trend of Energy Usage Analysis data of specified
Page 47
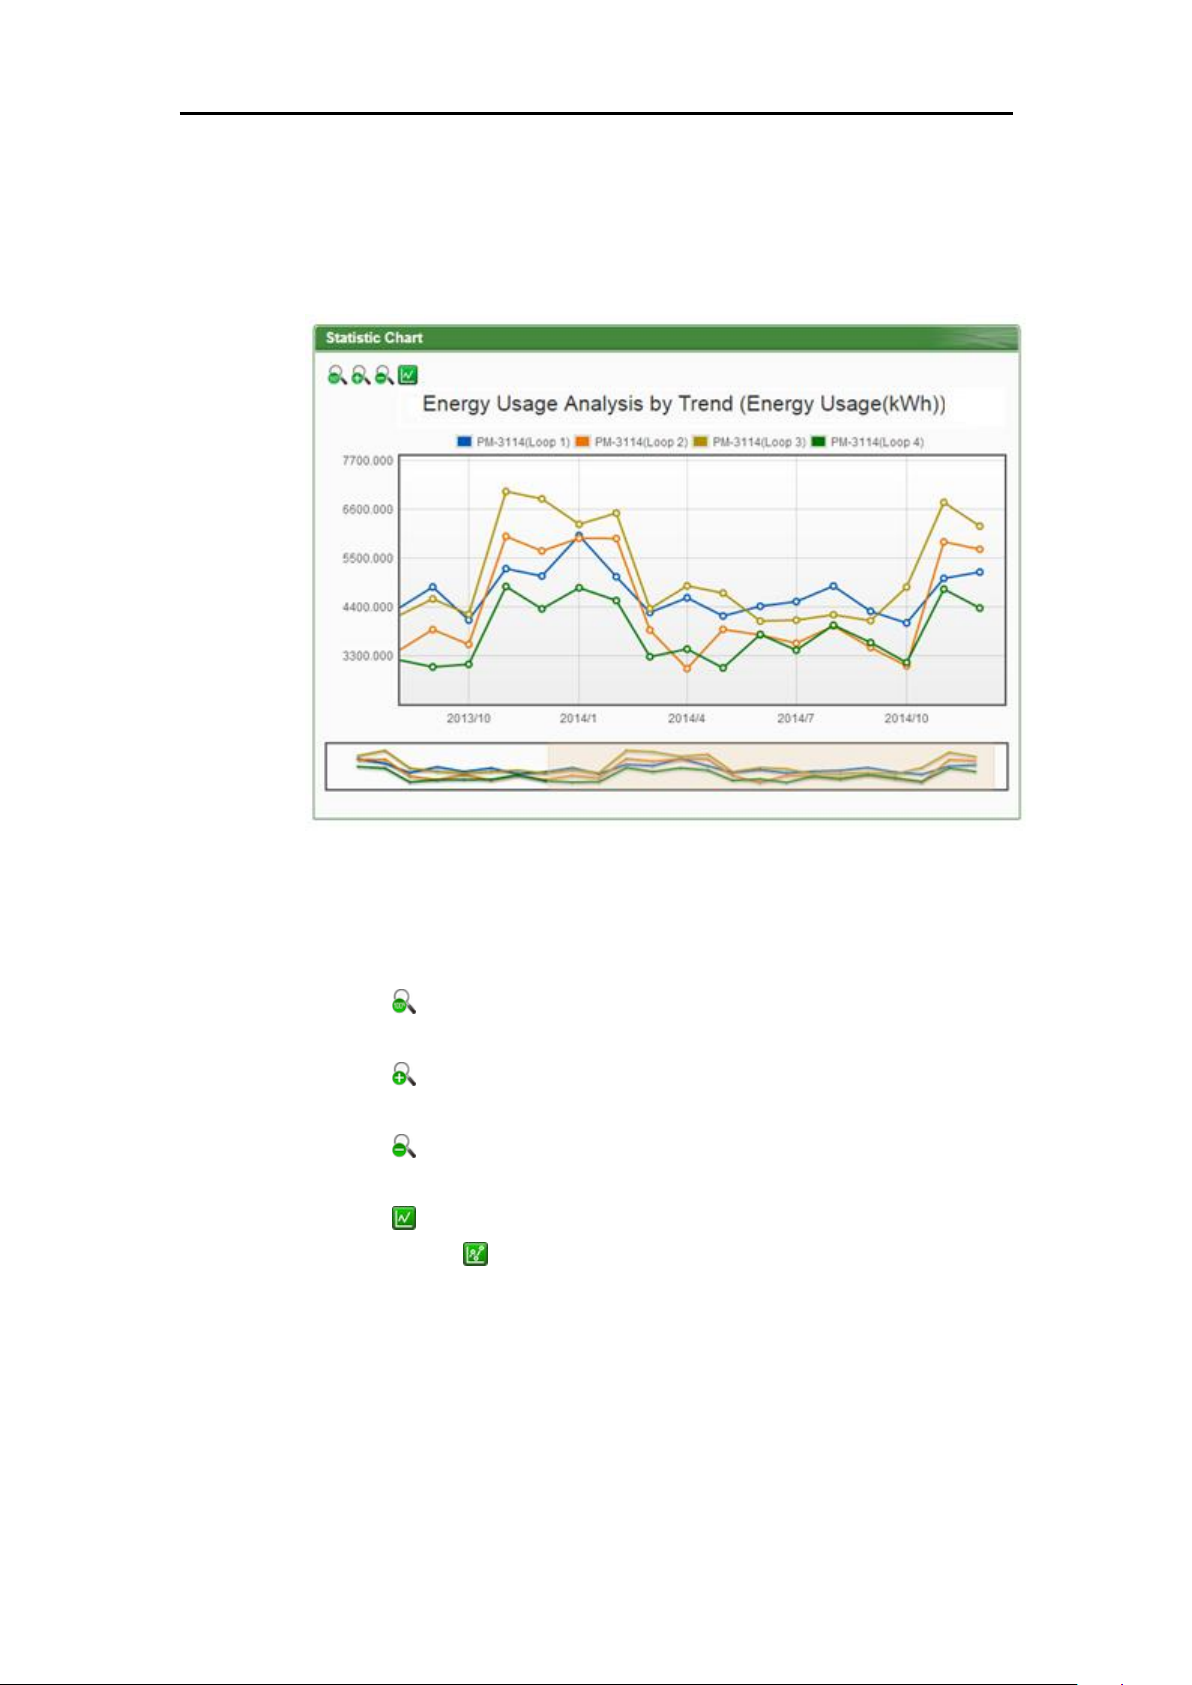
ICP DAS PMC/PMD Series User Manual
34
classification will be displayed in historical chart. The user could select
the range on the below region or drag and move on the chart to adjust the
viewing range. Move the mouse cursor close to the marker, the value
will be displayed.
Figure5-27 : PM-3114 Energy Usage Analysis Trend Chart
On the upper left of the Energy Usage Analysis by Trend Chart, there are
4 function icons.
Set the Energy Usage Analysis by Trend Chart to be default
status.
Zoom in the Y-axis of the Energy Usage Analysis by Trend
Chart.
Zoom out the Y-axis of the Energy Usage Analysis by Trend
Chart.
Hide the markers on the Energy Usage Analysis by Trend
Chart. Show the markers on the Energy Usage Analysis by
Trend Chart.
5.6.2 Energy Usage Analysis by Time Period
The users could specify the data classification and the time range under
this section, and then select the loop(s)/phase(s) to be inquired; the
corresponding Energy Usage Analysis by Time Period will be
displayed in histogram chart to show the annual, quarterly or monthly
Page 48
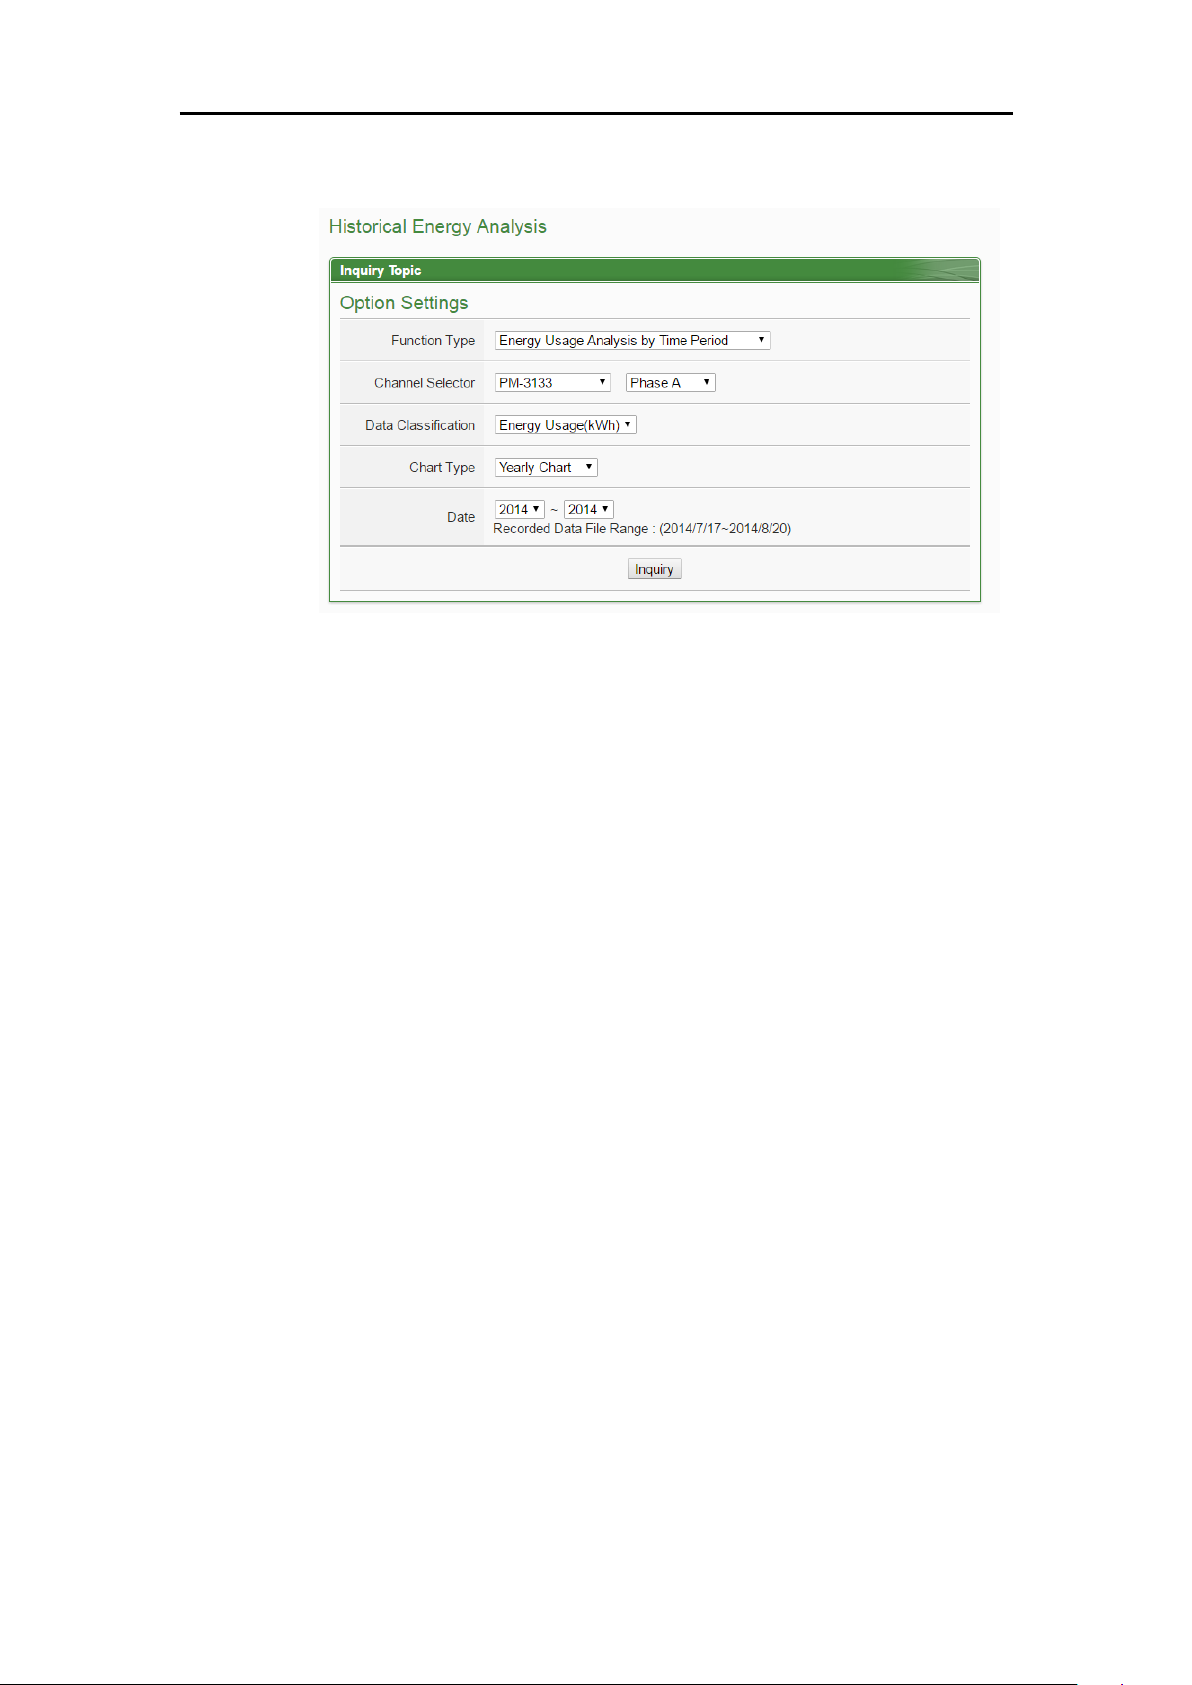
ICP DAS PMC/PMD Series User Manual
35
energy usage comparison for each year.
Figure5-28 : Energy Usage Analysis by Time Period
Function Type: The user can select one of the following three options
for energy analysis: Energy Usage Analysis by Trend, Energy Usage
Analysis by Time Period and Energy Usage Breakdown by
Circuit/Group.
Select Loop/Phase: All power meters connected to the PMC/PMD
will be listed. If no power meter is connected, the user couldn’t
perform inquiry operation.
Data Classification: includes V (voltage), I (current), PF (power
factor), Energy Usage (KWh), and Maximum Demand.
Chart Type: Provides Yearly Chart, Quarterly Chart and Monthly
Chart.
Date: Select the date range to be queried (the system will provide the
date range can be queried)
Click on “Inquiry” button to display the Energy Usage Analysis by Time for
the specified date range. If the selected date does not contain the file or
exceeds the date of the file storage range, a message “No file exists” will be
displayed. The Energy Usage Analysis by Time Period will be displayed in
the lower region in histogram chart. Move the mouse cursor close to the
histogram chart, the value will be displayed.
Page 49
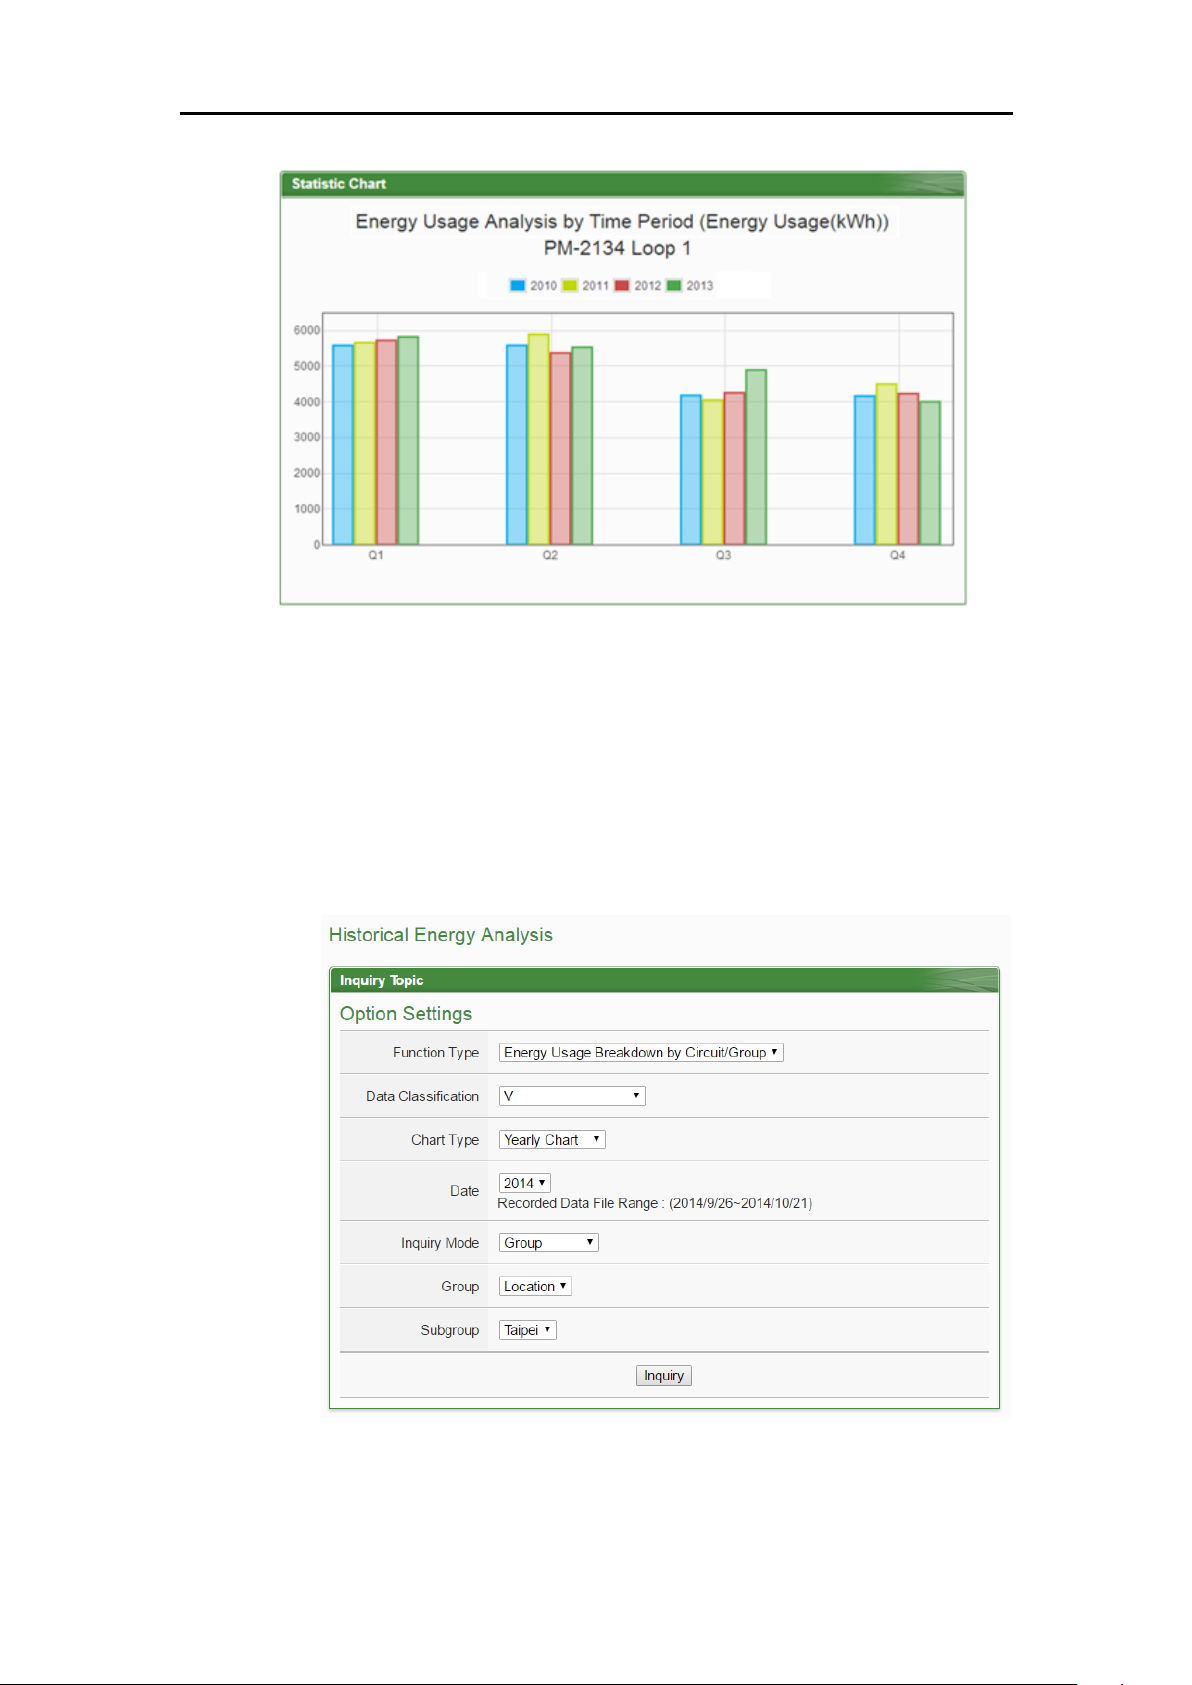
ICP DAS PMC/PMD Series User Manual
36
Figure5-29 : Time Histogram Chart for PM-3114 Loop 1
5.6.3 Energy Usage Breakdown by Circuit/Group
The users could specify the data classification and the time range under
this section, and then select the loop(s)/phase(s) to be inquired; the
corresponding Energy Usage Breakdown by Circuit/Group will be
displayed in category pie chart to show the Energy Usage Proportion of
the loops/phases.
Figure5-30 : Energy Usage breakdown by Circuit/Group
Function Type: The user can select one of the following three options
Page 50
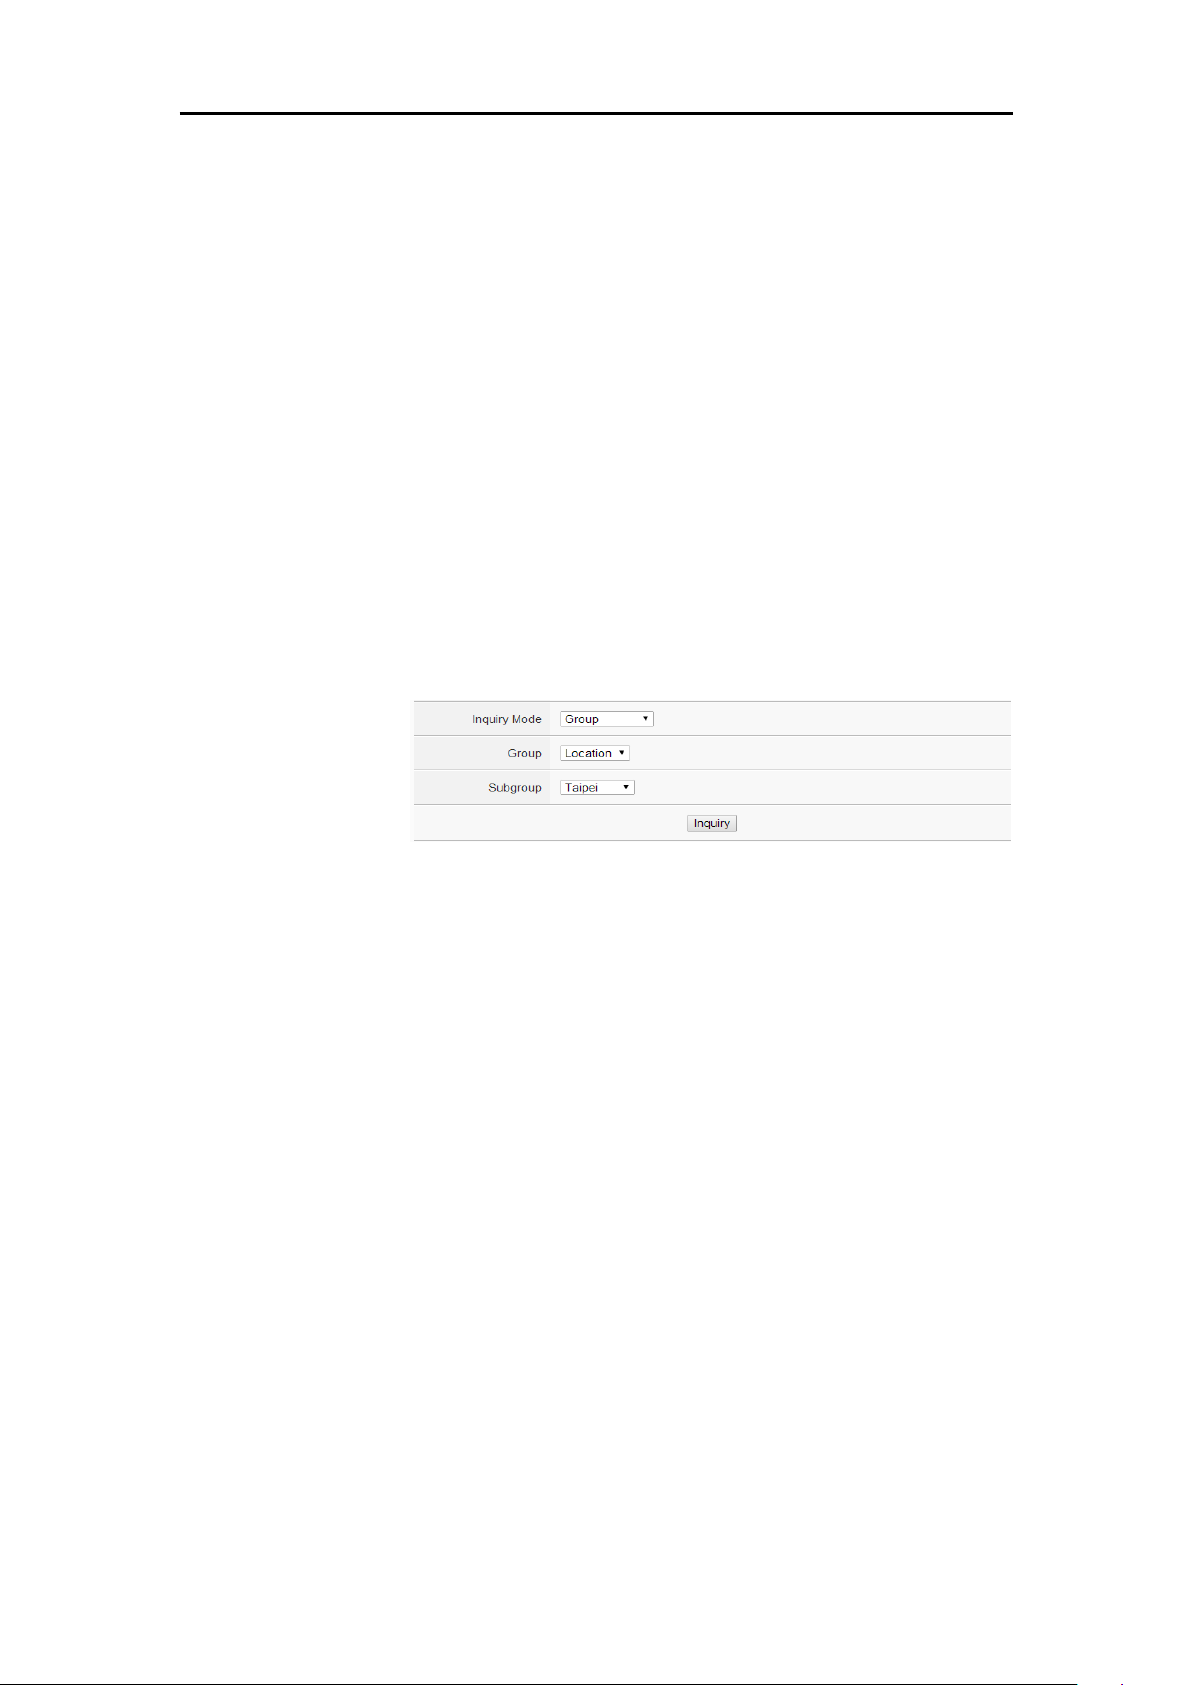
ICP DAS PMC/PMD Series User Manual
37
for energy analysis: Energy Usage Analysis by Trend, Energy Usage
Analysis by Time Period and Energy Usage Breakdown by
Circuit/Group.
Data Classification: includes V (voltage), I (current), PF (power
factor), Energy Usage (KWh), and Maximum Demand.
Chart Type: Provides Yearly Chart, Monthly Chart and Daily Chart.
Date: Select the date range to be queried (the system will provide the
date range can be queried).
Inquiry Mode:The user can select one of the following two options
for inquiring: group mode and user-defined mode.
Group:
In group mode, the user can select group and subgroup to
inquiry the energy usage analysis of loops/phases of the power
meters in the format of proportion chart. If no group is pre-set,
the user will not be able to perform inquiry operation.
Figure5-31 : Inquiry by Group Mode
User-defined:
In user-defined mode, all power meters connected to the
PMC/PMD will be listed. If no power meter is connected, the
user will not be able to perform inquiry operation. The
minimum loop/phase to be queried is 1 loop/phase.
Click on “Inquiry” button to display the Energy Usage Breakdown by
Circuit/Group for the specified date range. If the selected date does not
contain the file or exceeds the date of the file storage range, a message “No
file exists” will be displayed. The Energy Usage Breakdown by
Circuit/Group will be displayed as category pie chart in the lower region.
Move the mouse cursor close to the category pie chart, the value will be
displayed. The electricity usage information will be listed as table below.
The maximum and minimum value of the loop/phase will be listed on the
table. If the Data Classification of the inquired data is Electricity Usage
(KWh), the statistic information of total Energy Usage will also be listed on
the table.
Page 51
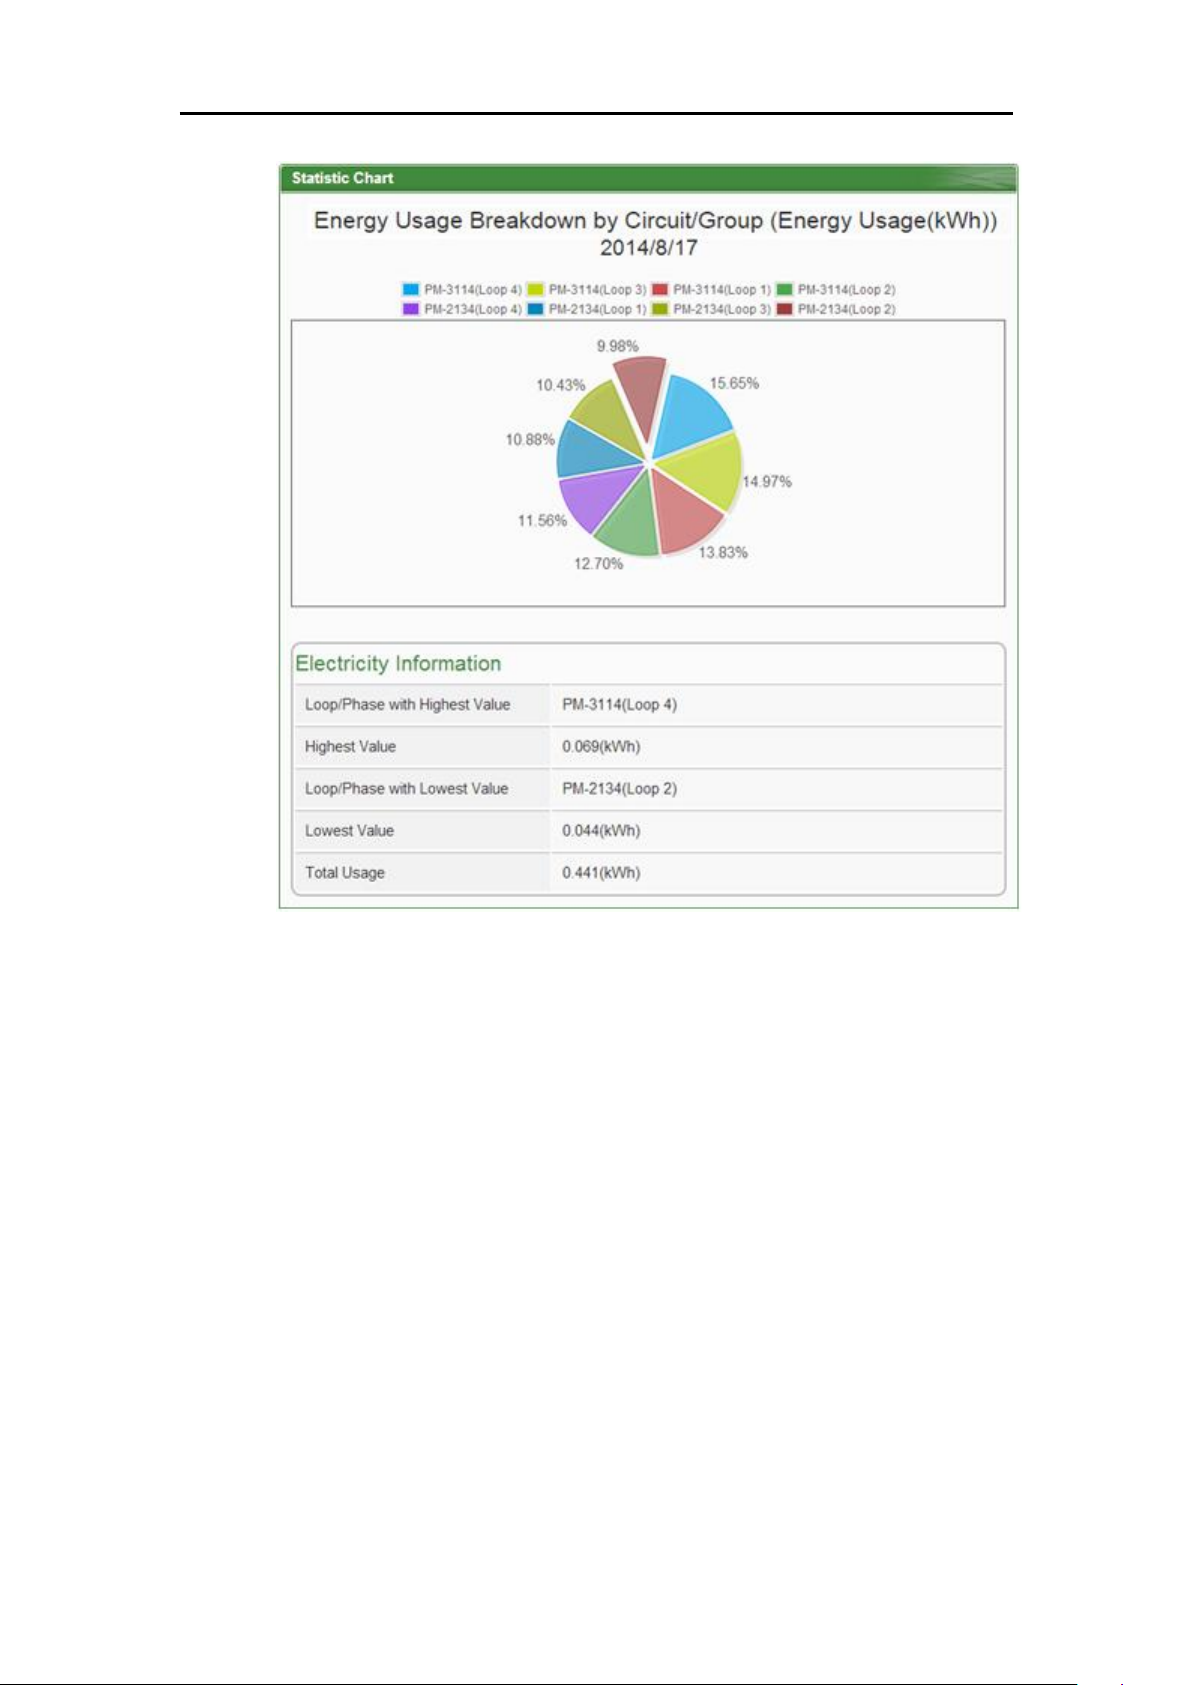
ICP DAS PMC/PMD Series User Manual
38
Figure5-32 : Energy Usage Breakdown by Circuit/Group Chart
Page 52
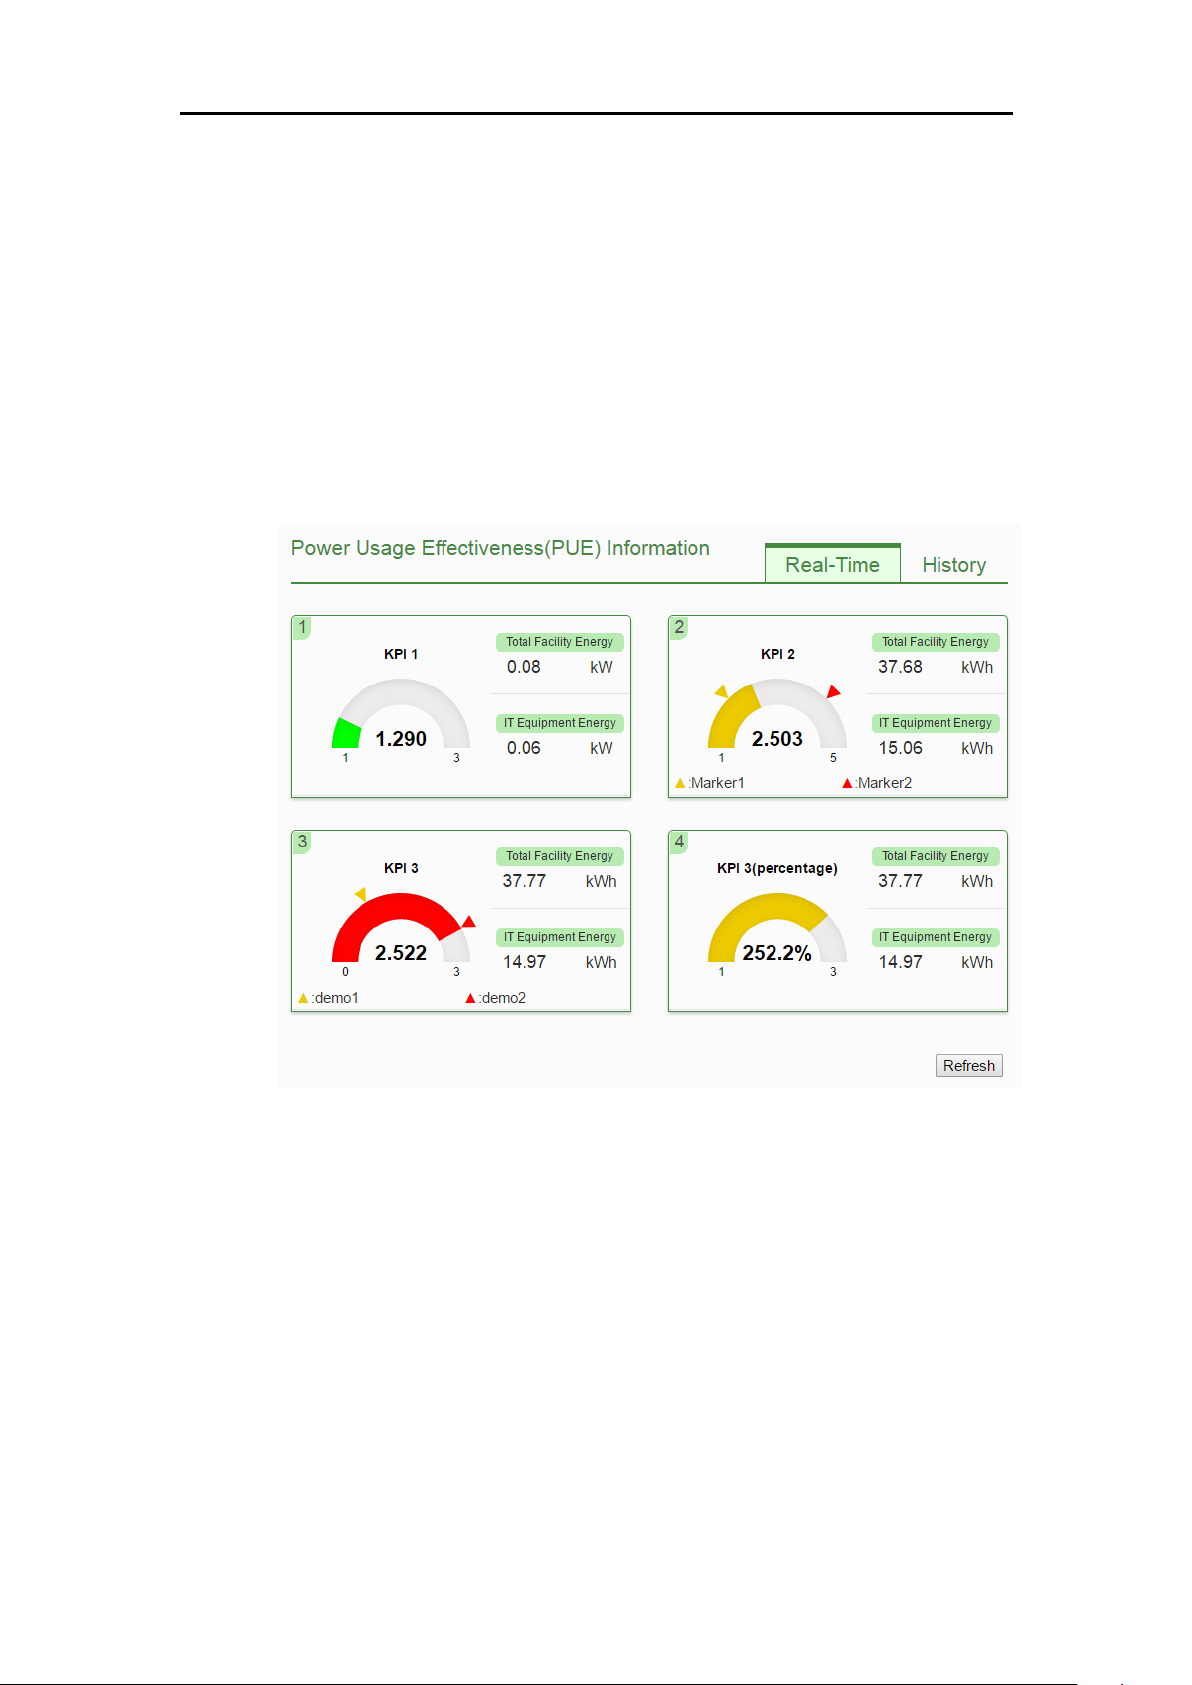
ICP DAS PMC/PMD Series User Manual
39
5.7 PUE Information
Power Usage Effectiveness(PUE) information can be displayed in two
modes(Real-Time and History), users can change the viewing mode
according to the requirement;more detailed information is as below:
5.7.1 Real-Time
"Real-Time" overview mode allows display of the multiple PUE values
which are calculated by "Total Facility Energy" and "IT Equipment
Energy" preset by users. The page refreshes every 20 seconds, the user
could also click "Refresh" button to refresh the data immediately.
Figure5-33 : PUE information - Realtime
5.7.2 History
"History" overview mode allows display of the PUE data in historical
trend. Select the PUE option from the dropdown list of the PUE List,
choose the classification from the dropdown list of the Chart Type and
then specify the date from the dropdown list of the Date. The interface
is shown as below:
Page 53
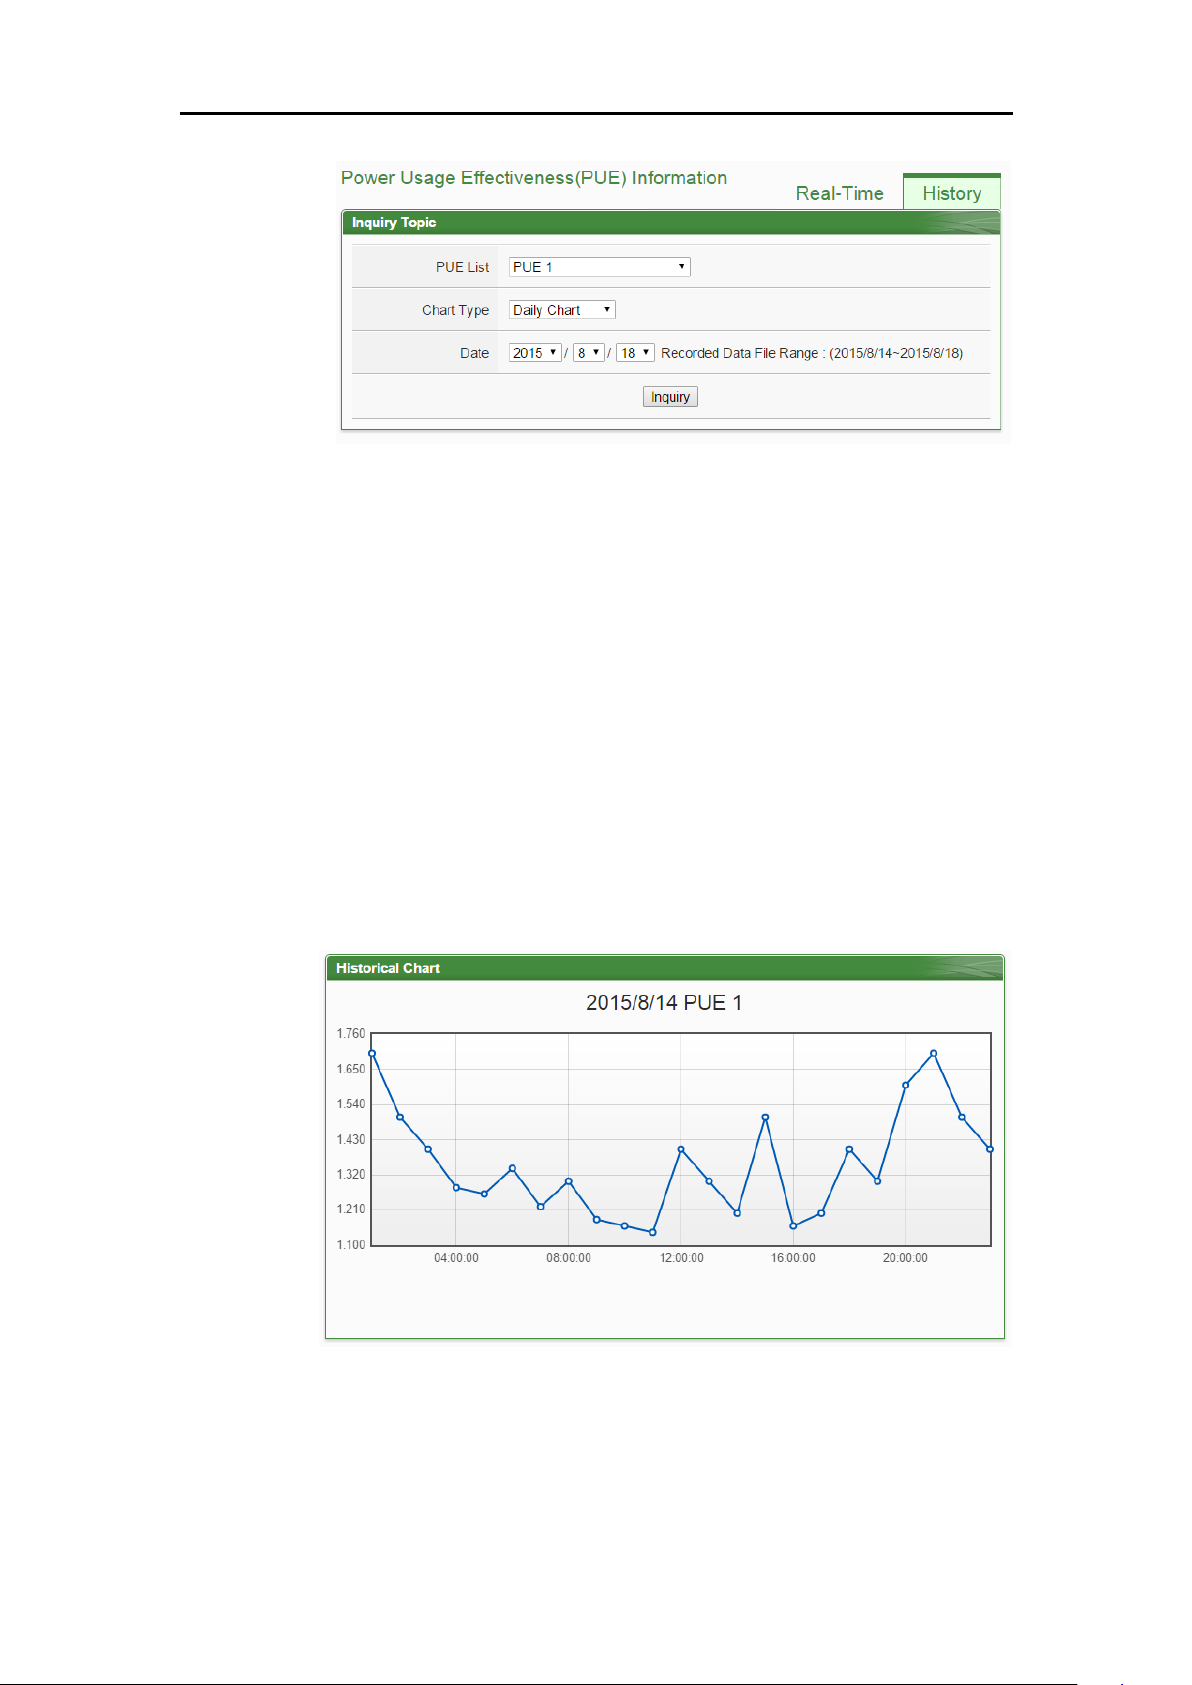
ICP DAS PMC/PMD Series User Manual
40
Figure5-34 : PUE information - History(1)
PUE List:All PUE options which are preset by users will be listed
on the dropdown list of the PUE List, if no PUE option is preset,
the inquiry operation will not be able to perform.
Chart Type:Provides Daily Chart and Monthly Chart.
Date:The dates which are available for PUE data retrieval will be
displayed. Please note, if no log file is available, the inquiry
operation will not be performed.
Click on “Inquiry” to display the PUE data historical statistic chart
(Figure 5-35) of the selected date range. If the selected date does not
contain the file or exceeds the date of the file storage range, a message
“No file exists” will be displayed.
Figure5-35 : PUE information - History(2)
Page 54
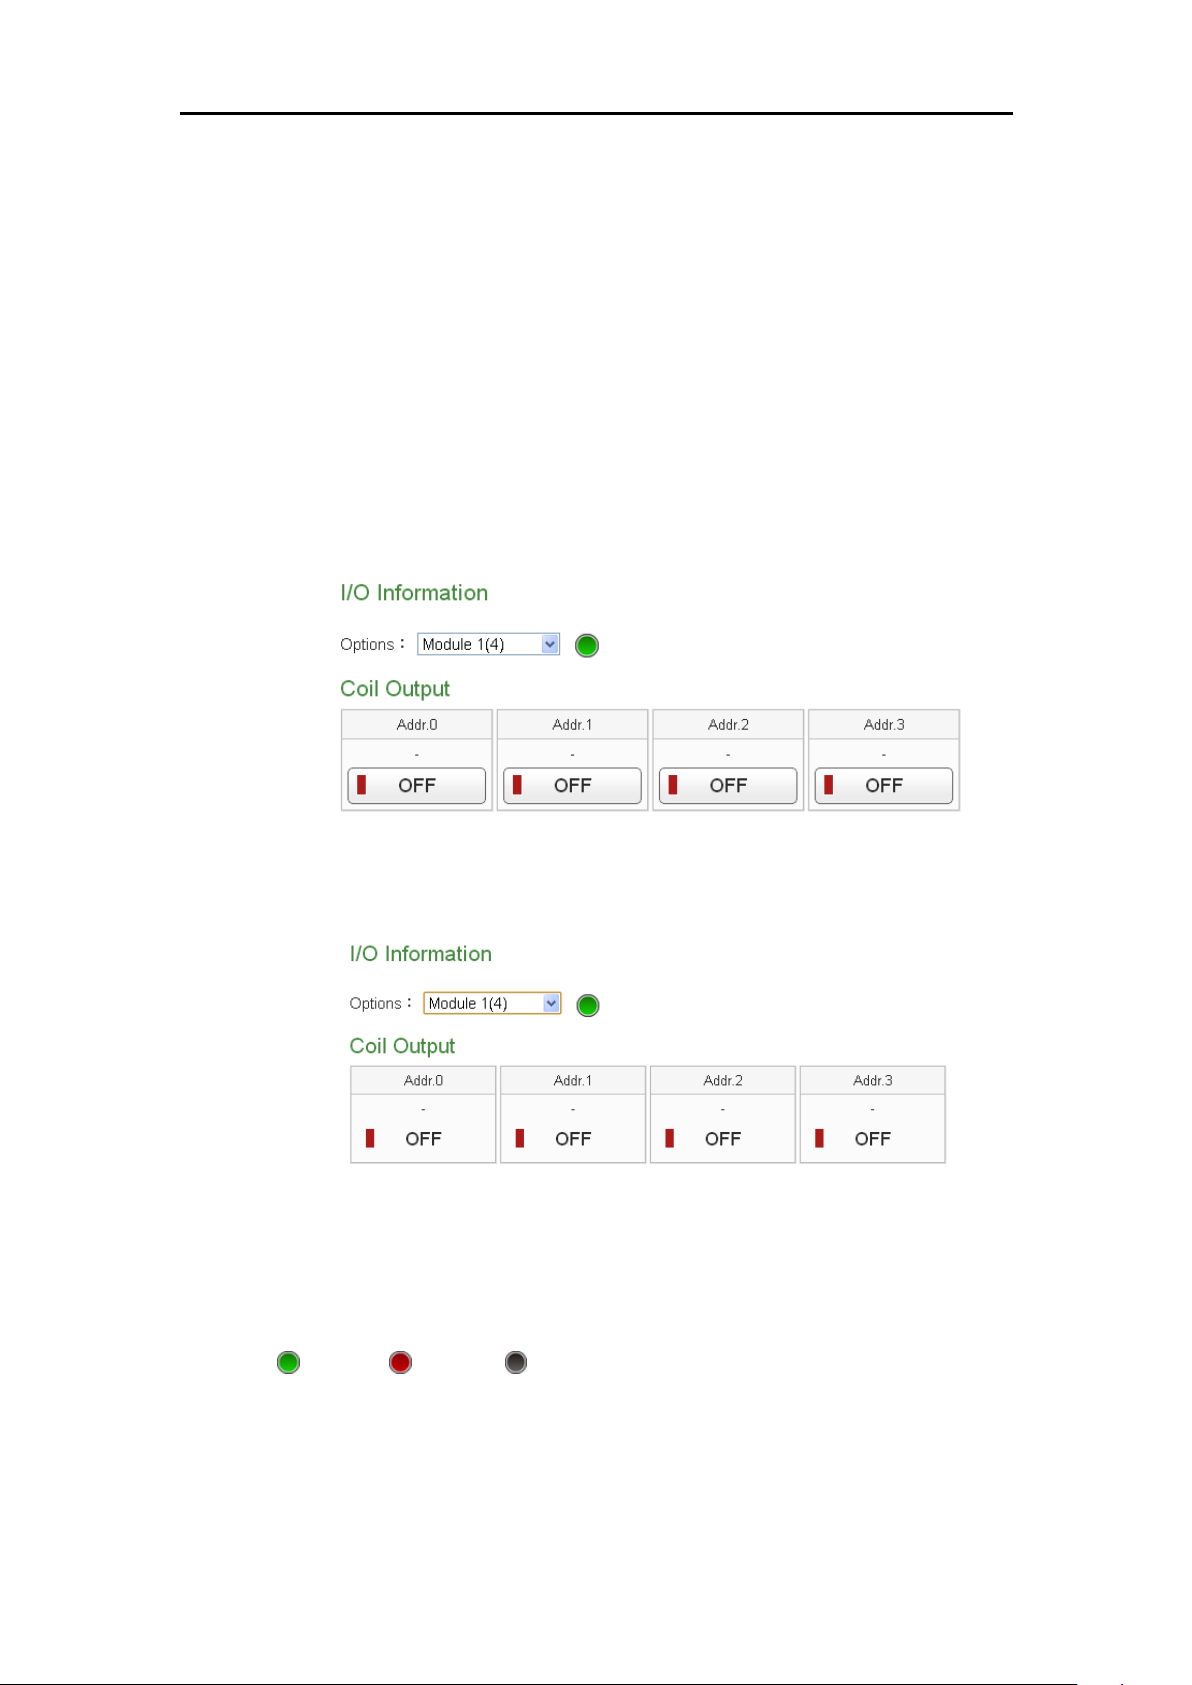
ICP DAS PMC/PMD Series User Manual
41
5.8 I/O Information
The I/O Information page will display the real-time values of the Internal
Registers of the PMC/PMD and the real-time I/O channels values of all I/O
modules (including XW Board, M-7000 or DL Modules, Modbus RTU
Modules and Modbus TCP modules) that are connected to the PMC/PMD.
If login as the Administrator, it allows to modify the values of Internal
Registers or output values of the DO/AO channels (Figure 5-36). If login as
a general user, they are allowed to view the values of Internal Registers and
the I/O channels (Figure 5-37) only.
Figure5-36 : I/O Information(login as Administrator)
Figure5-37 : I/O Information(login as General User)
The graphic indicator on the right side of the I/O modules will reveal the
connection status of the module, the graphic indicators are as follow:
: Online : Offline : Connecting
Page 55
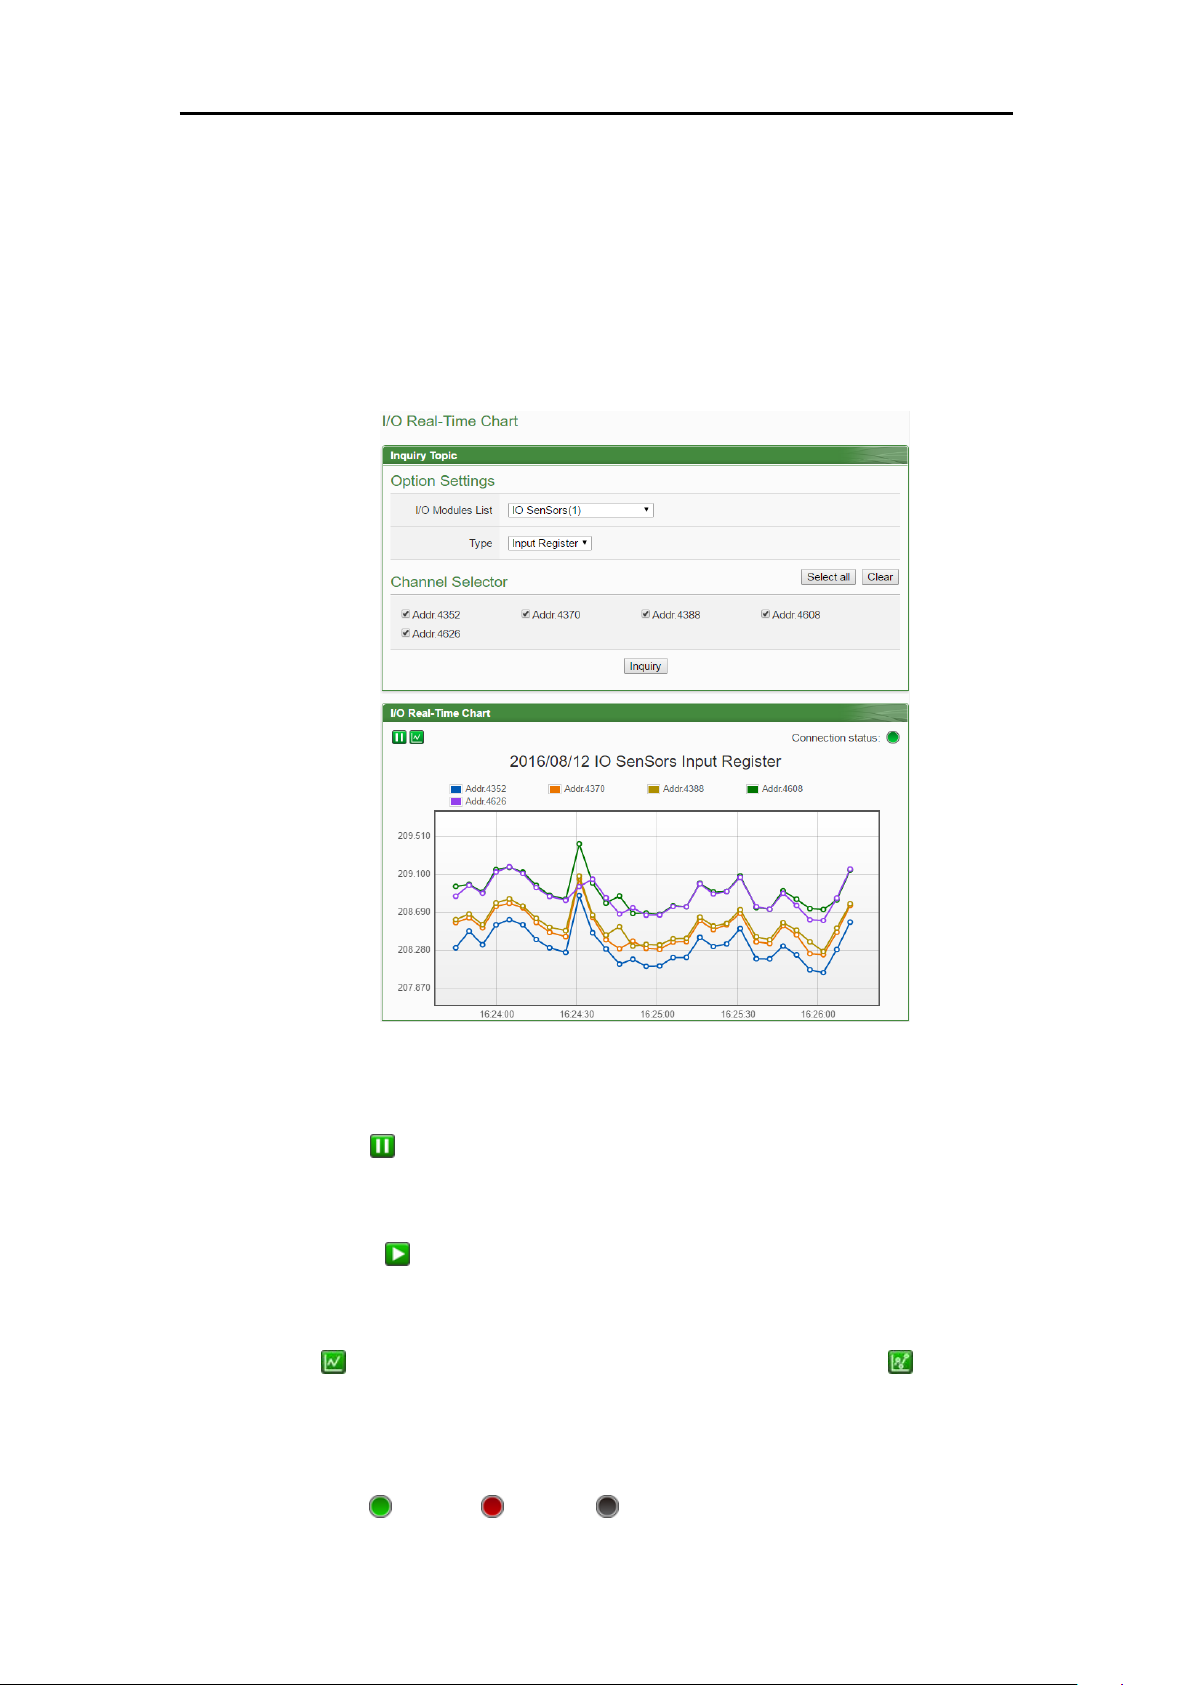
ICP DAS PMC/PMD Series User Manual
42
5.9 I/O Realtime Chart
I/O Realtime Chart allows display of real-time channel data of the I/O
module in trend style. Select the I/O module from the dropdown list of the
"I/O module List", the classification from the dropdown list of the "Type"
field, the I/O channel from the "Channel Selector" field then click on
“Inquiry” button, it will show the chart. The interface is shown as below:
Figure5-38 : I/O Realtime Chart
There are three function icons on the upper area of the I/O Realtime Chart:
The icon allows to pause the update of the chart, only the data
within the 25 minutes will be displayed. The user could click and drag
on the chart and move forward or backward to show desired time zone.
Click to resume the update of the chart. To view the data on a
specific marker, move the mouse over the marker to display the data
value.
icon allows to hide the markers on the chart; click on button to
show the markers on the chart.
“Connection Status” will reveal the connection status of the I/O module,
the graphic indicators are shown as follow:
: Online : Offline : Connecting
Page 56
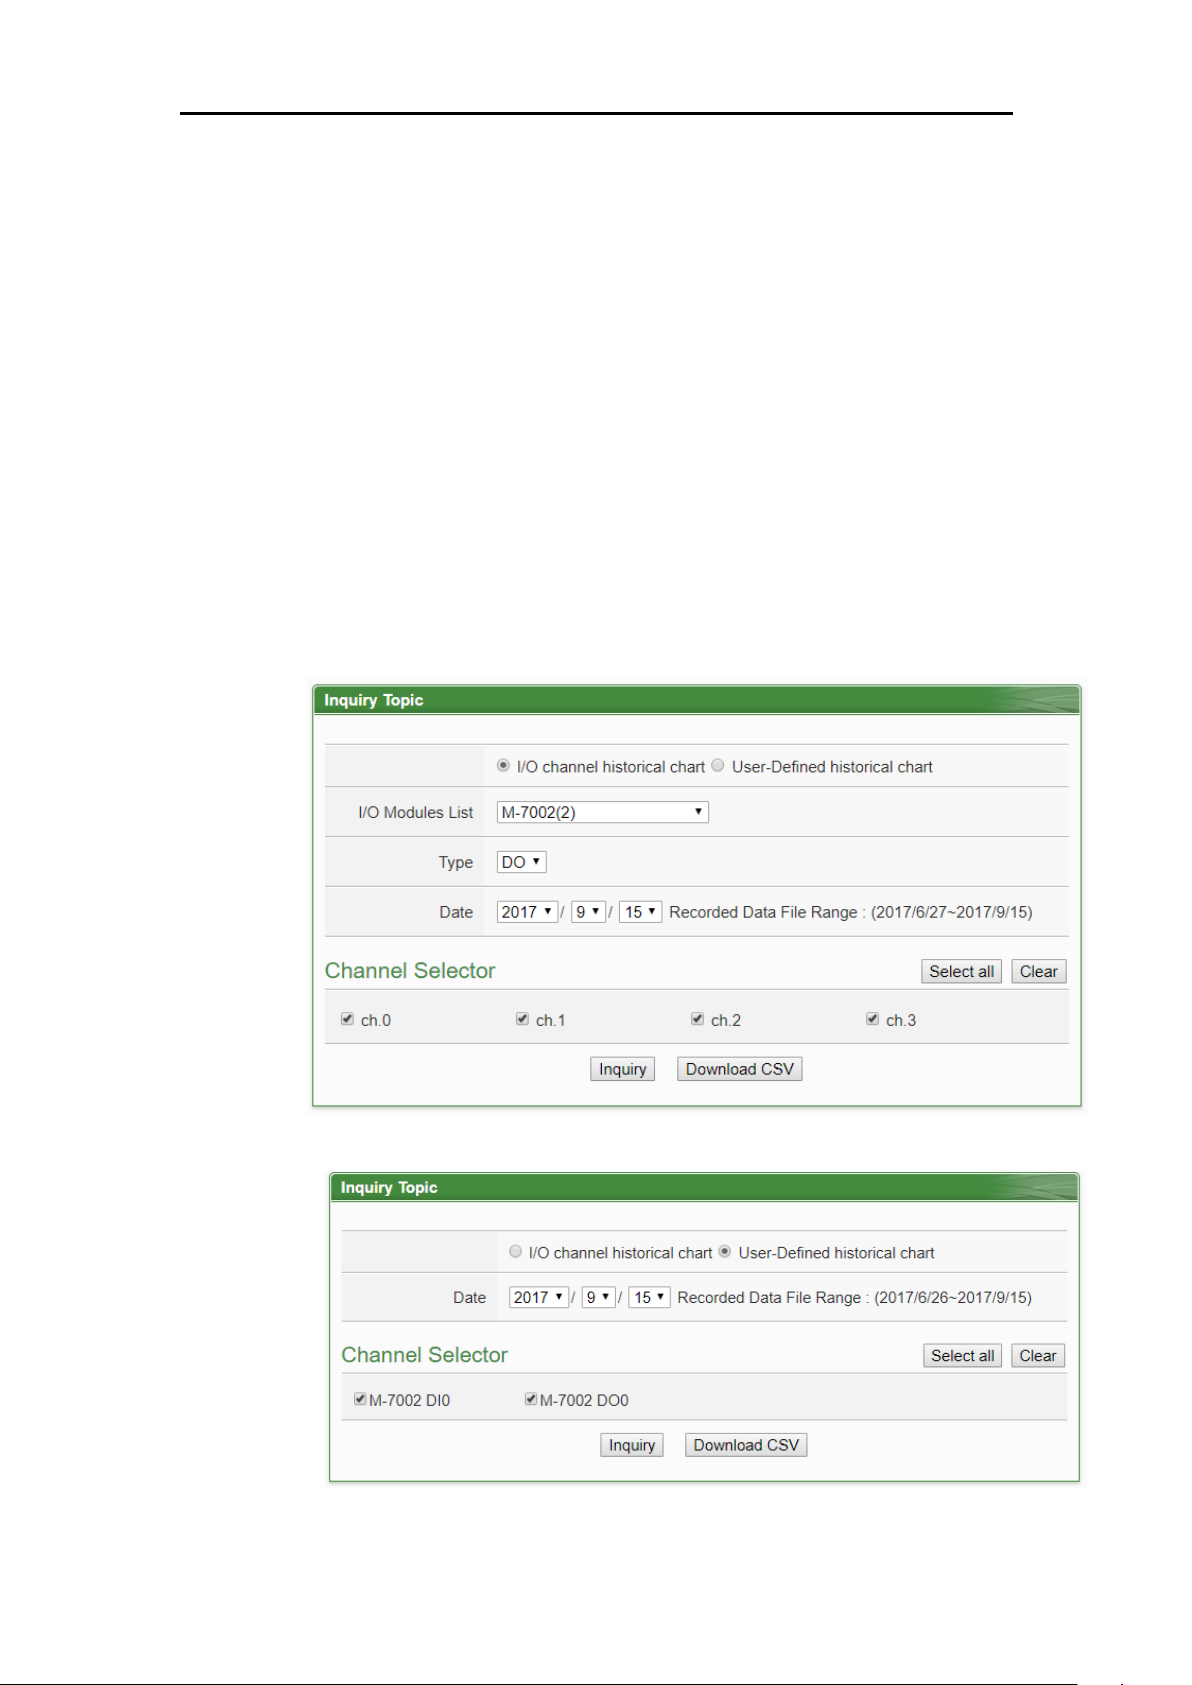
ICP DAS PMC/PMD Series User Manual
43
5.10 I/O Historical Chart
I/O Historical Chart allows display of I/O channel historical data of the
Data Logger in trend style. Specify the date from the dropdown list of
the "Date" field, select the I/O channel from the "Channel Selector" field,
then click on “Inquiry” button, it will show the chart. The interface is
shown as below. User also can click the "Download CSV" button to
download the csv file of the Data Logger for the specify date. (Using
PMC-52xx/PMD as an example):
Please Note:The PMC-5151’s I/O historical data is from User-Defined
Data Logger. The PMC-52xx/PMD’s I/O historical data is from I/O Data
Logger and User-Defined Data Logger.
Figure5-39 : I/O Channel Historical Chart
Figure5-40 : User-Defined Historical Chart
Page 57
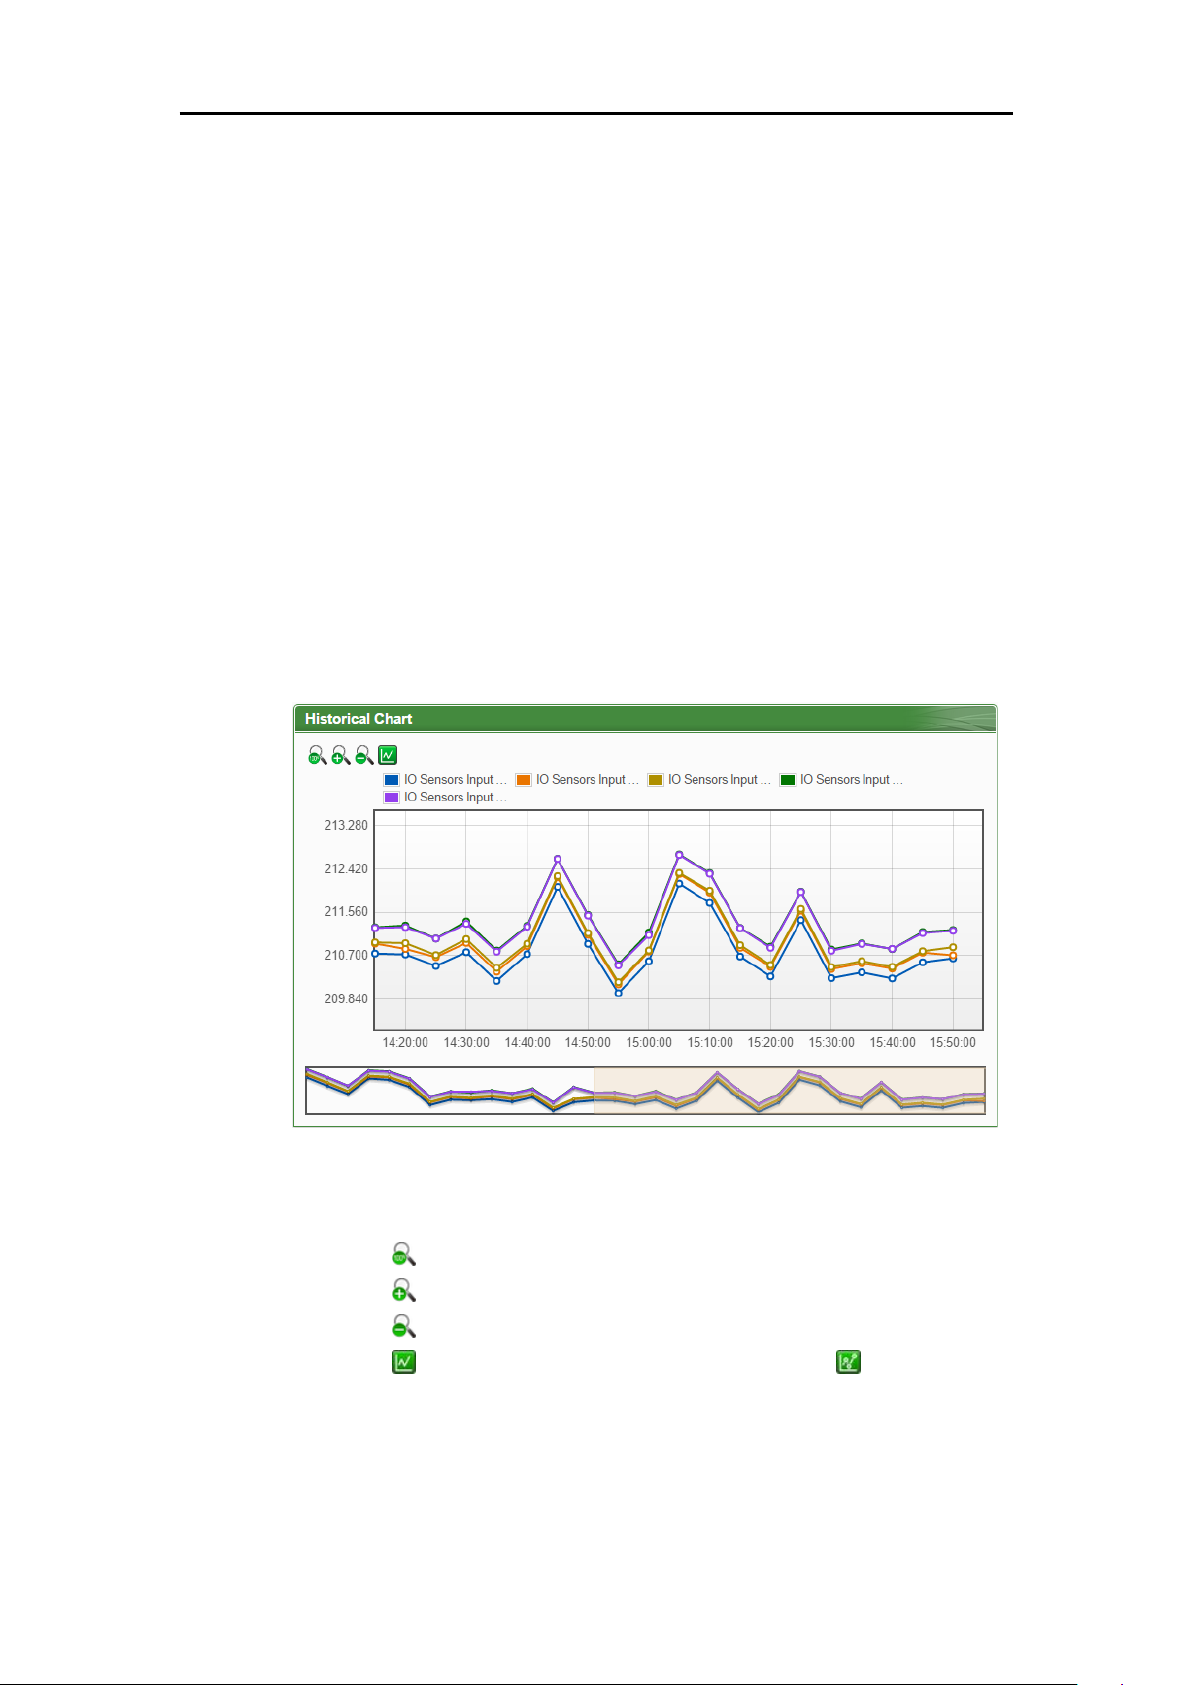
ICP DAS PMC/PMD Series User Manual
44
Date
The dates that are available for channel data retrieval will be
displayed. Please note, if no log file is available, the inquiry operation
will not be performed.
Channel Selector
All Channel of the User-Defined Data Logger will be list on the
dropdown list of the "Channel Selector" List, if there is no any
channel in the User-Defined Data Logger, the inquiry operation will
not be able to perform
Click on “Inquiry” to display the channel data historical statistic chart
(Figure 5-40) of the selected date. If the selected date does not contain
the file or exceeds the date of the file storage range, a message “No file
exists” will be displayed. The Historical Data Chart is shown as below:
Figure5-41 : I/O Historical Data Chart
On the upper left of the Historical Chart, there are 4 function icons.
Set the Historical Chart to be default status.
Zoom in the Y-axis of the Historical Chart
Zoom out the Y-axis of the Historical Chart
Hide the markers on the Historical Chart. Show the
markers on the Historical Chart
Page 58
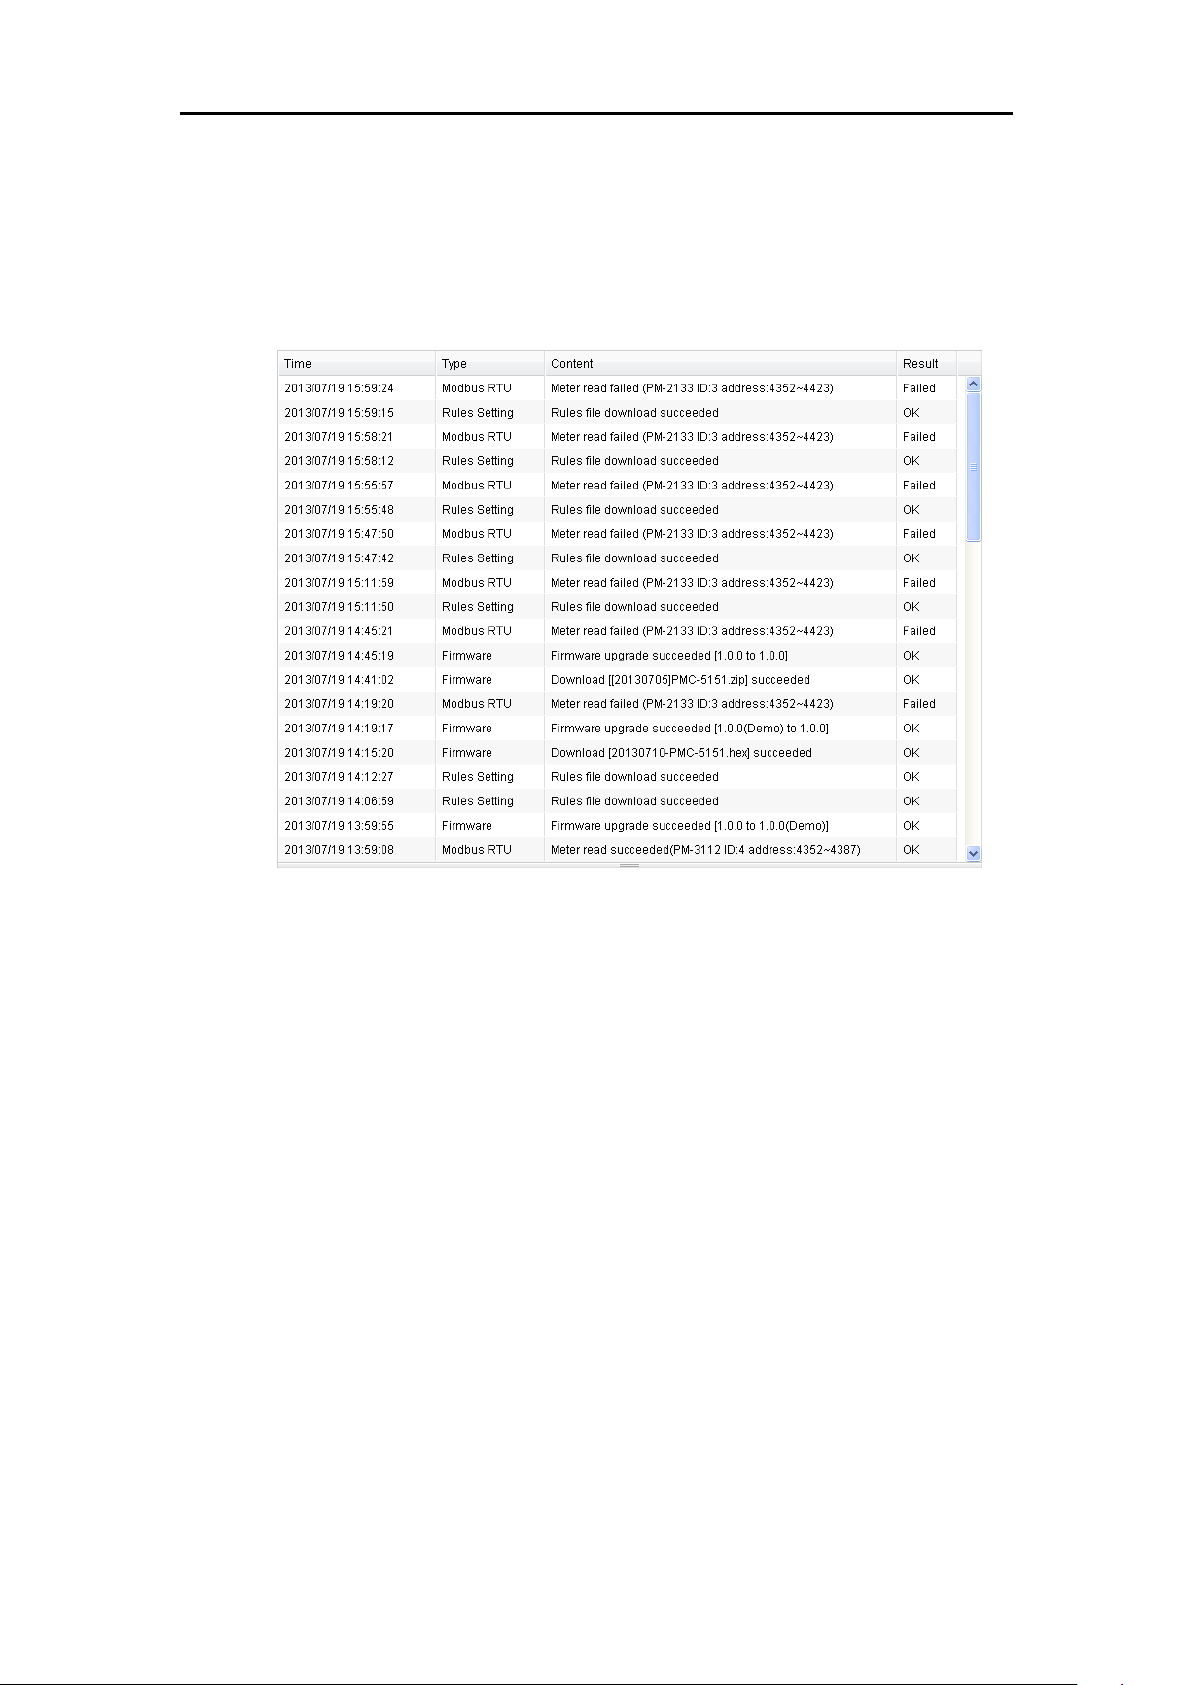
ICP DAS PMC/PMD Series User Manual
45
5.11 Event Log
The Event Log page allows to view the list of system event logger
information when login as the Administrator.
Figure5-42 : Event Log information display
The Event Log record including the following information:
The PMC/PMD failed to read data of the power meter(s).
Change the network settings on the PMC/PMD.
Save settings to the PMC/PMD.
Change the system time setting.
Reset accumulated power data of the power meter to 0.
Transfer Data Logger files to FTP server succeeded or failed.
When performing firmware upgrade, record the transfer of the
firmware file to the PMC/PMD is succeeded or failed.
The upgrade of the firmware is succeeded or failed.
Page 59
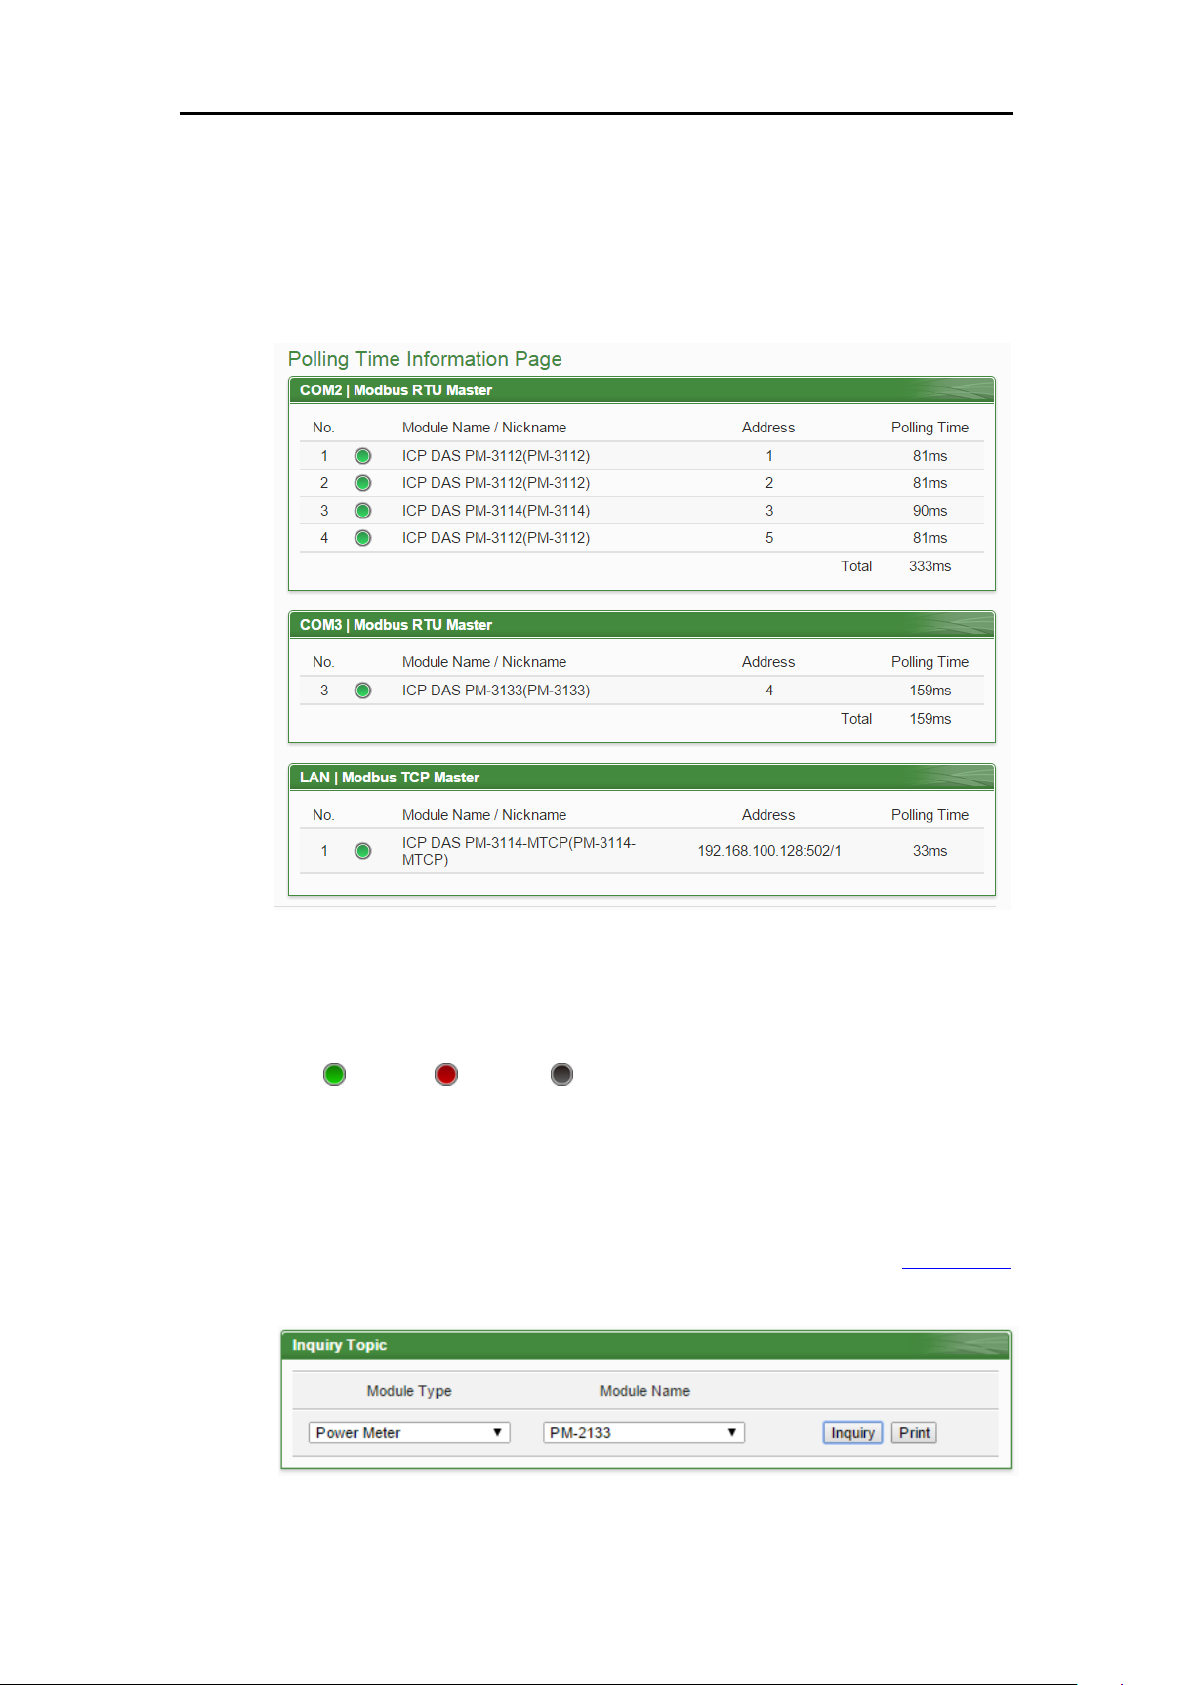
ICP DAS PMC/PMD Series User Manual
46
5.12 Polling Time Information
Users can check the polling time of each modules and power meters which
are connected with PMC/PMD currently. The "Polling Time Information
Page" is as below:
The graphic indicator on the right side of the No. will reveal the connection
status of the module, the graphic indicators are as follow:
: Online : Offline : Connecting
5.13 Modbus Table Information
The user can query and print the detailed modbus address information of
the modules which are connected to PMC/PMD. Please refer to Appendix I
for more detailed Modbus address description.
Figure5-43 : Polling Time Information
Figure5-44 : The Interface of Modbus Table Information
Page 60
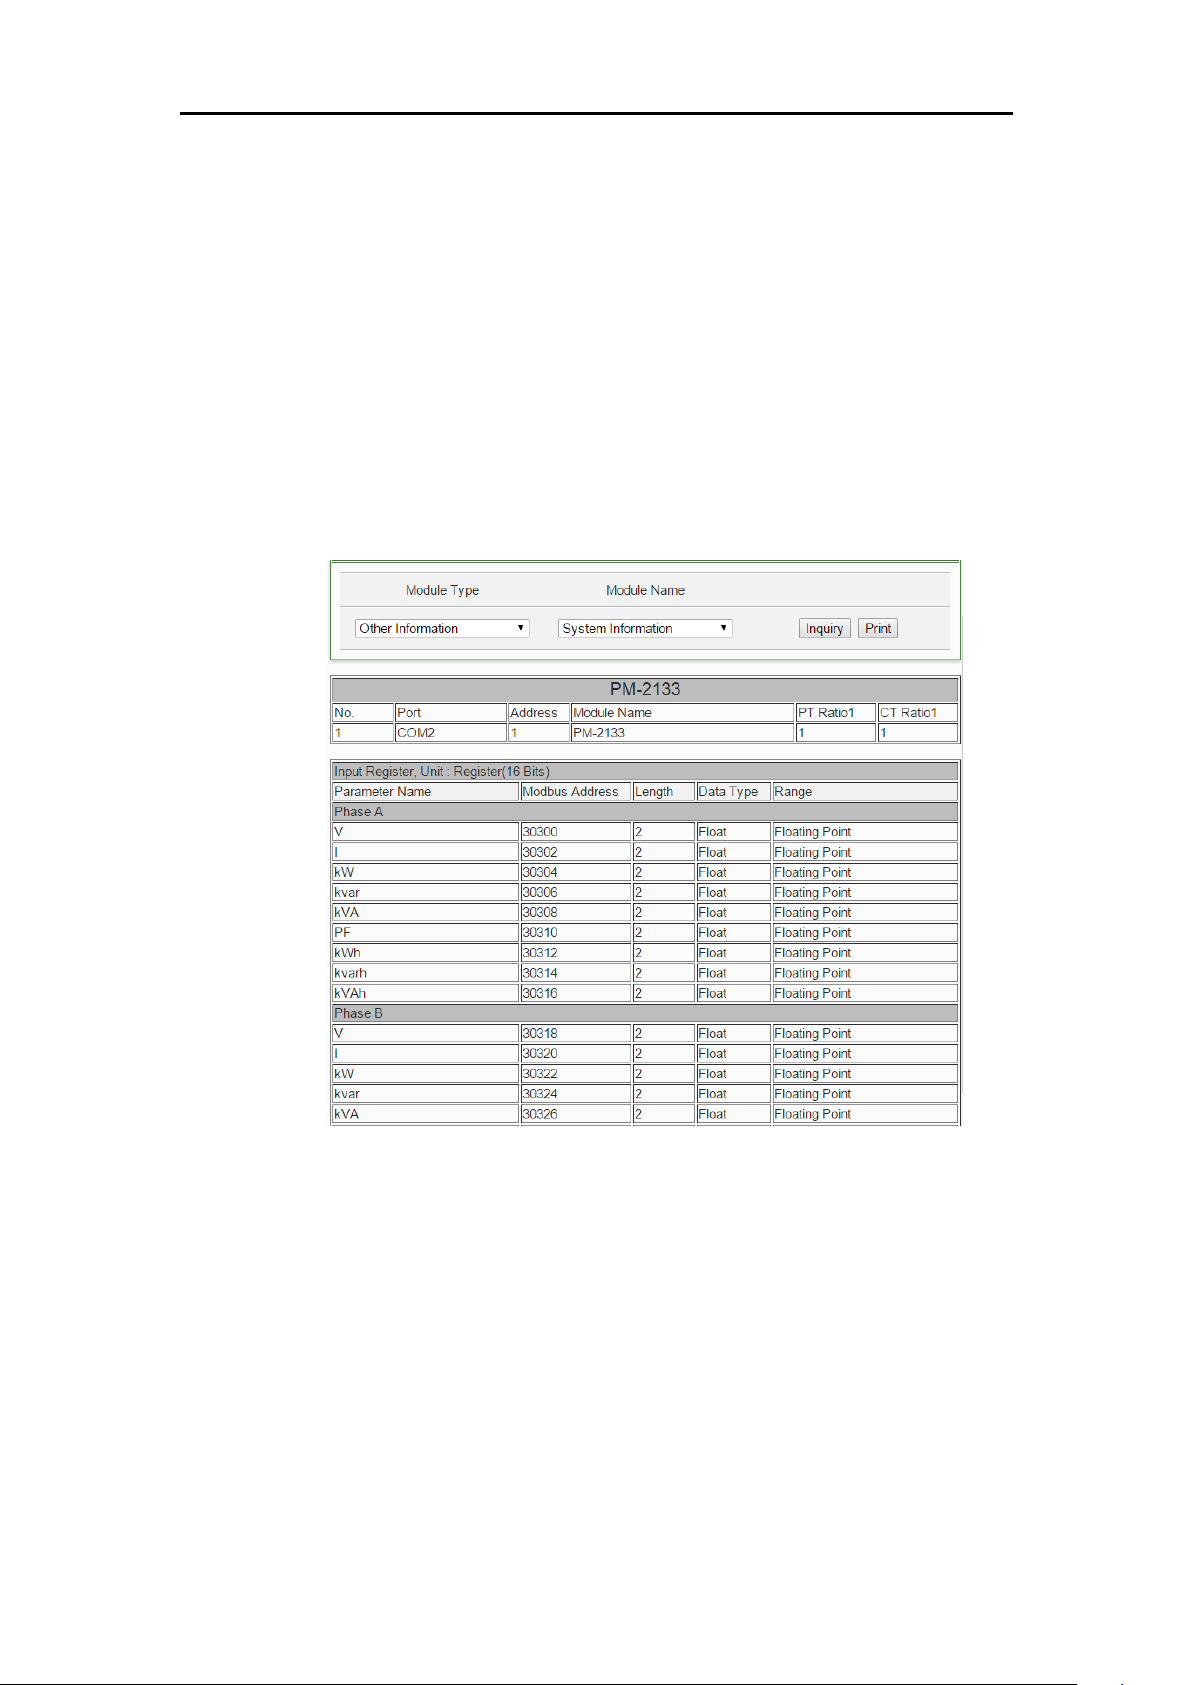
ICP DAS PMC/PMD Series User Manual
47
Module Type
“Module Type” includes 4 options : Power Meter, I/O Module,
XW-Board, XV-Board and Other Information
Module Name
According to the selected “Module Type” option, the corresponding
module name or information of “Module Name” will be listed.
Click on “Inquiry” to display the Modbus table information of the selected
module. The users can click on the "Print" button to print this Modbus
address table.
Figure5-45 : Inquiry result of Modbus Table Information
5.14 UID Information
Users can check the UID information of each power meters which are
connected with PMC/PMD currently. The "UID Information" page is as
below:
Page 61
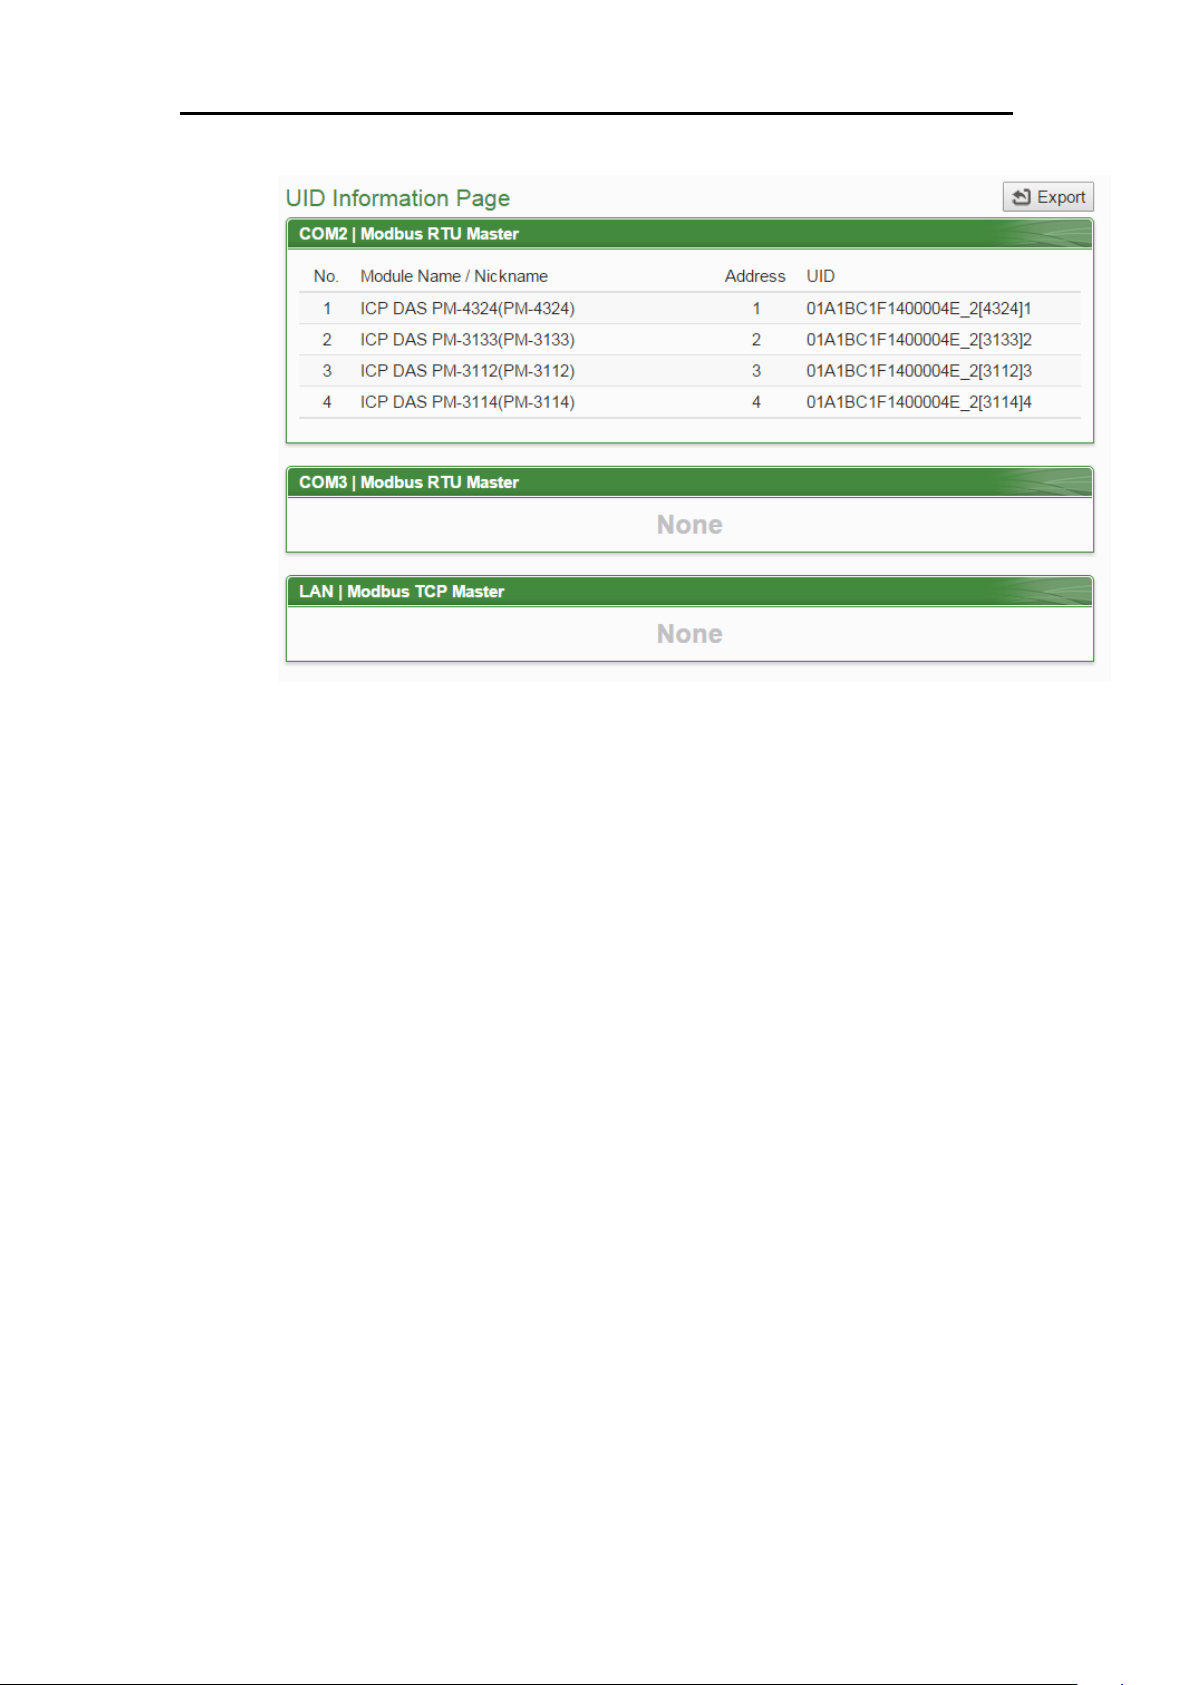
ICP DAS PMC/PMD Series User Manual
48
Figure5-46 : Power Meter UID Information Page
Users can click "Export" button to export the UID information as CSV file.
Page 62
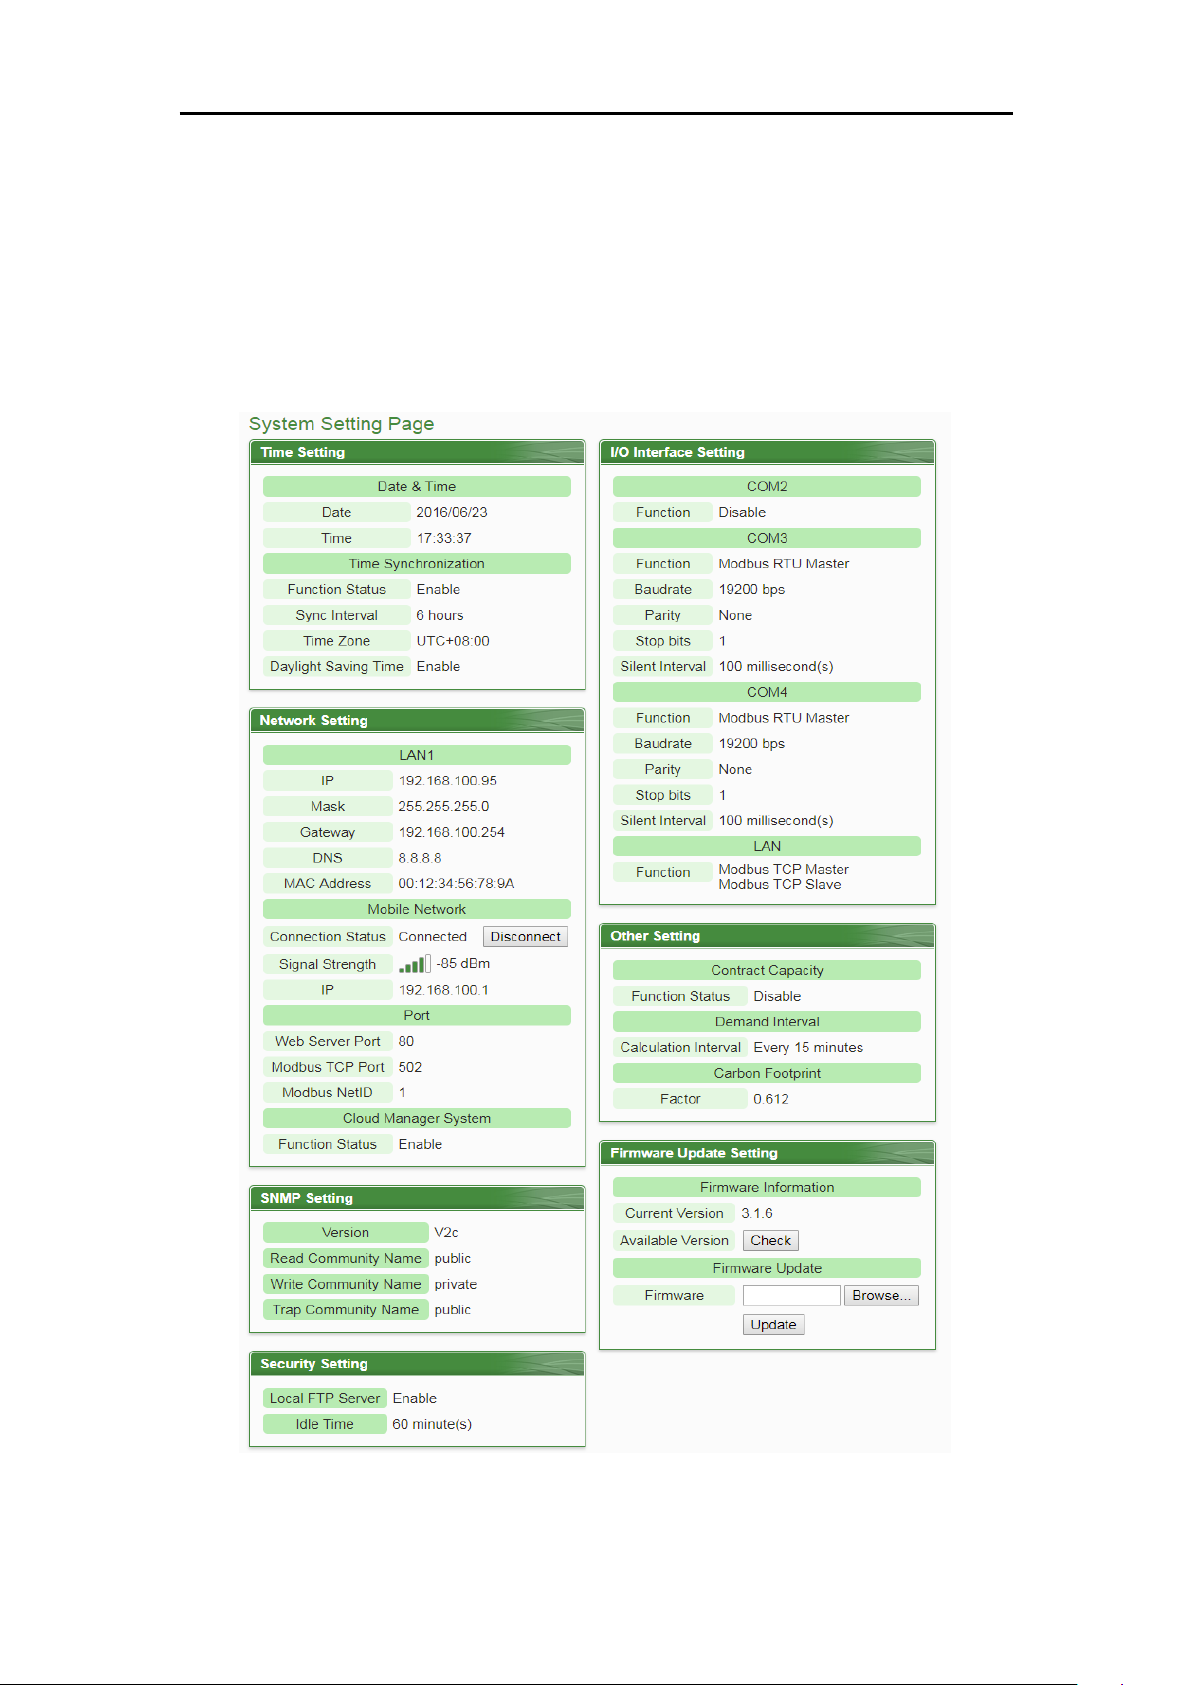
ICP DAS PMC/PMD Series User Manual
49
6 System Setting
System Setting includes 6 options: Time Setting, Network Setting, SNMP Setting,
Security Setting, I/O Interface Setting, Power Meter Group Setting and Other Setting.
When you get into the System Setting page, the system settings information of this
PMC/PMD will be displayed, as shown below:
Figure6-1 : System Setting Overview Page
The user could view system setting information of PMC/PMD or perform firmware
Page 63
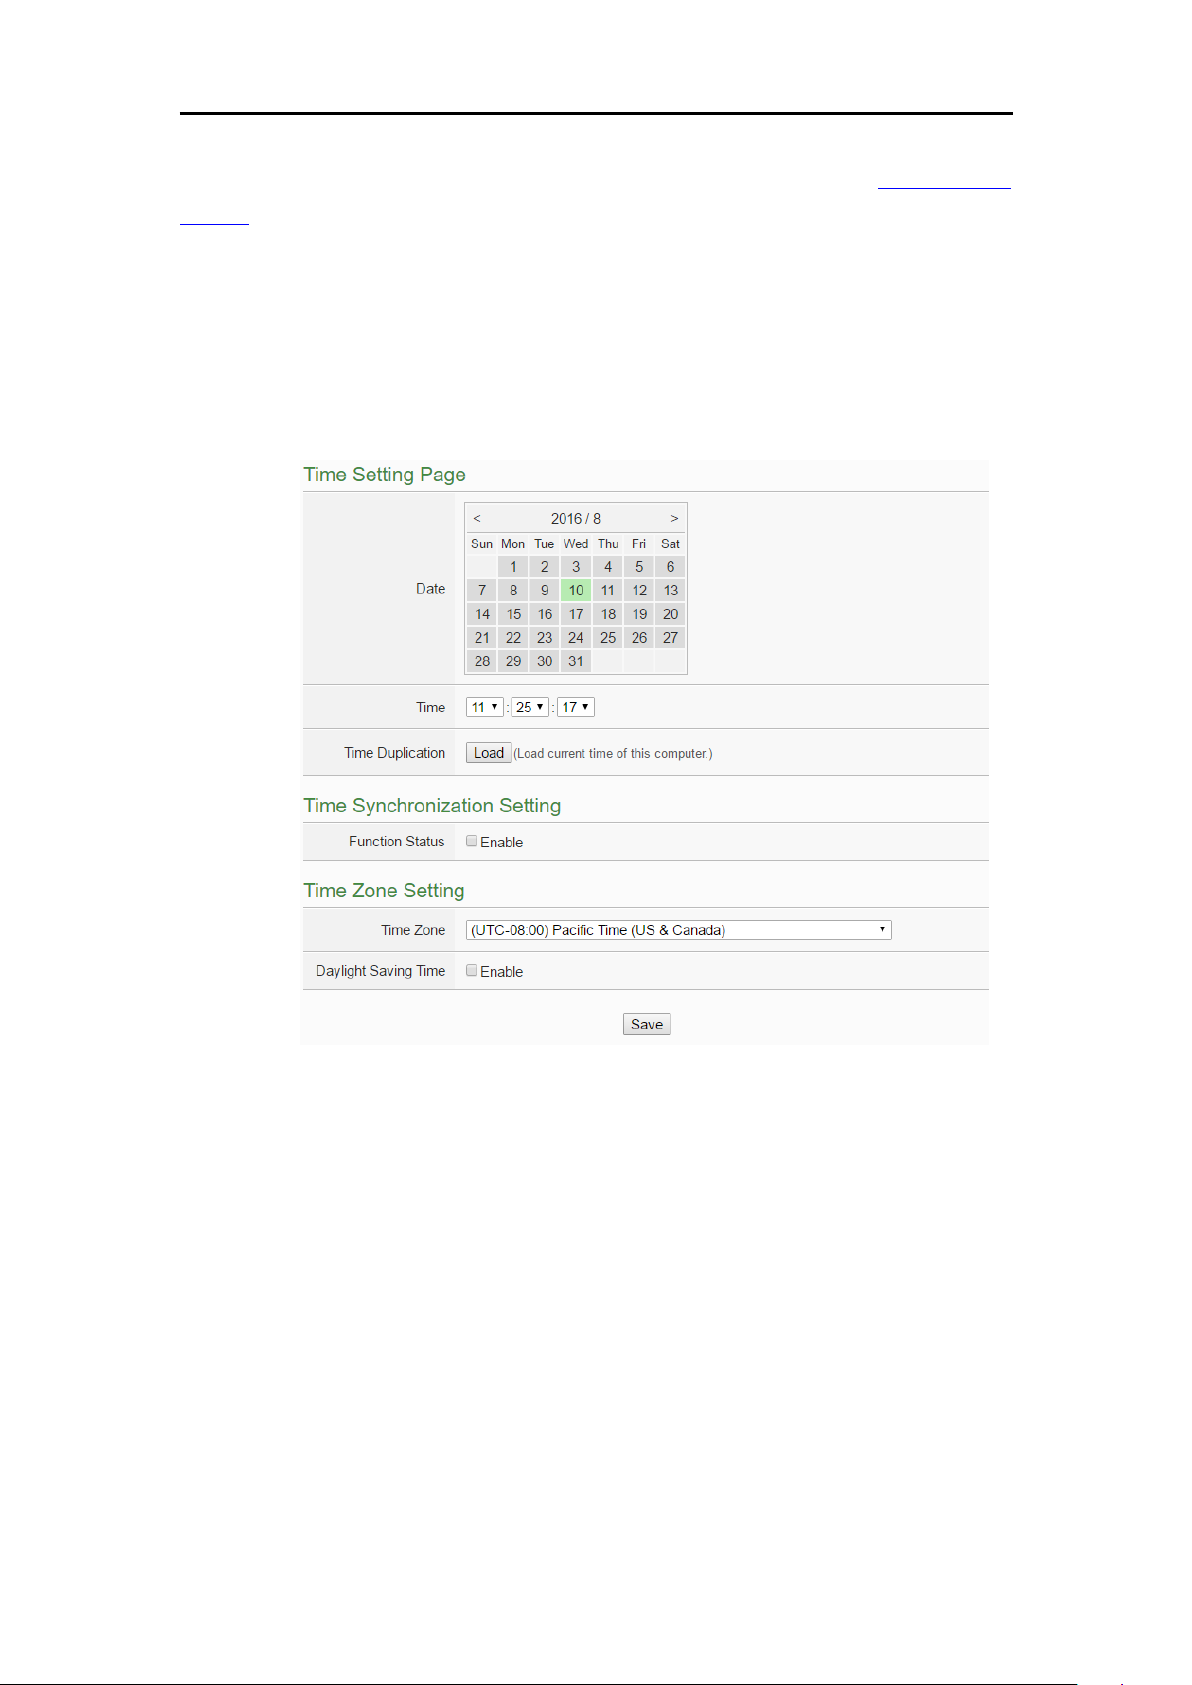
ICP DAS PMC/PMD Series User Manual
50
update on this page. For firmware update operations, please refer to 6.9 Firmware
Update.
6.1 Time Setting
On the Time Setting page, it allows to set the time of PMC/PMD and Time
Synchronization function. The setting interface is as below:
Figure6-2 : Time Setting Page
When get into this page, the system will read and display current time of the
PMC/PMD. To modify the system time of PMC/PMD, set up the date and
time on the “Time Setting page section” and then click “save” to complete
the settings. The user could click on “Load” in the “Time Duplication” to
synchronize the system time of the computer where the browser located and
the system time of the PMC/PMD. The PMC/PMD also provides SNTP
Time Server function that allows to set up Time Synchronization to sync the
clock through network. The following figure illustrates the set up interface:
Page 64
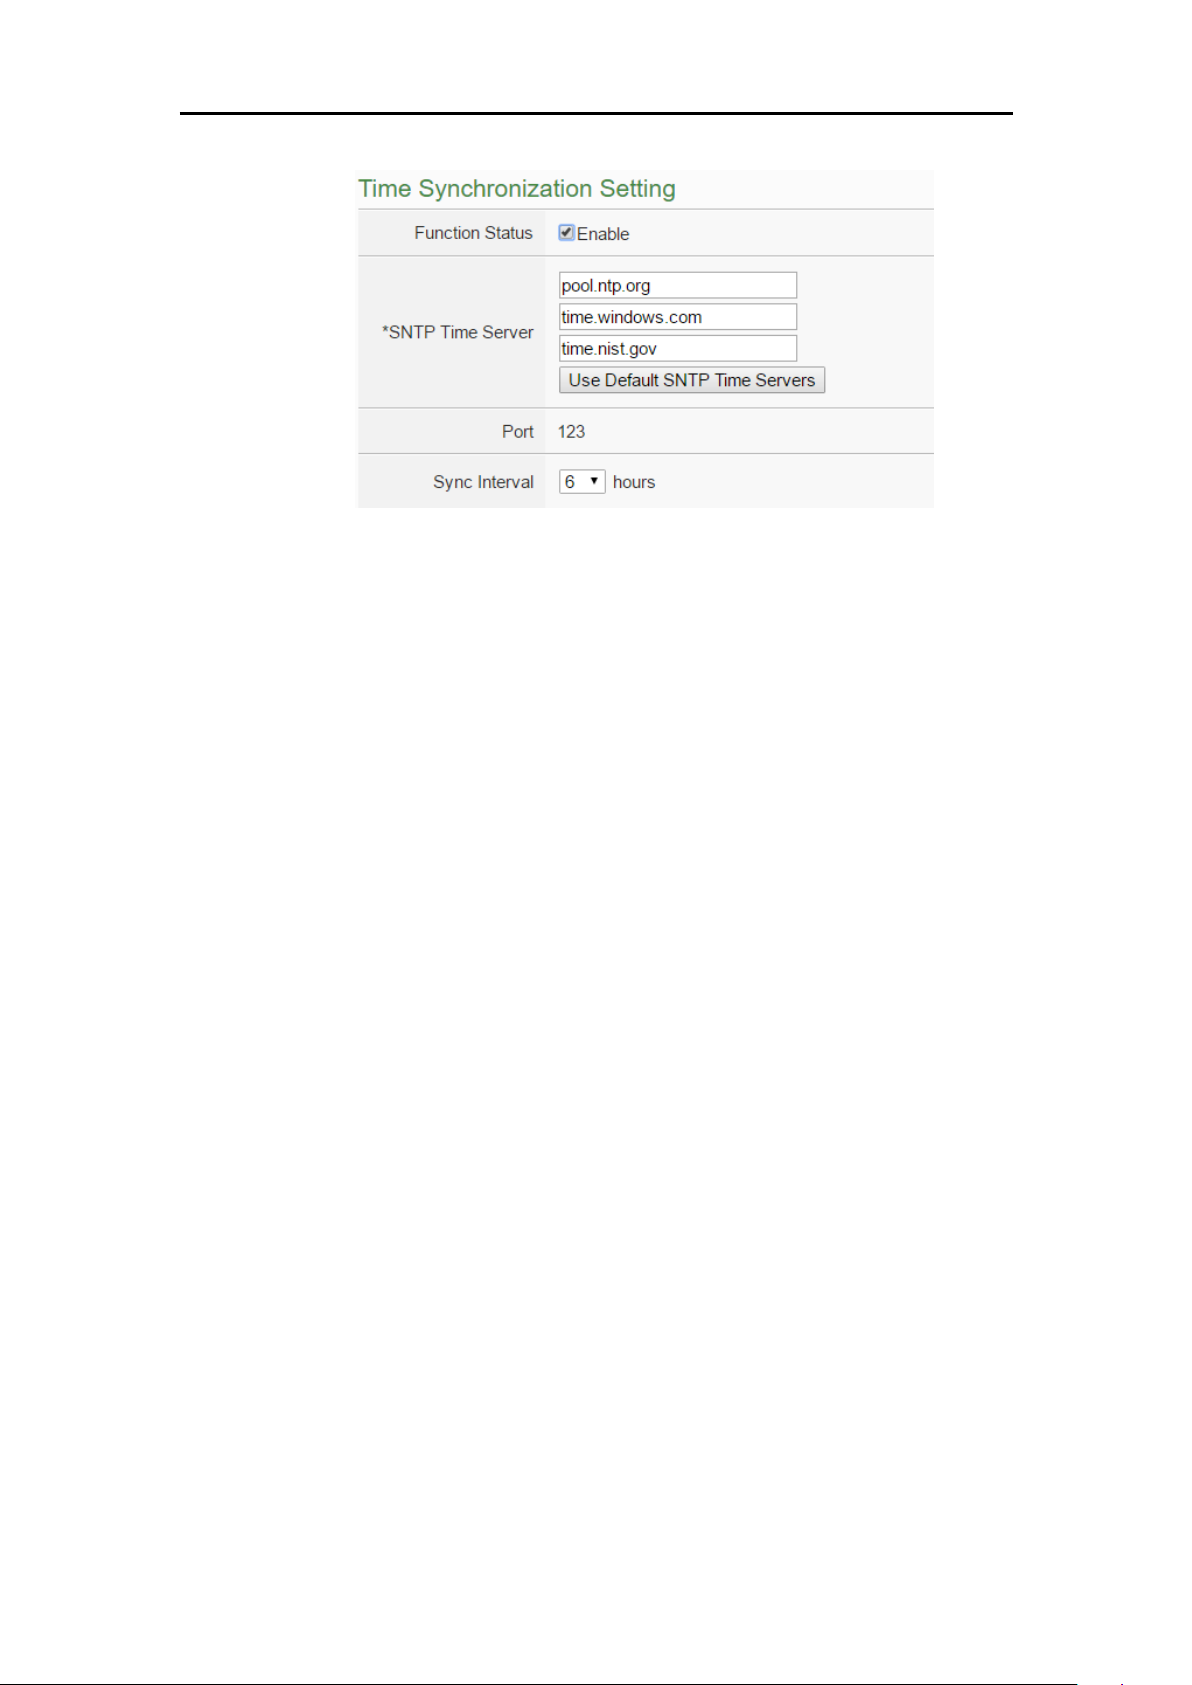
ICP DAS PMC/PMD Series User Manual
51
Follow the steps below to set up Time Synchronization Setting:
i. In the “Function Status” field, check “Enable” to enable the Time
Figure6-3 : Time Synchronization Setting
Synchronization function.
ii. In the “SNTP Time Server” field, input the IP address or domain name of
the SNTP Time Server. There are 3 default SNTP Time Servers, the user
could modify the address to use other server. Click “Use Default SNTP
Time Servers” to restore the default Time Server settings.
iii. The default Port number setting is “123”, currently it is not allowed to be
modified.
iv. In the “Sync Interval” field, select the time interval to specify how often
will the PMC/PMD automatically connect to SNTP time server for time
synchronization through the network. The user could set the time
interval to be 6, 12, or 24 hours.
v. After all settings are completed, click “Save” button to save the changes.
In addition, users can select the time zone of the PMC/PMD location from
the dropdown list in the “Time Zone” field, and enable the daylight saving
time function in the “Daylight Saving Time” field if required.
Page 65
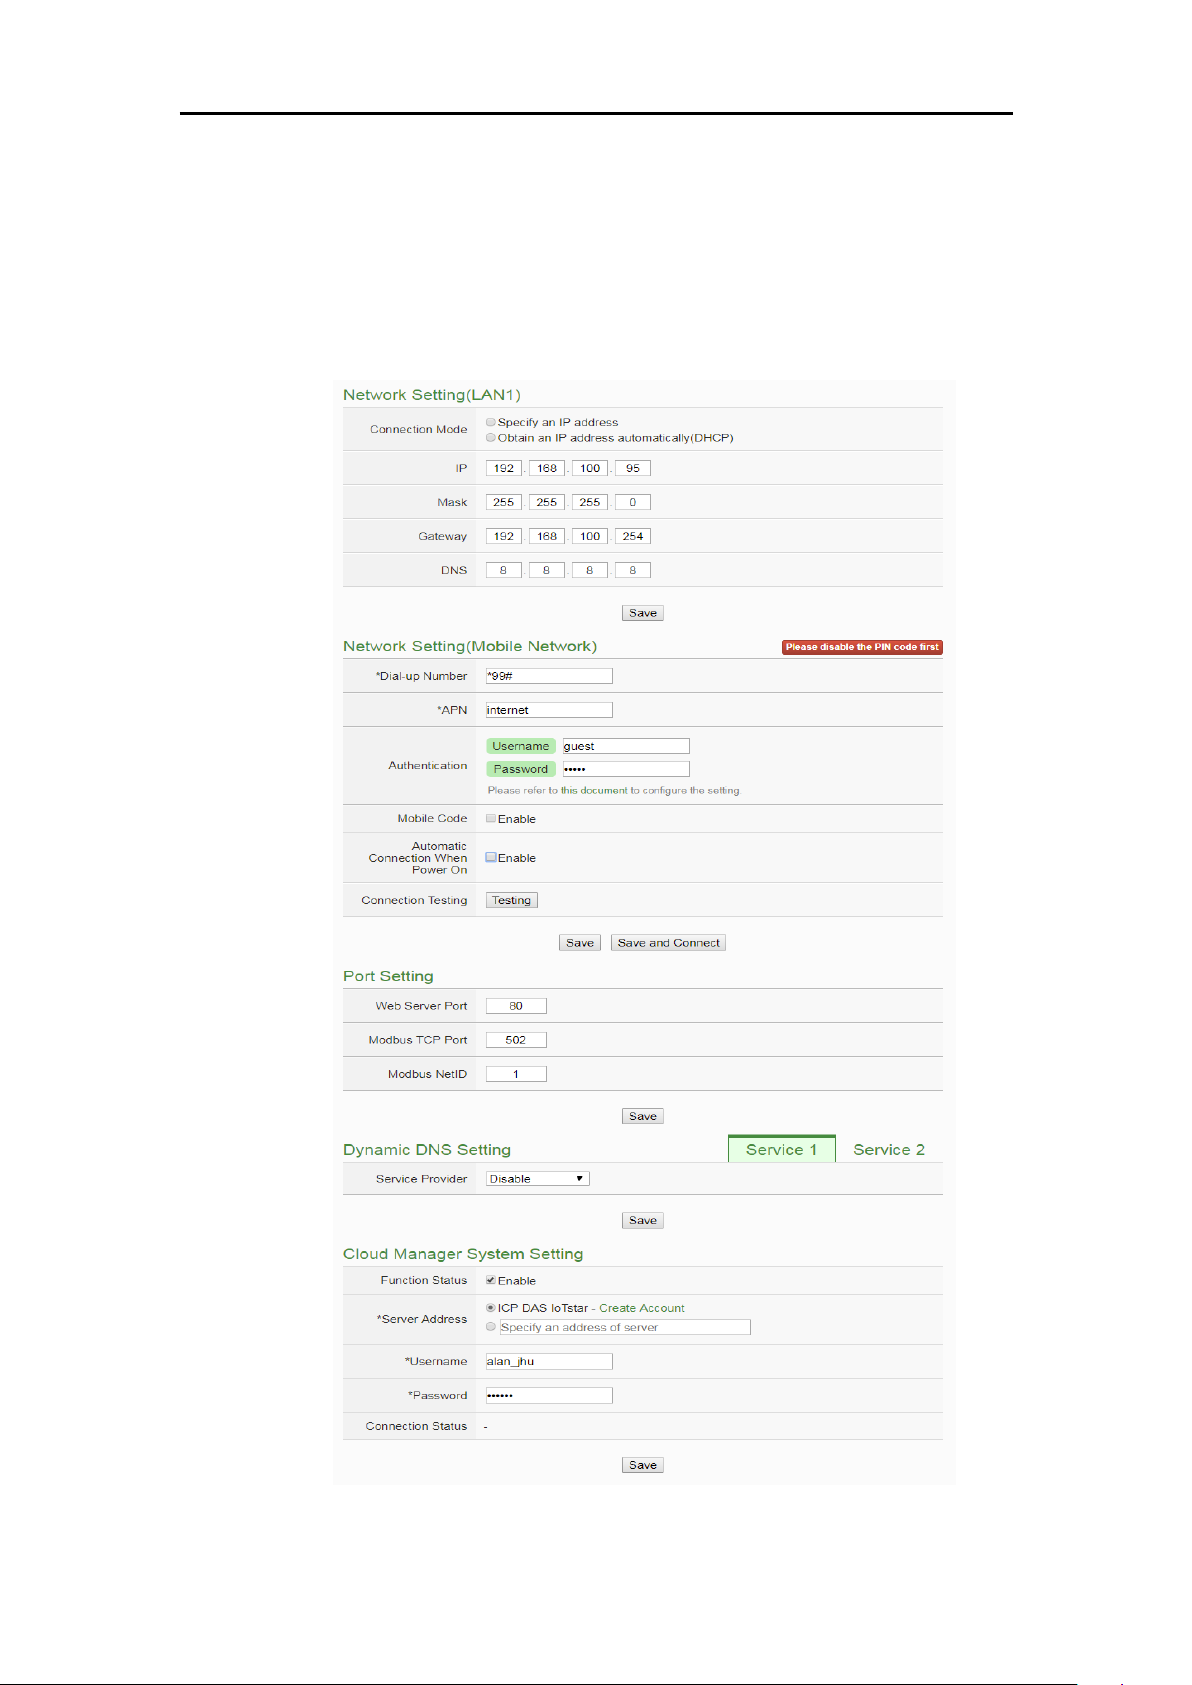
ICP DAS PMC/PMD Series User Manual
52
6.2 Network Setting
Network Setting allows making a change to network configuration, web
server port or Modbus settings on the PMC/PMD. The following figure
illustrates the configuration interface. Please Note:PMC-52xx/PMD series
only support LAN1 setting.
Figure6-4 : PMC-52xx/PMD Network Setting Page
Page 66
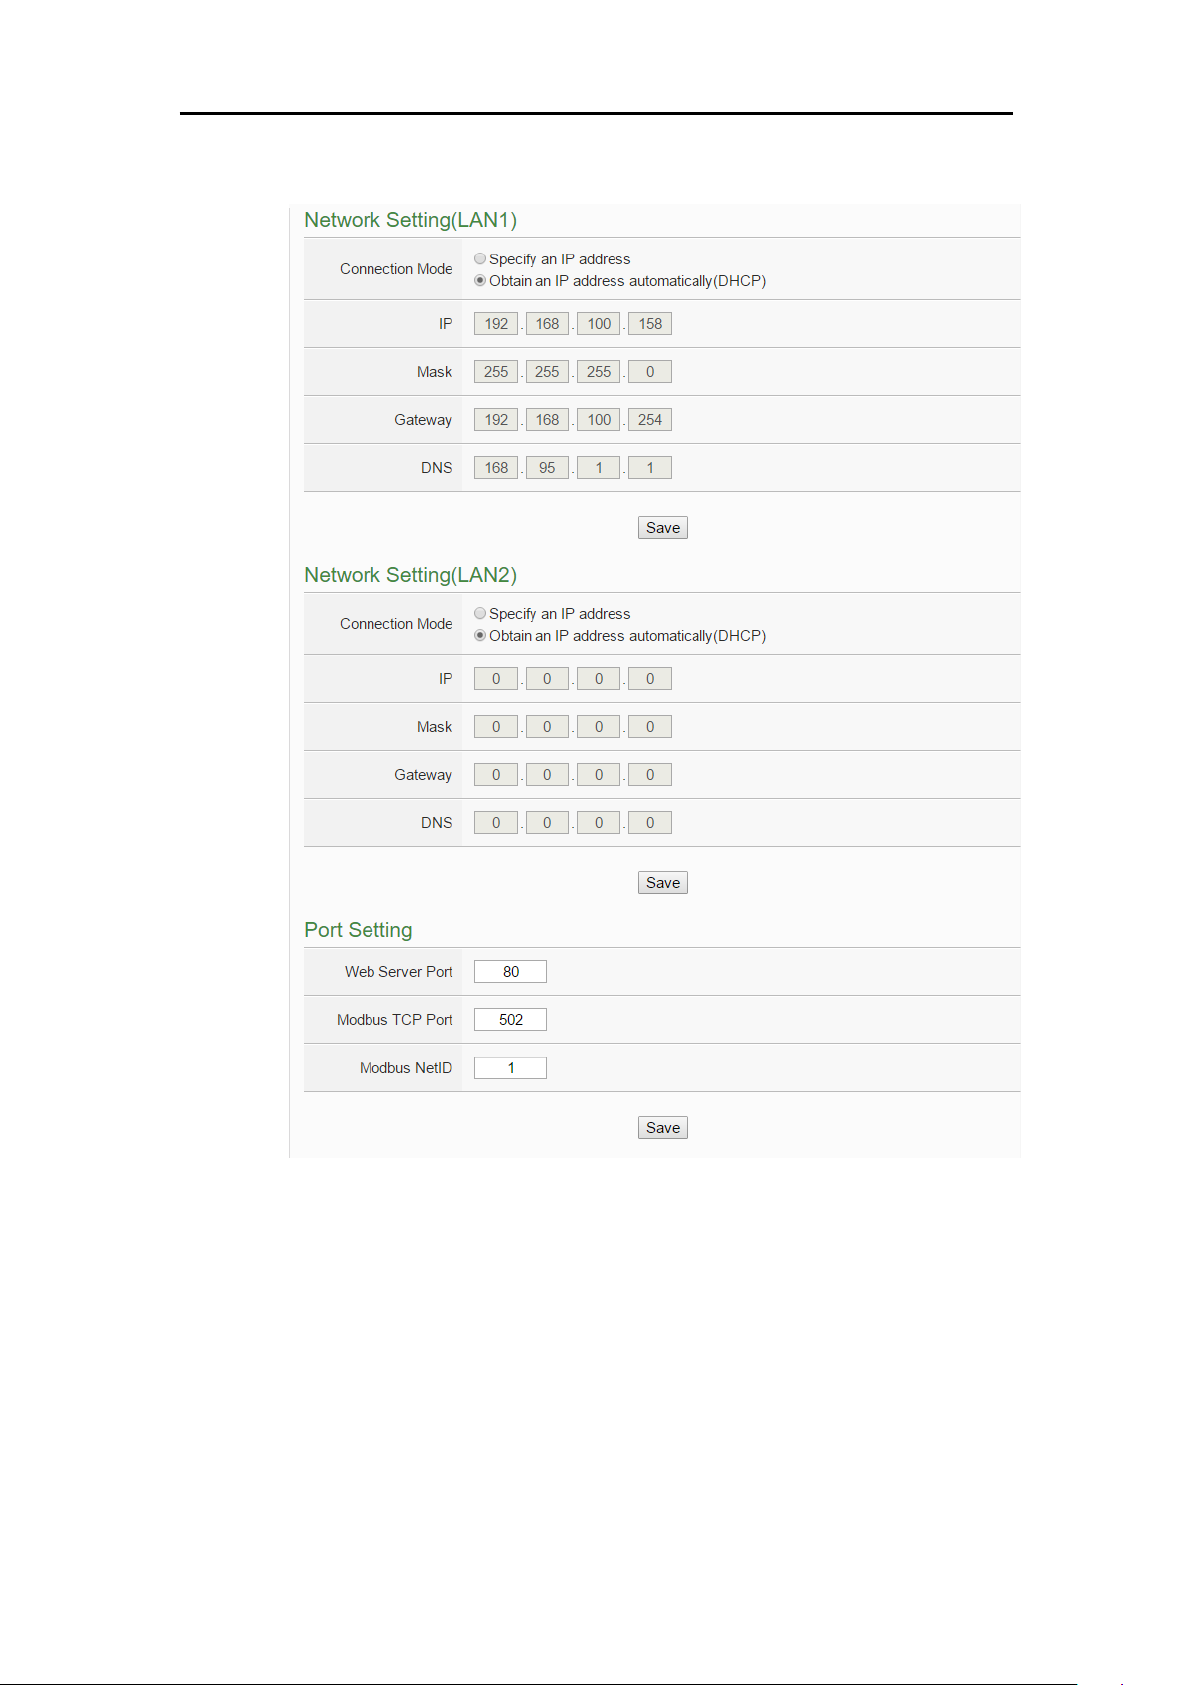
ICP DAS PMC/PMD Series User Manual
53
Figure6-5 : PMC-5151 Network Setting Page
Each time when the user enters this page, it will read and display current
network configuration and port settings from the PMC/PMD. In the
“Connection mode” field, please select the connection mode as “Obtain an
IP address automatically (DHCP)” or “Specify an IP address”, then modify
IP/Mask/Gateway/DNS Server IP configuration. After all settings are
completed, click “Save” button to save the changes. After the network
configuration is completed, the user could login into PMC/PMD webpage
via LAN1 or LAN2, and is able to retrieve data via Modbus TCP. In the
Page 67
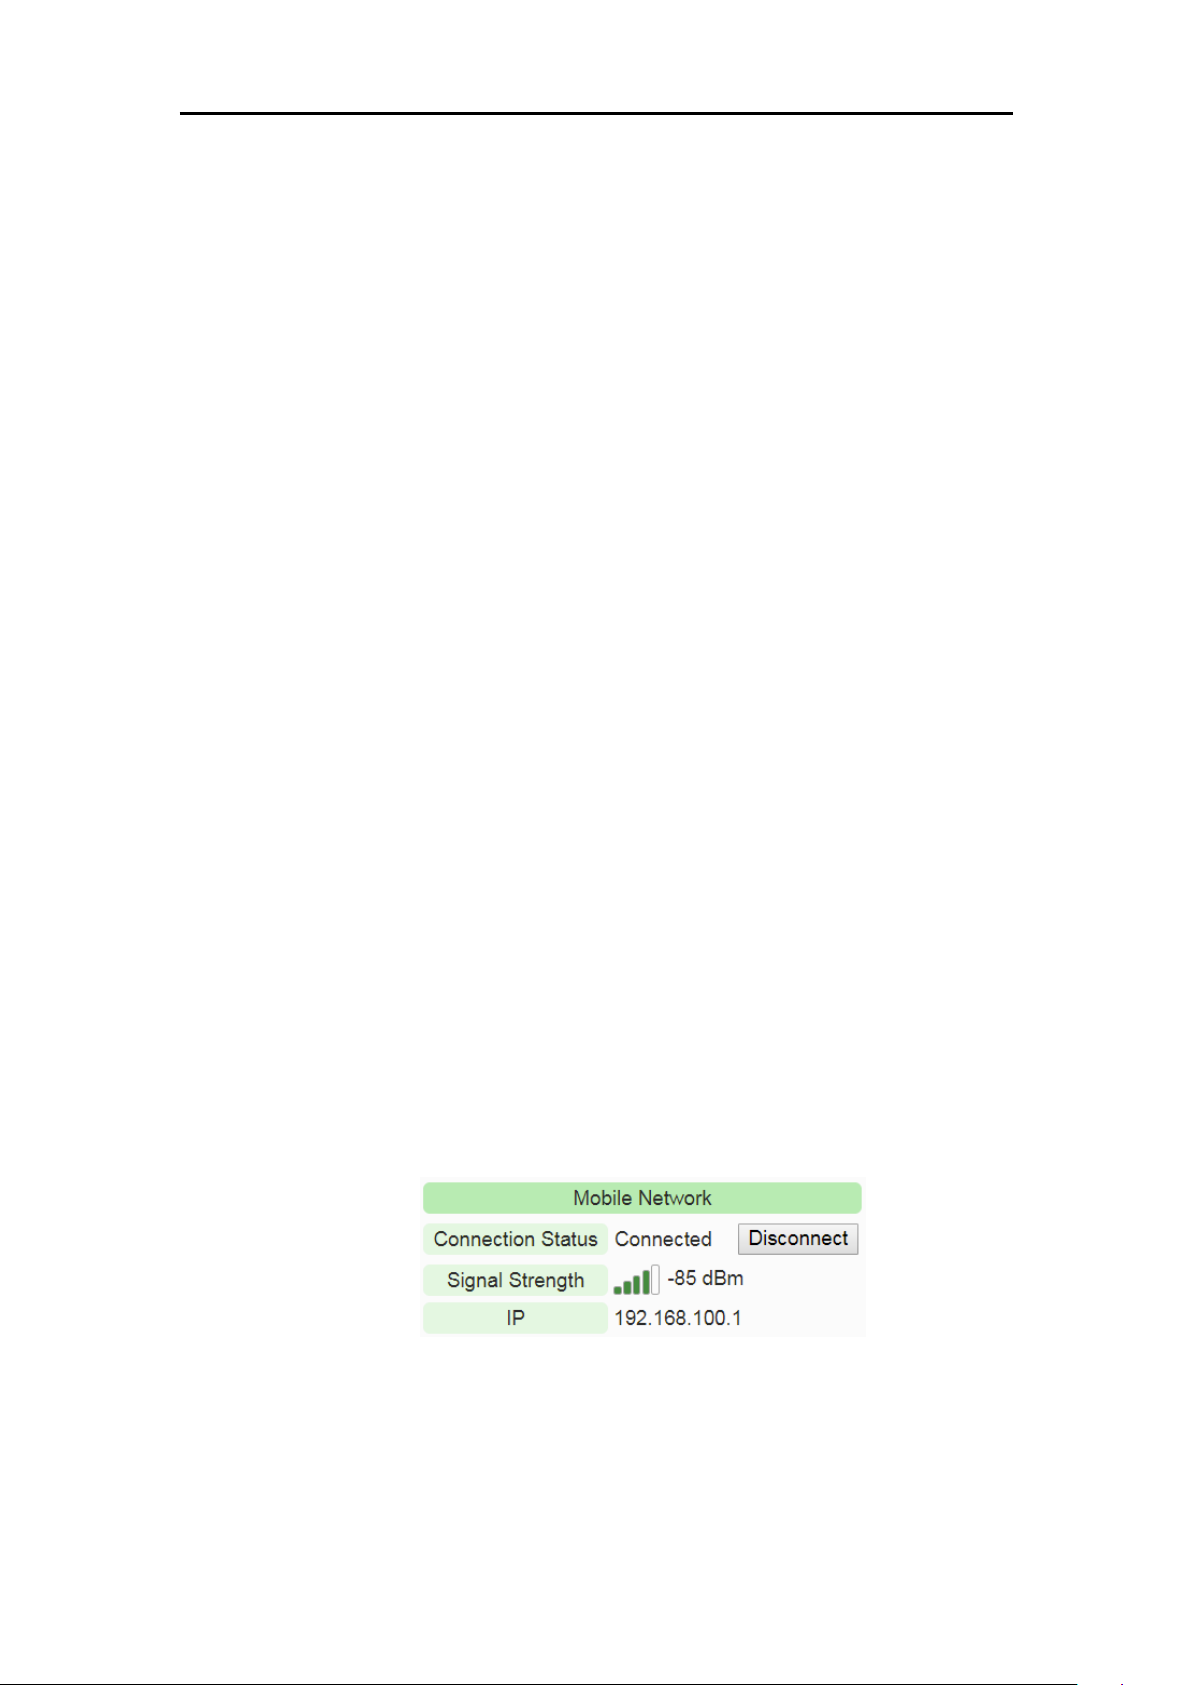
ICP DAS PMC/PMD Series User Manual
54
“Port Setting” section, the user can modify the Web Server Port/ Modbus
TCP Port/ Modbus NetID. After all settings are completed, click “Save”
button to save the changes.
The Network Setting (Mobile Network) section is for user to complete the
setting of 4G/3G Mobile Network of PMC-5231M-4GE(or
4GC)/PMC-5231M -3GWA. The default Dial-up number is “*99#”. User
can change it by the proprietary number provided by the
Telecommunication Service Company. To configure the setting for "APN"
and "Authentication" field, please refer to the document provided on the
PMC Web page. "Mobile Code" is an optional setting. It depends on the
service the Telecommunication Service Company provides. If the user
select the "Automatic Connection When Power On" option, it will enable
the PMC-5231M-4GE(or 4GC)/PMC-5231M-3GWA to complete the
4G/3G Network connection automatically when power on PMC. User can
click the "Connection Testing" button to test the 4G/3G Network
connection status between the PMC-5231M-4GE(or 4GC)/PMC-5231M
-3GWA and the 4G/3G Wireless Network. Please Note: In order to complete
the connection to the 4G/3G Network, please remember to disable the PIN
code setting of the SIM used in PMC-5231M-4GE(or 4GC)/PMC-5231M
-3GWA.
After completing the 4G/3G Mobile Network setting, the connection status
between PMC and 4G/3G Mobile Network can be shown on the System
Setting Page; and the connection status (Connect or Disconnect) can be
changed manually. This section also displays the strength level of the 3G
Signal and the IP address that PMC-5231M-4GE(or 4GC)/PMC-5231M
-3GWA occupies through 4G/3G Network.
Figure6-6 : Signal Strength level and IP address for Mobile Network
PMC-52xx also provides the Dynamic DNS service. The following figure
illustrates the configuration interface:
Page 68
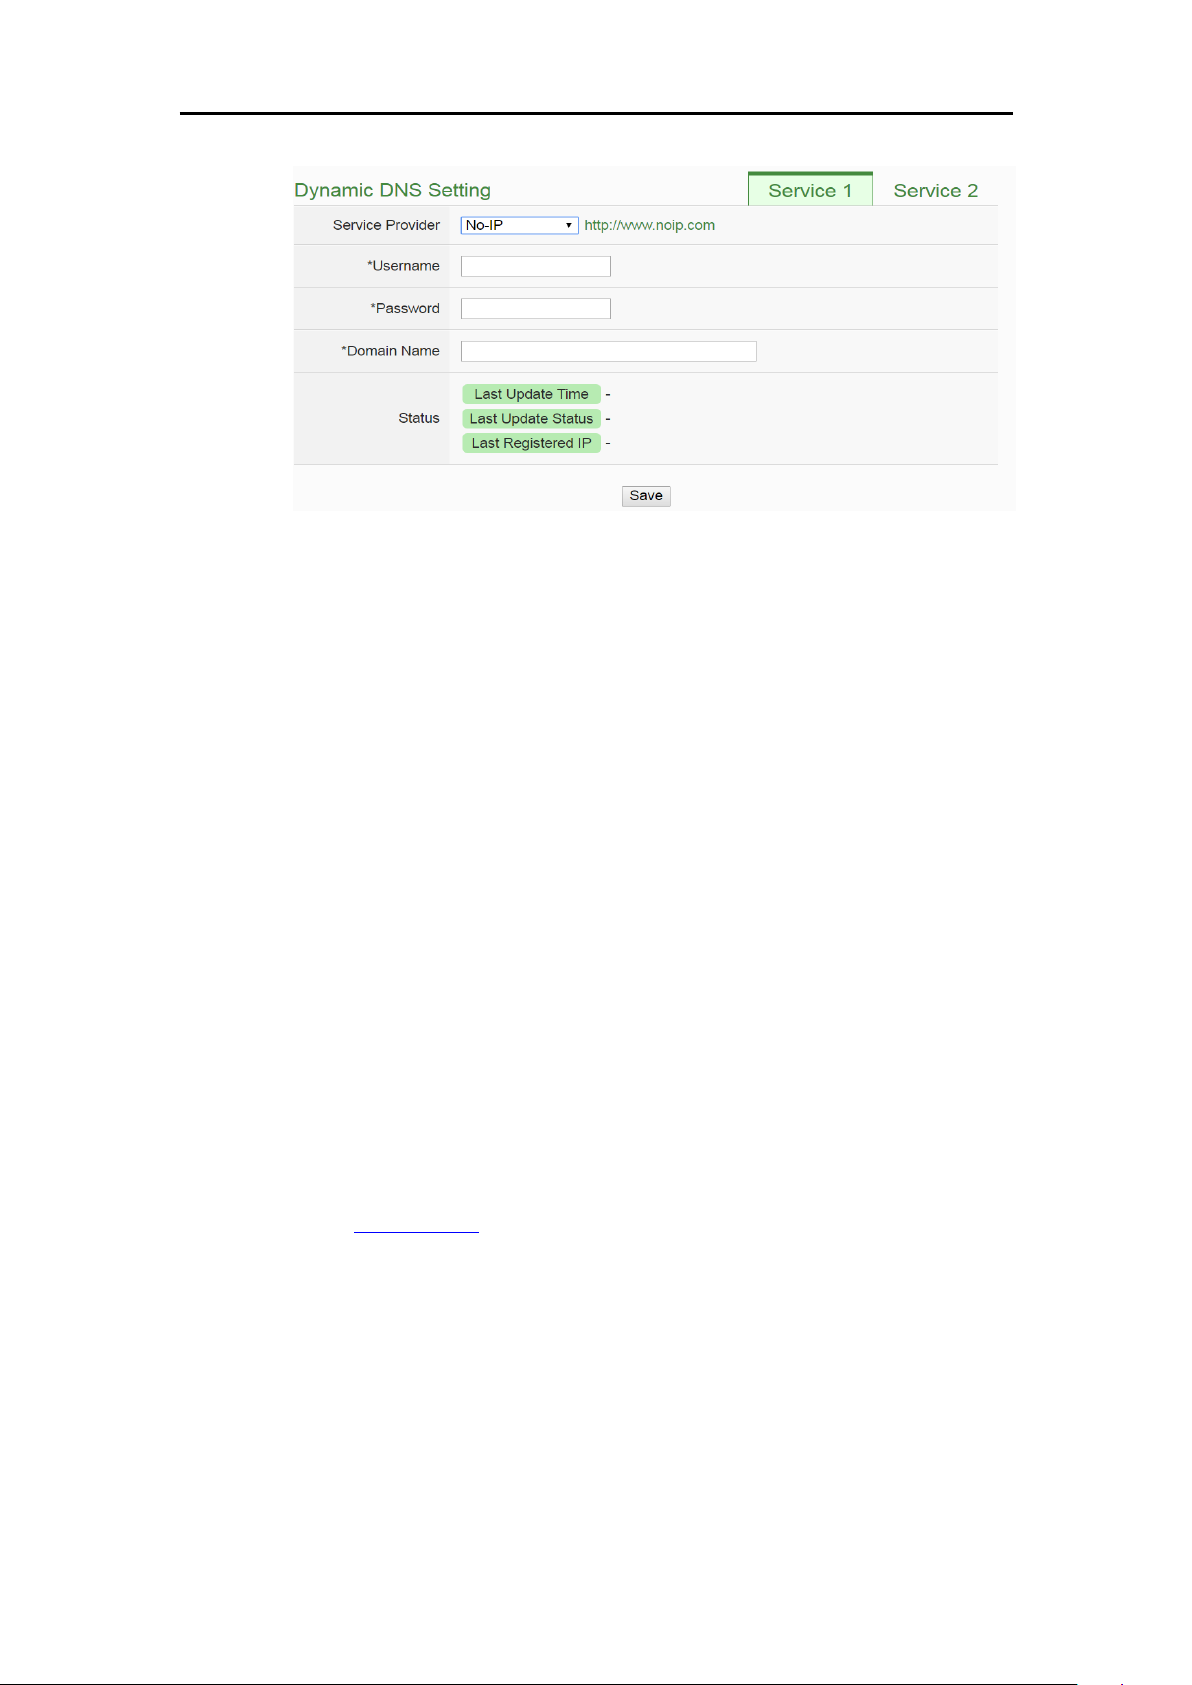
ICP DAS PMC/PMD Series User Manual
55
Follow the steps below to set up Dynamic DNS service:
i. Click the services tabs on the right-top corner of “Dynamic DNS
Figure6-7 : DDNS Setting Page
service”. System provides two items for selection as “Service 1” and
“Service 2”. User can enable one Dynamic DNS service for normal
status, or enable two Dynamic DNS services for the redundant service.
ii. In the “Service Provider” field, select the provider of Dynamic DNS
services from the dropdown list. Currently system provides 4 service
providers for selection as “ChangeIP.com”, “FreeDNS”, “DynDNS”
and “No-IP”. User can also select “Disable” to disable the service.
iii. If user selects “No-IP”, “ChangeIP.com” or “DynDNS”, please enter the
ID, Password and Domain Name to login the service. If user selects
“FreeDNS”, please insert the Token to login the service.
iv. After all settings are completed, click “Save” button to save the
changes.
PMC-52xx/PMD also provide the connection ability to the ICP DAS
IoTstar Cloud Manager Software. For more detailed information, please
refer to Appendix IX.
Please Note:ICP DAS IoTstar Cloud Manager System only support
PMC-52xx/PMD controller.
Page 69
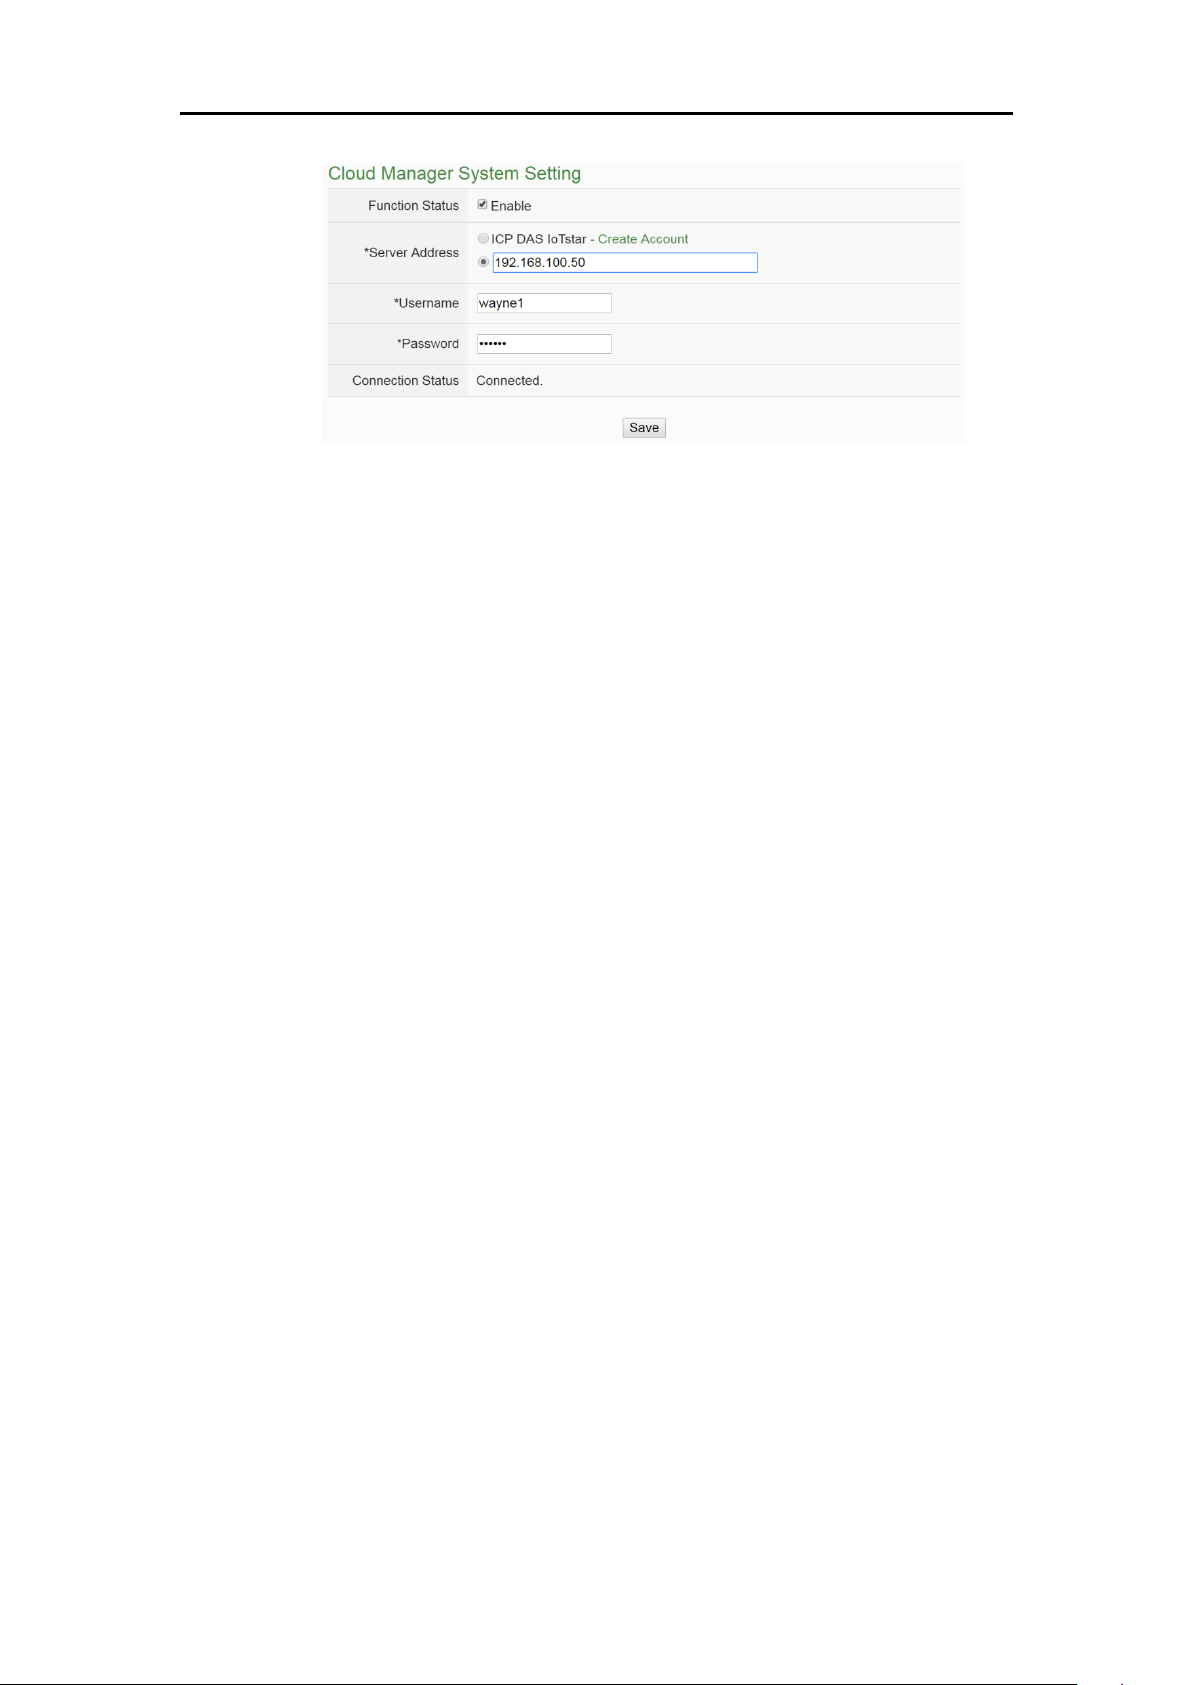
ICP DAS PMC/PMD Series User Manual
56
Figure6-8 : IoTstar connection setting page
Please note:
1. PMC/PMD adopts Google DNS server as system default DNS server,
the default IP is “8.8.8.8”, the IP can be modified to other DNS server IP
if required.
2. If the connection mode is “Specify an IP address”, then you make
modification to the IP address, the system will logout automatically and
re-connect to the web page automatically based on the new setting. If
the connection mode is “Obtain an IP address automatically (DHCP)”,
the system may fail to re-connect to the web page because the IP address
is changed. Please use PMC Utility to search the PMC/PMD, get the
new IP address of PMC/PMD, and then launch browser to connect to the
PMC/PMD with the new IP address.
6.3 VPN Setting (This function is for PMC-5151 only.)
PMC-5151 supports VPN(Virtual Private Network) function to connect
with the virtual private network. With this function, it enhances the
flexibility of the maintenance and management of the PMC-5151. The
setting interface is as below:
Page 70
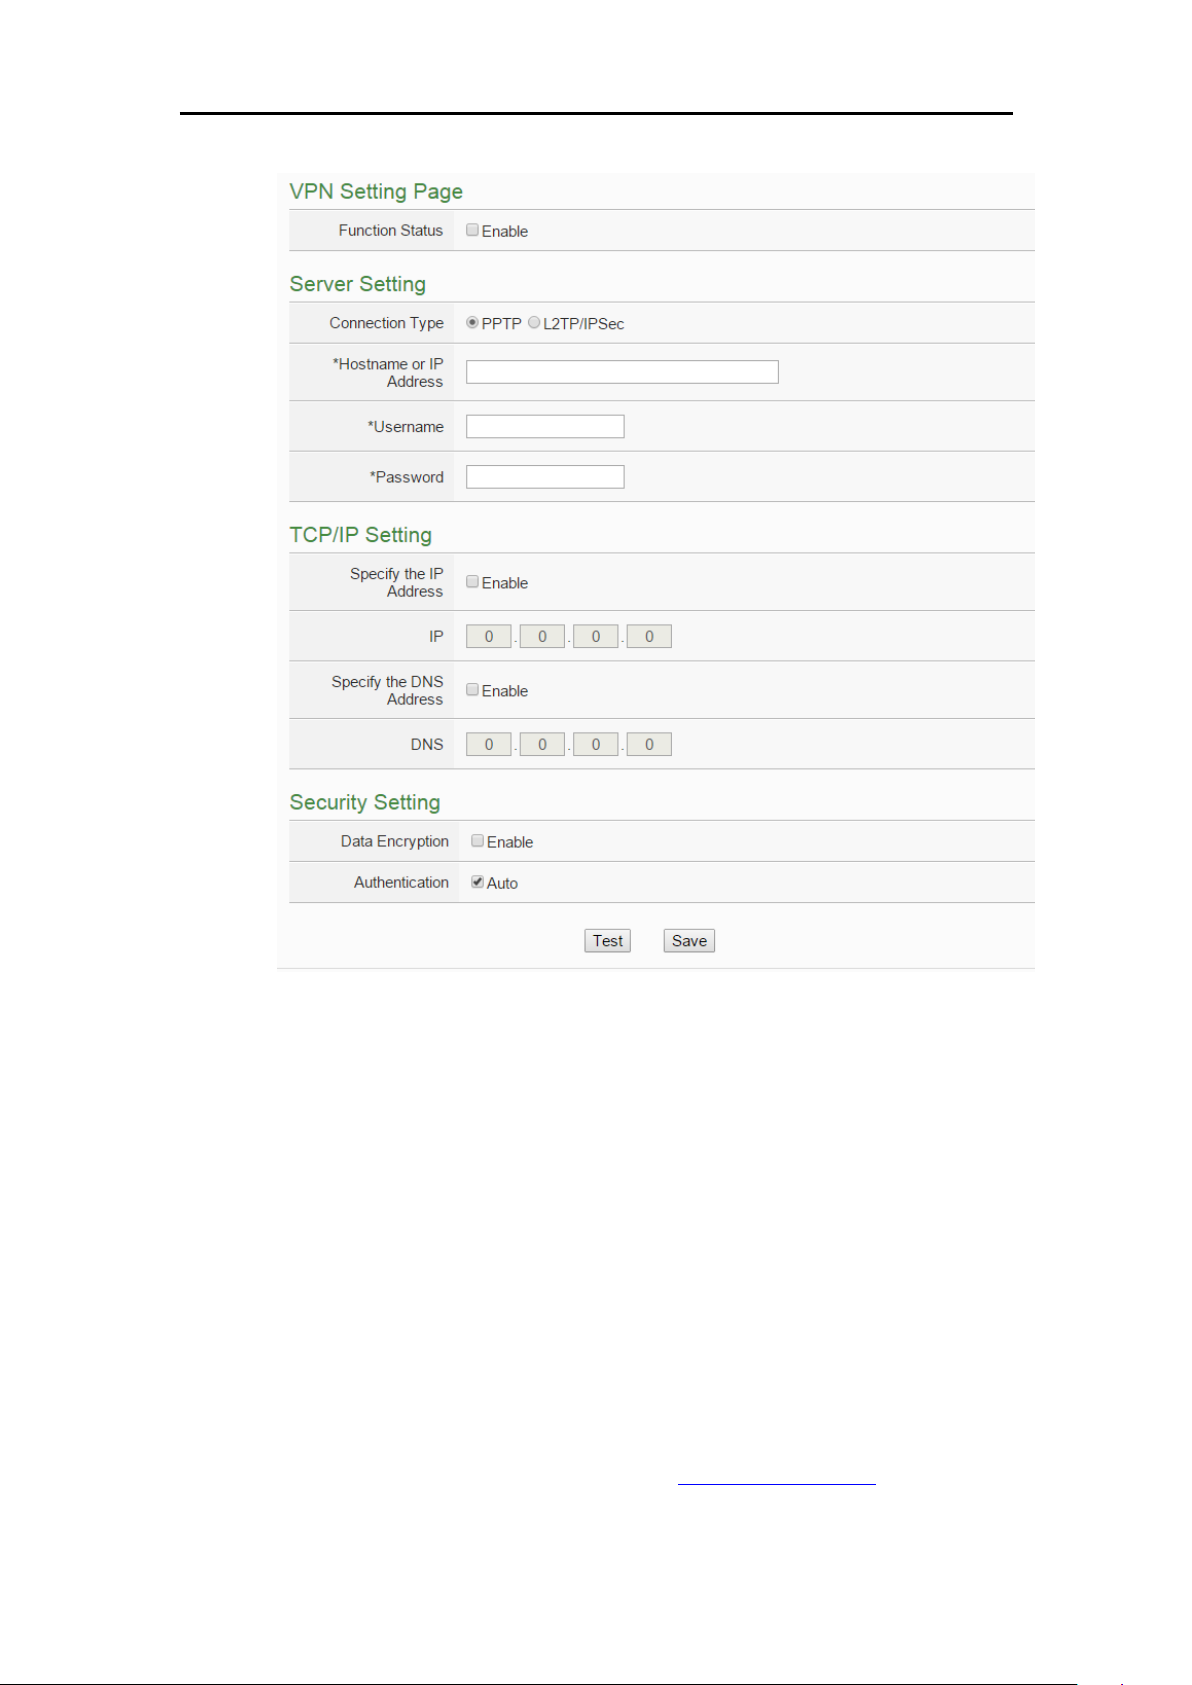
ICP DAS PMC/PMD Series User Manual
57
Figure6-9 : Setting interface of VPN function
When setting up the parameters of the VPN connection, please setup correct
and suitable settings of the VPN server, TCP/IP and security according to
the parameters of the remote VPN server. Please click "Test" or "Save"
button to test or save the settings. The description of these two buttons are
as below:
Test" button
The system will test the VPN connection settings. If the connection is
failed, please confirm the settings again.
"Save" button
The system will save the VPN connection settings. If the "Function
Status" is "Enable", the system will start the VPN connection, and the
connection status will be shown on "System Setting Page" as below:
Page 71
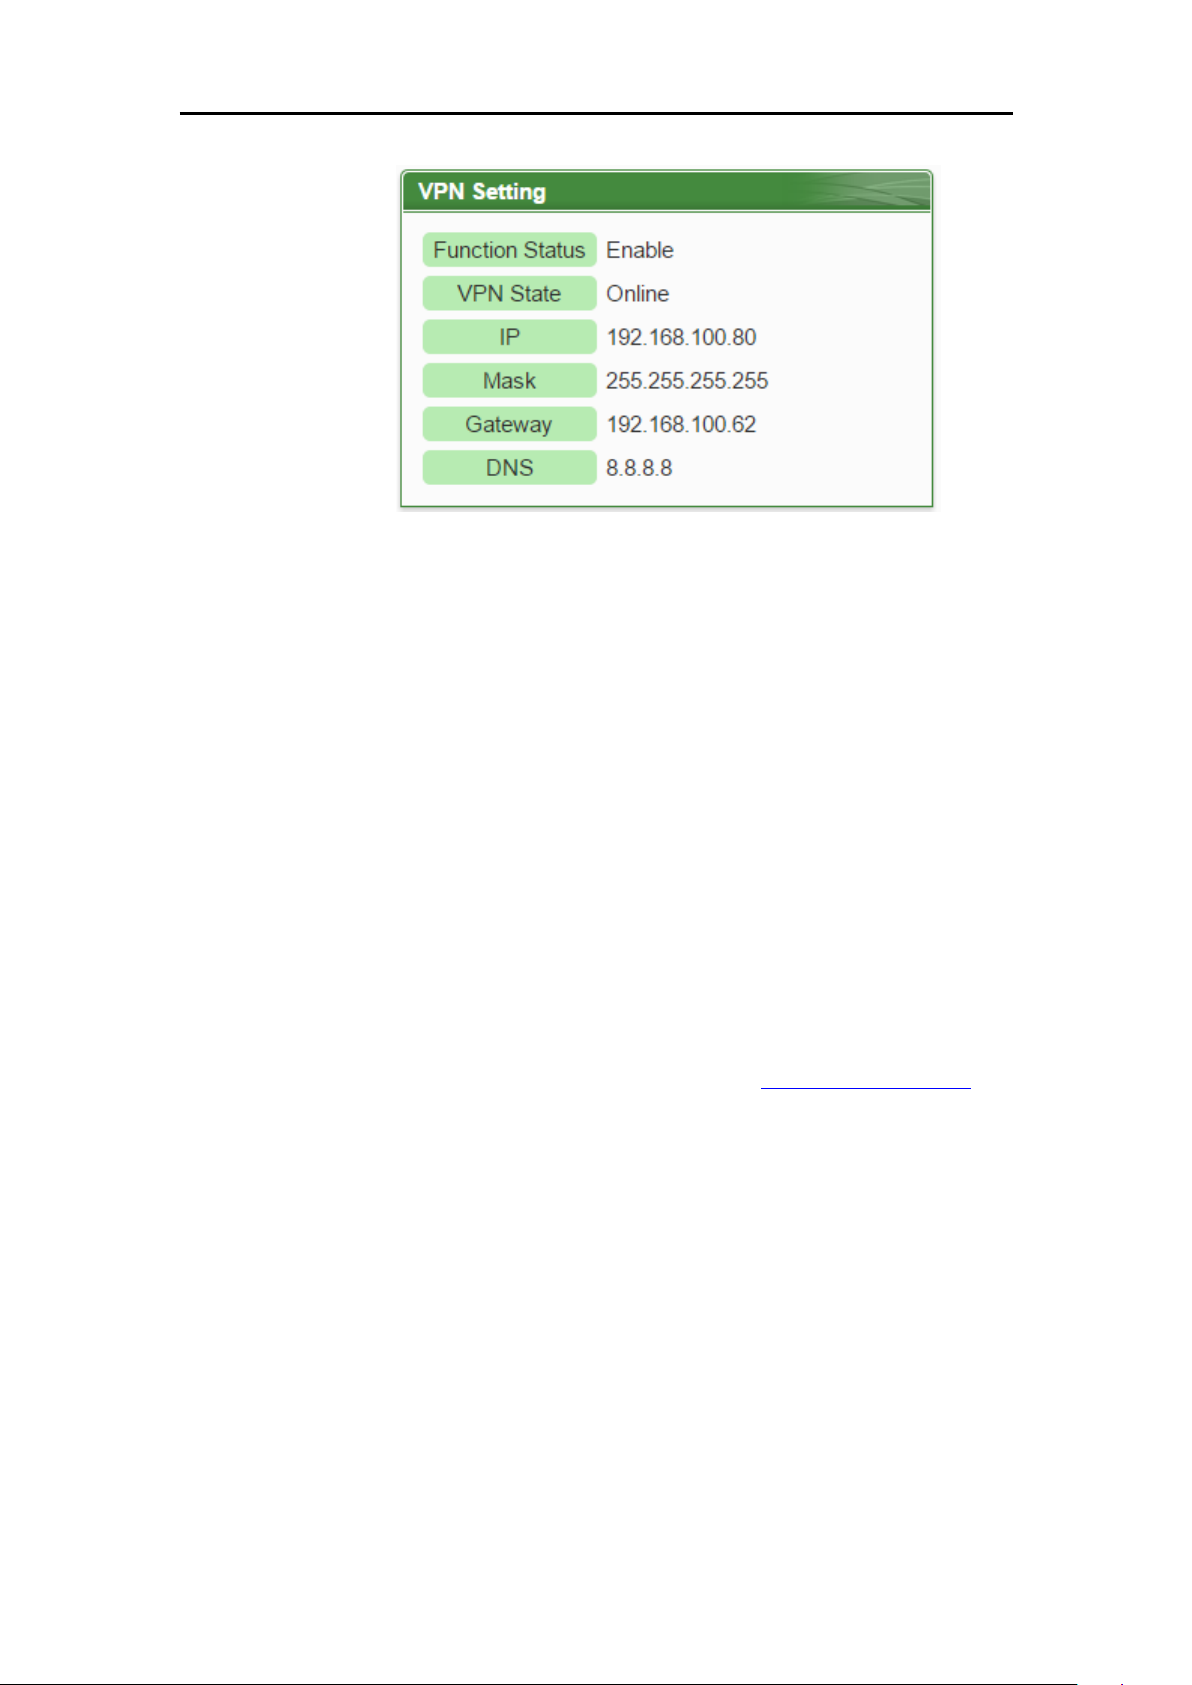
ICP DAS PMC/PMD Series User Manual
58
Figure6-10 : Setting interface of VPN function
Please note:
1. When using VPN IP address to login the system, the below functions
will be disabled:
The network settings of LAN1 and LAN2
If the user wants to modify the settings of LAN1 or LAN2, please
use the IP address of LAN1 or LAN2 to login the system.
The testing function of VPN
If the user wants to test the settings of VPN connection, please use
the IP address of LAN1 or LAN2 to login the system.
2. When the user is using the VPN IP address to login the system and save
the VPN settings, the system will logout the user and redirect the
webpage to the new VPN IP address automatically. If the user is not sure
about the new VPN IP address, please use the IP address of LAN1 or
LAN2 to login the system and go to the "System Setting Page" to
inquiry the VPN settings.
3. When the VPN connection is failed due to security issues, please check
if the security settings of the remote VPN servers are matched with the
VPN security settings of the PMC-5151. Please refer to the description
of the web setting page as below
Page 72
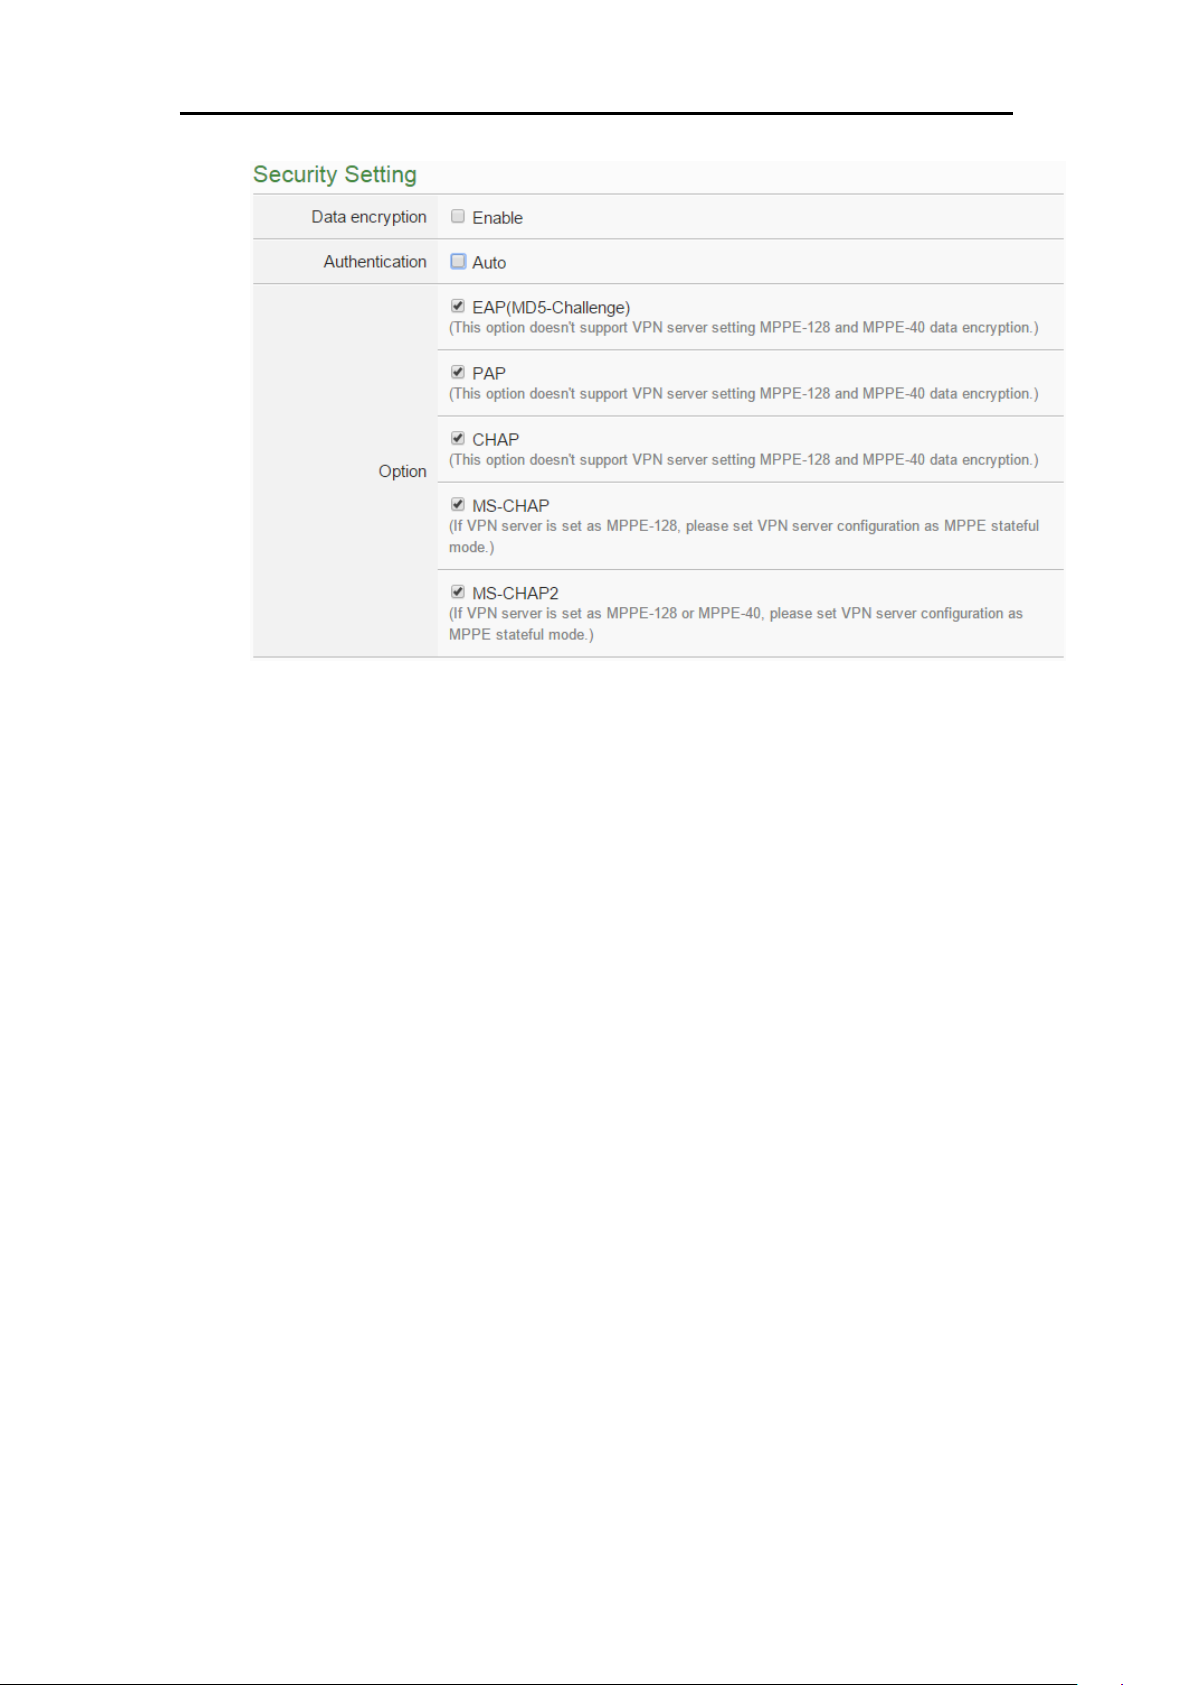
ICP DAS PMC/PMD Series User Manual
59
Figure6-11 : Security setting interface of VPN function
Page 73
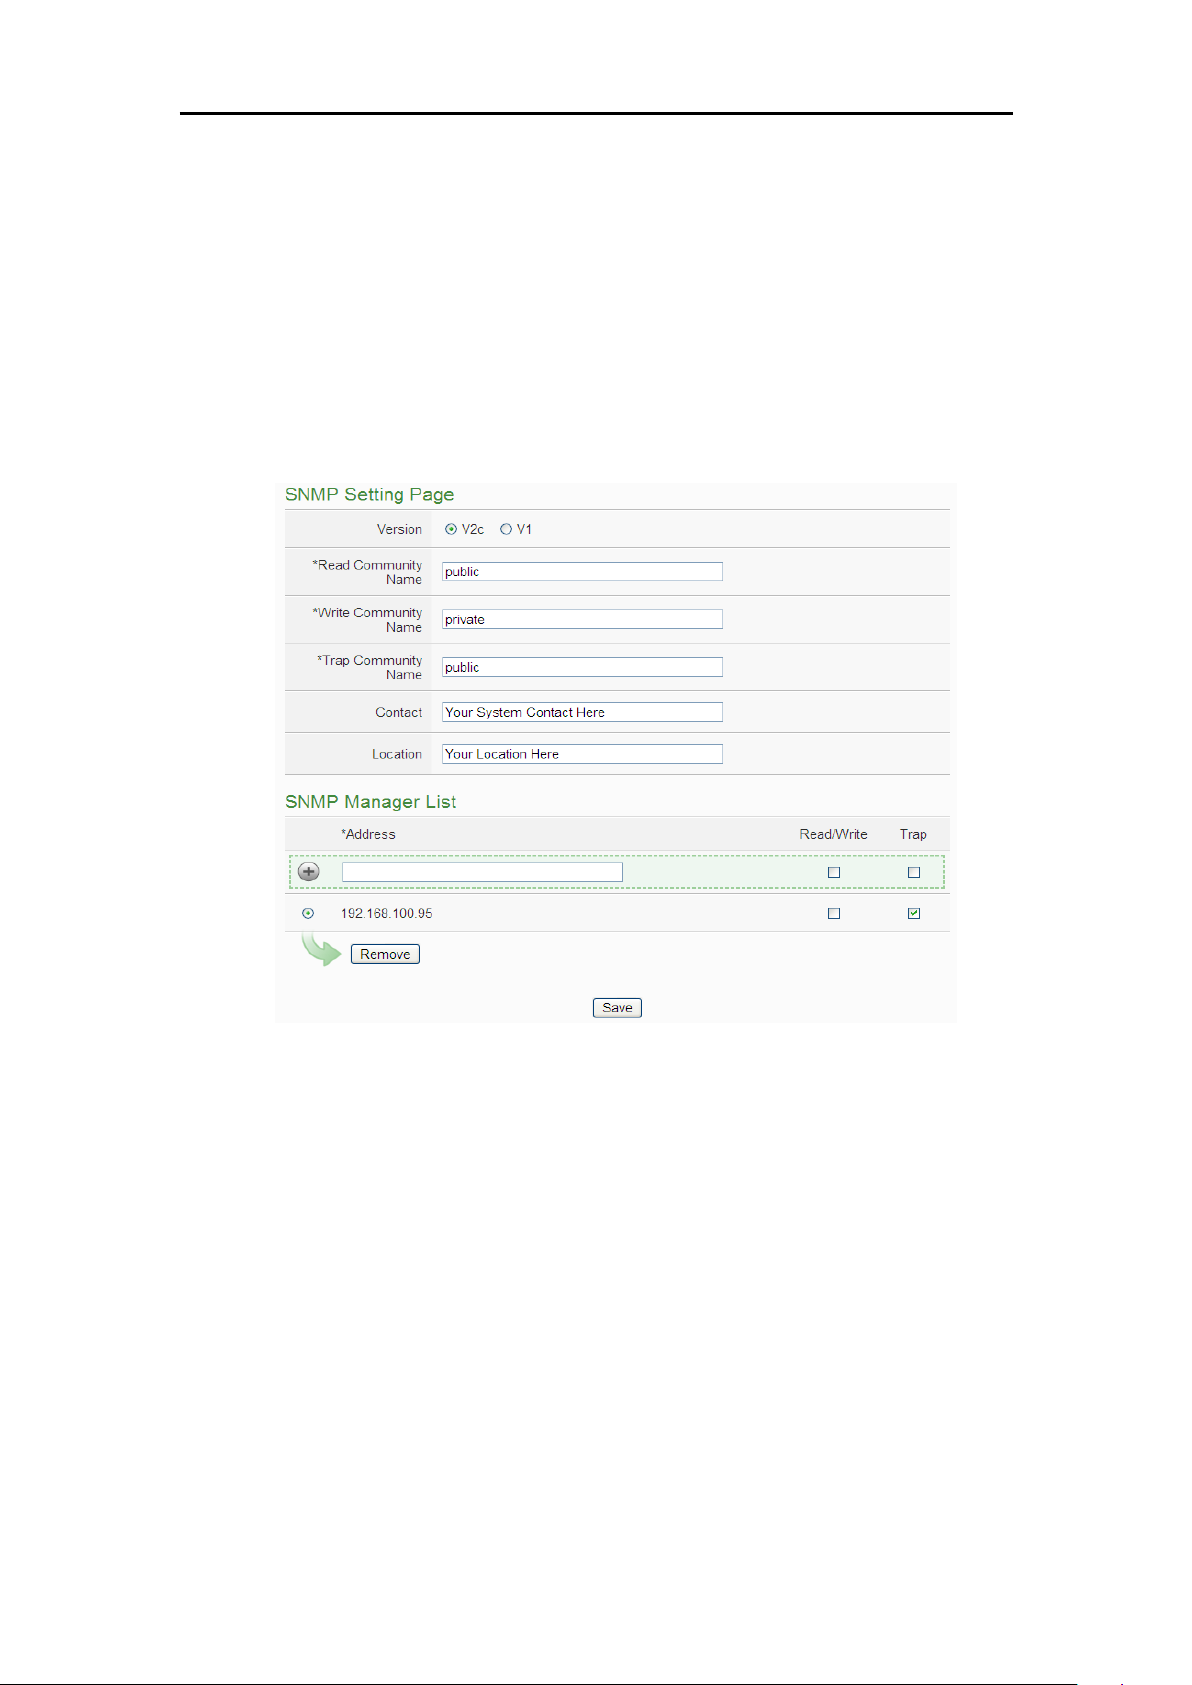
ICP DAS PMC/PMD Series User Manual
60
6.4 SNMP Setting
The PMC/PMD provides SNMP(Simple Network Management Protocol)
V1 and V2c to work with the SNMP Network Management software for
monitoring the system data, power meter data and I/O module data. The
SNMP Setting page allows you to enable or modify the settings of the
SNMP function on the PMC/PMD. The following figure illustrates the set
up interface:
Figure6-12 : SNMP Setting Page
Please follow the steps below for the SNMP Settings:
i. In the “Version” field, select the SNMP version that you want to use.
Currently PMC/PMD supports SNMP V2c and V1 protocol,
ii. In the “Read Community Name” field, input a string for “Read
Community Name” for SNMP function. The default string is “public”.
iii. In the “Write Community Name” field, input a string for “Write
Community Name” for SNMP function. The default string is
“private”.
iv. In the “Trap Community Name” field, input a string for “Trap
Community Name” for the SNMP function. The default string is
“public”.
v. In the “Contact” field, input the “Contact” string.
Page 74
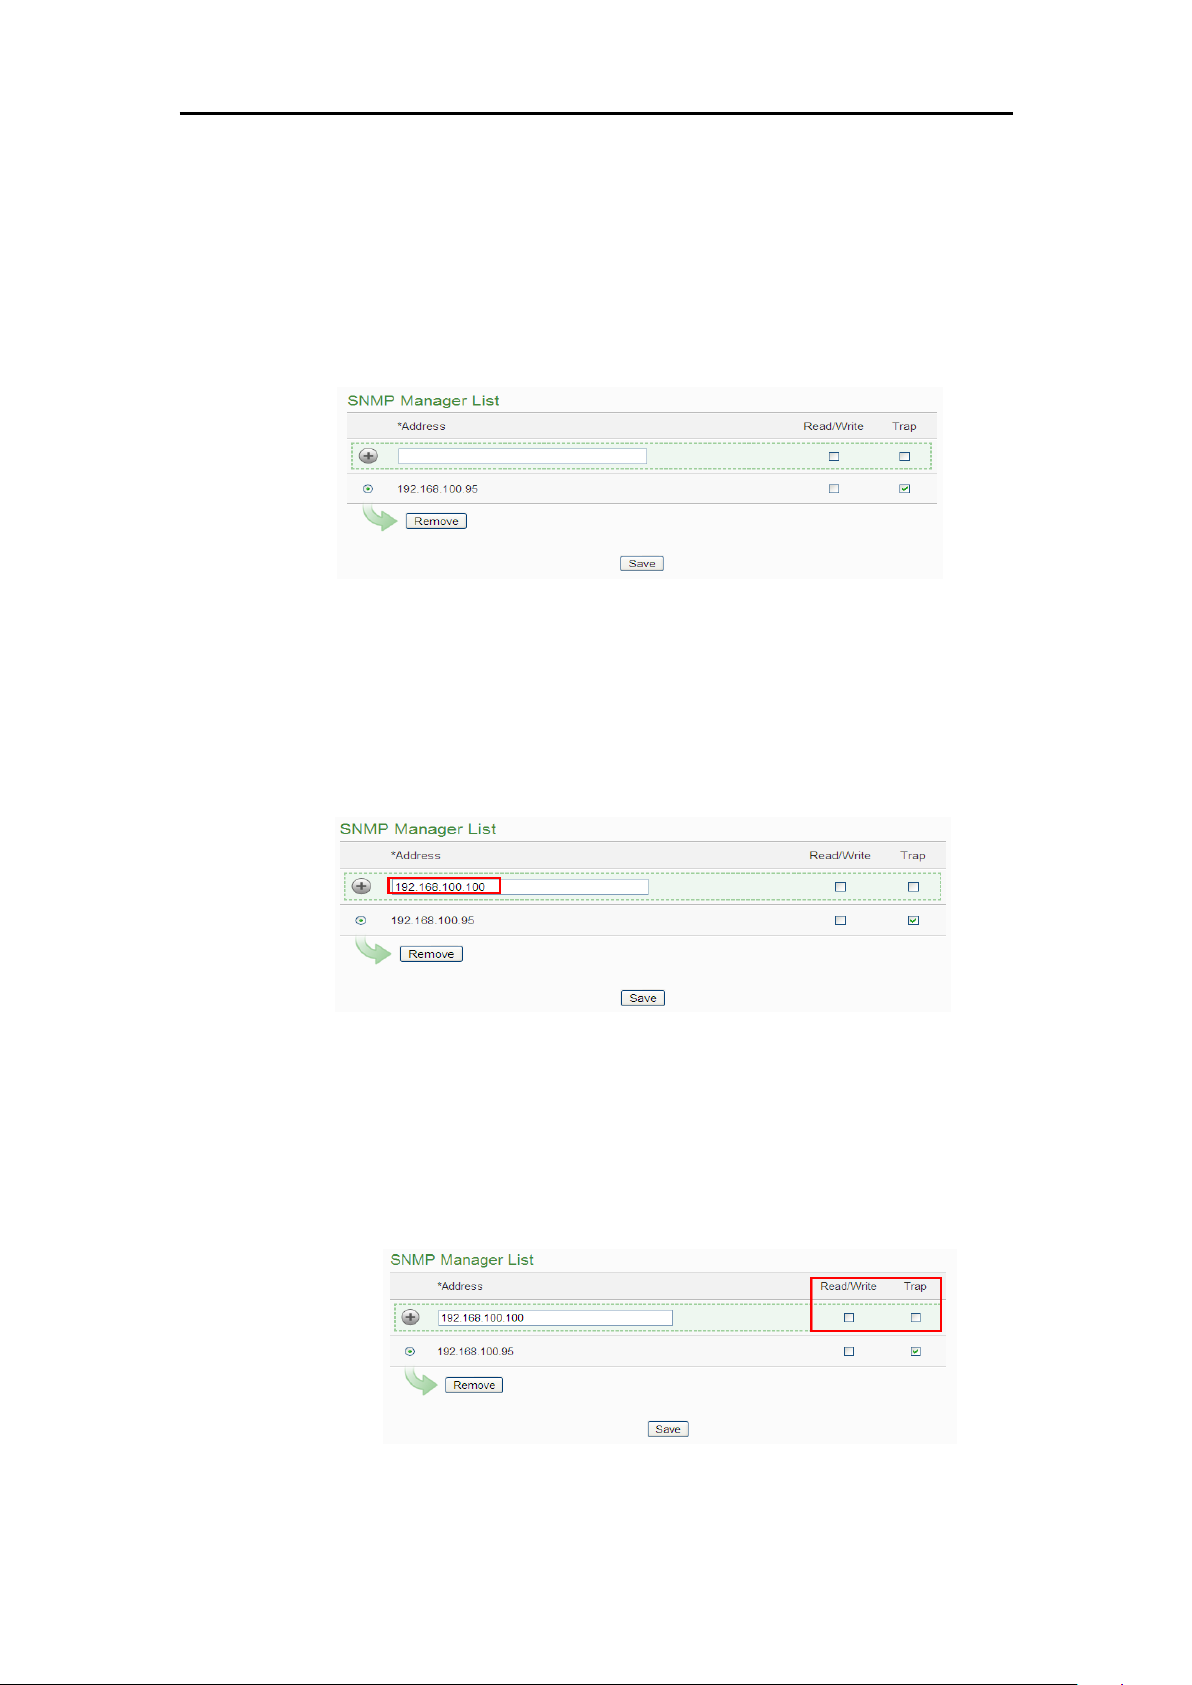
ICP DAS PMC/PMD Series User Manual
61
vi. In the “Location” field, input the “Location” string,
The SNMP Manager List is a list for all SNMP Managers which will
interact with the SNMP Agent of PMC/PMD. Please follow the steps as
below to perform the setting for SNMP Managers. After all settings are
completed, click “Save” button to save the changes.
Figure6-13 : SNMP Manager List
i. Set up IP Address or domain name of the SNMP Manager that you
want to add. Please set up the Address appropriately, if the settings
are not the same as the settings of the SNMP Manager, the interaction
between PMC/PMD and the SNMP Manager will be failed.
Figure6-14 : The Address Setting for SNMP Manager
ii. Click to Enable (or Disable) the working model between the SNMP
Manager and the SNMP Agent of PMC/PMD. Currently PMC/PMD
provides two working models as Read/Write (Polling) and Trap for
SNMP Manager.
Figure6-15 : The Working Model Setting for SNMP Manager
Page 75
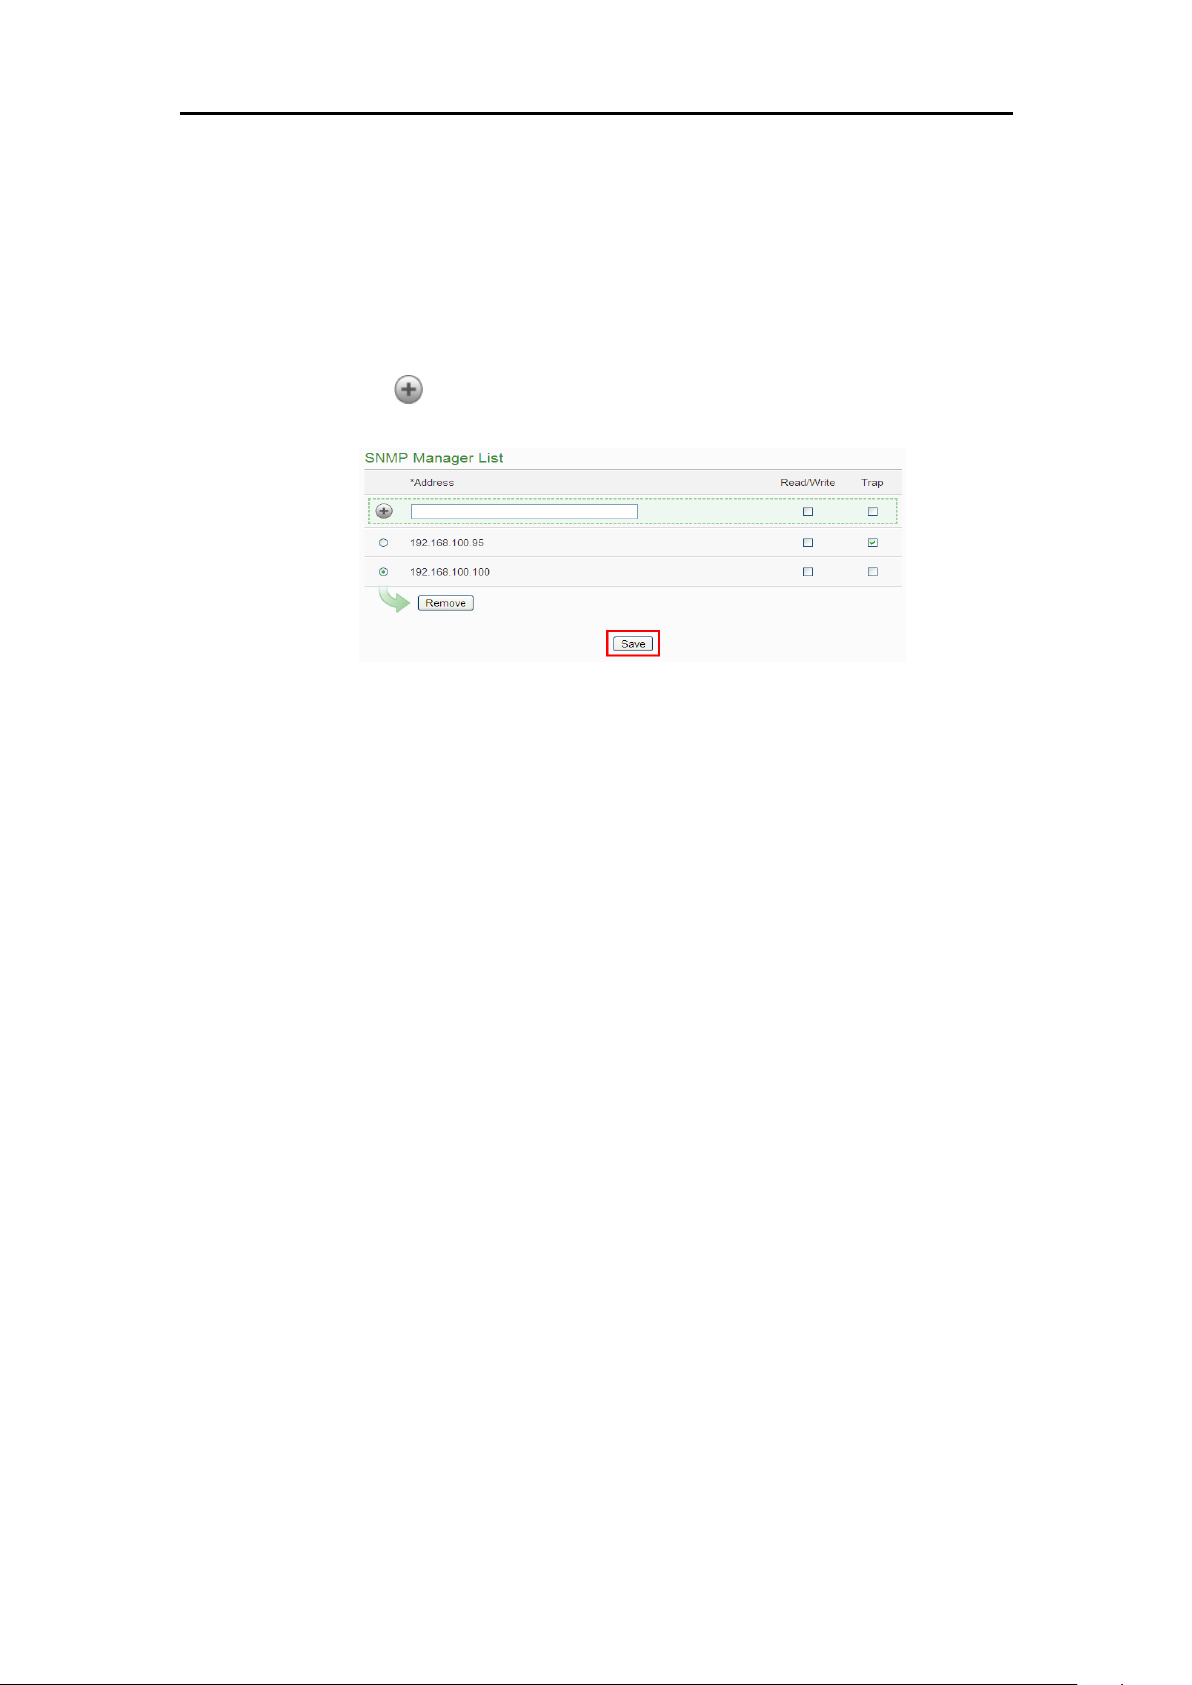
ICP DAS PMC/PMD Series User Manual
62
Please Note: If no "Read/Write" field on the list is enabled to accept
the Read/Write commands, indicating that it will allow accepting the
Read/Write commands from ANY SNMP Manager.
iii. After completing the IP address and working model setting, please
click button to add the SNMP Manager to the list. After adding
the SNMP Manager, click “Save” button to save the changes.
Figure6-16 : Save the SNMP Manager Setting
Page 76
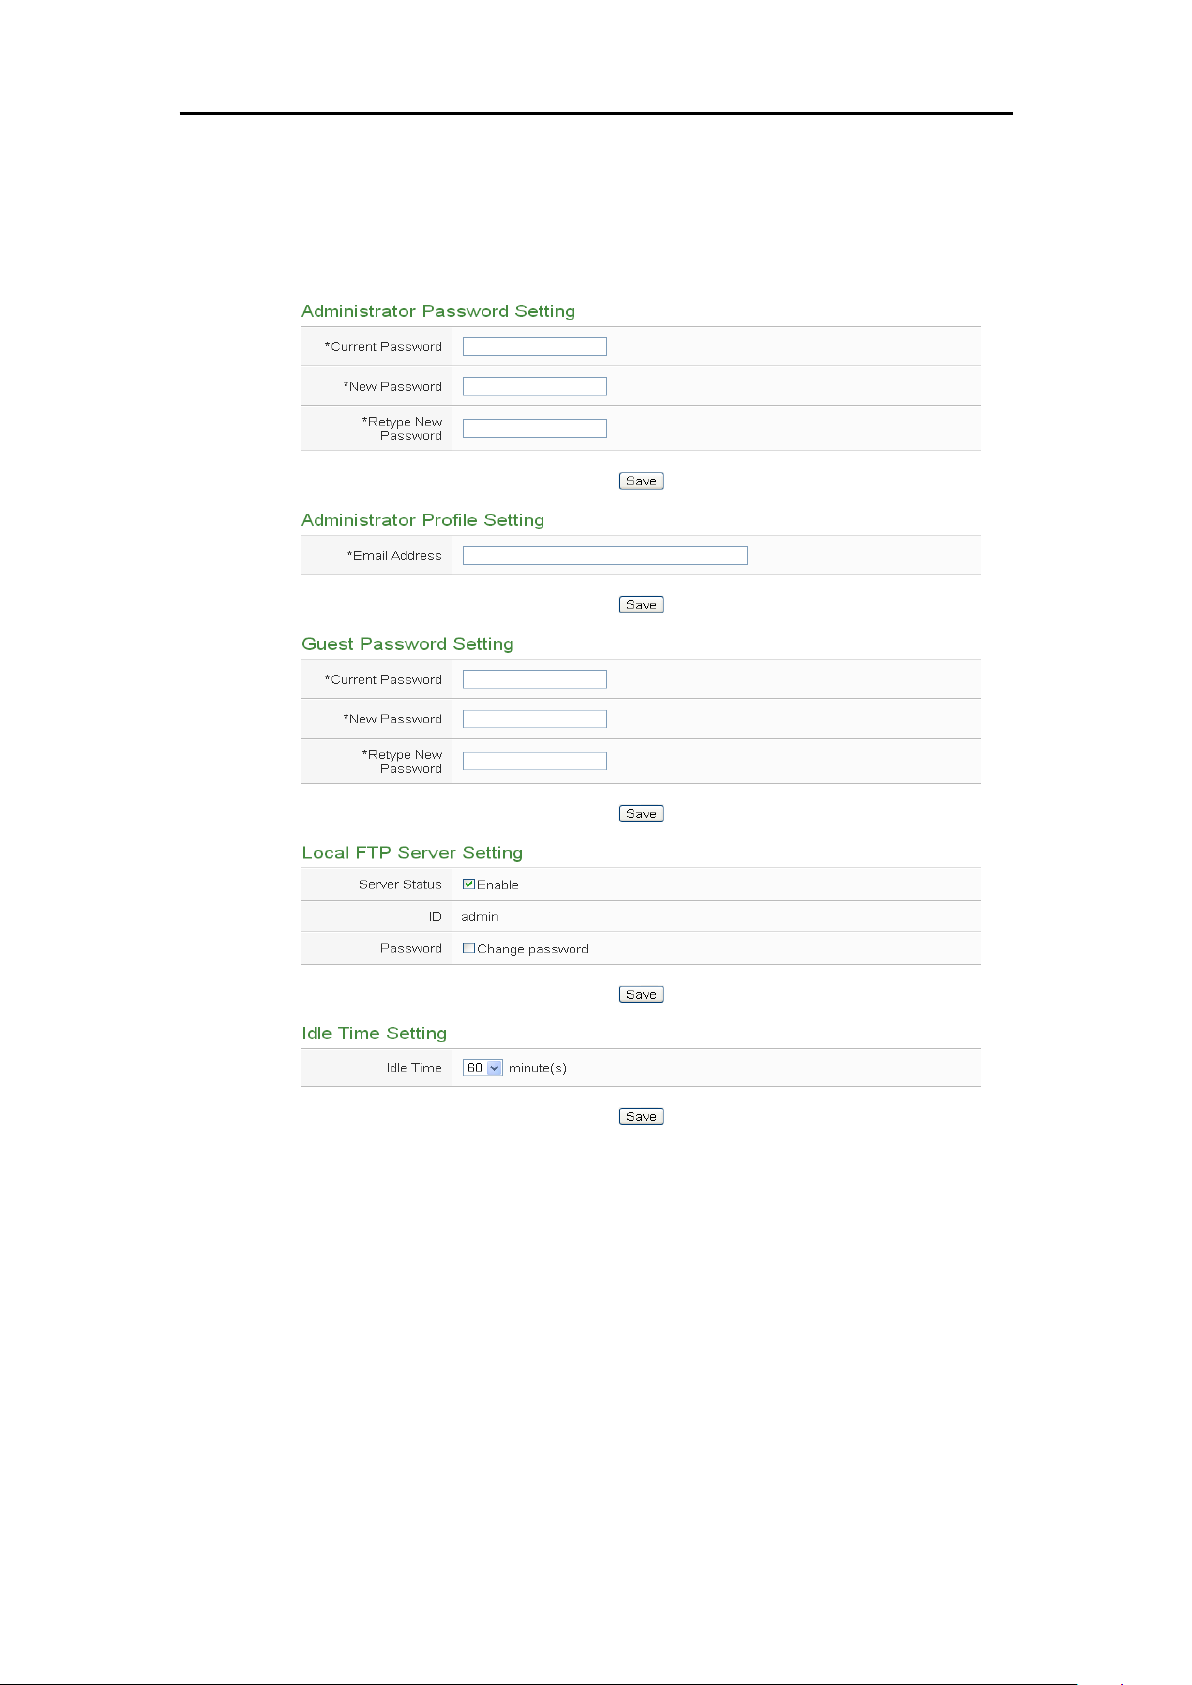
ICP DAS PMC/PMD Series User Manual
63
6.5 Security Setting
Security Setting allows user to change the password that is required when
access to PMC/PMD. The user could also modify the settings of FTP Server
and Idle Time. The Security Setting page is as follow:
Figure6-17 : Security Setting Page
Password Setting
PMC/PMD provides two passwords sets, one for Administrator, the other
for Guest. The default password for Administrator is “Admin” and
“User” for Guest. The user can modify the password in the “Password
Setting” section; the Password length is limited to 16 characters. After all
settings are completed, click “Save” button to save the changes. In
addition, if login as the Administrator, in the “Administrator Profile
Setting” section, the users could input an email address, once the
password is forgotten or lost, the PMC/PMD could send an email with
Page 77
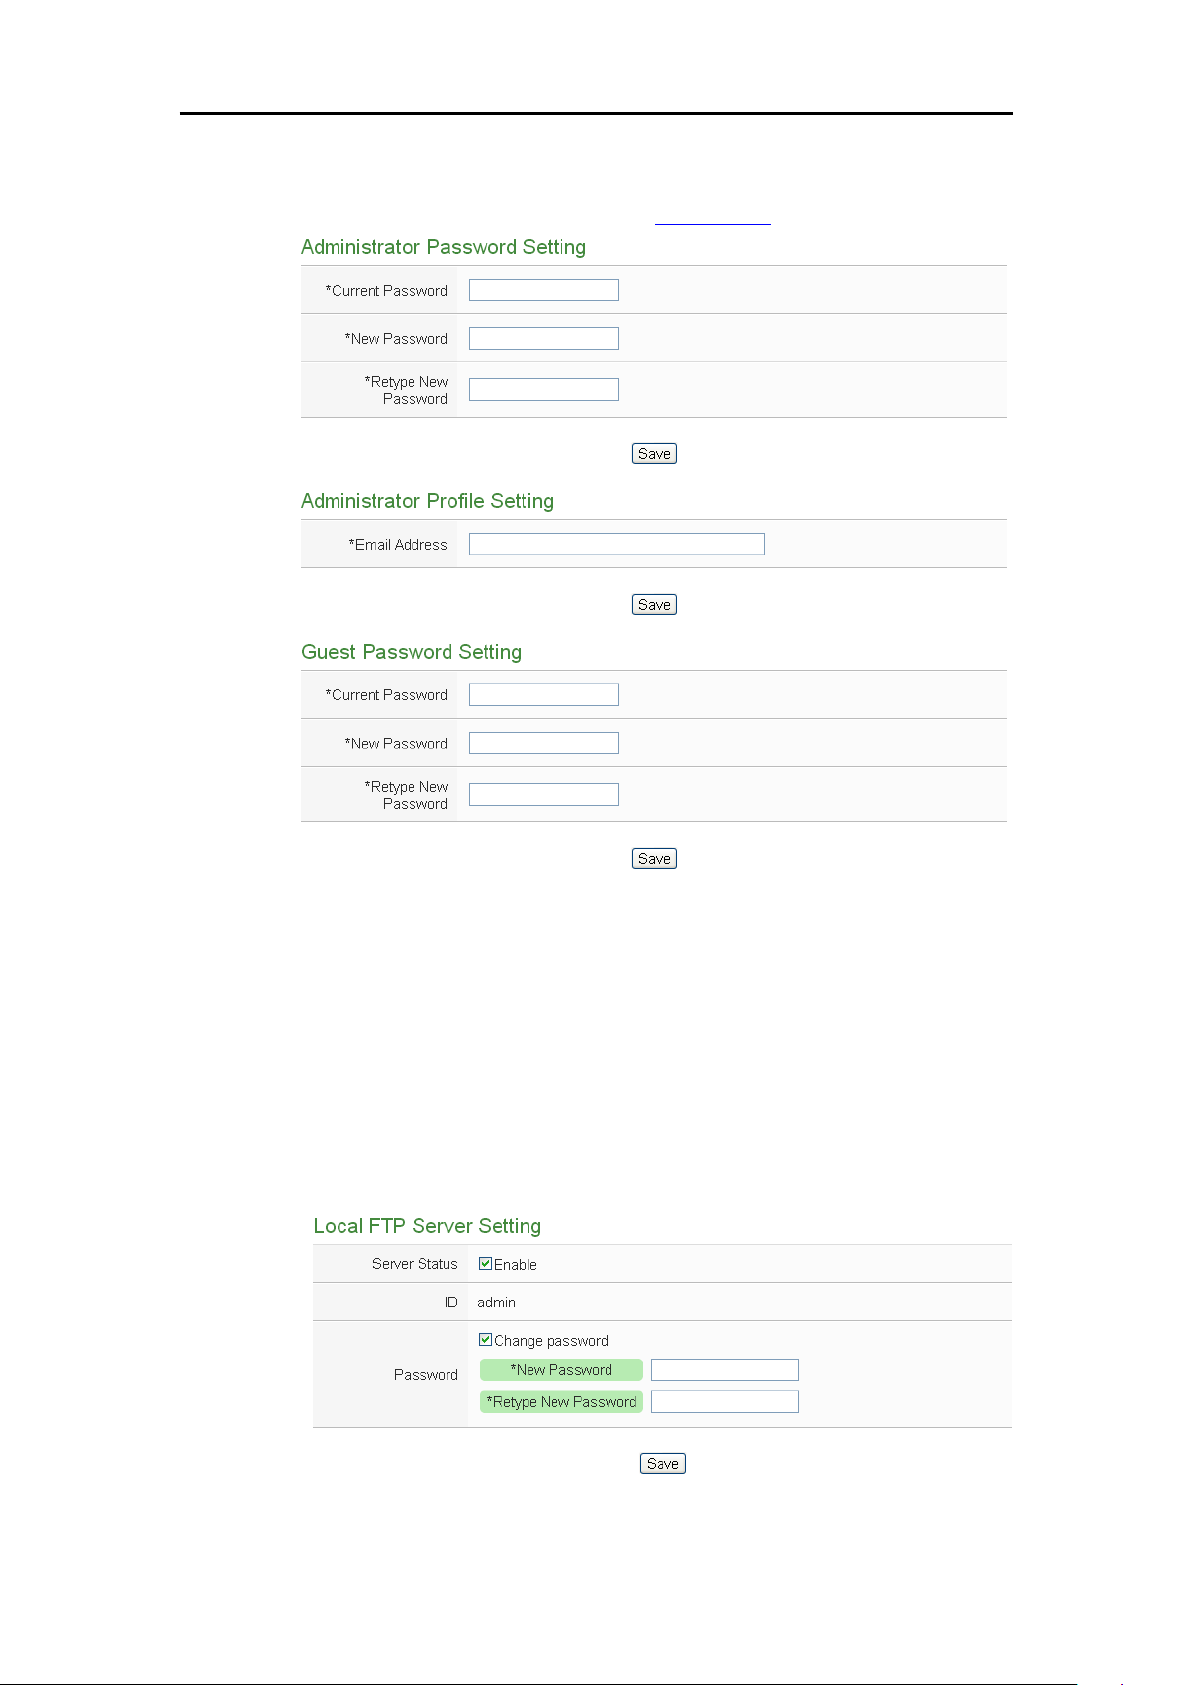
ICP DAS PMC/PMD Series User Manual
64
the passwords (administrator and guest) to this email address, for more
detailed information, please refer to Appendix II.
Figure6-18 : Password Setting Page
Local FTP Server Setting
In this section, it allows to enable or disable the FTP Server function on
the PMC/PMD side. The user could connect to PMC/PMD FTP Server
via FTP software to remotely retrieve event log or data record file. To
enable this function, check “Enable” in the “Server Status” field. The
default password is “Admin”, the user could modify the password of the
FTP Server on the PMC/PMD side if required.
Figure6-19 : Local FTP Server Setting Page
Page 78
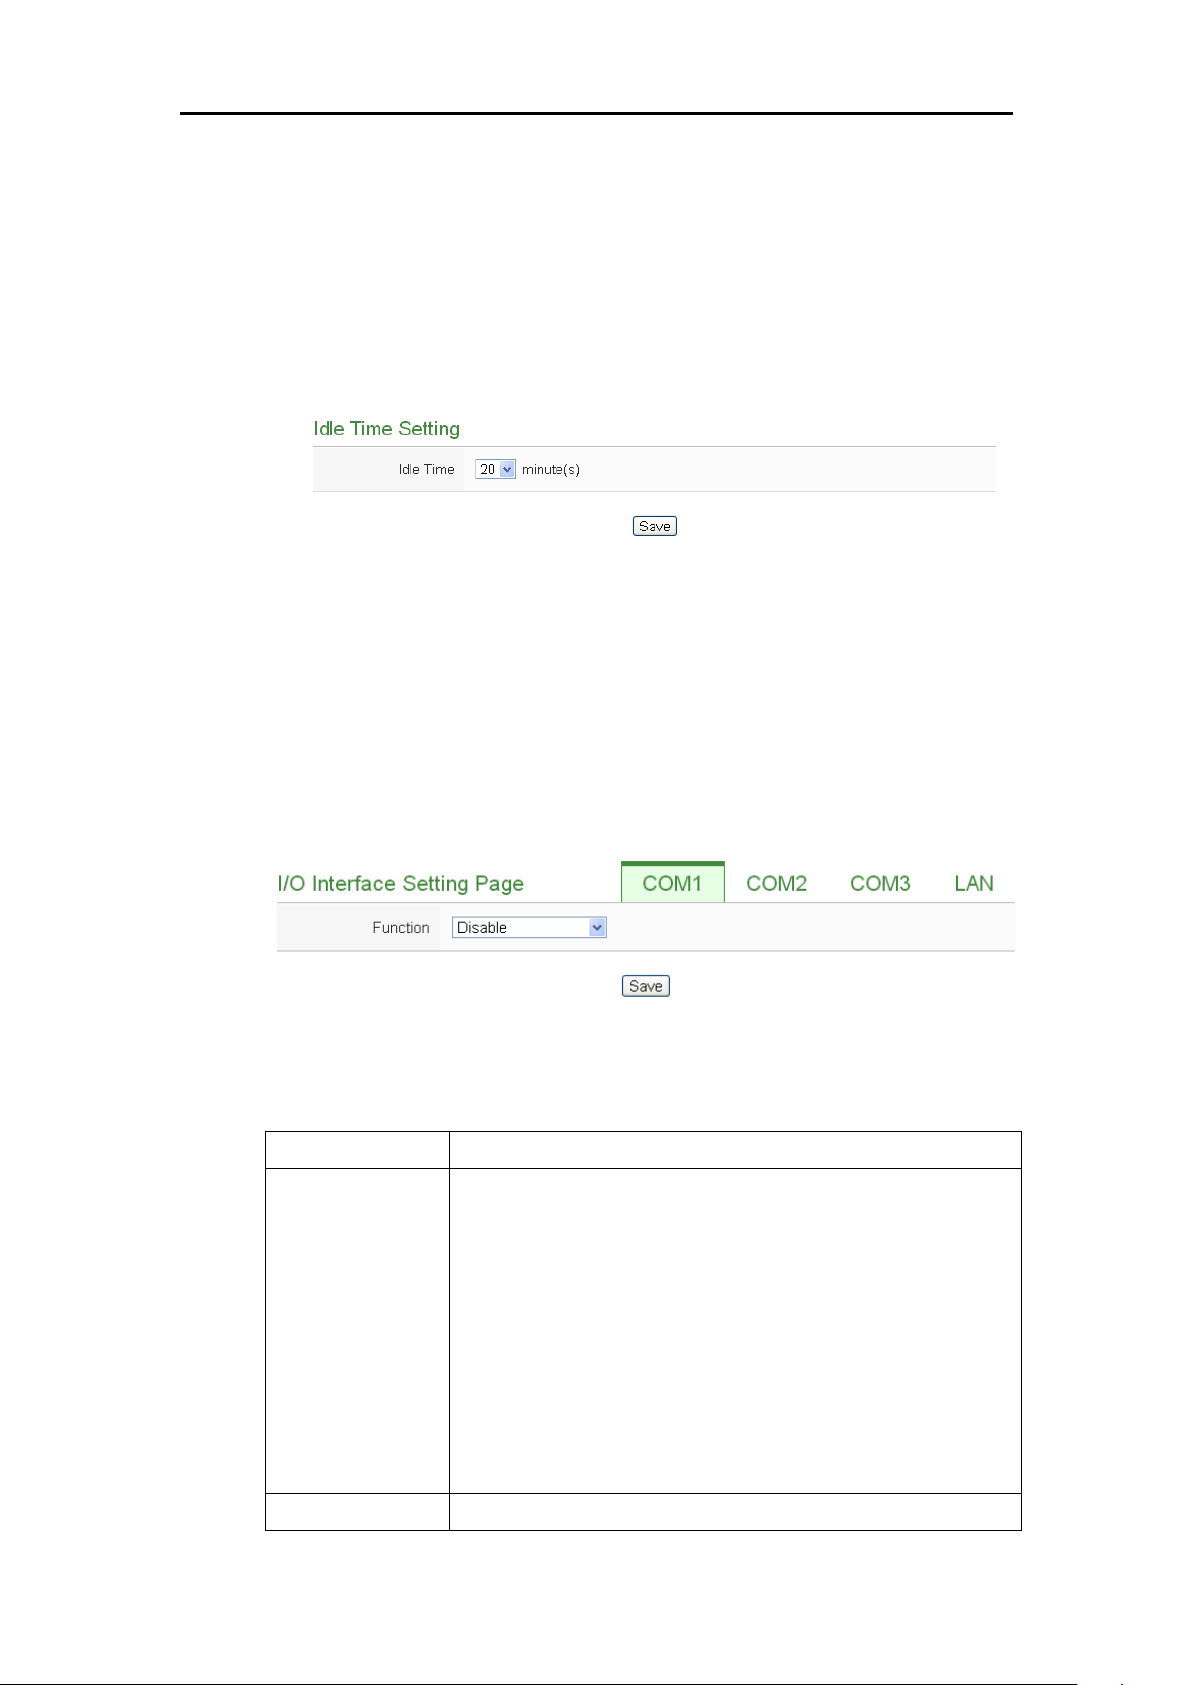
ICP DAS PMC/PMD Series User Manual
65
Model
I/O interface function
PMC-5151
COM1(RS-232):Reserved specifically for Modbus
RTU Slave for connections to HMI or SCADA.
COM2/COM3(RS-485):Reserved for Modbus RTU
Master to connect Modbus RTU slave devices or for
Modbus RTU Slave to connect HMI or SCADA.
LAN:LAN connection is by default set for Modbus
TCP Slave to connect HMI or SCADA. It can also be
set for Modbus TCP Mater to connect Modbus TCP
devices.
PMC-52xx
COM2(RS-232):Reserved specifically for Modbus
Idle Time Setting
After the administrator login into the PMC/PMD page, when the idle
time exceeds the pre-set time interval (default is 10 minutes), the
administrator will be automatically logout. The idle time could be set as
Disable/10/20/30/60 minutes, after the setting is completed, click “Save”
button to save the changes.
Figure6-20 : Idle Time Setting Page
6.6 I/O Interface Setting
I/O Interface Setting allows to setup the function settings on COM Port or
LAN of PMC/PMD. The setting interface is shown as below (Using
PMC-5151 as an example):
Figure6-21 : I/O Interface Setting Page
The I/O interface functions for PMC/PMD are as below.
Page 79
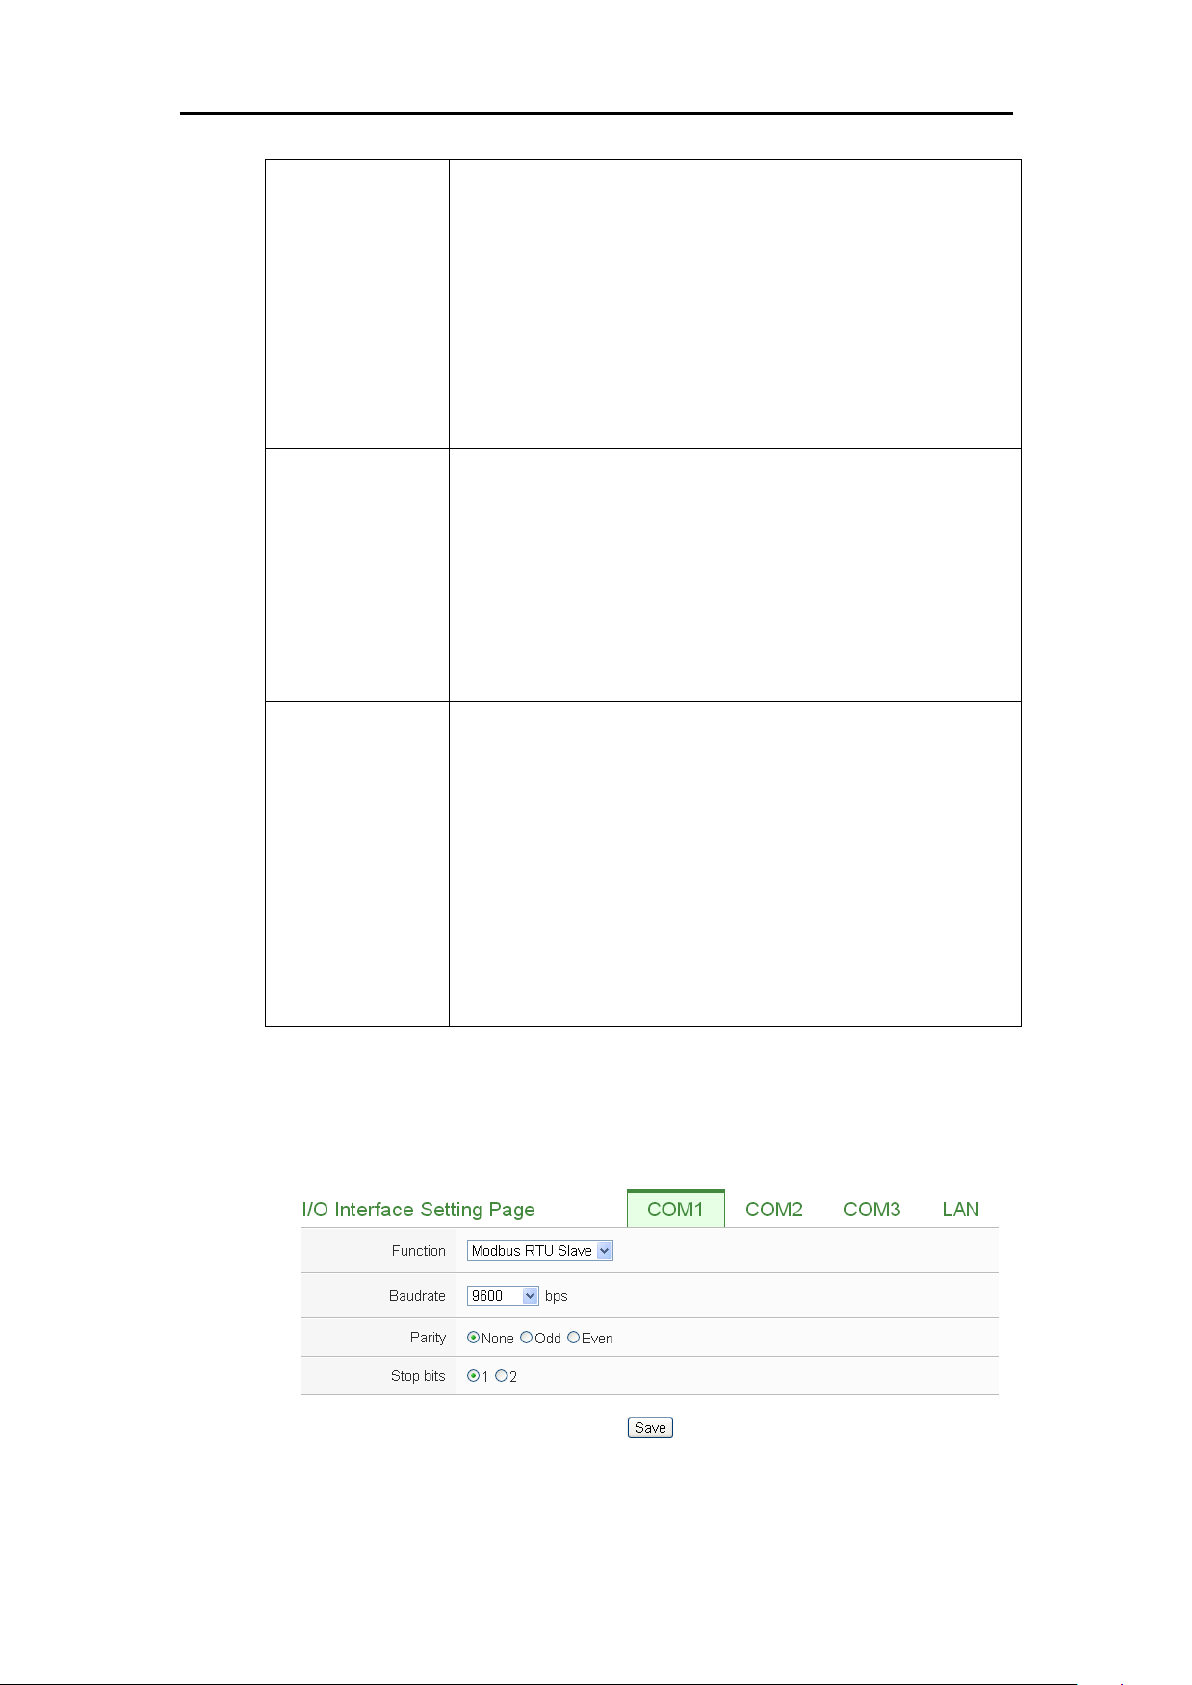
ICP DAS PMC/PMD Series User Manual
66
RTU Slave for connections to HMI or SCADA.
COM3/COM4(RS-485):Reserved for Modbus RTU
Master to connect Modbus RTU slave devices or for
Modbus RTU Slave to connect HMI or SCADA.
LAN:LAN connection is by default set for Modbus
TCP Slave to connect HMI or SCADA. It can also be
set for Modbus TCP Mater to connect Modbus TCP
devices.
PMD-2201
COM1/COM2(RS-485):Reserved for Modbus RTU
Master to connect Modbus RTU slave devices or for
Modbus RTU Slave to connect HMI or SCADA.
LAN:LAN connection is by default set for Modbus
TCP Slave to connect HMI or SCADA. It can also be
set for Modbus TCP Mater to connect Modbus TCP
devices.
PMD-4201
COM1/COM2(RS-485):Reserved for Modbus RTU
Master to connect Modbus RTU slave devices or for
Modbus RTU Slave to connect HMI or SCADA.
COM3(RS-485):Reserved specifically for Modbus
RTU Slave for connections to HMI or SCADA.
LAN:LAN connection is by default set for Modbus
TCP Slave to connect HMI or SCADA. It can also be
set for Modbus TCP Mater to connect Modbus TCP
devices.
The following section will introduce how to set I/O interface for different
functions:
Connect to HMI or SCADA via COM Port
Figure6-22 : Function setting to connect to HMI or SCADA
Page 80
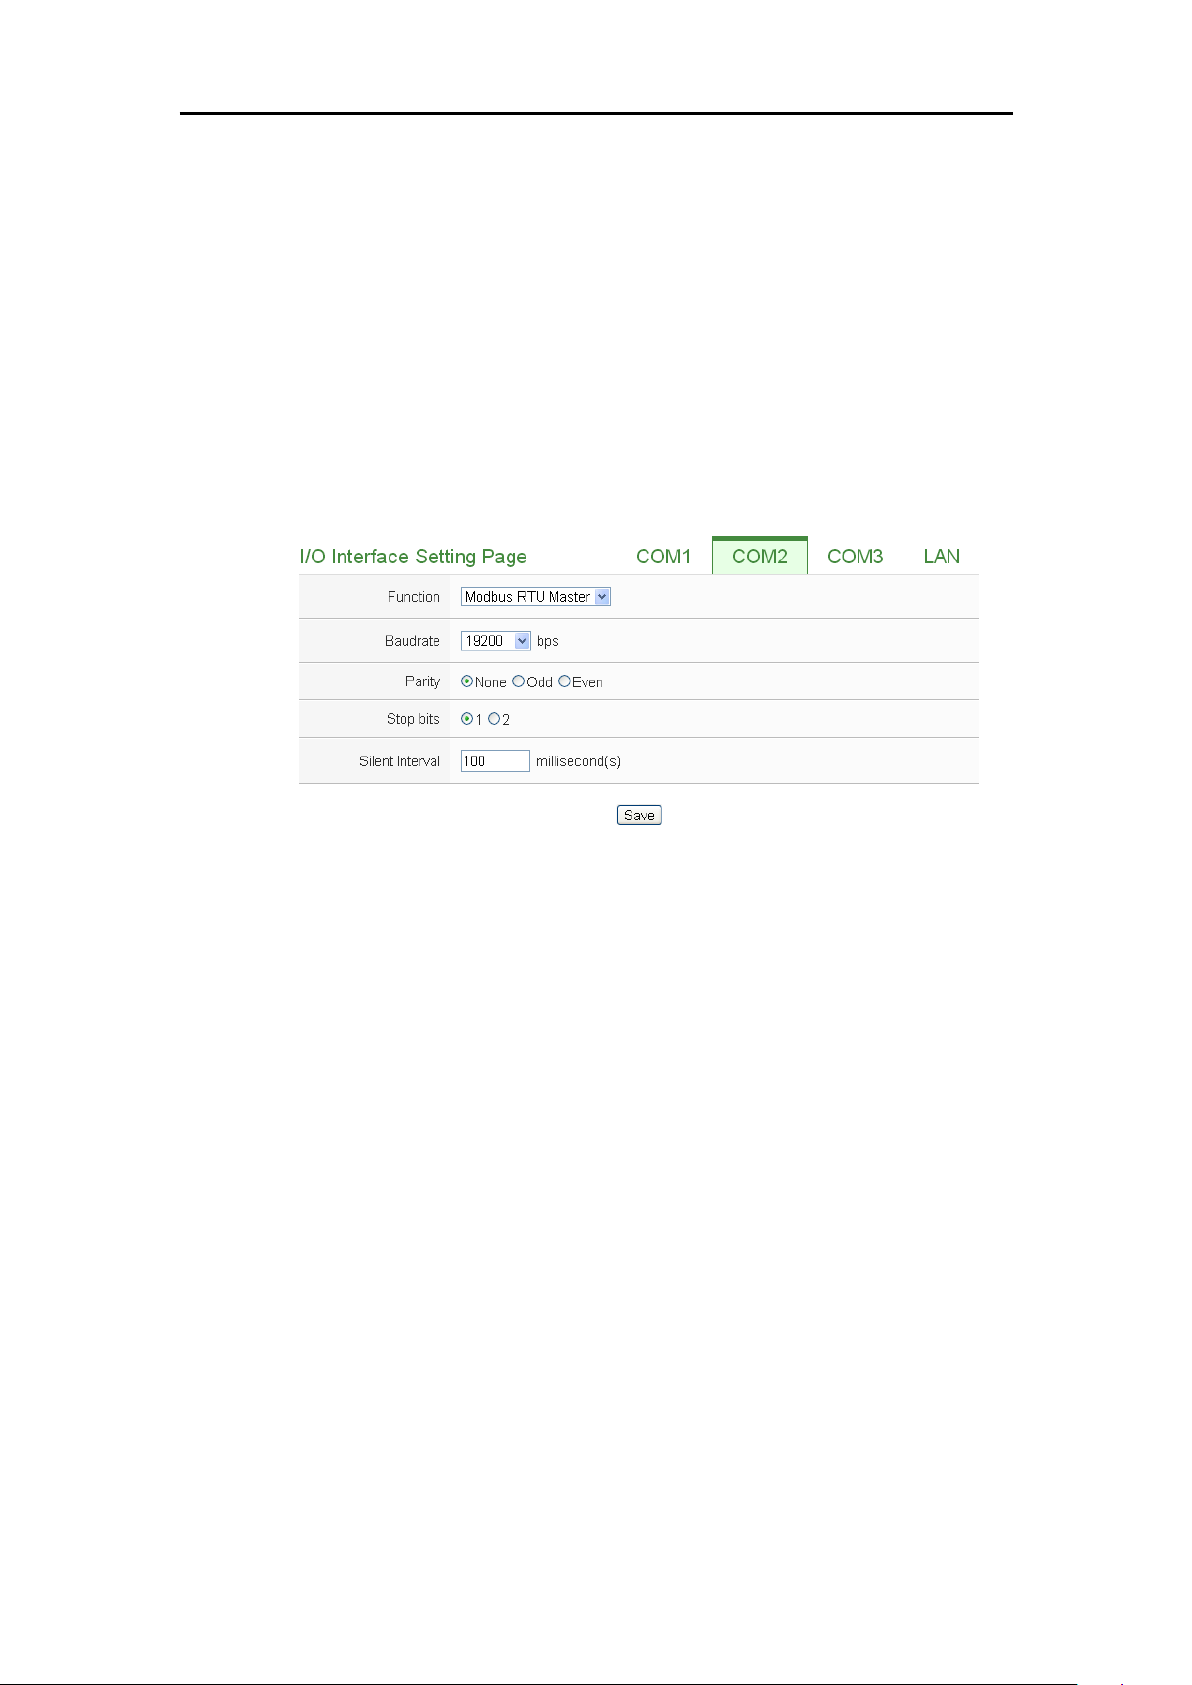
ICP DAS PMC/PMD Series User Manual
67
The settings steps are as below:
i. In the “Baudrate” field, select the Baudrate from the dropdown list, the
Baudrate of PMC/PMD and HMI or SCADA have to be set the same.
ii. In the “Parity” and “Stop bits” fields, set up the Parity and Stop bits.
The Parity and Stop bits of PMC/PMD and HMI or SCADA have to
be set the same.
iii. After all settings are completed, click “Save” button to save the
changes.
Connect to Modbus RTU slave device via COM Port.
Figure6-23 : Function setting to connect to Modbus RTU slave device
The settings steps are as below:
i. In the “Baudrate” field, select the Baudrate from the dropdown list, the
Baudrate of PMC/PMD and Modbus RTU slave device have to be set
the same.
ii. In the “Parity” and “Stop bits” fields, set up the Parity and Stop bits.
The Parity and Stop bits of PMC/PMD and Modbus RTU slave device
have to be set the same.
iii. In the “Silent Interval” field, input the time interval between successive
sending of commands from the PMC/PMD to the Modbus RTU slave
device, the unit will be millisecond (ms).
Please Note: After the “Baudrate” is selected, the system will
automatically generate a proper value in the “Silent Interval” field.
For each Modbus RTU Slave device has different Modbus command
process capability, the response time for sending result from Modbus
RTU Slave device to PMC/PMD might be different. The user can
adjust this value to most appropriate time interval, such as: extend
this value to make sure every Modbus RTU Slave device connected to
Page 81
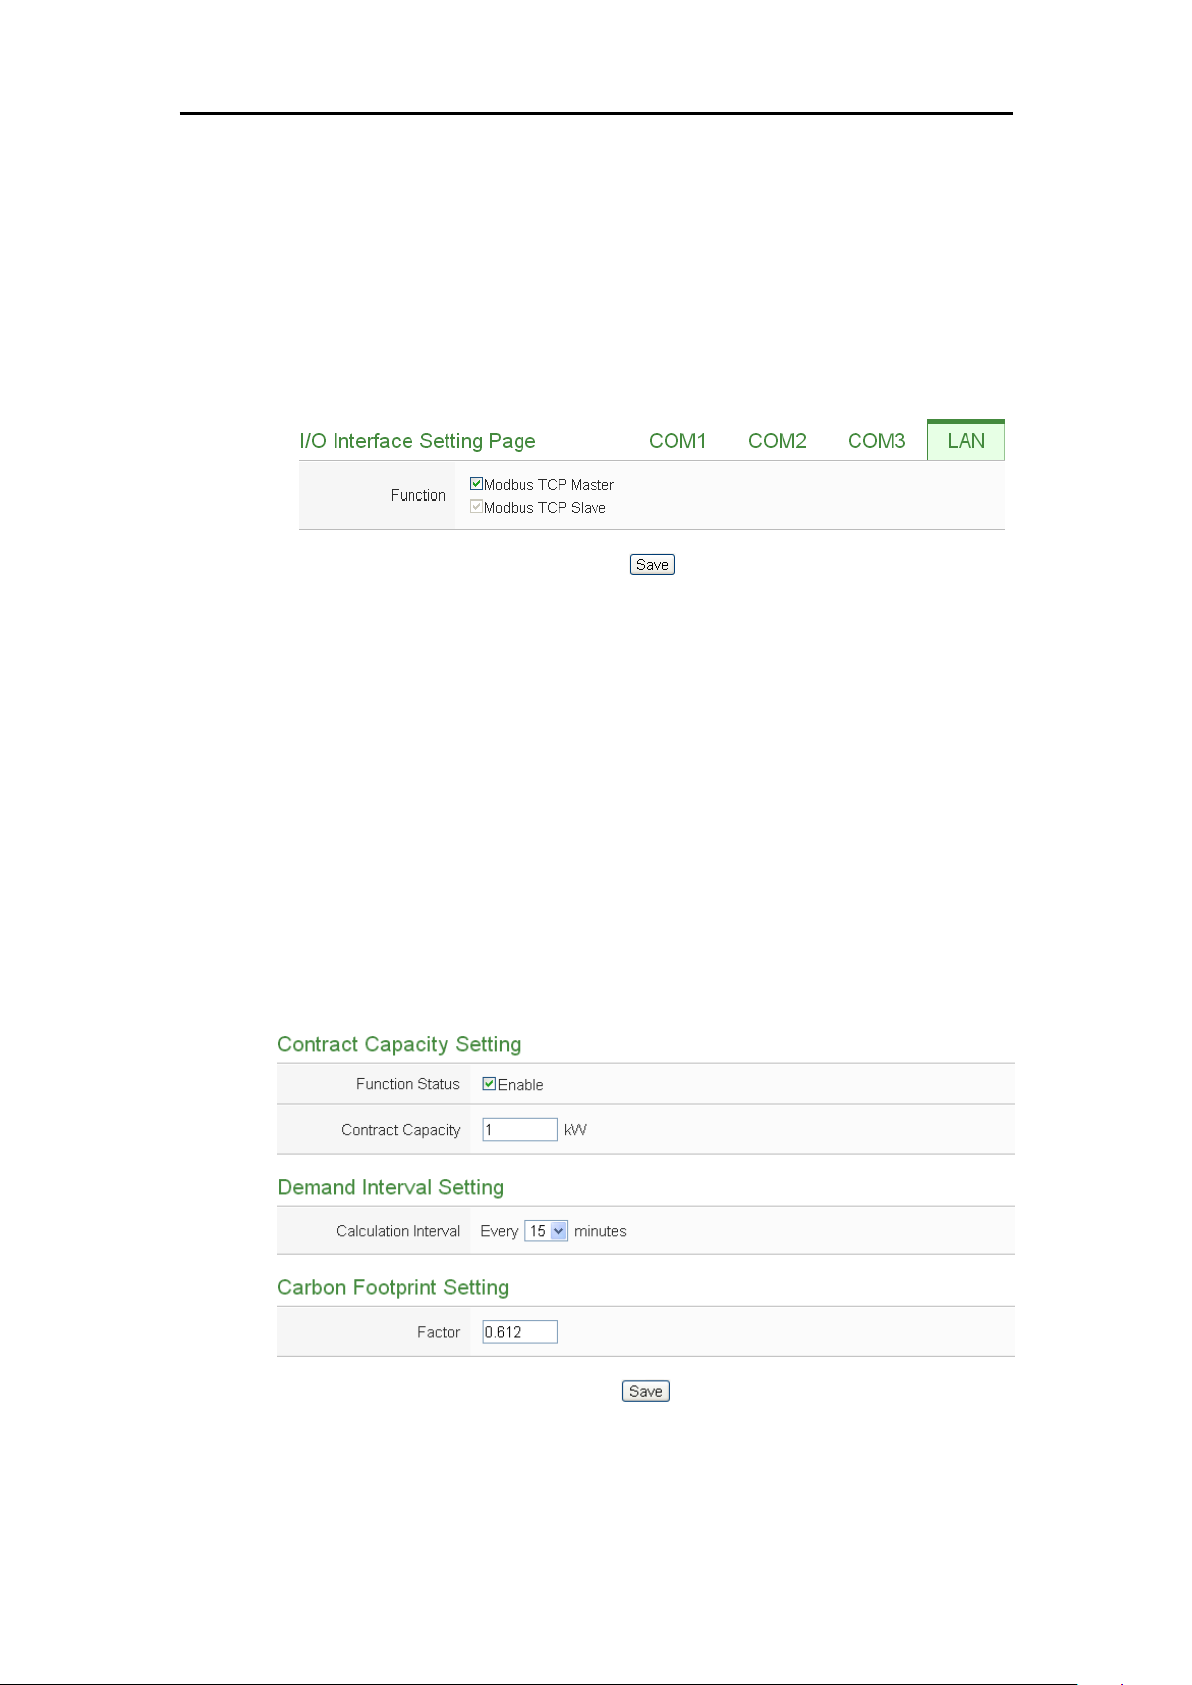
ICP DAS PMC/PMD Series User Manual
68
the PMC/PMD has enough time to process the Modbus command, or
shorten this value to improve the efficiency of the poll mechanism
between Modbus RTU Slave device and PMC/PMD.
iv. After all settings are completed, click “Save” button to save the
changes.
Connect to HMI (or SCADA) and Modbus TCP Slave device via LAN
Figure6-24 : I/O Function setting about LAN
The LAN function on PMC/PMD is by default set for Modbus TCP
Slave to connect HMI or SCADA. User can also select the “Modbus
TCP Master” Checkbox to enable the Modbus TCP Mater function for
connecting to Modbus TCP Slave devices through Ethernet.
6.7 Other Setting
In the “Other Setting” section, it allows to set up Contract Capacity Setting,
Demand Interval Setting and Carbon Footprint Setting. The setting interface
is shown as below:
Figure6-25 : Other setting page
Contract Capacity Setting
Page 82
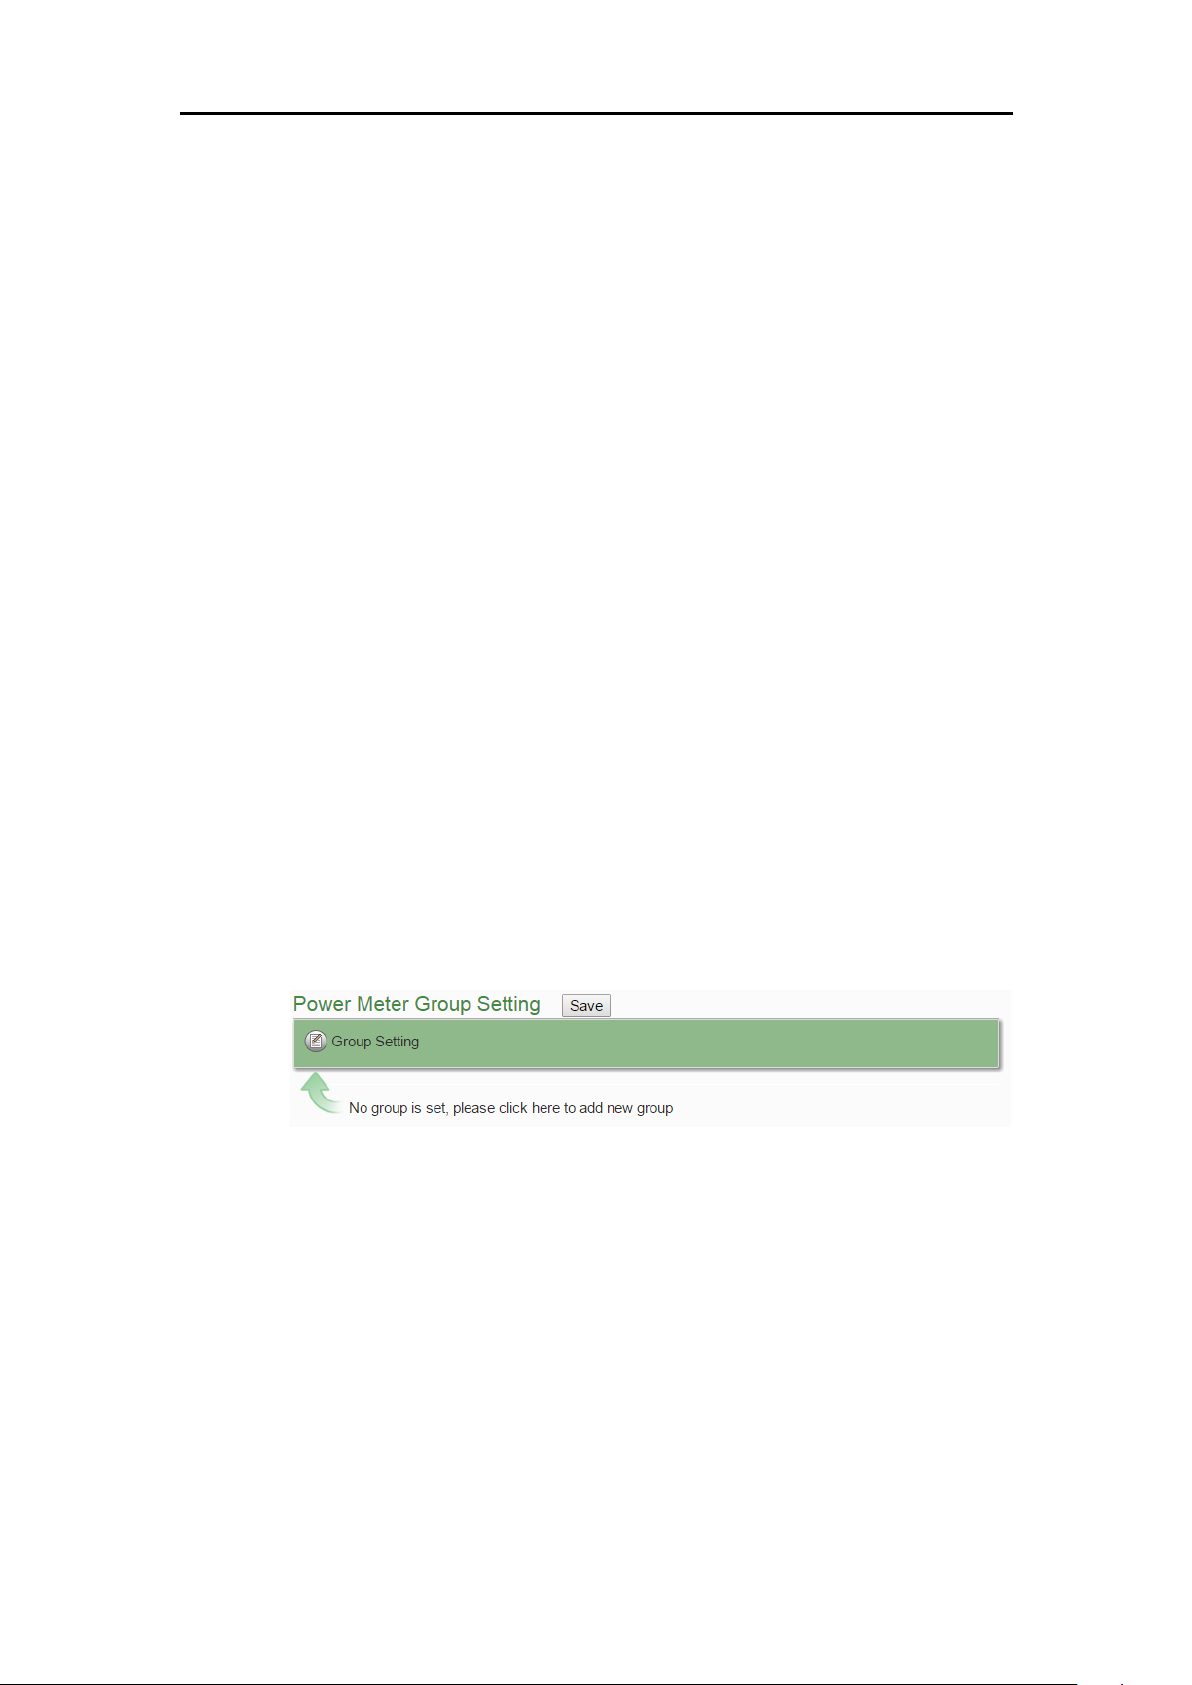
ICP DAS PMC/PMD Series User Manual
69
In this section, it allows to enable and set Contract Capacity. To enable
the Contract Capacity function, click on “Enable” and input the Contract
Capacity. Click “Save” button to save the settings. The Contract
Capacity being set will be displayed on the System Setting main page.
Demand Interval Setting
In this section, it allows to set Demand Interval Setting. The system will
calculate the demand according to this demand interval. The default
interval is 15 minutes; the user could set the interval to be 15/30/60
minutes. Click “Save” button to save the settings.
Carbon Footprint Setting
In this section, it allows to set Carbon Footprint Setting. Please input the
Carbon Footprint factor based on the Carbon Footprint factors for
countries worldwide that the International Energy Agency (IEA)
published.
6.8 Power Meter Group Setting
The power meter group setting function allows user to create groups that
contain specific loops/phases of power meters for easy group classification.
These pre-set groups can be inquired in “Power Data Information” and
“Historical Electricity Analysis” pages for power data analysis. The power
meter group setting page is shown as below:
Please refer to the following chapters to setup the group/subgroup and click
the “Save” button to save the changes.
Figure6-26 : Power Meter Group Setting
6.8.1 Group and Subgroup Viewing
Click the group or subgroup bar to expand/hide the lists.
Page 83
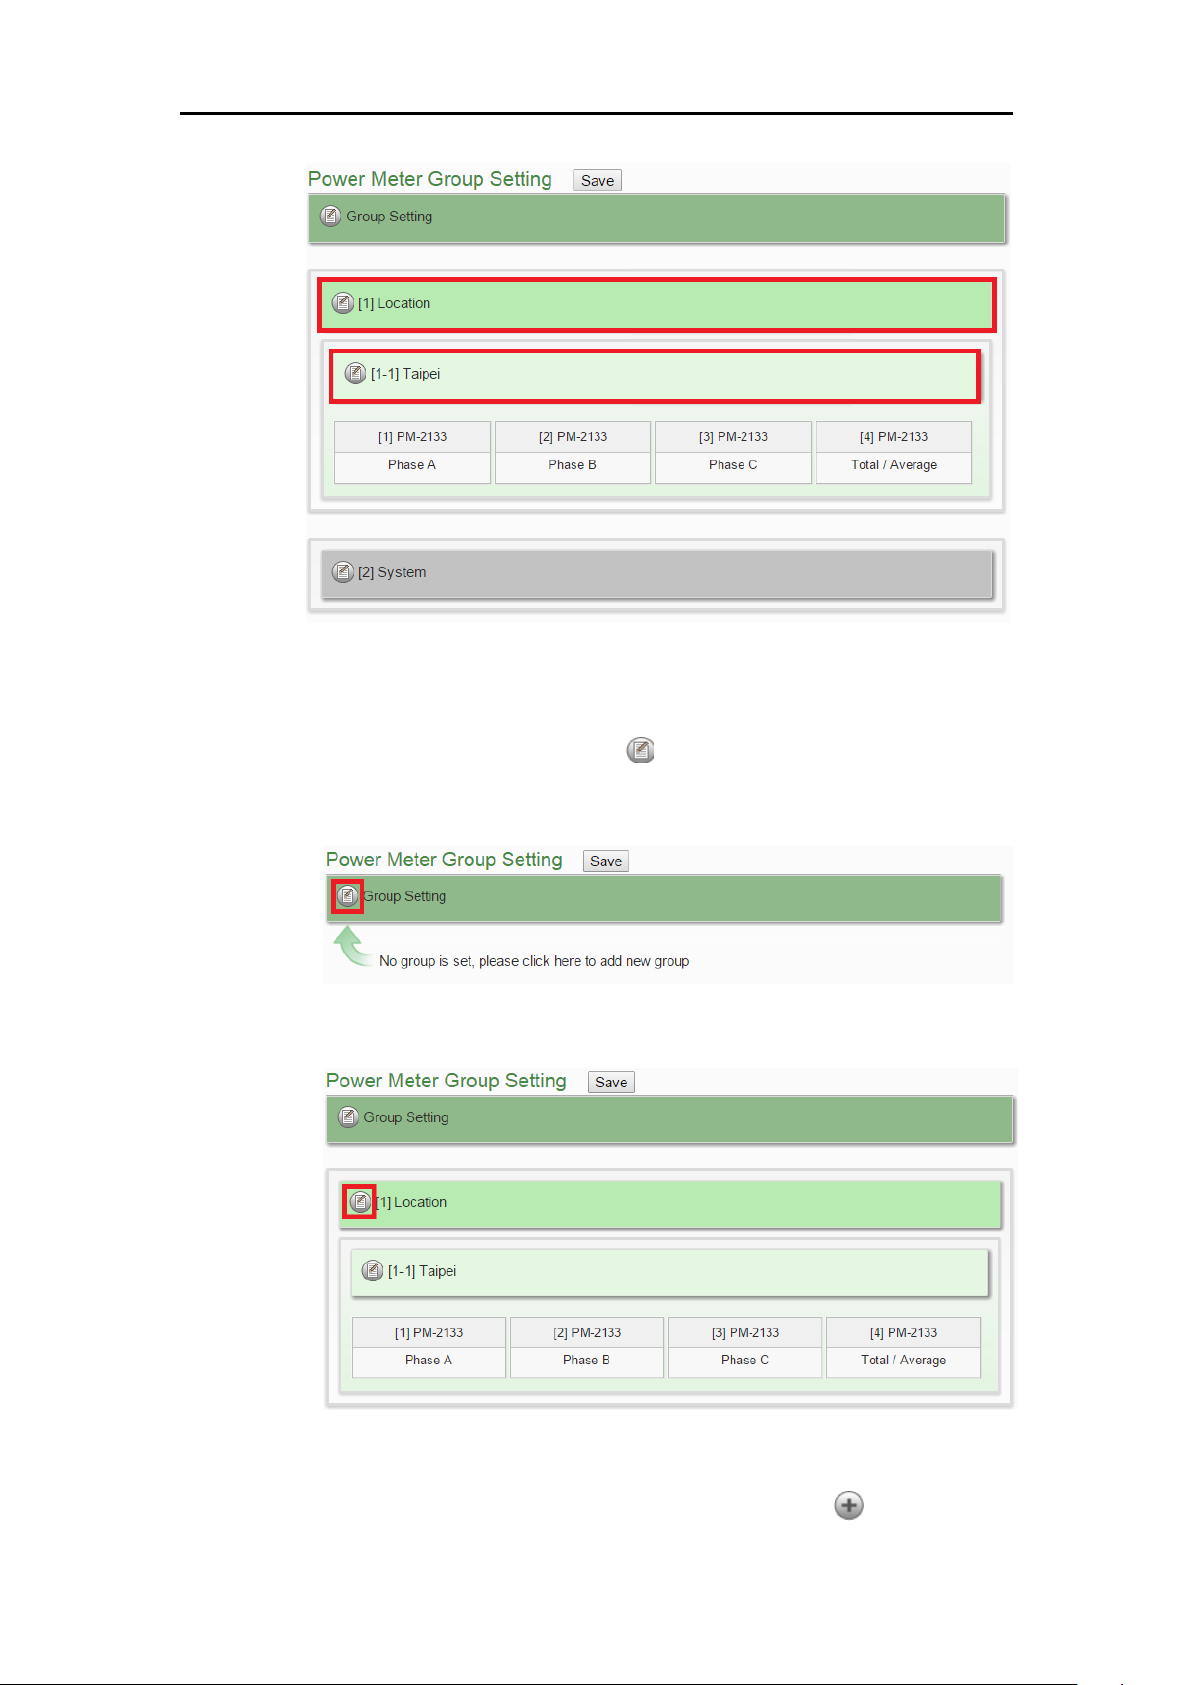
ICP DAS PMC/PMD Series User Manual
70
Figure6-27 : Group and Subgroup Viewing
6.8.2 Group and Subgroup Setting
i Click the “Set up” button ( ) of group or subgroup to open the
setting window.
Figure6-28 : Group Setting
Figure6-29 : Subgroup Setting
ii Input the group/subgroup name and click to add this
Page 84
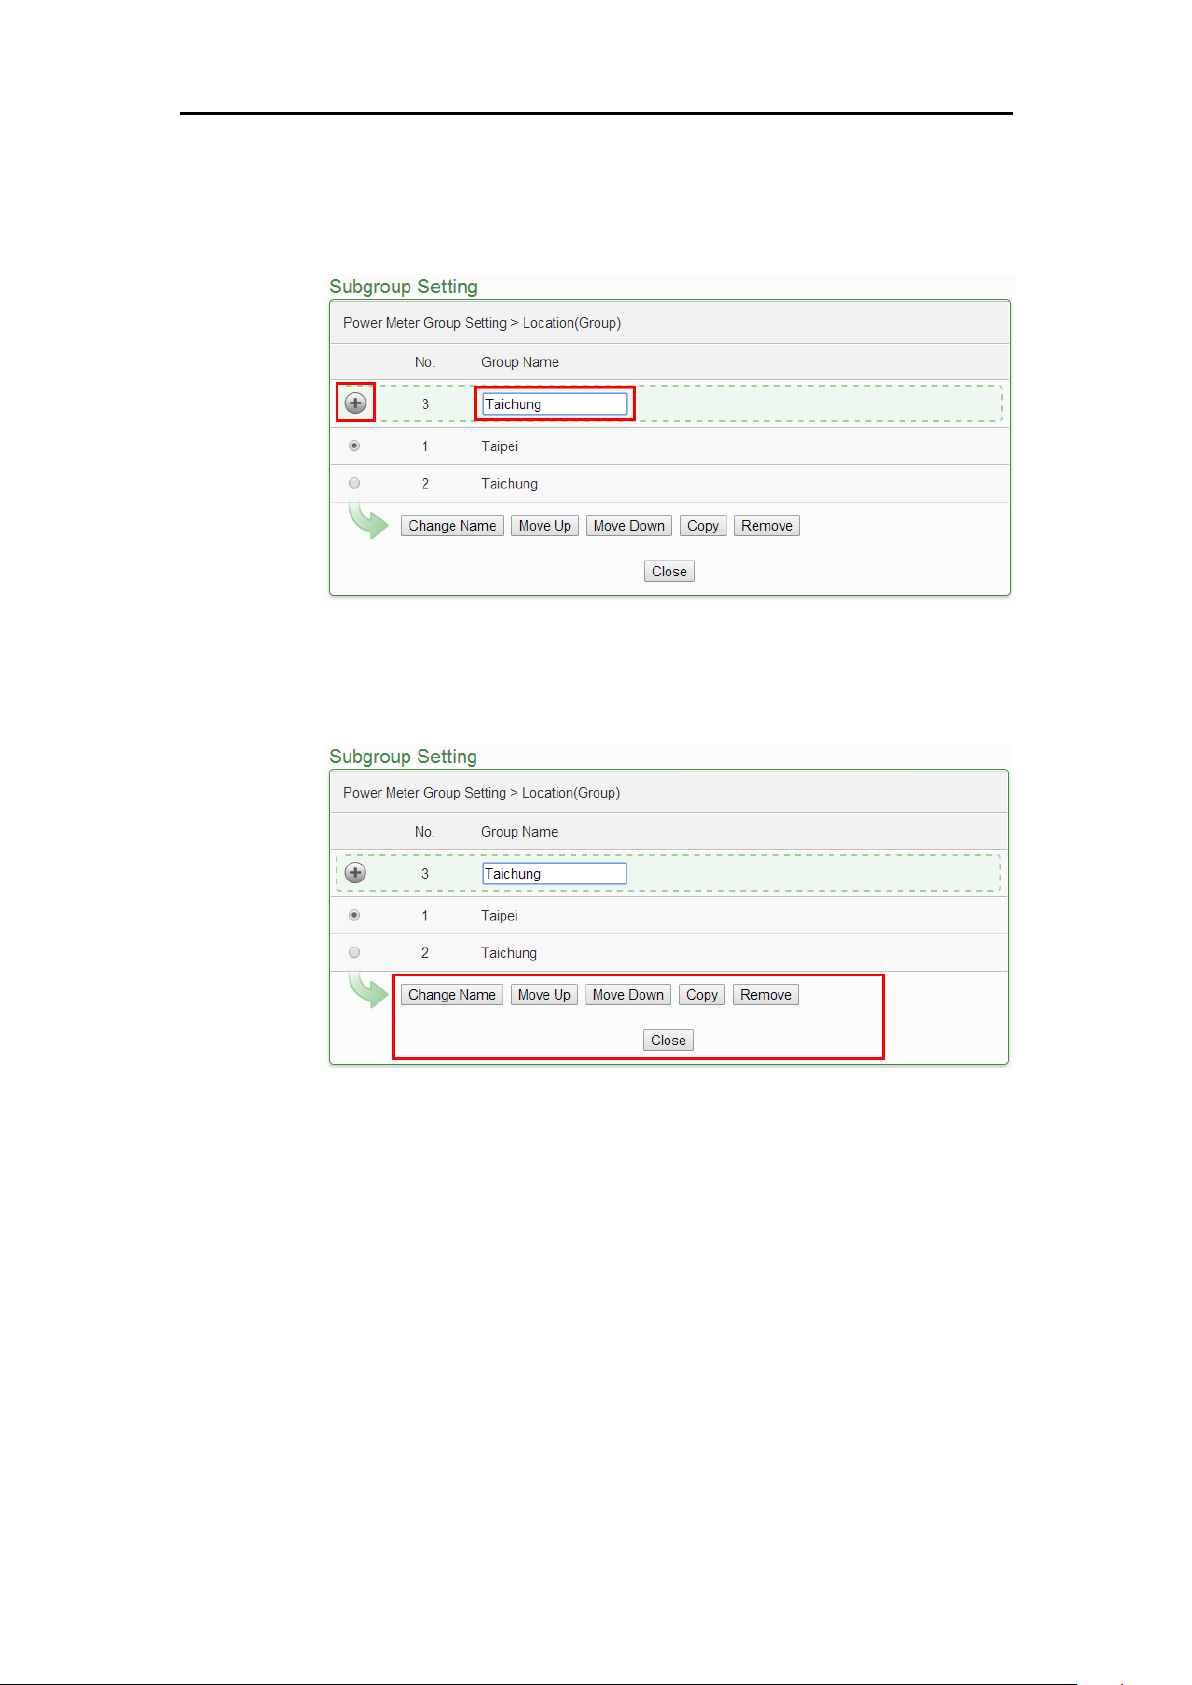
ICP DAS PMC/PMD Series User Manual
71
group/subgroup to the lists. Click “Close” button to return to group
setting page.
Figure6-30 : Subgroup Setting Window
6.8.3 Group and Subgroup configuration
Figure6-31 : Configurations for Subgroup
The group/subgroup configurations can be done on the
Group/Subgroup Setting page. Please select the group/subgroup first
and click on the function button to perform the configurations:
Change Name:Click the radio button in front of the group
and click on “Change Name” to change the name of selected
group. Click “OK” button to save the changes.
Move Up:Click the radio button in front of the group name
and click on “Move Up” to move the group to upper order
(upper index number (No.)).
Move Down:Click the radio button in front of the group
Page 85
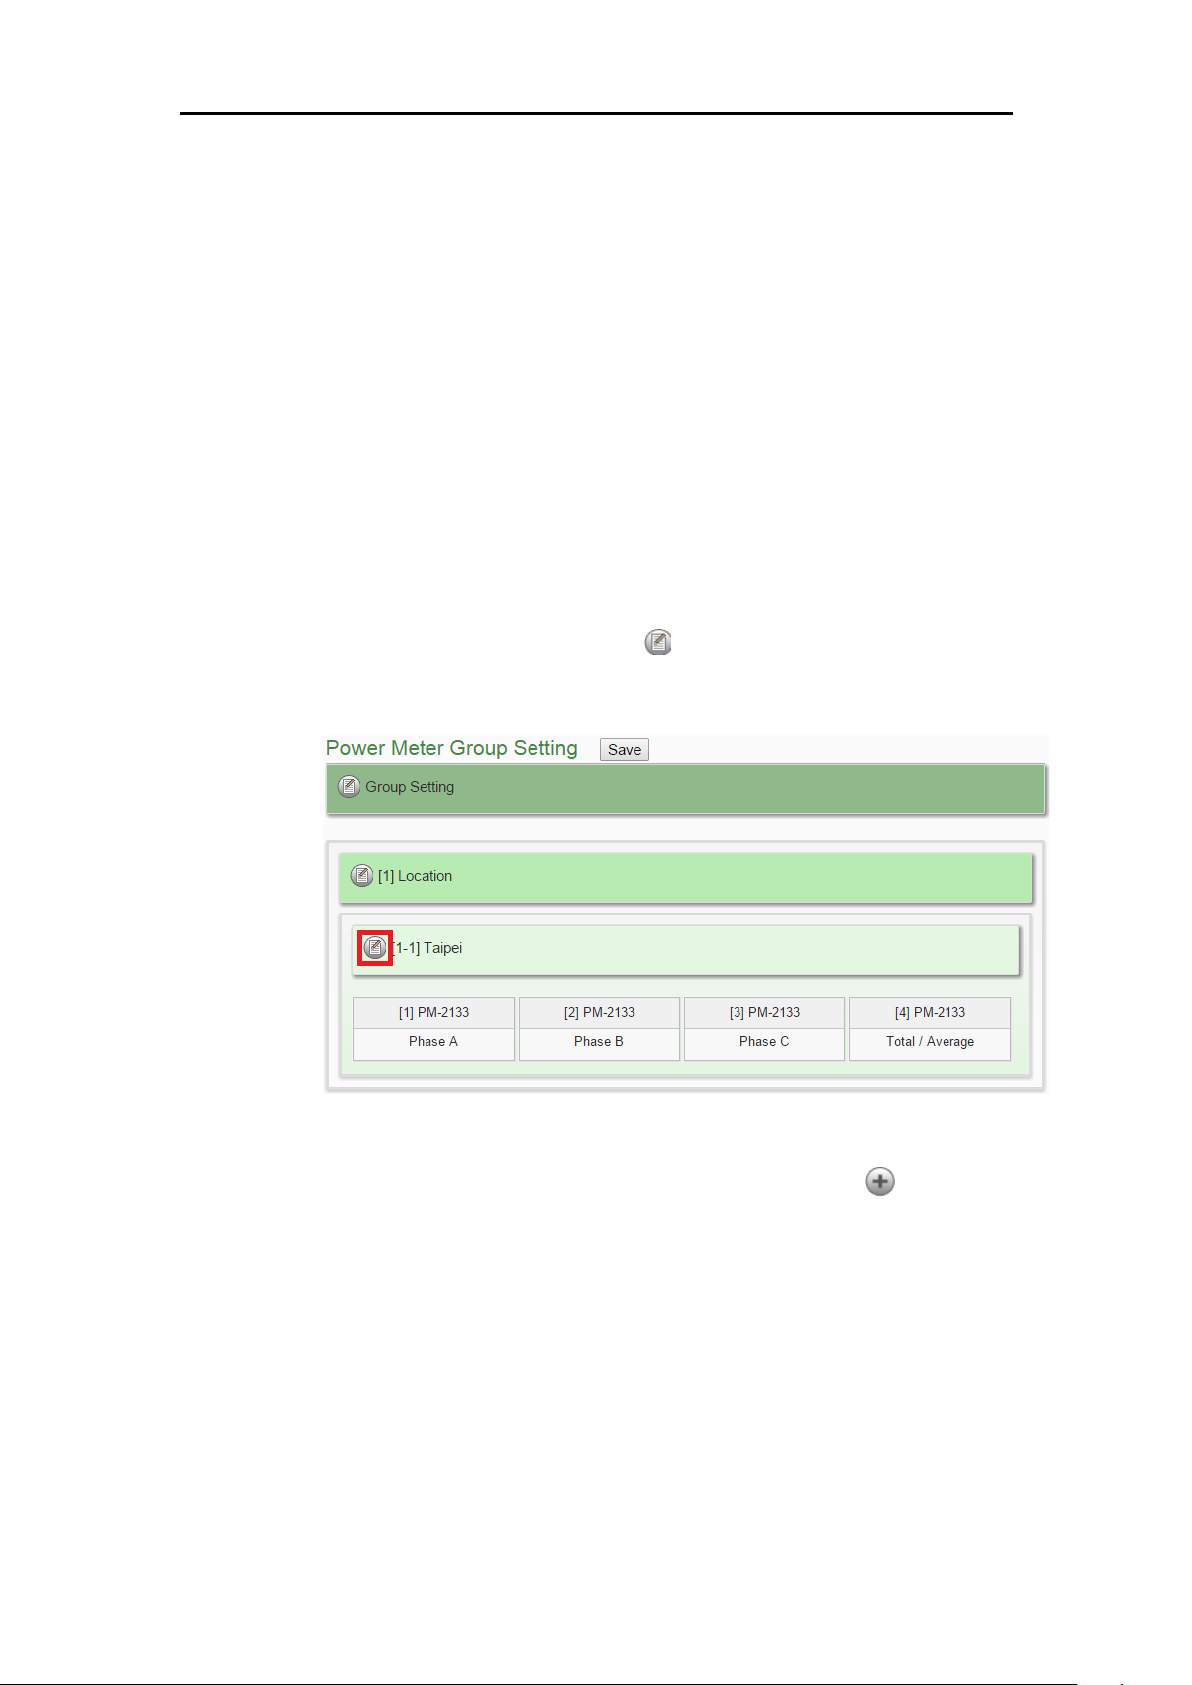
ICP DAS PMC/PMD Series User Manual
72
and click on “Move Down” to move the group to lower order
(lower index number (No.)).
Copy:To copy the settings of a pre-set group to the new
group, please click the radio button in front of the pre-set
group and then click on “Copy”, a new group (in sequence)
will be added to the list and the settings of the old group will
be copied to this newly added group.
Remove:Click the radio button in front of the group and
click on “Remove” to remove the selected group.
Close:Click the “Close” button to return to group setting
page.
6.8.4 Setup the loops/phases of the subgroup
i Click the “Set up” button ( ) of subgroup to open the setting
window.
Figure6-32 : Loops/Phases of subgroup Setting
ii Select the loop/phase of the power meter and click to add this
loop/phase to the lists. Click “Close” button to return to group
setting page.
Page 86
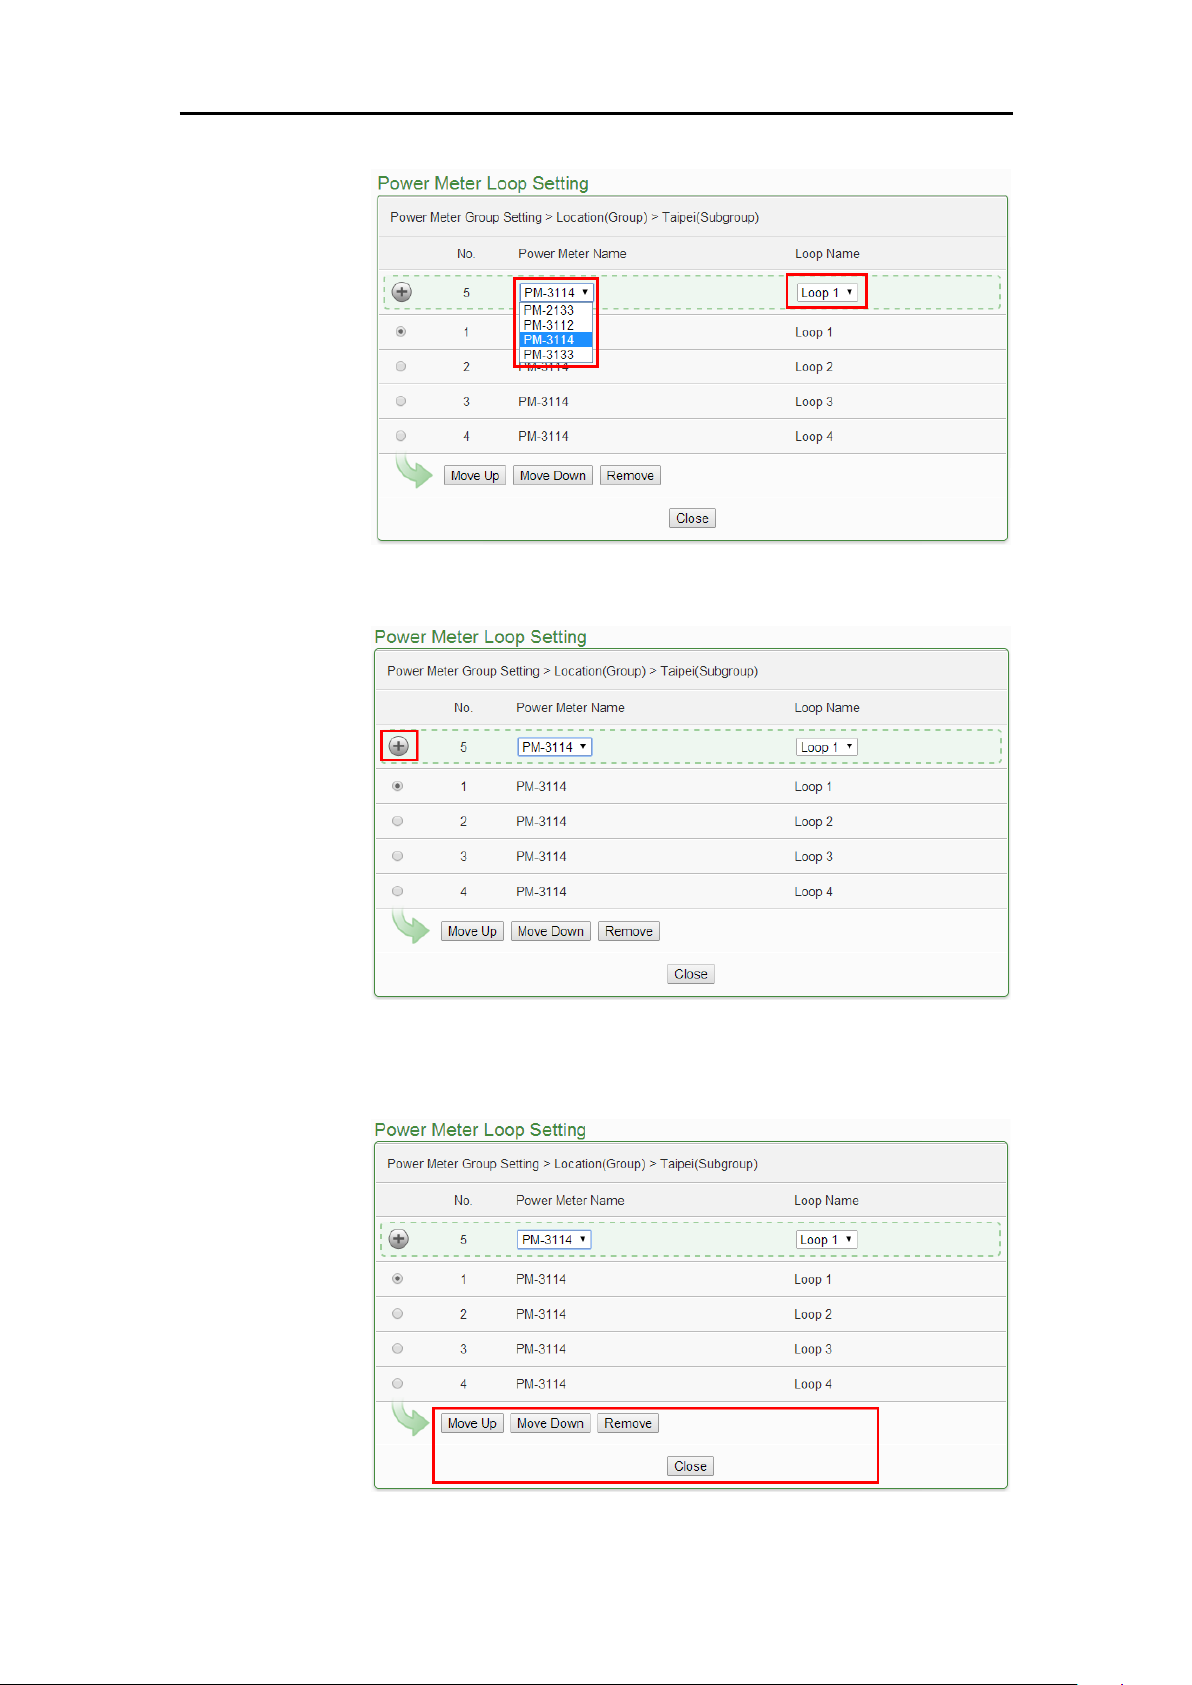
ICP DAS PMC/PMD Series User Manual
73
Figure6-33 : Choose Loops/Phased of Subgroup
Figure6-34 : Add Loops/Phases for Subgroup
6.8.5 Loop/Phase of group configuration
Figure6-35 : Configurations for Loops/Phased of Subgroup
Page 87

ICP DAS PMC/PMD Series User Manual
74
The loop/phase of subgroup configurations can be done on the Power
Meter Loop Setting page.. Please select the loop/phase first and click
on the function button to perform the configurations:
Move Up:Click the radio button in front of the loop/phase
name and click on “Move Up” to move the loop/phase to
upper order (upper index number (No.)).
Move Down : Click the radio button in front of the
loop/phase and click on “Move Down” to move the
loop/phase to lower order (lower index number (No.)).
Remove:Click the radio button in front of the loop/phase
and click on “Remove” to remove the selected loop/phase.
Close:Click the “Close” button to return to group setting
page.
Page 88
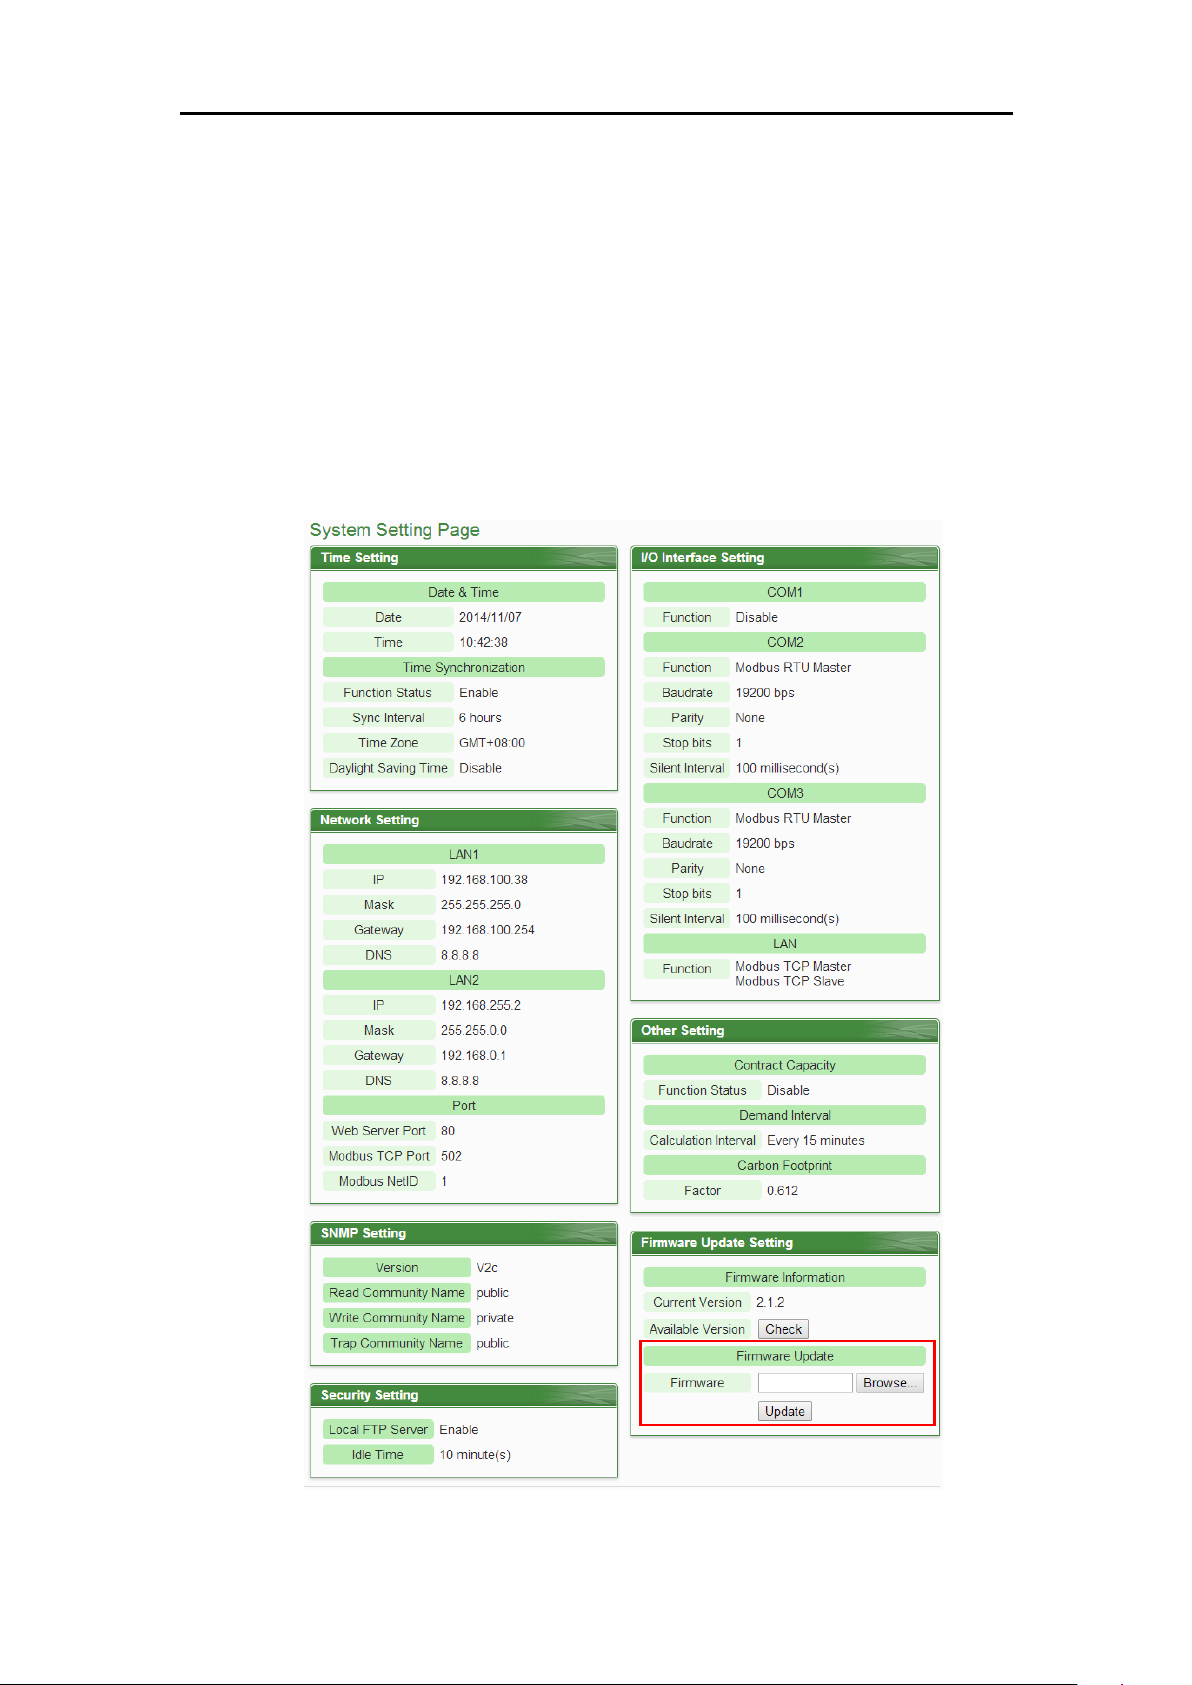
ICP DAS PMC/PMD Series User Manual
75
6.9 Firmware Update
PMC/PMD allows to update firmware via browser, after the update is
completed; the PMC/PMD doesn’t require to reboot. Please follow the steps
below:
i. Please contact ICP DAS service to obtain the latest version of the
PMC/PMD firmware file.
ii. Go to “System Setting” page, under the “Firmware Update Setting”,
click on “Browse”.
Figure6-36 : Firmware Update(1)
Page 89
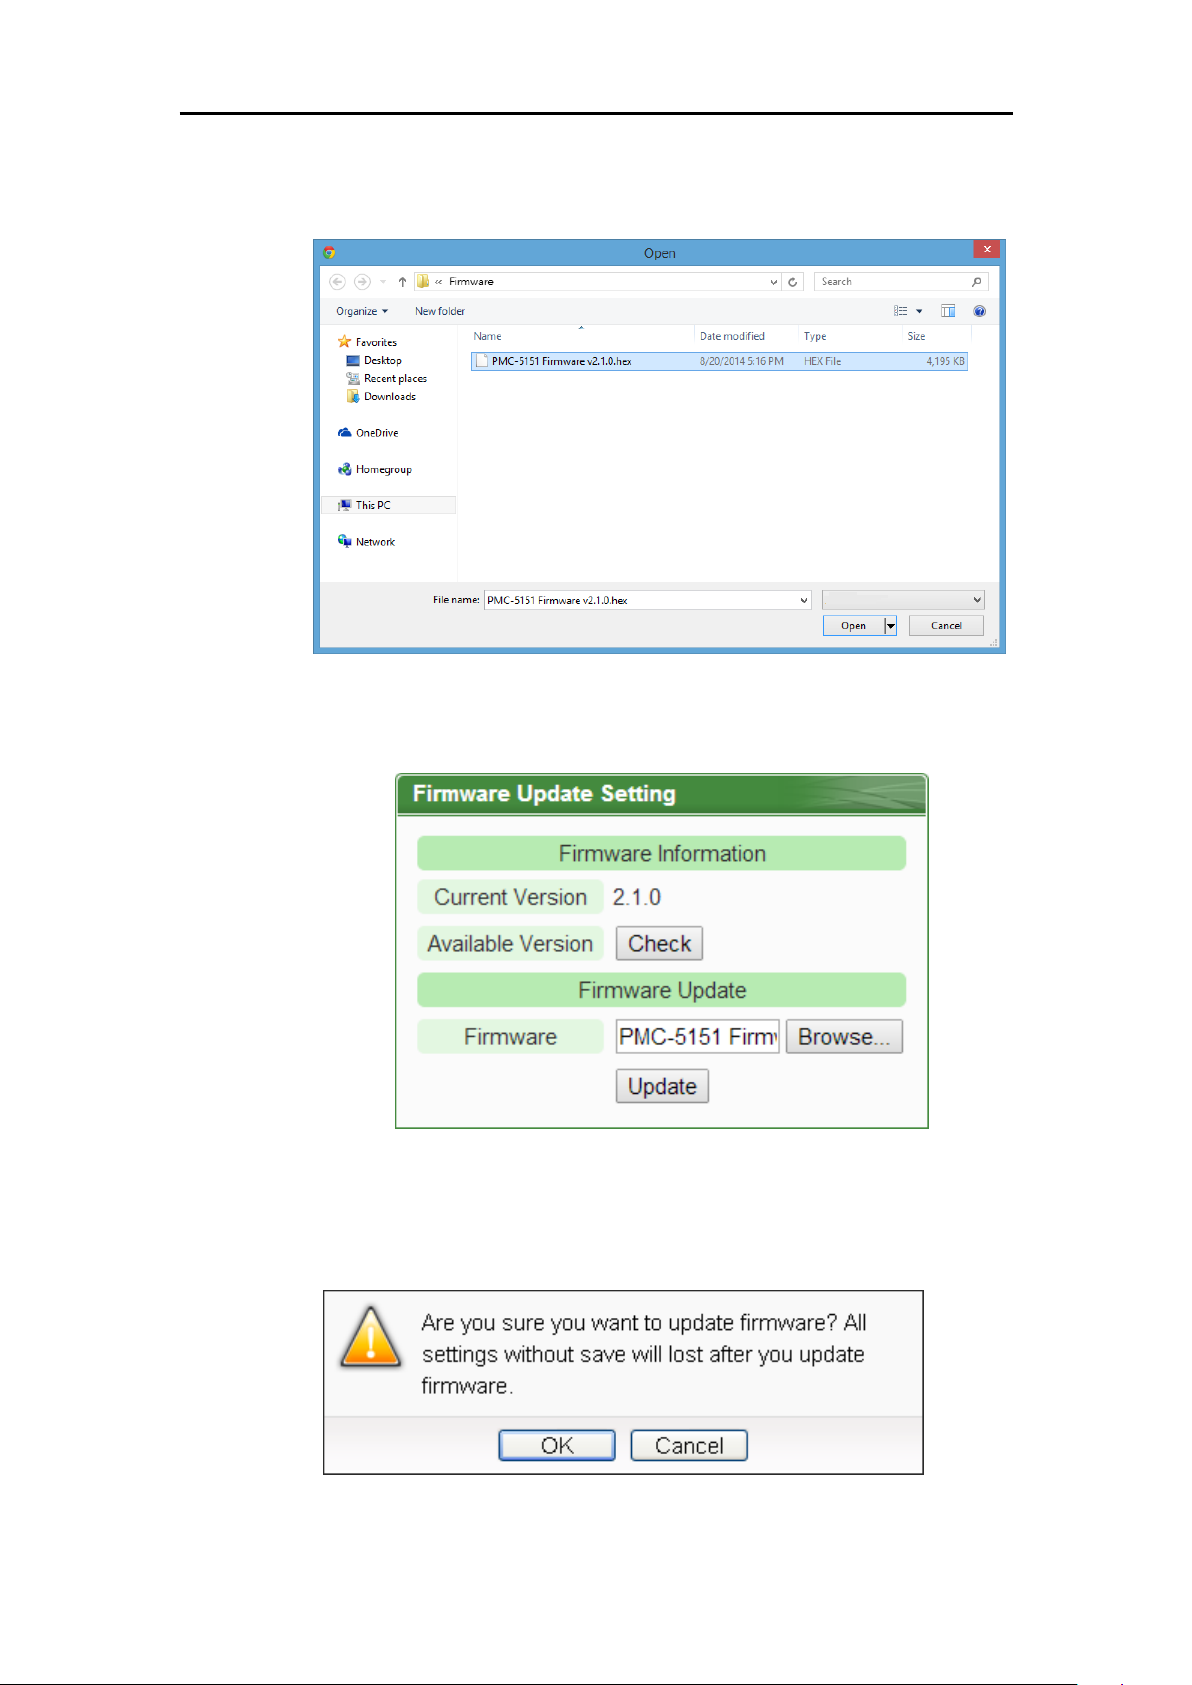
ICP DAS PMC/PMD Series User Manual
76
iii. Browse through to select the new firmware file and click “Open”.
Figure6-37 : Firmware Update(2)
iv. Click “Update” to update the firmware.
Figure6-38 : Firmware Update(3)
v. Click “OK” to start the firmware update, to cancel the firmware update,
click “Cancel”.
Figure6-39 : Firmware Update(4)
Page 90
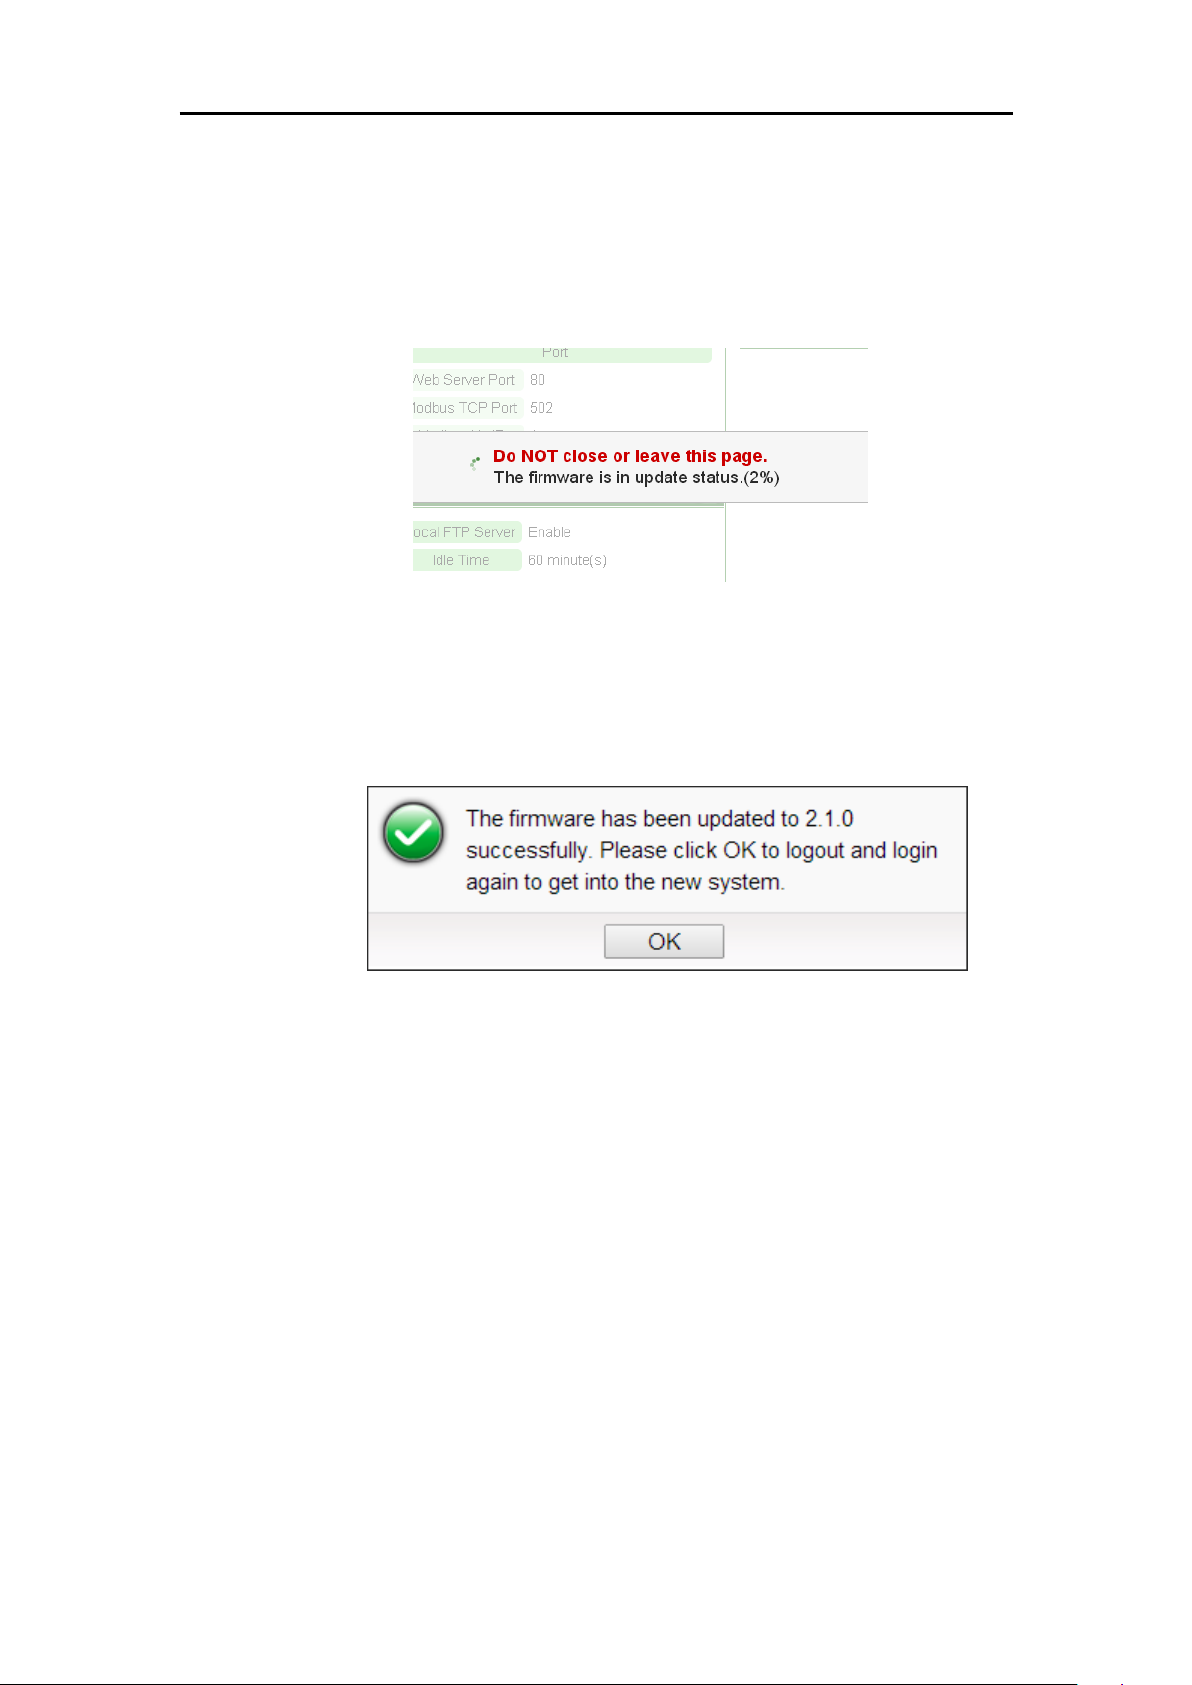
ICP DAS PMC/PMD Series User Manual
77
vi. Updating the firmware
Please note: when the firmware update process is started, please DO
NOT close the update window or perform any system modification, or
may result in unexpected failures.
Figure6-40 : Firmware Update(5)
vii. Click “OK” to complete the update process. After the update is
completed, please clear the cache and cookies on your browser. If the
update process is failed, please perform the update again.
Figure6-41 : Firmware Update(6)
Page 91
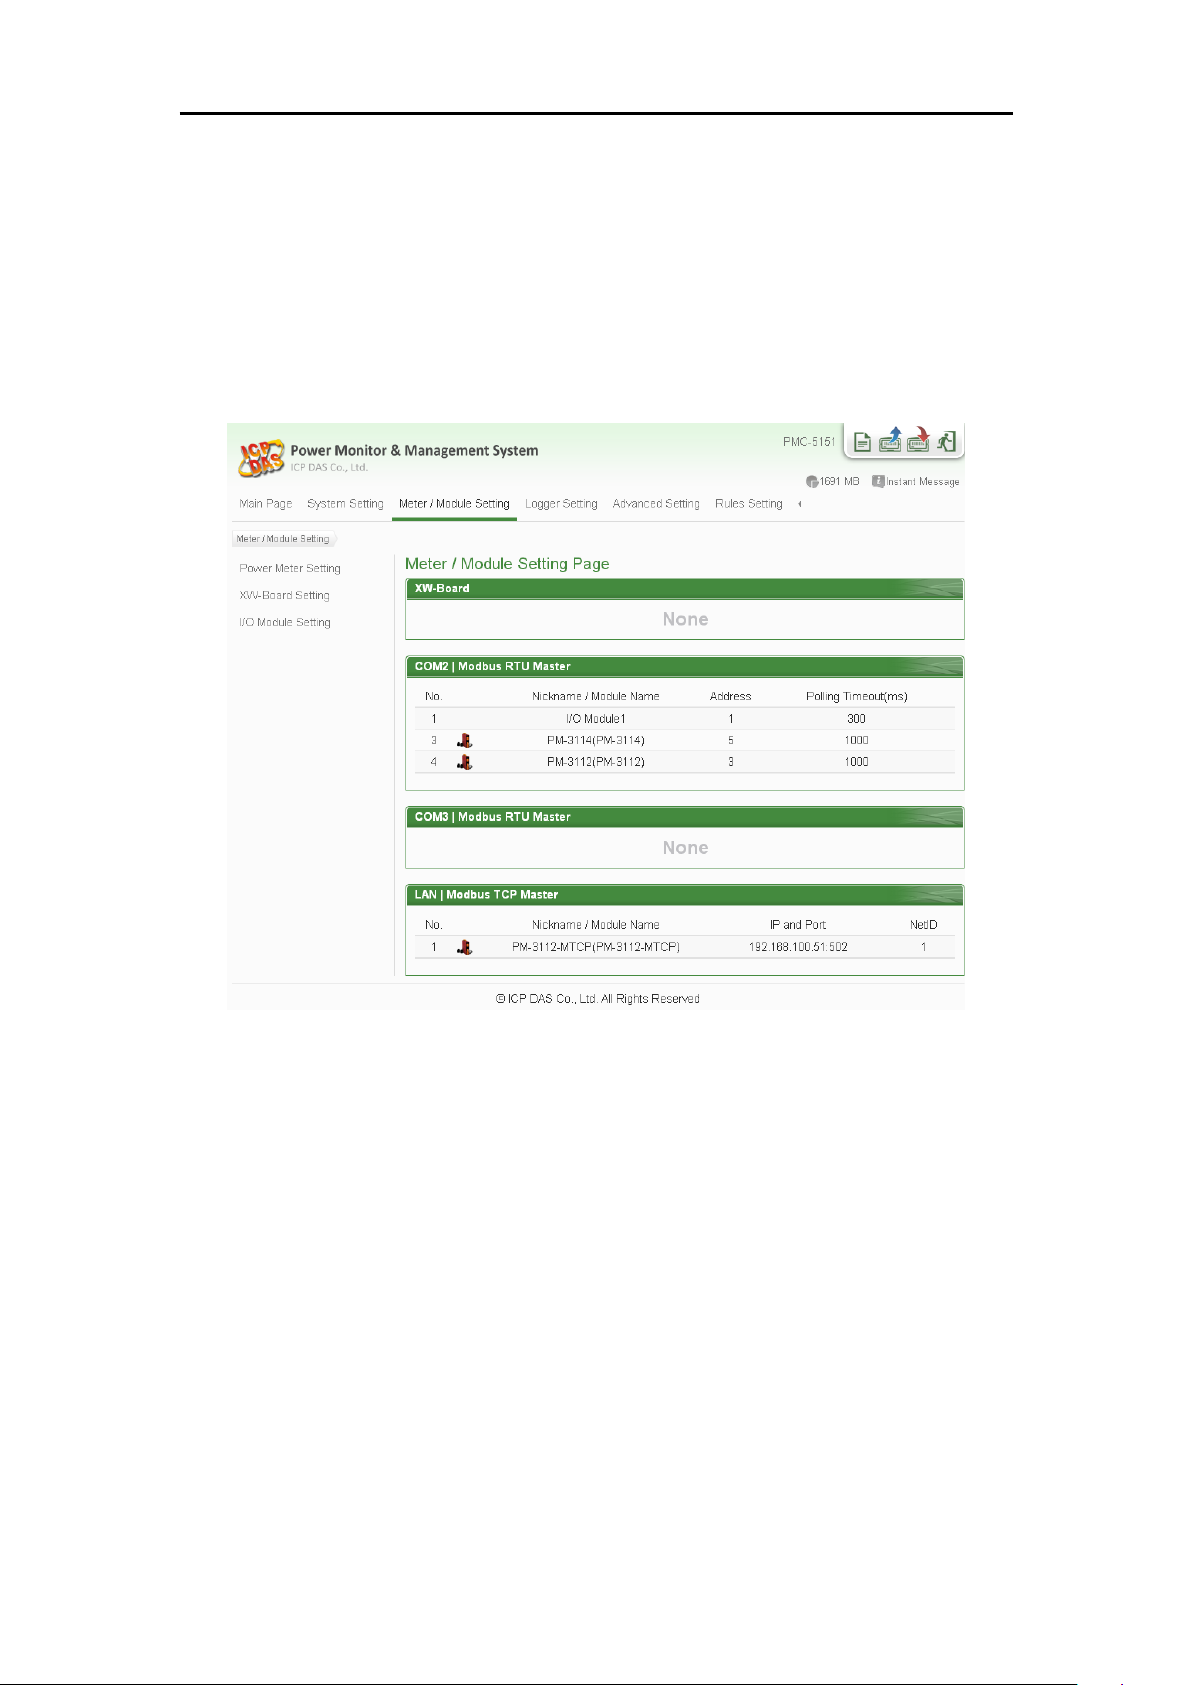
ICP DAS PMC/PMD Series User Manual
78
7 Power Meter & I/O Module Setting
Meter / Module Setting page allows to perform settings of the power meters and I/O
Modules that are connected to the PMC/PMD. After getting into the setting page, the
overview page will display current setting of the power meters and I/O Modules that
are connected to the PMC/PMD, shown as below:
Figure7-1 : Meter / Module Setting Page
More detailed information for each function setting will be given in the following
sections:
Page 92
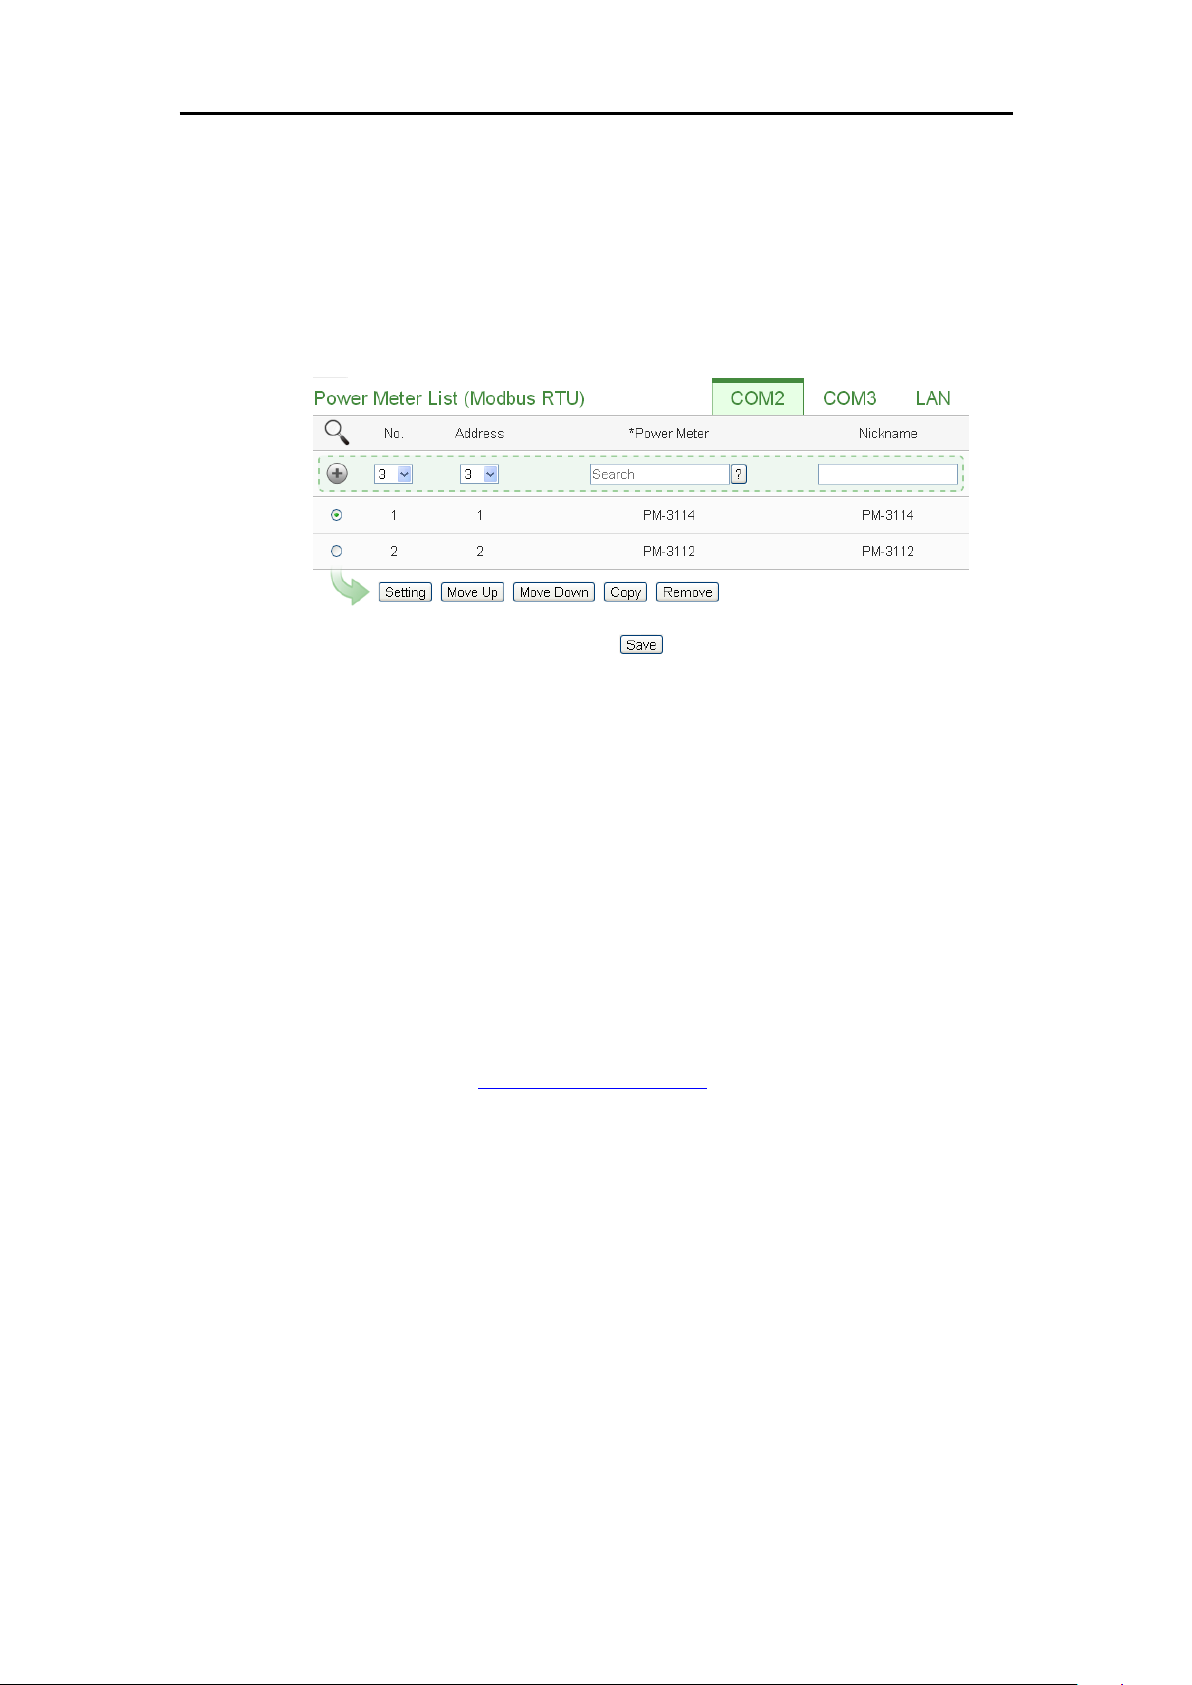
ICP DAS PMC/PMD Series User Manual
79
7.1 Power Meter Setting
On the “Power Meter Setting” page, it allows to set up the settings of the
Modbus RTU and Modbus TCP power meters that are connected to the
PMC/PMD. The Power Meter Setting page is shown as below(Using
PMC-5151 as an example):
Figure7-2 : Power Meter Setting Page
On the Power Meter Setting page, a list for all power meters connected to
the PMC/PMD will be displayed. Please follow the following sections to
perform settings for Modbus RTU and Modbus TCP power meters. After all
settings are completed, click “Save” button to save the changes.
Please note:
1. PMC/PMD provides 2 COM Port(RS-485) interface that allows
connections to Modbus RTU power meters.
2. PMC/PMD provides LAN interface that allows connections to Modbus
TCP power meters. For more detailed information about LAN settings
please refer to “6.6 I/O Interface setting”.
3. One PMC/PMD allows connections to at most 24 ICP DAS Modbus
TCP/RTU power meters (with maximum 16 Modbus TCP Power
Meters), and 8 Modbus I/O modules.
Each RS-485 interface (with Modbus RTU Master) can connect to
Max. 16 power meters.
Support at most 4 ICP DAS PM-4324 series Power Meters.
Page 93
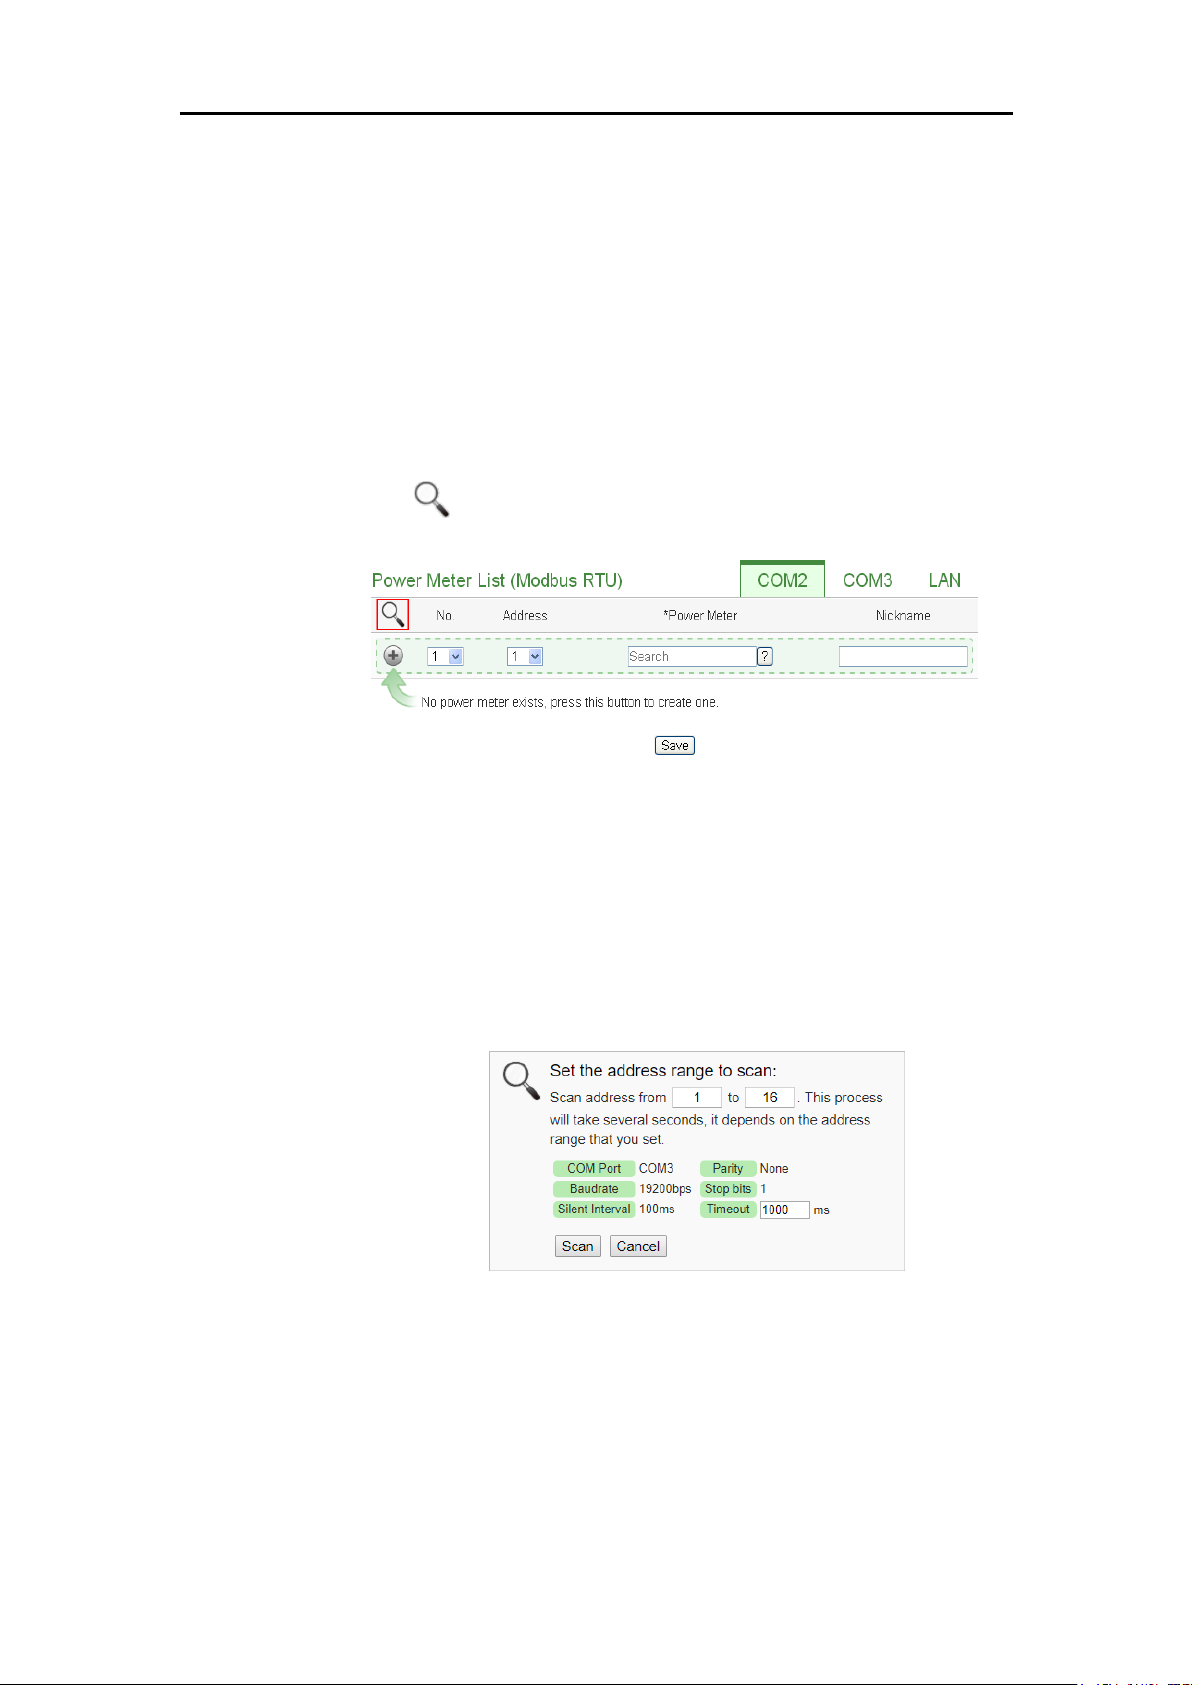
ICP DAS PMC/PMD Series User Manual
80
7.1.1 Scan to add Modbus RTU Power Meters
Perform “Scan” to automatically build a list of Modbus RTU power
meters that are connected to the PMC/PMD. The steps are as below:
i Before performing the scan of the power meters, please make sure
the RS-485 wirings connecting to the PMC/PMD and the power
meters function well, and make sure the settings of the addresses of
the power meters are completed.
ii Click to start the scan of Modbus RTU power meters that are
connected to the PMC/PMD.
Figure7-3 : The “Scan” button to search Power Meter
iii When the Scan page appears (Figure 7-4), input the starting address
and the ending address of the Modbus address that are going to
perform scan. Click on “Scan”, the system will start to scan the
power meters that match the settings previously set, to cancel the
scan, click on “Cancel”.
Figure7-4 : Set up the Scanning Range for the Power Meters
iv When the system is performing the scan (Figure 7-5), the address
that are performing scan will be dynamically shown on the upper
left side, please wait till the scan operation is completed. To stop the
scan operation, click on “Cancel” to terminal the scan and leave the
page.
Page 94
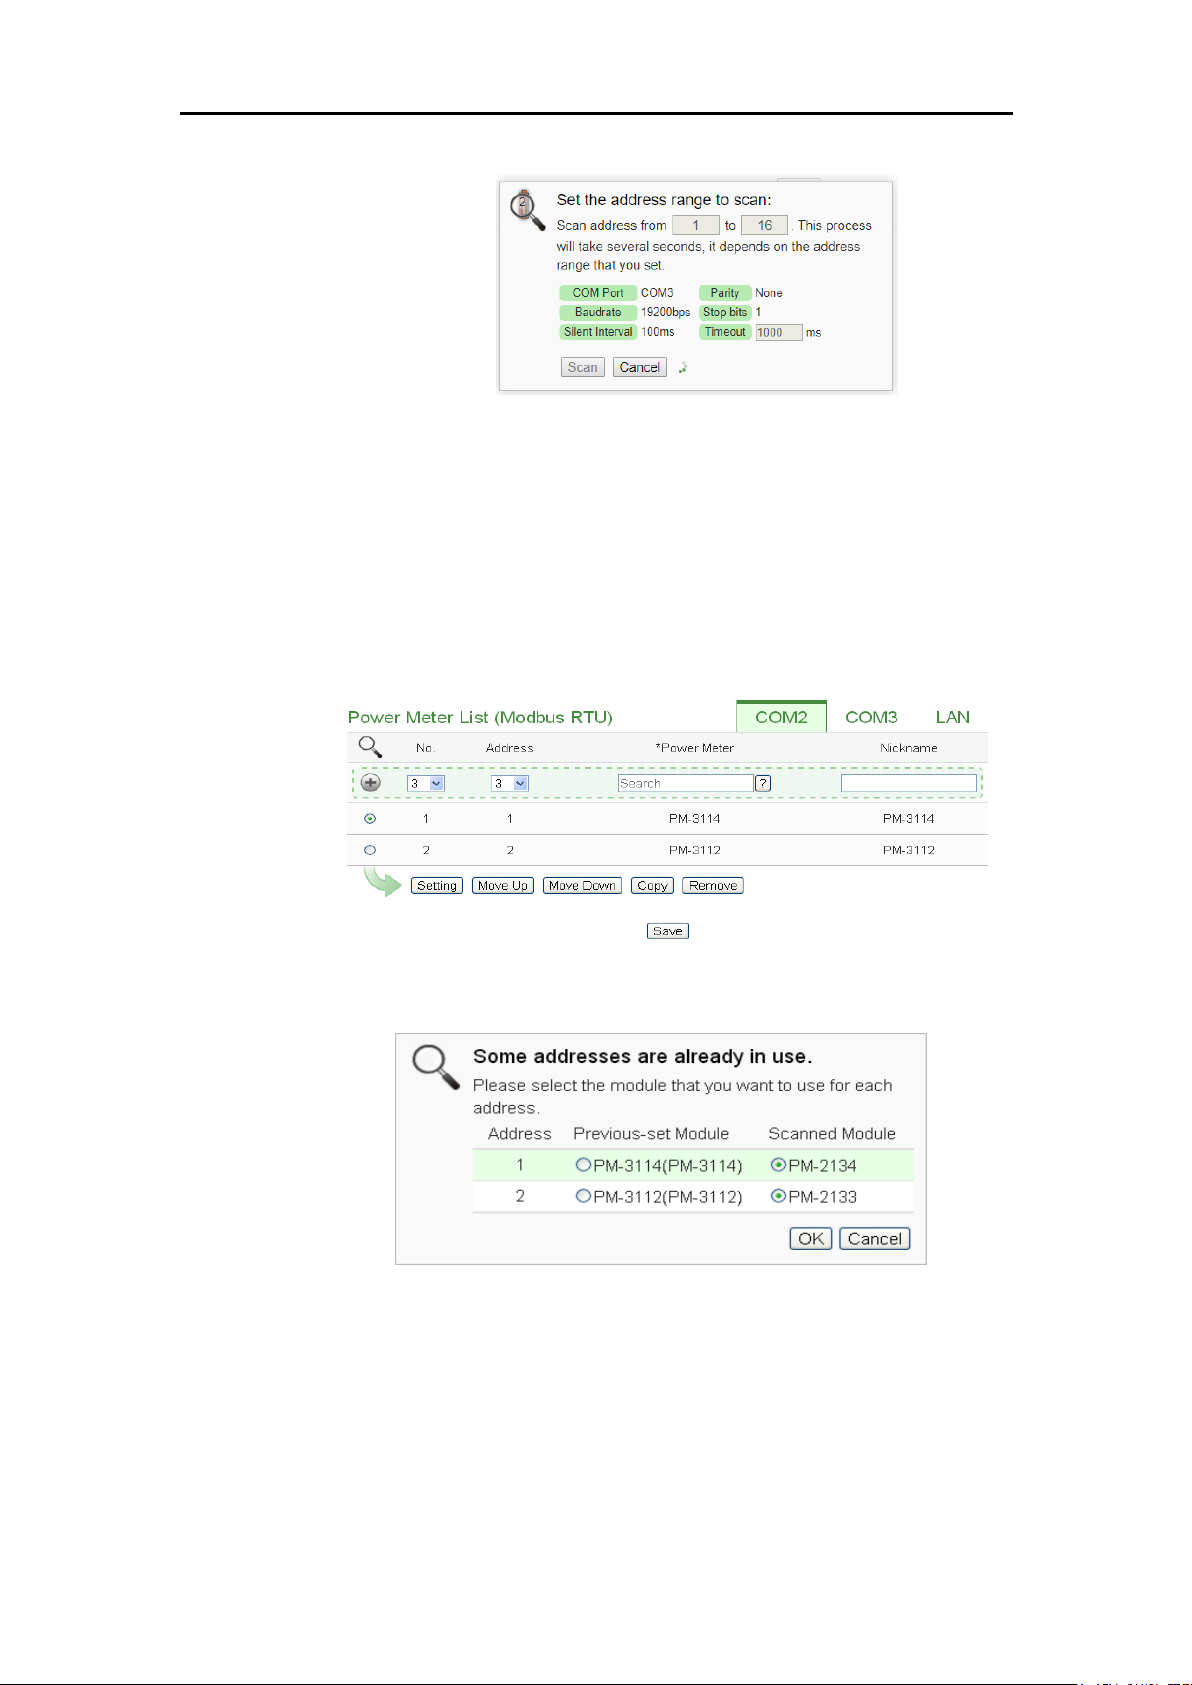
ICP DAS PMC/PMD Series User Manual
81
v After the Scan operation is completed, a Power Meter List will
appear (Figure 7-6). If the newly scanted module doesn’t match the
module previously set on the same address, a window will appear
(Figure 7-7), please select the actual device that are connected to
PMC/PMD. After all settings are completed, click “Save” button to
Figure7-5 : Scanning the Power Meters
save the changes.
Figure7-6 : The Power Meter List after Scan operation
Figure7-7 : Select the actual Power Meter connected to PMC/PMD
7.1.2 Add Modbus RTU Power Meter Manually
In addition to perform Scan operation to automatically add Modbus
RTU power meters to the list, the user could also add the Modbus RTU
power meter manually one by one, the steps are as below:
Page 95
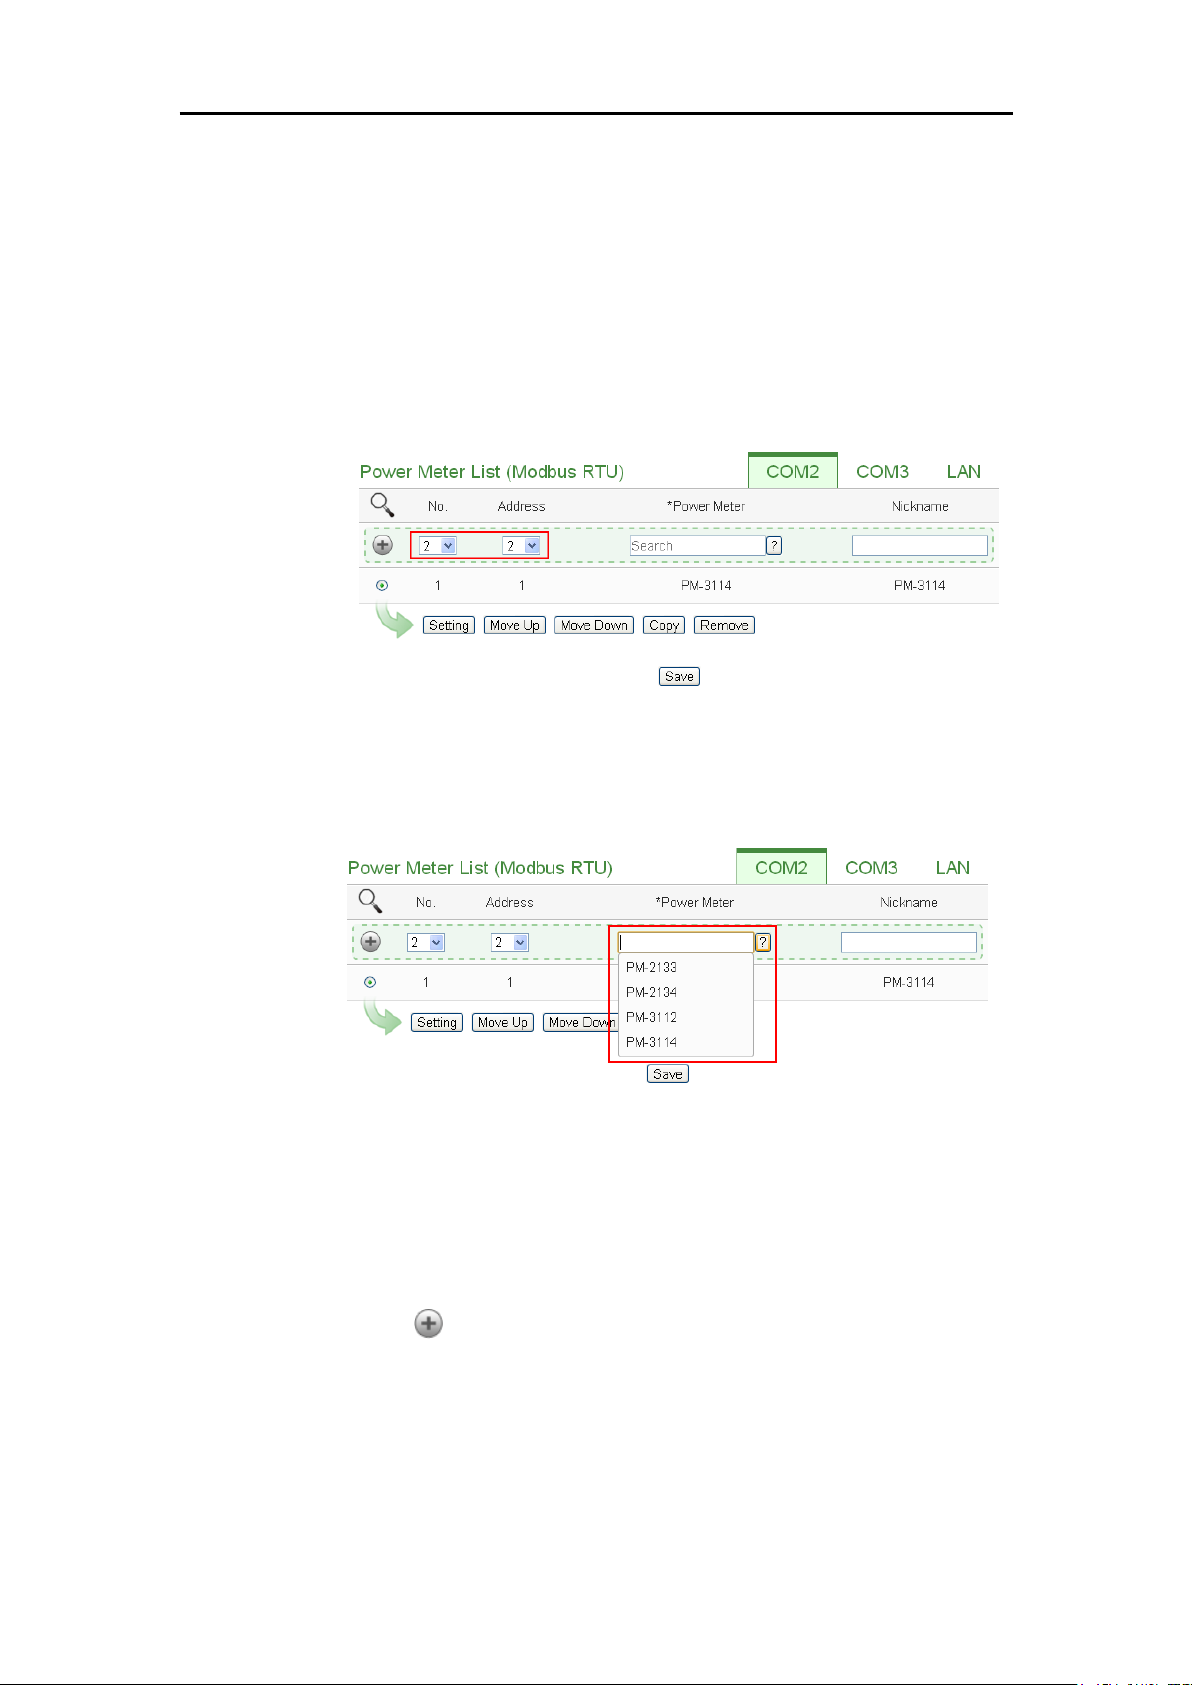
ICP DAS PMC/PMD Series User Manual
82
i No: The number will be the order that the power data of the Modbus
RTU power meter being stored in the PMC/PMD Modbus Table.
The range is 1~16.
ii Address: The address will be the Modbus address of this Modbus
RTU power meter, please make sure the address setting is the same
as the settings of the module, if the setting is not accurate, the
connection for PMC/PMD to the power meter will be failed.
Figure7-8 : Set up the No and Address of the power meter
iii Select the Power meter model:
Figure7-9 : Select Modbus RTU Power Meter model
iv Nickname: For user to define a nickname for this power meter, this
nickname will be displayed on the “Power meter Information” and
“Rule Setting” pages. Default setting will be the model of the power
meter.
v Click to add the meter to the list (Figure 7-10). After adding the
power meter, click “Save” button to save the changes.
Page 96
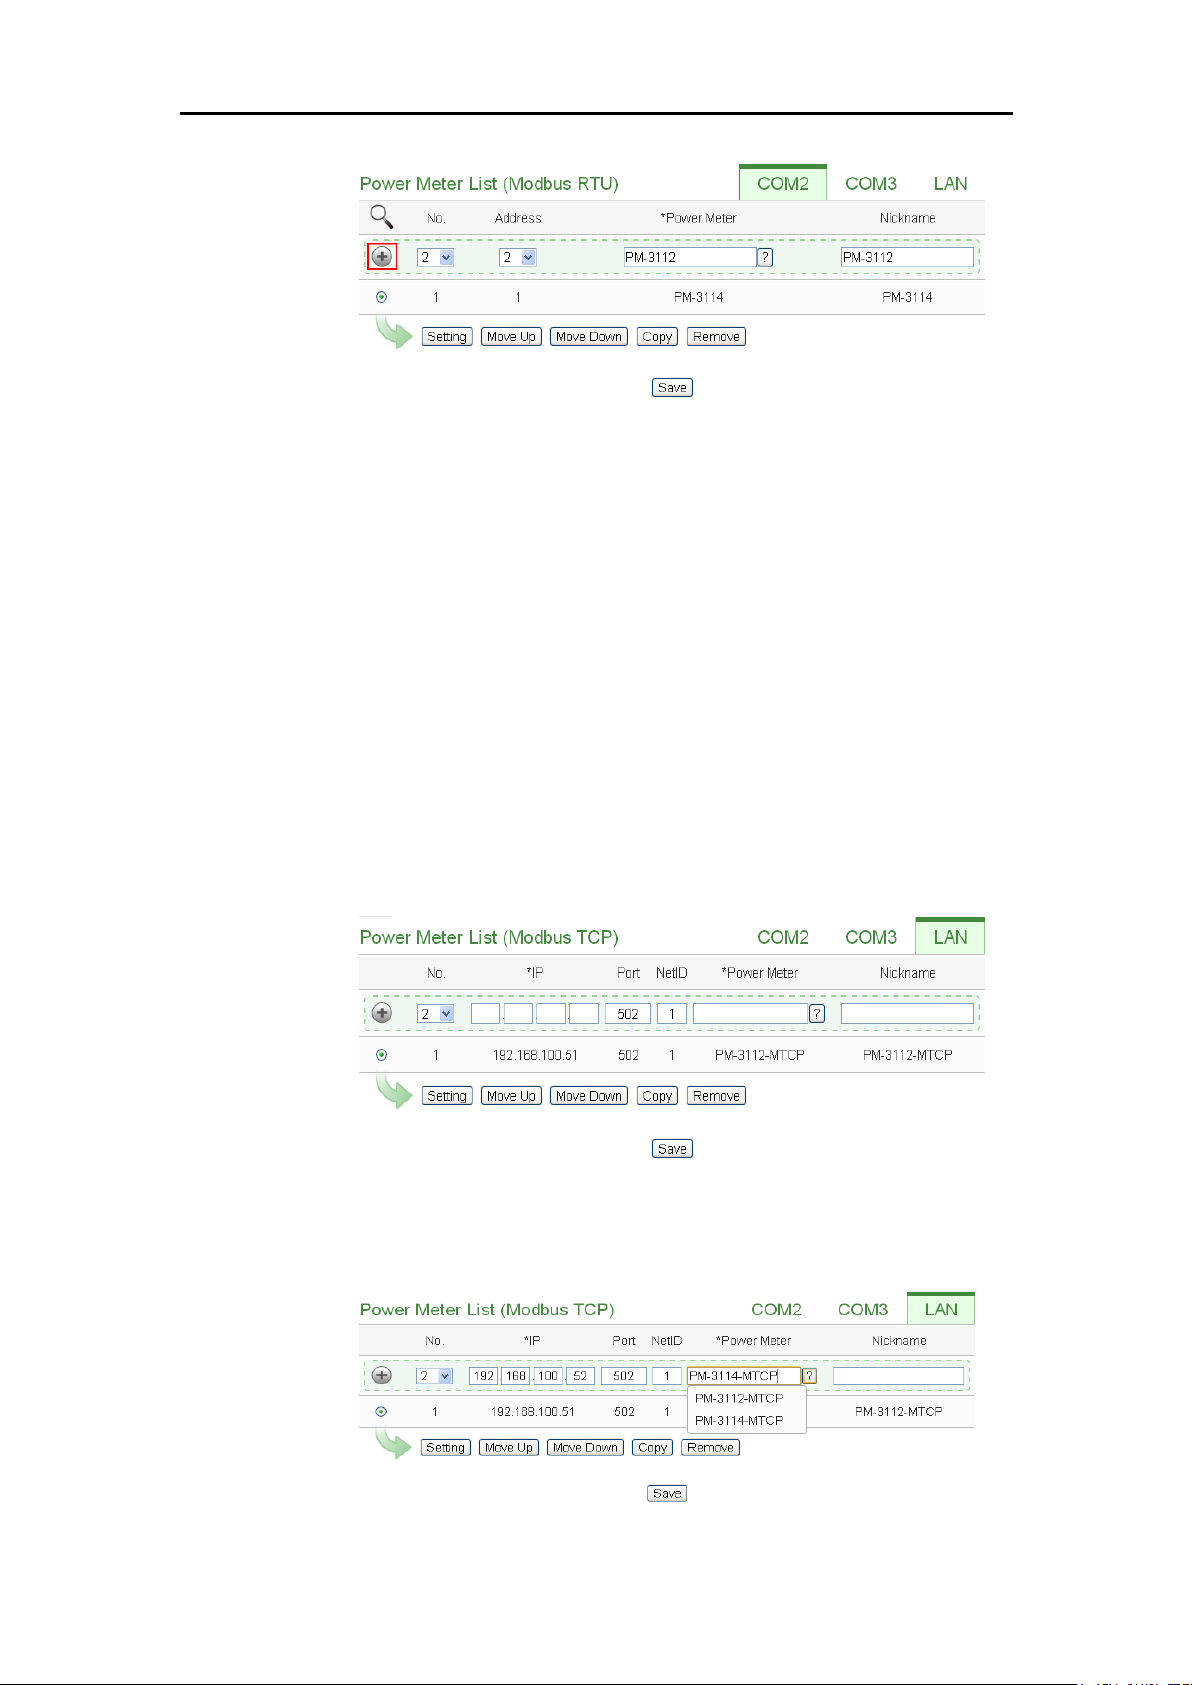
ICP DAS PMC/PMD Series User Manual
83
Figure7-10 : Add the Modbus RTU Power Meter manually
7.1.3 Add Modbus TCP Power Meter Manually
PMC/PMD allows connection to Modbus TCP Power Meters via
Ethernet, the user could add the Modbus TCP Power meter to the list
manually; the steps are as below:
i No: The Number will be the order that the power data of the
Modbus TCP power meter being stored in the PMC/PMD Modbus
Table. The range is 1~16.
ii Network: Set up the settings of IP, Port and NetID appropriately as
required. Please make sure the network setting is the same as the
settings of the module, if the setting is not accurate, the connection
for PMC/PMD to the power meter will be failed.
Figure7-11 : Add Modbus TCP Power Meter
iii Select the Power meter model (Figure 7-12):
Page 97
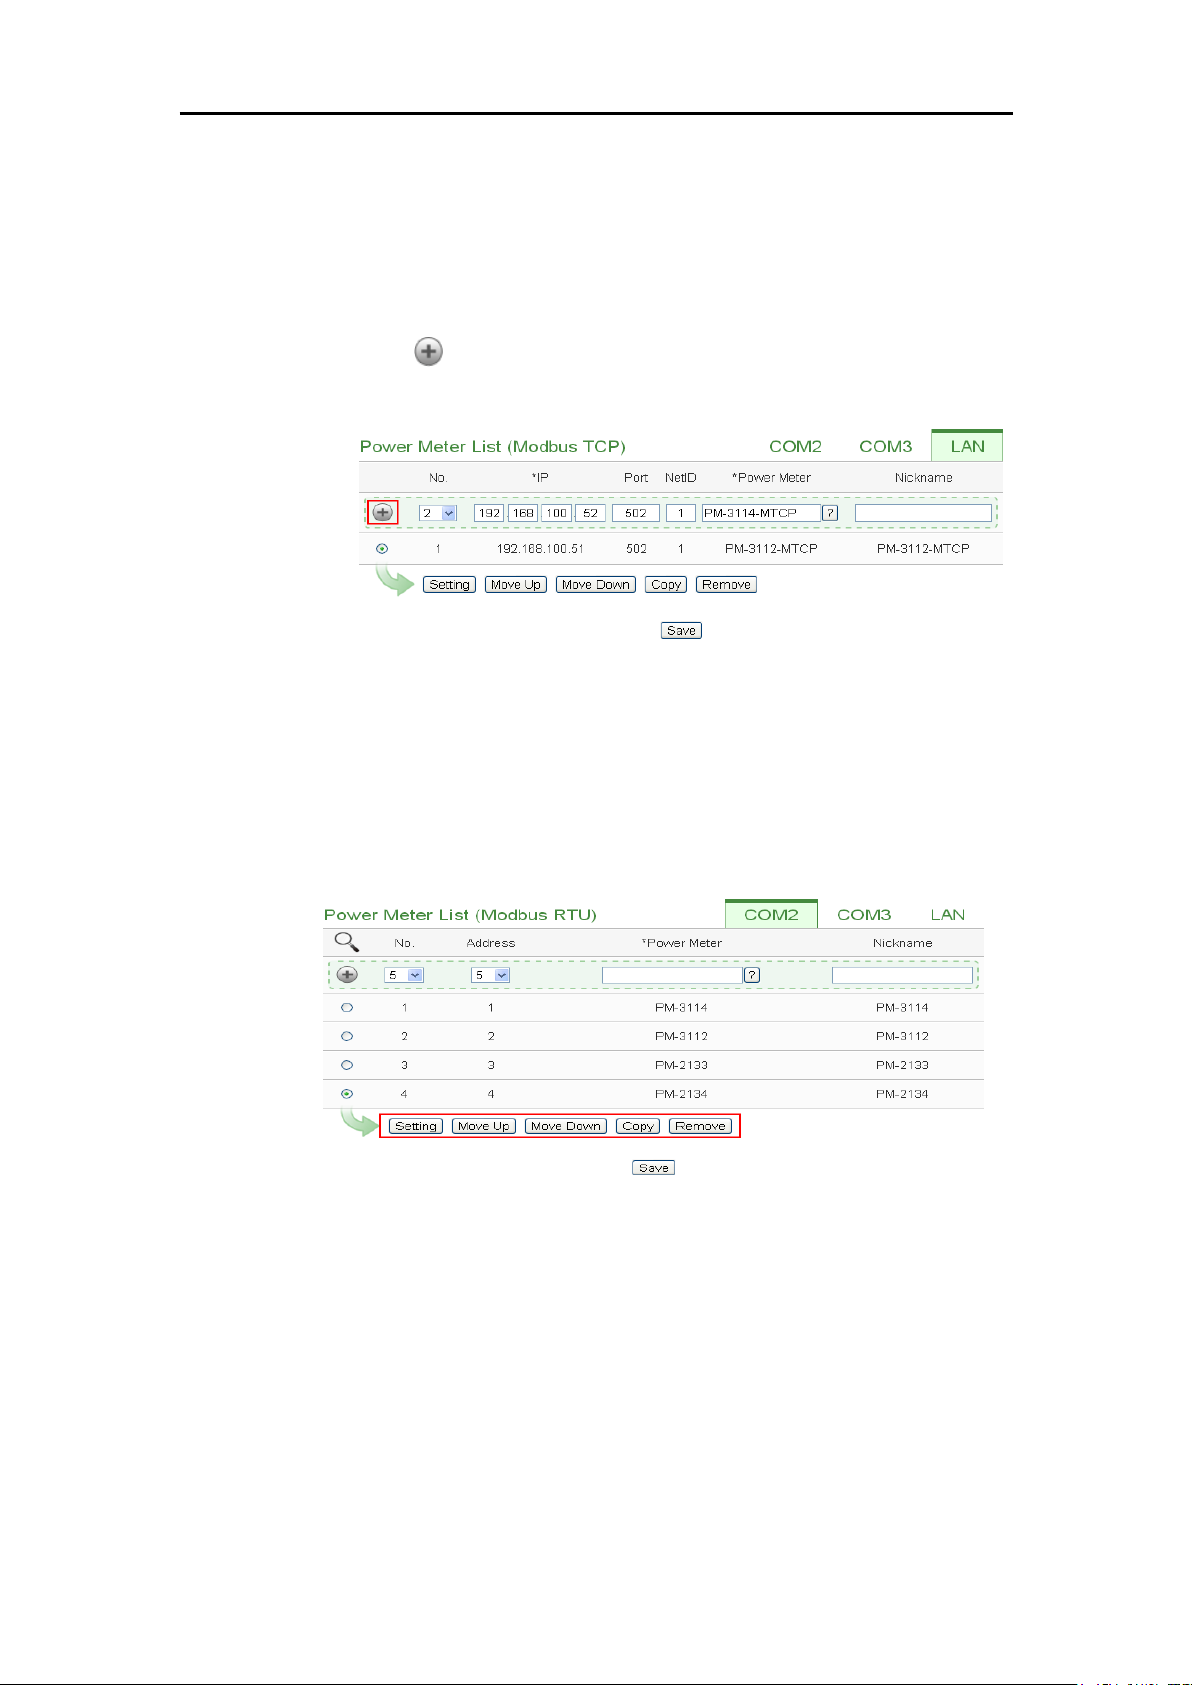
ICP DAS PMC/PMD Series User Manual
84
Figure7-12 : Select Modbus TCP Power Meter model
iv Nickname: For user to define a nickname for this power meter, this
nickname will be displayed on the “Power meter Information” and
“Rule Setting” pages. Default setting will be the model of the power
meter.
v Click to add the meter to the list (Figure 7-13). After adding the
power meter, click “Save” button to save the changes.
Figure7-13 : Add the Modbus TCP Power Meter manually
7.1.4 Power Meter List Interface
After the Modbus RTU/TCP Power Meters are added to the power
meter list via auto scan or manual work, the Modbus RTU/TCP Power
Meters will be listed as below:
Figure7-14 : Power Meter List Interface
The following functions allow to perform settings or rearrange order of
the power meters. Please select the power meter and click on the
function button to perform the operations:
Setting: Click the radio button in front of the power meter and
click on “Setting” to get into the setting page of the power meter.
The settings for each power meter module will be given in the
following section.
Move Up: Click the radio button in front of the power meter
Page 98
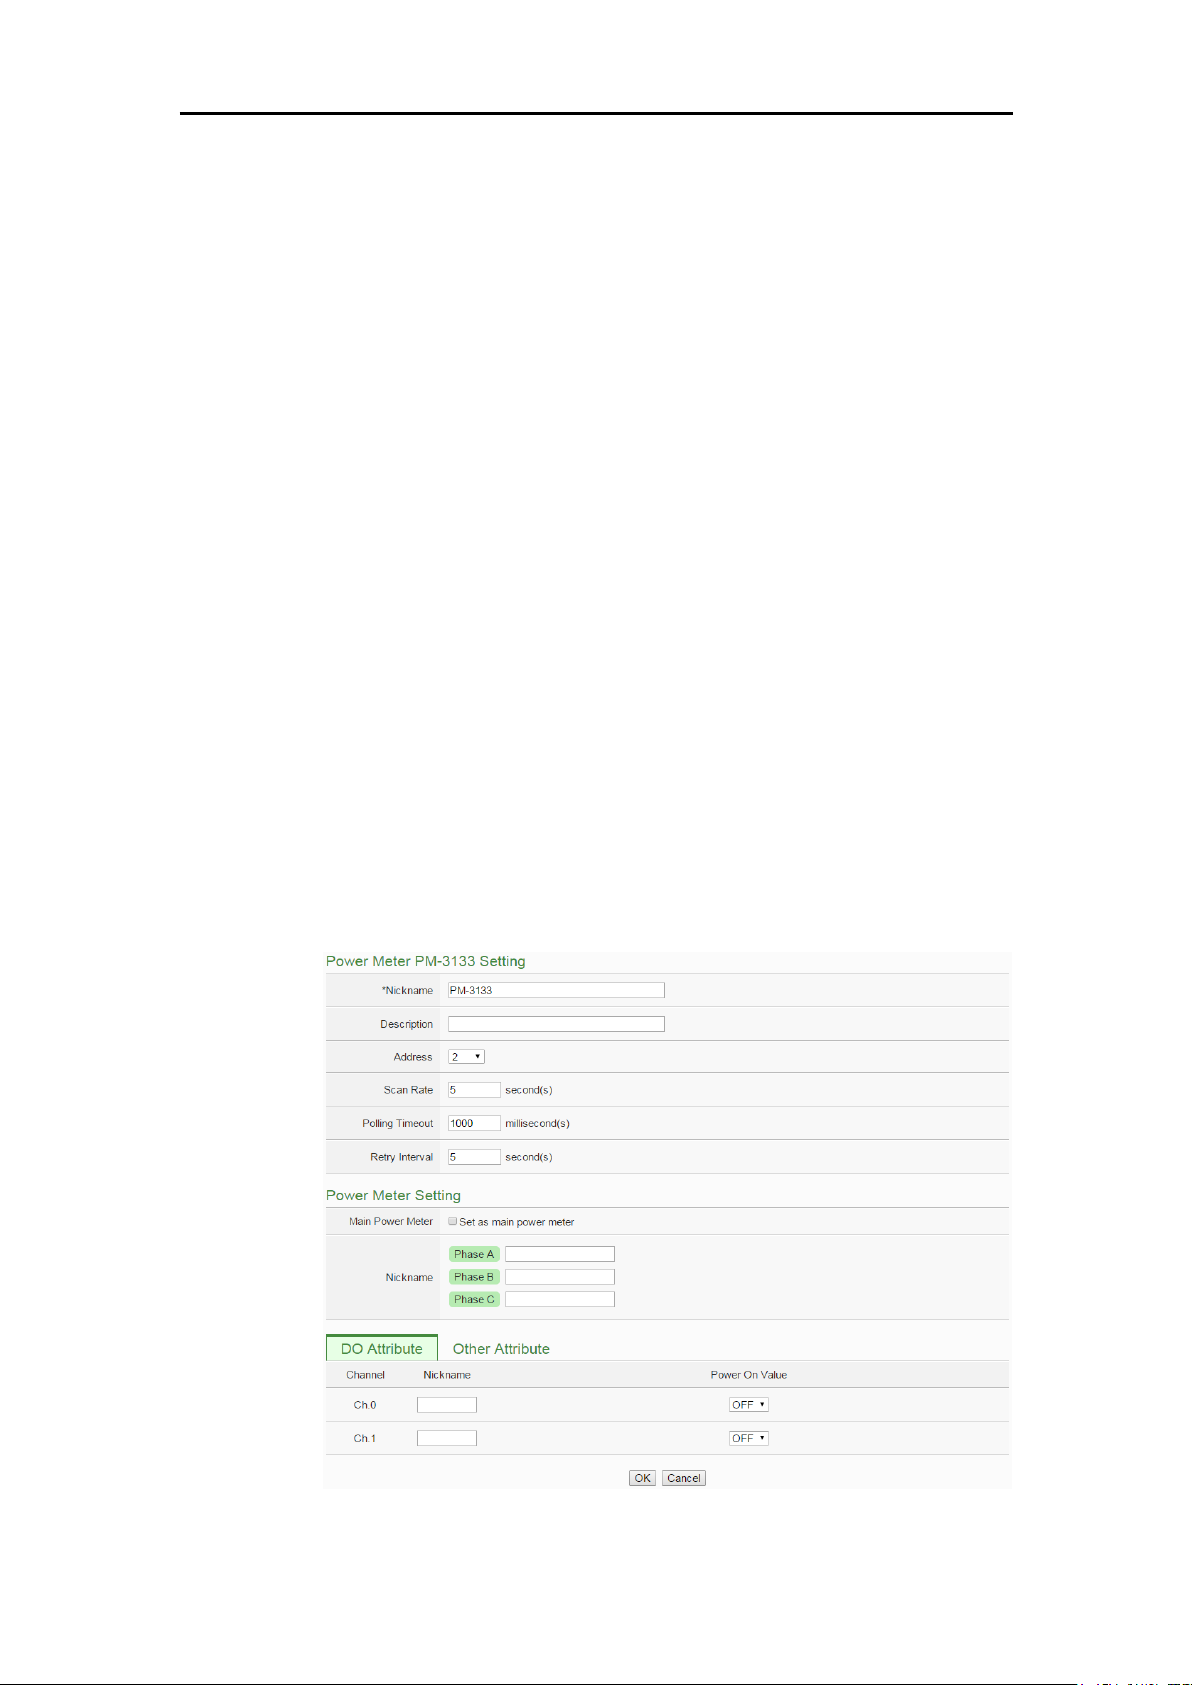
ICP DAS PMC/PMD Series User Manual
85
and click on “Move Up” to move the power meter to upper
order (upper index number (No)).
Move Down: Click the radio button in front of the power meter
and click on “Move Down” to move the power meter to lower
order (lower index number (No)).
Copy: To copy the settings of a pre-set power meter to the new
power meter, please click the radio button in front of the pre-set
power meter and then click on “Copy”, a new power meter (in
sequence) will be added to the list and the settings of the old
power meter will be copied to this newly added power meter.
Remove: Click the radio button in front of the power meter and
click on “Remove” to remove the selected power meter.
After all settings are completed, click “Save” button to save the
changes.
7.1.5 Modbus RTU Power Meter Setting
PMC/PMD support ICP DAS Single-phase and Three-phase Modbus
RTU Power Meters, the following section will give more detailed
settings of each power meter setting page.
The Three-Phase Modbus RTU Power Meter Setting page is shown
as follow (using PM-3133 as an example):
Figure7-15 : PM-3133 Setting Page
Page 99

ICP DAS PMC/PMD Series User Manual
86
The settings are as follow:
Nickname:For user to define nicknames for each power meter,
this nickname will be displayed on the “Power Meter
Information” and “Rule Setting” pages.
Description: The Description field provides a space for the user
to make a brief description of this power meter.
Address: The address will be the Modbus address of this
Modbus RTU power meter, please make sure the address setting
is the same as the settings of the module, if the setting is not
accurate, the connection for PMC/PMD to the power meter will
be failed.
Scan Rate: Input the time interval for PMC/PMD to periodically
retrieve the power data of this Modbus RTU Power Meter, the
setting range will be 0 ~ 65535 seconds.
Polling Timeout: The time interval for PMC/PMD to send
command to the Modbus RTU Power Meter and wait for the
response, the unit will be ms. The setting range will be 1-10000
ms.
Retry Interval: The time interval to wait for PMC/PMD to
repeatedly send command again when PMC/PMD sends
command to the Modbus RTU Power Meter and get no response.
The unit will be second. the setting range will be 3 ~ 65535
seconds.
Main Power Meter: When the “Set as main power meter” is
selected, this power meter will be set as main power meter and
the power data of this meter will be displayed on the Main
Power Meter area on the “Power Data Overview” page.
CT/Phase Nickname: For user to define nicknames for each CT
(or phase), this nickname will be displayed on the “Power
Meter Information” and “Rule Setting” pages. For three-phase
power meter, the user could give nicknames to the Phase A/B/C.
After all settings are completed, click “OK” button to return to the
Power Meter List.
Page 100
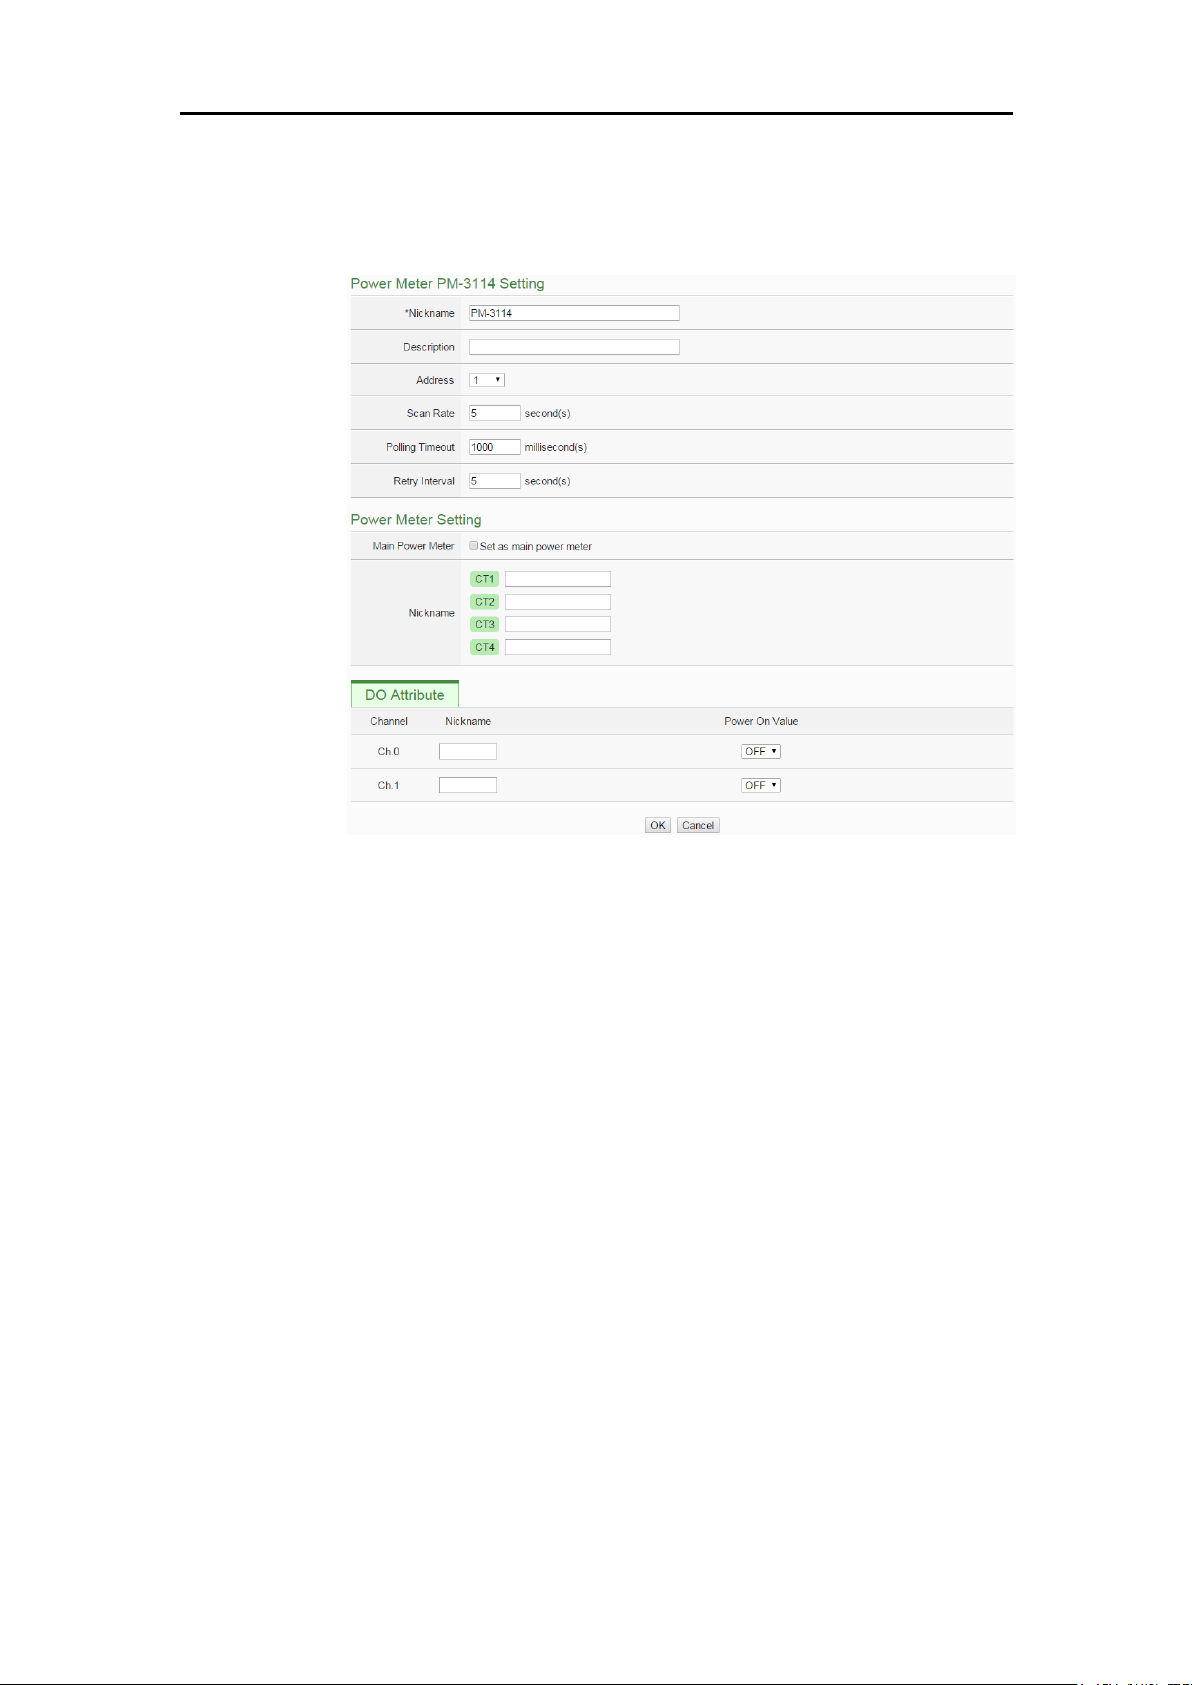
ICP DAS PMC/PMD Series User Manual
87
The Single-Phase Modbus RTU Power Meter Setting page is shown
as follow (using PM-3114 as an example):
Figure7-16 : PM-3114 Setting Page
The settings are as follow:
For the settings of Nickname, Description, Address, Scan Rate,
Polling Timeout, Retry Interval and Main Power Meter, please
refer to “Three-Phase Modbus RTU Power Meter Setting”
section.
CT / Phase Nickname: For user to define nicknames for each
CT (or phase), this nickname will be displayed on the “Power
Meter Information” and “Rule Setting” pages. For single-phase
power meter, the user could give nicknames to the CT1/CT2/
CT3/CT4.
DO Attribute:
Nickname:For user to define nicknames for each DO
channel, this nickname will be displayed on the “Power
Meter Information” and “Rule Setting” pages.
Power On Value: Set up the initial value for the DO
channels when the power meter is powered on.
 Loading...