

Page 1

ERserver
Hardware Maintenance Manual
xSeries 342 Type 8669
Page 2

Page 3

ER s e r v e r
Hardware Maintenance Manual
xSeries 342 Type 8669
Page 4

Note
Before using this information and the product it supports, be sure to read the general information
under “Notices” on page 143.
First Edition (June 2001; updated December 2001, March 2002, July 2002)
The following paragraph does not apply to the United Kingdom or any country were such provisions are
inconsistent with local law:
INTERNATIONAL BUSINESS MACHINES CORPORATION PROVIDES THIS PUBLICATION ″AS IS″ WITHOUT
WARRANTY OF ANY KIND, EITHER EXPRESS OR IMPLIED, INCLUDING, BUT NOT LIMITED TO, THE IMPLIED
WARRANTIES OF MERCHANTABILITY OR FITNESS FOR A PARTICULAR PURPOSE. Some states do not allow
disclaimer of express or implied warranties in certain transactions, therefore, this statement may not apply to you.
This publication could include technical inaccuracies or typographical errors. Changes are periodically made to the
information herein; these changes will be incorporated in new editions of the publication. IBM may make
improvements and/or changes in the product(s) and/or the program(s) described in this publication at any time.
This publication was developed for products and services offered in the United States of America. IBM may not offer
the products, services, or features discussed in this document in other countries, and the information is subject to
change without notice. Consult your local IBM representative for information on the products, services, and features
available in your area.
Requests for technical information about IBM products should be made to your IBM reseller or IBM marketing
representative.
© Copyright International Business Machines Corporation 2000, 2001. All rights reserved.
US Government Users Restricted Rights – Use, duplication or disclosure restricted by GSA ADP Schedule Contract
with IBM Corp.
Page 5
About this manual
This manual contains diagnostic information, a Symptom-to-FRU index, service
information, error codes, error messages, and configuration information for the IBM
xSeries 342.
Important: This manual is intended for trained servicers who are familiar with IBM
PC Server products.
Important safety information
Be sure to read all caution and danger statements in this book before performing
any of the instructions. See “Safety information” on page 109.
Leia todas as instruções de cuidado e perigo antes de executar qualquer operação.
®
Prenez connaissance de toutes les consignes de type Attention et Danger avant de
procéder aux opérations décrites par les instructions.
Lesen Sie alle Sicherheitshinweise, bevor Sie eine Anweisung ausführen.
© Copyright IBM Corp. 2000, 2001 iii
Page 6

Online support
Accertarsi di leggere tutti gli avvisi di attenzione e di pericolo prima di effettuare
qualsiasi operazione.
Lea atentamente todas las declaraciones de precaución y peligro ante de llevar a
cabo cualquier operación.
Use the World Wide Web (WWW) to download Diagnostic, BIOS Flash, and Device
Driver files.
File download address is:
http://www.ibm.com/pc/support
iv Hardware Maintenance Manual: xSeries 342 Type 8669
Page 7

Contents
About this manual .......................iii
Important safety information ....................iii
Online support .........................iv
General checkout ........................1
General information .......................3
Features and specifications .....................3
Server features .........................5
Reliability, availability, and serviceability features .............6
Controls and indicators ......................7
Operator information panel ....................8
Powering on the server .....................9
Powering off the server .....................9
Diagnostics ..........................11
Diagnostic tools overview .....................11
Identifying problems using LEDs ..................11
Power supply LEDs ......................11
Light path diagnostics .....................11
Diagnostics panel .......................11
Light path diagnostics .....................12
POST ............................12
POST error messages .....................12
Error logs ..........................12
Log viewing from Configuration/Setup ..............13
Log viewing from diagnostic programs ..............13
SCSI messages (some models)...................13
Diagnostic programs and error messages ...............13
Text messages ........................14
Starting the diagnostic programs .................15
Viewing the test log ......................16
Diagnostic error message tables .................16
Recovering BIOS code ......................16
Troubleshooting the Ethernet controller ................17
Network connection problems ..................17
Ethernet controller troubleshooting chart ..............18
Power checkout ........................19
Replacing the battery ......................19
Configuration .........................23
Using the Configuration/Setup Utility program .............23
Starting the Configuration/Setup Utility program ............23
Main menu of the Configuration/Setup Utility .............24
Additional Configuration/Setup Utility menu choices .........26
Using passwords .......................27
Setting the password override switch ...............27
Using the SCSISelect utility program .................28
Starting the SCSISelect utility program ...............28
Choices available from the SCSISelect menu.............28
Using the PXE boot agent utility program ...............29
Starting the PXE boot agent utility program .............29
Choices available from the PXE boot agent menu ...........30
© Copyright IBM Corp. 2000, 2001 v
Page 8

Installing options .......................33
Major components of the xSeries 342 server ..............33
System board layout .......................34
System board options connectors .................34
System board internal cable connectors...............35
System board external port connectors ...............36
System board switches and jumpers ................36
System board LED locations ...................38
Light Path Diagnostics panel ..................39
Before you begin ........................40
System reliability considerations .................41
Working inside a server with power on ...............41
Handling static-sensitive devices .................41
Locations ...........................42
Removing the cover and bezel ..................42
Adapters ..........................44
Adapter considerations ....................44
Adapter installation .....................45
Internal drives ........................47
Internal drive bays .....................47
SCSI drives ........................48
SCSI IDs .........................48
Hot-swap drive installation...................49
Non-hot-swap drive installation .................50
Memory modules .......................51
Microprocessor installation ...................53
Microprocessor installation in Models 1RX, 2RX, 4RX, 1TG, 2TG, 4TG 54
Microprocessor installation in Model 5RX .............56
Hot-swap power supply installation ................61
3-Pack Ultra 160 Hot-Swap Expansion Kit .............63
Hot-swap fan assembly replacement ................63
Installing the server cover and bezel ................64
Connecting external options ....................65
Cabling requirements .....................65
Setting SCSI IDs for external devices ...............65
Installation procedure .....................65
Input/Output ports .......................65
Video port.........................66
Keyboard port .......................66
Auxiliary-device (pointing device) port ..............67
Ultra 160 SCSI ports.....................67
Serial ports ........................69
Universal Serial Bus ports ...................70
Ethernet port........................71
Integrated System Management Processor ports ..........74
Cabling the server........................75
FRU information (service only) ..................77
LED cover ..........................77
LED board ..........................77
On/off reset board ........................78
Diskette/CD-ROM drive ......................78
SCSI backplane ........................79
Hot-swap hard disk drive backplane assembly .............79
Power supply backplane .....................80
AC distribution box .......................81
vi Hardware Maintenance Manual: xSeries 342 Type 8669
Page 9

System board .........................81
Symptom-to-FRU index .....................83
Beep symptoms ........................83
No Beep symptoms .......................85
Information panel system error LED .................85
Diagnostic error codes ......................87
Error symptoms ........................91
Power supply LED errors .....................92
POST error codes ........................93
Service processor error codes ...................98
SCSI error codes ........................99
Temperature error messages ....................99
Fan error messages ......................100
Power error messages .....................100
System shutdown .......................100
Voltage related system shutdown.................101
Temperature related system shutdown ...............101
DASD checkout ........................101
Host Built-In Self Test (BIST) ...................102
Bus fault messages.......................102
Undetermined problems .....................102
Parts listing, xSeries 342 ....................105
System ...........................106
Keyboards ..........................107
Power cords .........................108
Related service information ...................109
Safety information .......................109
General safety .......................109
Electrical safety .......................110
Safety inspection guide ....................111
Handling static-sensitive devices .................112
Grounding requirements ....................113
Safety notices (multi-lingual translations) ..............113
Send us your comments!.....................142
Problem determination tips ....................143
Notices ...........................143
Trademarks..........................144
Contents vii
Page 10

viii Hardware Maintenance Manual: xSeries 342 Type 8669
Page 11

General checkout
The server diagnostic programs are stored in upgradable read-only memory (ROM)
on the system board. These programs are the primary method of testing the major
components of the server: the system board, Ethernet controller, video controller,
RAM, keyboard, mouse (pointing device), diskette drive, serial ports, and hard
drives. You can also use them to test some external devices. See “Diagnostic
programs and error messages” on page 13.
Also, if you cannot determine whether a problem is caused by the hardware or by
the software, you can run the diagnostic programs to confirm that the hardware is
working properly.
When you run the diagnostic programs, a single problem might cause several error
messages. When this occurs, work to correct the cause of the first error message.
After the cause of the first error message is corrected, the other error messages
might not occur the next time you run the test.
A failed system might be part of a shared DASD cluster (two or more systems
sharing the same external storage device(s)). Prior to running diagnostics, verify
that the failing system is not part of a shared DASD cluster.
A system might be part of a cluster if:
v The customer identifies the system as part of a cluster.
v One or more external storage units are attached to the system and at least one
of the attached storage units is additionally attached to another system or
unidentifiable source.
v One or more systems are located near the failing system.
If the failing system is suspected to be part of a shared DASD cluster, all diagnostic
tests can be run except diagnostic tests which test the storage unit (DASD residing
in the storage unit) or the storage adapter attached to the storage unit.
Notes:
1. For systems that are part of a shared DASD cluster, run one test at a time in
looped mode. Do not run all tests in looped mode, as this could enable the
DASD diagnostic tests.
2. If multiple error codes are displayed, diagnose the first error code displayed.
3. If the computer hangs with a POST error, go to “POST error codes” on page 93.
4. If the computer hangs and no error is displayed, go to “Undetermined problems”
on page 102.
5. Power supply problems, see “Power supply LED errors” on page 92.
6. Safety information, see “Safety information” on page 109.
7. For intermittent problems, check the error log; see “Error logs” on page 12.
© Copyright IBM Corp. 2000, 2001 1
Page 12

001 IS THE SYSTEM PART OF A CLUSTER?
YES. Schedule maintenance with the customer. Shut down all systems
related to the cluster. Run storage test.
NO. Go to step 002.
002 IF THE SYSTEM IS NOT PART OF A CLUSTER:
v Power-off the computer and all external devices.
v Check all cables and power cords.
v Set all display controls to the middle position.
v Power-on all external devices.
v Power-on the computer.
v Record any POST error messages displayed on the screen. If an error is
displayed, look up the first error in the “POST error codes” on page 93.
v Check the information LED panel System Error LED; if on, see
“Information panel system error LED” on page 85.
v Check the System Error Log. If an error was recorded by the system,
see “Symptom-to-FRU index” on page 83.
v Start the Diagnostic Programs. See “Starting the diagnostic programs” on
page 15.
v Check for the following responses:
1. One beep.
2. Readable instructions or the Main Menu.
003 DID YOU RECEIVE BOTH OF THE CORRECT RESPONSES?
NO. Find the failure symptom in “Symptom-to-FRU index” on page 83.
YES. Run the Diagnostic programs. If necessary, refer to “Starting the
diagnostic programs” on page 15.
If you receive an error, go to“Symptom-to-FRU index” on page 83.
If the diagnostics completed successfully and you still suspect a problem,
see “Undetermined problems” on page 102.
2 Hardware Maintenance Manual: xSeries 342 Type 8669
Page 13

General information
The IBM xSeries 342 server is a high-performance server that supports
symmetric multiprocessing (SMP). It is ideally suited for networking environments
that require superior microprocessor performance, efficient memory management,
flexibility, and large amounts of reliable data storage.
Performance, ease of use, reliability, and expansion capabilities were key
considerations during the design of this server. These design features make it
possible for you to customize the system hardware to meet your needs today, while
providing flexible expansion capabilities for the future.
If you have access to the World Wide Web, you can obtain up-to-date information
about the server model and other IBM server products at the following World Wide
Web address: http://www.ibm.com/eserver/xseries.
Features and specifications
The following table provides a summary of the features and specifications for the
xSeries 342:
Microprocessor:
v Intel
v 256 KB or 512 KB Level-2 cache
v Supports up to two microprocessors
Memory:
v Maximum: 4 GB
v Type: ECC, SDRAM, PC133, Registered DIMMs
v Slots: Four (two-way interleaved)
Drives standard:
v Diskette: 1.44 MB
v CD-ROM: 24X IDE
Expansion bays:
v Hot-swap: Three slim high
v Non-hot-swap: Two 5.25-inch, replaceable with a three slim-high hot-swap drive
PCI expansion slots:
v One 33 MHz/32-bit
v Two 33 MHz/64-bit
v Two 66 MHz/64-bit
Hot-swap power supplies:
v 270 Watt (115-230 V ac)
v Minimum: One
v Maximum: Two, second power supply provides redundant power
®
Pentium®III
expansion option
Redundant cooling:
v Three hot-swap fans
Video:
v S3 video controller
v Compatible with SVGA and VGA
v 8 MB video memory
© Copyright IBM Corp. 2000, 2001 3
Page 14

Size (3U):
v Height: 128 mm (5 in.)
v Depth: 695 mm (27.3 in.)
v Width: 440 mm (17.3 in.)
v Weight: 21.3 to 29.5 (47 to 65 lbs.) depending upon configuration
Integrated functions:
v Dual channel Ultra 160 SCSI controller
v One 10BASE-T/100BASE-TX/100BASE-FX, Intel Ethernet controller with Alert on
LAN
™
and Wake on LAN®support
v Two serial ports
v Two Universal Serial Bus ports
v Keyboard port
v Mouse port
v Video port
v Integrated system management processor (ISMP) with two ISM (RS-485) RJ-45
connectors
v Two ISM (RJ-45) connectors
v One system management Serial C port
Acoustical noise emissions:
v Sound power, idling (open bay): 6.6 bel maximum
v Sound power, operating: 6.8 bel maximum
v Sound pressure, operating: 53 dBa maximum
Environment:
v Air temperature:
– Server on: 10° to 35° C (50° to 95° F). Altitude: 0 to 914 m (2998 ft.)
– Server on: 10° to 32° C (50° to 89.6° F). Altitude: 914 m (2998 ft.) to 2133 m
(6998 ft.)
– Server off: 10° to 43° C (50° to 109.4° F). Maximum altitude: 2133 m (6998
ft.)
v Humidity:
– Server on: 8% to 80%
– Server off: 8% to 80%
Heat output:
v Approximate heat output in British Thermal Units (BTU) per hour
– Minimum configuration 375 BTU (110 watts)
– Maximum configuration 1300 BTU (380 watts)
Electrical input:
v Sine-wave input (50-60 Hz) required
v Input voltage low range:
– Minimum: 100 V ac
– Maximum: 127 V ac
v Input voltage high range:
– Minimum: 200 V ac
– Maximum: 240 V ac
v Input kilovolt-amperes (kVA) approximately:
– Minimum: 0.08 kVA (0.076 kW)
– Maximum: 0.38 kVA
* KB equals approximately 1000 bytes. MB equals approximately 1000000 bytes.
GB equals approximately 1000000000 bytes.
4 Hardware Maintenance Manual: xSeries 342 Type 8669
Page 15

Server features
The xSeries 342 is designed to be cost-effective, powerful, and flexible. The server
offers:
v Impressive performance using an innovative approach to SMP
The server supports up to two Intel Pentium III microprocessors. The server
comes with one microprocessor installed; you can install an additional
microprocessor to enhance performance and provide SMP capability.
v Large data-storage and hot-swap capabilities
All models of the server support up to three hot-swap hard disk drives. This
hot-swap feature enables you to remove and replace hard disk drives without
turning off the server. The xSeries 3-Pack Ultra 160 Hot-Swap Expansion Kit
option is available to add three additional drives.
v Optional PCI adapters
The server uses peripheral component interconnect (PCI) bus architecture to
provide compatibility with a wide range of existing hardware devices and software
applications. The server supports up to five PCI adapters in the expansion slots
on the system board.
v Redundant cooling capability
The redundant cooling capability of the hot-swap fans in the server allow
continued operation if one of the fans fails. You can also replace a failing
hot-swap fan without turning off the server.
v Optional redundant power capability
You can install an additional 270-watt power supply in the server to provide
redundant power for the server. The Power Non-Redundant (NON) light emitting
diode (LED) in the group of diagnostic LEDs on the system board is lit when the
power load is 270 watts or greater with two power supplies installed.
v Large system memory
The memory bus in the server supports up to 4 GB (GB equals approximately
1000000000 bytes) of system memory. The memory controller provides error
correcting code (ECC) support for up to four industry standard PC133, 3.3 V,
168-pin, 8-byte, registered, synchronous-dynamic-random access memory
(SDRAM) dual inline memory modules (DIMMs).
v IBM integrated system management processor (ISMP)
The integrated system management processor provides environmental monitoring
for the server. When environmental conditions exceed thresholds or when system
components fail, the ISMP lights the Light Path Diagnostics
™
LEDs to indicate
the location of the problem. Critical errors, as well as environmental and
configuration information, are also included in the error log.
If an optional Remote Supervisor Adapter is installed on the Advanced System
Management (ASM) interconnect network, you can view the system health;
update the ISMP code; power on, power off, and restart the server; view the error
log; view the vital product data; and send alerts over the ASM interconnect
network.
v Integrated network environment support
The server comes with an Ethernet controller on the system board. This Ethernet
controller has an interface for connecting to 10-Mbps or 100-Mbps networks. The
server automatically selects between 10BASE-T and 100BASE-TX. The controller
provides full-duplex (FDX) capability, which allows simultaneous transmission and
reception of data on the Ethernet local area network (LAN).
v Redundant network-interface card
General information 5
Page 16

The addition of an optional, redundant network interface card (NIC) provides a
failover capability to a redundant Ethernet connection. If a problem occurs with
the primary Ethernet connection, all Ethernet traffic associated with this primary
connection is automatically switched to the redundant NIC. This switching occurs
without data loss and without user intervention.
v Optional digital linear tape drive
The addition of an optional digital linear tape drive (DLT) allows quick backup of
large amounts of data.
™
v IBM ServerGuide
CDs
The ServerGuide CDs included with the server provide programs to help you set
up the server and install the network operating system (NOS). The ServerGuide
program detects the hardware options installed, and provides the correct
configuration programs and device drivers. In addition, the ServerGuide CDs
include a variety of application programs for the server.
Reliability, availability, and serviceability features
Three of the most important features in server design are reliability, availability, and
serviceability (RAS). These factors help to ensure the integrity of the data stored on
the server; that the server is available when you want to use it; and that should a
failure occur, you can easily diagnose and repair the failure with minimal
inconvenience.
The following is an abbreviated list of the RAS features that the server supports.
v Menu-driven setup, system configuration, RAID configuration, and diagnostic
programs
v Power-on self-test (POST)
v ROM resident diagnostics
v Integrated System Management Processor
v Predictive failure alerts
v Microprocessor built-in self-test (BIST), internal error signal monitoring,
configuration checking, CPU/VRM failure identification through Light Path
Diagnostics technology
v Diagnostic support of ServeRAID
v Cable detection
v Hot-swap drive bays
v System error logging
v Upgradable BIOS, diagnostics, and system management code
v Automatic restart after a power failure
v Parity checking on the SCSI and PCI buses
v Error checking and correcting (ECC) memory
v Redundant hot-swap power supply option
v Redundant hot-swap cooling
v Redundant Ethernet capabilities (with optional adapter)
v Vital Product Data (VPD) on processor complex, system board, power backplane,
SCSI backplane, and each power supply
v Operator information panel and group of diagnostic LEDs on the system board
v Remind button to temporarily turn off LEDs for nonvital alerts
™
adapters and Ethernet adapters
6 Hardware Maintenance Manual: xSeries 342 Type 8669
Page 17
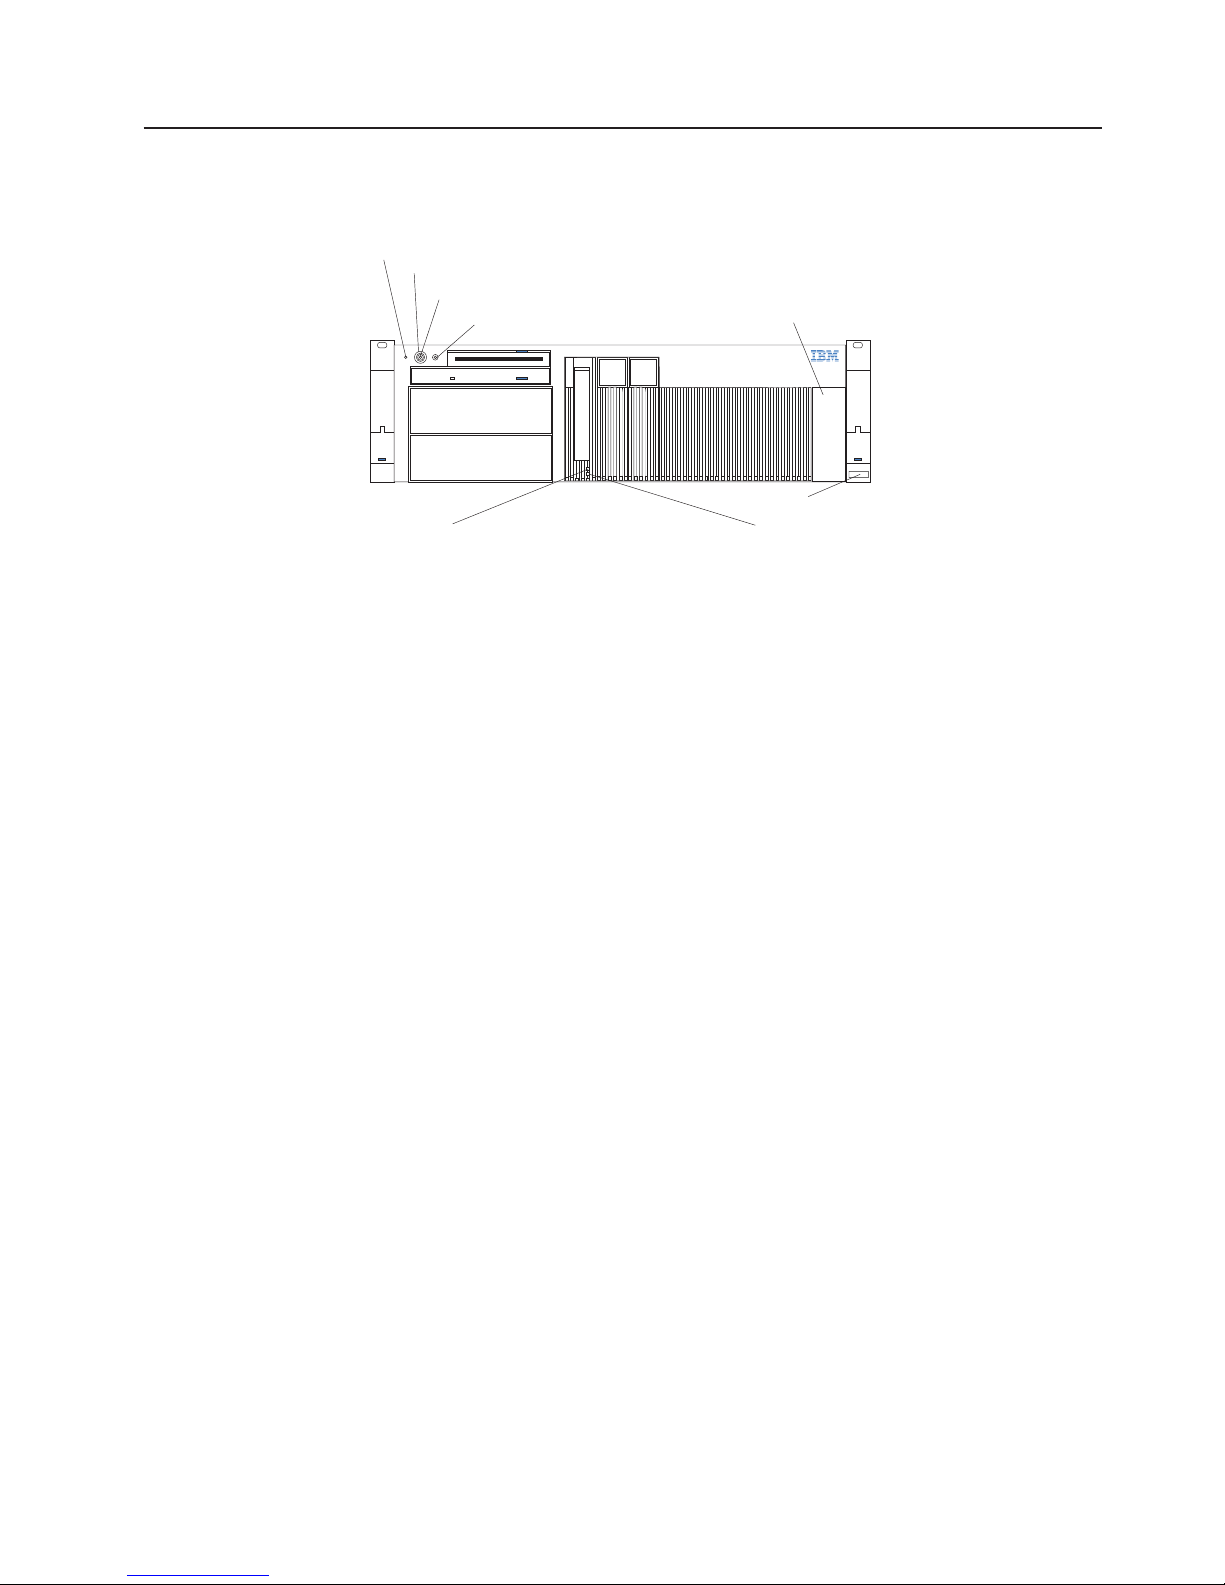
Controls and indicators
The most commonly used controls and status indicators are on the front panel of
the server.
System power light (green)
Power-control-button shield (if installed)
Power control button
Hard disk drive activity light (green) Hard disk drive status light (amber)
System Power Light: When this green light is on, system power is present in the
server. When this light flashes, the server is in standby mode (the system power
supply is turned off and AC current is present). When this light is off, either a power
supply, AC power, or a light has failed.
Attention: If this light is off, it does not mean there is no electrical current present
Reset button
Operator information panel
Serial number
in the server. The light might be burned out. To remove all electrical
current from the server, you must unplug the server power cords from
the electrical outlets or from the UPS.
Power-control button shield: You can install this circular disk over the
power-control button to prevent accidental manual power-off. This disk is provided
with the server.
Power-control Button: Press this button to manually turn the server on or off.
Reset Button: Press this button to reset the server and run the power-on self-test
(POST).
Operator Information Panel: The lights on this panel give status information for
the server. See “Operator information panel” on page 8 for more information.
Hard Disk Drive Status Light: Each of the hot-swap drive bays has a Hard Disk
Status light. When this amber light is on continuously, the drive has failed (only if
RAID is installed). If a ServeRAID adapter is installed and this light flashes slowly
(one flash per second), the drive is being rebuilt. When the light flashes rapidly
(three flashes per second), the controller is identifying the drive.
General information 7
Page 18
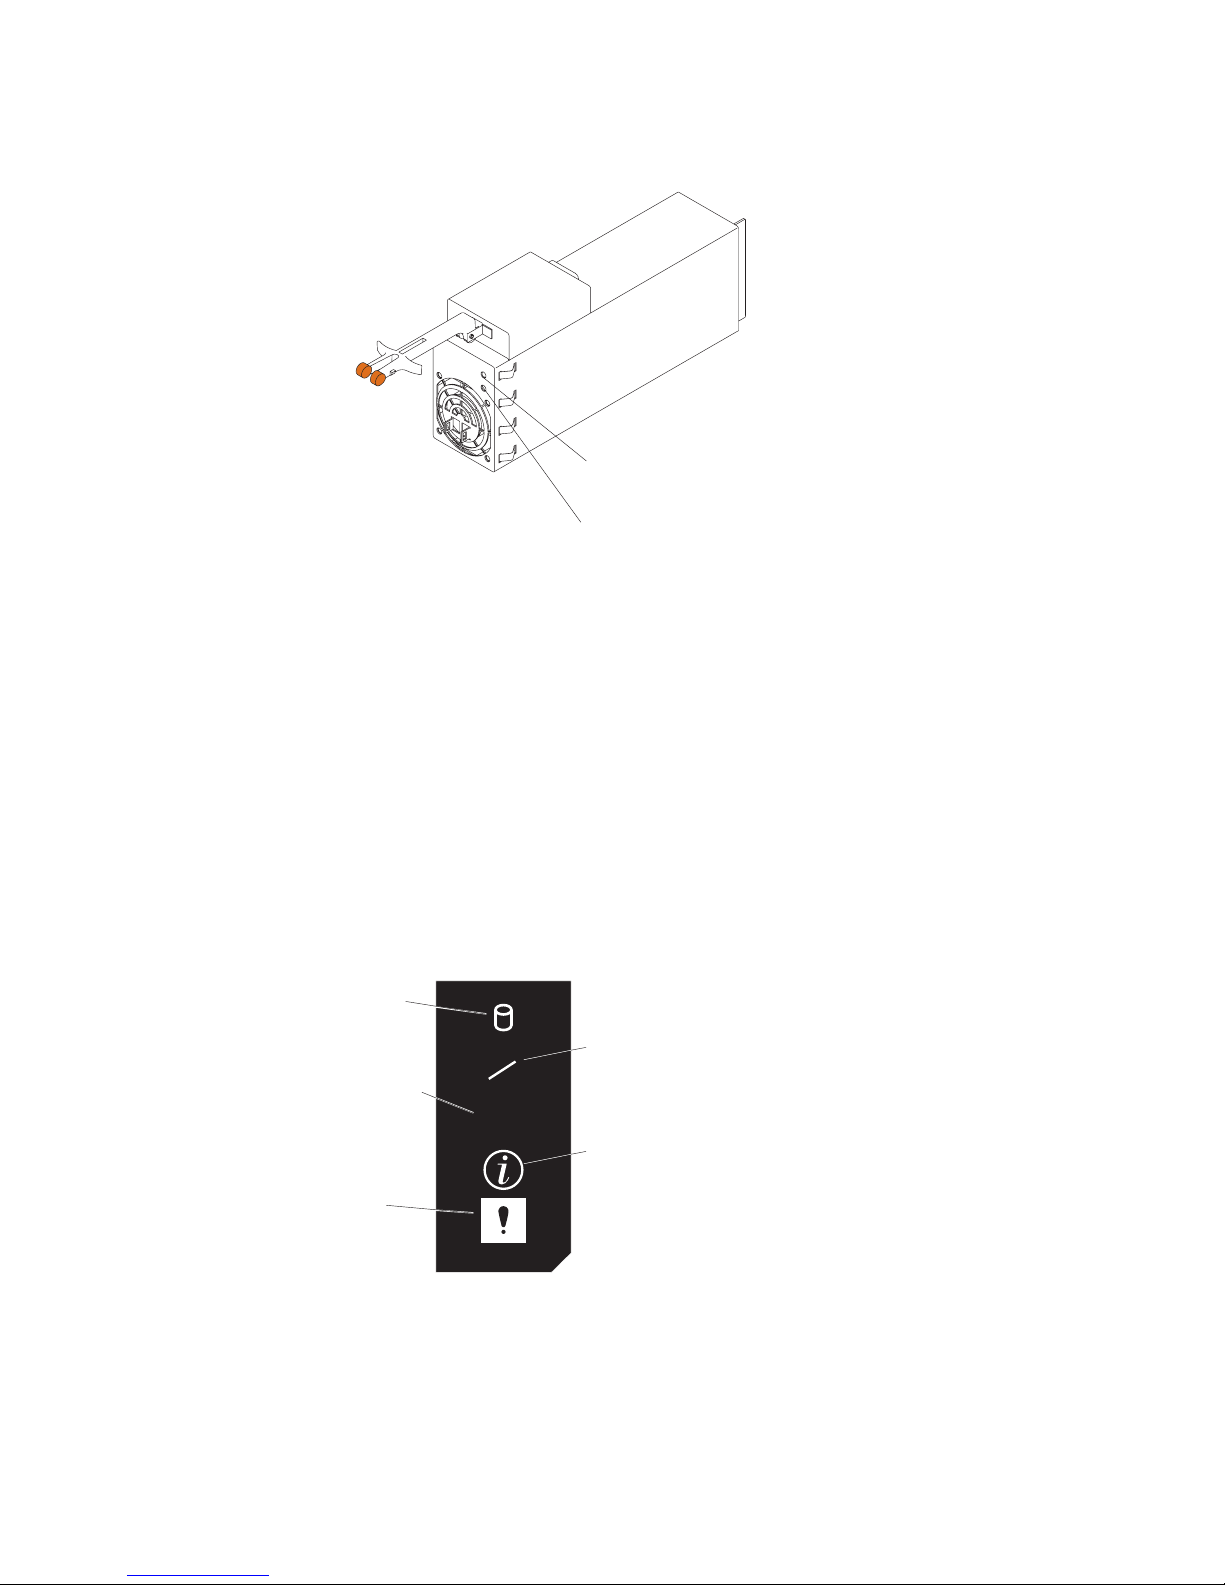
Hard Disk Drive Activity Light: Each of the hot-swap drive bays has a Hard Disk
Activity light. When this green light is flashing, the controller is accessing the drive.
AC power
LED (green)
DC power
LED (green)
AC Power Light: This light provides status information about the power supply.
During normal operation, both the AC and DC Power lights are on. For any other
combination of lights, see “Power supply LED errors” on page 92.
DC Power Light: This light provides status information about the power supply.
During normal operation, both the AC and DC Power lights are on. For any other
combination of lights, see “Power supply LED errors” on page 92.
Operator information panel
SCSI Hard
Drive Activity
Light (green)
Ethernet Link
Status Light
(green)
System
Error
Light (amber)
SCSI Hard Disk Drive Activity Light: This green light is on when there is activity
on a hard disk drive.
TX
RX
LINK
OK
Ethernet
Transmit/
Receive
Activity Light
(green)
Information
Light (amber)
Ethernet Transmit/Receive Activity Light: When this green light is on, there is
transmit or receive activity to or from the server. This light stays on even if the
server power is turned off.
8 Hardware Maintenance Manual: xSeries 342 Type 8669
Page 19
Ethernet Link Status Light: When this green light is on, there is an active
connection on the Ethernet port. The light stays on even if the server power is
turned off.
Information Light: This amber light is on when the system error log contains
information about certain conditions in the server that might affect performance.
System Error Light: This amber light is lit when a system error occurs. An LED on
the diagnostic LED panel may also be on to further isolate the error.
Powering on the server
You can start the server in several ways:
v You can turn on the server by pressing the power-control button on the front of
the server.
v If the server is turned on, a power failure occurs, and unattended-start mode is
enabled in the Configuration/Setup utility program, the server will start
automatically when power is restored.
v If AC power is present, the server is off, and the wake-up feature is enabled in
the Configuration/Setup utility program, the wake-up feature will turn on the
server at the set time.
v The Integrated System Management Processor can also turn on the server.
Powering off the server
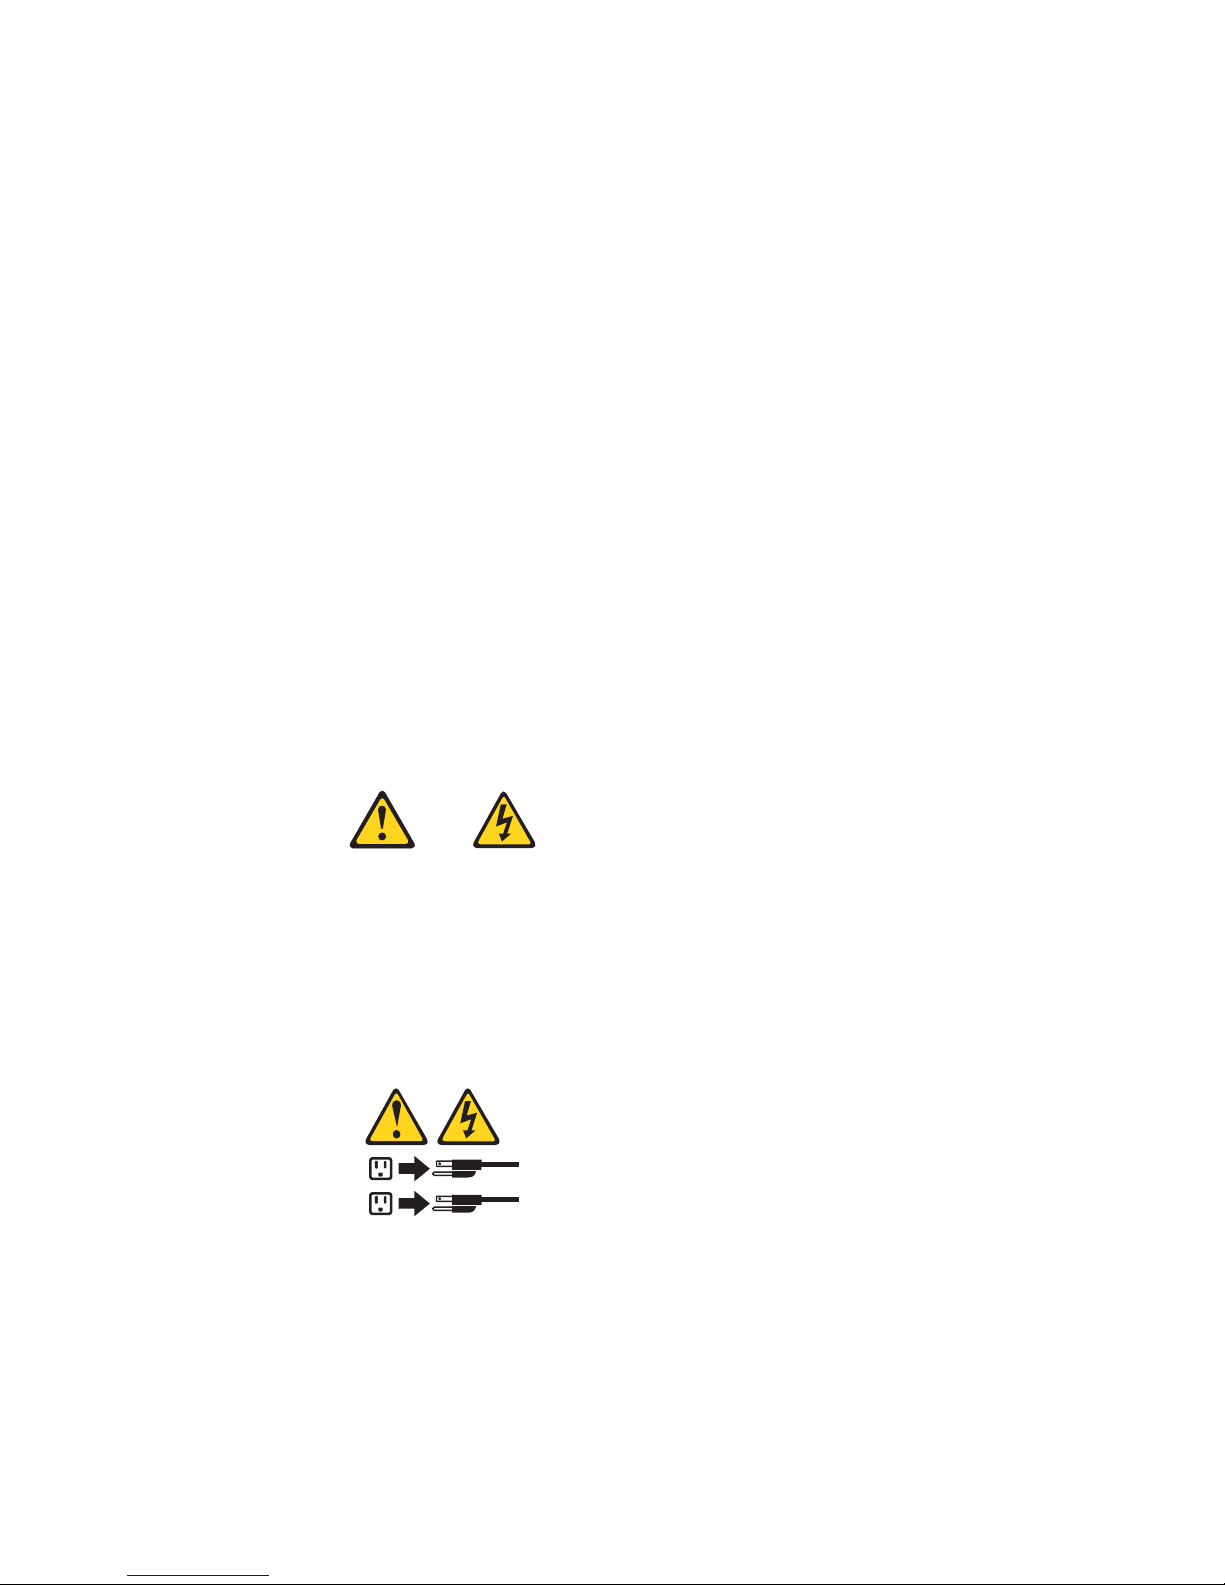
Statement 5:
CAUTION:
The power control button on the device and the power switch on the power
supply do not turn off the electrical current supplied to the device. The device
also might have more than one power cord. To remove all electrical current
from the device, ensure that all power cords are disconnected from the power
source.
2
1
The server can be turned off as follows:
v You can turn off the server by pressing the power-control button on the front of
the server. Pressing the power-control button starts an orderly shutdown of the
operating system, if this feature is supported by the operating system, and places
the server in standby mode.
Note: After turning off the server, wait at least 5 seconds before pressing the
power-control button to power the server on again.
General information 9
Page 20

v You can press and hold the power-control button for more than 4 seconds to
cause an immediate shutdown of the server and place the server in standby
mode. You can use this feature if the operating system hangs.
v You can disconnect the server power cords from the electrical outlets to shut off
all power to the server.
Note: Wait about 15 seconds after disconnecting the power cords for the system
to stop running. Watch for the System Power light on the operator
information panel to stop blinking.
v If the system was turned on by the wake-up feature or Wake on LAN feature, you
can turn it off by either a software routine or by the fail-safe, power-down
counter.
v The Integrated System Management Processor can turn off the server.
10 Hardware Maintenance Manual: xSeries 342 Type 8669
Page 21

Diagnostics
This section provides basic troubleshooting information to help you resolve some
common problems that might occur with the server.
Diagnostic tools overview
The following tools are available to help you identify and resolve hardware-related
problems:
v POST beep codes, error messages, and error logs
The power-on self-test (POST) generates beep codes and messages to indicate
successful test completion or the detection of a problem. See “POST” on page 12
for more information.
v Diagnostic programs and error messages
The server diagnostic programs are stored in upgradable read-only memory
(ROM) on the system board. These programs are the primary method of testing
the major components of the server. See “Diagnostic programs and error
messages” on page 13 for more information.
v Light path diagnostics
The server has light-emitting diodes (LEDs) to help you identify problems with
server components. These LEDs are part of the light-path diagnostics that are
built into the server. By following the path of lights, you can quickly identify the
type of system error that occurred. See “Light path diagnostics” for more
information.
Identifying problems using LEDs
The server has LEDs to help you identify problems with some server components.
These LEDs are part of the light path diagnostics built into the server. By following
the path of lights, you can identify the type of system error that occurred. See the
following sections for more information.
Power supply LEDs
The AC and DC Power LEDs on the power supply provide status information about
the power supply. See “Power supply LED errors” on page 92.
Light path diagnostics
You can use the light path diagnostics built into the server to quickly identify the
type of system error that occurred. The diagnostics panel is under the air baffle.
The server is designed so that any LEDs that are illuminated remain illuminated
when the server shuts down as long as the AC power source is good and the
power supplies can supply +5V DC current to the server. This feature helps you
isolate the problem if an error causes the server to shut down. See “Light path
diagnostics” on page 12.
Diagnostics panel
The following illustration shows the LEDs on the diagnostics panel on the system
board. See “Light path diagnostics” on page 12 for information on identifying
© Copyright IBM Corp. 2000, 2001 11
Page 22
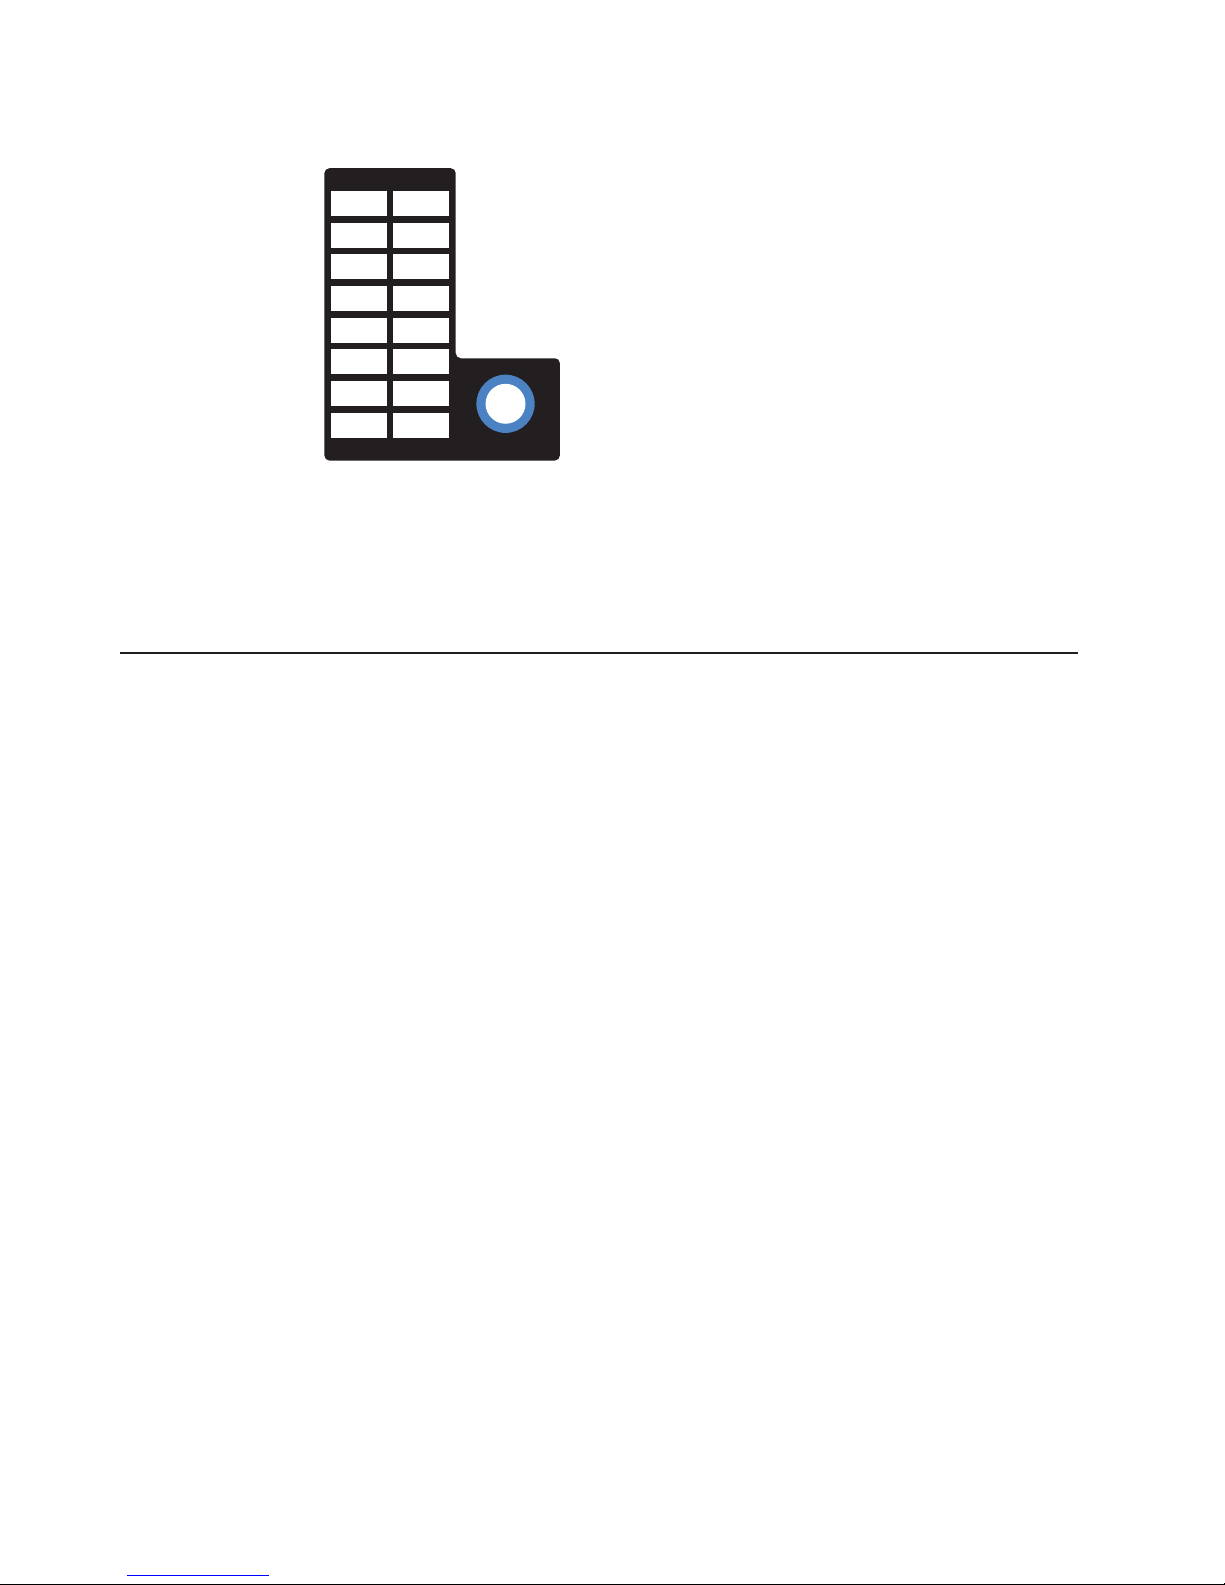
problems using these LEDs.
MEM
CPU
PCI A
PCI B
PCI C
VRM
DASD
SP
PS1
PS2
PS3
NON
OVER
NMI
TEMP
FAN
Light path diagnostics
The System Error LED on the operator information panel is lit when certain system
errors occur. If the System Error LED on the server is lit, see the table in
“Information panel system error LED” on page 85 to determine the cause of the
error and the action you should take.
POST
When you turn on the server, it performs a series of tests to check the operation of
server components and some of the options installed in the server. This series of
tests is called the power-on self-test, or POST.
REMIND
If POST finishes without detecting any problems, a single beep sounds and the first
screen of the operating system or application program appears.
If POST detects a problem, more than one beep sounds and an error message
appears on the screen. See “Beep symptoms” on page 83 and “POST error
messages” for more information.
Notes:
1. If you have a power-on password or administrator password set (with Remote
Supervisor Adapter installed), you must type the password and press Enter,
when prompted, before POST will continue.
2. A single problem might cause several error messages. When this occurs, work
to correct the cause of the first error message. After you correct the cause of
the first error message, the other error messages usually will not occur the next
time you run the test.
POST error messages
The table “POST error codes” on page 93 provides information about the POST
error messages that can appear during startup.
Error logs
The POST error log contains the three most recent error codes and messages that
the system generated during POST. The system error log contains all messages
issued during POST and system status messages from the integrated system
management processor.
12 Hardware Maintenance Manual: xSeries 342 Type 8669
Page 23

Note: It is possible during power-on that some system error log entries may
contain a date of 01/01/1990 with a time of 00:00:00. These entries occur
prior to the ISMP clock being initialized and may be disregarded.
You can view the contents of the error logs from the Configuration/Setup Utility
program or from the diagnostic programs.
Log viewing from Configuration/Setup
To view the contents of the error log from the Configuration/Setup Utility, start the
Configuration/Setup Utility program; then, select Error Logs from the main menu.
See “Starting the Configuration/Setup Utility program” on page 23 for more
information.
Log viewing from diagnostic programs
To view the contents of the error log from the diagnostic programs, start the
diagnostic programs; select Hardware Info from the top of the diagnostic programs
screen; select System Error Log from the list that appears; then, follow the
instructions on the screen. See “Starting the diagnostic programs” on page 15 for
more information.
SCSI messages (some models)
If you receive a SCSI error message while using the SCSISelect Utility, use the
following list to determine the possible cause of the error and what action to take.
Note: If the server does not have a hard disk drive, ignore any message that
indicates that the drive is not installed.
One or more of the following might be causing the problem.
v A failing SCSI device (adapter or drive)
v An improper SCSI configuration
v Duplicate SCSI IDs in the same SCSI chain
v An improperly installed SCSI terminator
v A defective SCSI terminator
v An improperly installed cable
v A defective cable
Verify that:
v The external SCSI devices are turned on. External devices must be turned on
before the server.
v The cables for all external SCSI devices are connected correctly.
v The last device in each SCSI chain is terminated properly.
v The SCSI devices are configured correctly.
You will get these messages only when running the SCSISelect Utility. See “SCSI
error codes” on page 99.
Diagnostic programs and error messages
The server diagnostic programs are stored in upgradable read-only memory (ROM)
on the system board. These programs are the primary method of testing the major
components of the server.
Diagnostics 13
Page 24

Diagnostic error messages indicate that a problem exists; they are not intended to
be used to identify a failing part. Troubleshooting and servicing of complex
problems that are indicated by error messages should be performed by trained
service personnel.
Sometimes the first error to occur causes additional errors. In this case, the server
displays more than one error message. Always follow the suggested action
instructions for the first error message that appears.
The following sections contain the error codes that might appear in the detailed test
log and summary log when running the diagnostic programs.
The error code format is as follows:
fff-ttt-iii-date-cc-text message
where:
fff is the three-digit function code that indicates the function being tested when
the error occurred. For example, function code 089 is for the
microprocessor.
ttt is the three-digit failure code that indicates the exact test failure that was
encountered.
iii is the three-digit device ID.
date is the date that the diagnostic test was run and the error recorded.
Text messages
cc is the check digit that is used to verify the validity of the information.
text message
is the diagnostic message that indicates the reason for the problem.
The diagnostic text message format is as follows:
Function Name: Result (test specific string)
where:
Function Name
is the name of the function being tested when the error occurred. This
corresponds to the function code (fff) given in the previous list.
Result
can be one of the following:
Passed
This result occurs when the diagnostic test completes without any errors.
Failed This result occurs when the diagnostic test discovers an error.
User Aborted
This result occurs when you stop the diagnostic test before it is complete.
Not Applicable
This result occurs when you specify a diagnostic test for a device that is not
present.
Aborted
This result occurs when the test could not proceed because of the system
configuration.
14 Hardware Maintenance Manual: xSeries 342 Type 8669
Page 25

Warning
This result occurs when a possible problem is reported during the
diagnostic test, such as when a device that is to be tested is not installed.
Test Specific String
This is additional information that you can use to analyze the problem.
Starting the diagnostic programs
You can press F1 while running the diagnostic programs to obtain Help information.
You also can press F1 from within a help screen to obtain online documentation
from which you can select different categories. To exit Help and return to where you
left off, press Esc.
To start the diagnostic programs:
1. Turn on the server and watch the screen.
Note: To run the diagnostic programs, you must start the server with the
highest level password that is set. That is, if an administrator password is
set, you must enter the administrator password, not the power-on
password, to run the diagnostic programs.
2. When the message F2 for Diagnostics appears, press F2.
3. Type in the appropriate password; then, press Enter.
4. Select either Extended or Basic from the top of the screen.
5. When the Diagnostic Programs screen appears, select the test you want to run
from the list that appears; then, follow the instructions on the screen.
Notes:
a. If the server stops during testing and you cannot continue, restart the server
and try running the diagnostic programs again.
b. The keyboard and mouse (pointing device) tests assume that a keyboard
and mouse are attached to the server.
c. If you run the diagnostic programs with either no mouse or a USB mouse
attached to the server, you will not be able to navigate between test
categories using the Next Cat and Prev Cat buttons. All other functions
provided by mouse-selectable buttons are also available using the function
keys.
d. You can test the USB keyboard by using the regular keyboard test. Also,
you can run the USB Interface test only if there are no USB devices
attached.
e. You can view server configuration information (such as system configuration,
memory contents, interrupt request (IRQ) use, direct memory access (DMA)
use, device drivers, and so on) by selecting Hardware Info from the top of
the screen.
When the tests have completed, you can view the Test Log by selecting Utility from
the top of the screen.
If the hardware checks out OK but the problem persists during normal server
operations, a software error might be the cause. If you suspect a software problem,
refer to the information that comes with the software package.
Diagnostics 15
Page 26

Viewing the test log
The test log will not contain any information until after the diagnostic program has
run.
Note: If you already are running the diagnostic programs, begin with step 3
To view the test log:
1. Turn on the server and watch the screen.
If the server is on, shut down the operating system and restart the server.
2. When the message F2 for Diagnostics appears, press F2.
If a power-on password or administrator password is set, the server prompts
you for it. Type in the appropriate password; then, press Enter.
3. When the Diagnostic Programs screen appears, select Utility from the top of
the screen.
4. Select View Test Log from the list that appears; then, follow the instructions on
the screen.
The system maintains the test-log data while the server is powered on. When
you turn off the power to the server, the test log is cleared.
Diagnostic error message tables
For descriptions of the error messages that might appear when you run the
diagnostic programs, see “Diagnostic error codes” on page 87.
Attention: If diagnostic error messages appear that are not listed in the tables,
make sure that the server has the latest levels of BIOS, Integrated System
Management Processor, ServeRAID, and diagnostics microcode installed.
Recovering BIOS code
If the BIOS code has become damaged, such as from a power failure during a flash
update, you can recover the BIOS using the recovery boot block and a BIOS flash
diskette.
Note: You can obtain a BIOS flash diskette from one of the following sources:
v Use the ServerGuide program to make a BIOS flash diskette.
v Download a BIOS flash diskette from the World Wide Web. Go to
The flash memory of the server contains a protected area that cannot be
overwritten. The recovery boot block is a section of code in this protected area that
enables the server to start up and to read a flash diskette. The flash utility recovers
the system BIOS from the BIOS recovery files on the diskette.
To recover the BIOS:
1. Turn off the server and peripheral devices and disconnect all external cables
and power cords; then, remove the cover.
2. Locate the boot-block jumper block (J16) on the system board.
3. Place a jumper on pins 2 and 3 to enable BIOS backup page.
4. Insert the BIOS flash diskette into the diskette drive.
5. Restart the server.
http://www.ibm.com/pc/support/ and make the appropriate selections.
16 Hardware Maintenance Manual: xSeries 342 Type 8669
Page 27

6. The system completes the power-on self-test (POST). Select 1 – Update
POST/BIOS from the menu that contains various flash (update) options.
7. When you are asked if you would like to move the current POST/BIOS image
to the backup ROM location, type N.
Attention: Typing Y will copy the corrupted BIOS into the secondary page.
8. When you are asked if you would like to save the current code to a diskette,
select N.
9. You will be asked to choose which language you wish to use. Select your
language (0-7) and press Enter to accept your choice. You will be prompted to
remove the diskette and press Enter to restart the system. Remove the flash
diskette from the diskette drive.
10. Turn off the server.
11. Remove the jumper on the boot-block jumper block or move it to pins 1 and 2
to return to normal startup mode.
12. Restart the server. The system should start up normally.
Troubleshooting the Ethernet controller
This section provides troubleshooting information for problems that might occur with
the 10/100 Mbps Ethernet controller.
Network connection problems
If the Ethernet controller cannot connect to the network, check the following:
v Make sure that the cable is installed correctly.
The network cable must be securely attached at all connections. If the cable is
attached but the problem persists, try a different cable.
If you set the Ethernet controller to operate at 100 Mbps, you must use Category
5 cabling.
If you directly connect two workstations (without a hub), or if you are not using a
hub with X ports, use a crossover cable.
Note: To determine whether a hub has an X port, check the port label. If the
label contains an X, the hub has an X port.
v Determine if the hub supports auto-negotiation. If not, try configuring the
integrated Ethernet controller manually to match the speed and duplex mode of
the hub.
v Check the Ethernet controller lights on the operator information panel.
These lights indicate whether a problem exists with the connector, cable, or hub.
– The Ethernet Link Status light illuminates when the Ethernet controller
receives a LINK pulse from the hub. If the light is off, there might be a bad
connector or cable, or a problem with the hub.
– The Ethernet Transmit/Receive Activity light illuminates when the Ethernet
controller sends or receives data over the Ethernet Network. If the Ethernet
Transmit/Receive Activity light is off, make sure that the hub and network are
operating and that the correct device drivers are loaded.
– The Ethernet Speed 100 Mbps light illuminates when the Ethernet controller
LAN speed is 100 Mbps.
v Make sure that you are using the correct device drivers, supplied with the server.
v Check for operating system-specific causes for the problem.
v Make sure that the device drivers on the client and server are using the same
protocol.
v Test the Ethernet controller.
Diagnostics 17
Page 28

The way you test the Ethernet controller depends on which operating system you
are using (see the Ethernet controller device driver README file).
The Ethernet wrap test can be used to determine if a hardware problem is
causing the Ethernet connection to fail. To perform the Ethernet wrap test, use
the wrap plug (FRU # 60G3981) in conjunction with the diagnostic tests.
If the testing methods above indicate that the hardware is functioning normally
but the problem still exists, inform the network administrator.
Ethernet controller troubleshooting chart
You can use the following troubleshooting chart to find solutions to 10/100 Mbps
Ethernet controller problems that have definite symptoms.
Table 1. Ethernet troubleshooting chart
Ethernet controller problem Suggested Action
The server stops running
when loading device drivers.
The PCI BIOS interrupt settings are incorrect.
Check the following:
v Determine if the interrupt (IRQ) setting assigned to the Ethernet controller is also
assigned to another device in the Configuration/Setup Utility program.
Although interrupt sharing is allowed for PCI devices, some devices do not function
well when they share an interrupt with a dissimilar PCI device. Try changing the
IRQ assigned to the Ethernet controller or the other device. For example, for
NetWare Versions 3 and 4 it is recommended that disk controllers not share
interrupts with LAN controllers.
v Make sure that you are using the most recent device driver available from the
World Wide Web.
v Run the network diagnostic program.
If the problem remains, go to “Starting the diagnostic programs” on page 15 to run
the diagnostic programs.
Ethernet Link Status light
does not light.
The Ethernet
Transmit/Receive Activity light
does not light.
Data is incorrect or sporadic. Check the following:
Check the following:
v Make sure that the hub is turned on.
v Check all connections at the Ethernet controller and the hub.
v Check the cable. A crossover cable is required unless the hub has an X
designation.
v Use another port on the hub.
v If the hub does not support auto-negotiation, manually configure the Ethernet
controller to match the hub.
v If you manually configured the duplex mode, make sure that you also manually
configure the speed.
v Run diagnostics on the LEDs.
If the problem remains, go to “Starting the diagnostic programs” on page 15 to run
the diagnostic programs.
Check the following:
Note: The Ethernet Transmit/Receive Activity LED illuminates only when data is sent
to or by this Ethernet controller.
v Make sure that you have loaded the network device drivers.
v The network might be idle. Try sending data from this workstation.
v Run diagnostics on the LEDs.
v The function of this LED can be changed by device driver load parameters. If
necessary, remove any LED parameter settings when you load the device drivers.
v Make sure that you are using Category 5 cabling when operating the server at 100
Mbps.
v Make sure that the cables do not run close to noise-inducing sources like
fluorescent lights.
18 Hardware Maintenance Manual: xSeries 342 Type 8669
Page 29

Table 1. Ethernet troubleshooting chart (continued)
Ethernet controller problem Suggested Action
The Ethernet controller
stopped working when
another adapter was added to
the server.
The Ethernet controller
stopped working without
apparent cause.
Check the following:
v Make sure that the cable is connected to the Ethernet controller.
v Make sure that the PCI system BIOS is current.
v Reseat the adapter.
v Determine if the interrupt (IRQ) setting assigned to the Ethernet adapter is also
assigned to another device in the Configuration/Setup Utility program.
Although interrupt sharing is allowed for PCI devices, some devices do not function
well when they share an interrupt with a dissimilar PCI device. Try changing the
IRQ assigned to the Ethernet adapter or the other device.
If the problem remains, go to “Starting the diagnostic programs” on page 15 to run
the diagnostic programs.
Check the following:
v Run diagnostics for the Ethernet controller.
v Try a different connector on the hub.
v Reinstall the device drivers. Refer to the operating-system documentation and to
the ServerGuide information.
If the problem remains, go to “Starting the diagnostic programs” on page 15 to run
the diagnostic programs.
Power checkout
Power problems can be difficult to troubleshoot. For instance, a short circuit can
exist anywhere on any of the power distribution busses. Usually a short circuit will
cause the power subsystem to shut down because of an overcurrent condition.
A general procedure for troubleshooting power problems is as follows:
1. Power off the system and disconnect the AC cord(s).
2. Check for loose cables in the power subsystem. Also check for short circuits, for
instance if there is a loose screw causing a short circuit on a circuit board.
3. Remove adapters and disconnect the cables and power connectors to all
internal and external devices until system is at minimum configuration required
for power on (see ″Minimum operating requirements″ on page 103).
4. Reconnect the AC cord and power on the system. If the system powers up
successfully, replace adapters and devices one at a time until the problem is
isolated. If system does not power up from minimal configuration, replace FRUs
of minimal configuration one at a time until the problem is isolated.
To use this method it is important to know the minimum configuration required for a
system to power up (see page 103). For specific problems, see “Power error
messages” on page 100.
Replacing the battery
When replacing the battery, you must replace it with a lithium battery of the same
type from the same manufacturer. To avoid possible danger, read and follow the
safety statement below.
To order replacement batteries, call 1-800-772-2227 within the United States, and
1-800-465-7999 or 1-800-465-6666 within Canada. Outside the U.S. and Canada,
call your IBM reseller or IBM marketing representative.
Diagnostics 19
Page 30
Note: After you replace the battery, you must reconfigure the system and reset the
system date and time.
v Statement 2
CAUTION:
When replacing the lithium battery, use only IBM Part Number 33F8354 or an
equivalent type battery recommended by the manufacturer. If the system has
a module containing a lithium battery, replace it only with the same module
type made by the same manufacturer. The battery contains lithium and can
explode if not properly used, handled, or disposed of.
Do not:
v Throw or immerse into water.
v Heat to more than 100°C (212°F)
v Repair or disassemble
Dispose of the battery as required by local ordinances or regulations.
Note: Before you begin be sure to read “Before you begin” on page 40. Follow any
special handling and installation instructions supplied with the replacement
battery.
To replace the battery:
1. Review the information in “Before you begin” on page 40 and any special
handling and installation instructions supplied with the replacement battery.
2. Turn off the server and peripheral devices and disconnect all external cables
and power cords; then, remove the server cover.
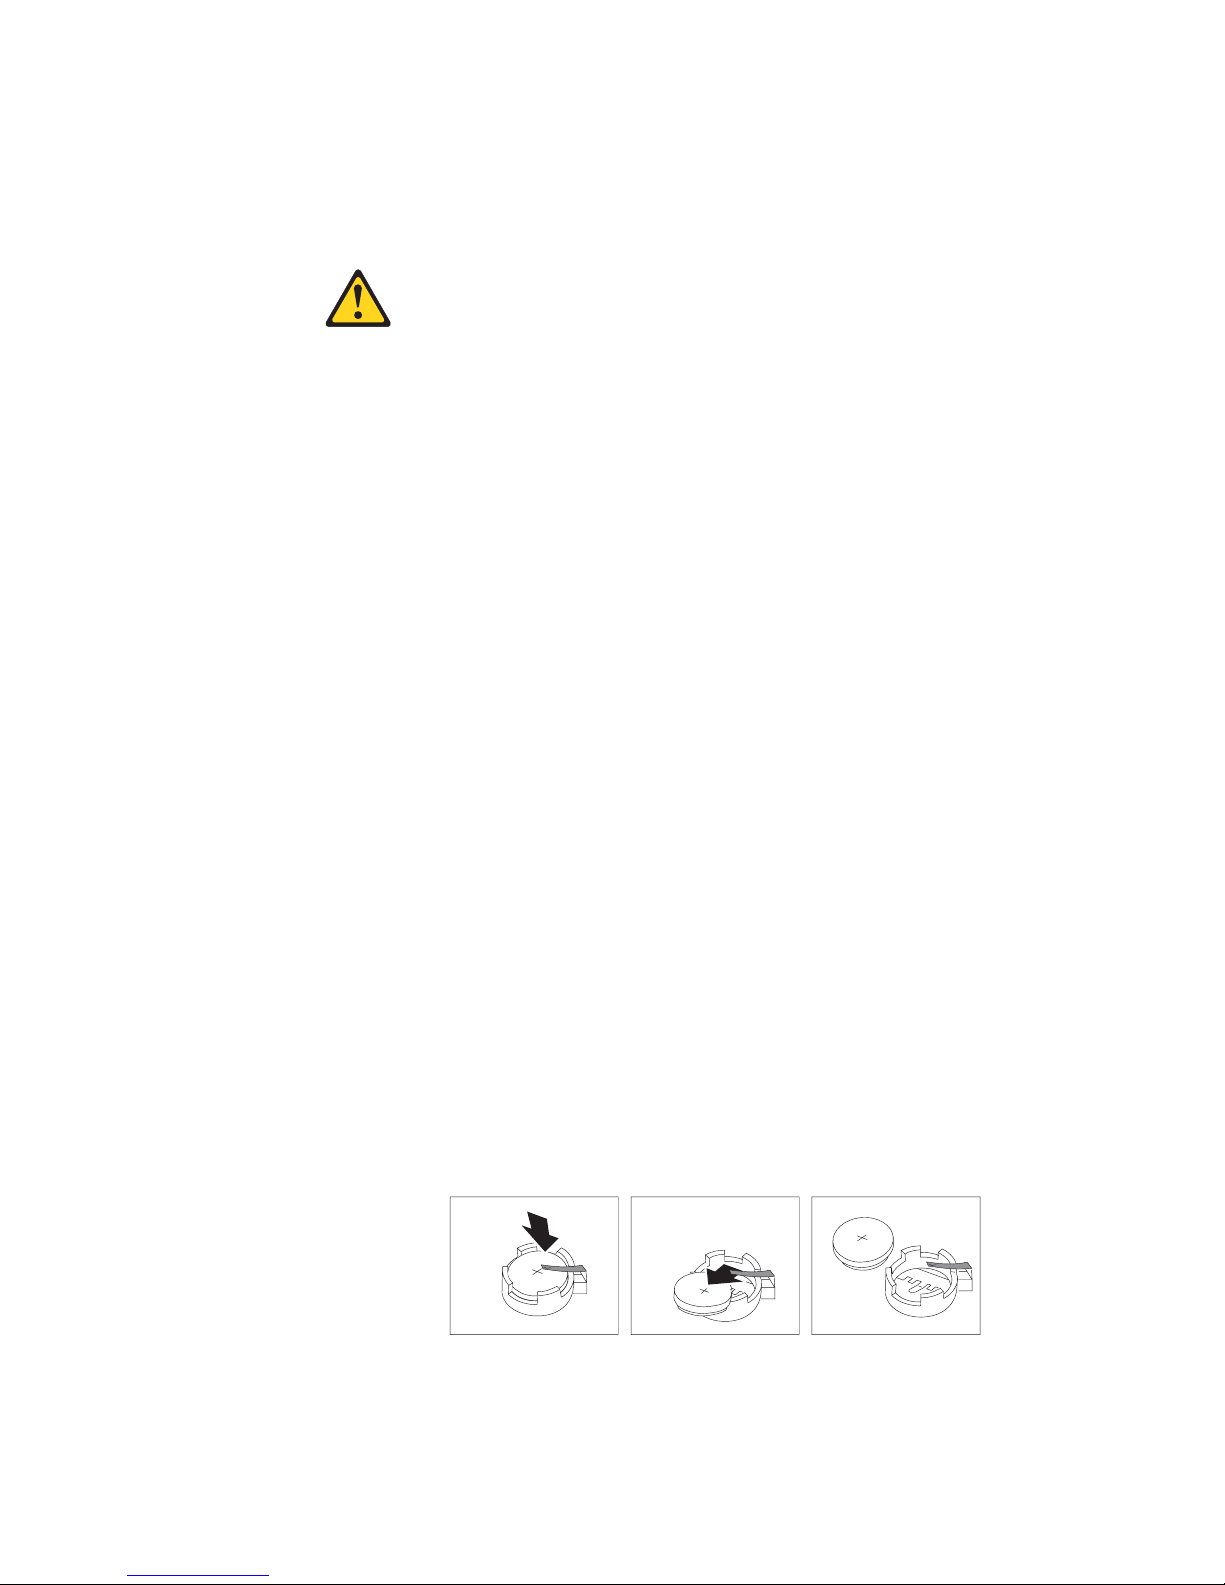
3. Remove the battery:
a. Use one finger to lift the battery clip over the battery.
b. Use one finger to slightly slide the battery from its socket. The spring
mechanism behind the battery will push the battery out toward you as you
slide it from the socket.
c. Use your thumb and index finger to pull the battery from under the battery
clip.
d. Ensure that the battery clip is touching the base of the battery socket by
pressing gently on the clip.
4. Insert the new battery:
a. Tilt the battery so that you can insert it into the socket, under the battery
clip.
b. As you slide it under the battery clip, press the battery down into the socket.
20 Hardware Maintenance Manual: xSeries 342 Type 8669
Page 31

5. Reinstall the server cover and connect the cables.
6. Turn the server on.
7. Start the Configuration/Setup Utility program and set configuration parameters.
v Set the system date and time.
v Set the power-on password.
v Reconfigure the server.
Diagnostics 21
Page 32

22 Hardware Maintenance Manual: xSeries 342 Type 8669
Page 33

Configuration
The following configuration programs are provided with the server:
v Configuration/Setup Utility
This program is part of the basic input/output system (BIOS) that comes with the
server. You can use this program to configure serial port assignments, change
interrupt request (IRQ) settings, change the drive startup sequence, set the date
and time, and set passwords. See “Using the Configuration/Setup Utility program”
for more information.
v SCSISelect Utility
With the built-in SCSISelect Utility program, you can configure the devices
attached to the integrated SCSI controller. See “Using the SCSISelect utility
program” on page 28 for more information.
v PXE Boot Agent Utility
The Preboot eXecution Environment (PXE) Boot Agent Utility program is part of
the BIOS code that comes with the server. You can use this program to change
network startup (boot) protocols and startup (boot) order, to select operating
system wake up support, and to set menu wait times. See “Using the PXE boot
agent utility program” on page 29 for more information
v ServerGuide CDs
The ServerGuide CDs include software setup and installation tools specifically
designed for IBM xSeries servers. You can use these CDs during the initial
installation of the server to configure the server hardware and simplify the
network operating system installation. The ServerGuide CDs also contain a
collection of application programs, which you can install after the server is up and
running.
v ServeRAID programs
The ServeRAID programs come with the optional ServeRAID adapters and with
server models that have a ServeRAID adapter preinstalled. If the server has a
ServeRAID adapter installed, you must use the ServeRAID configuration program
to define and configure the disk-array subsystem before you install the operating
system. Refer to the ServeRAID documentation provided on the xSeries
Documentation CD for more information.
Using the Configuration/Setup Utility program
This section provides the instructions needed to start the Configuration/Setup Utility
program and descriptions of the menu choices available.
Starting the Configuration/Setup Utility program
To start the Configuration/Setup Utility program:
1. Turn on the server and watch the monitor screen.
2. When the message Press F1 for Configuration/Setup appears, press F1.
Note: If you have set both levels of passwords (user and administrator), you
3. Follow the instructions that appear on the screen.
© Copyright IBM Corp. 2000, 2001 23
must type the administrator password to access the full
Configuration/Setup menu.
Page 34

Main menu of the Configuration/Setup Utility
From the Configuration/Setup Utility main menu, you can select settings that you
want to change. The Configuration/Setup Utility main menu is similar to the
following:
IBM Server Setup - © Copyright IBM Corporation 2001
Configuration/Setup Utility
·
System Summary
·
System Information
· Product Data
·
Devices and I/O Ports
·
Date and Time
·
System Security
·
Start Options
·
Advanced Setup
·
Error Logs
Save Settings
Restore Settings
Load Default Settings
Exit Setup
<F1> Help < > < > Move
<Esc> Exit <Enter> Select
¯
Notes:
1. You can press F1 to display Help information for a selected menu item.
2. The choices on some menus might differ slightly, depending on the BIOS
version in the server.
Descriptions of the choices available from the main menu are as follows:
v System Summary
Select this choice to display configuration information. This includes the type and
speed of the microprocessors and the amount of memory installed.
Changes that you make to configuration settings appear on this summary screen.
You cannot edit the fields.
v Product Data
Select this choice to view system information, such as the machine type and
model, the server serial number, the system Universally Unique Identifier (UUID)
number, the integrated system management processor revision level, and the
revision level or issue date of the BIOS code stored in the flash electrically
erasable programmable ROM (EEPROM).
Note: The server serial number is used as the name of the system on the ASM
interconnect network for any remote alerts. For more information, refer to
the system management adapter option documentation.
v Devices and I/O Ports
Select this choice to view or change the assignments for devices and
input/output ports. This choice appears only on the full Configuration/Setup Utility
main menu.
v Date and Time
Select this choice to set the system date and time.
The system time is in a 24-hour format (hour:minute:second).
v System Security
Select this choice to set or change a power-on password.
24 Hardware Maintenance Manual: xSeries 342 Type 8669
Page 35

If you have an optional Remote Supervisor Adapter installed, you can also set
the administrator password and the remote-control password.
After you set a power-on password, you can enable the unattended-start mode.
This locks the keyboard and mouse but allows the system to start the operating
system. The keyboard and mouse remain locked until you type the correct
password. See “Using passwords” on page 27 for more information.
v Start Options
Select this choice to view or change the start options. This choice appears only
on the full Configuration/Setup Utility main menu. Start options take effect when
you start the server.
You can select keyboard operating characteristics, such as whether the keyboard
number lock starts on or off. You also can enable the server to run without a
diskette drive, monitor, or keyboard.
You can enable a virus-detection test that checks for changes in the master boot
record at startup. You also can choose to run POST in the Enhanced mode or
the Quick mode.
– Startup Sequence Options
The server uses a startup sequence to determine the device from which the
operating system loads. For example, you can define a startup sequence that
checks for a startable diskette in the diskette drive; then, it checks the hard
disk drive in bay 1, and checks a network adapter.
– Alert on LAN BIOS
You can enable Alert on LAN support with this option. The default setting for
this menu item is Disabled.
v Advanced Setup
Select this choice to change values for advanced hardware features, such as
cache control and PCI configuration. This choice appears only on the full
Configuration/Setup Utility main menu.
A warning message appears above the choices on this menu to alert you that the
system might malfunction if these options are configured incorrectly. Follow the
instructions on the screen carefully.
– Core Chipset Control
Select this choice to modify settings that control features of the core chipset
on the system board.
Attention: Do not make changes here unless directed to do so by an IBM
authorized service representative.
– System Partition Visibility
Select this choice to choose whether the System Partition is visible or hidden.
– Memory Settings
Select this choice to manually disable or enable a bank of memory.
If a memory error is detected during POST or memory configuration, the
server can automatically disable the failing memory bank and continue
operating with reduced memory capacity. If this occurs, you must manually
enable the memory bank after the problem is corrected. Select Memory
Settings from the Advanced Setup menu and use the arrow keys to highlight
the bank that you want to enable; then, use the arrow keys to select Enabled.
– CPU Options
Select this choice to set the system cache type for all microprocessors.
– PCI BUS Control
Configuration 25
Page 36

Select this choice to view and identify system resources used by PCI devices.
PCI devices automatically communicate with the server configuration
information. This usually results in automatic configuration of a PCI device.
After making changes, select:
- PCI MLT to save the changes and return to the Advanced Setup menu.
- PCI Interrupt Routing to ignore the changes, restore the previous settings,
and return to the Advanced Setup menu.
– Integrated System Management Processor Settings
Select this choice to set the server to automatically restart after a
nonmaskable interrupt (NMI) occurs. The default setting for this menu item is
Enabled.
v Error Logs
Select this choice to view the three most recent error codes and messages that
the system generated during POST. You can also select Clear error logs to
clear the contents of this log.
Note: System status messages available in the System Error Log in the
Configuration/Setup Utility program are provided only for trained IBM
service personnel.
v Save Settings
Select this choice to save your customized settings.
v Restore Settings
Select this choice to delete your changes and restore the previous settings.
v Load Default Settings
Select this choice to cancel your changes and restore the factory settings.
v Exit Setup
If you have made any changes, the program will prompt you to save the changes
or exit without saving the changes.
Additional Configuration/Setup Utility menu choices
When you install an IBM Remote Supervisor Adapter in the server, you can view
additional menu choices in the Configuration/Setup Utility program, such as:
v System Information
Select this choice to display information about the server.
v PCI Slot Information
Select this choice to view the properties of adapters installed in PCI slots.
v Administrator Password
Select this choice to set or change the administrator password.
v Remote Control Security Settings
Select this choice to set a remote-control password. When you set a
remote-control password, you can also set the number of failed attempts to enter
the correct remote-control password, and the duration before another attempt is
allowed.
For a list of supported options for the server, refer to
http://www.ibm.com/pc/us/compat/ on the World Wide Web. To order an optional
Remote Supervisor Adapter, contact your IBM Reseller or an IBM marketing
representative.
26 Hardware Maintenance Manual: xSeries 342 Type 8669
Page 37

Using passwords
The System Security choice appears only on the full Configuration/Setup Utility
menu. After you select this choice, you can implement the protection level for the
power-on password. If you have an optional Remote Supervisor Adapter installed,
you can also implement the Administrator password and the Remote Control
password. For complete details about the optional Remote Supervisor Adapter, refer
to the documentation that comes with the adapter.
You can use any combination of up to seven characters (A–Z, a–z, and 0–9) for
your power-on password. Keep a record of your password in a secure place. If you
forget the power-on password, you can regain access to the server through one of
the following methods:
v Change the position of the password override switch as described in “Setting the
v Remove the battery and then install the battery.
Setting the password override switch
The following illustration shows the location of the password override switch, switch
6 of switch block 1, on the system board.
Note: The illustrations in this document might differ slightly from your hardware.
password override switch”.
SW1
ON
1 2 3 4 5 6 7 8
To set the password override switch:
1. Review the information in “Before you begin” on page 40 and “Safety
information” on page 109.
2. Turn off the server and peripheral devices and disconnect all external cables
and power cords; then, remove the cover. See “Removing the cover and bezel”
on page 42.
3. Change the setting of the password override switch (switch 6 on switch block 1
on the system board) to the opposite side of the switch.
4. Install the server cover and connect all external cables and power cords (see
“Installing the server cover and bezel” on page 64).
Password override switch
(switch 6 of switch block 1)
Configuration 27
Page 38

5. Turn on the server.
Note: You can now start the Configuration/Setup Utility program and set a
power-on password. Restart the server; then, press the F1 key to enter the
Setup utility. Select System Security and change or delete the power-on
password. If the power-on password is not changed or deleted, the old
password will be reinstated the next time you start the server.
Using the SCSISelect utility program
SCSISelect is a built-in, menu-driven configuration utility program that you can use
to:
v View the default SCSI IDs
v Locate and correct configuration conflicts
v Perform a low-level format on a SCSI hard disk
The following sections provide the instructions needed to start the SCSISelect Utility
and descriptions of the menu choices available.
Note: If the server has a RAID adapter installed, use the configuration method
supplied with the RAID adapter to view or change SCSI settings for devices
attached to the adapter.
Starting the SCSISelect utility program
To start the SCSISelect utility program:
1. Turn on the server.
2. When the <<< Press <CTRL><A> for SCSISelect
appears, press Ctrl+A.
3. When prompted, select either channel A or channel B.
4. Use the arrow keys to select a choice from the menu.
v Press Esc to return to the previous menu.
v Press the F5 key to switch between color and monochrome modes (if the
monitor permits).
5. Follow the instructions on the screen to change the settings of the selected
items; then, press Enter.
™
Utility! >>> prompt
Choices available from the SCSISelect menu
The following choices appear on the SCSISelect Utility menu:
v Configure/View Host Adapter Settings
Select this choice to view or change the SCSI controller settings. To reset the
SCSI controller to its default values, press F6; then, follow the instructions that
appear on the screen.
You can view or change the following controller settings:
– Host Adapter SCSI ID
Select this choice to view the SCSI controller ID, normally 7.
– SCSI Parity Checking
Select this choice to view the assigned value of Enabled.
– Host Adapter SCSI Termination
Select this choice to view the assigned value of Enabled.
– Boot Device Options
28 Hardware Maintenance Manual: xSeries 342 Type 8669
Page 39

Select this choice to configure startable device parameters. Before you can
make updates, you must know the ID of the device whose parameters you
want to configure.
– SCSI Device Configuration
Select this choice to configure SCSI device parameters. Before you can make
updates, you must know the ID of the device whose parameters you want to
configure.
Note: The Maximum Sync Transfer Rate represents the transfer rate for Ultra
SCSI devices.
- The transfer rate for Ultra 160 SCSI LVD devices is 160.0 Mbps.
- The transfer rate for Ultra2 SCSI LVD devices is 80.0 Mbps.
- The transfer rate for Fast SCSI devices is 20.0 Mbps.
– Advanced Configuration Options
Select this choice to view or change the settings for advanced configuration
options.
v SCSI Disk Utilities
Select this choice to view the SCSI IDs that are assigned to each device or to
format a SCSI device.
To use the utility program, select a drive from the list. Read the screens carefully
before making a selection.
Note: If you press Ctrl+A before the selected drives are ready, an Unexpected
SCSI Command Failure screen might appear. Restart the server and
watch the SCSISelect messages as each drive spins up. After the drive
that you want to view or format spins up, press Ctrl+A.
Using the PXE boot agent utility program
The PXE boot agent is a built-in, menu-driven configuration utility program that you
can use to:
v Change network startup (boot) protocols
v Change network startup (boot) order
v Set menu wait times
v Select OS wake up support
Note: Changing the network startup protocols and startup order, as well as
selecting the operating-system wake support, are not supported on this
product.
The following sections provide instructions for starting the PXE Boot Agent Utility
program and descriptions of the menu choices that are available.
Starting the PXE boot agent utility program
The following sections provide the instructions needed to start the PXE Boot Agent
Utility and descriptions of the available menu choices.
To start the PXE Boot Agent Utility program, do the following:
1. Turn on the server.
2. When the <Initializing Intel (R) Boot Agent version X.X.XX PXE 2.0
Build XXX (WfM 2.0) prompt appears, press Ctrl+S.
Configuration 29
Page 40

Note: By default, you will have two seconds after the prompt appears on the
screen to press Ctrl+S.
3. Use the arrow keys or press Enter to select a choice from the menu:
v Press Esc to return to the previous menu.
v Press the F4 key to exit.
4. Follow the instructions on the screen to change the settings of the selected
items; then, press Enter.
Choices available from the PXE boot agent menu
The following choices appear on the PXE Boot Agent Utility menu:
v Network Boot Protocol
PXE is the default value for this menu item.
Note: Do not change this value. There are no other network boot protocols
supported.
v Boot Order
Select this choice to change the order in which boot devices are queried.
– Try local drives first, then network (Default)
– Try network only
– Try local drives only
– Try network first, then local drives
Note: This option is not supported on this product. To change the boot order use
the Configuration/Setup utility. See “Using the Configuration/Setup Utility
program” on page 23 for more information.
v Show setup prompt
Select this choice to either display the PXE setup prompt or disable it. Disable is
the default setting.
When this choice is enabled, Press Ctrl+S to enter the setup menu will appear
on the screen under the initializing prompt.
v Setup time wait menu
Select this choice to set the amount of time (in seconds) that the system will
pause during initialization for a Ctrl+S input.
– 2 seconds (Default)
– 3 seconds
– 5 seconds
– 8 seconds
v Legacy OS wake up support
Select this choice to enable or disable the operating system wake up support.
– Disabled (Default)
– Enabled
Note:
1. Use the default setting for the Advanced Configuration and Power
Interface (ACPI) aware operating systems, such as Windows 2000 or
Windows NT.
2. If the server is running a non-ACPI operating system, you must set the
selection to Enable to use the Wake on LAN support.
30 Hardware Maintenance Manual: xSeries 342 Type 8669
Page 41

3. When using a non-ACPI operating system, do not send a wake up
packet to the server while it is turned on. If a wake up packet has been
sent while the server is on, you must turn off the server.
Configuration 31
Page 42

32 Hardware Maintenance Manual: xSeries 342 Type 8669
Page 43

Installing options
This chapter provides instructions to help you add options to the server. Some
option-removal instructions are provided, in case you need to remove one option to
install another.
Major components of the xSeries 342 server
The orange color on components and labels in the server identifies hot-swap or
hot-plug components. This means that you can install or remove the components
while the system is running, provided that your system is configured to support this
function. For complete information about installing or removing a hot-swap or
hot-plug component, see the information provided in the detailed procedures in this
document under “Hot-swap drive installation” on page 49.
The blue color on components and labels indicates touch points where a
component can be gripped, a latch moved, and so on.
Note: The illustrations in this document might differ slightly from your hardware.
Hot-swap fan
Air baffle
Memory module
Fan sink
Microprocessor
Terminator card
System board
Filler panel for device bay
Filler panel for
drive bay
Hot-swap hard
disk drive
Hot-swap
power supply
Filler panel for
power supply bay
© Copyright IBM Corp. 2000, 2001 33
Page 44

System board layout
The illustrations in the following sections show the components on the system
board.
System board options connectors
The following illustration shows a layout of the system board and identifies
system-board connectors for user-installable options.
Microprocessor 2
(U69)
PCI Slot 1
32-bit (J44)
PCI Slot 2
64-bit (J41)
PCI Slot 3
64-bit (J42)
Battery
(BH1)
PCI Slot 4
64-bit (J29)
PCI Slot 5
64-bit (J30)
Microprocessor 1
(U68)
VRM 1 connector (J37)
DIMM 4 (J4)
DIMM 3 (J3)
DIMM 2 (J2)
DIMM 1 (J1)
VRM 2 connector (J38)
34 Hardware Maintenance Manual: xSeries 342 Type 8669
Page 45

System board internal cable connectors
The following illustration shows internal cable connectors on the system board.
CPU1 Fan sink
connector (J46)
CPU2 Fan sink
connector (J45)
Fan 3
(J26)
Main power
connector (J19)
System management
connector (J54)
On/Off Reset
button connector (J11)
SCSI B
connector
(J25)
Power backplane
signal connector (J43)
Fan 1
(J28)
Operator
information
panel
(J39)
DASD I2C
connector (J9)
Fan 2
(J48)
IDE
(J40)
SCSI A
connector
(J24)
Flash boot block
recovery jumper
(J16)
Diskette
(J18)
Installing options 35
Page 46

System board external port connectors
The following illustration shows the external port connectors in the system board.
Serial ports
(J20)
Mouse/keyboard
ports
(J8)
Ethernet port
(J6)
USB ports
(J5)
ISM ports
(J50)
Management
(not supported)
Video port
(J36)
System board switches and jumpers
The following illustrations identify the switches and jumpers on the system board.
SW1
8 7 6 5 4 3 2 1
Password override switch
(switch 6 of switch block 1)
36 Hardware Maintenance Manual: xSeries 342 Type 8669
Page 47

123
Flash boot block
recovery jumper
(J16)
System board jumper blocks
Any jumper blocks on the system board that are not shown in the illustration are
reserved. For normal operation of the system, no jumpers should be installed on
any of the jumper blocks.
Boot block jumper
If the BIOS has become damaged, such as from a power failure during a flash
update, you can recover the BIOS using the boot block jumper and a BIOS flash
diskette. See “Recovering BIOS code” on page 16 for information about the boot
block jumper.
System board switch block
The switch block contains microswitches 1-8. As shown in this illustration, switch 8
is at the top of the switch block and switch 1 is at the bottom.
The following table describes each switch.
Table 2. Switches 1-8
Switch
number Description
1- 4 Reserved
5 Clock frequency selection.
When On, the host bus speed is 100 Mhz. When Off, the host bus speed is 133 Mhz. The default
setting is off. Set this to Off to optimize the system performance.
6 Password override. (Toggling this switch allows one opportunity to enter the Setup Utility to change
or delete the power-on password.)
See “Setting the password override switch” on page 27 for more information.
Installing options 37
Page 48

Table 2. Switches 1-8 (continued)
Switch
number Description
7 Reserved. The default setting is Off.
8 Power-on override.
When On, overrides the power-on switch and forces power-on mode. The system will always start
without the use of the power-on switch. the default setting is Off (disabled).
Note: In most cases the speed settings are locked and there is no need to change
them.
System board LED locations
The following illustration identifies LEDs on the system board. You might need to
refer to this figure when solving problems with the server.
VRM 1 error LED
(CR19)
Microprocessor 1
error LED (CR13)
DIMM 4 error LED
(CR15)
DIMM 3 error LED
(CR14)
DIMM 2 error LED
(CR17)
DIMM 1 error LED
(CR16)
Fan sink 1 LED
(CR78)
Microprocessor 2
error LED (CR20)
Fan sink 2 LED
(CR79)
VRM 2 error LED
(CR18)
Light path
diagnostics panel
Remind button
Integrated System
Management Processor
LED (CR70)
38 Hardware Maintenance Manual: xSeries 342 Type 8669
Page 49

Light Path Diagnostics panel
The Light Path Diagnostics LEDs are described in the following table.
MEM
CPU
PCI A
PCI B
PCI C
VRM
DASD
SP
PS1
PS2
PS3
NON
OVER
NMI
TEMP
FAN
REMIND
LED Description
MEM A memory failure occurred. This LED is turned on when any of the Light Path LEDs located near
the memory (DIMM) are turned on by the integrated system management processor.
CPU A CPU failure occurred. This LED is turned on when either of the two Light Path LEDs located
near the appropriate CPU socket is turned on by the integrated system management processor.
PCI A Error occurred on an adapter in PCI slot 1 or on one of the PCI devices integrated on the system
board.
PCI B Error occurred on an adapter in PCI slot 2 or 3 or on one of the PCI devices integrated on the
system board.
PCI C Error occurred on an adapter in PCI slot 4 or 5 or on one of the PCI devices integrated on the
system board.
VRM A VRM failure occurred. This LED is turned on by the hardware when either of the two Light Path
LEDs located near the appropriate VRM is turned on by the integrated system management
processor.
DASD System board or SCSI hot-swap hard disk drive failure, hard disk drive removed from either
standard or optional expansion hot-swap bay DASD backplane, or hard disk drive temperature
has exceeded maximum limit (in this case, the TEMP and System error LEDs will be lit).
SP An error has been detected in the integrated system management processor.
PS1 Power supply 1 failure or removed.
PS2 Power supply 2 failure or removed (only active when 2nd power supply is installed).
PS3 Not used.
NON-RED Server power supplies are no longer redundant with two power supplies installed.
OVERSPEC The system has approached 95% of the power capabilities of the installed power-supply units.
NMI Nonmaskable interrupt occurred.
TEMP System temperature exceeded maximum limit. Other LEDs will be on to identify the area of over
temperature (such as CPUx, CPU, DASD LEDs).
FAN Fan failure, or fan is operating slowly or has been removed. This LED is turned on when any of
the Light Path LEDs mounted directly on the fan assemblies or near the CPU sockets are turned
on by the integrated system management processor.
Remind Button
Installing options 39
Page 50

You can use the Remind button to place the front panel system-error light into a
Remind mode. By pressing the button, you acknowledge the failure but indicate that
you will not take immediate action. If a new failure occurs, the LED will turn on
again.
In the Remind mode, the system-error light flashes every 2 seconds. The
system-error light remains in Remind mode until one of the following situations
occur:
v All known problems are resolved
v The system is restarted
v A new problem occurs
You can use the Remind button to delay server maintenance until a later time. Also,
resetting the system-error light enables the LED to react to another error. If the LED
is still solid from the first error, it will mask additional errors.
Integrated System Management Processor LED
The xSeries 342 server has an Integrated System Management Processor feature
on the system board. The green Integrated System Management Processor LED
flashes, indicating that the system temperature, fan speeds, voltage ranges, power
supplies, power backplane, and DASD backplane are being monitored. If an error
occurs in any of these areas, the Integrated System Management Processor turns
on the respective error LED on the Light Path Diagnostics panel. If the Integrated
System Management Processor LED remains on or off, or if it blinks significantly
faster than approximately once per second, then an error has occurred. See ″SP
LED″ at “Information panel system error LED” on page 85.
Before you begin
Before you begin to install options in the server, read the following information:
v Become familiar with the safety and handling guidelines specified under “Working
v You do not need to turn off the server to install or replace hot-swap power
v The orange color on components and labels in the server identifies hot-swap or
v The blue color on components and labels identifies touch points where a
v Make sure that you have an adequate number of properly grounded electrical
v Back up all important data before you make changes to disk drives.
v Have a small, flat-blade screwdriver available.
v For a list of supported options for the server, refer to
inside a server with power on” on page 41, “Handling static-sensitive devices” on
page 41, and “Safety information” on page 109. These guidelines will help you
work safely while working with the server or options.
supplies, hot-swap drives, hot-swap fans, or hot-plug PCI adapters.
hot-plug components. This means that you can install or remove the component
while the system is running, provided that your system is configured to support
this function. For complete details about installing or removing a hot-swap or
hot-plug component, see the information provided in this chapter.
component can be gripped, a latch moved, and so on.
outlets for the server, monitor, and any other options that you intend to install.
http://www.ibm.com/pc/us/compat on the World Wide Web.
40 Hardware Maintenance Manual: xSeries 342 Type 8669
Page 51

System reliability considerations
To help ensure proper cooling and system reliability, make sure:
v Each of the drive bays has either a drive or a filler panel installed.
v Each of the power supply bays has either a power supply or a filler panel
installed.
v The cover is in place during normal operation.
v There is at least 50 mm (2 inches) of ventilated space at the sides of the server
and 100 mm (4 inches) at the rear of the server.
v The cover is removed for no longer than 30 minutes while the server is
operating.
v The processor housing cover (if available on the server) that protects the
processor and memory area is removed for no longer that ten minutes while the
server is operating.
v A removed hot-swap drive is replaced within two minutes of removal.
v Cables for optional adapters are routed according to the instructions provided
with the adapters (ensure that cables are not restricting air flow).
v The fans are operating correctly and the air flow is good.
v A failed fan is replaced within 48 hours.
In addition, ensure that the environmental specifications for the system are met.
See “Features and specifications” on page 3.
For information on temperature error messages, see “Temperature error messages”
on page 99.
Working inside a server with power on
The server supports hot-plug, hot-add, and hot-swap devices and it is designed to
operate safely while turned on with the cover removed. Follow these guidelines
when you work inside a server that is turned on:
v Avoid loose-fitting clothing on your forearms. Button long-sleeved shirts before
working inside the server; do not wear cuff links while you are working inside the
server.
v Do not allow your necktie to hang inside the server.
v Remove jewelry, such as bracelets, necklaces, and loose-fitting wrist watches.
v Remove items from your shirt pocket (such as pens or pencils) that could fall into
the server as you lean over it.
v Take care to avoid dropping any metallic objects, such as paper clips, hair pins,
or screws, into the server.
Handling static-sensitive devices
Static electricity, though harmless to you, can seriously damage server components
or options.
Note: When you are adding an internal option, do not open the static-protective
package containing the option until you are instructed to do so.
When you handle options and other server components, take these precautions to
avoid damage from static electricity:
v Limit your movement. Movement can cause static electricity to build up around
you.
Installing options 41
Page 52

v Always handle components carefully. Handle adapters, the memory board, and
memory modules (DIMMs) by the edges. Never touch any exposed circuitry.
v Prevent others from touching components.
v When you are installing a new option, touch the static-protective package
containing the option to a metal expansion-slot screw or other unpainted metal
surface on the server for at least two seconds. (This reduces static electricity
from the package and from your body.)
v When possible, remove the option and install it directly into the server without
setting the option down. When this is not possible, place the static-protective
package that the option comes in on a smooth, level surface and place the
option on it.
v Do not place the option on the server’s covers or any metal surface.
Locations
The following sections describe how to remove and/or install certain components
inside the server.
Removing the cover and bezel
The following section describes how to remove the cover and bezel.
Cover-release latch
Side latch
Bezel
Side latch
To remove the server top cover:
1. Review the information in “Before you begin” on page 40.
2. If you are planning to install or remove any part other than a hot-swap hard disk
drive, hot-swap power supply, or hot-swap fan, turn off the server and all
attached devices and disconnect all external cables and power cords.
Statement 1:
42 Hardware Maintenance Manual: xSeries 342 Type 8669
Page 53

DANGER
Electrical current from power, telephone, and communication cables is hazardous. To
avoid a shock hazard:
v Do not connect or disconnect any cables or perform installation, maintenance, or
reconfiguration of this product during an electrical storm.
v Connect all power cords to a properly wired and grounded electrical outlet.
v Connect to properly wired outlets any equipment that will be attached to this
product.
v When possible, use one hand only to connect or disconnect signal cables.
v Never turn on any equipment when there is evidence of fire, water, or structural
damage.
v Disconnect the attached power cords, telecommunications systems, networks, and
modems before you open the device covers, unless instructed otherwise in the
installation and configuration procedures.
v Connect and disconnect cables as described in the following table when installing,
moving, or opening covers on this product or attached devices.
To connect:
a. Turn everything OFF.
b. First, attach all cables to devices.
c. Attach signal cables to connectors.
d. Attach power cords to outlet.
e. Turn device ON.
To disconnect:
a. Turn everything OFF.
b. First, remove power cords from outlet.
c. Remove signal cables from connectors.
d. Remove all cables from devices.
Statement 5:
CAUTION:
The power-control button on the device and the power switch on the
power supply do not turn off the electrical current supplied to the device.
The device also might have more than one power cord. To remove all
electrical current from the device, ensure that all power cords are
disconnected from the power source.
2
1
3. Release the left and right side latches and pull the server out of the rack
enclosure until both slide rails lock.
Note: When the server is in the locked position, you can reach the cables on
4. Lift the cover-release latch. Lift the cover off the server and set the cover aside.
the back of the server.
Installing options 43
Page 54

Adapters
Attention: For proper cooling and airflow, replace the cover before turning on
the server. Operating the server for extended periods of time (over
30 minutes) with the cover removed might damage server
components.
To remove the bezel:
1. Press in on the top sides of the bezel and pull the bezel away from the server
front.
2. Store the bezel in a safe place.
You can install up to five peripheral component interconnect (PCI) adapters in the
expansion connectors on the system board.
The server comes with a video controller. This video controller is an integrated
component on the system board. It is not removable. If you want to disable this
controller and use a video adapter instead, you can install a video adapter in an
expansion slot. When you install a video adapter, the server BIOS automatically
disables the integrated video controller.
The following illustration shows the location of the PCI expansion slots on the
system board.
System-management
connector (J54)
PCI Slot 1
32-bit
33 MHz (J44)
PCI Slot 2
64-bit
33 MHz (J41)
PCI Slot 3
64-bit
33 MHZ (J42)
PCI Slot 4
64-bit
66 MHz (J29)
PCI Slot 5
64-bit
66 MHz (J30)
Adapter considerations
Before you continue with the adapter-installation procedure:
v Review the documentation that comes with the adapter and follow those
instructions in addition to the instructions given in this section. If you need to
change the switch or jumper settings on your adapter, follow the instructions that
come with the adapter.
v You can install full-length adapters in all expansion slots.
v You can install a 32-bit adapter in any of the PCI slots.
v The server supports 5.0 V signalling and universal PCI adapters in slots 1, 2, and
3; it supports 3.3 V signalling or PCI adapters in slots 4 and 5.
44 Hardware Maintenance Manual: xSeries 342 Type 8669
Page 55

v The server uses a rotational interrupt technique to configure PCI adapters.
Because of this technique, you can install a variety of PCI adapters that currently
do not support sharing of PCI interrupts.
v PCI slot 1 is on PCI bus A, PCI slots 2 and 3 are on PCI bus B, and PCI slots 4
and 5 are on PCI bus C. The system scans PCI slot 1, the system board
Ethernet, PCI slots 2-5, the system board SCSI, channel A, and the system
board SCSI channel B, if you have not changed the boot precedence from the
default.
You can use the Configuration/Setup Utility program to change the boot
precedence for the server. Select Start Options from the Configuration/Setup
Utility program.
Note: The Remote Supervisor Adapter must be installed in PCI slot 1.
Adapter installation
Adapter
Expansion-slot cover
Installing options 45
Page 56

The following illustration shows the rerouting of the SCSI cable if you install a
ServerRAID adapter.
SCSI
connector A (J24)
To install an adapter:
1. Review the information in “Before you begin” on page 40.
2. Turn off the server and peripheral devices and disconnect all external cables
and power cords; then, remove the cover (see “Removing the cover and bezel”
on page 42).
3. Determine which expansion slot you will use for the adapter.
Attention: Check the instructions that come with the adapter for any
requirements or restrictions.
4. Remove the expansion-slot cover:
a. Loosen and remove the screw on the top of the expansion-slot cover.
b. Slide the expansion-slot cover out of the server. Store it in a safe place for
future use.
Attention: Expansion-slot covers must be installed on the openings for
all vacant slots. This maintains the electromagnetic emissions
characteristics of the system and ensures proper cooling of system
components.
5. Refer to the documentation that comes with your adapter for any cabling
instructions. It might be easier for you to route any cables before you install
the adapter.
6. Remove the adapter from the static-protective package.
Attention: Avoid touching the components and gold-edge connectors on the
7. Place the adapter, component-side up, on a flat, static-protective surface.
8. Set any jumpers or switches as described by the adapter manufacturer.
9. Install the adapter:
a. Carefully grasp the adapter by its top edge or upper corners, and align it
with the expansion slot on the system board.
b. Press the adapter firmly into the expansion slot.
46 Hardware Maintenance Manual: xSeries 342 Type 8669
adapter.
Page 57

Internal drives
Attention: When you install an adapter in the server, be sure that it is
completely and correctly seated in the system-board connector
before you apply power. Incomplete insertion might cause
damage to the system board or the adapter.
c. Insert and tighten the expansion-slot screw on the top of the adapter
bracket.
10. Connect any needed cables to the adapter.
v If you are installing a ServeRAID adapter, disconnect the cable from SCSI
connector A (J24) on the system board and plug it into the connector on the
top of the ServeRAID adapter.
v If you are installing an adapter that is not a ServeRAID adapter, refer to the
documentation that came with your adapter for cabling instructions.
Attention: Route cables so that the flow of air from the fans is not blocked.
11. If you have other options to install or remove, do so now; otherwise, go to
“Installing the server cover and bezel” on page 64.
If you add different types of drives, your system can read multiple types of media
and store more data. Several types of drives are available, such as:
v Diskette
v Hard disk
v CD-ROM
v Tape
The server contains hardware that lets you replace a failed hard disk drive without
turning off the server. Therefore, you have the advantage of continuing to operate
your system while a hard disk drive is removed or installed. These drives are known
as hot-swappable or hot-swap drives.
Each hot-swap drive bay has two indicator lights (see “Controls and indicators” on
page 7). If the amber hard-disk status light is lit continuously, that individual drive is
faulty and needs to be replaced. When the hard-disk status light indicates a drive
fault, you can replace that hot-swap drive without turning off the server.
Each hot-swap drive that you plan to install must have a hot-swap-drive tray
attached. The drive must have a single connector attachment (SCA) connector.
Hot-swap-drive trays come with the hot-swap drives.
Internal drive bays
Internal drives are installed in bays. The server comes with a preinstalled diskette
drive and a preinstalled CD-ROM drive.
CD-ROM drive
Diskette drive
Empty 5.25-inch bays Hot-swap bay
Hot-swap bay
(SCSI ID 0)
(SCSI ID 1)
Hot-swap bay
(SCSI ID 2)
Installing options 47
Page 58

v The server comes with one 3.5-inch, 1.44 MB diskette drive and one 48x IDE
CD-ROM drive.
v The empty bays below the diskette drive come without a device installed. You
can use these bays for 5.25-inch, half-high, removable-media drives, such as
tape backup drives. You also can combine these bays into a single, full-high bay
and install a digital linear tape (DLT) drive; or, you can install an xSeries Media
Bay Ultra 160 Hot Swap Conversion Kit option, which converts these bays to
three hot-swap drive bays.
v The xSeries 342 server supports only one diskette drive.
v If you are installing a device with a 50-pin connector in either of the 5.25-inch
bays, you need a 68-pin to 50-pin converter (option number 32G3925).
v The server supports three slim-high (1-inch) hot-swap hard disk drives in the
hot-swap bays. If the server has the xSeries Media Bay Ultra 160 Hot Swap
Conversion Kit option installed, it supports three additional hot-swap hard disk
drives.
v The hot-swap bays connect to a SCSI backplane. This backplane is a printed
circuit board behind the bay.
Note: The server EMI integrity and cooling are both protected by having the
5.25-inch bays covered or occupied. When you install a drive, save the filler
panel from the bay, in case you later remove the drive and do not replace it
with another.
SCSI drives
Some drives have a special design called small computer system interface,or
SCSI. This design allows you to attach multiple drives to a single SCSI channel.
Notes:
1. Any information about SCSI drives also applies to other SCSI devices, such as
tape drives.
2. If you plan to install both internal and external SCSI devices, you must follow
the instructions in “Connecting external options” on page 65, in addition to the
instructions in this section.
A 16-bit (wide) SCSI cable connects the SCSI hard-disk drive backplane to an
integrated SCSI controller on the system board. An additional 16-bit 1-drop SCSI
cable is shipped inside the server. It is folded and restrained with a cable clamp on
the bottom of the server chassis near the empty bays. You can use this cable to
connect an optional SCSI device installed in one of the empty 5.25-inch bays to the
SCSI channel A connector on the system board.
SCSI IDs
Each SCSI device that is connected to an individual channel of a SCSI controller
needs a unique identification (ID) so that the controller can identify the devices and
ensure that different devices do not attempt to transfer data at the same time. If you
need to set IDs for SCSI devices, refer to the instructions that come with those
devices.
The server automatically sets SCSI IDs for hot-swap hard disk drives.
The SCSI ID assigned to each hot-swap bay is shown on the server beside the bay.
The server uses the hard disk drive SCSI IDs to send status information to the
indicator lights above each hot-swap bay.
48 Hardware Maintenance Manual: xSeries 342 Type 8669
Page 59

The processing sequence for SCSI devices is set through the SCSISelect Utility
program. The default sequence proceeds from the lowest SCSI ID to the highest (0
to 15). The SCSI controller uses ID 7.
Ensure that the device you are installing is not terminated. It is not necessary to set
termination jumpers on internal SCSI devices. The server hardware provides
termination for all internal SCSI devices.
Hot-swap drive installation
The hot-swap drive bays support hot-swap drives only.
This section gives the procedure for installing a hot-swap hard disk drive. If you
want to remove a drive, reverse the following steps.
Notes:
1. To minimize the possibility of damage to the hard disk drives, install the server
in the rack before installing the hard disk drives.
2. You do not have to turn off the server to install hot-swap drives. However, you
must turn off the server when performing any steps that involve installing or
removing cables.
Drive-tray assembly
Drive handle
Filler panel
To install a drive in a hot-swap drive bay:
1. Review the information in “Before you begin” on page 40.
Attention: To maintain proper system cooling, do not operate the server for
more than two minutes without either a drive or a filler panel
installed for each bay.
2. Remove the filler panel from one of the empty hot-swap bays by inserting your
finger into the depression on the filler panel and pulling it away from the server.
3. Install the hard disk drive in the hot-swap bay:
a. Ensure the tray handle is open (that is, perpendicular to the drive).
b. Align the drive/tray assembly with the guide rails in the bay.
c. Gently push the drive/tray assembly into the bay until the drive connects to
the backplane.
d. Push the tray handle down until it locks.
Installing options 49
Page 60

4. Check the hard disk drive status indicators to verify that the hard disk drive is
operating properly.
Non-hot-swap drive installation
Before you install drives in the server, verify that you have all the cables and any
other equipment specified in the documentation that comes with the internal drive.
You might also need to perform certain preinstallation activities. Some of the steps
are required only during the initial installation of an option.
Slide rail
Slide rails
Drive
Slide rail
Side latches
Filler panel
To install a non-hot-swap drive:
1. Review the information in“Before you begin” on page 40.
2. Turn off the server and peripheral devices and then remove the cover and
bezel. (See “Removing the cover and bezel” on page 42.)
3. Remove the filler panel from the bay opening by pushing in the side latches
and pulling the filler panel away from the server. You do not need the filler
panel when you have a drive installed in the bay.
Note: The electromagnetic interference (EMI) integrity and cooling are
protected by having the non-hot-swap bays covered or occupied. When
you install a drive, save the filler panel from the bay, in case you later
remove the drive and do not replace it with another.
4. Touch the static-protective bag containing the drive to any unpainted metal
surface on the server; then, remove the drive from the bag and place it on a
static-protective surface.
5. Set any jumpers or switches on the drive according to the documentation that
comes with the drive.
6. Install rails on the drive.
v If you are installing a standard-size drive:
a. Pull the blue slide rails off the back of the filler panel.
b. Clip the rails onto the sides of the drive.
v If you are installing a digital linear tape (DLT) backup drive, use the metal
slide rails and screws that are shipped in the box that contains the server
documentation.
7. Place the drive so that the slide rails engage in the bay guide rails. Push the
drive into the bay until it clicks into place.
50 Hardware Maintenance Manual: xSeries 342 Type 8669
Page 61

8. If you are installing a SCSI device, continue with the next step. If you are
installing an IDE device, go to step 11.
9. To install a SCSI device:
a. Attach the connector on the 1-drop SCSI cable for the non-hot-swap drive
bays to the back of the drive. The cable is shipped restrained in a cable
clamp on the bottom of the server chassis near the bays. Connect the
other end of the cable to SCSI channel A on the system board, if it is not
already attached. See “System board internal cable connectors” on
page 35 for the location of the SCSI channel A connector.
Note: If you want to install more than one optional SCSI 5.25-inch device,
install an optional SCSI adapter to control the device.
b. Connect a power cable to the back of the drive. Power cables for
non-hot-swap drives come installed in the server. The connectors are
keyed and can be inserted only one way.
c. Continue with step 11
10. To install an IDE device, such as a CD-ROM drive or a DVD-ROM drive, use
the two-drop IDE cable that comes with the option:
a. Remove the cable connecting the CD-ROM drive to the IDE connector on
the system board.
b. Using the two-drop cable that came with your IDE option, connect the
CD-ROM drive and the IDE device to the IDE connector on the system
board.
c. Set the jumper on the back of the new IDE device to slave.
11. If you have other options to install or remove, do so now; otherwise, go to
“Installing the server cover and bezel” on page 64.
Memory modules
Adding memory to the server is an easy way to make programs run faster. You can
increase the amount of memory in the server by installing options called
memory-module kits. Each kit contains one industry-standard, dual inline memory
module (DIMM). The server uses a two-way interleaved memory configuration. You
must install matched pairs of memory kits, but the set in slots 1 and 4 do not need
to be the same size as the set in slots 2 and 3.
Notes:
1. The server comes with two dual inline memory modules (DIMMs) installed in
2. Your xSeries 342 server supports 128 MB, 256 MB, 512 MB, and 1 GB DIMMs.
3. Installing or removing DIMMs changes the configuration information in the
DIMM slots 1 and 4. Install additional DIMMs as a matched pair in DIMM
connectors 2 and 3 and as instructed in the documentation that comes with your
option.
You must install the DIMMs in pairs of the same size. Place pair 1 in slots 1 and
4 and pair 2 in slots 2 and 3. Refer to the ServerProven
™
list on the World Wide
Web at http://www.ibm.com/pc/compat for information about memory modules
for use with the server.
server. Therefore, after installing or removing a DIMM, you must save the new
configuration information in the Configuration/Setup Utility program. When you
restart the server, the system displays a message indicating that the memory
configuration has changed. Start the Configuration/Setup Utility program and
select Save Settings.
Installing options 51
Page 62

DIMM 1
DIMM 2
DIMM connector 4 (J4)
DIMM connector 3 (J3)
DIMM connector 2 (J2)
DIMM connector 1 (J1)
To install a DIMM:
1. Review the information in “Before you begin” on page 40, “Safety information”
on page 109, and “Handling static-sensitive devices” on page 41. Also review
the documentation that comes with your option.
2. Turn off the server and peripheral devices and disconnect all external cables
and power cords.
3. Remove the cover. (See “Removing the cover and bezel” on page 42.)
4. Touch the static-protective package containing the DIMM to any unpainted metal
surface on the server. Then, remove the DIMM from the package. You must
install memory in matched pairs: the first pair must be in slots 1 and 4 and the
second pair must be in slots 2 and 3.
Attention: To avoid breaking the retaining clips or damaging the DIMM
connectors, handle the clips gently.
5. Install the DIMM:
52 Hardware Maintenance Manual: xSeries 342 Type 8669
Page 63

a. Turn the DIMM so that the pins align correctly with the connector.
DIMM
(second pair)
b. Insert the DIMM into the connector by pressing on one edge of the DIMM
and then the other edge of the DIMM. Be sure to press straight into the
connector. Be sure that the retaining clips snap into the closed position.
c. Make sure the retaining clips are in the closed position. If a gap exists
between the DIMM and the retaining clips, the DIMM has not been properly
installed. In this case, open the retaining clips and remove the DIMM; then,
reinsert the DIMM.
d. Repeat steps 5a through 5c for the second DIMM; then continue with step 6.
6. If you have other options to install or remove, do so now; otherwise, go to
“Installing the server cover and bezel” on page 64.
Microprocessor installation
The server comes with one microprocessor installed on the system board. If you
install an additional microprocessor, the server can operate as a symmetric
multiprocessing (SMP) server. With SMP, certain operating systems and application
programs can distribute the processing load between the microprocessors.
Notes:
1. Before you install a new microprocessor, review the documentation that comes
with the microprocessor, so that you can determine whether you need to update
the server basic input/output system (BIOS). The latest level of BIOS for the
server is available through the World Wide Web.
2. Obtain an SMP-capable operating system (optional). For a list of supported
operating systems, see http://www.ibm.com/pc/us/compat/ on the World Wide
Web.
Installing options 53
Page 64

3. If two microprocessors are installed, the microprocessor installed in connector
U69 is the startup processor, and the microprocessor installed in U68 is the
application processor.
Attention: To avoid damage and ensure proper server operation when you install a
new or an additional microprocessor, use microprocessors that have the
same cache size and type, and the same clock speed. Microprocessor
internal and external clock frequencies must be identical.
Microprocessor installation in Models 1RX, 2RX, 4RX, 1TG, 2TG,
4TG
To install an additional microprocessor in Models 1RX, 2RX, 4RX, 1TG, 2TG, 4TG:
1. Review the information in “Before you begin” on page 40.
2. Turn off the server and peripheral devices and disconnect all external cables
and power cords; then remove the cover (see “Removing the cover and bezel”
on page 42).
3. Remove the fan 3 assembly by lifting the orange handle on top of the fan
assembly and pulling the fan assembly away from the server.
Fan 3
Air baffle
4. Remove the air baffle by grasping it at the sides and lifting it from the server.
54 Hardware Maintenance Manual: xSeries 342 Type 8669
Page 65

5. Remove the terminator card from the microprocessor connector by lifting the
release arm on the carrier. Leave the arm in its open position.
Terminator card
VRM 2
VRM connector
Fan sink
(Remove thermal tape liner on installation)
Microprocessor 2
Microprocessor 1 location
VRM 1
6. Store the terminator card in a safe place in the static-protective package that
your new microprocessor is shipped in; you will need to install it again, if you
ever remove the microprocessor.
7. Install the microprocessor:
a. Touch the static-protective package containing the new microprocessor to
any unpainted metal surface on the server; then, remove the
microprocessor from the package.
b. Line up the microprocessor over the microprocessor connector and
carefully press the microprocessor into the connector. Make sure that the
corner with the gold arrow is lined up with pin C1 on the planar.
c. Press down and latch the release arm.
Note: To remove a microprocessor, pull upward on the microprocessor release
8. Install the voltage regulator module (VRM) included in the microprocessor kit.
Attention: When installing or replacing a VRM, use only a VRM specified for
a. Center the VRM over the VRM connector. Make sure that the VRM is
b. Press the VRM into the connector.
Note: If you remove the microprocessor later, remember to install the
9. Remove the thermal tape liner from the underside of the fan sink and discard.
arm and then lift the microprocessor off of the connector.
use with the xSeries 342 server. Use of other VRMs might cause
the server to overheat.
oriented and aligned correctly.
terminator card in the appropriate microprocessor connector and to
remove the VRM.
Installing options 55
Page 66

10. Set the fan sink into place.
Fan sink
(Remove thermal tape
liner on installation)
Microprocessor
release lever
Ensure correct alignment
of fan sink, mounting clip,
and mounting socket
Make sure the fan sink guide fits between the processor and the processor
socket.
Fan sink guide
11. Press down and latch the spring retention clip on the back of the fan sink (the
side facing the back of the server).
12. Press down and latch the spring retention clip on the front of the fan sink (the
side facing the front o f the server).
13. Plug the fan sink into the fan sink connector on the system board (J46). Make
sure the cable is not in a position to interfere with the fan sink operation.
14. Reinstall the air baffle. Make sure the sides of the air baffle fit inside the
brackets on the server.
15. Reinstall the fan 3 assembly and make sure that the connector engages.
16. If you have other options to install or remove, do so now; otherwise, go to
“Installing the server cover and bezel” on page 64.
Microprocessor installation in Model 5RX
To install an additional microprocessor in Model 5RX:
1. Review the information in “Before you begin” on page 40.
2. Turn off the server and peripheral devices and disconnect all external cables
and power cords; then remove the cover (see “Removing the cover and bezel”
on page 42).
56 Hardware Maintenance Manual: xSeries 342 Type 8669
Spring retention clip
Page 67

3. Remove the fan 3 assembly by lifting the handle on top of the fan assembly
and pulling the fan assembly away from the server.
Note: The illustrations in this document may differ slightly from your hardware.
Fan 3 assembly
Air-baffle assembly
4. Lift and remove the air-baffle assembly from the server.
5. Install the microprocessor.
a. Pull out and lift up the release lever; then, remove the terminator card from
the microprocessor socket. Store the terminator card in a safe place, such
as the static-protective package that your new microprocessor comes in.
Installing options 57
Page 68

Note: You will need to reinstall the terminator card if you ever remove the
microprocessor and do not replace it.
Heat sink
Terminator
card
VRM 2
(Remove thermal tape liner
on installation)
Microprocessor
orientation indicator
Microprocessor 2
VRM 1
Microprocessor
release lever
b. Touch the static-protective package containing the new microprocessor to
any unpainted metal surface on the server; then, remove the
microprocessor from the package.
c. Using the orientation indicators on the microprocessor and on the
microprocessor socket, align the microprocessor pins over the socket; then,
carefully press the microprocessor into the socket.
d. Press down and latch the release lever.
6. Install the voltage regulator module (VRM) included in the microprocessor kit.
Attention: When installing or replacing a VRM, you must use the same type
of VRM that comes shipped on your server. Use of other VRMs might cause
your server to overheat.
a. Open the retaining clips located on the ends of the VRM connector, if
necessary.
b. Center the VRM over the VRM connector. Make sure that the VRM is
oriented and aligned correctly.
c. Press the VRM into the connector. Make sure the retaining clips snap into
the closed position.
Note: If you remove the microprocessor later, install a terminator card in the
7. Install the heat sink.
Attention: You must install the same type of heat sink that comes installed in
your server.
58 Hardware Maintenance Manual: xSeries 342 Type 8669
vacant microprocessor socket and remove the appropriate VRM.
Page 69

a. Remove the thermal tape liner from the underside of the heat sink and
discard it.
Heat sink
(Remove thermal tape
liner on installation)
Heat-sink guide
Microprocessor
release lever
Tab (Rear)
Ensure correct alignment
of heat sink
Tab (Front)
b. Align and place the heat sink on the top of the microprocessor.
Note: Be sure the heat-sink guide fits between the microprocessor and the
microprocessor socket.
c. Press down and latch the spring-retention clip on the rear of the heat sink
onto the tab located on the rear of the microprocessor connector (the side
facing the rear of the server).
d. Press down and latch the spring-retention clip located at the front of the
heat sink onto the tab located on the front of the microprocessor socket
(the side facing the front of the server).
8. Reinstall the air-baffle assembly.
Attention: You must remove the air-flow guides from the air-baffle assembly
when you install an additional microprocessor on the system board. Otherwise,
the air-flow guides must remain in place to ensure proper air flow.
Air-flow guide 1
Installing options 59
Page 70

a. Remove the air-flow guide 1 (external) from the air-baffle assembly by
rotating the guide in a back and forth motion.
Air-flow guide 2
b. Remove the air-flow guide 2 (internal) from the air-baffle assembly by
rotating the guide in a back and forth motion.
c. Align the air-baffle guides with the slots located on the chassis; then, slide
the air-baffle assembly into place.
Note: You must use the same air-baffle assembly that comes installed in
your server to ensure proper server operation.
Attention: Once the air baffle has been modified for use with two
microprocessors, it will no longer function adequately for use with one
microprocessor only. If you remove the second microprocessor and operate
the server with only one microprocessor, you must use an air baffle
assembly that has not been modified to remove the air-flow guides.
Fan 3 assembly
Guides
Slots
Air-baffle assembly
Guides
Slots
9. Reinstall the fan 3 assembly and make sure the fan is fully seated into the
connector.
60 Hardware Maintenance Manual: xSeries 342 Type 8669
Page 71

10. If you have other options to install, do so now. Otherwise, install the server
cover (see “Installing the server cover and bezel” on page 64).
Hot-swap power supply installation
The server comes with one power supply. You can install an additional power
supply.
Note: You do not need to turn off the power to the server to install a hot-swap
power supply.
v Statement 8
CAUTION:
Never remove the cover on a power supply or any part that has the following
label attached.
Hazardous voltage, current, and energy levels are present inside any
component that has this label attached. There are no serviceable parts inside
these components. If you suspect a problem with one of these parts, contact
a service technician.
Power supply 1 power cord connector
Power supply 2 power cord connector
Installing options 61
Page 72

Power supply
Handle
AC power
LED (green)
DC power
LED (green)
Filler
panel
To install a power supply:
1. Remove the bezel. See “Removing the cover and bezel” on page 42.
2. Remove the filler panel from the empty power supply bay by inserting your
finger into the depression on the filler panel and pulling it away from the server.
Save the filler panel in case you remove the power supply at a later time.
Note: During normal operation, each power-supply bay must have either a
3. Install the power supply in the bay:
a. Place the handle on the power supply in the open position, pinch the
side-clips, and slide the power supply into the chassis.
b. Gently close the handle to seat the power supply in the bay.
4. Plug the power cord for the added power supply into the power cord connector
on the rear of the server.
5. Route the power cord through the cable-management arm.
6. Plug the power cord into a properly grounded electrical outlet.
7. Verify that the DC Power light and AC Power light on the power supply are lit,
indicating that the power supply is operating correctly.
8. Replace the bezel. See “Installing the server cover and bezel” on page 64.
62 Hardware Maintenance Manual: xSeries 342 Type 8669
power supply or filler panel installed for proper cooling.
Page 73

3-Pack Ultra 160 Hot-Swap Expansion Kit
You can install an xSeries 3-Pack Ultra160 Hot-Swap Expansion Kit in the server to
provide three additional hot-swap hard disk drives.
Filler panels
Hot-swap expansion option
To install a xSeries 3-Pack Ultra160 Hot-Swap Expansion Kit:
1. Review the information in “Before you begin” on page 40, “Safety information”
on page 109, and “Handling static-sensitive devices” on page 41.
2. Turn off the server and peripheral devices and disconnect all external cables
and power cords; then, remove the cover and bezel. (See “Removing the cover
and bezel” on page 42.)
3. Release the side latches to remove the filler panels from the bays below the
CD-ROM drive.
4. Refer to the documentation provided with the option to assemble the hot-swap
expansion option.
5. Slide the hot-swap expansion option into the bays and attach it to the server
with the screws provided in the kit.
6. Refer to the documentation provided with the option to complete the installation
of the option. (See “System board internal cable connectors” on page 35 for
locations of the cable connectors on the system board.)
7. If you have other options to install or remove, do so now; otherwise, go to
“Installing the server cover and bezel” on page 64.
Hot-swap fan assembly replacement
The server comes with three hot-swap fan assemblies. You do not need to turn off
the power to the server to replace a hot-swap fan assembly.
Installing options 63
Page 74

Attention: Replace a fan that has failed within 48 hours to help ensure proper
cooling.
Fan 2
Handle
Fan 1
Fan 3
To replace a hot-swap fan assembly:
1. Remove the cover. See “Removing the cover and bezel” on page 42.
Attention: To ensure proper system cooling, do not remove the top cover for
more than 30 minutes during this procedure.
2. The LED on the failing fan assembly will be lit. Remove the failing fan assembly
from the server by lifting the orange handle on the top of the fan assembly and
and pulling the fan assembly away from the server.
3. Slide the replacement fan assembly into the server until it clicks into place.
4. Verify that the FAN LED on the diagnostics panel on the system board is not lit.
If the FAN LED is lit, reseat the fan.
5. Replace the cover. See “Installing the server cover and bezel” below.
Installing the server cover and bezel
Side latch
To install the server cover:
1. Place the cover-release latch in the open (up) position and align the flanges on
the left and right sides of the cover with the slots on the server chassis.
Cover-release latch
Side latch
Bezel
64 Hardware Maintenance Manual: xSeries 342 Type 8669
Page 75

2. Close the cover-release latch.
To install the bezel:
1. Align the trim bezel with the front of the server.
2. Press inward on the top sides of the bezel and press the bezel toward the
server until it clicks into place.
To complete the installation:
If you disconnected any cables from the back of the server, reconnect the cables;
then, plug the power cords into properly grounded electrical outlets.
Connecting external options
If you install a SCSI adapter, you can attach a SCSI storage expansion enclosure to
the server.
Cabling requirements
To select and order the correct cables for use with external devices, contact your
IBM reseller or IBM marketing representative.
For information about the maximum length of SCSI cable between the terminated
ends of the cable, see ANSI SCSI Standards:
v X3.131-1986 (SCSI)
v X3.131-1994 (SCSI-2)
v X3T10/1071D
Adhering to these standards ensures that the server operates properly.
Setting SCSI IDs for external devices
Each SCSI device that is connected to a SCSI controller must have a unique SCSI
ID, so that the SCSI controller can identify the devices and ensure that different
devices do not attempt to transfer data at the same time. SCSI devices that are
connected to different SCSI controllers can have duplicate SCSI IDs. The SCSI
controller uses one of the SCSI IDs; the default SCSI ID for the SCSI controller is
7. Refer to the instructions that come with the SCSI devices for more information
about setting a SCSI ID.
Installation procedure
To attach an external device:
1. Turn off the server and all attached devices.
2. Follow the instructions that come with the option to prepare it for installation and
to connect it to the server.
Input/Output ports
This section provides information about the input/output (I/O) ports on the rear of
the server. These ports include the following:
v One video port
v Two integrated system management (RS-485) ports
v One management port (not supported)
v Two Universal Serial Bus (USB) ports
v One Ethernet port
Installing options 65
Page 76

v One keyboard port
v One auxiliary pointing device (mouse) port
v Two serial ports
v Dual-channel Ultra160 ports (internal connectors only)
Mouse
Serial A
Serial B
Keyboard
Ethernet
Universal Serial Bus
(USB) 1 and 2
ISM-A
ISM-B
Video
Serial C
(not supported)
Video port
The server comes with an integrated super video graphics array (SVGA) video
controller. This controller is not removable, but you can disable it by installing a PCI
video adapter.
Note: If you install a PCI video adapter, the server BIOS will automatically disable
the integrated video adapter.
The following table shows the pin-number assignments for the 15-pin analog video
connector on the rear of the server.
5
Pin Signal Pin Signal Pin Signal
1 Red 6 Ground 11 Not connected
2 Green or monochrome 7 Ground 12 DDC SDA
3 Blue 8 Ground 13 Horizontal synchronization (Hsynch)
4 Not connected 9 +5 V dc 14 Vertical synchronization (Vsynch)
5 Ground 10 Ground 15 DDC SDL
1
1115
Keyboard port
There is one keyboard on the rear of the server.
Note: If you attach a standard (non-USB) keyboard to the keyboard connector, the
USB ports and devices will be disabled during the power-on self-test
(POST).
66 Hardware Maintenance Manual: xSeries 342 Type 8669
Page 77

The following table shows the pin-number assignments for the keyboard connector
on the rear of the server.
6
4
2
Pin I/O Signal
1 I/O Data
2 N/A Reserved
3 N/A Ground
4 N/A +5 V dc
5 I/O Keyboard clock
6 N/A Reserved
5
3
1
Auxiliary-device (pointing device) port
The system board has one auxiliary-device port that supports a mouse or other
pointing device.
The following table shows the pin-number assignments for the auxiliary-device
connector on the rear of the server.
6
4
5
3
Pin Signal
1 Data
2 Not connected
3 Ground
4 +5Vdc
5 Clock
6 Not connected
Ultra 160 SCSI ports
The server has an integrated dual-channel Ultra 160 small computer system
interface (SCSI) controller. This controller supports two independent Ultra 160 SCSI
channels: one internal and one external. Each of these channels supports up to 15
SCSI devices. In addition, this controller uses:
v Double-transition clocking to achieve high transfer rates
v Domain name validation to negotiate compatible data transfer speeds with each
device
v Cyclic-redundancy checking (CRC), instead of the usual parity checking, to
significantly improve data reliability
v An active terminator on the system board for SCSI bus termination
1
2
Installing options 67
Page 78

You can use the external LVD SCSI channel connector, on the rear of the server, to
connect different types of small computer system interface (SCSI) devices. Inside
the server, a SCSI cable connects the internal SCSI channel connector to the
hot-swap drive backplane.
Note: If you install a PCI RAID adapter to configure and manage the internal
hot-swap drives, you must move the SCSI cable from the system-board
SCSI connector to an internal channel connector on the RAID adapter.
SCSI cabling requirements: If you plan to attach external SCSI devices, you
must order additional SCSI cables. To select and order the correct cables for use
with external devices, contact your IBM reseller or IBM marketing representative.
For information about the maximum length of SCSI cable between the terminated
ends of the cable, refer to the ANSI SCSI standards. Adhering to these standards
will help ensure that the server operates properly.
Setting SCSI IDs: Each SCSI device connected to a SCSI controller must have a
unique SCSI ID. This ID enables the SCSI controller to identify the device and
ensure that different devices on the same SCSI channel do not attempt to transfer
data simultaneously. SCSI devices that are connected to different SCSI channels
can have duplicate SCSI IDs.
The hot-swap-drive backplane controls the SCSI IDs for the internal hot-swap drive
bays. However, when you attach SCSI devices to the external SCSI connector, you
must set a unique ID for the device. Refer to the information that is provided with
the device for instructions to set its SCSI ID.
SCSI connector pin-number assignments: The following table shows the
pin-number assignments for the 68-pin SCSI connectors.
34
68
Pin Signal Pin Signal
1 +Data 12 35 -Data 12
2 +Data 13 36 -Data 13
3 +Data 14 37 -Data 14
4 +Data 15 38 -Data 15
5 +Data P1 39 -Data P1
6 +Data 0 40 -Data 0
7 +Data1 41 -Data 1
8 +Data 2 42 -Data 2
9 +Data 3 43 -Data 3
10 +Data 4 44 -Data 4
11 +Data 5 45 -Data 5
12 +Data 6 46 -Data 6
13 +Data 7 47 -Data 7
14 +Data P 48 -Data P
1
35
68 Hardware Maintenance Manual: xSeries 342 Type 8669
Page 79

Pin Signal Pin Signal
15 Ground 49 Ground
16 DIFFSENS 50 Ground
17 Term power 51 Term power
18 Term power 52 Term power
19 Reserved 53 Reserved
20 Ground 54 Ground
21 +Attention 55 -Attention
22 Ground 56 Ground
23 +Busy 57 -Busy
24 +Acknowledge 58 -Acknowledge
25 +Reset 59 -Reset
26 +Message 60 -Message
27 +Select 61 -Select
28 +Control/Data 62 -Control/Data
29 +Request 63 -Request
30 +Input/Output 64 -Input/Output
31 +Data 8 65 -Data 8
32 +Data 9 66 -Data9
33 +Data 10 67 -Data 10
34 +Data 11 68 -Data 11
Serial ports
The server has two standard serial ports, Serial port A and Serial port B. The
operating system can use both serial ports, Serial port A and Serial port B.
Some application programs require specific ports, and some modems function
properly only at certain communication port addresses. You might need to use the
Configuration/Setup Utility program to change communication port address
assignments to prevent or resolve address conflicts.
Viewing or changing the serial-port assignments: To view or change the
serial-port assignments:
1. Restart the server and watch the monitor screen.
2. When the message Press F1 for Configuration/Setup appears, press F1.
3. From the main menu, click Devices and I/O Ports; then, press Enter.
4. Select the serial port; then, use the arrow keys to advance through the settings
available.
5. Select Save Settings; then, select Exit Setup to exit from the
Configuration/Setup Utility main menu.
Serial-port connectors: The following table shows the pin-number assignments
for the 9-pin, male D-shell serial-port connectors on the rear of the server. These
Installing options 69
Page 80

pin-number assignments conform to the industry standard.
1
69
Pin Signal Pin Signal
1 Data carrier detect 6 Data set ready
2 Receive data 7 Request to send
3 Transmit data 8 Clear to send
4 Data terminal ready 9 Ring indicator
5 Signal ground
5
Universal Serial Bus ports
The server has two Universal Serial Bus (USB) ports, which configure automatically.
USB is an emerging serial interface standard for telephony and multimedia devices.
It uses Plug and Play technology to determine the type of device attached to the
connector.
Notes:
1. If you attach a standard (non-USB) keyboard to the keyboard connector, the
USB ports and devices will be disabled during the power-on self-test (POST).
2. If you install a USB keyboard that has a mouse port, the USB keyboard
emulates a mouse and you will not be able to disable the mouse settings in the
Configuration/Setup Utility program.
USB cables and hubs: You need a 4-pin cable to connect devices to USB 1 or
USB 2. If you plan to attach more than two USB devices, you must use a hub to
connect the devices. The hub provides multiple connectors for attaching additional
external USB devices.
USB technology provides 12 megabits-per-second (Mbps) speed with a maximum
of 127 external devices and a maximum signal distance of five meters (16 ft.) per
segment.
USB-port connectors: Each USB port has an external connector on the rear of
the server for attaching USB compatible devices.
14
The following table shows the pin-number assignments for the USB-port connectors
on the rear of the server.
Table 3. USB-port connector pin-number assignments
Pin Signal
1 VCC+5VVCC
2 -Data
3 +Data
4 Ground
70 Hardware Maintenance Manual: xSeries 342 Type 8669
Page 81

Ethernet port
The server comes with an integrated Ethernet controller. This controller provides an
interface for connecting to 10-Mbps or 100-Mbps networks and provides full-duplex
(FDX) capability, which enables simultaneous transmission and reception of data on
the Ethernet local area network (LAN).
To access the Ethernet port, connect a Category 3, 4 or 5 unshielded twisted-pair
(UTP) cable to the RJ-45 connector on the rear of the server.
Note: The 100BASE-TX Fast Ethernet standard requires that the cabling in the
network be Category 5 or higher.
Configuring the Ethernet controller: When you connect the server to the
network, the Ethernet controller automatically detects the data-transfer rate
(10 Mbps or 100 Mbps) on the network and then sets the controller to operate at
the appropriate rate. That is, the Ethernet controller will adjust to the network data
rate, whether the data rate is standard Ethernet (10BASE-T), Fast Ethernet
(100BASE-TX), half duplex (HDX), or full duplex (FDX). The controller supports
half-duplex (HDX) and full-duplex (FDX) modes at both speeds.
The Ethernet controller is a PCI Plug and Play device. You do not need to set any
jumpers or configure the controller for your operating system before you use the
Ethernet controller. However, you must install a device driver to enable your
operating system to address the Ethernet controller. The device drivers are provided
on the ServerGuide CDs.
Failover for redundant Ethernet: The IBM Netfinity 10/100 Fault Tolerant Adapter
is an optional redundant network interface card (NIC adapter) that you can install in
the server. If you install this NIC adapter and connect it to the same logical segment
as the primary Ethernet controller, you can configure the server to support a failover
function. You can configure either the integrated Ethernet controller or the NIC
adapter as the primary Ethernet controller. In failover mode, if the primary Ethernet
controller detects a link failure, all Ethernet traffic associated with it is switched to
the redundant (secondary) controller. This switching occurs without any user
intervention. When the primary link is restored to an operational state, the Ethernet
traffic switches back to the primary Ethernet controller. The switch back to the
primary Ethernet controller can be automatic or manually controlled, depending on
the setup and operating system.
Note that only one controller in the redundant pair is active at any given time. For
example, if the primary Ethernet controller is active, then the secondary Ethernet
controller cannot be used for any other network operation.
Note: Your operating system determines the maximum number of IBM Netfinity
10/100 Fault Tolerant Adapters that you can install in the server. See the
documentation that comes with the adapter for more information.
Considerations when combining failover and hot-plug functions: If your operating
system supports hot-plug PCI adapters and the optional redundant NIC adapter is
installed in a hot-plug PCI slot (this system does not have a hot-plug PCI), you can
replace the NIC adapter without powering off the server — even if it is the primary
Ethernet controller. Disconnecting the Ethernet cable from the primary Ethernet
controller will cause the Ethernet traffic to switch automatically to the secondary
Ethernet controller. This can be very useful if a faulty adapter causes a network
problem, or if you want to upgrade the primary adapter hardware.
Installing options 71
Page 82

Note: If you hot-replace the primary adapter while the Ethernet traffic is being
handled by the secondary Ethernet controller, the traffic does not
automatically switch back to the primary adapter when the primary adapter
comes back online. See “Configuring for failover”.
Configuring for failover: The failover feature currently is supported by Windows NT
Server and Novell IntraNetWare. The setup required for each operating system
follows.
Windows NT Server:
IBM offers hot-plug support for Windows NT Server Version 4.0. Failover can work
in conjunction with hot-plug support or independently. If you are not using hot-plug
support, go to “Windows NT Server failover setup” on page 73.
Windows NT Server hot-plug setup:
IBM Netfinity Hot Plug PCI for Windows NT Server 4.0 package is available for
download from the IBM Web site at:
http://www.ibm.com/pc/support
Enter the brand type of Server, click on Downloadable files and look for Hot Plug.
The IBM Netfinity Hot Plug PCI for Windows NT Server 4.0 package uses the Intel
Desktop Management Interface (DMI) to control hot-plug support for the Ethernet
controllers. The Ethernet controller in your computer is DMI compliant. Download
and install the following software in the order listed:
1. IBM Failover DMI Agent
2. IBM PCI Hot Plug Solution
3. IBM Netfinity 10/100 Fault Tolerant Adapter device drivers
Note: The order of installation is important. You must install the IBM Netfinity Hot
Plug for Windows NT.
Note: The order of installation is important. You must install the IBM Netfinity Hot
Plug for Windows NT Server 4.0 package before you install the IBM Netfinity
10/100 Fault Tolerant Adapter driver. If you install the adapter device driver
before the PCI Hot Plug Solution package, the adapter device driver will not
recognize the hot-plug code. This happens because the adapter device
driver only checks the NT registry for the Hot Plug package during
installation. If the PCI Hot Plug Solution package is added after the adapter
device driver is installed, the adapter must be removed and added again in
order for it to detect the PCI Hot-Plug Solution code.
To install the IBM Failover DMI Agent:
1. Download the DMI EXE file from the xSeries Support web page and extract the
files onto a diskette.
2. Insert the diskette into the diskette drive.
3. From the Start menu, select the Run option.
4. Type A:\SETUP.EXE in the Open box.
5. Click Ok. The setup wizard opens.
6. Follow the instructions that are given by the setup wizard until the program is
installed.
7. Restart the server.
72 Hardware Maintenance Manual: xSeries 342 Type 8669
Page 83

To install the IBM PCI Hot Plug Solution package:
1. Download the IBM PCI Hot Plug Services EXE file from the xSeries Support
web page and extract the files onto a diskette.
2. Log on to Windows NT Server as a user in the Administrator group.
3. Insert the diskette into the diskette drive.
4. From the Start menu, select the Run option.
5. Type A:\SETUP.EXE in the Open box.
6. Click OK. The Setup wizard opens.
7. Follow the instructions given by the setup wizard until the program is installed.
Windows NT Server failover setup:
To install the IBM Netfinity 10/100 Fault Tolerant Adapter device drivers:
1. Add the redundant NIC adapter according to the instructions that are provided
with the adapter.
2. Use the ServerGuide CDs to install the AMD PCNet Ethernet Family adapter
device driver.
3. Do not select the Grouping box at this point; you must first restart the machine.
4. From the Windows NT Server desktop, select Control Panel, then select the
Network icon, then select the Adapters tab.
5. Highlight one of the adapters that will be in the redundant pair and then click the
Properties... button.
6. Check the Grouping box. This will show the possible combinations for redundant
pairs.
7. Select the adapter pair you want and then select OK. Note that the integrated
Ethernet controller is located at PCI bus A, slot 2.
Two options are available for recovering from a failover condition. The options
are determined by the Enable for DMI / Hot Swap Support checkbox. If the IBM
Netfinity Hot Plug PCI for Windows NT Server 4.0 package is installed, this
checkbox will appear at the bottom of the Adapter Properties panel. If you do
not have the IBM Netfinity Hot Plug PCI for Windows NT Server 4.0 package
installed on the server, you will not see the Enable for DMI / Hot Swap Support
checkbox.
If the Enable for DMI / Hot Swap Support checkbox is not checked or is not
present, traffic will automatically switch back to the primary adapter when the
primary link status is restored. In this mode, the adapter cannot be
hot-swapped. Users with the IBM Netfinity Hot Plug PCI for Windows NT Server
4.0 package installed should check the Enable for DMI / Hot Swap Support
checkbox.
If the Enable for DMI / Hot Swap Support checkbox is checked, traffic will
remain on the secondary adapter until the user directs it to return to the primary
adapter. This can be done after the hot-swap replacement of the primary
adapter or by using the DMI interface.
8. Select Close to exit from the Network setup.
When you restart the server, the failover function will be in effect.
If a failover occurs, a message is written to the NT Event Viewer log. In addition, if
the Enable for DMI / Hot Swap Support checkbox is checked, a DMI alert will also
be generated.
IntraNetWare:
Installing options 73
Page 84

1. Add the redundant NIC adapter according to the instructions that are provided
with the adapter.
2. Load the device driver by using the following command:
LOAD d:\path\PCNTNW.LAN PRIMARY=x SECONDARY=y
where d and path are the drive and path where the driver is located, and x and
y are the PCI slot numbers where the redundant pair is located.
The slot number associated with the integrated Ethernet controller can vary
depending on the configuration of the server. To determine the slot number, load
the driver with no parameters. The driver will display the available slot numbers.
The slot number that is greater than 10000 will be the slot number of integrated
Ethernet controller. When the slot number of the integrated Ethernet controller is
determined, reload the driver with the appropriate parameters.
3. When the driver is loaded, bind it to a protocol stack.
The failover function is now enabled. If a failover occurs:
v The operating system console generates a message.
v The custom counters for the device driver contain variables that define the state
of the failover function and the location of the redundant pair. You can use the
NetWare Monitor to view the custom counters.
Note: If the primary adapter was hot-replaced while the Ethernet traffic was being
handled by the secondary Ethernet controller, the traffic does not
automatically switch back to the primary adapter when the primary adapter
comes back online. In this case, issue the command:
LOAD d:\path\PCNTNW SCAN
where d and path are the drive and path where the driver is located. This
command causes the device driver to locate the primary adapter and switch
the Ethernet traffic to it.
Ethernet port connector: The following table shows the pin-number assignments
for the RJ-45 connector. These assignments apply to both 10BASE-T and
100BASE-TX devices.
Table 4. Ethernet RJ-45 connector pin-number assignments.
Pin Signal Pin Signal
1 Transmit data+ 5 Not connected
2 Transmit data- 6 Receive data 3 Receive data+ 7 Not connected
4 Not connected 8 Not connected
Integrated System Management Processor ports
The integrated system management (ISM) ports (ISM-A and ISM-B) use a dual
RJ-45 connector to interconnect ISM processors of several servers through an
optional Remote Supervisor Adapter.
74 Hardware Maintenance Manual: xSeries 342 Type 8669
Page 85

Note: ISM ports (ISM A and B) are used for the RS-485 interconnect network
Refer to the Remote Supervisor Adapter option documentation for detailed
information about the ASM interconnect network.
Cabling the server
The following illustration shows input/output connectors and cable routing for the
server.
Note: The illustrations in this document might differ slightly from your hardware.
Mouse
communications.
Serial A
Serial B
Keyboard
Ethernet
Universal Serial Bus
(USB) 1 and 2
ISM-A
ISM-B
Video
Serial C
(not supported)
Refer to the following illustration for the routing of cables through the
cable-management arm.
Installing options 75
Page 86

76 Hardware Maintenance Manual: xSeries 342 Type 8669
Page 87

FRU information (service only)
Field Replacement Units (FRUs) for the xSeries 342 should be replaced by qualified
service personnel only.
Note: Before performing any removals, read “Safety information” on page 109,
“Before you begin” on page 40 and “Handling static-sensitive devices” on
page 41.
LED cover
LED board
Note: Before beginning, read “Safety information” on page 109, “Before you begin”
on page 40 and “Handling static-sensitive devices” on page 41.
To remove the LED cover, do the following:
1. Turn off server and disconnect all external cables and power cords.
2. Remove the cover. See “Removing the cover and bezel” on page 42.
3. From the back of the cover, release the four tabs1 and gently pry away the
LED cover2.
Note: Before beginning, read “Safety information” on page 109, “Before you begin”
© Copyright IBM Corp. 2000, 2001 77
on page 40 and “Handling static-sensitive devices” on page 41.
Page 88

To remove the LED board:
1. Turn off server and disconnect all external cables and power cords.
2. Remove the cover. See “Removing the cover and bezel” on page 42.
3. Disconnect the LED board cable from the system board, connector (J39).
4. Remove the two screws1.
5. Carefully slide out the board2.
On/off reset board
Note: Before beginning, read “Safety information” on page 109, “Before you begin”
on page 40 and “Handling static-sensitive devices” on page 41.
To remove the on/off reset board:
1. Turn off server and disconnect all external cables and power cords.
2. Remove the cover. See “Removing the cover and bezel” on page 42.
3. Disconnect the cable from the system board, connector (J11).
4. Remove the screw1.
5. Gently pull off the board2.
Diskette/CD-ROM drive
Note: Before beginning, read “Safety information” on page 109, “Before you begin”
on page 40 and “Handling static-sensitive devices” on page 41.
To remove the diskette/CDROM drive:
78 Hardware Maintenance Manual: xSeries 342 Type 8669
Page 89

SCSI backplane
1. Turn off server and disconnect all external cables and power cords.
2. Remove the cover. See “Removing the cover and bezel” on page 42.
3. Disconnect the cable, connector (J18), from the system board.
4. Remove the screw1.
5. Carefully pull out drive2 to remove.
Note: Before beginning, read “Safety information” on page 109, “Before you begin”
on page 40 and “Handling static-sensitive devices” on page 41.
To remove the hot-swap hard disk drive backplane:
1. Turn off server and disconnect all external cables and power cords.
2. Remove the cover. See “Removing the cover and bezel” on page 42.
3. Disconnect all cables connected to the backplane.
4. Remove the screw1 from the top of the assembly.
5. Gently slide the SCSI backplane assembly2 up to remove.
Hot-swap hard disk drive backplane assembly
Note: Before beginning, read “Safety information” on page 109, “Before you begin”
on page 40 and “Handling static-sensitive devices” on page 41.
FRU information (service only) 79
Page 90

To remove the hot-swap hard disk drive backplane:
1. Turn off server and disconnect all external cables and power cords.
2. Remove the cover. See “Removing the cover and bezel” on page 42.
3. Pull out the hard drives in order to disconnect them from the backplane.
4. Remove the screw from the top of the backplane bracket1.
5. Lift the backplane from the chassis.
6. Remove the cables from the backplane2.
7. Remove the four screws3.
8. Gently lift up to remove the backplane board.
Power supply backplane
Note: Before beginning, read “Safety information” on page 109 and “Handling
static-sensitive devices” on page 41.
To remove the power supply backplane:
1. Turn off server and disconnect all external cables and power cords.
2. Remove the cover. See “Removing the cover and bezel” on page 42.
3. Remove power supplies from the backplane1.
4. Disconnect all cables from the backplane.
5. Remove the two screws3.
6. Remove the plastic retainer4.
7. Remove insulator2 and replace on new backplane.
80 Hardware Maintenance Manual: xSeries 342 Type 8669
Page 91

AC distribution box
Note: Before beginning, read “Safety information” on page 109, “Before you begin”
To remove the AC distribution box:
1. Turn off server and disconnect all external cables and power cords.
2. Remove the cover. See “Removing the cover and bezel” on page 42.
3. Remove screw1.
4. Pull the AC distribution box1 toward front of machine in order to release it
from the chassis clips3.
5. Remove the two hot-swap power supplies.
6. Pull down on the cable receptacle5 to release it from the chassis.
on page 40 and “Handling static-sensitive devices” on page 41.
System board
Note: To install the receptacle, push up into the chassis opening of slot4.Be
sure to properly replace receptacles, 1 to 1 and 2 to 2, as labeled.
FRU information (service only) 81
Page 92

Note: Before beginning, read “Safety information” on page 109, “Before you begin”
on page 40 and “Handling static-sensitive devices” on page 41.
To remove the system board:
Note: When replacing the system board, you must either update the system with
the latest firmware or restore the pre-existing firmware that the customer
provides on a diskette or CD image.
1. Turn off server and disconnect all external cables and power cords.
2. Remove the cover. See “Removing the cover and bezel” on page 42.
3. Remove the rear air flow fan.
4. Remove the air baffle.
5. Remove the system board cables.
6. Pull up on the two knobs1.
7. Pull up on the system board cage2 to remove from the chassis.
8. Remove the 9 screws3 to remove system board from system board cage.
82 Hardware Maintenance Manual: xSeries 342 Type 8669
Page 93

Symptom-to-FRU index
This index supports xSeries 342 servers. The Symptom-to-FRU lists symptoms,
errors, and the possible causes. The most likely cause is listed first. Use this
Symptom-to-FRU index to help you decide which FRUs to have available when
servicing the computer.
The POST BIOS displays POST error codes and messages on the screen.
Beep symptoms
Beep symptoms are short tones or a series of short tones separated by pauses
(intervals without sound). See the following examples.
Note: One beep after successfully completing POST indicates the system is
functioning properly.
Beeps Description
1-2-3
4 Four continuous beeps
v One beep
v A pause (or break)
v Two beeps
v A pause (or break)
v Three Beeps
Beep/Symptom FRU/Action
1-1-3 (CMOS write/read test failed)
1-1-4 (BIOS EEPROM checksum
failed)
1-2-1 (Programmable Interval Timer
failed)
1-2-2 (DMA initialization failed)
1-2-3 (DMA page register write/read
failed)
1-2-4 (RAM refresh verification
failed)
1-3-1 (1st 64K RAM test failed)
2-1-1 (Secondary DMA register
failed)
2-1-2 (Primary DMA register failed)
2-1-3 (Primary interrupt mask
register failed)
2-1-4 (Secondary interrupt mask
register failed)
1. Battery
2. System Board
1. Recover BIOS
2. System Board
1. System Board
1. System Board
1. System Board
1. DIMM
2. System Board
1. DIMM
1. System Board
1. System Board
1. System Board
1. System Board
© Copyright IBM Corp. 2000, 2001 83
Page 94

Beep/Symptom FRU/Action
2-2-2 (Keyboard controller failed)
2-2-3 (CMOS power failure and
checksum checks failed)
2-2-4 (CMOS configuration
information validation failed)
2-3-1 (Screen initialization failed)
2-3-2 (Screen memory failed)
2-3-3 (Screen retrace failed)
2-3-4 (Search for video ROM failed)
2-4-1 (Video failed; screen believed
operable)
3-1-1 (Timer tick interrupt failed)
3-1-2 (Interval timer channel 2 failed)
3-1-3 (RAM test failed above
address OFFFFH))
3-1-4 (Time-Of-Day clock failed)
3-2-1 (Serial port failed)
3-2-2 (Parallel port failed)
3-2-4 (Failure comparing CMOS
memory size against actual)
3-3-1 (Memory size mismatch
occurred; see ″Memory Settings″ on
page 25)
3-3-2 (Critical SMBUS error
occurred)
3-3-3 (No operational memory in
system)
4-4-4 (Optional system management
adapter not installed in slot 1 or not
functioning correctly)
1. System Board
2. Keyboard
1. Battery
2. System Board
1. Battery
2. System Board
1. System Board
1. System Board
1. System Board
1. System Board
1. System Board
1. System Board
1. System Board
1. DIMM
2. System Board
1. Battery
2. System Board
1. System Board
1. System Board
1. DIMM
2. Battery
1. DIMM
2. Battery
1. Disconnect the server power cord from outlet, wait 30 seconds and
retry.
2. System Board
3. DIMMs
4. DASD Backplane
5. Power Supply
6. Power Supply Backplane
7. 12C Cable
1. Install or reseat the memory modules, then do a 3 boot reset. (See
“Using the Configuration/Setup Utility program” on page 23.)
2. DIMMs
3. Memory Board
4. System Board
1. Verify that adapter is installed in slot 1.
2. Adapter
3. System Board
84 Hardware Maintenance Manual: xSeries 342 Type 8669
Page 95

Beep/Symptom FRU/Action
Two Short Beeps (Information only,
the configuration has changed)
Three Short Beeps
One Continuous Beep
Repeating Short Beeps
One Long and One Short Beep
One Long and Two Short Beeps
Two Long and Two Short Beeps
1. Run Diagnostics
2. Run Configuration/Setup
1. DIMM
2. System Board
1. Processor
2. Optional Processor (if installed)
3. System Board
1. Keyboard
2. System Board
1. Video adapter (if present)
2. System Board
1. Video adapter (if present)
2. System Board
1. Video adapter
No Beep symptoms
No Beep Symptom FRU/Action
No beep and the system
operates correctly.
No Beeps occur after
successfully completing POST
(The Power-On Status is
disabled.)
No ac power (Power supply ac
LED is off)
No beep and no video
System will not power-up
(Power supply ac LED is on)
1. Check speaker cables
2. Speaker
3. System Board
1. Run Configuration/Setup, set the Start Options Power-On Status to
enable.
2. Check speaker connection
3. System Board
1. Check the power cord.
2. Power Supply (If two are installed, swap them to determine if one is
defective.)
3. Power Backplane
4. Hot-Swap Power AC Inlet Box
1. See “Undetermined problems” on page 102
1. See“Power supply LED errors” on page 92
Information panel system error LED
The system error LED is turned on when an error is detected. If the system error
LED is on, remove the cover and check the diagnostic panel LEDs. The following is
a complete list of diagnostic panel LEDs followed by the FRU/Action for correcting
the problem. The following chart is valid only when the system error LED is on.
Note: If a diagnostic panel LED is on and the information LED panel system error
LED is off, there is probably an LED problem. Run LED diagnostics.
Symptom-to-FRU index 85
Page 96

Notes:
1. To locate the LEDs on the system board see “System board LED locations” on
page 38.
2. Check the System Error Log for additional information before replacing a FRU.
3. The DIMM error LEDs, processor error LEDs, and VRM error LEDs turn off
when the system is powered down.
Diagnostic Panel LED FRU/Action
All LEDs off (Check System Error
Log for error condition, then clear
System Error Log when the
problem is found.)
MEM LED on (The LED next to the
failing DIMM is on.)
CPU LED on (The LED next to the
failing CPU should be on.)
PCI A LED on
PCI B LED on
PCI C LED on
VRM LED on (The LED next to the
failing VRM should be on.)
DASD LED on (The LED located
next to the drive bay that the failing
drive is installed in will be turned
on. Check amber drive LED for
failing hard drive.)
SP LED
PS1 LED on
PS2 LED on
NON LED on
1. System Error Log is 75% full; clear the log.
2. PFA alert; check log for failure; clear PFA alert; remove AC power for at
least 20 seconds, reconnect, then power up system.
3. Run Information Panel diagnostics.
1. Processor/PCI Board.
2. Failing DIMM in slot J1-J4.
1. Processor 1 or 2.
2. System Board
1. PCI Card in slot 1.
2. Remove all PCI adapters from slots 1-5.
3. System Board.
1. Card in slots 2-3.
2. Remove all PCI adapters from slots 1-5.
3. System Board.
1. Card in slots 4-5.
2. Remove all PCI adapters from slots 1-5.
3. System Board.
1. Voltage regulator module indicated by the VRM LED on.
2. Processor indicated by the Processor LED.
1. Be sure the fans are operating correctly and the air flow is good.
2. If installed, reseat I2C cable between DASD backplane and DASD I2C on
planar (J9).
3. Failing drive. SCSI channel A has failed (This is the SCSI channel for the
hot-swap hard disk drives).
4. SCSI Backplane.
1. Unplug server for 30 seconds, retry
2. Reflash or update firmware for ISMP, BIOS
3. System Board
1. Check the DC Good LED on power supply 1. If off, replace power
supply 1.
2. Power Backplane.
1. Check the DC Good LED on power supply 2. If off, replace power
supply 2.
2. Power Backplane.
1. Check the PS1, PS2, and PS3 LEDs and replace any indicated power
supply.
2. Install an additional power supply or remove optional devices from the
server.
86 Hardware Maintenance Manual: xSeries 342 Type 8669
Page 97

Diagnostic Panel LED FRU/Action
OVER LED on
NMI LED on
TEMP LED on
FAN LED on
1. Install an optional additional power supply, or remove optional devices
from the server.
1. Reboot the system.
2. Check the System Error Log.
1. Ambient temperature must be within normal operating specifications.
See “Features and specifications” on page 3.
2. Ensure fans are operating correctly.
3. Examine System Error Log.
a. System over recommended temperature
1) Information LED Panel
b. DASD over recommended temperature (DASD LED also on)
1) Overheating hard drive
2) DASD Backplane
c. System over recommended temperature for CPU X (where X is CPU 1,
2) (CPU LED also on)
1) CPU X
2) System Board
d. I/O Legacy Board over recommended temperature
4. If the CPU LED on the diagnostics panel is also on, one of the
microprocessors has caused the error.
1. Check individual fan LEDs.
2. Replace respective fan.
3. Fan Cable.
4. System Board.
5. Power Backplane Board.
Diagnostic error codes
Note: In the following error codes, if XXX is 000, 195,or197 do not replace a
FRU. The description for these error codes are:
000 The test passed.
195 The Esc key was pressed to abort the test.
197 This is a warning error and may not indicate a hardware failure.
For all error codes, replace/follow the FRU/Action indicated.
Error Code/Symptom FRU/Action
001-XXX-000 (Failed core tests)
001-XXX-001 (Failed core tests)
001-250-000 (Failed System Board ECC)
001-250-001 (Failed System Board ECC)
005-XXX-000 (Failed Video test)
1. System Board
1. System Board
1. System Board
1. System Board
1. System Board
Symptom-to-FRU index 87
Page 98

Error Code/Symptom FRU/Action
011-XXX-000 (Failed COM1 Serial Port
test)
011-XXX-001 (Failed COM2 Serial Port
test)
014-XXX-000 (Failed Parallel Port test)
015-XXX-001 (USB interface not found,
board damaged)
015-XXX-015 (Failed USB external
loopback test)
015-XXX-198 (USB device connected
during USB test)
020-XXX-000 (Failed PCI Interface test)
020-XXX-001 (Failed Hot-Swap Slot 1 PCI
Latch test)
020-XXX-002 (Failed Hot-Swap Slot 2 PCI
Latch test)
020-XXX-003 (Failed Hot-Swap Slot 3 PCI
Latch test)
020-XXX-004 (Failed Hot-Swap Slot 4 PCI
Latch test)
030-XXX-000 (Failed Internal SCSI
interface test)
035-XXX-099
035-XXX-S99 (Failed RAID test on PCI slot
S, check System Error Log before replacing
a FRU)
035-XXX-SNN (Check System Error Log
before replacing a FRU, NN = SCSI ID of
failing fixed disk)
035-253-S99 (RAID adapter initialization
failure)
075-XXX-000 (Failed Power Supply test)
089-XXX-001 (Failed Microprocessor test)
1. System Board
1. System Board
1. System Board
1. System Board
1. Make sure parallel port is not disabled.
2. Re-run USB external loopback test.
3. System board
1. Remove USB devices from USB1 and USB2.
2. Re-run USB external loopback test.
3. System Board
1. System Board
1. PCI Hot-Swap Latch Assembly
2. System Board
1. PCI Hot-Swap Latch Assembly
2. System Board
1. PCI Hot-Swap Latch Assembly
2. System Board
1. PCI Hot-Swap Latch Assembly
2. System Board
1. System Board
1. No adapters were found.
2. If adapter is installed re-check connection.
1. Adapter
2. SCSI Backplane
3. Cable
1. Fixed Disk with SCSI ID NN on RAID adapter in PCI slot S.
1. ServeRAID Adapter in slot S is not configured properly. Obtain
the basic and extended configuration status and refer to the
ServeRAID Hardware Maintenance Manual for more information.
2. Cable
3. SCSI Backplane
4. Adapter
1. Power Supply
1. VRM 1 for Microprocessor 1
2. Microprocessor 1
88 Hardware Maintenance Manual: xSeries 342 Type 8669
Page 99

Error Code/Symptom FRU/Action
089-XXX-002 (Failed Optional
Microprocessor test)
166-198-000 System Management:
Aborted (Unable to communicate with ASM
adapter. It may be busy. Run the test
again.) (Communication with the ASM
adapter has failed.)
1. VRM 2 for Optional Microprocessor 2
2. Optional Microprocessor 2
1. Rerun the Diagnostic Test
2. Fix other error conditions and retry. These include other Failed
System Management tests and items logged in the optional Remote
Supervisor Adapter’s System Error Log.
3. Disconnect all server and option power cords from server, wait 30
seconds, reconnect, and retry
4. Remote Supervisor Adapter, if installed
5. System Board
166-201-001 System Management: Failed
(I2C Bus Error(s). ISMP indicates I2C
errors on bus 0. Potential FRUs: Memory
DIMMs, system board.)
1. If installed, reseat I2C cable between Remote Supervisor Adapter
(in PCI slot 1/J44) and planar (J54)
2. Reseat Memory DIMMs
3. Memory DIMMs
4. System board
166-201-002 System Management: Failed
(I2C Bus Error(s)) (ISMP indicates I2C
errors on bus 2. Potential FRUs: LED front
panel, system board.)
1. Reseat I2C cable between operator information panel and planar
(J39)
2. Operator information panel
3. System board
166-201-003 System Management: Failed
(I2C Bus Error(s)) (ISMP indicates I2C error
on bus 3. Potential FRUs: power
backplane, system board.)
166-201-004 System Management: Failed
(I2C Bus Error(s)) (ISMP indicates I2C error
on bus 4. Potential FRUs: DASD
backplane, system board.)
166-201-005 System Management: Failed
(I2C Bus Error(s) ISMP indicates I2C errors
on bus 0, 1, or 5. Potential FRUs: Memory
DIMMs, CPUs, system board.)
1. Reseat cables between Power Backplane and planar
2. Power Backplane
3. System board
1. If installed, reseat I2C cable between DASD backplane and DASD
I2C on planar (J9)
2. System board
1. Reseat Memory DIMMs
2. Reseat processors
3. Memory DIMMs
4. Processors
5. System board
166-250-000 System Management: Failed
(I2C cable is disconnected. Reconnect I2C
cable between Remote Supervisor Adapter
and System Board.)
166-260-000 System Management: Failed
(Unable to restart ASM adapter.) (Restart
ASM adapter Error. After restarting, ASM
communication was lost. Unplug and cold
boot to reset ASM adapter.)
166-342-000 System Management: Failed
(ASM adapter BIST indicate failed tests.)
1. Reseat I2C cables between Remote Supervisor Adapter (in PCI slot
1/J44) and planar (J54)
2. I2C Cable(s)
1. Disconnect all server and option power cords from server, wait 30
seconds, reconnect, and retry.
2. Reseat Remote Supervisor Adapter (in PCI slots 1/J44).
3. Remote Supervisor Adapter
1. Ensure the latest firmware levels for Remote Supervisor Adapter
and BIOS.
2. Disconnect all server and option power cords from server, wait 30
seconds, reconnect, and retry
3. Remote Supervisor Adapter
Symptom-to-FRU index 89
Page 100

Error Code/Symptom FRU/Action
166-400-000 System Management: Failed
System management hardware on system
board failed) (ISMP Self Test Result failed
tests: x where x = Flash, RAM, or ROM.)
180-XXX-000 (Diagnostics LED failure)
180-XXX-001 (Failed Front LED panel test)
180-XXX-002 (Failed Diagnostics LED
Panel test)
180-361-003 (Failed Fan LED test)
180-XXX-003 (Failed System Board LED
test)
180-XXX-005 (Failed SCSI Backplane LED
test)
201-XXX-0NN (Failed Memory test, see
″Memory Settings″ on page 25)
201-XXX-999 (Multiple DIMM failure, see
error text)
202-XXX-001 (Failed System Cache test)
202-XXX-002 (Failed System Cache test)
206-XXX-000 (Failed Diskette Drive test)
215-XXX-000 (Failed IDE CD-ROM test)
217-198-XXX (Could not establish drive
parameters)
217-XXX-000 (Failed BIOS Fixed Disk test)
Note: If RAID is configured, the fixed disk
number refers to the RAID logical array
217-XXX-001 (Failed BIOS Fixed Disk test)
Note: If RAID is configured, the fixed disk
number refers to the RAID logical array
217-XXX-002 (Failed BIOS Fixed Disk test)
Note: If RAID is configured, the fixed disk
number refers to the RAID logical array
1. Re-flash or Update firmware for ISMP
2. System board
1. Run Diagnostic LED test for the failing LED.
1. Operator Information Panel
2. Power Switch Assembly
3. System Board
1. System Board
1. Fan(s)
2. System Board
1. System Board
1. SCSI Backplane
2. SCSI Backplane Cable
3. System Board
1. DIMM Location slots 1-4 where NN = DIMM location.
Note: NN=1=DIMM 1 =2=DIMM 2 =3=DIMM 3 =4=DIMM 4
2. System Board
1. See error text for failing DIMMs
2. System Board
1. VRM 1
2. Microprocessor 1
1. VRM 2
2. Microprocessor 2
1. Cable
2. Diskette Drive
3. System Board
1. CD-ROM Drive Cables
2. CD-ROM Drive
3. System Board
1. Check cable and termination
2. SCSI Backplane
3. Fixed Disk
1. Fixed Disk 1
1. Fixed Disk 2
1. Fixed Disk 3
90 Hardware Maintenance Manual: xSeries 342 Type 8669
 Loading...