

Page 1

TM
TPC Benchmark
H Full Disclosure Report
for
IBM
IBM DB2
®
^ xSeries 346
®
Universal Database 8.2
Submitted for Review
using
May 18, 2005
®
Page 2

Second Edition - December 2005
THE INFORMATION CONTAINED IN THIS DOCUMENT IS DISTRI BUTED ON AN AS IS BASIS
WITHOUT ANY WARRANTY EITHER EXPRESSED OR IMPLIED. The use of this information or the
implementation of any of these techniques is the customer’s responsibility and depends on the customer’s
ability to evaluate and integrate them into the customer’s operational environment. While each item has
been reviewed by IBM for accuracy in a specific situation, there is no guarantee that the same or similar
results will be obtained elsewhere. Customers attempting to adapt these techniques to their own
environment do so at their own risk.
In this document, any references made to an IBM licensed program are not intended to state or imply that
only IBM’s licensed program may be used; any functionally equivalent program may be used.
This publication was produced in the United States. IBM may not offer the products, services, or features
discussed in this document in other countries, and the information is subject to change without notice.
Consult your local IBMrepresentative for information on products and services available in your area.
© Copyright International Business Machines Corporation 2004. All rights reserved.
Permission is hereby granted to reproduce this document in whole or in part, provided the copyright notice
as printed above is set forth in full text on the title page of each item reproduced.
U.S. Government Users - Documentation related to restricted rights: Use, duplication, or disclosure is
subject to restrictions set forth in GSA ADP Schedule Contract with IBM Corp.
Trademarks
IBM, the IBM ~ logo, DB2, DB2 Universal Database, and xSeries are trademarks or registered
trademarks of International Business Machines Corporation.
The following terms used in this publication are trademarks of other companies as follows: TPC
Benchmark,TPC-H, QppH QthH and QphH are trademarks of Transaction Processing Performance
Council; Intel and Xeon aretrademarks or registered trademarks of Intel Corporation; Linux is a registered
trademark of Linus Torvalds in the United States, other countries, or both. Other company, product, or
service names, which may be denoted by two asterisks (**), may be trademarks or service marks of others.
Notes
1 GHz only measures microprocessor internal clock speed, not application performance. Many factors affect
application performance.
2 When referring to hard disk capacity, one GB equals one billion bytes. Total user-accessible capacity may
be less.
©Copyright IBM Corporation TPC Benchmark H Full Disclosure Report May 2005 Page: 2
Page 3
®
IBM
®
with IBM DB2
~™ x346
®
UDB 8.2
TPC-H Revision 2.1.0
Report Date:
May 18, 2005
Total System Cost Composite Query-per-hour Metric Price/Performance
$1,761,686
54,465.9
QphH@3000GB
per QphH@3000GB
$ 32
Database Size Database Manager Operating System Availability Date
3000GB IBM DB2 UDB 8.2
SuSE Linux
Enterprise Server 9
Aug 15, 2005
Database Load Time: 2:23:35
RAID (Base Table): Y RAID (Base Tables and
System Configuration:
Load Included Backup: N Total Data Storage /
Database Size: 8.75
RAID (ALL): Y
Auxiliary Data Structures): Y
64 IBM ~ x346 servers, each server with:
Processor: 1 x 3.6GHz Intel Xeon with 2MB cache
on 1 processor, 1 core, 2 threads
Memory: Eight (8) 512MB PC-3200 ECC SDRAM RDIMMs
Cluster Interconnect: One Voltaire HCA400 Dual-Port InfiniBand Host Channel Adapter
Disk Controllers: One ServeRAID-7k Ultra320 SCSI controller
Disk Drives:
Total Disk Storage:
Six (6) 73.4GB 15K Ultra320 SCSI disk drives
26,249 GB
Page 4
y
IBM® ~™ x346
®
with IBM DB2
®
UDB 8.2
TPC-H Revision 2.1.0
Report Date:
18, 2005
Ma
Page 5
IBM®~™ x346
®
with IBM DB2
Measurement Results:
Database Scale Factor 3000
Total Data Storage/Database Size 8.75
Start of Database Load 15:05:38
End of Database Load 17:29:13
Database Load Time 2:23:35
Query Streams for Throughput Test 8
TPC-H Power 90,854.7
TPC-H Throughput 32,651.4
TPC-H Composite Query-per-Hour (QphH@3000GB) 54,465.9
Total System Price over 3 Years $1,761,686
TPC-H Price/Performance Metric ($/QphH@3000GB) $32
Measurement Interval:
Measurement Interval in Throughput Test (Ts) = 58215 seconds
Duration of Stream Execution:
®
UDB 8.2
TPC-H Revision 2.1.0
Report Date: May 18, 2005
Page 6
y
®
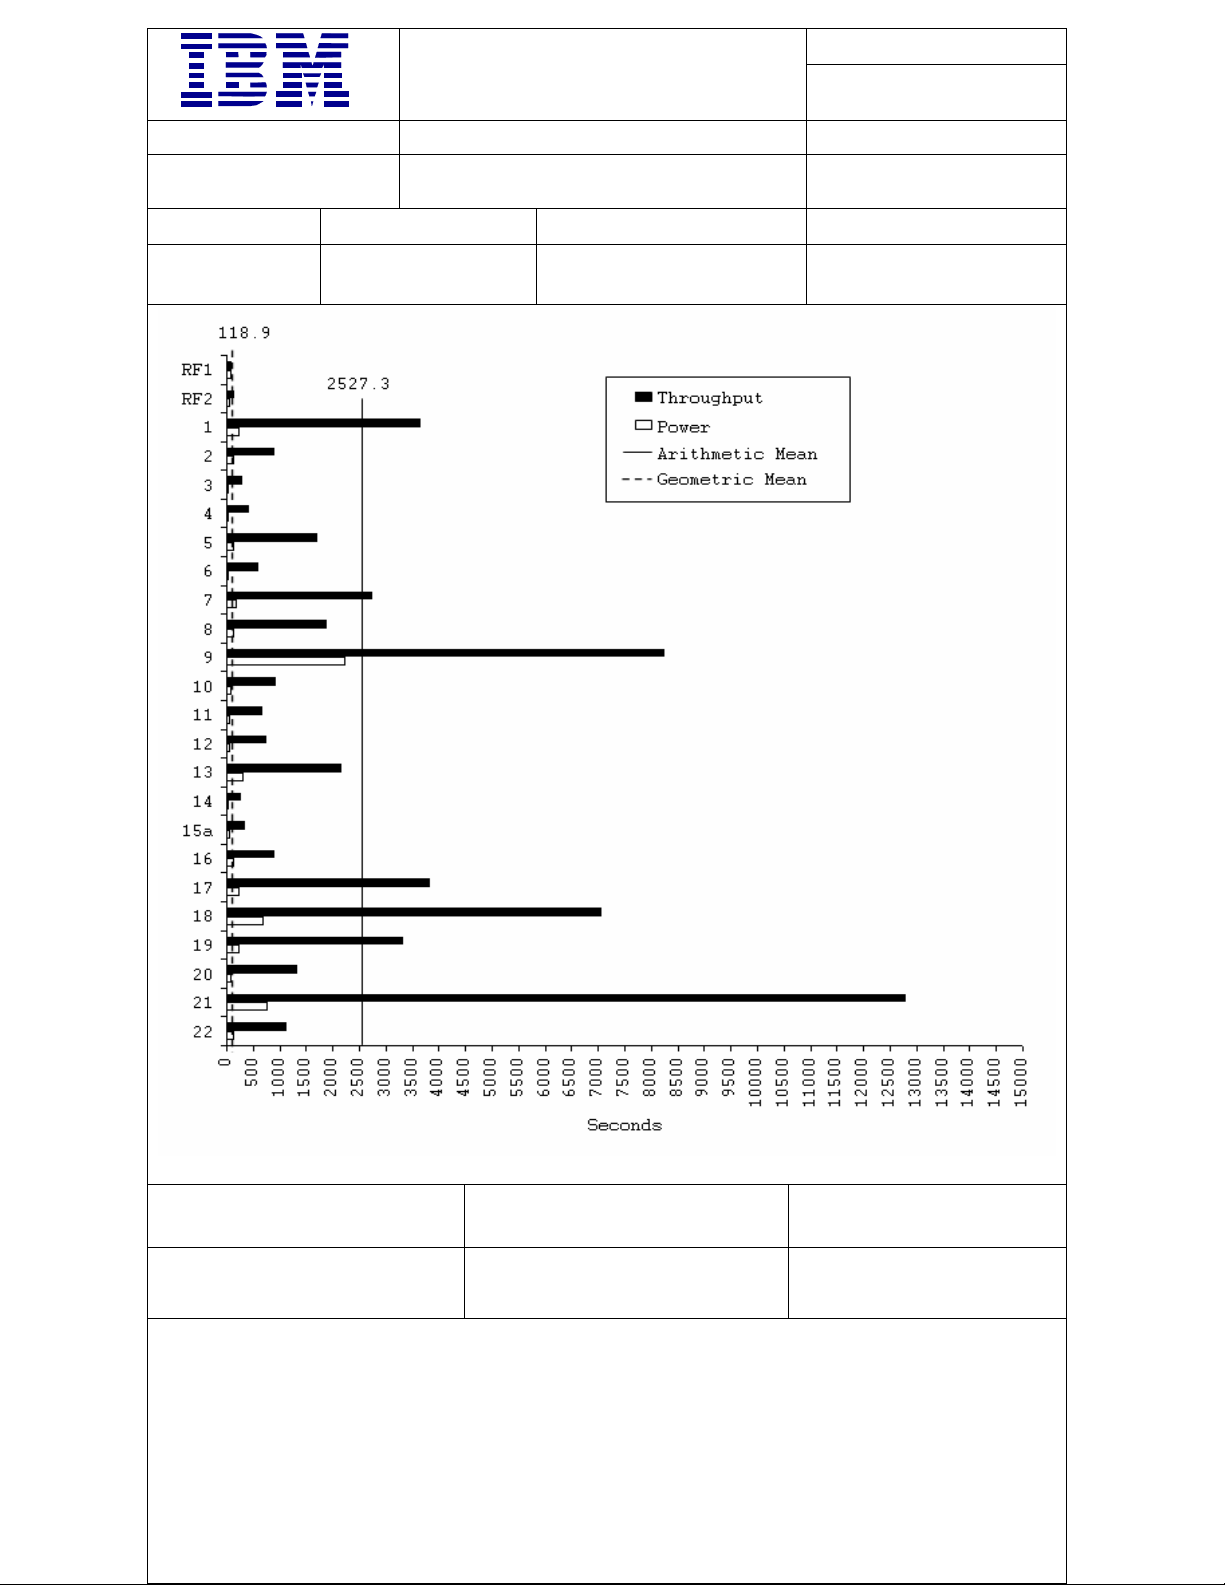
TPC-H Timing Intervals (in seconds):
IBM® ~™ x346
®
with IBM DB2
UDB 8.2
TPC-H Revision 2.1.0
Report Date:
18, 2005
Ma
Page 7

Benchmark Sponsor: Haider Rizvi
Mgr., DB2 Data Warehouse Performance
IBM Canada Ltd;
8200 Warden Avenue
Markham, Ontario L6G 1C7
May 16, 2005
I verified the TPC Benchmark™ H performance of the following configuration:
Platform: IBM
^ eServer xSeries 346, 64-node cluster
Database Manager: IBM DB2 UDB 8.2
Operating System: SuSE Linux Enterprise Server 9
The results were:
CPU (Speed) Memory Disks
QphH@3,000GB
Sixty-four (64) IBM ^ eServer xSeries 346 (each with)
1 x Intel Xeon
(3.6 GHz)
2 MB L2 Cache
4 GB Main
6 x 73.4 GB uSCSI
54,465.9
In my opinion, this performance result was produced in compliance with the TPC’s requirements
for the benchmark. The following verification items were given special attention:
• The database records were defined with the proper layout and size
• The database population was generated using DBGEN
• The database was properly scaled to 3,000GB and populated accordingly
• The compliance of the database auxiliary data structures was verified
• The database load time was correctly measured and reported
• The required ACID properties were verified and met
1373 North Franklin Street • Colorado Springs, CO 80903-2527 • Office: 719/473-7555 • Fax: 719/473-7554
Page 8

• The query input variables were generated by QGEN
• The query text was produced using minor modifications and an approved query variant
• The execution of the queries against the SF1 database produced compliant answers
• A compliant implementation specific layer was used to drive the tests
• The throughput tests involved 8 query streams
• The ratio between the longest and the shortest query was such that no query timing was
adjusted
• The execution times for queries and refresh functions were correctly measured and reported
• The repeatability of the measured results was verified
• The required amount of database log was configured
• The system pricing was verified for major components and maintenance
• The major pages from the FDR were verified for accuracy
Additional Audit Notes:
None.
Respectfully Yours,
François Raab
President
1373 North Franklin Street • Colorado Springs, CO 80903-2527 • Office: 719/473-7555 • Fax: 719/473-7554
Page 9

Table of Contents
Preface
1 General Items
1.1 Benchmark Sponsor 14
1.2 Parameter Settings 14
1.3 Configuration Diagrams 14
1.3.1 Measured and Priced Configurations 15
2 Clause 1: Logical Database Design Related Items
2.1 Database Table Definitions 16
2.2 Database Organization 16
2.3 Horizontal Partitioning 16
2.4 Replication 16
3 Clause 2: Queries and Update Functions Related Items
3.1 Query Language 17
3.2 Random Number Generation 17
3.3 Substitution Parameters Generation 17
3.4 Query Text and Output Data from Database 17
12
14
16
17
3.5 Query Substitution Parameters and Seeds Used 17
3.6 Query Isolation Level 17
3.7 Refresh Function Implementation 18
4 Clause 3: Database System Properties Related Items
4.1 Atomicity Requirement s 19
4.1.1 Atomicity of Completed Transactions 19
4.1.2 Atomicity of Aborted Transactions 19
4.2 Consistency Requirements 19
4.2.1 Consistency Condition 19
4.2.2 Consistency Tests 20
4.3 Isolation Requirements 20
4.3.1 Isolation Test 1 20
4.3.2 Isolation Test 2 20
4.3.3 Isolation Test 3 20
4.3.4 Isolation Test 4 21
4.3.5 Isolation Test 5 21
19
©Copyright IBM Corporation TPC Benchmark H Full Disclosure Report May 2005 Page: 7
Page 10

4.3.6 Isolation Test 6 22
4.4 Durability Requirements 22
4.4.1 Failure of Durable Medium Containing Recovery Log Data, and
Loss of System Power/Memory
22
4.4.2 Loss of Switch Power 23
5 Clause 4: Scaling and Database Populat i on Rel a ted Items
24
5.1 Cardinality of Tables 24
5.2 Distribution of Tables and Logs 24
5.3 Database Partition / Replication Mapping 25
5.4 RAID Implementation 25
5.5 DBGEN Modifications 25
5.6 Database Load Time 25
5.7 Data Storage Ratio 25
5.8 Database Load Mechanism Details and Illustration 25
5.9 Qualification Database Configuration 26
6 Clause 5: Performance Metrics and Execution Rules Related Items
27
6.1 System Activity between Load and Performance Tests 27
6.2 Steps in the Power Test 27
6.3 Timing Intervals for Each Query and Refresh Function 27
6.4 Number of Streams for the Throughput Test 27
6.5 Start and End Date/Times for Each Query Stream 27
6.6 Total Elapsed Time for the Measurement Interval 27
6.7 Refresh Function Start Date/Time and Finish Date/Time 27
6.8 Timing Intervals for Each Query and Each Refresh Function for Each Stream 28
6.9 Performance Metrics 28
6.10 Performance Metric and Numerical Quantities from Both Runs 28
6.11 System Activity between Tests 28
7 Clause 6: SUT and Driver Implementation Related Items
29
7.1 Driver 29
7.2 Implementation-Specific Layer 29
7.3 Profile-Directed Optimization 29
8 Clause 7: Pricing Related Items
30
8.1 Hardware and Software Components 30
8.2 Three-Year Cost of System Configuration 30
8.3 Availability Dates 30
©Copyright IBM Corporation TPC Benchmark H Full Disclosure Report May 2005 Page: 8
Page 11

8.4 Country-Specific Pricing 30
9 Clause 8: Audit Related Items
31
9.1 Auditor’s Report 31
Appendix A: Tunable Parameters and System Configuration
32
DB2 UDB 8.2 Database and Database Manager Configuration 32
DB2 Database Manager Configuration 33
DB2 Registry Variables 35
Linux Parameters 35
Appendix B: Database Build Scripts
35
buildtpcd 35
create_bufferpools 46
create_indexes 47
create_nodegroups 47
create_tables 47
create_ tablespaces 49
createuftbls 50
db2nodes.cfg 50
Load_db2set.ksh 51
run_db2set.ksh 51
runstats.ddl 52
load_tables.ksh 52
load_tb_customer.ddl
load_tb_lineitem.ddl
load_tb_orders.ddl
load_tb_part.ddl
load_tb_partsupp.ddl
load_tb_supplier.ddl
53
53
53
53
53
53
Load_dbcfg.ddl 53
load_dbmcfg.ddl 54
run_dbcfg.ddl 54
run_dbmcfg.ddl 54
setlogpath.ksh 54
tpcd.setup 54
Appendix C: Qualification Query Output
©Copyright IBM Corporation TPC Benchmark H Full Disclosure Report May 2005 Page: 9
58
Page 12

Qualification Queries 58
Query 1 58
Query 2 59
Query 3 60
Query 4 60
Query 5 61
Query 6 61
Query 7 62
Query 8 62
Query 9 63
Query 10 63
Query 11 65
Query 12 65
Query 13 65
Query 14 66
Query 15a 66
Query 16 67
Query 17 67
Query 18 68
Query 19 69
Query 20 70
Query 21 70
Query 22 72
First 10 Rows of the Database 72
Query Substitution Parameters 76
Appendix D: Driver Source Code
80
ploaduf1 80
ploaduf2 80
load_line_uf 80
load_orders_uf 80
runpower 80
runthroughput 84
tpcdbatch.h 88
tpcdbatch.sqc 89
©Copyright IBM Corporation TPC Benchmark H Full Disclosure Report May 2005 Page: 10
Page 13

tpcdUF.sqc 128
Appendix E: ACID Transaction Source Code
acid.h 135
acid.sqc 136
makefile 148
Appendix F: Price Quotations
135
185
©Copyright IBM Corporation TPC Benchmark H Full Disclosure Report May 2005 Page: 11
Page 14

Preface
TPC Benchmark H Standard Specification was developed by the Transaction Processing Performance
Council (TPC). It was released on February 26, 1999, and most recently revised (Revision 2.1.0) August
14, 2003. This is the full disclosure report for benchmark testing of IBM
TPC Benchmark H Standard Specification.
The TPC Benchmark H is a decision support benchmark. It consists of a suite of business-oriented ad hoc
queries and concurrent data modificati ons. The q ueries and the data populating the database have been
chosen to have broad industry-wide relevance while maintaining a sufficient degree of ease of
implementation. This benchmark illustrates decision support systems that:
v Examine large volumes of data;
v Execute queries with a high degree of complexity;
v Give answers to critical business questions.
TPC-H evaluates the performance of various decision support systems by the execution of set of queries
against a standard database under controlled conditions. The TPC-H queries:
v Give answers to real-world business questions;
v Simulate generated ad-hoc queries (e.g., via a point-and-click GUI interface);
v Are far more complex than most OLTP transactions;
v Include a rich breadth of operators and selectivity constraints;
v Generate intensive activity on the part of the database server component of the system under test;
v Are executed against a database complying with specific population and scaling requirements;
v Are implemented with constraints derived from staying closely synchronized with an on-line production
database.
The TPC-H operations are modeled as follows:
v The database is continuously available 24 hours a day, 7 day s a week, for ad- h oc queries from multiple
end users and data modifications against all tables, except possibly during infrequent (e.g., once a
month) maintenance sessions.
v The TPC-H database tracks, possibly with some delay, the state of the OLTP database through ongoing
refresh functions, which batch together a number of modifications impacting some part of the decision
support database.
v Due to the worldwide nature of the business data stored in the TPC-H database, the queries and the
refresh functions may be executed against the database at any time, especially in relation to each other.
In addition, this mix of queries and refresh functions is subject to specific ACIDity requirements, since
queries and refresh functions may execute concurrently.
v To achieve the optimal compromise between performance and operational requirements, the database
administrator can set, once and for all, the locking levels and the concurrent scheduling rules for queries
and refresh functions.
The minimum database required to run the benchmark holds business data from 10,000 suppliers. It
contains almost 10 million rows representing a raw storage capacity of about 1 gigabyte. Compliant
benchmark implementations may also use one of the larger permissible database populations (e.g., 100
gigabytes), as defined in Clause 4.1.3).
The performance metrics reported by TPC-H is called the TPC-H Composite Query-per-Hour Performance
Metric (QphH@Size), and reflects multiple aspects of the capability of the system to process queries. These
aspects include the selected database size against which the queries are executed, the query processing
power when queries are submitted by a single stream , and the query throughput when queries are
submitted by multiple concurrent users. The TPC-H Price/Performance metric is expressed as
$/QphH@Size. To be compliant with the TPC-H standard, all references to TPC-H results for a given
configuration must include all required reporting components (see Clause 5.4.6). The TPC believes that
comparisons of TPC-H results measured against different database sizes are misleading and discourages
such comparisons.
~ x346 according to the
©Copyright IBM Corporation TPC Benchmark H Full Disclosure Report May 2005 Page: 12
Page 15

The TPC-H database must be implemented using a commercially available database management system
(DBMS), and the queries executed via an interface using dynamic SQL. The specification provides for
variants of SQL, as implementers are not required to have implemented a specific SQL standard in full.
Benchmarks results are highly dependent upon workload, specific applicatio n requirements, and systems
design and implementation. Relative system performance will vary as a result of these and other factors.
Therefore, TPC-H should not be used as a substitute for specific customer application benchmarking when
critical capacity planning and/or product evaluation decisions are contemplated.
©Copyright IBM Corporation TPC Benchmark H Full Disclosure Report May 2005 Page: 13
Page 16

1 General Items
1.1 Benchmark Sponsor
A statement identifying the benchmark sponsor(s) and other participating companies must be provided.
IBM Corporation sponsored this TPC-H benchmark.
1.2 Parameter Settings
Settings must be provided for all customer-tunable parameters and options that have been changed from
the defaults found in actual products, including but not limited to:
v
Database tuning options
v
Optimizer/Query execution options
v
Query Processing tool/language configuration parameters
v
Recovery/commit options
v
Consistency/locking options
v
Operating system and configuration parameters
v
Configuration parameters and options for any other software component incorporated into the pricing
structure
v
Compiler optimization options.
Appendix A, “Tunable Parameters,” contains a list of all DB2 parameters and operating system parameters.
Session initialization parameters can be set during or immediately after establishing the connection to the
database within the tpcdbatch program documented in Appendix D, “Driver Source Code.” This result uses
the default session initialization parameters established during preprocessing/binding of the tpcdbatch
program.
1.3 Configuration Diagrams
Diagrams of both measured and price d con f i gurations must be provided, accompanie d by a descript i o n of
the differences. This includes, but is not limited to:
v
Number and type of processors
v
Size of allocated memory and any specific mapping/partitioning of memory unique to the test and type
of disk units (and controllers, if applicable)
v
Number and type of disk units (and controllers, if applicable)
v
Number of channels or bus connections to disk units, including their protocol type
v
Number of LAN (e.g., Ethernet) connections, including routers, workstations, terminals, etc., that were
physically used in the test or are incorporated into the pricing structure
v
Type and run-time execution location of software components (e.g., DBMS, query processing
tools/languages, middleware components, software drivers, etc.).
The configuration diagram for the tested and priced system is provided on the following page.
©Copyright IBM Corporation TPC Benchmark H Full Disclosure Report May 2005 Page: 14
Page 17

1.3.1 Priced and Measured Configurations
The priced configuration was a cluster of 64 x IBM
• 1 Intel Xeon 3.6GHz processor with 2MB cache
• Eight (8) 512MB PC-3200 ECC SDRAM RDIMMs
• One Voltaire HCA400 Dual-Port InfiniBand Host Channel Adapter
• One ServeRAID-7k Ultra320 SCSI controller
• Six (6) 73.4GB 15K Ultra320 SCSI disk drives
For full details of the priced configuration see the pricing spreadsheet in the Executive Summary.
~ xSeries 346 servers. Each had:
©Copyright IBM Corporation TPC Benchmark H Full Disclosure Report May 2005 Page: 15
Page 18

2 Clause 1: Logical Database Design Related Items
2.1 Database Table Definitions
Listings must be provided for all table definiti on st at ements and all other statements used to set up the test
and qualification databases. (8.1.2.1)
Appendix B contains the scripts that were used to set up the TPC-H test and qualification databases.
2.2 Database Organization
The physical organization of tables and indexes within the test and qualification databases must be
disclosed. If the column ordering of any table is different from that specified in Clause 1.4, it must be noted.
Appendix B contains the scripts that were used to create the indexes on the test and qualification databases.
2.3 Horizontal Partitioning
Horizontal partitioning of tables and rows in the test and qualification databases must be disclosed (see
Clause 1.5.4).
Horizontal partitioning was used for all tables except for the nation and region tables. See Appendix B,
“Database Build Scripts.”
2.4 Replication
Any replication of physical objects must be disclosed and must conform to the requirements of Clause
1.5.6).
No replication was used.
©Copyright IBM Corporation TPC Benchmark H Full Disclosure Report May 2005 Page: 16
Page 19

3 Clause 2: Queries and Update Functions Related Items
3.1 Query Language
The query language used to implement the queries must be identified.
SQL was the query language used.
3.2 Random Number Generation
The method of verification for the random number generation must be described unless the supplied
DBGEN and QGEN were used.
The TPC-supplied DBGEN version 1.3.0 and QGEN version 1.3.0 were used to generate all database
populations.
3.3 Substitution Parameters Generation
The method used to generate values for substitution parameters must be disclosed. If QGEN is not used for
this purpose, then the source code of any non-commercial tool used must be di scl ose d. If QGEN is used, the
version number, release number, modification number and patch level of QGEN must be disclosed.
The supplied QGEN version 1.3.0 was used to generate the substitution parameters.
3.4 Query Text and Output Data from Database
The executable query text used for query validation must be disclosed along with the corresponding output
data generated during the execution of the query text against the qualification database. If minor
modifications (see Clause 2.2.3) have been applied to any functional query definitions or approved variants
in order to obtain executable query text, these modifications must be disclosed and justified. The
justification for a particular minor query modification can apply collectively to all queries for which it has
been used. The output data for the power and throughput tests must be made available electronically upon
request.
Appendix C.1, “Qualification Queries,” contains the output for each of the queries. The functional query
definitions and variants used in this disclosure use the following minor query modifications:
v Table names and view names are fully qualified. For example, the nation table is referred to as
“TPCD.NATION.”
v The standard IBM SQL date syntax is used for date arithmetic. For example, DATE(‘1996-01-01’)+3
MONTHS.
v The semicolon (;) is used as a command delimiter.
3.5 Query Substitution Parameters and Seeds Used
All query substitution parameters used for all performance tests must be disclosed in tabular format, along
with the seeds used to generate these parameters.
Appendix C contains the seed and query substitution parameters used.
3.6 Query Isolation Level
The isolation level used to run the queries must be disclosed. If the isolation level does not map closely to
one of the isolation levels defined in Clause 3.4, additional descriptive detail must be provided.
The isolation level used to run the queries was “repeatable read.”
©Copyright IBM Corporation TPC Benchmark H Full Disclosure Report May 2005 Page: 17
Page 20

3.7 Refresh Function Implementation
The details of how the refresh functions were implemented must be disclosed (including source code of any
non-commercial program used).
The refresh functions are part of the implementation-specific layer/driver code included in Appendix D,
“Driver Source Code.”
©Copyright IBM Corporation TPC Benchmark H Full Disclosure Report May 2005 Page: 18
Page 21

4 Clause 3: Database System Properties Related Items
The results of the ACID tests must be disclosed, along with a description of how the ACID requirements
were met. This includes disclosing the code written to implement the ACID Transaction and Query.
All ACID tests were conducted according to specifications. The Atomicity, Isolation, Consistency and
Durability tests were performed on the IBM
source code.
4.1 Atomicity Requirements
The system under test must guarantee that transactions are atomic; the system will either perform all
individual operations on the data, or will assure that no partially completed operations leave any effects on
the data.
4.1.1 Atomicity of Completed Transactions
Perform the ACID transactions for a randomly selected set of input data and verify that the appropriate
rows have been changed in the ORDER, LINEITEM and HISTORY tables.
The following steps were performed to verify the Atomicity of completed transactions.
1. The total price from the ORDER table and the extended price from the LINEITEM table were
retrieved for a randomly selected order key. The number of records in the HISTORY table was
also retrieved.
2. The ACID Transaction T1 was executed for the order key used in step 1.
3. The total price and extended price were retrieved for the same order key used in step 1 and step 2.
It was verified that:
T1.EXTENDEDPRICE=OLD.EXTENDEDPRICE+((T1.DELTA)*
(OLD.EXTENDEDPRICE/OLD.QUANTITY)),T1.TOTALPRICE=OLD.TOTALPRICE+
((T1.EXTENDEDPRICE-OLD.EXTENDEDPRICE)*(1-DISCOUNT)*(1+TAX)), and that
the number of records in the History table had increased by 1.
4.1.2 Atomiciy of Aborted Transactions
~ x346. Appendix E contains the ACID transaction
Perform the ACID transactions for a randomly selected set of input data, and verify that the appropriate
rows have been changed in the ORDER, LINEITEM and HISTORY tables.
The following steps were performed to verify the Atomicity of the aborted ACID transaction:
1. The ACID application is passed a parameter to execute a rollback of the transaction instead of
performing the commit.
2. The total price from the ORDER table and the extended price from the LINEITEM table were
retrieved for a random order key. The number of records in the HISTORY table was also
retrieved.
3. The ACID transaction was executed for the orderkey used in step 2. The transaction was rolled
back.
4. The total price and the extended price were retrieved for the same orderkey used in step 2 and step
3. It was verified that the extended price and the total price were the same as in step 2.
4.2 Consistency Requirements
Consistency is the property of the application that requires any execution of transactions to take the
database from one consistent state to another.
4.2.1 Consistency Condition
A consistent state for the TPC-H database is defined to exist when:
O_TOTALPRICE=SUM(L_EXTENDEDPRICE*(1-L_DISCOUNT)*(1+L_TAX)
for each ORDER and LINEITEM defined by (O_ORDERKEY=L_ORDERKEY)
©Copyright IBM Corporation TPC Benchmark H Full Disclosure Report May 2005 Page: 19
Page 22

The following queries were executed before and after a measurement to show that the database was always
in a consistent state both initially and after a measurement.
SELECT DECIMAL(SUM(DECIMAL(INTEGER(INTEGER(DECIMAL
(INTEGER(100*DECIMAL(L_EXTENDEDPRICE,20,2)),20,3)*
(1-L_DISCOUNT))*(1+L_TAX)),20,3)/100.0),20,3)
FROM TPCD.LINEITEM WHERE L_ORDEYKEY=okey
SELECT DECIMAL(SUM(O_TOTALPRICE,20,3)) from TPCD.ORDERS WHERE
O_ORDERKEY = okey
4.2.2 Consistency Tests
Verify that the ORDER and LINEITEM tables are initially consistent as defined in Clause 3.3.2.1, based on
a random sample of at least 10 distinct values of O_ORDERKEY.
The queries defined in 4.2.1, “Consistency Condition,” were run after initial database build and pr ior to
executing the ACID transaction. The queries showed that the database was in a consistent condition.
After executing 9 streams of 100 ACID transactions each, the queries defined in 4.2.1, “Consistency
Condition,” were run again. The queries showed that the database was still in a consistent state.
4.3 Isolation Requirements
4.3.1 Isolation Test 1
This test demonstrates isolation for the read-write conflict of a read-write transaction and a read-on ly
transaction when the read-write transaction is committed.
The following steps were performed to satisfy the test of isolation for a read-only and a read-write
committed transaction:
1. First session: Start an ACID transaction with a randomly selected O_KEY,L_KEY and DELTA.
The transaction is delayed for 60 seconds just prior to the Commit.
2. Second session: Start an ACID query for the same O_KEY as in the ACID transaction.
3. Second session: The ACID query attempts to read the file but is locked out by the ACID
transaction waiting to complete.
4. First session: The ACID transaction is released and the Commit is executed releasing the record.
With the LINEITEM record now released, the ACID query can now complete.
5. Second session: Verify that the ACID query delays for approximately 60 seconds and that the
results displayed for the ACID query match the input for the ACID transaction.
4.3.2 Isolation Test 2
This test demonstrates isolation for the read-write conflict of read-write transaction and read-only
transaction when the read-write transaction is rolled back.
The following steps were performed to satisfy the test of isolation for read-only and a rolled back readwrite transaction:
1. First session: Perform the ACID transaction for a random O_KEY, L_KEY and DELTA. The
transaction is delayed for 60 seconds just prior to the Rollback.
2. Second session: Start an ACID query for the same O_KEY as in the ACID transaction. The ACID
query attempts to read the LINEITEM table but is locked out by the ACID transaction.
3. First session: The ACID transaction is released and the Rollback is executed, releasing the read.
4. Second session: With the LINEITEM record now released, the ACID query completes.
4.3.3 Isolation Test 3
This test demonstrates isolation for the write-write conflict of two refresh transactions when the first
transaction is committed.
The following steps were performed to verify isolation of two refresh transactions:
©Copyright IBM Corporation TPC Benchmark H Full Disclosure Report May 2005 Page: 20
Page 23

1. First session: Start an ACID transaction T1 for a randomly selected O_KEY, L_KEY and
DELTA. The transaction is delayed for 60 seconds just prior to the COMMIT.
2. Second session: Start a second ACID transaction T2 for the same O_KEY, L_KEY, and for a
randomly selected DELTA2. This transaction is forced to wait while the 1st session holds a lock
on the LINEITEM record requested by the second session.
3. First session: The ACID transaction T1 is released and the Commit is executed, releasing the
record. With the LINEITEM record now released, the ACID transaction T2 can now complete.
4. Verify that:
T2.L_EXTENDEDPRICE=T1.L_EXTENDEDPRICE+DELTA*
(T1.L_EXTENDEDPRICE)/T1.L_QUANTITY)
4.3.4 Isolation Test 4
This test demonstrates isolation for write-write conflict of two ACID transactions when the first tran saction
is rolled back.
The following steps were performed to verify the isola tion of two ACID transactions after the first one is
rolled back:
1. First session: Start an ACID transaction T1 for a randomly selected O_KEY, L_KEY, and
DELTA. The transaction is delayed for 60 seconds just prior to the rollback.
2. Second session: Start a second ACID transaction T2 for the same O_KEY, L_KEY used by the 1st
session. This transaction is forced to wait while the 1st session holds a lock on the LINEITEM
record requested by the second session.
3. First session: Rollback the ACID transaction T1. With the LINEITEM record now released, the
ACID transaction T2 completes.
4. Verify that T2.L_EXTENDEDPRICE = T1.L_EXTENDEDPRICE
4.3.5 Isolation Test 5
This test demonstrates the ability of read and write transactions affecting different database tables to make
progress concurrently.
1. First session: Start an ACID transaction, T1, for a randomly selected O_KEY, L_KEY and
DELTA. The ACID transaction was suspended prior to COMMIT.
2. First session: Start a second ACID transaction, T2, which selects random values of
PS_PARTKEY and PS_SUPPKEY and returns all columns of the PARTSUPP table for which
PS_PARTKEY and PS_SUPPKEY are equal to the selected values.
3. T2 completed.
4. T1 was allowed to complete.
5. It was verified that the appropriate rows in the ORDERS, LINEITEM and HISTORY tables have
been changed.
©Copyright IBM Corporation TPC Benchmark H Full Disclosure Report May 2005 Page: 21
Page 24

4.3.6 Isolation Test 6
This test demonstrates that the continuous submission of arbitrary (read-only) queries against one or more
tables of the database does not indefinitely delay refresh transactions affecting those tables from making
progress.
1. First session: A transaction T1, which executes modified TPC-H query 1 wi t h DELT A = 0, was
started.
2. Second session: Before T1 completed, an ACID transaction T2, with randomly selected values of
O_KEY, L_KEY and DELTA, was started.
3. Third session: Before T1 completed, a transaction T3, which executes modified TPC-H query 1
with a randomly selected value of DELTA (not equal to 0), was started.
4. T1 completed.
5. T2 completed.
6. T3 completed.
7. It was verified that the appropriate rows in the ORDERS, LINEITEM and HISTORY tables were
changed.
4.4 Durability Requirements
The SUT must guarantee durability: the ability to preserve the effects of committed transactions and ensure
database consistency after recovery from any one of the failures listed in Clause 3.5.3.
4.4.1 Failure of Durable Medium Containing Recovery Log Data, and Loss of System
Power/Memory
Guarantee the database and committed updates are preserved across a permanent irrecoverable failure of
any single durable medium containing TPC-H database tables or recovery log tables.
The database log was stored on RAID-5 protected storage. The tables for the database were stored on
RAID-5 protected storage. The tests were conducted on the qualification database. The steps performed are
shown below.
1. The consistency test described in section 4.2.1 was verified.
2. The current count of the total number of records in the HISTORY table was determined giving
hist1.
3. A test to run 200 ACID transactions on each of 9 execution streams was started such that each
stream executes a different set of transactions.
4. One of the disks containing the DB2 transaction log recovery data and DB2 database tables was
powered off after at least 30 ACID transactions had completed from each of the execution
streams.
5. Because the disks were in RAID 5 configuration the applications continued running the ACID
transactions.
6. The system was shutdown by switching off circuit breakers on the power rail connected to all
system component cabinets, after at least a total of 100 transactions had completed for each
stream.
7. The system was powered back on and rebooted.
8. All volumes were re-established and RAID5 volumes were synchronized.
9. Step 2 was performed giving hist2. It was verified that hist2 - hist1 was greater than or eq ual to the
number of records in the success file.
10. Consistency condition described in 4.2.1 was verified.
©Copyright IBM Corporation TPC Benchmark H Full Disclosure Report May 2005 Page: 22
Page 25

4.4.2. Loss of Switch Power
This test was conducted on the qualification database. The following steps were performed:
1. The consistency test described in section 4.2.1 was verified.
2. The current count of the total number of records in the HISTORY table was determined giving
hist1.
3. A test to run 200 ACID transactions on each of 9 execution streams was started such that each
stream executes a different set of transactions.
4. The Voltaire Infiniband switch was disconnected from the system.
5. Database detected the network loss and terminated processing.
6. Network connections were reestablished and the database was restarted.
7. Step 2 was performed giving hist2. It was verified that hist2 - hist1 was greate r tha n or eq ual to
the number of records in the success file.
8. Consistency condition described in 4.2.1 was verified.
©Copyright IBM Corporation TPC Benchmark H Full Disclosure Report May 2005 Page: 23
Page 26

5 Clause 4: Scaling and Database Population Related Items
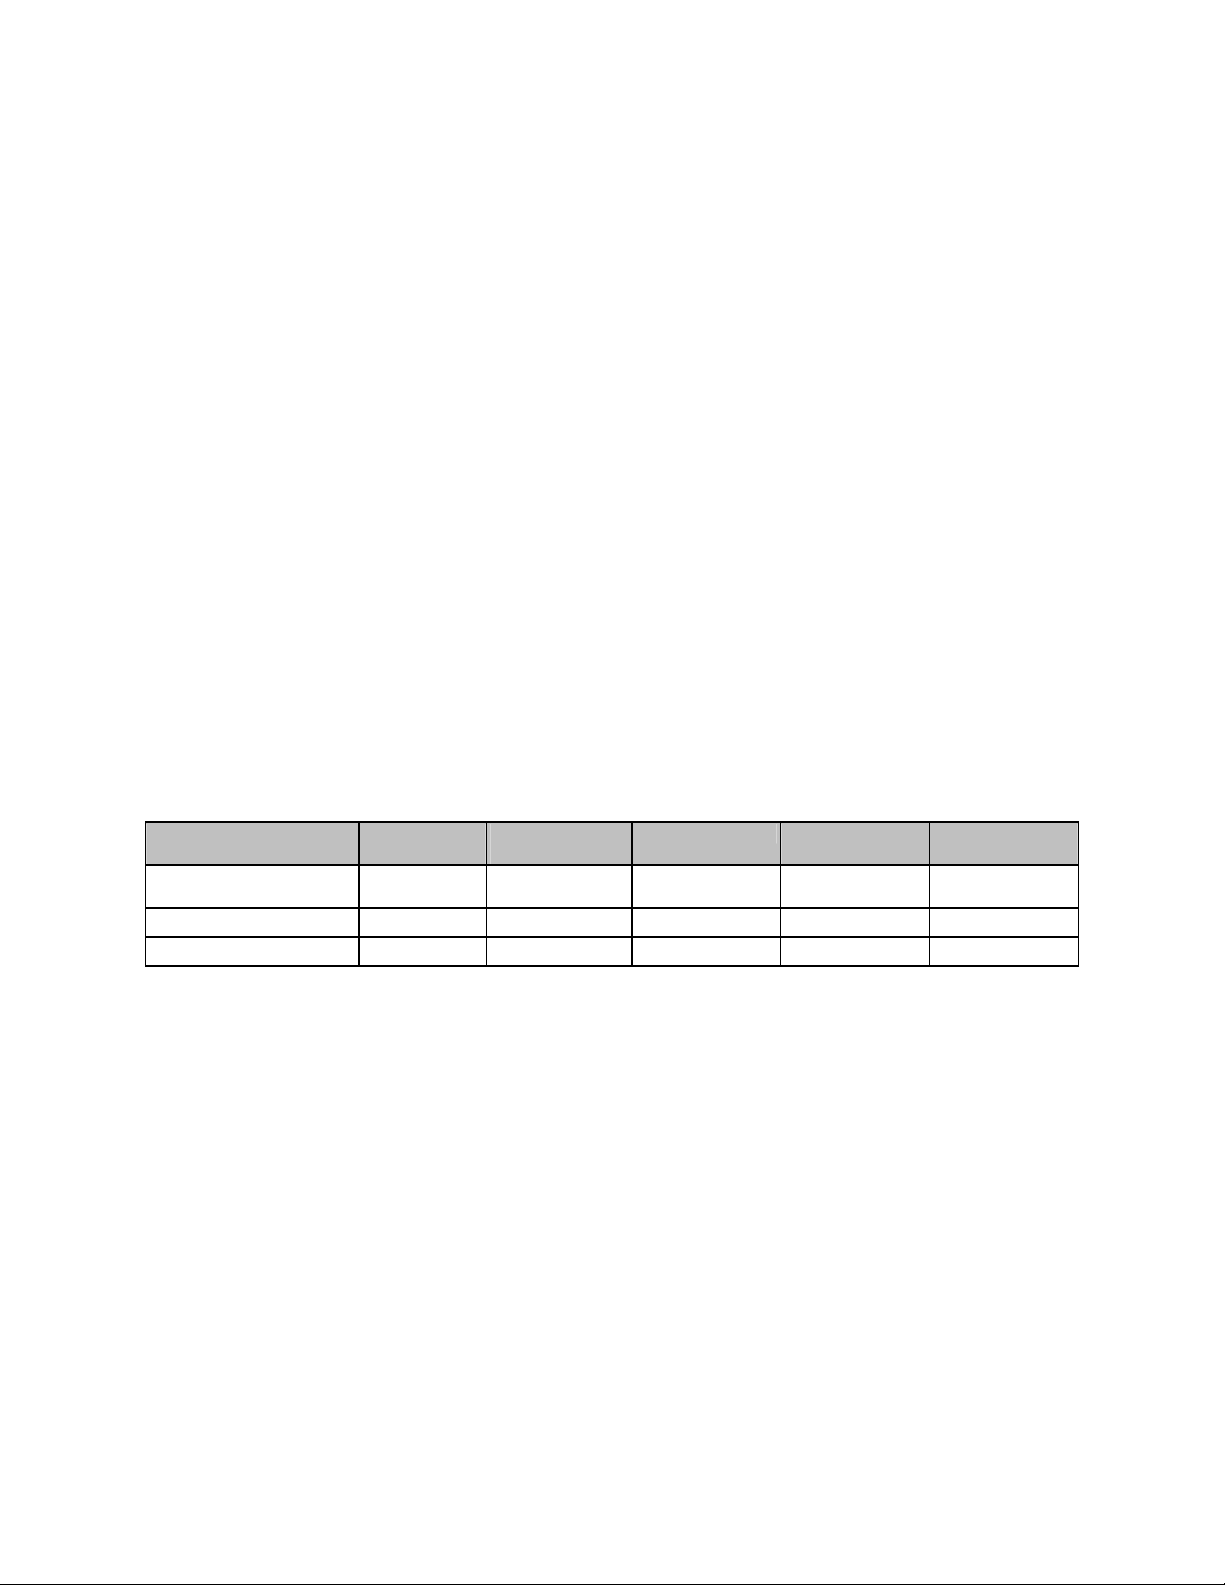
5.1 Cardinality of Tables
The cardinality (e.g., the number of rows) of each table of the test database, as it existed at the completion
of the database load (see Clause 4.2.5), must be disclosed.
Table Name Rows
Order 4,500,000,000
Lineitem 18,000,048,306
Customer 450,000,000
Part 600,000,000
Supplier 30,000,000
Partsupp 2,400,000,000
Nation 25
Region 5
5.2 Distribution of Tables and Logs
The distribution of tables and logs across all media must be explicitly described.
Controller Drives Logical Partition Size Use
Internal 3 disk-73.4GB /dev/sda1 50GB OS root filesystem
Serve-RAID 7k RAID5 /dev/sda2 8GB Swap
/dev/sda5 18GB Temp Tables
/dev/sda6 40GB DB Data
/dev/sda7 25GB Temp Tables
/dev/sda8 1.5GB Logs
3 disk-73.4GB /dev/sdb1 58GB Filesystem
RAID5 /dev/sdb5 18GB Temp Tables
/dev/sdb6 40GB DB Data
/dev/sdb7 25GB Temp Tables
/dev/sdb8 1.5GB Logs
©Copyright IBM Corporation TPC Benchmark H Full Disclosure Report May 2005 Page: 24
Page 27
5.3 Database Partition / Replication Mapping
The mapping of database partitions/replications must be explicitly described.
The database was not replicated. The database was logically partitioned into 128 logical nodes, 2 nodes on
each physical server.
5.4 RAID Implementation
Implementations may use some form of RAID to ensure high availability. If used for data, auxiliary storage
(e.g., indexes) or temporary space, the level of RAID must be disclosed for each device.
RAID level 5 was used across all database tables, indexes, and recovery logs.
5.5 DBGEN Modifications
Any modifications to the DBGEN (see Clause 4.2.1) source code must be disclosed. In the event that a
program other than DBGEN was used to populate the database, it must be disclosed in its entirety.
The standard distribution DBGEN version 1.3.0 was used for database population. No modi fi cat i ons were
made.
5.6 Database Load Time
The database load time for the test database (see Clause 4.3) must be disclosed.
See the Executive Summary at the beginning of this report.
5.7 Data Storage Ratio
The data storage ratio must be disclosed. It is computed as the ratio between the total amount of priced
disk space and the chosen test database size as defined in Clause 4.1.3.
The calculation of the data storage ratio is shown in the following table.
Disk Type Number of
Disks
73.4GB 15K Ultra160 SCSI
Drive
Total
The data storage ratio is 8.75, derived by dividing 26,249.856GB by the database size of 3000GB.
384 68.359 GB 26,249.856 GB
Formatted Space
per Disk
Total Disk Space Scale Factor Storage Ratio
26,249.856 GB 3000 8.75
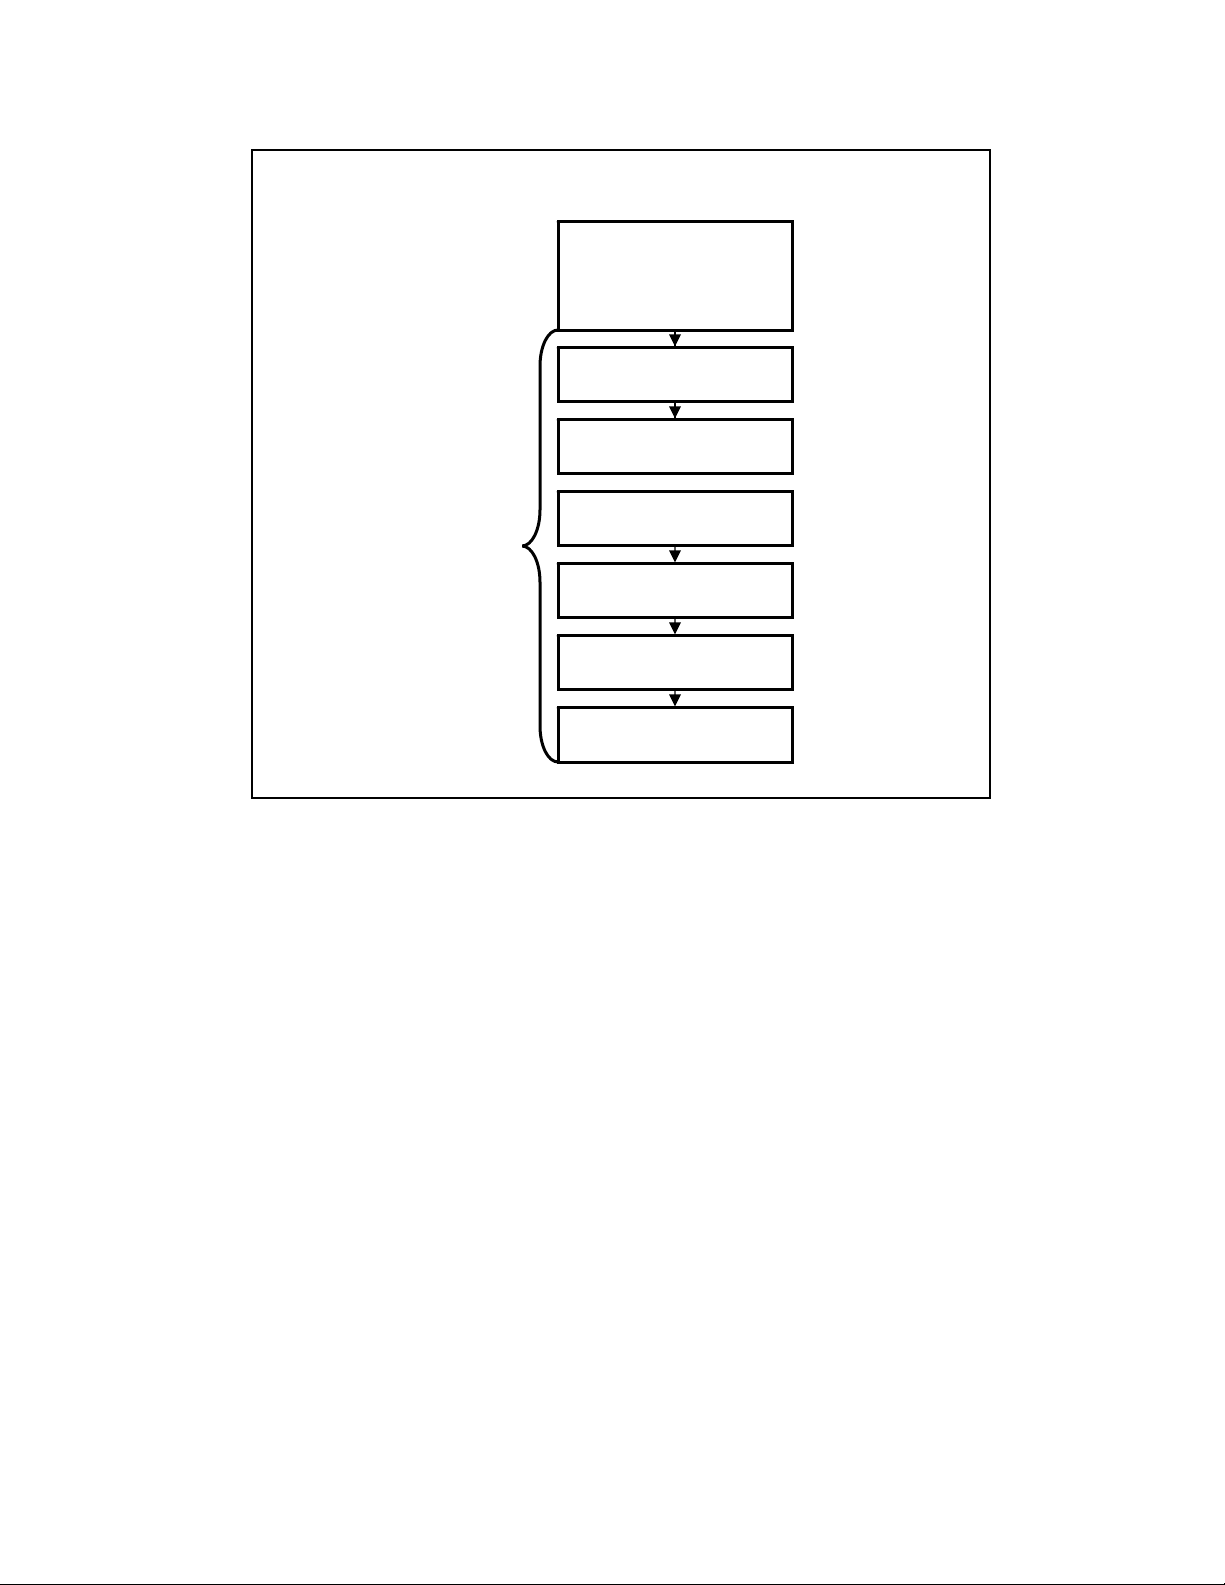
5.8 Database Load Mechanism Details and Illustration
The details of the database load must be disclosed, including a block diagram illustrating the overall
process. Disclosure of the load procedure includes all steps. scripts, input and configuration files required
to completely reproduce the test and qualification databases.
Flat files for each of the tables were created using DBGEN.
The NATION and REGION tables were created on node 0 and then loaded from dbgen output. The other
tables were loaded on 128 logical nodes.
The tables were loaded as depicted in Figure 4-1.
©Copyright IBM Corporation TPC Benchmark H Full Disclosure Report May 2005 Page: 25
Page 28
g
Period
Database Load Timin
Create Database,
Nodegroups and
tablespaces
Configure for Load
Create Tables
Load Tables
Create Indexes
Update Statistics
Configure for Run
Figure 4-1. Database Load Procedure
5.9 Qualification Database Configuration
Any differences between the configuration of the qualification database and the test database must be
disclosed.
The qualification database used identical scripts to create and load the data with changes to adjust for the
database scale factor.
©Copyright IBM Corporation TPC Benchmark H Full Disclosure Report May 2005 Page: 26
Page 29

6 Clause 5: Performance Metrics and Execution Rules Related Items
6.1 System Activity between Load and Performance Tests
Any system activity on the SUT that takes place between the conclusion of the load test and the beginning of
the performance test must be fully disclosed.
The auditor requested that queries be run against the database to verify the correctness of the database load.
6.2 Steps in the Power Test
The details of the steps followed to implement the power test (e.g., system reboot, database restart) must be
disclosed.
The following steps were used to implement the power test:
1. RF1 Refresh Transaction
2. Stream 00 Execution
3. RF2 Refresh Transaction
6.3 Timing Intervals for Each Query and Refresh Function
The timing intervals for each query of the measured set and for both update functions must be reported for
the power test.
See the Numerical Quantities Summary in the Executive Summary at the beginning of this report.
6.4 Number of Streams for the Throughput Test
The number of execution streams used for the throughput test must be disclosed.
Eight streams were used for the throughput test.
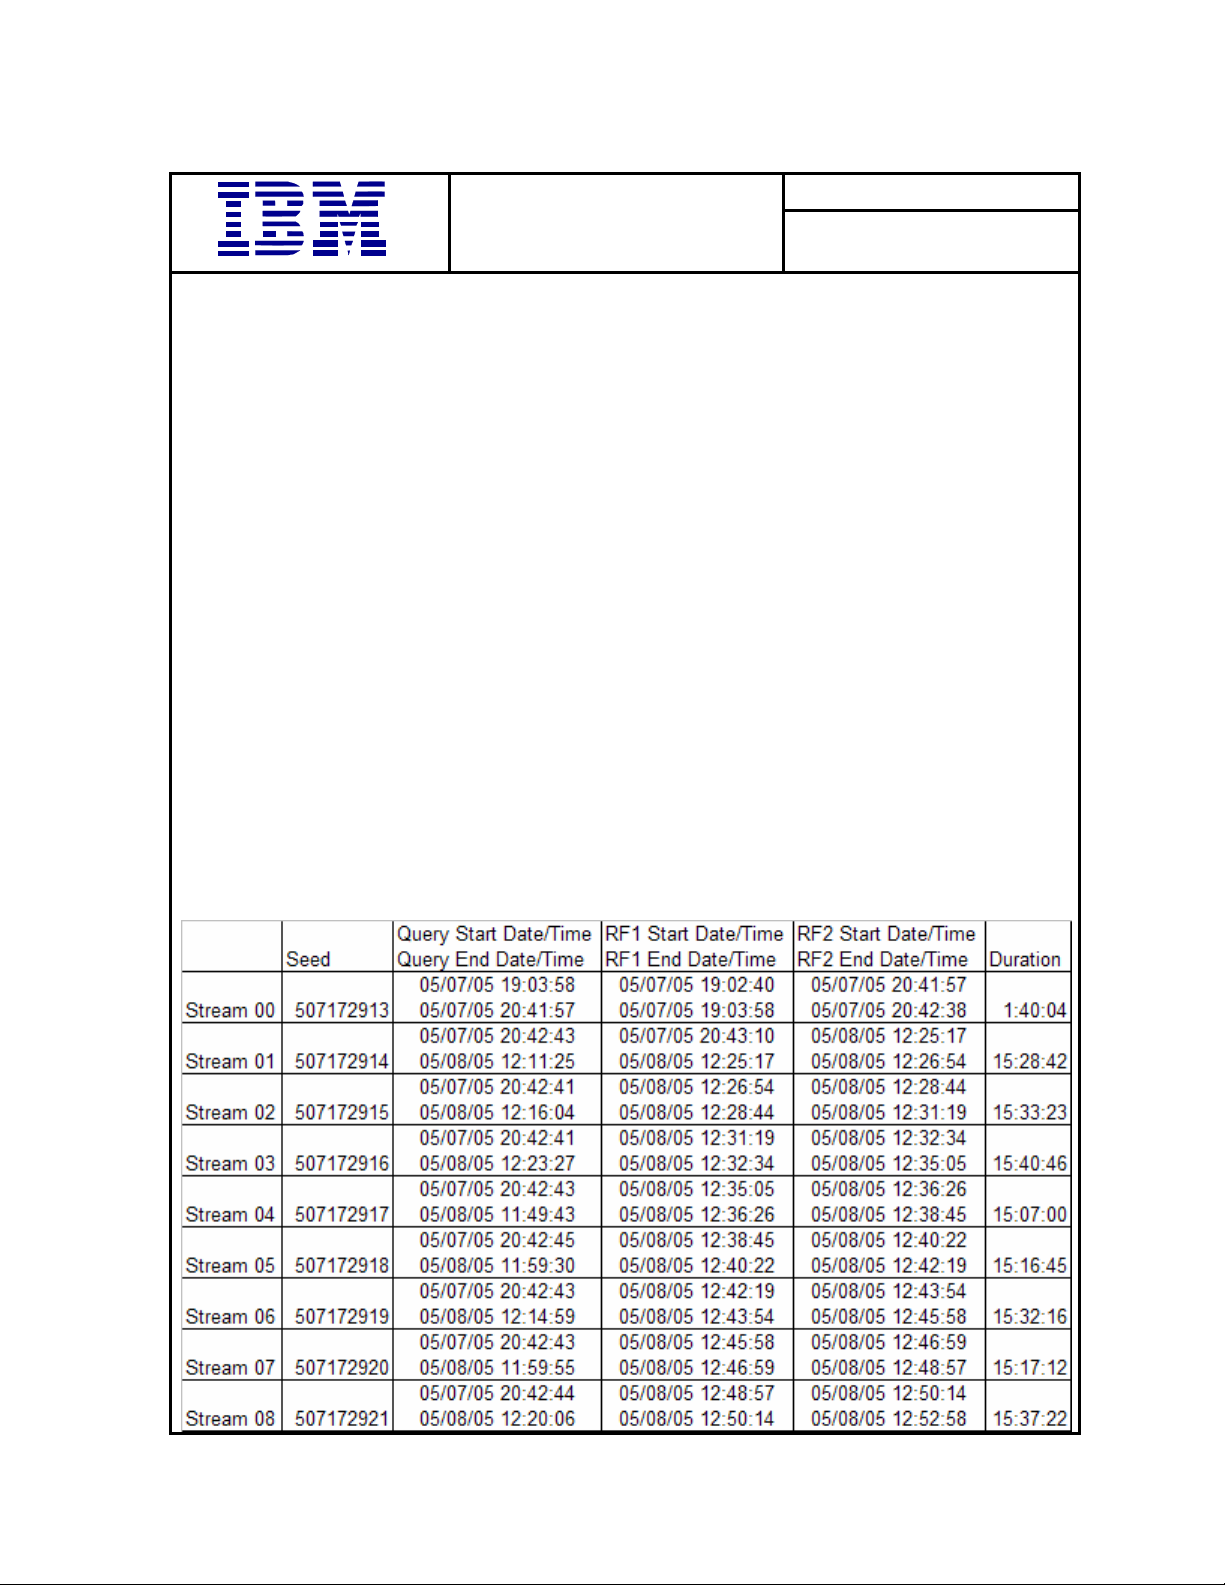
6.5 Start and End Date/Times for Each Query Stream
The start time and finish time for each query execution stream must be reported for the throughput test.
See the Numerical Quantities Summary in the Executive Summary at the beginning of this report.
6.6 Total Elapsed Time for the Measurement Interval
The total elapsed time for the measurement interval must be reported for the throughput test.
See the Numerical Quantities Summary in the Executive Summary at the beginning of this report..
6.7 Refresh Function Start Date/Time and Finish Date/Time
The start time and finish time for each update function in the update stream must be reported for the
throughput test.
See the Numerical Quantities Summary in the Executive Summary at the beginning of this report.
©Copyright IBM Corporation TPC Benchmark H Full Disclosure Report May 2005 Page: 27
Page 30

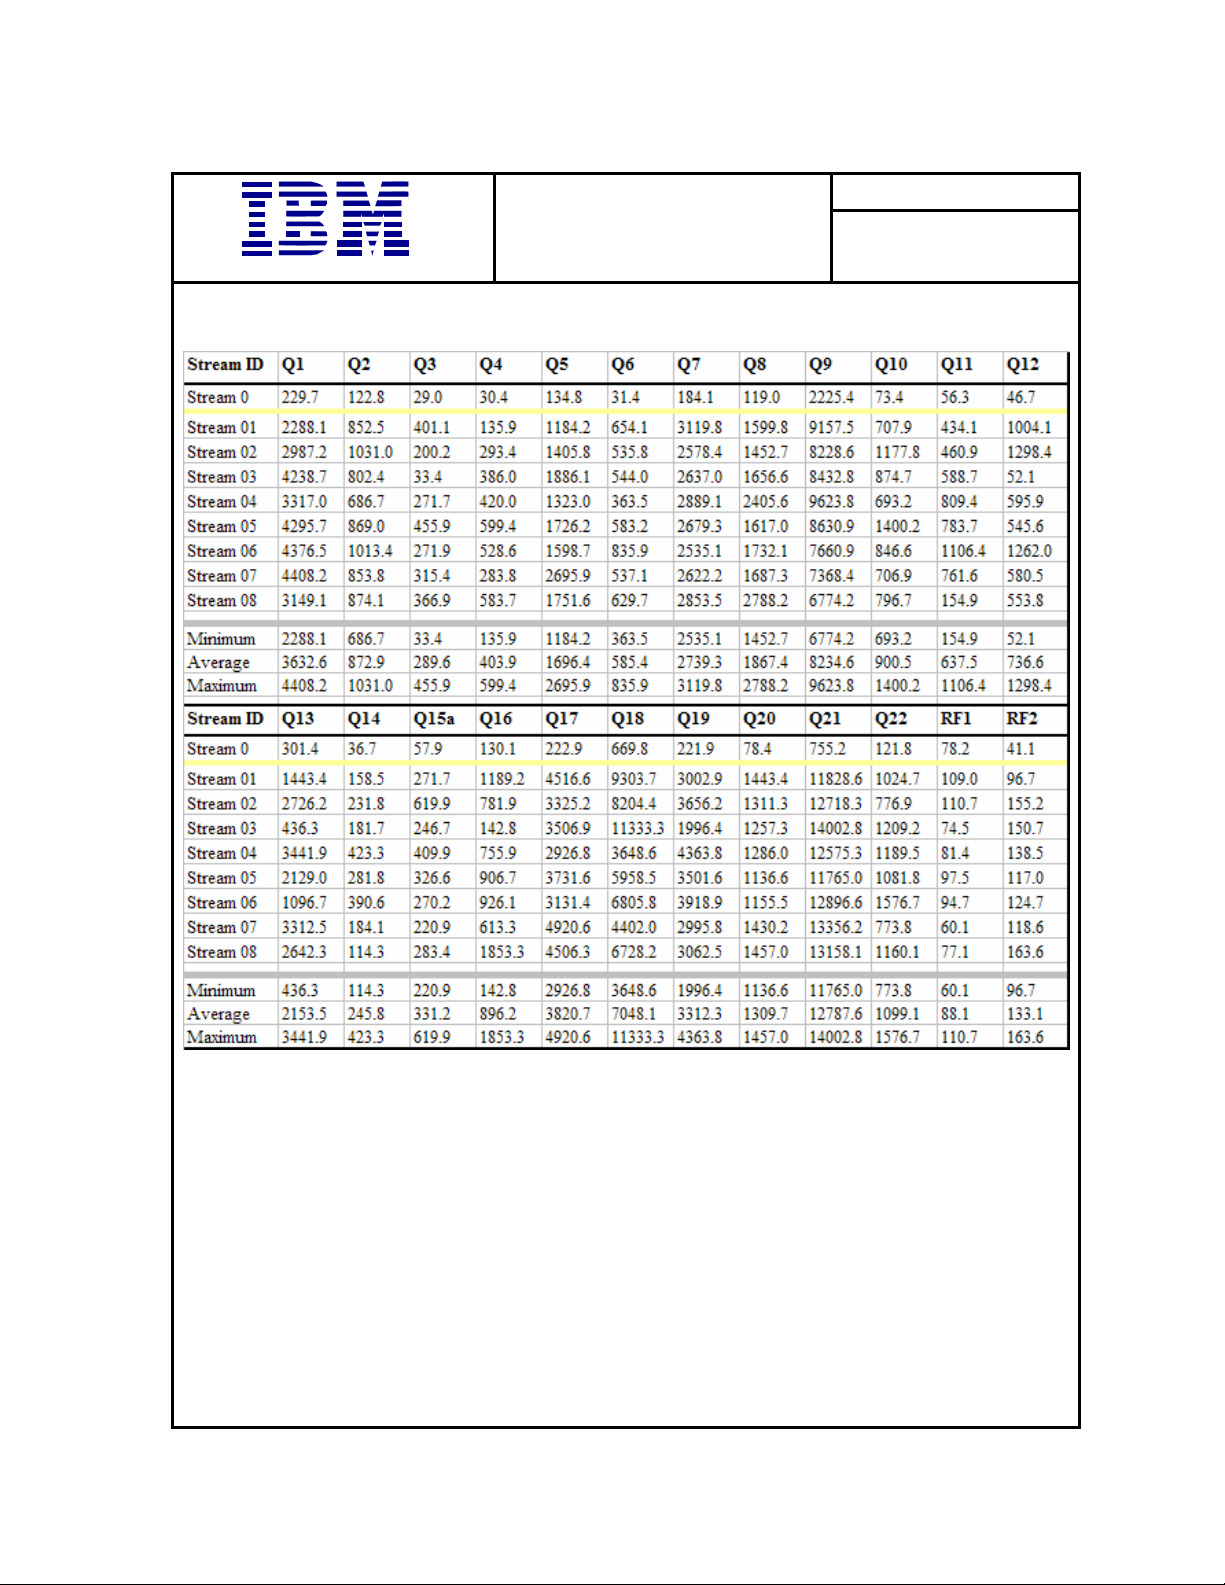
6.8 Timing Intervals for Each Query and Each Refresh Function for Each Stream
The timing intervals for each query of each stream and for each update function must be reported for the
throughput test.
See the Numerical Quantities Summary in the Executive Summary at the beginning of this report.
6.9 Performance Metrics
The computed performance metrics, related numerical quantities, and the price/performance metric must
be reported.
See the Numerical Quantities Summary in the Executive Summary at the beginning of this report.
6.10 Performance Metric and Numerical Quantities from Both Runs
The performance metric and numerical quantities from both runs must be disclosed.
Two consecutive runs of the TPC-H benchmark were performed. The following table contains the results
for both runs.
Run1
Run2
QppH @ 3000GB QthH @ 3000GB QphH @ 3000GB
90,854.7 32,651.4 54,465.9
96,326.7 31,892.1 55,426.2
6.11 System Activity between Tests
Any activity on the SUT that takes place between the conclusion of Run1 and the beginning of Run2 must be
disclosed.
The system was rebooted and DB2 was restarted between runs.
©Copyright IBM Corporation TPC Benchmark H Full Disclosure Report May 2005 Page: 28
Page 31

7 Clause 6: SUT and Driver Implementation Related Items
7.1 Driver
A detailed textual description of how the driver performs its functions, how its various components interact
and any product functionality or environmental setting on which it relies must be provided. All related
source code, scripts and configurations must be disclosed. The information provided should be sufficient
for an independent reconstruction of the driver.
Appendix D, “Driver Source Code,” contains the source code used for the driver and all scripts used in
connection with it.
The Power test is invoked by calling tpcdbatch with the stream number 0 specified, an indication that the
refresh functions must be run, and the SQL file that contains the power stream queries.
The Throughput test is invoked by initiating a call to tpcdbatch for every query stream that will be run.
Tpcdbatch gets the stream number for each of the streams, and the SQL file specific to that stream number
as the queries to execute. The refresh function is initiated as a separate call to tpcdbatch with the SQL script
for the refresh functions and the total number of query streams specified.
7.2 Implementation-Specific Layer
If an implementation-specific layer is used, then a detailed description of how it performs its functions must
be supplied, including any related source code or scripts. This descri pt i o n shoul d al l ow a n independent
reconstruction of the implementation-specific layer.
The implementation specific layer is a single executable SQL application that uses embedded dynamic
SQL to process the EQT generated by QGEN. The application is called tpcdbatch to indicate that it
processes a batch of TPC-H queries, although it is completely capable of processing any arbitrary SQL
statement (both DML and DDL).
A separate instance of tpcdbatch is invoked for each stream. Each instance establishes a distinct connection
to the database server through which the EQT is transmitted to the database and the results are returned
through the implementation specific layer to the driver. When an instance of tpcdbatch is invoked, it is
provided with a context of whether it is running a power test, query stream or refresh stream, as well as an
input file containing the 22 queries and/or refresh functions. tpcdbatch then connects to the database,
performs any session initialization as well as preparing output files required by the auditor. Then it
proceeds to read from the input file and processes each query or refresh function in turn.
For queries, each query is prepared, described, and a cursor is opened and used to fetch the required
number of rows. After the last row has been retrieved a commit is issued. For the refresh functions, during
the database build all data is first split for each node using the db2split utility. For RF1, the data for each
node is further split into n equal portions for both the lineitem and orders tables taking care that the records
for the same orderkey remain in the same set. For RF2, the data for each node is further split into m equal
portions. During the run, when tpcdbatch encounters a call to execute RF1, it first calls a shell script which
loads these n sets of data into n sets of temporary tables (one each for lineitem and orders). Then tpcdbatch
forks off n children to do an insert with subselect into the original lineitem and orders tables. When
tpcdbatch encounters a call to execute RF2, it calls a shell script that loads these data into a single staging
table. Then tpcdbatch forks off p children (where p * x = m) to do x sets of deletes from the orders and
lineitem tables with a subselect from the staging table.
7.3 Profile-Directed Optimization
Profile-directed optimization was not used.
©Copyright IBM Corporation TPC Benchmark H Full Disclosure Report May 2005 Page: 29
Page 32

8 Clause 7: Pricing Related Items
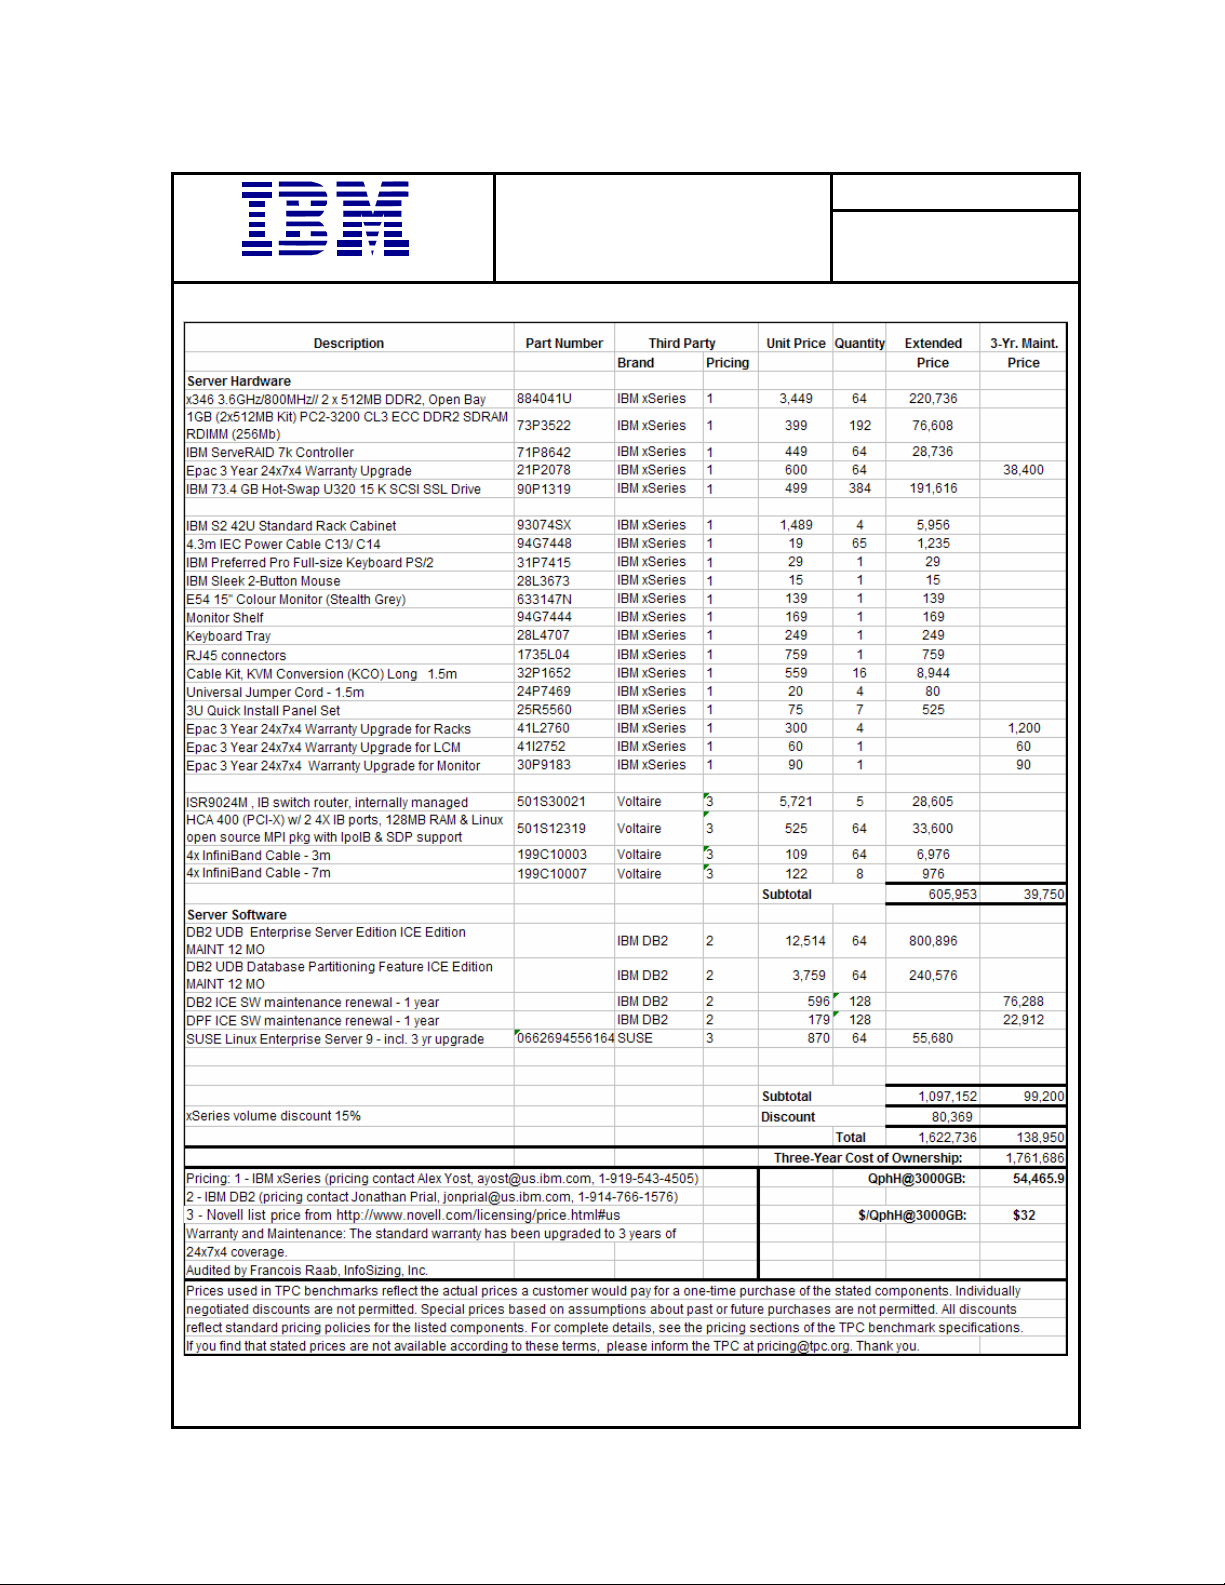
8.1 Hardware and Software Components
A detailed list of the hardware and software used in the priced system must be reported. Each item must
have a vendor part number, description and release/revision level, and either general availability status or
committed delivery date. If package-pricing is used, contents of the package must be disclosed. Pricing
source(s) and effective date(s) must also be reported.
A detailed list of all hardware and software, including the 3-year price, is provided in the Executive
Summary at the front of this report. The price quotations are included in Appendix F.
8.2 Three-Year Cost of System Configuration
The total 3-year price of the entire configuration must be reported, including hardware, software and
maintenance charges. Separate comp onent pricing is recommended. The basis of all disc ou nt s mu st be
disclosed.
A detailed list of all hardware and software, including the 3-year price, is provided in the Executive
Summary at the front of this report. The price quotations are included in Appendix F.
8.3 Availability Dates
The committed delivery date for general availability (availability date) of products used in the price
calculations must be reported. When the priced system includes products with different availability dates,
availability date reported on the Executive Summary must be the date by which all components are
committed to being available. The Full Disclosure Report must report availability dates individually for at
least each of the categories for which a pricing subtotal must be provided (see Clause 7.3.1.3).
The system as priced will be generally available August 15, 2005.
8.4 Country-Specific Pricing
Additional Clause 7 related items may be included in the Full Disclosure Report for each country-specific
priced configuration. Country-specific pricing is subject to Clause 7.1.7.
The configuration is priced for the United States of America.
©Copyright IBM Corporation TPC Benchmark H Full Disclosure Report May 2005 Page: 30
Page 33

9 Clause 8: Audit Related Items
9.1 Auditor’s Report
The auditor’s agency name, address, phone num ber, and Attestation letter with a brief audit summary
report indicating compliance must be included in the Full Disclosure Report. A statement should be
included specifying who to contact in order to obtain further information regarding the audit process.
This implementation of the TPC Benchmark H was audited by Francois Raab of InfoSizing, Inc. Further
information can be downloaded from www.tpc.org.
©Copyright IBM Corporation TPC Benchmark H Full Disclosure Report May 2005 Page: 31
Page 34

Appendix A: Tunable Parameters
and System Configuration
DB2 UDB 8.2 Database and Database
Manager Configuration
get database configuration for TPCD
Database Configuration for Database
TPCD
Database configuration release level
= 0x0a00
Database release level
= 0x0a00
Database territory
= US
Database code page
= 819
Database code set
= ISO8859-1
Database country/region code
= 1
Database collating sequence
= BINARY
Alternate collating sequence
(ALT_COLLATE) =
Dynamic SQL Query management
(DYN_QUERY_MGMT) = DISABLE
Discovery support for this database
(DISCOVER_DB) = ENABLE
Default query optimization class
(DFT_QUERYOPT) = 7
Degree of parallelism
(DFT_DEGREE) = 1
Continue upon arithmetic exceptions
(DFT_SQLMATHWARN) = NO
Default refresh age
(DFT_REFRESH_AGE) = 0
Default maintained table types for opt
(DFT_MTTB_TYPES) = SYSTEM
Number of frequent values retained
(NUM_FREQVALUES) = 0
Number of quantiles retained
(NUM_QUANTILES) = 600
Backup pending
= NO
Database is consistent
= NO
Rollforward pending
= NO
Restore pending
= NO
Multi-page file allocation enabled
= YES
Log retain for recovery status
= NO
User exit for logging status
= NO
Data Links Token Expiry Interval (sec)
(DL_EXPINT) = 60
Data Links Write Token Init Expiry
Intvl(DL_WT_IEXPINT) = 60
Data Links Number of Copies
(DL_NUM_COPIES) = 1
Data Links Time after Drop (days)
(DL_TIME_DROP) = 1
Data Links Token in Uppercase
(DL_UPPER) = NO
Data Links Token Algorithm
(DL_TOKEN) = MAC0
Database heap (4KB)
(DBHEAP) = 10000
Size of database shared memory (4KB)
(DATABASE_MEMORY) = AUTOMATIC
Catalog cache size (4KB)
(CATALOGCACHE_SZ) = (MAXAPPLS*4)
Log buffer size (4KB)
(LOGBUFSZ) = 2048
Utilities heap size (4KB)
(UTIL_HEAP_SZ) = 5000
Buffer pool size (pages)
(BUFFPAGE) = 70000
Extended storage segments size (4KB)
(ESTORE_SEG_SZ) = 16000
Number of extended storage segments
(NUM_ESTORE_SEGS) = 0
Max storage for lock list (4KB)
(LOCKLIST) = 40000
Max size of appl. group mem set (4KB)
(APPGROUP_MEM_SZ) = 2000
Percent of mem for appl. group heap
(GROUPHEAP_RATIO) = 70
Max appl. control heap size (4KB)
(APP_CTL_HEAP_SZ) = 512
Sort heap thres for shared sorts (4KB)
(SHEAPTHRES_SHR) = 250
Sort list heap (4KB)
(SORTHEAP) = 10000
SQL statement heap (4KB)
(STMTHEAP) = 10000
Default application heap (4KB)
(APPLHEAPSZ) = 1024
Package cache size (4KB)
(PCKCACHESZ) = (MAXAPPLS*8)
Statistics heap size (4KB)
(STAT_HEAP_SZ) = 4384
Interval for checking deadlock (ms)
(DLCHKTIME) = 10000
Percent. of lock lists per application
(MAXLOCKS) = 20
Lock timeout (sec)
(LOCKTIMEOUT) = -1
Changed pages threshold
(CHNGPGS_THRESH) = 60
Number of asynchronous page cleaners
(NUM_IOCLEANERS) = 2
Number of I/O servers
(NUM_IOSERVERS) = 4
Index sort flag
(INDEXSORT) = YES
Sequential detect flag
(SEQDETECT) = YES
©Copyright IBM Corporation TPC Benchmark H Full Disclosure Report May 2005 Page: 32
Page 35

Default prefetch size (pages)
(DFT_PREFETCH_SZ) = AUTOMATIC
Track modified pages
(TRACKMOD) = OFF
Default number of containers
= 1
Default tablespace extentsize (pages)
(DFT_EXTENT_SZ) = 32
Max number of active applications
(MAXAPPLS) = AUTOMATIC
Average number of active applications
(AVG_APPLS) = 1
Max DB files open per application
(MAXFILOP) = 1024
Log file size (4KB)
(LOGFILSIZ) = 50000
Number of primary log files
(LOGPRIMARY) = 4
Number of secondary log files
(LOGSECOND) = 1
Changed path to log files
(NEWLOGPATH) =
Path to log files
= /dev/raw/raw1
Overflow log path
(OVERFLOWLOGPATH) =
Mirror log path
(MIRRORLOGPATH) =
First active log file
=
Block log on disk full
(BLK_LOG_DSK_FUL) = NO
Percent of max active log space by
transaction(MAX_LOG) = 0
Num. of active log files for 1 active
UOW(NUM_LOG_SPAN) = 0
Group commit count
(MINCOMMIT) = 1
Percent log file reclaimed before soft
chckpt (SOFTMAX) = 360
Log retain for recovery enabled
(LOGRETAIN) = OFF
User exit for logging enabled
(USEREXIT) = OFF
HADR database role
= STANDARD
HADR local host name
(HADR_LOCAL_HOST) =
HADR local service name
(HADR_LOCAL_SVC) =
HADR remote host name
(HADR_REMOTE_HOST) =
HADR remote service name
(HADR_REMOTE_SVC) =
HADR instance name of remote server
(HADR_REMOTE_INST) =
HADR timeout value
(HADR_TIMEOUT) = 120
HADR log write synchronization mode
(HADR_SYNCMODE) = NEARSYNC
First log archive method
(LOGARCHMETH1) = OFF
Options for logarchmeth1
(LOGARCHOPT1) =
Second log archive method
(LOGARCHMETH2) = OFF
Options for logarchmeth2
(LOGARCHOPT2) =
Failover log archive path
(FAILARCHPATH) =
Number of log archive retries on error
(NUMARCHRETRY) = 5
Log archive retry Delay (secs)
(ARCHRETRYDELAY) = 20
Vendor options
(VENDOROPT) =
Auto restart enabled
(AUTORESTART) = ON
Index re-creation time and redo index build
(INDEXREC) = SYSTEM (RESTART)
Log pages during index build
(LOGINDEXBUILD) = OFF
Default number of loadrec sessions
(DFT_LOADREC_SES) = 1
Number of database backups to retain
(NUM_DB_BACKUPS) = 12
Recovery history retention (days)
(REC_HIS_RETENTN) = 366
TSM management class
(TSM_MGMTCLASS) =
TSM node name
(TSM_NODENAME) =
TSM owner
(TSM_OWNER) =
TSM password
(TSM_PASSWORD) =
Automatic maintenance
(AUTO_MAINT) = OFF
Automatic database backup
(AUTO_DB_BACKUP) = OFF
Automatic table maintenance
(AUTO_TBL_MAINT) = OFF
Automatic runstats
(AUTO_RUNSTATS) = OFF
Automatic statistics profiling
(AUTO_STATS_PROF) = OFF
Automatic profile updates
(AUTO_PROF_UPD) = OFF
Automatic reorganization
(AUTO_REORG) = OFF
DB2 Database Manager Configuration
Database Manager
get database manager configuration
Database Manager Configuration
Node type = Enterprise Server Edition
with local and remote clients
Database manager configuration release
level = 0x0a00
CPU speed (millisec/instruction)
(CPUSPEED) = 1.889377e-06
Communications bandwidth (MB/sec)
(COMM_BANDWIDTH) = 1.000000e+00
©Copyright IBM Corporation TPC Benchmark H Full Disclosure Report May 2005 Page: 33
Page 36

Max number of concurrently active databases
(NUMDB) = 1
Data Links support
(DATALINKS) = NO
Federated Database System Support
(FEDERATED) = NO
Transaction processor monitor name
(TP_MON_NAME) =
Default charge-back account
(DFT_ACCOUNT_STR) =
Java Development Kit installation path
(JDK_PATH) = /opt/IBMJava2-141
Diagnostic error capture level
(DIAGLEVEL) = 0
Notify Level
(NOTIFYLEVEL) = 0
Diagnostic data directory path
(DIAGPATH) =
Default database monitor switches
Buffer pool
(DFT_MON_BUFPOOL) = OFF
Lock
(DFT_MON_LOCK) = OFF
Sort
(DFT_MON_SORT) = OFF
Statement
(DFT_MON_STMT) = OFF
Table
(DFT_MON_TABLE) = OFF
Timestamp
(DFT_MON_TIMESTAMP) = OFF
Unit of work
(DFT_MON_UOW) = OFF
Monitor health of instance and databases
(HEALTH_MON) = OFF
SYSADM group name
(SYSADM_GROUP) =
SYSCTRL group name
(SYSCTRL_GROUP) =
SYSMAINT group name
(SYSMAINT_GROUP) =
SYSMON group name
(SYSMON_GROUP) =
Client Userid-Password Plugin
(CLNT_PW_PLUGIN) =
Client Kerberos Plugin
(CLNT_KRB_PLUGIN) =
Group Plugin
(GROUP_PLUGIN) =
GSS Plugin for Local Authorization
(LOCAL_GSSPLUGIN) =
Server Plugin Mode
(SRV_PLUGIN_MODE) = UNFENCED
Server List of GSS Plugins
(SRVCON_GSSPLUGIN_LIST) =
Server Userid-Password Plugin
(SRVCON_PW_PLUGIN) =
Server Connection Authentication
(SRVCON_AUTH) = NOT_SPECIFIED
Database manager authentication
(AUTHENTICATION) = SERVER
Cataloging allowed without authority
(CATALOG_NOAUTH) = NO
Trust all clients
(TRUST_ALLCLNTS) = YES
Trusted client authentication
(TRUST_CLNTAUTH) = CLIENT
Bypass federated authentication
(FED_NOAUTH) = NO
Default database path
(DFTDBPATH) = /home/tpch
Database monitor heap size (4KB)
(MON_HEAP_SZ) = 90
Java Virtual Machine heap size (4KB)
(JAVA_HEAP_SZ) = 2048
Audit buffer size (4KB)
(AUDIT_BUF_SZ) = 0
Size of instance shared memory (4KB)
(INSTANCE_MEMORY) = AUTOMATIC
Backup buffer default size (4KB)
(BACKBUFSZ) = 1024
Restore buffer default size (4KB)
(RESTBUFSZ) = 1024
Sort heap threshold (4KB)
(SHEAPTHRES) = 100000
Directory cache support
(DIR_CACHE) = YES
Application support layer heap size (4KB)
(ASLHEAPSZ) = 15
Max requester I/O block size (bytes)
(RQRIOBLK) = 32767
Query heap size (4KB)
(QUERY_HEAP_SZ) = 1000
Workload impact by throttled
utilities(UTIL_IMPACT_LIM) = 10
Priority of agents
(AGENTPRI) = SYSTEM
Max number of existing agents
(MAXAGENTS) = 400
Agent pool size
(NUM_POOLAGENTS) = 64
Initial number of agents in pool
(NUM_INITAGENTS) = 4
Max number of coordinating agents
(MAX_COORDAGENTS) = (MAXAGENTS NUM_INITAGENTS)
Max no. of concurrent coordinating agents
(MAXCAGENTS) = MAX_COORDAGENTS
Max number of client connections
(MAX_CONNECTIONS) = MAX_COORDAGENTS
Keep fenced process
(KEEPFENCED) = YES
Number of pooled fenced processes
(FENCED_POOL) = MAX_COORDAGENTS
Initial number of fenced processes
(NUM_INITFENCED) = 0
Index re-creation time and redo index build
(INDEXREC) = RESTART
Transaction manager database name
(TM_DATABASE) = 1ST_CONN
Transaction resync interval (sec)
(RESYNC_INTERVAL) = 180
SPM name
(SPM_NAME) =
©Copyright IBM Corporation TPC Benchmark H Full Disclosure Report May 2005 Page: 34
Page 37

SPM log size
(SPM_LOG_FILE_SZ) = 256
SPM resync agent limit
(SPM_MAX_RESYNC) = 20
SPM log path
(SPM_LOG_PATH) =
TCP/IP Service name
(SVCENAME) = DB2_tpch_SVC
Discovery mode
(DISCOVER) = SEARCH
Discover server instance
(DISCOVER_INST) = ENABLE
Maximum query degree of parallelism
(MAX_QUERYDEGREE) = ANY
Enable intra-partition parallelism
(INTRA_PARALLEL) = NO
No. of int. communication
buffers(4KB)(FCM_NUM_BUFFERS) = 16384
Number of FCM request blocks
(FCM_NUM_RQB) = 8192
Number of FCM connection entries
(FCM_NUM_CONNECT) = AUTOMATIC
Number of FCM message anchors
(FCM_NUM_ANCHORS) = AUTOMATIC
Node connection elapse time (sec)
(CONN_ELAPSE) = 20
Max number of node connection retries
(MAX_CONNRETRIES) = 5
Max time difference between nodes (min)
(MAX_TIME_DIFF) = 1440
db2start/db2stop timeout (min)
(START_STOP_TIME) = 10
DB2 Registry Variables
DB2NOLIOAIO=no
DB2_EXTENDED_OPTIMIZATION=Y
DB2_ANTIJOIN=Y
DB2_LIKE_VARCHAR=Y,Y
DB2BPVARS=/home/custom/bpvar.cfg
DB2RQTIME=30
DB2OPTIONS=-t -v +c
DB2COMM=tcpip
DB2BQTRY=120
DB2_PARALLEL_IO=*
Linux Parameters
kernel.shmmax=268435456
kernel.shmmni=4096
kernel.msgmni=1024
fs.file-max=8129
kernel.sem="250 32000 32 1024"
vm.swappiness=0
Appendix B: Database Build Scripts
buildtpcd
#!/usr/bin/perl
# usage buildtpcd [QUAL]
# ASSUMPTIONS: all ddl files have commits in
them!
($myName = $0) =~ s@.*/@@; $usage="
Usage: buildtpcd [QUAL]
where QUAL is the optional parameter
saying to build the qualification
database (sf = .1 =
100MB)\n";
$qual="";
if (@ARGV == 1){
$qual = $ARGV[0];
}
# get TPC-D specific environment variables
require "getvars";
require "macro.pl";
require "tpcdmacro.pl";
require "version";
$timestamp=`perl gettimestamp "short"`;
# Make output unbuffered.
open(STDOUT, "| tee
buildtpcd.out.${timestamp}");
select(STDOUT);
$| = 1 ;
#-------------------------------------------
--------------------------------#
# verify that necessary environment
variables for building the database #
# are present. Default those that aren't
necessary #
#-------------------------------------------
--------------------------------#
# variables that must be specified for
script to run
@reqVars = ("TPCD_PLATFORM",
"TPCD_PRODUCT",
"TPCD_VERSION",
"TPCD_DBNAME",
"TPCD_MODE",
"TPCD_SF",
"TPCD_DDLPATH",
"TPCD_AUDIT",
"TPCD_AUDIT_DIR",
"TPCD_BUILD_STAGE");
# variables default to 'NULL' if unspecified
@defNullVars = ("TPCD_LOAD_SCRIPT",
"TPCD_LOAD_SCRIPT_QUAL",
"TPCD_INPUT",
"TPCD_QUAL_INPUT",
"TPCD_DBGEN",
"TPCD_LOGPRIMARY",
"TPCD_LOGSECOND",
"TPCD_LOGFILSIZ",
"TPCD_LOG_DIR",
"TPCD_MACHINE",
"TPCD_AGENTPRI",
"TPCD_STAGING_TABLE_DDL",
"TPCD_PRELOAD_STAGING_TABLE_SCRIPT",
"TPCD_DELETE_STAGING_TABLE_SQL",
"TPCD_RUNSTATSHORT",
"TPCD_ADD_RI",
"TPCD_AST",
"TPCD_DBM_CONFIG",
"TPCD_EXPLAIN_DDL",
©Copyright IBM Corporation TPC Benchmark H Full Disclosure Report May 2005 Page: 35
Page 38

"TPCD_NODEGROUP_DEF",
"TPCD_BUFFERPOOL_DEF",
"TPCD_LOAD_DB2SET_SCRIPT",
"TPCD_DB2SET_SCRIPT",
"TPCD_LOG_DIR_SETUP_SCRIPT",
"TPCD_LOAD_CONFIGFILE",
"TPCD_LOAD_DBM_CONFIGFILE",
"TPCD_TEMP");
&setVar(@reqVars, "ERROR");
&setVar(@defNullVars, "NULL");
if ( $qual eq "QUAL" ){
@reqQualVars = ("TPCD_QUAL_DBNAME",
"TPCD_QUAL_DDL",
"TPCD_QUAL_TBSP_DDL",
"TPCD_QUALCONFIGFILE",
"TPCD_DBM_QUALCONFIG",
"TPCD_LOAD_QUALCONFIGFILE",
"TPCD_LOAD_DBM_QUALCONFIGFILE");
&setVar(@reqQualVars, "ERROR");
if ( ($ENV{"TPCD_QUAL_INPUT"}) eq "NULL"
){
if ((($ENV{"TPCD_DBGEN"}) eq "NULL")
||
(($ENV{"TPCD_TEMP"}) eq
"NULL")){
die "TPCD_DBGEN and TPCD_TEMP
must be set if flatfiles are not
provided.\n";
}
}
}
$platform=$ENV{"TPCD_PLATFORM"};
if (length($ENV{"TPCD_DBPATH"}) <= 0){
# if no db pathname specified, build the
db in the home directory
if ( $platform eq "aix" ||
$platform eq "sun" ||
$platform eq "ptx" ||
$platform eq "hp" ||
$platform eq "linux"){
$ENV{"TPCD_DBPATH"} = $ENV{"HOME"};
}
elsif ( $platform eq "nt" ){
$ENV{"TPCD_DBPATH"} =
$ENV{"HOMEDRIVE"};
}
else{
die "platform '$platform' not
supported yet\n";
}
}
if ( ($ENV{"TPCD_INPUT"}) eq "NULL" ){
if ((($ENV{"TPCD_DBGEN"}) eq "NULL") ||
(($ENV{"TPCD_TEMP"}) eq "NULL")){
die "TPCD_DBGEN and TPCD_TEMP must
be set if flatfiles are not provided.\n";
}
}
#-------------------------------------------
--------------------------------#
# ddl script files found under custom
directory #
#-------------------------------------------
--------------------------------#
if (length($ENV{"TPCD_DDL"}) <= 0){
$ENV{"TPCD_DDL"} = "dss.ddl";
}
if (length($ENV{"TPCD_TBSP_DDL"}) <= 0){
$ENV{"TPCD_TBSP_DDL"} = "dss.tbsp.ddl";
}
if (length($ENV{"TPCD_INDEXDDL"}) <= 0){
$ENV{"TPCD_INDEXDDL"} = "dss.index";
}
if (length($ENV{"TPCD_RUNSTATS"}) <= 0){
$ENV{"TPCD_RUNSTATS"} = "dss.runstats";
}
if (length($ENV{"TPCD_CONFIGFILE"}) <= 0){
$ENV{"TPCD_CONFIGFILE"} =
"dss.dbconfig";
}
#-------------------------------------------
--------------------------------#
# other settings
#
#-------------------------------------------
--------------------------------#
if (length($ENV{"TPCD_BACKUP_DIR"}) <= 0){
$ENV{"TPCD_BACKUP_DIR"} =
"${delim}dev${delim}null";
}
if (length($ENV{"TPCD_COPY_DIR"}) <= 0){
$ENV{"TPCD_COPY_DIR"} =
"${delim}dev${delim}null";
}
if (length($ENV{"TPCD_TEMP"}) <= 1){
$ENV{"TPCD_TEMP"} =
"/u/$instance/sqllib/tmp";
}
if (length($ENV{"TPCD_PHYS_NODE"}) <= 0){
$ENV{"TPCD_NODEGROUP_DEF"}="NULL"
}
if (length($ENV{"TPCD_GENERATE_SEED_FILE"})
<= 0){
$ENV{"TPCD_GENERATE_SEED_FILE"} = "no";
}
if (length($ENV{"TPCD_SORTBUF"}) <= 0){
$ENV{"TPCD_SORTBUF"} = 4096;
}
if (length($ENV{"TPCD_LOAD_PARALLELISM"}) <=
0){
$ENV{"TPCD_LOAD_PARALLELISM"} = 0;
}
if (length($ENV{"TPCD_LOADSTATS"}) <= 0){
$ENV{"TPCD_LOADSTATS"} = "no";
}
if (length($ENV{"TPCD_FASTPARSE"}) <= 0){
$ENV{"TPCD_FASTPARSE"} = "no";
}
if (length($ENV{"TPCD_LOG"}) <= 0){
$ENV{"TPCD_LOG"} = "no";
}
if (length($ENV{"TPCD_SMPDEGREE"}) <= 0 ){
©Copyright IBM Corporation TPC Benchmark H Full Disclosure Report May 2005 Page: 36
Page 39

$ENV{"TPCD_SMPDEGREE"} = 1;
}
if (length($ENV{"TPCD_ACTIVATE"}) <= 0){
$ENV{"TPCD_ACTIVATE"} = "no";
}
if (length($ENV{"TPCD_APPEND_ON"}) <= 0){
$ENV{"TPCD_APPEND_ON"}="yes"
}
if (length($ENV{"TPCD_GENERATE_SEED_FILE"})
<= 0){
$ENV{"TPCD_GENERATE_SEED_FILE"}="no";
}
#setup global variables
$tpcdVersion= $ENV{"TPCD_VERSION"};
$buildStage=
$ENV{"TPCD_BUILD_STAGE"};
$mode= $ENV{"TPCD_MODE"};
$delim =
$ENV{"TPCD_PATH_DELIM"};
$sep = $ENV{"COMMAND_SEP"};
$ddlpath= $ENV{"TPCD_DDLPATH"};
$extraindex=
$ENV{"TPCD_EXTRAINDEX"};
$earlyindex=
$ENV{"TPCD_EARLYINDEX"};
$loadstats=
$ENV{"TPCD_LOADSTATS"};
$addRI= $ENV{"TPCD_ADD_RI"};
$astFile= $ENV{"TPCD_AST"};
$genSeed=
$ENV{"TPCD_GENERATE_SEED_FILE"};
$log= $ENV{"TPCD_LOG"};
$activate=
$ENV{"TPCD_ACTIVATE"};
$RealAudit= $ENV{"TPCD_AUDIT"};
$auditDir=
$ENV{"TPCD_AUDIT_DIR"};
$loadsetScript=
$ENV{"TPCD_LOAD_DB2SET_SCRIPT"};
$user= $ENV{"USER"};
$logDirScript=
$ENV{"TPCD_LOG_DIR_SETUP_SCRIPT"};
$logprimary=
$ENV{"TPCD_LOGPRIMARY"};
$logsecond=
$ENV{"TPCD_LOGSECOND"};
$logfilsiz=
$ENV{"TPCD_LOGFILSIZ"};
$dbpath = $ENV{"TPCD_DBPATH"};
$explainDDL=
$ENV{"TPCD_EXPLAIN_DDL"};
$platform=
$ENV{"TPCD_PLATFORM"};
$buffpooldef=
$ENV{"TPCD_BUFFERPOOL_DEF"};
$stagingTbl =
$ENV{"TPCD_STAGING_TABLE_DDL"};
$preloadSampleUF=
$ENV{"TPCD_PRELOAD_STAGING_TABLE_SCR
IPT"};
$deleteSampleUF=
$ENV{"TPCD_DELETE_STAGING_TABLE_SQL"
};
$machine= $ENV{"TPCD_MACHINE"};
$runstatShort =
$ENV{"TPCD_RUNSTATSHORT"};
$runstats =
$ENV{"TPCD_RUNSTATS"};
$smpdegree =
$ENV{"TPCD_SMPDEGREE"};
$agentpri =
$ENV{"TPCD_AGENTPRI"};
$setScript =
$ENV{"TPCD_DB2SET_SCRIPT"};
$backupdir =
$ENV{"TPCD_BACKUP_DIR"};
$nodegroupdef=
$ENV{"TPCD_NODEGROUP_DEF"};
$dbgen= $ENV{"TPCD_DBGEN"};
$appendOn=
$ENV{"TPCD_APPEND_ON"};
$indexddl=
$ENV{"TPCD_INDEXDDL"};
if($qual eq "QUAL"){
$logDir=
$ENV{"TPCD_LOG_QUAL_DIR"};
$dbname=
$ENV{"TPCD_QUAL_DBNAME"};
$input=
$ENV{"TPCD_QUAL_INPUT"};
$sf= $ENV{"TPCD_QUAL_SF"};
$loadconfigfile=$ENV{"TPCD_LOAD_QUAL
CONFIGFILE"};
$loadDBMconfig=
$ENV{"TPCD_LOAD_DBM_QUALCONFIGFILE"}
;
$loadscript =
$ENV{"TPCD_LOAD_SCRIPT_QUAL"};
$configfile =
$ENV{"TPCD_QUALCONFIGFILE"};
$dbmconfig =
$ENV{"TPCD_DBM_QUALCONFIG"};
$ddl=
$ENV{"TPCD_QUAL_DDL"};
$tbspddl=
$ENV{"TPCD_QUAL_TBSP_DDL"};
}else{
$logDir= $ENV{"TPCD_LOG_DIR"};
$dbname= $ENV{"TPCD_DBNAME"};
$input= $ENV{"TPCD_INPUT"};
$sf= $ENV{"TPCD_SF"};
$loadconfigfile=$ENV{"TPCD_LOAD_CONF
IGFILE"};
$loadDBMconfig=
$ENV{"TPCD_LOAD_DBM_CONFIGFILE"};
$loadscript =
$ENV{"TPCD_LOAD_SCRIPT"};
$configfile =
$ENV{"TPCD_CONFIGFILE"};
$dbmconfig =
$ENV{"TPCD_DBM_CONFIG"};
$ddl= $ENV{"TPCD_DDL"};
$tbspddl=
$ENV{"TPCD_TBSP_DDL"};
}
if (( $mode eq "uni" ) || ( $mode eq "smp"
)){
$all_ln="once";
$all_pn="once";
$once="once";
}
else{
$all_ln="all_ln";
$all_pn="all_pn";
$once="once";
}
©Copyright IBM Corporation TPC Benchmark H Full Disclosure Report May 2005 Page: 37
Page 40

#-------------------------------------------
--------------------------------#
# echo parameter settings to acknowledge
what is being built #
# and set db2set options for database load
#
#-------------------------------------------
--------------------------------#
&printSummary;
print "\nSleeping for 15 seconds to give you
a chance to reconsider...\n";
sleep 15;
if ( $platform eq "nt" ){
if (($mode eq "uni") || ($mode eq
"smp")){
#spaces required for NT
$rc=&dodb_noconn("db2set
DB2OPTIONS=\" -t -v +c\";db2set
DB2NTNOCACHE=ON",$all_ln);
}
else{
$rc=&dodb_noconn("db2set
DB2OPTIONS=\\\" -t -v +c\\\";db2set
DB2NTNOCACHE=ON",$all_ln);
}
}
else{
if (($mode eq "uni") || ($mode eq
"smp")){
$rc=&dodb_noconn("db2set
DB2OPTIONS=\"-t -v +c\"",$all_ln);
}
else{
# $rc=&dodb_noconn("db2set
DB2OPTIONS=\\\"-t -v +c\\\"",$all_ln);
}
}
if ( $rc != 0 ){
die "failure setting db2 environment
variable : rc = $rc\n";
}
#-------------------------------------------
--------------------------------#
# set the db2 env vars for loading, from the
TPCD_LOAD_DB2SET_SCRIPT script #
#-------------------------------------------
--------------------------------#
if ( $loadsetScript ne "NULL" )
{
if ( $platform eq "nt" ){
if (( $mode eq "uni" ) || ( $mode eq
"smp" )){
$rc=system("${ddlpath}${delim}$loadsetScript
");
}
else{
$rc=system(" rah \" cd
${ddlpath} & $loadsetScript\" ");
}
}
else{
$rc=system("${ddlpath}${delim}$loadsetScript
");
}
($rc == 0) || die "failure loading
db2set parms from $loadsetScript \n";
}
!&stopStart || die;
#-------------------------------------------
--------------------------------#
# Begin complete build: TPCD_BUILDSTAGE =
ALL #
#-------------------------------------------
--------------------------------#
if($buildStage eq "ALL") {
#create the database
$rc = &createDb;
($rc == 0) || die "ERROR: create
database failed. rc = $rc\n ";
&setLog;
};
$rc = &setLoadConfig;
#-------------------------------------------
--------------------------------#
# Begin build from CreateTablespace or early
Indexes #
#-------------------------------------------
--------------------------------#
if( $buildStage eq "ALL" ||
$buildStage eq "CRTTBSP" ||
($buildStage eq "INDEX" && $earlyindex
eq "yes")){
!&createNodegroups || print "ERROR:
create nodegroups failed.\n";
!&createBufferPools || print "ERROR:
create bufferpools failed.\n";
&outtime("*** Start of audited Load
Time - starting to create tables");
!&createTablespaces || print
"WARNING: create tablespaces error.\n";
!&createExplainTbls || print
"ERROR: create EXPLAIN tables failed.\n";
!&createTables || print "ERROR:
create tables failed.\n";
mkdir("${delim}tmp${delim}$instance"
,0777);
# if earlyindex requested, create
indexes
if ( $earlyindex eq "yes" ){
!&createIndexes("early") ||
die "ERROR: create early indexes failed.\n";
}
# start the dbgen and load.....call
the specific mode for loading (uni,smp,mln)
!&loadData || die "ERROR: failure
during load data\n";
# remove the update.pair.num file so
when setupDir runs, it doesn't
# hang waiting for an answer on nt
&rm("$auditDir${delim}$dbname.$user.
update.pair.num");
# verify that the audit directory
exists
$filename="$auditDir";
if (-e $filename){
# set up the
$auditDir/$dbname.$user.update.pair.num file
©Copyright IBM Corporation TPC Benchmark H Full Disclosure Report May 2005 Page: 38
Page 41

# to start at update pair 1
$filename="$auditDir${delim}$dbname.
$user.update.pair.num";
}else{
mkdir ("$auditDir", 0775) ||
die "cannot mkdir $auditDir";
}
print "setting update pair num to
1\n";
system("echo 1 > $filename");
};
#-------------------------------------------
--------------------------------#
# Begin build from Index or Load
#
#-------------------------------------------
--------------------------------#
if( $buildStage eq "ALL" ||
$buildStage eq "CRTTBSP" ||
$buildStage eq "LOAD" ||
$buildStage eq "INDEX"){
# if indexes haven't been created,
do so now
if ( $earlyindex ne "yes" ){
!&createIndexes("normal") ||
die "ERROR: create indexes failed.\n";
}
if ( $extraindex ne "no" ){
!&createIndexes("extra") ||
die "ERROR: create extra indexes failed.\n";
}
}; # end create/load/index phase of the
build
#-------------------------------------------
--------------------------------#
# Begin build from runstats
#
#-------------------------------------------
--------------------------------#
if( $buildStage eq "ALL" ||
$buildStage eq "CRTTBSP" ||
$buildStage eq "LOAD" ||
$buildStage eq "INDEX" ||
$buildStage eq "RUNSTATS"){
# if statistics not gathered on the
load, run runstats (we have to run the
# stats at the same time as the
index creation whether it be both during
load,
# or after load)
# We need to run the runstats as
well if we have specifed an extra index file
# for "after load" indexes
if (( $loadstats eq "no" ) || (
$earlyindex eq "no" ) || ( $extraindex ne
"no" )){
&doRunStats;
}
};
#-------------------------------------------
--------------------------------#
# End build phase: all/load/index/runstats
#
#-------------------------------------------
--------------------------------#
# Add RI/AST, set run configuration
#
#-------------------------------------------
--------------------------------#
if ( $addRI ne "NULL" ){
&outtime("*** Adding RI contraints
started");
&dodb2file($dbname,"$ddlpath${delim}$addRI",
$once);
&outtime("*** Adding RI contraints
completed");
}
#add the AST if it has been requested
if ( $astFile ne "NULL" ){
&outtime("*** Adding AST started");
&dodb2file($dbname,"$ddlpath${delim}$astFile
",$once);
&outtime("*** Adding AST completed");
}
# check tbsp info
&dodb_conn($dbname,"db2 list tablespaces
show detail",$once);
# set the configuration
&outtime("*** Set Configuration started");
#&outtime("*** Setting degree of
parallelism");
&setConfiguration;
# if logging is enabled, we must take a
backup of the database
if ( $log eq "yes" ){
&createBackup;
}
# stop and restart the database to get
config parms recognized
!&stopStart || die;
&outtime("*** Set Configuration completed");
&outtime("*** End of audited Load Time");
#create generated seeds
if ( $genSeed ne "no" ){
$rc = system("perl createmseedme.pl
1000");
($rc != 0) || warn "createmseedme
failed\n";
}
#-------------------------------------------
--------------------------------#
# Call buildptpcdbatch to compile tpcdbatch
#
#-------------------------------------------
--------------------------------#
# - if we are in real audit mode then we
have to do a number of things #
# set up the audit directory structure
and the run directory structure #
# so that once we have completed the
buildtpcd, we are ready to run. #
©Copyright IBM Corporation TPC Benchmark H Full Disclosure Report May 2005 Page: 39
Page 42

# first remove any old "update pair
number" file so we won't be prompted #
# doing setupDir.
#
# - before we stop the database for the
final time #
# if we are in the real audit mode then
run dbtables and dbcheck before #
# we print out the notice that we're
ready to run performance tests #
# if we are building the qualification
database then we'll bind to both #
# the dbname database and the
qualification database #
#-------------------------------------------
--------------------------------#
$rc = system("perl buildtpcdbatch $qual");
($rc == 0 ) || die "buildtpcdbatch failed
rc=$rc\n";
if ( $RealAudit eq "yes" ){
&rm("$auditDir${delim}tools${delim}t
pcd.runsetup");
system("perl setupRun");
if ( $qual eq "QUAL" ){
$verifyType="q";
}
else{
$verifyType="t";
}
system("perl tablesdb $verifyType");
&dodb2file($dbname,"$auditDir${delim
}tools${delim}first10rows.sql",$once);
}
#-------------------------------------------
--------------------------------#
# Create Catalog info
#
#-------------------------------------------
--------------------------------#
$rc = system("perl catinfo.pl b");
($rc == 0 ) || warn "catinfo failed!!! rc =
$rc\n";
$rc=system("db2stop");
($rc == 0 ) || die "failure during db2stop
rc = $rc \n";
&outtime("*** Ready to run the performance
tests once the dbm has restarted");
if ( $RealAudit ne "yes" ){
# if we are not in a real audit, then we
can restart the database manager
# if we are in a real audit, then we
don't want to do this until the
# power test starts
$rc=system("db2start");
($rc == 0 ) || die "failure during
db2start rc = $rc \n";
if ( $activate eq "yes" ){
&dodb_noconn("activate database
$dbname",$once);
}
}
&outtime("*** Finished creating the
database");
#-------------------------------------------
--------------------------------#
# finished creating the database
#
#-------------------------------------------
--------------------------------#
#-------------------------------------------
--------------------------------#
# Function: setLog
#
#-------------------------------------------
--------------------------------#
sub setLog{
# update the log information first
# set up the log directory before we
do any index creation
my $rc;
my $setLogs;
my $setLogString;
if ($logDirScript ne "NULL"){
system ("perl
$ddlpath${delim}$logDirScript");
}
elsif ( $logDir ne "NULL" ){
&dodb_noconn("db2 update
database configuration for $dbname using
newlogpath $logDir",$all_ln);
}
$setLogs=0;
$setLogString="";
if ( $logprimary ne "NULL" ){
$setLogString.="db2 update db
cfg for $dbname using logprimary
$logprimary";
$setLogs=1;
}
if ( $logsecond ne "NULL" ){
if ( $setLogs != 0 ){
$setLogString.=" $sep ";
}
$setLogString.="db2 update db
cfg for $dbname using logsecond $logsecond";
$setLogs=1;
}
if ( $logfilsiz ne "NULL" ){
if ( $setLogs != 0 ){
$setLogString.=" $sep ";
}
$setLogString.="db2 update db
cfg for $dbname using logfilsiz $logfilsiz";
$setLogs=1;
}
if ( $setLogs != 0 ){
$setLogString.=" $sep ";
}
$setLogString.="db2 update db cfg
for $dbname using logbufsz 128";
# $rc =
&dodb_noconn("$setLogString",$all_ln);
}
#-------------------------------------------
--------------------------------#
# Function: createDb
#
©Copyright IBM Corporation TPC Benchmark H Full Disclosure Report May 2005 Page: 40
Page 43

#-------------------------------------------
--------------------------------#
sub createDb{
&outtime("*** Starting to create the
database");
# setup required variables
my $rc;
$rc = &dodb_noconn("db2 \"create
database $dbname on $dbpath collate using
identity with 'TPC-D $sf GB'\"",$once);
($rc == 0) || return($rc);
# reset the db and dbm configuration
before we start
&dodb_noconn("db2 reset database
configuration for $dbname",$all_ln);
&dodb_conn($dbname,"db2 alter
bufferpool ibmdefaultbp size -1 $sep \
db2 grant connect on database
to public $sep \
db2 grant dbadm on database to
$dbname $sep \
db2 commit",$once);
&dodb_noconn("db2 reset database
manager configuration",$once);
}
#-------------------------------------------
--------------------------------#
# Function: createNodegroups
#
#-------------------------------------------
--------------------------------#
sub createNodegroups{
&outtime("*** Creating the
nodegroups.");
my $rc;
if ( $nodegroupdef ne "NULL"){
$rc =
&dodb2file($dbname,"$ddlpath${delim}$nodegro
updef",$once);
}
}
#-------------------------------------------
--------------------------------#
# Function: createExplainTbls
#
#-------------------------------------------
--------------------------------#
sub createExplainTbls{
&outtime("*** Creating the EXPLAIN
tables.");
my $rc;
my $explnPathFile;
my $home;
my $sqlpath;
if ( $explainDDL ne "NULL" ){
$explnPathFile="$explainDDL";
}
else{
if ( $platform eq "ptx" ){
$home=$ENV{"HOME"};
$sqlpath="$home${delim}sqllib";
}
if ( $platform ne "nt" ){
$home=$ENV{"HOME"};
$sqlpath="$home${delim}sqllib";
}
else{
$sqlpath=$ENV{"DB2PATH"};
}
$explnPathFile="$sqlpath${delim}misc
${delim}EXPLAIN.DDL";
}
$rc = &dodb_conn($dbname,
"db2 -tvf $explnPathFile $sep \
db2 alter table explain_instance
locksize table append on $sep \
db2 alter table explain_statement
locksize table append on $sep \
db2 alter table explain_argument
locksize table append on $sep \
db2 alter table explain_object
locksize table append on $sep \
db2 alter table explain_operator
locksize table append on $sep \
db2 alter table explain_predicate
locksize table append on $sep \
db2 alter table explain_stream
locksize table append on",
$once);
}
#-------------------------------------------
--------------------------------#
# Function: createBufferPools
#
#-------------------------------------------
--------------------------------#
sub createBufferPools{
my $rc;
&outtime("*** Creating the
bufferpools");
if ( $buffpooldef ne "NULL" ){
#run the create bufferpool
ddl
$rc =
&dodb2file($dbname,"$ddlpath${delim}$buffpoo
ldef",$once);
}
}
#-------------------------------------------
--------------------------------#
# Function: createTablespaces
#
#-------------------------------------------
--------------------------------#
sub createTablespaces{
&outtime("*** Ready to start
creating the tablespaces");
# setup required variables
my $rc;
$rc =
&dodb2file($dbname,"$ddlpath${delim}$tbspddl
",$once);
($rc == 0) || return $rc;
# create/populate the staging tables
if ( $stagingTbl ne "NULL" ){
# staging tables must be
created for both test and qualification
database
# but they do not need to be
populated for the qualification database
$rc =
&dodb2file($dbname,"$ddlpath${delim}$staging
Tbl",$once);
($rc == 0) || return $rc;
©Copyright IBM Corporation TPC Benchmark H Full Disclosure Report May 2005 Page: 41
Page 44

if ( $qual ne "QUAL" ){
if ( $preloadSampleUF
ne "NULL" ){
# preload the
sample UF data for statistics gathering
$rc = system
("perl $ddlpath${delim}$preloadSampleUF");
#($rc == 0) ||
return $rc;
}
if ( $deleteSampleUF
ne "NULL" ){
# delete the
sample rows now that stats have been
gathered
$rc =
&dodb2file($dbname,"$ddlpath${delim}$deleteS
ampleUF",$once);
#($rc == 0) ||
return $rc;
}
}
}
}
#-------------------------------------------
--------------------------------#
# Function: createTables
#
#-------------------------------------------
--------------------------------#
sub createTables{
my $rc;
$rc =
&dodb2file($dbname,"$ddlpath${delim}$ddl",$o
nce);
($rc == 0) || return $rc;
# update the locksize on the nonupdated tables to be table level locking
# update the tables for appendmode
if ($appendOn eq "yes"){
$rc = &dodb_conn($dbname,
"db2 alter table
tpcd.nation locksize table $sep \
db2 alter table
tpcd.region locksize table $sep \
db2 alter table
tpcd.customer locksize table $sep \
db2 alter table
tpcd.supplier locksize table $sep \
db2 alter table
tpcd.part locksize table $sep \
db2 alter table
tpcd.partsupp locksize table $sep \
# db2 alter table
tpcd.lineitem append on $sep \
# db2 alter table
tpcd.orders append on",
$once);
}
else{
$rc = &dodb_conn($dbname,
"db2 alter table
tpcd.nation locksize table $sep \
db2 alter table
tpcd.region locksize table $sep \
db2 alter table
tpcd.customer locksize table $sep \
db2 alter table
tpcd.supplier locksize table $sep \
db2 alter table
tpcd.part locksize table $sep \
db2 alter table
tpcd.partsupp locksize table $sep \
db2 alter table
tpcd.lineitem pctfree 0 $sep \
db2 alter table
tpcd.orders pctfree 0",
$once);
}
}
#-------------------------------------------
--------------------------------#
# Function: createIndexes
#
#-------------------------------------------
--------------------------------#
sub createIndexes{
# setup required variables
local @args = @_;
my $indexType = @args[0];
my $rc;
&outtime("*** Starting to create
$indexType indexes");
if( $indexType eq "extra"){
$rc =
&dodb2file($dbname,"$ddlpath${delim}$extrain
dex",$once);
}elsif ($indexType eq "early" ||
$indexType eq "normal"){
$rc =
&dodb2file($dbname,"$ddlpath${delim}$indexdd
l",$once);
}
&outtime("*** Create $indexType
index completed");
return $rc;
}
#-------------------------------------------
--------------------------------#
# Function: setLoadConfig
#
#-------------------------------------------
--------------------------------#
sub setLoadConfig{
&outtime("*** Setting LOAD
configuration.");
my $rc;
my $buffpage;
my $sortheap;
my $sheapthres;
my $util_heap_sz;
my $ioservers;
my $ioclnrs= 1;
my $chngpgs= 60;
if ($loadconfigfile eq "NULL"){
if ( $machine eq "small" ){
$buffpage = 5000;
$sortheap = 3000;
$sheapthres = 8000;
$util_heap_sz = 5000;
$ioservers = 6;
}
©Copyright IBM Corporation TPC Benchmark H Full Disclosure Report May 2005 Page: 42
Page 45

elsif ( $machine eq "medium"
){
$buffpage = 10000;
$sortheap = 8000;
$sheapthres = 20000;
$util_heap_sz =
10000;
$ioservers = 10;
}
elsif ( $machine eq "big" ){
$buffpage = 30000;
$sortheap = 20000;
$sheapthres = 50000;
$util_heap_sz =
30000;
$ioservers = 20;
}
else {
die "Neither a LOAD
config filename nor a valid machine size has
\
been specified!\n";
}
$rc = &dodb_noconn("db2
update db cfg for $dbname using buffpage
$buffpage $sep \
db2 update db cfg for $dbname
using sortheap $sortheap $sep \
db2 update db cfg for $dbname
using num_iocleaners $ioclnrs $sep \
db2 update db cfg for $dbname
using num_ioservers $ioservers $sep \
db2 update db cfg for $dbname
using util_heap_sz $util_heap_sz $sep \
db2 update db cfg for $dbname
using chngpgs_thresh $chngpgs",$all_ln);
}
else{
$rc =
&dodb2file_noconn("$ddlpath${delim}$loadconf
igfile",$all_ln);
}
($rc == 0) || return $rc;
if($loadDBMconfig ne "NULL"){
$rc =
&dodb2file_noconn("$ddlpath${delim}$loadDBMc
onfig",$once);
}
else{
$rc = &dodb_noconn("db2
update dbm cfg using sheapthres
$sheapthres",$once);
}
($rc == 0) || return $rc;
&dodb_noconn("db2 terminate",$once);
$rc = &stopStart;
return $rc;
}
#-------------------------------------------
--------------------------------#
# Function: loadData
#
#-------------------------------------------
--------------------------------#
sub loadData{
# start the dbgen and load.....call
the specific mode for loading (uni,smp,mln)
my $rc;
if (( $mode eq "uni" ) || ( $mode eq
"smp" )){
&outtime("*** Starting the
load");
# call the appropriate
dbgen/load for uni/smp
if ( $loadscript eq "NULL"){
$rc = system("perl
genloaduni $qual");
($rc == 0) || print
"ERROR: genloaduni failed rc = $rc\n";
}
else{
$rc =
&dodb2file_noconn("$ddlpath${delim}$loadscri
pt",$once);
($rc == 0) || print
"ERROR: load script: $loadscript failed. rc
= $rc\n";
}
}
elsif (( $mode eq "mln" ) || ( $mode
eq "mpp" )){
&outtime("*** Starting the
load");
# call the appropriate
dbgen/split/(sort)/load for mln/mpp
if ( $loadscript eq "NULL"){
$rc = system("perl
genloadmpp $qual");
($rc == 0) || print
"ERROR: genloadmpp failed. rc = $rc\n";
}
else{
system("$ddlpath${delim}$loadscript"
);
#$rc =
&dodb2file_noconn("$ddlpath${delim}$loadscri
pt $sf");
#($rc == 0) || print
"ERROR: load script $loadscript failed. rc =
$rc\n";
}
}
else{
print "TPCD_MODE not set to
one of uni, smp, mln or mpp\n";
$rc = 1;
}
($rc == 0) || &outtime("*** Load
complete");
return $rc;
}
#-------------------------------------------
--------------------------------#
# Function: doRunStats
#
#-------------------------------------------
--------------------------------#
sub doRunStats{
# if loadstats not gathered, then
index stats not gathered either.
&outtime("*** Runstats started");
if ( $runstatShort ne "NULL" ){
# we've specified a second
runstats file...This runstats file should do
# runstats for all table except
lineitem. The lineitem runstats command
# should be left in the main
runstats file.
©Copyright IBM Corporation TPC Benchmark H Full Disclosure Report May 2005 Page: 43
Page 46

if ( $platform eq "aix" ||
$platform eq "sun" || $platform eq "ptx" ){
print "runstats from
$ddlpath${delim}$runstatShort running
now\n";
$rc = system("db2 -tvf
\"$ddlpath${delim}$runstatShort\" >
\"$auditDir${delim}tools${delim}runstatShort
.out\" & ");
print "rc from
runstatshort=$rc\n";
}
elsif ( $platform eq "nt" ){
system("start db2 -tvf
$ddlpath${delim}$runstatShort");
}
else
{
print "Don't know how to
start in background on $platform
platform\n";
print "therefore running
runstats serially\n";
&dodb2file($dbname,"$ddlpath${delim}$runstat
Short",$once);
}
}
# run the full runstats, or the
remainder of what wasn't put into the short
# runstats file. You should be sure
that this runstats will take longer
# than the short runstats that is
running in the background, otherwise
# setting the config will happen
before this is done.
&dodb2file($dbname,"$ddlpath${delim}$runstat
s",$once);
&outtime("*** Runstats completed");
}
#-------------------------------------------
--------------------------------#
# Function: setConfiguration
#
#-------------------------------------------
--------------------------------#
sub setConfiguration{
my $ret = 0;
# &dodb_noconn("db2 update database
configuration for $dbname using dft_degree
$smpdegree",$all_ln);
&dodb_noconn("db2 update database
manager configuration using max_querydegree
$smpdegree",$once);
&dodb2file_noconn("${ddlpath}${delim
}$configfile",$all_ln);
&dodb2file_noconn("${ddlpath}${delim
}$dbmconfig",$once);
if ( $agentpri ne "NULL" ){
&dodb_noconn("db2 update dbm cfg
using AGENTPRI $agentpri",$once);
}
# set the db2 environment variables
for running the benchmark
if ( $setScript ne "NULL" ){
if ( $platform eq "aix" ||
$platform eq "sun" || $platform eq "ptx"){
$ret=system("${ddlpath}${delim}$setScript");
}
elsif ( $platform eq "nt" ){
if (($mode eq "uni" ) ||
($mode eq "smp" )){
$ret = system("perl
${ddlpath}${delim}$setScript");
}
else{
$ret = system(" rah \"
cd ${ddlpath} & $setScript\" ");
}
}
#($ret == 0 ) || die "failure
setting runtime db2set parms from $setScript
\n";
}
}
#-------------------------------------------
--------------------------------#
# Function: createBackup
#
#-------------------------------------------
--------------------------------#
sub createBackup{
my $rc;
&dodb_noconn("db2 update database
configuration for $dbname using LOGRETAIN
yes",$all_ln);
print "\n NOTE: DO NOT RESET THE
DATABASE CONFIGURATION or you will lose
logretain\n";
# force a connection to the database
on all nodes to ensure LOGRETAIN is
# set in effect.
# An error message will print to
screen if the logretain is set properly
# i.e. SQL116N A connection to or
activation of database <database name>
# cannot be made.
# This is expected and the lack of
this error message should be seen as an
# error in the database build.
# &dodb_conn($dbname,"db2 \"select
count(*) from tpcd.region\"",$all_ln);
if ( $qual eq "QUAL" ){
&outtime("*** Starting the
backup");
if (( $mode eq "mln" ) || (
$mode eq "mpp")){
# must back up catalog
node first...assume node 00
$rc=system("db2_all
\'}]<<+000< db2 \"backup database $dbname to
$backupdir without prompting\" \' ");
($rc == 0 ) || print
"ERROR: backup of catalog node failed rc =
$rc\n";
# back up remaining nodes
$rc=system("db2_all
\'||}]<<-000< db2 backup database $dbname to
/filesystem/backup/qual without prompting\'
");
($rc == 0 )|| print
"ERROR: backup of remaining nodes failed rc
= $rc\n";
}
else{
©Copyright IBM Corporation TPC Benchmark H Full Disclosure Report May 2005 Page: 44
Page 47

$rc = &dodb_noconn("db2
backup database $dbname to
/filesystem/backup/qual without
prompting",$once);
$rc = &dodb_noconn("db2
update db cfg for tpcd using newlogpath
/dev/raw/raw1 logfilsiz 100000 logprimary 20
softmax 1600", $once);
}
($rc == 0) || &outtime("***
Finished the backup");
}
else{
# This is the test database.
Clause 3.1.4 states that "the test sponsor
is
# not required to make or
have backup copies of the test database;
however
# all other mechanisms that
guarantee durability of the qualification
# database must be enabled in
the same way for the test database".
# According to this clause we
do need to keep the backup of the database.
$rc = &dodb_noconn("db2
backup database tpcd to
/filesystem/backup/test with 16 BUFFERS
PARALLELISM 8 without prompting",$once);
$rc = &dodb_noconn("db2
update db cfg for tpcd using newlogpath
/dev/raw/raw1 logfilsiz 100000 logprimary 20
softmax 1600", $once);
}
return $rc;
}
#-------------------------------------------
--------------------------------#
# Function: printSummary
#
#-------------------------------------------
--------------------------------#
sub printSummary{
if ( $buildStage ne "ALL" ){
print " ***** STARTING the build
process at the $buildStage Stage *****\n";
}
print "Building a TPC-D Version
$tpcdVersion $sf GB database on $dbpath
with: \n";
print " Mode = $mode \n";
print " Tablespace ddl in
$ddlpath${delim}$tbspddl \n";
if ( $nodegroupdef ne "NULL" ){
print " Nodegroup ddl in
$ddlpath${delim}$nodegroupdef \n";
}
if ( $buffpooldef ne "NULL" ){
print " Bufferpool ddl in
$ddlpath${delim}$buffpooldef \n";
}
print " Table ddl in
$ddlpath${delim}$ddl \n";
print " Index ddl in
$ddlpath${delim}$indexddl\n";
if ( $extraindex ne "no" ){
print " Indices to create after
the load $ddlpath${delim}$extraindex\n";
}
if ( $loadscript eq "NULL"){
if ( $input eq "NULL" ){
print " Data generated by
DBGEN in $dbgen\n";
}
else{
print " Data loaded from
flat files in $input\n";
}
}
if ( $earlyindex eq "yes" ){
print " Indexes created before
loading\n";
}
else{
print " Indexes created after
loading\n";
}
if ( $addRI ne "NULL" ){
print " RI being used from
$ddlpath${delim}$addRI\n";
}
if ( $astFile ne "NULL" ){
print " AST being used from
$ddlpath${delim}$astFile\n";
}
if ( $loadstats eq "yes" ){
if ( $earlyindex eq "yes" ){
print " Statistics for tables
and indexes gathered during load\n";
}
else{
if ( $runstatShort eq "NULL" ){
print " Statistics for
tables and indexes gathered after load using
$ddlpath${delim}$runstats \n";
}
else{
print " Statistics for
tables and indexes gathered after load using
$ddlpath${delim}$runstats and
$ddlpath${delim}$runstatShort\n";
}
}
}
else{
if ( $runstatShort eq "NULL" ){
print " Statistics for tables
and indexes gathered after load using
$ddlpath${delim}$runstats \n";
}
else{
print " Statistics for tables
and indexes gathered after load using
$ddlpath${delim}$runstats and
$ddlpath${delim}$runstatShort\n";
}
}
if ( $loadconfigfile ne "NULL" ){
print " Database Configuration
parameters for LOAD taken from
$ddlpath${delim}$loadconfigfile\n";
}
if ( $loadDBMconfig ne "NULL" ){
print " Database manager
Configuration parameters for LOAD taken from
$ddlpath${delim}$loadDBMconfig\n";
}
if ( $configfile ne "NULL" ){
print " Database Configuration
parameters taken from
$ddlpath${delim}$configfile\n";
©Copyright IBM Corporation TPC Benchmark H Full Disclosure Report May 2005 Page: 45
Page 48

}
else{
print " Database Configuration
paramters taken from
$ddlpath${delim}dss.dbconfig${sfReal}GB\n";
$configfile="dss.dbconfig${sfReal}GB";
}
if ( $dbmconfig ne "NULL" ){
print " Database Manager
Configuration parameters taken from
$ddlpath${delim}$dbmconfig\n";
}
else{
print " Database Manager
Configuration paramters taken from
$ddlpath${delim}dss.dbmconfig${sfReal}GB\n";
$configfile="dss.dbmconfig${sfReal}GB";
}
#print " Copy image for load
command created in $copydir\n";
if ( $log eq "yes" ){
print " Backup files placed in
$backupdir\n";
}
else{
print " No backup will be
taken.\n";
}
print " Log retain set to $log\n";
if ( $logDir eq "NULL" ){
print " Log files remain in
database path\n";
}
else{
print " Log file path set to
$logDir\n";
}
if ( $logprimary eq "NULL" ){
print " Log Primary left at
default\n";
}
else{
print " Log Primary set to
$logprimary\n";
}
if ( $logsecond eq "NULL" ){
print " Log Second left at
default\n";
}
else{
print " Log second set to
$logsecond\n";
}
if ( $logfilsiz eq "NULL" ){
print " Logfilsiz left at
default\n";
}
else{
print " Logfilsiz set to
$logfilsiz\n";
}
if (($loadconfigfile eq "") ||
($loadconfigfile eq "NULL")){
print " Machine size set to
$machine so the following configuration\n";
print " parameters are used for
load, create index and runstats: \n";
print " BUFFPAGE = $buffpage
\n";
print " SORTHEAP = $sortheap
\n";
print " SHEAPTHRES =
$sheapthres\n";
print " NUM_IOSERVERS =
$ioservers\n";
print " NUM_IOCLEANERS =
$ioclnrs\n";
print " CHNGPGS_THRESH =
$chngpgs\n";
print " UTIL_HEAP_SZ =
$util_heap_sz\n";
print " Degree of parallelism
(dft_degree and max_querydegree) set to
$smpdegree\n";
print " Parameters for load
are: temp file = $ldtemp\n";
print "
sort buf = $sortbuf\n";
print "
ld parallelism = $load_parallelism\n";
if ( $fparse eq "yes" ){
print "
FASTPARSE used on load\n";
}
}
if ( $loadscript ne "NULL"){
print " Load commands in
$ddlpath${delim}$loadscript\n";
}
print " Degree of parallelism
(dft_degree and max_querydegree) set to
$smpdegree\n";
if ( $agentpri ne "NULL" ){
print " AGENTPRI set to
$agentpri\n";
}
if ( $activate eq "yes" ){
print " Database will be
activated when build is complete\n";
}
if ( $explainDDL ne "NULL" ){
print " EXPLAIN DDL being used
from $ddlpath${delim}$explainDDL\n";
}
else{
print " EXPLAIN DDL being used
from default sqllib directory\n";
}
}
1;
create_bufferpools
--------------------------------------------
------------
-- Create Bufferpools
--------------------------------------------
-----------ALTER BUFFERPOOL IBMDEFAULTBP SIZE -1;
COMMIT WORK;
CREATE BUFFERPOOL BP32K ALL NODES SIZE 25000
PAGESIZE 32K;
COMMIT WORK;
ALTER BUFFERPOOL BP32K NUMBLOCKPAGES 5000
BLOCKSIZE 16;
COMMIT WORK;
©Copyright IBM Corporation TPC Benchmark H Full Disclosure Report May 2005 Page: 46
Page 49

create_indexes
--------------------------------------------
-------------
-- Create Indexes
--------------------------------------------
-------------
values(current timestamp);
ALTER TABLE TPCD.REGION ADD PRIMARY KEY
(R_REGIONKEY);
COMMIT WORK;
values(current timestamp);
ALTER TABLE TPCD.NATION ADD PRIMARY KEY
(N_NATIONKEY);
COMMIT WORK;
values(current timestamp);
ALTER TABLE TPCD.PART ADD PRIMARY KEY
(P_PARTKEY);
COMMIT WORK;
values(current timestamp);
ALTER TABLE TPCD.SUPPLIER ADD PRIMARY KEY
(S_SUPPKEY);
COMMIT WORK;
values(current timestamp);
ALTER TABLE TPCD.PARTSUPP ADD PRIMARY KEY
(PS_PARTKEY,PS_SUPPKEY);
COMMIT WORK;
values(current timestamp);
ALTER TABLE TPCD.CUSTOMER ADD PRIMARY KEY
(C_CUSTKEY);
COMMIT WORK;
values(current timestamp);
ALTER TABLE TPCD.LINEITEM ADD PRIMARY KEY
(L_ORDERKEY,L_LINENUMBER);
COMMIT WORK;
values(current timestamp);
ALTER TABLE TPCD.ORDERS ADD PRIMARY KEY
(O_ORDERKEY);
COMMIT WORK;
values(current timestamp);
CREATE INDEX TPCD.N_RK ON TPCD.NATION
(N_REGIONKEY ASC) PCTFREE 0 ;
commit work;
values(current timestamp);
CREATE INDEX TPCD.S_NK ON TPCD.SUPPLIER
(S_NATIONKEY ASC) PCTFREE 0 ;
commit work;
values(current timestamp);
CREATE INDEX TPCD.PS_PK ON TPCD.PARTSUPP
(PS_PARTKEY ASC) PCTFREE 0 ;
commit work;
values(current timestamp);
CREATE UNIQUE INDEX TPCD.PS_SKPK ON
TPCD.PARTSUPP (PS_SUPPKEY ASC, PS_PARTKEY
ASC) PCTFREE 0 ;
commit work;
values(current timestamp);
CREATE INDEX TPCD.PS_SK ON TPCD.PARTSUPP
(PS_SUPPKEY ASC) PCTFREE 0 ;
commit work;
values(current timestamp);
CREATE INDEX TPCD.C_NK ON TPCD.CUSTOMER
(C_NATIONKEY ASC) PCTFREE 0 ;
commit work;
values(current timestamp);
select
substr(tbname,1,10),substr(name,1,18),create
_time from sysibm.sysindexes
where tbcreator='TPCD' order by 3;
select substr(tbname,1,10),
substr(name,1,18),indextype,substr(colnames,
1,40) from sysibm.sysindexes where name like
'SQL%' and tbcreator ='TPCD' order by 1,2;
create_nodegroups
--------------------------------------------
----------
-- Create Nodegroups
--------------------------------------------
---------CREATE NODEGROUP ng_all ON NODES (0 to 127);
CREATE NODEGROUP ng_node0 ON NODE (0);
COMMIT WORK;
create_tables
--------------------------------------------
-------------
-- Create Tables
--------------------------------------------
-------------
CREATE TABLE TPCD.NATION ( N_NATIONKEY
INTEGER NOT NULL,
N_NAME
CHAR(25) NOT NULL,
N_REGIONKEY
INTEGER NOT NULL,
N_COMMENT
VARCHAR(152) NOT NULL)
IN SMALL_DATA;
CREATE TABLE TPCD.REGION ( R_REGIONKEY
INTEGER NOT NULL,
R_NAME
CHAR(25) NOT NULL,
R_COMMENT
VARCHAR(152) NOT NULL)
©Copyright IBM Corporation TPC Benchmark H Full Disclosure Report May 2005 Page: 47
Page 50

IN SMALL_DATA;
CREATE TABLE TPCD.PART ( P_PARTKEY
INTEGER NOT NULL,
P_NAME
VARCHAR(55) NOT NULL,
P_MFGR
CHAR(25) NOT NULL,
P_BRAND
CHAR(10) NOT NULL,
P_TYPE
VARCHAR(25) NOT NULL,
P_SIZE
INTEGER NOT NULL,
P_CONTAINER
CHAR(10) NOT NULL,
P_RETAILPRICE
FLOAT NOT NULL,
P_COMMENT
VARCHAR(23) NOT NULL )
IN DATA_INDEX
PARTITIONING KEY(P_PARTKEY) USING
HASHING;
CREATE TABLE TPCD.SUPPLIER ( S_SUPPKEY
INTEGER NOT NULL,
S_NAME
CHAR(25) NOT NULL,
S_ADDRESS
VARCHAR(40) NOT NULL,
S_NATIONKEY
INTEGER NOT NULL,
S_PHONE
CHAR(15) NOT NULL,
S_ACCTBAL
FLOAT NOT NULL,
S_COMMENT
VARCHAR(101) NOT NULL)
IN DATA_INDEX
PARTITIONING KEY(S_SUPPKEY) USING
HASHING;
CREATE TABLE TPCD.PARTSUPP ( PS_PARTKEY
INTEGER NOT NULL,
PS_SUPPKEY
INTEGER NOT NULL,
PS_AVAILQTY
INTEGER NOT NULL,
PS_SUPPLYCOST
FLOAT NOT NULL,
PS_COMMENT
VARCHAR(199) NOT NULL )
IN DATA_INDEX
PARTITIONING KEY(PS_PARTKEY) USING
HASHING;
CREATE TABLE TPCD.CUSTOMER ( C_CUSTKEY
INTEGER NOT NULL,
C_NAME
VARCHAR(25) NOT NULL,
C_ADDRESS
VARCHAR(40) NOT NULL,
C_NATIONKEY
INTEGER NOT NULL,
C_PHONE
CHAR(15) NOT NULL,
C_ACCTBAL
FLOAT NOT NULL,
C_MKTSEGMENT
CHAR(10) NOT NULL,
C_COMMENT
VARCHAR(117) NOT NULL)
IN DATA_INDEX
PARTITIONING KEY(C_CUSTKEY) USING
HASHING;
CREATE TABLE TPCD.ORDERS ( O_ORDERKEY
BIGINT NOT NULL,
O_CUSTKEY
INTEGER NOT NULL,
O_ORDERSTATUS
CHAR(1) NOT NULL,
O_TOTALPRICE
FLOAT NOT NULL,
O_ORDERDATE
DATE NOT NULL,
O_ORDERPRIORITY
CHAR(15) NOT NULL,
O_CLERK
CHAR(15) NOT NULL,
©Copyright IBM Corporation TPC Benchmark H Full Disclosure Report May 2005 Page: 48
Page 51

O_SHIPPRIORITY
INTEGER NOT NULL,
O_COMMENT
VARCHAR(79) NOT NULL)
ORGANIZE BY (O_ORDERDATE)
IN DATA_INDEX
PARTITIONING KEY(O_ORDERKEY) USING
HASHING;
CREATE TABLE TPCD.LINEITEM ( L_ORDERKEY
BIGINT NOT NULL,
L_PARTKEY
INTEGER NOT NULL,
L_SUPPKEY
INTEGER NOT NULL,
L_LINENUMBER
INTEGER NOT NULL,
L_QUANTITY
FLOAT NOT NULL,
L_EXTENDEDPRICE
FLOAT NOT NULL,
L_DISCOUNT
FLOAT NOT NULL,
L_TAX
FLOAT NOT NULL,
L_RETURNFLAG
CHAR(1) NOT NULL,
L_LINESTATUS
CHAR(1) NOT NULL,
L_SHIPDATE
DATE NOT NULL,
L_COMMITDATE
DATE NOT NULL,
L_RECEIPTDATE
DATE NOT NULL,
L_SHIPINSTRUCT
CHAR(25) NOT NULL,
L_SHIPMODE
CHAR(10) NOT NULL,
L_COMMENT
VARCHAR(44) NOT NULL)
ORGANIZE BY (L_SHIPDATE)
IN DATA_INDEX
PARTITIONING KEY(L_ORDERKEY) USING
HASHING;
COMMIT WORK;
create_ tablespaces
--------------------------------------------
------------------
-- Create Tablespaces
--------------------------------------------
-----------------CREATE regular tablespace data_index
PAGESIZE 32K
MANAGED BY database
using (device '/dev/sda6' 39063536K)
ON DBPARTITIONNUMS
(0,2,4,6,8,10,12,14,16,18,20,22,24,26,28,30,
32,34,36,38,40,42,44,46,48,50,52,54,56,58,60
,62,64,66,68,70,72,74,76,78,80,82,84,86,88,9
0,92,94,96,98,100,102,104,106,108,110,112,11
4,116,118,120,122,124,126)
using (device '/dev/sdb6' 39063536K)
ON DBPARTITIONNUMS
(1,3,5,7,9,11,13,15,17,19,21,23,25,27,29,31,
33,35,37,39,41,43,45,47,49,51,53,55,57,59,61
,63,65,67,69,71,73,75,77,79,81,83,85,87,89,9
1,93,95,97,99,101,103,105,107,109,111,113,11
5,117,119,121,123,125,127)
EXTENTSIZE 16
PREFETCHSIZE 32
BUFFERPOOL BP32K
OVERHEAD 35;
CREATE temporary tablespace TEMP32K
PAGESIZE 32K
MANAGED BY database
using (device '/dev/sda7' 24416240K)
ON DBPARTITIONNUMS
(0,2,4,6,8,10,12,14,16,18,20,22,24,26,28,30,
32,34,36,38,40,42,44,46,48,50,52,54,56,58,60
,62,64,66,68,70,72,74,76,78,80,82,84,86,88,9
0,92,94,96,98,100,102,104,106,108,110,112,11
4,116,118,120,122,124,126)
using (device '/dev/sdb7' 24416240K)
ON DBPARTITIONNUMS
(1,3,5,7,9,11,13,15,17,19,21,23,25,27,29,31,
33,35,37,39,41,43,45,47,49,51,53,55,57,59,61
,63,65,67,69,71,73,75,77,79,81,83,85,87,89,9
1,93,95,97,99,101,103,105,107,109,111,113,11
5,117,119,121,123,125,127)
EXTENTSIZE 16
PREFETCHSIZE 32
BUFFERPOOL BP32K;
CREATE temporary tablespace TEMP4K
PAGESIZE 4K
MANAGED BY database
using (device '/dev/sda5' 17580016K)
ON DBPARTITIONNUMS
(0,2,4,6,8,10,12,14,16,18,20,22,24,26,28,30,
32,34,36,38,40,42,44,46,48,50,52,54,56,58,60
,62,64,66,68,70,72,74,76,78,80,82,84,86,88,9
0,92,94,96,98,100,102,104,106,108,110,112,11
4,116,118,120,122,124,126)
using (device '/dev/sdb5' 17580016K)
ON DBPARTITIONNUMS
(1,3,5,7,9,11,13,15,17,19,21,23,25,27,29,31,
©Copyright IBM Corporation TPC Benchmark H Full Disclosure Report May 2005 Page: 49
Page 52

33,35,37,39,41,43,45,47,49,51,53,55,57,59,61
,63,65,67,69,71,73,75,77,79,81,83,85,87,89,9
1,93,95,97,99,101,103,105,107,109,111,113,11
5,117,119,121,123,125,127)
EXTENTSIZE 48
PREFETCHSIZE 96;
CREATE regular TABLESPACE small_data
IN NODEGROUP ng_node0
PAGESIZE 4K
MANAGED BY system
USING (
'/data/small_data'
)
BUFFERPOOL ibmdefaultbp
OVERHEAD 25
TRANSFERRATE .3;
COMMIT WORK;
drop tablespace tempspace1;
commit work;
createuftbls
--------------------------------------------
-----------------
-- Create Update Function Tables
--------------------------------------------
----------------CREATE TABLE TPCDTEMP.ORDERS_NEW ( APP_ID
INTEGER NOT NULL,
O_ORDERKEY
BIGINT NOT NULL,
O_CUSTKEY
INTEGER NOT NULL,
O_ORDERSTATUS
CHAR(1) NOT NULL,
O_TOTALPRICE
FLOAT NOT NULL,
O_ORDERDATE
DATE NOT NULL,
O_ORDERPRIORITY
CHAR(15) NOT NULL,
O_CLERK
CHAR(15) NOT NULL,
O_SHIPPRIORITY
INTEGER NOT NULL,
O_COMMENT
VARCHAR(79) NOT NULL WITH DEFAULT)
PARTITIONING KEY (O_ORDERKEY)
IN DATA_INDEX;
CREATE TABLE TPCDTEMP.ORDERS_DEL ( APP_ID
INTEGER NOT NULL,
O_ORDERKEY
BIGINT NOT NULL)
PARTITIONING KEY (O_ORDERKEY)
IN DATA_INDEX;
CREATE TABLE TPCDTEMP.LINEITEM_NEW ( APP_ID
INTEGER NOT NULL,
L_ORDERKEY
BIGINT NOT NULL,
L_PARTKEY
INTEGER NOT NULL,
L_SUPPKEY
INTEGER NOT NULL,
L_LINENUMBER
INTEGER NOT NULL,
L_QUANTITY
FLOAT NOT NULL,
L_EXTENDEDPRICE
FLOAT NOT NULL,
L_DISCOUNT
FLOAT NOT NULL,
L_TAX
FLOAT NOT NULL,
L_RETURNFLAG
CHAR(1) NOT NULL,
L_LINESTATUS
CHAR(1) NOT NULL,
L_SHIPDATE
DATE NOT NULL,
L_COMMITDATE
DATE NOT NULL,
L_RECEIPTDATE
DATE NOT NULL,
L_SHIPINSTRUCT
CHAR(25) NOT NULL,
L_SHIPMODE
CHAR(10) NOT NULL,
L_COMMENT
VARCHAR(44) NOT NULL WITH DEFAULT)
PARTITIONING KEY (L_ORDERKEY)
IN DATA_INDEX;
CREATE INDEX TPCDTEMP.I_ORDERS_NEW ON
TPCDTEMP.ORDERS_NEW
( APP_ID,
O_ORDERKEY,
O_CUSTKEY,
O_ORDERSTATUS,
O_TOTALPRICE,
O_ORDERDATE,
O_ORDERPRIORITY,
O_CLERK,
O_SHIPPRIORITY,
O_COMMENT);
CREATE INDEX TPCDTEMP.I_LINEITEM_NEW ON
TPCDTEMP.LINEITEM_NEW (APP_ID);
CREATE UNIQUE INDEX TPCDTEMP.I_ORDERS_DEL ON
TPCDTEMP.ORDERS_DEL
(APP_ID, O_ORDERKEY);
COMMIT WORK;
db2nodes.cfg
0 bbirdib001 0
1 bbirdib001 1
2 bbirdib002 0
3 bbirdib002 1
4 bbirdib003 0
5 bbirdib003 1
6 bbirdib004 0
7 bbirdib004 1
8 bbirdib005 0
9 bbirdib005 1
10 bbirdib006 0
11 bbirdib006 1
12 bbirdib007 0
13 bbirdib007 1
14 bbirdib008 0
15 bbirdib008 1
©Copyright IBM Corporation TPC Benchmark H Full Disclosure Report May 2005 Page: 50
Page 53

16 bbirdib009 0
17 bbirdib009 1
18 bbirdib010 0
19 bbirdib010 1
20 bbirdib011 0
21 bbirdib011 1
22 bbirdib012 0
23 bbirdib012 1
24 bbirdib013 0
25 bbirdib013 1
26 bbirdib014 0
27 bbirdib014 1
28 bbirdib015 0
29 bbirdib015 1
30 bbirdib016 0
31 bbirdib016 1
32 bbirdib017 0
33 bbirdib017 1
34 bbirdib018 0
35 bbirdib018 1
36 bbirdib019 0
37 bbirdib019 1
38 bbirdib020 0
39 bbirdib020 1
40 bbirdib021 0
41 bbirdib021 1
42 bbirdib022 0
43 bbirdib022 1
44 bbirdib023 0
45 bbirdib023 1
46 bbirdib024 0
47 bbirdib024 1
48 bbirdib025 0
49 bbirdib025 1
50 bbirdib026 0
51 bbirdib026 1
52 bbirdib027 0
53 bbirdib027 1
54 bbirdib028 0
55 bbirdib028 1
56 bbirdib029 0
57 bbirdib029 1
58 bbirdib030 0
59 bbirdib030 1
60 bbirdib031 0
61 bbirdib031 1
62 bbirdib032 0
63 bbirdib032 1
64 bbirdib033 0
65 bbirdib033 1
66 bbirdib034 0
67 bbirdib034 1
68 bbirdib035 0
69 bbirdib035 1
70 bbirdib036 0
71 bbirdib036 1
72 bbirdib037 0
73 bbirdib037 1
74 bbirdib038 0
75 bbirdib038 1
76 bbirdib039 0
77 bbirdib039 1
78 bbirdib040 0
79 bbirdib040 1
80 bbirdib041 0
81 bbirdib041 1
82 bbirdib042 0
83 bbirdib042 1
84 bbirdib043 0
85 bbirdib043 1
86 bbirdib044 0
87 bbirdib044 1
88 bbirdib045 0
89 bbirdib045 1
90 bbirdib046 0
91 bbirdib046 1
92 bbirdib047 0
93 bbirdib047 1
94 bbirdib048 0
95 bbirdib048 1
96 bbirdib049 0
97 bbirdib049 1
98 bbirdib050 0
99 bbirdib050 1
100 bbirdib051 0
101 bbirdib051 1
102 bbirdib052 0
103 bbirdib052 1
104 bbirdib053 0
105 bbirdib053 1
106 bbirdib054 0
107 bbirdib054 1
108 bbirdib055 0
109 bbirdib055 1
110 bbirdib056 0
111 bbirdib056 1
112 bbirdib057 0
113 bbirdib057 1
114 bbirdib058 0
115 bbirdib058 1
116 bbirdib059 0
117 bbirdib059 1
118 bbirdib060 0
119 bbirdib060 1
120 bbirdib061 0
121 bbirdib061 1
122 bbirdib062 0
123 bbirdib062 1
124 bbirdib063 0
125 bbirdib063 1
126 bbirdib064 0
127 bbirdib064 1
load_db2set.ksh
#!/bin/ksh
db2set DB2NOLIOAIO=no
db2set DB2OPTIONS="-t -v +c"
db2set DB2_EXTENDED_OPTIMIZATION=Y
db2set DB2_LIKE_VARCHAR=Y,Y
db2set DB2_ANTIJOIN=Y
db2set DB2BPVARS=/home/custom/bpvar.cfg
db2set DB2RQTIME=30
db2set DB2COMM=tcpip
db2set DB2BQTRY=120
db2set DB2_PARALLEL_IO="*"
run_db2set.ksh
#!/bin/ksh
db2set DB2NOLIOAIO=no
db2set DB2OPTIONS="-t -v +c"
db2set DB2_EXTENDED_OPTIMIZATION=Y
db2set DB2_LIKE_VARCHAR=Y,Y
db2set DB2_ANTIJOIN=Y
db2set DB2BPVARS=/home/custom/bpvar.cfg
©Copyright IBM Corporation TPC Benchmark H Full Disclosure Report May 2005 Page: 51
Page 54

db2set DB2RQTIME=30
db2set DB2COMM=tcpip
db2set DB2BQTRY=120
db2set DB2_PARALLEL_IO="*"
runstats.ddl
RUNSTATS ON TABLE TPCD.NATION WITH
DISTRIBUTION on all columns
and columns (
n_name like statistics,
n_comment like statistics )
AND detailed INDEXES ALL;
commit;
RUNSTATS ON TABLE TPCD.REGION WITH
DISTRIBUTION on all columns
and columns (
r_name like statistics,
r_comment like statistics )
AND detailed INDEXES ALL;
commit;
RUNSTATS ON TABLE TPCD.SUPPLIER WITH
DISTRIBUTION on all columns
and columns (
s_name like statistics,
s_address like statistics,
s_phone like statistics,
s_comment like statistics)
AND detailed INDEXES ALL;
commit;
RUNSTATS ON TABLE TPCD.PART WITH
DISTRIBUTION on all columns
and columns (
p_name like statistics,
p_mfgr like statistics,
p_brand like statistics,
p_type like statistics,
p_container like statistics,
p_comment like statistics)
AND detailed INDEXES ALL;
commit;
RUNSTATS ON TABLE TPCD.PARTSUPP WITH
DISTRIBUTION on all columns
and columns (
ps_comment like statistics)
AND detailed INDEXES ALL;
commit;
RUNSTATS ON TABLE TPCD.CUSTOMER WITH
DISTRIBUTION on all columns
and columns (
c_name like statistics,
c_address like statistics,
c_phone like statistics,
c_mktsegment like statistics,
c_comment like statistics)
AND detailed INDEXES ALL;
commit;
RUNSTATS ON TABLE TPCD.ORDERS WITH
DISTRIBUTION on all columns
and columns (
o_orderstatus like statistics,
o_orderpriority like statistics,
o_clerk like statistics,
o_comment like statistics)
AND detailed INDEXES ALL;
commit;
RUNSTATS ON TABLE TPCD.LINEITEM WITH
DISTRIBUTION on all columns
and columns (
l_returnflag like statistics,
l_linestatus like statistics,
l_shipinstruct like statistics,
l_shipmode like statistics,
l_comment like statistics)
AND detailed INDEXES ALL;
COMMIT WORK;
load_tables.ksh
#!/bin/ksh
messages=${TPCD_TMP_DIR}
rawdata=${TPCD_INPUT}
custom=${TPCD_DDLPATH}
echo "Load Summary Time: " >
${messages}/loadstatus.out
# Nation and Region are loaded into the
current node
db2 connect to tpcd;
echo "Loading Nation at "`date` >>
${messages}/loadstatus.out
db2 "load from ${rawdata}/nation.tbl of del
modified by coldel| fastparse noheader
messages ${messages}/nation.msg replace into
TPCD.NATION nonrecoverable"
echo "Loading Region at "`date` >>
${messages}/loadstatus.out
db2 "load from ${rawdata}/region.tbl of del
modified by coldel| fastparse noheader
messages ${messages}/region.msg replace into
TPCD.REGION nonrecoverable"
#
echo "Loading Customer at "`date` >>
${messages}/loadstatus.out
db2 -tvf ${custom}/load_tb_customer.ddl
#
echo "Loading Supplier at "`date` >>
${messages}/loadstatus.out
db2 -tvf ${custom}/load_tb_supplier.ddl
#
echo "Loading Orders at "`date` >>
${messages}/loadstatus.out
db2 -tvf ${custom}/load_tb_orders.ddl
#
echo "Loading Lineitem at "`date` >>
${messages}/loadstatus.out
db2 -tvf ${custom}/load_tb_lineitem.ddl
#
echo "Loading Partsupp at "`date` >>
${messages}/loadstatus.out
db2 -tvf ${custom}/load_tb_partsupp.ddl
#
echo "Loading Part at "`date` >>
${messages}/loadstatus.out
db2 -tvf ${custom}/load_tb_part.ddl
#
db2 commit;
db2 terminate;
echo "Finished Loading at "`date` >>
${messages}/loadstatus.out
©Copyright IBM Corporation TPC Benchmark H Full Disclosure Report May 2005 Page: 52
Page 55

echo "--------------------------------------
-----" >> ${messages}/loadstatus.out
#echo "Starting Sanity Chequing at "`date`
>> ${messages}/loadstatus.out
#db2 connect to tpcd;
#db2 "select count_big(*) as lineitem from
tpcd.lineitem" >> ${messages}/loadstatus.out
#db2 "select count_big(*) as orders from
tpcd.orders" >> ${messages}/loadstatus.out
#db2 "select count_big(*) as partsupp from
tpcd.partsupp" >> ${messages}/loadstatus.out
#db2 "select count_big(*) as customer from
tpcd.customer" >> ${messages}/loadstatus.out
#db2 "select count_big(*) as part from
tpcd.part" >> ${messages}/loadstatus.out
#db2 "select count_big(*) as supplier from
tpcd.supplier" >> ${messages}/loadstatus.out
#db2 "select count(*) as nation from
tpcd.nation" >> ${messages}/loadstatus.out
#db2 "select count(*) as region from
tpcd.region" >> ${messages}/loadstatus.out
#db2 terminate;
#echo "Finish Sanity Chequing at "`date` >>
${messages}/loadstatus.out
load_tb_customer.ddl
load from
customer.tbl
of del
modified by coldel|
fastparse
messages
/home/tpch/tmp/customer.msg
replace into TPCD.CUSTOMER
nonrecoverable
partitioned db config mode load_only
part_file_location /flat0
;
load_tb_lineitem.ddl
load from
lineitem.tbl
of del
modified by coldel|
fastparse
messages
/home/tpch/tmp/lineitem.msg
replace into TPCD.LINEITEM
nonrecoverable
partitioned db config mode load_only
part_file_location /flat0
;
load_tb_orders.ddl
load from
orders.tbl
of del
modified by coldel|
fastparse
messages
/home/tpch/tmp/orders.msg
replace into TPCD.ORDERS
nonrecoverable
partitioned db config mode load_only
part_file_location /flat0
;
load_tb_part.ddl
load from
part.tbl
of del
modified by coldel|
fastparse
messages
/home/tpch/tmp/part.msg
replace into TPCD.PART
nonrecoverable
partitioned db config mode load_only
part_file_location /flat0
;
load_tb_partsupp.ddl
load from
partsupp.tbl
of del
modified by coldel|
fastparse
messages
/home/tpch/tmp/partsupp.msg
replace into TPCD.PARTSUPP
nonrecoverable
partitioned db config mode load_only
part_file_location /flat0
;
load_tb_supplier.ddl
load from /flat0/supplier.tbl
of del
modified by coldel|
fastparse
messages
/home/tpch/tmp/supplier.msg
replace into TPCD.SUPPLIER
nonrecoverable
CPU_PARALLELISM 4
;
load_dbcfg.ddl
UPDATE DB CFG FOR TPCD USING DBHEAP 15000
SORTHEAP 25000 SHEAPTHRES_SHR 0
APPGROUP_MEM_SZ 2000 DFT_QUERYOPT 7
DFT_DEGREE 4 NUM_FREQVALUES 0 NUM_QUANTILES
600 LOCKLIST 16384 MAXLOCKS 60
CHNGPGS_THRESH 15 NUM_IOCLEANERS 1
NUM_IOSERVERS 3 MAXFILOP 1024 LOGFILSIZ
10000 LOGPRIMARY 10 LOGSECOND 10 SOFTMAX 750
DATABASE_MEMORY AUTOMATIC UTIL_HEAP_SZ 50000
;
©Copyright IBM Corporation TPC Benchmark H Full Disclosure Report May 2005 Page: 53
Page 56

load_dbmcfg.ddl
UPDATE DBM CFG USING
CPUSPEED 1.889377e-06
SHEAPTHRES 100000
MAX_QUERYDEGREE ANY
INTRA_PARALLEL NO
SVCENAME DB2_tpch_SVC
NUMDB 1
MAX_TIME_DIFF 1440
DFT_MON_TIMESTAMP OFF
DIAGLEVEL 0
NOTIFYLEVEL 0
;
run_dbcfg.ddl
UPDATE DB CFG FOR TPCD USING DBHEAP 10000
SORTHEAP 10000 SHEAPTHRES_SHR 250
DATABASE_MEMORY automatic UTIL_HEAP_SZ 5000
DFT_QUERYOPT 7 DFT_DEGREE 1 NUM_FREQVALUES 0
NUM_QUANTILES 300 LOCKLIST 40000 MAXLOCKS 20
CHNGPGS_THRESH 60 NUM_IOCLEANERS 2
NUM_IOSERVERS 4 MAXFILOP 1024 LOGFILSIZ
50000 LOGPRIMARY 4 LOGSECOND 1 SOFTMAX 360
LOGBUFSZ 2048 MINCOMMIT 1 APPLHEAPSZ 1024
STMTHEAP 10000 BUFFPAGE 70000
database_memory automatic ;
run_dbmcfg.ddl
UPDATE DBM CFG USING
HEALTH_MON OFF
SHEAPTHRES 100000
MAX_QUERYDEGREE ANY
INTRA_PARALLEL NO
FCM_NUM_BUFFERS 16384
FCM_NUM_RQB 8192
NUM_POOLAGENTS 64
NUM_INITAGENTS 4
JAVA_HEAP_SZ 2048
CONN_ELAPSE 20
DFT_MON_TIMESTAMP OFF
;
setlogpath.ksh
#!/usr/bin/ksh
typeset -i p
for p in 0 2 4 6 8 10 12 14 16 18 20 22 24
26 28 30 32 34 36 38 40 42 44 46 48 50 52 54
56 58 60 62 64 66 68 70 72 74 76 78 80 82 84
86 88 90 92 94 96 98 100 102 104 106 108 110
112 114 116 118 120 122 124 126; do
db2_all "\"<<+$p< db2 update db cfg for
tpcd using newlogpath /dev/raw/raw1"
done
for p in 1 3 5 7 9 11 13 15 17 19 21 23 25
27 29 31 33 35 37 39 41 43 45 47 49 51 53 55
57 59 61 63 65 67 69 71 73 75 77 79 81 83 85
87 89 91 93 95 97 99 101 103 105 107 109 111
113 115 117 119 121 123 125 127; do
db2_all "\"<<+$p< db2 update db cfg for
tpcd using newlogpath /dev/raw/raw2"
done
tpcd.setup
# NOTE: ALL variable defitions must have a
comment at the end - haven't got
# the getvars script recognizing the
uncommented line yet
TPCD_PLATFORM=linux #
aix, nt, sun ....
TPCD_VERSION=2 # 1
or 2 (Version of tpcd). Default 1
TPCD_DBNAME=TPCD #
name to create database under
TPCD_WORKLOAD=H # TPC
version (R for TPCR, H for TPCH)
TPCD_AUDIT_DIR=/flat1/tpcd # top
level directory of tar file for
# all
the tpcd scripts
TPCD_PRODUCT=v5 # v5
or pe
# Use
pe if you really are using pe v1.2!
# but
I won't guarantee that it will work!
TPCD_MODE=mpp #
uni/smp/mln/mpp
TPCD_PHYS_NODE=64 #
number of physical nodes
TPCD_LN_PER_PN=2 #
number of logical nodes per physical node
TPCD_SF=3000 #
size of the database (1=1GB,...) to
# get
test size databases use:
#
0.012 = 12MB
#
0.1 = 100MB
TPCD_BUILD_STAGE=ALL #
where to start the build - currently the
#
following is possible:
#
ALL - do everything (create,load,
#
index,stats,config) (Default)
#
CRTTBSP - start after create db and
#
config setting. Start righ at
#
create tbsp
#
LOAD - start from the load of the tables
#
INDEX - start from the index creation
#
(NOTE if earlyindex is specified,
#
then this will do the create index
#
followed by the load...)
©Copyright IBM Corporation TPC Benchmark H Full Disclosure Report May 2005 Page: 54
Page 57

#
RUNSTATS - start from the runstats
#
(NOTE Do not use this option if
#
distribution stats are gathered
#
as part of the load, this will
#
start after the load and indices
#
have been created.
#
CONFIG - start from the setting up of
#
the benchmark runs config setup
#
TPCD_DBPATH=/home/tpch/DBPATH # path
for database (defaults to home)
TPCD_DDLPATH=/home/tpch/custom #
path for all ddl files and customized
#
scripts (load script), config files,etc
TPCD_BUFFERPOOL_DEF=create_bufferpools.ddl
# name of file with bufferpool definitions
# and sizes
TPCD_NODEGROUP_DEF=create_nodegroups.ddl
# name of file in ddlpath with nodegroup
# definitions
TPCD_EXPLAIN_DDL=NULL #
file with DDL for explains statments
# if
this is NULL then uses the default
# and
puts it in USERSPACE1 across all
#
nodes...nt 1TB found it was faster if
#
just in a single node nodegroup
TPCD_TBSP_DDL=create_tablespaces.ddl # ddl
file for tablespaces
TPCD_DDL=create_tables.ddl # ddl
file for tables
TPCD_QUAL_TBSP_DDL=create_tablespaces_qual.d
dl # ddl file for tablespaces for qual
TPCD_QUAL_DDL=create_tables.ddl # ddl
file for qualification database
#
tablespaces and tables should be identical
# to
regular ddl except container names
TPCD_INDEXDDL=create_indexes.ddl # ddl
file for indexes
TPCD_EXTRAINDEX=no # no
= no extra indexes
#
filename = If you want to create some
#
indices before
# the
load, and some indices after, then
# use
this additional file to specify the
TPCD_ADD_RI=NULL #
file name that contains any RI
#
constraints to add after index creation
# set
to NULL (default) if unused
#
indices to create after the load.
TPCD_AST=NULL #
file name that contains complete AST
#
definition including connection to
# the
database, summary table creation,
#
population, indexing and runstats.
TPCD_RUNSTATS=runstats.ddl # ddl
file for runstats. If you have
#
created indices before the load (ie
#
TPCD_EARLYINDEX=yes), have specified to
#
gather stats on the load command (either
#
through your own load script or by using
#
TPCD_LOADSTATS=yes, AND you have
#
specified a file for TPCD_EXTRAINDEX
#
then this runstats file should include
# the
runstats commands specifically for
# the
extra indices.
TPCD_RUNSTATSHORT=NULL #
NOTE!! THIS IS BUGGY....I can't get it to
#
work on UNI successfully
# ddl
file for short runstats that are
# run
in the background while the
#
TPCD_RUNSTATS are run in the foreground
# of
the build. If this is used, then
#
TPCD_RUNSTATS should have the runstats
#
command for lineitem and
#
TPCD_RUNSTATSHORT should have runstats
#
commands for all other tables.
TPCD_DBGEN=/flat1/tpcd/appendix.v2/dbgen
# path name to data generation code
#
Parameters used to specify source of
#
data for load scripts
TPCD_INPUT=/flat0/3TB #
NULL - use dbgen generated data OR
#
path name - to the pre-generated
#
flat files
#
TPCD_QUAL_INPUT=NULL #
NULL - use dbgen generated data OR
#
path name - to the pre-generated
#
flat files
©Copyright IBM Corporation TPC Benchmark H Full Disclosure Report May 2005 Page: 55
Page 58

TPCD_TAILOR_DIR=/flat1/tpcd/tailor
# path name for the directory used to
#
generate split specific config files
#
only used for partitioned environment
TPCD_EARLYINDEX=no #
create indexes before the load
#
LOAD specific parameters follow:
TPCD_LOAD_DB2SET_SCRIPT=load_db2set.ksh #
Script that contains the db2set commands
# for
the load process Use NULL if not
#
specified
TPCD_LOAD_CONFIGFILE=load_dbcfg.ddl
#config file with specific database config
#
parms for the load/index/runstats part
# of
the build.
# set
to NULL if use defaults
TPCD_LOAD_DBM_CONFIGFILE=load_dbmcfg.ddl
# config file with specific
# database manager config parts for the
# load/index/runstats part of the build.
# set to NULL if use defaults
TPCD_LOAD_QUALCONFIGFILE=load_dbcfg.ddl #
config file with specific database config
#
parms for the load/index/runstats part
# of
the build for qualification db.
# set
to NULL if use defaults
TPCD_LOAD_DBM_QUALCONFIGFILE=load_dbmcfg.ddl
# config file with specific
#
database manager config parts for the
#
load/index/runstats part of the build.
# set
to NULL if use defaults
TPCD_LOADSTATS=no #
gather statistics during load
#
ignored if EARLYINDEX is not set
# due
to runstats limitation
TPCD_TEMP=/tmp/tpch #
path for LOAD temp files
#
used in load script only
TPCD_SORTBUF=4096 #
sortbuf size for LOAD
#
used in load script only
TPCD_LOAD_PARALLELISM=0 #
degree of parallelism to use on load
# 0 =
use the "intelligent default" that
# the
load will chose at run time
#
used in load script only
TPCD_COPY_DIR=NULL #
directory where copy image is created
# on
load command CURRENTLY UNUSED
#
used in load script only
TPCD_FASTPARSE=yes # use
fastparse on load
#
used in load script only
#
Backup and logfile specific parameters
follow:
TPCD_BACKUP_DIR=/flat1/tpcd/backupdir
# directory where backup files are placed
TPCD_LOGPRIMARY=NULL #
NULL/value = how many primary log files
# to
configure. If NULL is specified then
# the
default is not changed.
TPCD_LOGFILSIZ=NULL #
NULL/value = how 4KB pages to use for
#
logfilsiz db cfg parameter. If NULL is
#
specified then the default is not changed
TPCD_LOGSECOND=NULL #
NULL/value = how many secondary log files
# to
configure. If NULL is specified then
# the
default is not changed.
TPCD_LOG_DIR=NULL #
directory where log files stored..
#
NULL leaves them in the dbpath
TPCD_LOG_QUAL_DIR=/home/logs #
directory where qual log files stored
#
NULL leaves them in the dbpath
TPCD_LOG=no #
yes/no - whether to turn LOG_RETAIN on
#
i.e. are backups needed to be taken
#
CONFIG specific parameters
TPCD_DB2SET_SCRIPT=NULL #
Script that contains the db2set commands
# for
the benchmark run. Use NULL if not
#
specified
TPCD_CONFIGFILE=run_dbcfg.ddl #
name of configuration file in ddl path
#
that will be used for the benchmark run
TPCD_DBM_CONFIG=run_dbmcfg.ddl #
name of config file for database manager
# cfg
parms
TPCD_QUALCONFIGFILE=run_dbcfg.ddl #
name of database cfg file in ddl path
# for
qualification database
©Copyright IBM Corporation TPC Benchmark H Full Disclosure Report May 2005 Page: 56
Page 59

TPCD_DBM_QUALCONFIG=run_dbmcfg.ddl #
name of config file for database
#
manager cfg parms
TPCD_MACHINE=small # set
to NULL if using load config file
#
big/medium/small size of machine used to
#
determine buffpage, sortheap,sheapthres
# and
ioservers parms for load, create
#
index and runstats
#
NOTE that this parameter is ignored if
# a
TPCD_LOAD_CONFIGFILE is specified
TPCD_SMPDEGREE=1 #
1...# of degrees of parallelism to run
#
with
TPCD_AGENTPRI=NULL # set
agentpri to this value (default
# is
SYSTEM)
TPCD_ACTIVATE=no #
activate the database upon build
#
completion
# run
specific parameters
TPCD_AUDIT=yes #
no/yes
# no
- don't set up qualification db stuff
# yes
- set up qualification db queries
#
- build the update function tables
#
and data before we get into the
#
timing of the creation of the
#
tables and the load.
TPCD_TMP_DIR=/tmp/tpch #
place to put temp working files
TPCD_SHARED_TEMP_FULL_PATHNAME=/home/tpch/sq
llib/tmp # just added
TPCD_QUERY_TEMPLATE_DIR=standard.V2 #
subdirectory in AUDIT_DIR/queries
# to
use as the source of the query
#
templates. Currently there are
# v2
ones and pe ones. You can make
#
your own directory following the same
#
form as in the v2 directory using
# any
variant you wish
TPCD_QUAL_DBNAME=TPCDQUAL #
name of qualification database
TPCD_NUMSTREAM=8 #
number of streams for the throughput test
TPCD_FLATFILES=/data/ufdata #
where to generate/read flat files
# for
update functions
TPCD_STAGING_TABLE_DDL=create_UFtables.ddl
# script that contains the ddl for creating
# the staging tables if they are used for
# the update functions
TPCD_PRELOAD_STAGING_TABLE_SCRIPT=NULL
# file that contains the sql for preloading
# and gathering stats on sample UF data
# Note that the data used is sample data
# and is not data from any of the applied
# update pairs
TPCD_DELETE_STAGING_TABLE_SQL=remove_UFtable
s.ddl # file that contains the sql for
deleting
# the preloaded data from the staging
# tables
TPCD_UPDATE_IMPORT=false #
true = use import for the staging tables
#
for UNI/SMP mode only (code change in
#
tpcdbatch) (if not uni mode then must
#
change load_update)
#
false = use load for staging tables
# The
default is false if not set.
#
NOTE that this parm is only for UNI/SMP
# it
is not for multi node invocation
TPCD_SPLIT_UPDATES=64 #
number of chunks to split the update
#
function into.
TPCD_CONCURRENT_INSERTS=16 #
number of insert chunks that are run
#
concurrently. TPCD_SPLIT_UPDATES
#
should be evenly divisible by this number
TPCD_CONCURRENT_INSERTS_LOAD=4 #
number of insert chunks that are loaded
#
concurrently. TPCD_SPLIT_UPDATES should
# be
evenly divisible by this number.
#
this controls the load portion of the
#
insert routine for partitioned databases
TPCD_CONCURRENT_DELETES=8 #
number of delete chunks that are run
©Copyright IBM Corporation TPC Benchmark H Full Disclosure Report May 2005 Page: 57
Page 60

TPCD_SPLIT_DELETES=64 #
number of portions to split the delete
#
function into.
#
this variable is only valid in UNI/SMP
#
mode.
TPCD_GEN_UPDATEPAIRS=20 #
number of pairs of update function data
# to
generate
# if
0 the update data generation and
#
setup will not be done. use this if
# you
don't want to run the update
#
functions (Update functions not
#
fully tested in new env't yet)
TPCD_GENERATE_SEED_FILE=yes #
yes/no These are the seed files for
#
generating the query substitution values
# yes
- generate a seed file base on
#
year/month/day (for audited runs)
# no
- use qgen's default seeds
TPCD_RUN_ON_MULTIPLE_NODES=NULL # pe
V1.2 only - will we be running each
#
query stream of throughput starting at
#
different nodes or from same node
TPCD_STATS_INTERVAL=30 #
timing interval for vmstats/iostats
TPCD_STATS_THRU_INT=300 #
timing interval for vmstats/iostats for
#
throughput run
TPCD_GATHER_STATS=off #
on/off - only implement for AIX yet
# on
= gather statistics around power
#
test run (vmstat,iostat,netstat)
# off
= no stats gathered during power run
TPCD_UFTEMP=DATA_INDEX #
base name of tablespace(s) where the
#
staging tables for the update functions
# are
created
#
this name will be used as the
#
basename for the tablespaces...eg
#
UFTEMP1 UFTEMP2 ....
TPCD_HAVECOMPILER=yes #
rebuild tpcdbatch executable
#
yes/no
TPCD_SLEEP=5 # ?
TPCD_INLISTMAX=default # max
num of keys to delete at a time
# for
UF2, use "default" for default.
TPCD_LOAD_SCRIPT=load_tables.ksh #
script to run for loading tables
# in
TPCD_DDLPATH directory under mln/mpp
#
leave as NULL if using default genloaduni
TPCD_LOAD_SCRIPT_QUAL=NULL #
script to run for loading tables in
#
TPCD_DDLPATH directory under mln/mpp
# for
QUAL db
TPCD_ROOTPRIV=no # do
you have root privileges to be able
# get
values of things like schedtune
# and
vmtune (currently on AIX only)
#
acid test specific information
TPCD_DB2LOG=/home/tpch/sqllib/db2dump
# directory wehre the db2diag.log can
# be
found for the durability tests
TPCD_APPEND_ON=no # set
to no if the cluster indexes are used
Appendix C: Qualification Query
Output
Qualification Queries
Query 1
Start timestamp 05/11/05 14:44:46.330949
--------------------------------------------
-
-- Query 01 - Var_0 Rev_01 - Pricing Summary
Report Query
Tag: Q1 Stream: -1 Sequence number: 17
select
l_returnflag,
l_linestatus,
sum(l_quantity) as sum_qty,
sum(l_extendedprice) as sum_base_price,
sum(l_extendedprice * (1 - l_discount)) as
sum_disc_price,
sum(l_extendedprice * (1 - l_discount) * (1
+ l_tax)) as sum_charge,
avg(l_quantity) as avg_qty,
avg(l_extendedprice) as avg_price,
avg(l_discount) as avg_disc,
count_big(*) as count_order
from
©Copyright IBM Corporation TPC Benchmark H Full Disclosure Report May 2005 Page: 58
Page 61

_
tpcd.lineitem
where
l_shipdate <= date ('1998-12-01') - 90 day
group by
l_returnflag,
l_linestatus
order by
l_returnflag,
l_linestatus
L_RETURNFLAG L_LINESTATUS SUM_QTY
SUM_BASE_PRICE SUM_DISC_PRICE
SUM_CHARGE AVG_QTY
AVG_PRICE AVG_DISC
COUNT_ORDER
--------------------------------------------
--------------------------------------------
--------------------------------------------
--------------------------------------------
--------------------------------------A F
37734107.000 56586554400.729
53758257134.869 55909065222.828
25.522 38273.130
0.050 1478493.
N F
991417.000 1487504710.380
1413082168.054 1469649223.194
25.516 38284.468
0.050 38854.
N O
74476040.000 111701729697.743
106118230307.606 110367043872.499
25.502 38249.118
0.050 2920374.
R F
37719753.000 56568041380.899
53741292684.604 55889619119.832
25.506 38250.855
0.050 1478870.
Number of rows retrieved is: 4
--------------------------------------------
-
Stop timestamp 05/11/05 14:44:58.596481
Query Time = 12.3 secs
Query 2
Start timestamp 05/11/05 14:42:14.342621
--------------------------------------------
-
-- Query 02 - Var_0 Rev_02 - Minimum Cost
Supplier Query
Tag: Q2 Stream: -1 Sequence number: 2
select
s_acctbal,
s_name,
n_name,
p_partkey,
p_mfgr,
s_address,
s_phone,
s_comment
from
tpcd.part,
tpcd.supplier,
tpcd.partsupp,
tpcd.nation,
tpcd.region
where
p_partkey = ps_partkey
and s_suppkey = ps_suppkey
and p_size = 15
and p_type like '%BRASS'
and s_nationkey = n_nationkey
and n_regionkey = r_regionkey
and r_name = 'EUROPE'
and ps_supplycost = (
select
min(ps_supplycost)
from
tpcd.partsupp,
tpcd.supplier,
tpcd.nation,
tpcd.region
where
p_partkey = ps_partkey
and s_suppkey = ps_suppkey
and s_nationkey = n_nationkey
and n_regionkey = r_regionkey
and r_name = 'EUROPE'
)
order by
s_acctbal desc,
n_name,
s_name,
p_partkey
fetch first 100 rows only
S_ACCTBAL S_NAME
N_NAME P_PARTKEY
P_MFGR S_ADDRESS
S
PHONE S_COMMENT
--------------------------------------------
--------------------------------------------
--------------------------------------------
--------------------------------------------
--------------------------------------------
--------------------------------------------
--------------
9938.530 Supplier#000005359
UNITED KINGDOM 185358
Manufacturer#4
QKuHYh,vZGiwu2FWEJoLDx04
33-429-790-6131 blithely silent pinto beans
are furiously. slyly final deposits acros
9937.840 Supplier#000005969
ROMANIA 108438
Manufacturer#1
ANDENSOSmk,miq23Xfb5RWt6dvUcvt6Qa
29-520-692-3537 carefully slow deposits use
furiously. slyly ironic platelets above the
ironic
9936.220 Supplier#000005250
UNITED KINGDOM 249
Manufacturer#4
B3rqp0xbSEim4Mpy2RH J
33-320-228-2957 blithely special packages
are. stealthily express deposits across the
closely final instructi
©Copyright IBM Corporation TPC Benchmark H Full Disclosure Report May 2005 Page: 59
Page 62

9923.770 Supplier#000002324
GERMANY 29821
Manufacturer#4 y3OD9UywSTOk
17-779-299-1839 quickly express packages
breach quiet pinto beans. requ
… Lines Deleted
7894.560 Supplier#000007981
GERMANY 85472
Manufacturer#4 NSJ96vMROAbeXP
17-963-404-3760 regular, even theodolites
integrate carefully. bold, special
theodolites are slyly fluffily iron
7887.080 Supplier#000009792
GERMANY 164759
Manufacturer#3
Y28ITVeYriT3kIGdV2K8fSZ V2UqT5H1Otz
17-988-938-4296 pending, ironic packages
sleep among the carefully ironic accounts.
quickly final accounts
7871.500 Supplier#000007206
RUSSIA 104695
Manufacturer#1 3w
fNCnrVmvJjE95sgWZzvW 32432-452-7731 furiously dogged pinto beans
cajole. bold, express notornis until the
slyly pending
7852.450 Supplier#000005864
RUSSIA 8363
Manufacturer#4 WCNfBPZeSXh3h,c
32-454-883-3821 blithely regular deposits
7850.660 Supplier#000001518
UNITED KINGDOM 86501
Manufacturer#1 ONda3YJiHKJOC
33-730-383-3892 furiously final accounts
wake carefully idle requests. even dolphins
wake acc
7843.520 Supplier#000006683
FRANCE 11680
Manufacturer#4
2Z0JGkiv01Y00oCFwUGfviIbhzCdy
16-464-517-8943 carefully bold accounts
doub
Number of rows retrieved is: 100
--------------------------------------------
-
Stop timestamp 05/11/05 14:42:14.956494
Query Time = 0.6 secs
Query 3
Start timestamp 05/11/05 14:44:16.088809
--------------------------------------------
-
-- Query 03 - Var_0 Rev_01 - Shipping
Priority Query
Tag: Q3 Stream: -1 Sequence number: 11
select
l_orderkey,
sum(l_extendedprice * (1 - l_discount)) as
revenue,
o_orderdate,
o_shippriority
from
tpcd.customer,
tpcd.orders,
tpcd.lineitem
where
c_mktsegment = 'BUILDING'
and c_custkey = o_custkey
and l_orderkey = o_orderkey
and o_orderdate < date ('1995-03-15')
and l_shipdate > date ('1995-03-15')
group by
l_orderkey,
o_orderdate,
o_shippriority
order by
revenue desc,
o_orderdate
fetch first 10 rows only
L_ORDERKEY REVENUE
O_ORDERDATE O_SHIPPRIORITY
--------------------------------------------
--------------------------- 2456423 406181.011
1995-03-05 0
3459808 405838.699
1995-03-04 0
492164 390324.061
1995-02-19 0
1188320 384537.936
1995-03-09 0
2435712 378673.056
1995-02-26 0
4878020 378376.795
1995-03-12 0
5521732 375153.922
1995-03-13 0
2628192 373133.309
1995-02-22 0
993600 371407.459
1995-03-05 0
2300070 367371.145
1995-03-13 0
Number of rows retrieved is: 10
--------------------------------------------
-
Stop timestamp 05/11/05 14:44:29.400192
Query Time = 13.3 secs
Query 4
Start timestamp 05/11/05 14:44:32.326315
--------------------------------------------
-
-- Query 04 - Var_0 Rev_01 - Order Priority
Checking Query
Tag: Q4 Stream: -1 Sequence number: 14
©Copyright IBM Corporation TPC Benchmark H Full Disclosure Report May 2005 Page: 60
Page 63

select
o_orderpriority,
count(*) as order_count
from
tpcd.orders
where
o_orderdate >= date ('1993-07-01')
and o_orderdate < date ('1993-07-01') + 3
month
and exists (
select
*
from
tpcd.lineitem
where
l_orderkey = o_orderkey
and l_commitdate < l_receiptdate
)
group by
o_orderpriority
order by
o_orderpriority
O_ORDERPRIORITY ORDER_COUNT
-----------------------------1-URGENT 10594
2-HIGH 10476
3-MEDIUM 10410
4-NOT SPECIFIED 10556
5-LOW 10487
Number of rows retrieved is: 5
--------------------------------------------
-
Stop timestamp 05/11/05 14:44:45.334065
Query Time = 13.0 secs
Query 5
Start timestamp 05/11/05 14:45:24.525118
--------------------------------------------
-
-- Query 05 - Var_0 Rev_02 Local Supplier
Volume Query
Tag: Q5 Stream: -1 Sequence number: 20
select
n_name,
sum(l_extendedprice * (1 - l_discount)) as
revenue
from
tpcd.customer,
tpcd.orders,
tpcd.lineitem,
tpcd.supplier,
tpcd.nation,
tpcd.region
where
c_custkey = o_custkey
and o_orderkey = l_orderkey
and l_suppkey = s_suppkey
and c_nationkey = s_nationkey
and s_nationkey = n_nationkey
and n_regionkey = r_regionkey
and r_name = 'ASIA'
and o_orderdate >= date ('1994-01-01')
and o_orderdate < date ('1994-01-01') + 1
year
group by
n_name
order by
revenue desc
N_NAME REVENUE
--------------------------------------------
----INDONESIA
55502041.170
VIETNAM
55295086.997
CHINA
53724494.257
INDIA
52035512.000
JAPAN
45410175.695
Number of rows retrieved is: 5
--------------------------------------------
-
Stop timestamp 05/11/05 14:45:40.170890
Query Time = 15.6 secs
Query 6
Start timestamp 05/11/05 14:42:43.447711
--------------------------------------------
-
-- Query 06 - Var_0 Rev_01 - Forecasting
Revenue Change Query
Tag: Q6 Stream: -1 Sequence number: 5
select
sum(l_extendedprice * l_discount) as revenue
from
tpcd.lineitem
where
l_shipdate >= date ('1994-01-01')
and l_shipdate < date ('1994-01-01') + 1
year
and l_discount between .06 - 0.01 and .06 +
0.01
and l_quantity < 24
REVENUE
----------------------
123141078.228
Number of rows retrieved is: 1
--------------------------------------------
-
©Copyright IBM Corporation TPC Benchmark H Full Disclosure Report May 2005 Page: 61
Page 64

Stop timestamp 05/11/05 14:42:45.198806
Query Time = 1.8 secs
Query 7
Start timestamp 05/11/05 14:45:40.170890
--------------------------------------------
-
-- Query 07 - Var_0 Rev_01 - Volume Shipping
Query
Tag: Q7 Stream: -1 Sequence number: 21
select
supp_nation,
cust_nation,
l_year,
sum(volume) as revenue
from
(
select
n1.n_name as supp_nation,
n2.n_name as cust_nation,
year (l_shipdate) as l_year,
l_extendedprice * (1 - l_discount) as volume
from
tpcd.supplier,
tpcd.lineitem,
tpcd.orders,
tpcd.customer,
tpcd.nation n1,
tpcd.nation n2
where
s_suppkey = l_suppkey
and o_orderkey = l_orderkey
and c_custkey = o_custkey
and s_nationkey = n1.n_nationkey
and c_nationkey = n2.n_nationkey
and (
(n1.n_name = 'FRANCE' and n2.n_name =
'GERMANY')
or (n1.n_name = 'GERMANY' and n2.n_name =
'FRANCE')
)
and l_shipdate between date('1995-01-01')
and date('1996-12-31')
) as shipping
group by
supp_nation,
cust_nation,
l_year
order by
supp_nation,
cust_nation,
l_year
SUPP_NATION CUST_NATION
L_YEAR REVENUE
--------------------------------------------
--------------------------------------------
FRANCE GERMANY
1995 54639732.734
FRANCE GERMANY
1996 54633083.308
GERMANY FRANCE
1995 52531746.670
GERMANY FRANCE
1996 52520549.022
Number of rows retrieved is: 4
--------------------------------------------
-
Stop timestamp 05/11/05 14:45:45.180910
Query Time = 5.0 secs
Query 8
Start timestamp 05/11/05 14:43:11.929282
--------------------------------------------
-
-- Query 08 - Var_0 Rev_01 - National Market
Share Query
Tag: Q8 Stream: -1 Sequence number: 8
select
o_year,
sum(case
when nation = 'BRAZIL' then volume
else 0
end) / sum(volume) as mkt_share
from
(
select
year(o_orderdate) as o_year,
l_extendedprice * (1 - l_discount) as
volume,
n2.n_name as nation
from
tpcd.part,
tpcd.supplier,
tpcd.lineitem,
tpcd.orders,
tpcd.customer,
tpcd.nation n1,
tpcd.nation n2,
tpcd.region
where
p_partkey = l_partkey
and s_suppkey = l_suppkey
and l_orderkey = o_orderkey
and o_custkey = c_custkey
and c_nationkey = n1.n_nationkey
and n1.n_regionkey = r_regionkey
and r_name = 'AMERICA'
and s_nationkey = n2.n_nationkey
and o_orderdate between date('1995-01-01')
and date ('1996-12-31')
and p_type = 'ECONOMY ANODIZED STEEL'
) as all_nations
group by
o_year
order by
o_year
©Copyright IBM Corporation TPC Benchmark H Full Disclosure Report May 2005 Page: 62
Page 65

O_YEAR MKT_SHARE
---------------------------------- 1995 0.034
1996 0.041
Number of rows retrieved is: 2
--------------------------------------------
-
Stop timestamp 05/11/05 14:43:29.298068
Query Time = 17.4 secs
Query 9
Start timestamp 05/11/05 14:42:14.956494
--------------------------------------------
-
-- Query 09 - Var_0 Rev_01 - Product Type
Profit Measure Query
Tag: Q9 Stream: -1 Sequence number: 3
select
nation,
o_year,
sum(amount) as sum_profit
from
(
select
n_name as nation,
year(o_orderdate) as o_year,
l_extendedprice * (1 - l_discount) ps_supplycost * l_quantity as amount
from
tpcd.part,
tpcd.supplier,
tpcd.lineitem,
tpcd.partsupp,
tpcd.orders,
tpcd.nation
where
s_suppkey = l_suppkey
and ps_suppkey = l_suppkey
and ps_partkey = l_partkey
and p_partkey = l_partkey
and o_orderkey = l_orderkey
and s_nationkey = n_nationkey
and p_name like '%green%'
) as profit
group by
nation,
o_year
order by
nation,
o_year desc
NATION O_YEAR
SUM_PROFIT
--------------------------------------------
-----------------ALGERIA 1998
31342867.235
ALGERIA 1997
57138193.023
ALGERIA 1996
56140140.133
ALGERIA 1995
53051469.653
ALGERIA 1994
53867582.129
… Lines Deleted
VIETNAM 1996
50488161.410
VIETNAM 1995
49658284.612
VIETNAM 1994
50596057.261
VIETNAM 1993
50953919.152
VIETNAM 1992
49613838.315
Number of rows retrieved is: 175
--------------------------------------------
-
Stop timestamp 05/11/05 14:42:41.405885
Query Time = 26.4 secs
Query 10
Start timestamp 05/11/05 14:44:58.596481
--------------------------------------------
-
-- Query 10 - Var_0 Rev_01 - Returned Item
Reporting Query
Tag: Q10 Stream: -1 Sequence number: 18
select
c_custkey,
c_name,
sum(l_extendedprice * (1 - l_discount)) as
revenue,
c_acctbal,
n_name,
c_address,
c_phone,
c_comment
from
tpcd.customer,
tpcd.orders,
tpcd.lineitem,
tpcd.nation
where
c_custkey = o_custkey
and l_orderkey = o_orderkey
and o_orderdate >= date ('1993-10-01')
and o_orderdate < date ('1993-10-01') + 3
month
and l_returnflag = 'R'
and c_nationkey = n_nationkey
group by
c_custkey,
c_name,
c_acctbal,
©Copyright IBM Corporation TPC Benchmark H Full Disclosure Report May 2005 Page: 63
Page 66

c_phone,
n_name,
c_address,
c_comment
order by
revenue desc
fetch first 20 rows only
C_CUSTKEY C_NAME
REVENUE C_ACCTBAL
N_NAME C_ADDRESS
C_PHONE C_COMMENT
--------------------------------------------
--------------------------------------------
--------------------------------------------
--------------------------------------------
--------------------------------------------
--------------------------------------------
------------------------ 57040 Customer#0000057040
734235.246 632.870 JAPAN
Eioyzjf4pp
22-895-641-3466 requests sleep blithely
about the furiously i
143347 Customer#0000143347
721002.695 2557.470 EGYPT
1aReFYv,Kw4
14-742-935-3718 fluffily bold excuses
haggle finally after the u
60838 Customer#0000060838
679127.308 2454.770 BRAZIL
64EaJ5vMAHWJlBOxJklpNc2RJiWE
12-913-494-9813 furiously even pinto beans
integrate under the ruthless foxes; ironic,
even dolphins across the slyl
101998 Customer#0000101998
637029.567 3790.890 UNITED
KINGDOM 01c9CILnNtfOQYmZj
33-593-865-6378 accounts doze blithely!
enticing, final deposits sleep blithely
special accounts. slyly express accounts pla
125341 Customer#0000125341
633508.086 4983.510 GERMANY
S29ODD6bceU8QSuuEJznkNaK
17-582-695-5962 quickly express requests
wake quickly blithely
25501 Customer#0000025501
620269.785 7725.040 ETHIOPIA
W556MXuoiaYCCZamJI,Rn0B4ACUGdkQ8DZ
15-874-808-6793 quickly special requests
sleep evenly among the special deposits.
special deposi
115831 Customer#0000115831
596423.867 5098.100 FRANCE
rFeBbEEyk dl ne7zV5fDrmiq1oK09wV7pxqCgIc
16-715-386-3788 carefully bold excuses
sleep alongside of the thinly idle
84223 Customer#0000084223
594998.024 528.650 UNITED
KINGDOM nAVZCs6BaWap rrM27N
2qBnzc5WBauxbA 33-442-824-8191
pending, final ideas haggle final requests.
unusual, regular asymptotes affix according
to the even foxes.
54289 Customer#0000054289
585603.392 5583.020 IRAN
vXCxoCsU0Bad5JQI ,oobkZ
20-834-292-4707 express requests sublate
blithely regular requests. regular, even
ideas solve.
39922 Customer#0000039922
584878.113 7321.110 GERMANY
Zgy4s50l2GKN4pLDPBU8m342gIw6R
17-147-757-8036 even pinto beans haggle.
slyly bold accounts inte
6226 Customer#0000006226
576783.761 2230.090 UNITED
KINGDOM
8gPu8,NPGkfyQQ0hcIYUGPIBWc,ybP5g,
33-657-701-3391 quickly final requests
against the regular instructions wake
blithely final instructions. pa
922 Customer#0000000922
576767.533 3869.250 GERMANY
Az9RFaut7NkPnc5zSD2PwHgVwr4jRzq
17-945-916-9648 boldly final requests
cajole blith
147946 Customer#0000147946
576455.132 2030.130 ALGERIA
iANyZHjqhyy7Ajah0pTrYyhJ
10-886-956-3143 furiously even accounts are
blithely above the furiousl
115640 Customer#0000115640
569341.193 6436.100 ARGENTINA
Vtgfia9qI 7EpHgecU1X
11-411-543-4901 final instructions are
slyly according to the
73606 Customer#0000073606
568656.858 1785.670 JAPAN
xuR0Tro5yChDfOCrjkd2ol
22-437-653-6966 furiously bold orbits about
the furiously busy requests wake across the
furiously quiet theodolites. d
110246 Customer#0000110246
566842.981 7763.350 VIETNAM
7KzflgX MDOq7sOkI
31-943-426-9837 dolphins sleep blithely
among the slyly final
142549 Customer#0000142549
563537.237 5085.990 INDONESIA
ChqEoK43OysjdHbtKCp6dKqjNyvvi9
19-955-562-2398 regular, unusual
dependencies boost slyly; ironic attainments
nag fluffily into the unusual packages?
146149 Customer#0000146149
557254.986 1791.550 ROMANIA
s87fvzFQpU
29-744-164-6487 silent, unusual requests
detect quickly slyly regul
52528 Customer#0000052528
556397.351 551.790 ARGENTINA
NFztyTOR10UOJ
11-208-192-3205 unusual requests detect.
slyly dogged theodolites use slyly. deposit
23431 Customer#0000023431
554269.536 3381.860 ROMANIA
HgiV0phqhaIa9aydNoIlb
29-915-458-2654 instructions nag quickly.
furiously bold accounts cajol
Number of rows retrieved is: 20
--------------------------------------------
-
Stop timestamp 05/11/05 14:45:11.811434
Query Time = 13.2 secs
©Copyright IBM Corporation TPC Benchmark H Full Disclosure Report May 2005 Page: 64
Page 67

Query 11
Start timestamp 05/11/05 14:44:45.334065
--------------------------------------------
-
-- Query 11 - Var_0 Rev_01 - Important Stock
Identification Query
Tag: Q11 Stream: -1 Sequence number: 15
select
ps_partkey,
sum(ps_supplycost * ps_availqty) as value
from
tpcd.partsupp,
tpcd.supplier,
tpcd.nation
where
ps_suppkey = s_suppkey
and s_nationkey = n_nationkey
and n_name = 'GERMANY'
group by
ps_partkey having
sum(ps_supplycost * ps_availqty) > (
select
sum(ps_supplycost * ps_availqty) *
0.0001000000
from
tpcd.partsupp,
tpcd.supplier,
tpcd.nation
where
ps_suppkey = s_suppkey
and s_nationkey = n_nationkey
and n_name = 'GERMANY'
)
order by
value desc
PS_PARTKEY VALUE
---------------------------------- 129760 17538456.860
166726 16503353.920
191287 16474801.970
161758 16101755.540
34452 15983844.720
… Lines Deleted
154731 7888301.330
101674 7879324.600
51968 7879102.210
72073 7877736.110
5182 7874521.730
Number of rows retrieved is: 1048
--------------------------------------------
-
Stop timestamp 05/11/05 14:44:45.759036
Query Time = 0.4 secs
Query 12
Start timestamp 05/11/05 14:45:45.180910
--------------------------------------------
-
-- Query 12 - Var_0 Rev_02 - Shipping Modes
and Order Priority Query
Tag: Q12 Stream: -1 Sequence number: 22
select
l_shipmode,
sum(case
when o_orderpriority = '1-URGENT'
or o_orderpriority = '2-HIGH'
then 1
else 0
end) as high_line_count,
sum(case
when o_orderpriority <> '1-URGENT'
and o_orderpriority <> '2-HIGH'
then 1
else 0
end) as low_line_count
from
tpcd.orders,
tpcd.lineitem
where
o_orderkey = l_orderkey
and l_shipmode in ('MAIL', 'SHIP')
and l_commitdate < l_receiptdate
and l_shipdate < l_commitdate
and l_receiptdate >= date ('1994-01-01')
and l_receiptdate < date ('1994-01-01') + 1
year
group by
l_shipmode
order by
l_shipmode
L_SHIPMODE HIGH_LINE_COUNT LOW_LINE_COUNT
--------------------------------------------
MAIL 6202 9324
SHIP 6200 9262
Number of rows retrieved is: 2
--------------------------------------------
-
Stop timestamp 05/11/05 14:45:58.076337
Query Time = 12.9 secs
Query 13
Start timestamp 05/11/05 14:44:10.427730
--------------------------------------------
-
-- Query 13 - Var_0 Rev_01 - Customer
Distribution Query
Tag: Q13 Stream: -1 Sequence number: 10
©Copyright IBM Corporation TPC Benchmark H Full Disclosure Report May 2005 Page: 65
Page 68

select
c_count,
count(*) as custdist
from
(
select
c_custkey,
count(o_orderkey)
from
tpcd.customer left outer join tpcd.orders on
c_custkey = o_custkey
and o_comment not like '%special%requests%'
group by
c_custkey
) as c_orders (c_custkey, c_count)
group by
c_count
order by
custdist desc,
c_count desc
C_COUNT CUSTDIST
------------------------- 0 50004
9 6641
10 6566
11 6058
8 5949
… Lines Deleted
37 7
40 4
38 4
39 2
41 1
Number of rows retrieved is: 42
--------------------------------------------
-
Stop timestamp 05/11/05 14:44:16.088809
Query Time = 5.7 secs
Query 14
Start timestamp 05/11/05 14:42:12.394778
--------------------------------------------
-
--#SET ROWS_OUT -1 ROWS_FETCH -1
-- Query 14 - Var_0 Rev_01 - Promotion
Effect Query
Tag: Q14 Stream: -1 Sequence number: 1
select
100.00 * sum(case
when p_type like 'PROMO%'
then l_extendedprice * (1 - l_discount)
else 0
end) / sum(l_extendedprice * (1 l_discount)) as promo_revenue
from
tpcd.lineitem,
tpcd.part
where
l_partkey = p_partkey
and l_shipdate >= date ('1995-09-01')
and l_shipdate < date ('1995-09-01') + 1
month
PROMO_REVENUE
----------------------
16.381
Number of rows retrieved is: 1
--------------------------------------------
-
Stop timestamp 05/11/05 14:42:14.342621
Query Time = 1.9 secs
Query 15a
Start timestamp 05/11/05 14:44:45.759036
--------------------------------------------
-
-- Query 15 - Var_a Rev_01 - Top Supplier
Query
Tag: Q15a Stream: -1 Sequence number: 16
with revenue (supplier_no, total_revenue) as
(
select
l_suppkey,
sum(l_extendedprice * (1-l_discount))
from
tpcd.lineitem
where
l_shipdate >= date ('1996-01-01')
and l_shipdate < date ('1996-01-01') + 3
month
group by
l_suppkey
)
select
s_suppkey,
s_name,
s_address,
s_phone,
total_revenue
from
tpcd.supplier,
revenue
where
s_suppkey = supplier_no
and total_revenue = (
select
max(total_revenue)
from
revenue
)
order by
s_suppkey
©Copyright IBM Corporation TPC Benchmark H Full Disclosure Report May 2005 Page: 66
Page 69

S_SUPPKEY S_NAME
S_ADDRESS
S_PHONE TOTAL_REVENUE
--------------------------------------------
--------------------------------------------
-------------------------------- 8449 Supplier#000008449
Wp34zim9qYFbVctdW
20-469-856-8873 1772627.209
Number of rows retrieved is: 1
--------------------------------------------
-
Stop timestamp 05/11/05 14:44:46.330949
Query Time = 0.6 secs
Query 16
Start timestamp 05/11/05 14:44:31.539340
--------------------------------------------
-
-- Query 16 - Var_0 Rev_01 - Parts/Supplier
Relationship Query
Tag: Q16 Stream: -1 Sequence number: 13
select
p_brand,
p_type,
p_size,
count(distinct ps_suppkey) as supplier_cnt
from
tpcd.partsupp,
tpcd.part
where
p_partkey = ps_partkey
and p_brand <> 'Brand#45'
and p_type not like 'MEDIUM POLISHED%'
and p_size in (49, 14, 23, 45, 19, 3, 36, 9)
and ps_suppkey not in (
select
s_suppkey
from
tpcd.supplier
where
s_comment like '%Customer%Complaints%'
)
group by
p_brand,
p_type,
p_size
order by
supplier_cnt desc,
p_brand,
p_type,
p_size
P_BRAND P_TYPE
P_SIZE SUPPLIER_CNT
--------------------------------------------
---------------------Brand#41 MEDIUM BRUSHED TIN
3 28
Brand#54 STANDARD BRUSHED COPPER
14 27
Brand#11 STANDARD BRUSHED TIN
23 24
Brand#11 STANDARD BURNISHED BRASS
36 24
Brand#15 MEDIUM ANODIZED NICKEL
3 24
… Lines Deleted
Brand#52 MEDIUM BRUSHED BRASS
45 3
Brand#53 MEDIUM BRUSHED TIN
45 3
Brand#54 ECONOMY POLISHED BRASS
9 3
Brand#55 PROMO PLATED BRASS
19 3
Brand#55 STANDARD PLATED TIN
49 3
Number of rows retrieved is: 18314
--------------------------------------------
-
Stop timestamp 05/11/05 14:44:32.326315
Query Time = 0.8 secs
Query 17
Start timestamp 05/11/05 14:42:45.198806
--------------------------------------------
-
-- Query 17 - Var_0 Rev_01 - Small-QuantityOrder Revenue Query
Tag: Q17 Stream: -1 Sequence number: 6
select
sum(l_extendedprice) / 7.0 as avg_yearly
from
tpcd.lineitem,
tpcd.part
where
p_partkey = l_partkey
and p_brand = 'Brand#23'
and p_container = 'MED BOX'
and l_quantity < (
select
0.2 * avg(l_quantity)
from
tpcd.lineitem
where
l_partkey = p_partkey
)
AVG_YEARLY
----------------------
348406.054
Number of rows retrieved is: 1
©Copyright IBM Corporation TPC Benchmark H Full Disclosure Report May 2005 Page: 67
Page 70

--------------------------------------------
-
Stop timestamp 05/11/05 14:42:57.147524
Query Time = 11.9 secs
Query 18
Start timestamp 05/11/05 14:42:57.147524
--------------------------------------------
-
-- Query 18 - Var_0 Rev_01 - Large Volume
Customer Query
Tag: Q18 Stream: -1 Sequence number: 7
select
c_name,
c_custkey,
o_orderkey,
o_orderdate,
o_totalprice,
sum(l_quantity)
from
tpcd.customer,
tpcd.orders,
tpcd.lineitem
where
o_orderkey in (
select
l_orderkey
from
tpcd.lineitem
group by
l_orderkey having
sum(l_quantity) > 300
)
and c_custkey = o_custkey
and o_orderkey = l_orderkey
group by
c_name,
c_custkey,
o_orderkey,
o_orderdate,
o_totalprice
order by
o_totalprice desc,
o_orderdate
fetch first 100 rows only
C_NAME C_CUSTKEY
O_ORDERKEY O_ORDERDATE
O_TOTALPRICE 6
--------------------------------------------
--------------------------------------------
-----------------------------Customer#0000128120 128120
4722021 1994-04-07 544089.090
323.000
Customer#0000144617 144617
3043270 1997-02-12 530604.440
317.000
Customer#0000013940 13940
2232932 1997-04-13 522720.610
304.000
Customer#0000066790 66790
2199712 1996-09-30 515531.820
327.000
Customer#0000046435 46435
4745607 1997-07-03 508047.990
309.000
Customer#0000015272 15272
3883783 1993-07-28 500241.330
302.000
Customer#0000146608 146608
3342468 1994-06-12 499794.580
303.000
Customer#0000096103 96103
5984582 1992-03-16 494398.790
312.000
Customer#0000024341 24341
1474818 1992-11-15 491348.260
302.000
Customer#0000137446 137446
5489475 1997-05-23 487763.250
311.000
Customer#0000107590 107590
4267751 1994-11-04 485141.380
301.000
Customer#0000050008 50008
2366755 1996-12-09 483891.260
302.000
Customer#0000015619 15619
3767271 1996-08-07 480083.960
318.000
Customer#0000077260 77260
1436544 1992-09-12 479499.430
307.000
Customer#0000109379 109379
5746311 1996-10-10 478064.110
302.000
Customer#0000054602 54602
5832321 1997-02-09 471220.080
307.000
Customer#0000105995 105995
2096705 1994-07-03 469692.580
307.000
Customer#0000148885 148885
2942469 1992-05-31 469630.440
313.000
Customer#0000114586 114586
551136 1993-05-19 469605.590
308.000
Customer#0000105260 105260
5296167 1996-09-06 469360.570
303.000
Customer#0000147197 147197
1263015 1997-02-02 467149.670
320.000
Customer#0000064483 64483
2745894 1996-07-04 466991.350
304.000
Customer#0000136573 136573
2761378 1996-05-31 461282.730
301.000
Customer#0000016384 16384
502886 1994-04-12 458378.920
312.000
Customer#0000117919 117919
2869152 1996-06-20 456815.920
317.000
Customer#0000012251 12251
735366 1993-11-24 455107.260
309.000
©Copyright IBM Corporation TPC Benchmark H Full Disclosure Report May 2005 Page: 68
Page 71

Customer#0000120098 120098
1971680 1995-06-14 453451.230
308.000
Customer#0000066098 66098
5007490 1992-08-07 453436.160
304.000
Customer#0000117076 117076
4290656 1997-02-05 449545.850
301.000
Customer#0000129379 129379
4720454 1997-06-07 448665.790
303.000
Customer#0000126865 126865
4702759 1994-11-07 447606.650
320.000
Customer#0000088876 88876
983201 1993-12-30 446717.460
304.000
Customer#0000036619 36619
4806726 1995-01-17 446704.090
328.000
Customer#0000141823 141823
2806245 1996-12-29 446269.120
310.000
Customer#0000053029 53029
2662214 1993-08-13 446144.490
302.000
Customer#0000018188 18188
3037414 1995-01-25 443807.220
308.000
Customer#0000066533 66533
29158 1995-10-21 443576.500
305.000
Customer#0000037729 37729
4134341 1995-06-29 441082.970
309.000
Customer#0000003566 3566
2329187 1998-01-04 439803.360
304.000
Customer#0000045538 45538
4527553 1994-05-22 436275.310
305.000
Customer#0000081581 81581
4739650 1995-11-04 435405.900
305.000
Customer#0000119989 119989
1544643 1997-09-20 434568.250
320.000
Customer#0000003680 3680
3861123 1998-07-03 433525.970
301.000
Customer#0000113131 113131
967334 1995-12-15 432957.750
301.000
Customer#0000141098 141098
565574 1995-09-24 430986.690
301.000
Customer#0000093392 93392
5200102 1997-01-22 425487.510
304.000
Customer#0000015631 15631
1845057 1994-05-12 419879.590
302.000
Customer#0000112987 112987
4439686 1996-09-17 418161.490
305.000
Customer#0000012599 12599
4259524 1998-02-12 415200.610
304.000
Customer#0000105410 105410
4478371 1996-03-05 412754.510
302.000
Customer#0000149842 149842
5156581 1994-05-30 411329.350
302.000
Customer#0000010129 10129
5849444 1994-03-21 409129.850
309.000
Customer#0000069904 69904
1742403 1996-10-19 408513.000
305.000
Customer#0000017746 17746
6882 1997-04-09 408446.930
303.000
Customer#0000013072 13072
1481925 1998-03-15 399195.470
301.000
Customer#0000082441 82441
857959 1994-02-07 382579.740
305.000
Customer#0000088703 88703
2995076 1994-01-30 363812.120
302.000
Number of rows retrieved is: 57
--------------------------------------------
-
Stop timestamp 05/11/05 14:43:11.929282
Query Time = 14.8 secs
Query 19
Start timestamp 05/11/05 14:45:11.811434
--------------------------------------------
-
-- Query 19 - Var_0 Rev_01 - Discounted
Revenue Query
Tag: Q19 Stream: -1 Sequence number: 19
select
sum(l_extendedprice* (1 - l_discount)) as
revenue
from
tpcd.lineitem,
tpcd.part
where
(
p_partkey = l_partkey
and p_brand = 'Brand#12'
and p_container in ('SM CASE', 'SM BOX', 'SM
PACK', 'SM PKG')
and l_quantity >= 1 and l_quantity <= 1 + 10
and p_size between 1 and 5
and l_shipmode in ('AIR', 'AIR REG')
and l_shipinstruct = 'DELIVER IN PERSON'
)
or
(
p_partkey = l_partkey
and p_brand = 'Brand#23'
©Copyright IBM Corporation TPC Benchmark H Full Disclosure Report May 2005 Page: 69
Page 72

_
and p_container in ('MED BAG', 'MED BOX',
'MED PKG', 'MED PACK')
and l_quantity >= 10 and l_quantity <= 10 +
10
and p_size between 1 and 10
and l_shipmode in ('AIR', 'AIR REG')
and l_shipinstruct = 'DELIVER IN PERSON'
)
or
(
p_partkey = l_partkey
and p_brand = 'Brand#34'
and p_container in ('LG CASE', 'LG BOX', 'LG
PACK', 'LG PKG')
and l_quantity >= 20 and l_quantity <= 20 +
10
and p_size between 1 and 15
and l_shipmode in ('AIR', 'AIR REG')
and l_shipinstruct = 'DELIVER IN PERSON'
)
REVENUE
----------------------
3083843.058
Number of rows retrieved is: 1
--------------------------------------------
-
Stop timestamp 05/11/05 14:45:24.525118
Query Time = 12.7 secs
Query 20
Start timestamp 05/11/05 14:42:41.405885
--------------------------------------------
-
-- Query 20 - Var_0 Rev_01 - Potential Part
Promotion Query
Tag: Q20 Stream: -1 Sequence number: 4
select
s_name,
s_address
from
tpcd.supplier,
tpcd.nation
where
s_suppkey in (
select
ps_suppkey
from
tpcd.partsupp
where
ps_partkey in (
select
p_partkey
from
tpcd.part
where
p_name like 'forest%'
)
and ps_availqty > (
select
0.5 * sum(l_quantity)
from
tpcd.lineitem
where
l_partkey = ps_partkey
and l_suppkey = ps_suppkey
and l_shipdate >= date ('1994-01-01')
and l_shipdate < date ('1994-01-01') + 1
year
)
)
and s_nationkey = n_nationkey
and n_name = 'CANADA'
order by
s_name
S
NAME S_ADDRESS
--------------------------------------------
------------------------Supplier#000000020
iybAE,RmTymrZVYaFZva2SH,j
Supplier#000000091
YV45D7TkfdQanOOZ7q9QxkyGUapU1oOWU6q3
Supplier#000000197
YC2Acon6kjY3zj3Fbxs2k4Vdf7X0cd2F
Supplier#000000226
83qOdU2EYRdPQAQhEtn GRZEd
Supplier#000000285
Br7e1nnt1yxrw6ImgpJ7YdhFDjuBf
… Lines Deleted
Supplier#000009862 rJzweWeN58
Supplier#000009868
ROjGgx5gvtkmnUUoeyy7v
Supplier#000009869
ucLqxzrpBTRMewGSM29t0rNTM30g1Tu3Xgg3mKag
Supplier#000009899 7XdpAHrzr1t,UQFZE
Supplier#000009974
7wJ,J5DKcxSU4Kp1cQLpbcAvB5AsvKT
Number of rows retrieved is: 204
--------------------------------------------
-
Stop timestamp 05/11/05 14:42:43.447711
Query Time = 2.0 secs
Query 21
Start timestamp 05/11/05 14:43:29.298068
--------------------------------------------
-
-- Query 21 - Var_0 Rev_01 - Suppliers Who
Kept Orders Waiting Query
Tag: Q21 Stream: -1 Sequence number: 9
select
s_name,
count(*) as numwait
from
©Copyright IBM Corporation TPC Benchmark H Full Disclosure Report May 2005 Page: 70
Page 73

tpcd.supplier,
tpcd.lineitem l1,
tpcd.orders,
tpcd.nation
where
s_suppkey = l1.l_suppkey
and o_orderkey = l1.l_orderkey
and o_orderstatus = 'F'
and l1.l_receiptdate > l1.l_commitdate
and exists (
select
*
from
tpcd.lineitem l2
where
l2.l_orderkey = l1.l_orderkey
and l2.l_suppkey <> l1.l_suppkey
)
and not exists (
select
*
from
tpcd.lineitem l3
where
l3.l_orderkey = l1.l_orderkey
and l3.l_suppkey <> l1.l_suppkey
and l3.l_receiptdate > l3.l_commitdate
)
and s_nationkey = n_nationkey
and n_name = 'SAUDI ARABIA'
group by
s_name
order by
numwait desc,
s_name
fetch first 100 rows only
S_NAME NUMWAIT
---------------------------------------Supplier#000002829 20
Supplier#000005808 18
Supplier#000000262 17
Supplier#000000496 17
Supplier#000002160 17
Supplier#000002301 17
Supplier#000002540 17
Supplier#000003063 17
Supplier#000005178 17
Supplier#000008331 17
Supplier#000002005 16
Supplier#000002095 16
Supplier#000005799 16
Supplier#000005842 16
Supplier#000006450 16
Supplier#000006939 16
Supplier#000009200 16
Supplier#000009727 16
Supplier#000000486 15
Supplier#000000565 15
Supplier#000001046 15
Supplier#000001047 15
Supplier#000001161 15
Supplier#000001336 15
Supplier#000001435 15
Supplier#000003075 15
Supplier#000003335 15
Supplier#000005649 15
Supplier#000006027 15
Supplier#000006795 15
Supplier#000006800 15
Supplier#000006824 15
Supplier#000007131 15
Supplier#000007382 15
Supplier#000008913 15
Supplier#000009787 15
Supplier#000000633 14
Supplier#000001960 14
Supplier#000002323 14
Supplier#000002490 14
Supplier#000002993 14
Supplier#000003101 14
Supplier#000004489 14
Supplier#000005435 14
Supplier#000005583 14
Supplier#000005774 14
Supplier#000007579 14
Supplier#000008180 14
Supplier#000008695 14
Supplier#000009224 14
Supplier#000000357 13
Supplier#000000436 13
Supplier#000000610 13
Supplier#000000788 13
Supplier#000000889 13
Supplier#000001062 13
Supplier#000001498 13
Supplier#000002056 13
Supplier#000002312 13
Supplier#000002344 13
Supplier#000002596 13
Supplier#000002615 13
Supplier#000002978 13
Supplier#000003048 13
Supplier#000003234 13
Supplier#000003727 13
Supplier#000003806 13
Supplier#000004472 13
Supplier#000005236 13
Supplier#000005906 13
Supplier#000006241 13
Supplier#000006326 13
Supplier#000006384 13
Supplier#000006394 13
Supplier#000006624 13
Supplier#000006629 13
Supplier#000006682 13
Supplier#000006737 13
Supplier#000006825 13
Supplier#000007021 13
Supplier#000007417 13
Supplier#000007497 13
Supplier#000007602 13
Supplier#000008134 13
Supplier#000008234 13
Supplier#000009435 13
Supplier#000009436 13
Supplier#000009564 13
Supplier#000009896 13
Supplier#000000379 12
Supplier#000000673 12
Supplier#000000762 12
Supplier#000000811 12
Supplier#000000821 12
Supplier#000001337 12
Supplier#000001916 12
Supplier#000001925 12
Supplier#000002039 12
Supplier#000002357 12
Supplier#000002483 12
Number of rows retrieved is: 100
©Copyright IBM Corporation TPC Benchmark H Full Disclosure Report May 2005 Page: 71
Page 74

_
_
--------------------------------------------
-
Stop timestamp 05/11/05 14:44:10.427730
Query Time = 41.1 secs
Query 22
Start timestamp 05/11/05 14:44:29.400192
--------------------------------------------
-
-- Query 22 - Var_0 Rev_01 - Global Sales
Opportunity Query
Tag: Q22 Stream: -1 Sequence number: 12
select
cntrycode,
count(*) as numcust,
sum(c_acctbal) as totacctbal
from
(
select
substr(c_phone, 1, 2) as cntrycode,
c_acctbal
from
tpcd.customer
where
substr(c_phone, 1, 2) in
('13', '31', '23', '29', '30', '18', '17')
and c_acctbal > (
select
avg(c_acctbal)
from
tpcd.customer
where
c_acctbal > 0.00
and substr(c_phone, 1, 2) in
('13', '31', '23', '29', '30', '18', '17')
)
and not exists (
select
*
from
tpcd.orders
where
o_custkey = c_custkey
)
) as custsale
group by
cntrycode
order by
cntrycode
CNTRYCODE NUMCUST TOTACCTBAL
--------------------------------------------
-13 888 6737713.990
17 861 6460573.720
18 964 7236687.400
23 892 6701457.950
29 948 7158866.630
30 909 6808436.130
31 922 6806670.180
Number of rows retrieved is: 7
--------------------------------------------
-
Stop timestamp 05/11/05 14:44:31.539340
Query Time = 2.1 secs
First 10 Rows of the Database
connect to TPCD
Database Connection Information
Database server = DB2/LINUXX8664
8.2.0
SQL authorization ID = TPCH
Local database alias = TPCD
SELECT * FROM TPCD.REGION FETCH FIRST 10
ROWS ONLY
R_REGIONKEY R_NAME
R
COMMENT
----------- ------------------------- ------
--------------------------------------------
--------------------------------------------
--------------------------------------------
------------- 0 AFRICA
special Tiresias about the furiously even
dolphins are furi
1 AMERICA even,
ironic theodolites according to the bold
platelets wa
2 ASIA
silent, bold requests sleep slyly across the
quickly sly dependencies. furiously silent
instructions alongside
3 EUROPE
special, bold deposits haggle foxes.
platelet
4 MIDDLE EAST
furiously unusual packages use carefully
above the unusual, exp
5 record(s) selected.
SELECT * FROM TPCD.NATION FETCH FIRST 10
ROWS ONLY
N_NATIONKEY N_NAME
N
REGIONKEY N_COMMENT
----------- ------------------------- ------
----- --------------------------------------
--------------------------------------------
--------------------------------------------
------------------------- 0 ALGERIA
0 final accounts wake quickly. special
reques
5 ETHIOPIA
0 fluffily ruthless requests integrate
fluffily. pending ideas wake blithely acco
©Copyright IBM Corporation TPC Benchmark H Full Disclosure Report May 2005 Page: 72
Page 75

_
14 KENYA
0 ironic requests boost. quickly pending
pinto beans cajole slyly slyly even
deposits. ironic packages
15 MOROCCO
0 ideas according to the fluffily final
pinto beans sleep furiously
16 MOZAMBIQUE
0 ironic courts wake fluffily even, bold
deposi
1 ARGENTINA
1 idly final instructions cajole stealthily.
regular instructions wake carefully blithely
express accounts. fluffi
2 BRAZIL
1 always pending pinto beans sleep sil
3 CANADA
1 foxes among the bold requests
17 PERU
1 final, final accounts sleep slyly across
the requests.
24 UNITED STATES
1 blithely regular deposits serve furiously
blithely regular warthogs! slyly fi
10 record(s) selected.
SELECT * FROM TPCD.PART FETCH FIRST 10 ROWS
ONLY
P_PARTKEY P_NAME
P_MFGR P_BRAND P_TYPE
P_SIZE P_CONTAINER P_RETAILPRICE
P_COMMENT
----------- --------------------------------
----------------------- --------------------
----- ---------- ------------------------- -
---------- ----------- ---------------------
--- ---------------------- 43 medium khaki chocolate rosy
blush Manufacturer#4
Brand#44 PROMO POLISHED STEEL
5 WRAP CASE +9.43040000000000E+002
carefully iro
98 frosted goldenrod chartreuse
dark honeydew Manufacturer#5
Brand#54 STANDARD ANODIZED BRASS
22 MED JAR +9.98090000000000E+002
furiou
144 wheat brown orange almond
aquamarine Manufacturer#1
Brand#14 SMALL ANODIZED TIN
26 SM BOX +1.04414000000000E+003
blithely bold r
232 ivory purple spring tan cornsilk
Manufacturer#5 Brand#53 LARGE
BURNISHED NICKEL 50 SM PKG
+1.13223000000000E+003 quick deposits enga
242 magenta deep lawn linen navy
Manufacturer#3 Brand#35 SMALL
POLISHED STEEL 42 LG BAG
+1.14224000000000E+003 final pearls wake b
474 gainsboro chiffon dodger orchid
royal Manufacturer#1
Brand#14 ECONOMY PLATED STEEL
45 LG PACK +1.37447000000000E+003
fluffi
612 midnight deep misty magenta
honeydew Manufacturer#4
Brand#42 PROMO PLATED STEEL
19 LG BOX +1.51261000000000E+003
ironic, expr
643 beige navy dim green forest
Manufacturer#3 Brand#32 MEDIUM
POLISHED STEEL 8 MED DRUM
+1.54364000000000E+003 furiously regular
requ
647 bisque violet dim lawn drab
Manufacturer#3 Brand#35 LARGE
BURNISHED STEEL 38 MED PKG
+1.54764000000000E+003 quickly spec
659 ivory green pink orange
chartreuse
Manufacturer#3 Brand#34 MEDIUM
BRUSHED BRASS 20 LG JAR
+1.55965000000000E+003 even,
10 record(s) selected.
SELECT * FROM TPCD.SUPPLIER FETCH FIRST 10
ROWS ONLY
S_SUPPKEY S_NAME
S_ADDRESS
S_NATIONKEY S_PHONE S_ACCTBAL
S
COMMENT
----------- ------------------------- ------
---------------------------------- ---------
-- --------------- ------------------------
--------------------------------------------
--------------------------------------------
------------ 43 Supplier#000000043
Z5mLuAoTUEeKY5v22VnnA4D87Ao6jF2LvMYnlX8h
12 22-421-568-4862 +7.77341000000000E+003
slyly final accounts wake blithely slyly
regular requests. sl
98 Supplier#000000098
ogHn8dpXB5Q
21 31-914-775-1978 +5.87307000000000E+003
slyly regular requests mold slyly regular
depo
144 Supplier#000000144
f8tddEKps816HHqNwsKdn3
20 30-726-423-7363 +9.80629000000000E+003
even, fluffy somas cajole ironically. even
instructions are after the bold deposits.
silent ac
232 Supplier#000000232
90YJjotHlfwyieaTfuBJ8kohU5Oc83bESout,p
7 17-478-427-3811 +3.00800000000000E+002
carefully express asymptotes use among the
accounts: final foxes c
242 Supplier#000000242
cpZMlI77TRq
11 21-489-286-5908 +3.73664000000000E+003
quickly express deposits sleep furiously
regular accounts. quickly even accounts
above the slyl
474 Supplier#000000474
USHBMdX8iFodU
0 10-327-319-7717 +5.22621000000000E+003
pending, express courts along the carefully
express accounts use quickly final instr
612 Supplier#000000612
gt9T2nnuWBiy5zcrWG2iSdZt,sAEYnD6
23 33-377-769-8060 -1.18860000000000E+002
bold, bold pinto beans use quickly. blithely
even accounts are. slyly pending requ
©Copyright IBM Corporation TPC Benchmark H Full Disclosure Report May 2005 Page: 73
Page 76

_
_
643 Supplier#000000643 mJN4aN
B Lxz2esIAW0GoxEw1rAU
18 28-782-409-7844 +1.21859000000000E+003
furiously brave packages cajole slyly p
647 Supplier#000000647
x5U7MBZmwfG9
23 33-258-202-4782 +9.82821000000000E+003
regular hockey players sleep busily along
the pe
659 Supplier#000000659
jjVP5XCtV9jbvUnkoeFUTrgB,ke
20 30-917-437-7814 +6.31860000000000E+002
furiously express instructions among the re
10 record(s) selected.
SELECT * FROM TPCD.PARTSUPP FETCH FIRST 10
ROWS ONLY
PS_PARTKEY PS_SUPPKEY PS_AVAILQTY
PS
SUPPLYCOST PS_COMMENT
----------- ----------- ----------- --------
---------------- ---------------------------
--------------------------------------------
--------------------------------------------
--------------------------------------------
--------------------------------------- 43 44 3211
+8.05780000000000E+002 final, express
dependencies sleep according to the express
requests. bold, regular accounts detect
outside the slyly
43 7500044 6770
+4.93190000000000E+002 furiously special
pinto beans cajole. ironic decoys across the
43 15000044 9506
+4.93650000000000E+002 carefully fluffy
accounts across the blithely final accounts
hang slyly according to the furiously
special platelets. sil
43 22500044 3232
+3.07120000000000E+002 bold packages wake
blithely above the furiously bold
98 99 9486
+9.08210000000000E+002 deposits haggle
busily express deposits. furiously blithe
platelets
98 7500099 8550
+6.57160000000000E+002 express, final
deposits haggle along the regular foxes.
carefully regular excuses wake against the
carefully even pinto beans. furiously
express pinto beans
98 15000099 3443
+1.39000000000000E+002 express, express
pinto beans wake blithely. silent, pending
requests around the special packages cajole
after the quietly regular accounts. somas
sleep.
98 22500099 3759
+8.11550000000000E+002 blithely silent
instructions promise furiously across the
blithely regular dependencies. unusual
packages print across the ironic pinto
beans. orbits sleep blithely against t
144 145 6295
+4.57370000000000E+002 carefully fluffy
deposits wake slyly at the furiously final
packages. regular instructions nag sometimes
even dolphins. bold packages across the
requests use unusual requests. qu
144 7500145 494
+8.49960000000000E+002 quickly silent
accounts will detect quickly across the
doggedly express deposits. quick p
10 record(s) selected.
SELECT * FROM TPCD.CUSTOMER FETCH FIRST 10
ROWS ONLY
C_CUSTKEY C_NAME
C_ADDRESS
C_NATIONKEY C_PHONE C_ACCTBAL
C
MKTSEGMENT C_COMMENT
----------- ------------------------- ------
---------------------------------- ---------
-- --------------- ------------------------
------------ -------------------------------
--------------------------------------------
----------------------------------------- 167 Customer#0000000167
QNc2eOlRIzL6jpthwgDuB866uCIUPiOX
5 15-288-395-5501 +1.46809000000000E+003
AUTOMOBILE furiously regular packages
wake. final packages above the requests
cajole quickly along the
185 Customer#0000000185
iHXzQgienOQ
5 15-760-572-8760 +2.78876000000000E+003
BUILDING final somas promise. furiously
regular deposits cajole furiously. final
deposits wake abo
279 Customer#0000000279
9t2Wo1jK1TYnDGg6ODSMGf1W9hRT3F3VK5zxJOC
9 19-220-605-9025 +9.66323000000000E+003
AUTOMOBILE slyly silent requests use
furiously. express ideas above the slyly
unusual asympt
495 Customer#0000000495
QhFbEv6KbQIwfZs 1krt1eACKI31v3iyM
7 17-400-405-6060 +7.99781000000000E+003
BUILDING blithely final requests nag
quickly carefully special deposits. daringly
bold ideas sleep. platel
742 Customer#0000000742
2qRObRkFktME6SsNV0Pa3L8txbA0AFtXuWsKrkW
12 22-610-582-8610 +6.38124000000000E+003
HOUSEHOLD blithely ironic requests
against the fluffily unu
798 Customer#0000000798
wW2OgnHj6dBz tO9OXFqCLm
4 14-670-423-7529 -3.91130000000000E+002
HOUSEHOLD blithely furious dependencies
sleep carefully. quickly regular depths are
quickl
856 Customer#0000000856
X4U7LH4YtDzephie
15 25-336-316-9641 +6.98855000000000E+003
FURNITURE furiously regular ideas sleep q
924 Customer#0000000924
yKEtokQYXiuSSh8ZP5
15 25-518-232-9865 +4.21253000000000E+003
BUILDING furiously even pinto beans
haggle carefully according to the unusual
platelets. blithely final accounts are c
1151 Customer#0000001151
ratQBQ4rYv TfhWfHe
7 17-948-135-2667 +6.35489000000000E+003
©Copyright IBM Corporation TPC Benchmark H Full Disclosure Report May 2005 Page: 74
Page 77

BUILDING quickly regular requests wake
carefully at the express, regular requests.
spe
1274 Customer#0000001274
eHJnE7ytBm
24 34-152-721-6307 +1.26970000000000E+002
AUTOMOBILE final, express ideas about the
quickly even theodol
10 record(s) selected.
SELECT * FROM TPCD.ORDERS FETCH FIRST 10
ROWS ONLY
O_ORDERKEY O_CUSTKEY
O_ORDERSTATUS O_TOTALPRICE
O_ORDERDATE O_ORDERPRIORITY O_CLERK
O_SHIPPRIORITY O_COMMENT
-------------------- ----------- -----------
-- ------------------------ ----------- ----
----------- --------------- -------------- -
--------------------------------------------
--------------------------------- 560930 75139516 F
+2.51755400000000E+005 01/01/1992 3-MEDIUM
Clerk#000052809 0 pinto beans
use carefully quickly ironic foxes!
carefully ironic
682656 251556262 F
+2.14111120000000E+005 01/01/1992 5-LOW
Clerk#002386025 0 silent ideas
doubt along the careful
1249954 112248034 F
+1.76414540000000E+005 01/01/1992 2-HIGH
Clerk#001149260 0 furiously
express pinto beans sleep closely! slyly
5062656 129352627 F
+2.60514290000000E+005 01/01/1992 2-HIGH
Clerk#000068024 0 carefully
quick foxes sleep slyly. furiou
5559427 158874836 F
+8.57943200000000E+004 01/01/1992 4-NOT
SPECIFIED Clerk#002091766 0
blithely bold instructions
7840449 431962390 F
+1.27660180000000E+005 01/01/1992 3-MEDIUM
Clerk#002944278 0 carefully
final escapades alongside of the ironic
gifts haggle furiously dari
8851235 229861853 F
+2.04729710000000E+005 01/01/1992 3-MEDIUM
Clerk#001696617 0 quickly
regular deposits are
9209959 239044726 F
+1.79729410000000E+005 01/01/1992 2-HIGH
Clerk#001578510 0 carefully
bold warhorses haggle carefully sly
9965413 117433954 F
+3.18893400000000E+004 01/01/1992 3-MEDIUM
Clerk#002117922 0 special somas
sleep blithely about the carefully silent
10011840 448748864 F
+4.73867000000000E+003 01/01/1992 5-LOW
Clerk#000608889 0 blithely
pending foxes wake quickly? slyly even
realms affix furi
10 record(s) selected.
SELECT * FROM TPCD.LINEITEM FETCH FIRST 10
ROWS ONLY
L_ORDERKEY L_PARTKEY L_SUPPKEY
L_LINENUMBER L_QUANTITY
L_EXTENDEDPRICE L_DISCOUNT
L_TAX L_RETURNFLAG
L_LINESTATUS L_SHIPDATE L_COMMITDATE
L_RECEIPTDATE L_SHIPINSTRUCT
L_SHIPMODE L_COMMENT
-------------------- ----------- -----------
------------ ------------------------ ------
------------------ ------------------------
------------------------ ------------ ------
------ ---------- ------------ -------------
------------------------- ---------- -------
------------------------------------ 46797348 23007410 507411
2 +7.00000000000000E+000
+9.21382000000000E+003 +1.00000000000000E002 +8.00000000000000E-002 A F
01/02/1992 03/23/1992 01/24/1992 NONE
REG AIR pending theodolites boost. evenl
49867331 4939892 12439893
6 +4.20000000000000E+001
+8.11293000000000E+004 +5.00000000000000E002 +4.00000000000000E-002 R F
01/02/1992 02/11/1992 01/25/1992 NONE
TRUCK slyly regu
53469543 180327230 7827237
1 +3.10000000000000E+001
+3.86948200000000E+004 +1.00000000000000E001 +4.00000000000000E-002 A F
01/02/1992 03/28/1992 01/24/1992 NONE
SHIP bold, final dolphins against the
126754048 225467769 7967791
4 +1.00000000000000E+001
+1.72549000000000E+004
+0.00000000000000E+000 +3.00000000000000E002 R F 01/02/1992
02/25/1992 01/28/1992 TAKE BACK RETURN
SHIP slyly dari
169237793 376168615 23668628
3 +3.00000000000000E+000
+4.99443000000000E+003 +8.00000000000000E002 +6.00000000000000E-002 R F
01/02/1992 02/17/1992 01/19/1992 TAKE
BACK RETURN REG AIR blithely
even asymptotes believe fu
174545953 421255359 1255360
4 +2.20000000000000E+001
+2.84523800000000E+004 +2.00000000000000E002 +8.00000000000000E-002 A F
01/02/1992 03/02/1992 01/18/1992 TAKE
BACK RETURN REG AIR special,
regular ideas ha
192128197 251607662 19107671
3 +1.10000000000000E+001
+1.93279900000000E+004 +5.00000000000000E002 +8.00000000000000E-002 R F
01/02/1992 02/09/1992 01/26/1992 TAKE
BACK RETURN TRUCK regular,
ironic h
195195204 155916529 13416535
5 +1.10000000000000E+001
+1.69150300000000E+004 +4.00000000000000E002 +1.00000000000000E-002 R F
01/02/1992 03/02/1992 01/22/1992
DELIVER IN PERSON SHIP slyly
ironic deposits grow quic
©Copyright IBM Corporation TPC Benchmark H Full Disclosure Report May 2005 Page: 75
Page 78

250473639 546239102 6239103
6 +4.30000000000000E+001
+4.35929700000000E+004 +8.00000000000000E002 +0.00000000000000E+000 R F
01/02/1992 03/27/1992 01/10/1992 NONE
FOB furiously special pinto beans
across the b
309613188 12046345 12046346
3 +1.60000000000000E+001
+2.06518400000000E+004 +6.00000000000000E002 +6.00000000000000E-002 A F
01/02/1992 02/09/1992 01/09/1992 TAKE
BACK RETURN MAIL final
requests sleep carefully acros
10 record(s) selected.
connect reset
DB20000I The SQL command completed
successfully.
terminate
DB20000I The TERMINATE command completed
successfully.
Query Substitution parameters
Power stream Seed = 507172913
-- TPC TPC-H Parameter Substitution (Version
1.3.0)
-- using 507172913 as a seed to the RNG
Q1 DELTA 71
Q2 SIZE 17
TYPE STEEL
REGION EUROPE
Q3 SEGMENT FURNITURE
DATE 1995-03-24
Q4 DATE 1996-09-01
Q5 REGION AMERICA
DATE 1993-01-01
Q6 DATE 1993-01-01
DISCOUNT 0.09
QUANTITY 25
Q7 NATION1 UNITED STATES
NATION2 UNITED KINGDOM
Q8 NATION UNITED KINGDOM
REGION EUROPE
TYPE ECONOMY POLISHED COPPER
Q9 COLOR saddle
Q10 DATE 1994-08-01
Q11 NATION JAPAN
FRACTION 0.0000000333
Q12 SHIPMODE1 AIR
SHIPMODE2 REG AIR
DATE 1993-01-01
Q13 WORD1 special
WORD2 packages
Q14 DATE 1993-12-01
Q15 DATE 1993-06-01
Q16 BRAND Brand#13
TYPE MEDIUM BRUSHED
SIZE1 48
SIZE2 41
SIZE3 46
SIZE4 13
SIZE5 23
SIZE6 4
SIZE7 33
SIZE8 37
Q17 BRAND Brand#33
CONTAINER LG PACK
Q18 QUANTITY 313
Q19 BRAND1 Brand#25
BRAND2 Brand#14
BRAND3 Brand#24
QUANTITY1 1
QUANTITY2 15
QUANTITY3 30
Q20 COLOUR saddle
DATE 1993-01-01
NATION MOZAMBIQUE
Q21 NATION BRAZIL
Q22 I1 26
I2 17
I3 28
I4 19
I5 23
I6 12
I7 25
Throughput Stream = 1 Seed = 507172914
-- TPC TPC-H Parameter Substitution (Version
1.3.0)
-- using 507172914 as a seed to the RNG
Q1 DELTA 79
Q2 SIZE 5
TYPE BRASS
REGION AMERICA
Q3 SEGMENT MACHINERY
DATE 1995-03-09
Q4 DATE 1994-06-01
Q5 REGION ASIA
DATE 1993-01-01
Q6 DATE 1993-01-01
DISCOUNT 0.07
QUANTITY 25
Q7 NATION1 MOZAMBIQUE
NATION2 MOROCCO
Q8 NATION MOROCCO
REGION AFRICA
TYPE ECONOMY BURNISHED COPPER
Q9 COLOR puff
Q10 DATE 1993-05-01
Q11 NATION ALGERIA
FRACTION 0.0000000333
Q12 SHIPMODE1 REG AIR
SHIPMODE2 AIR
DATE 1996-01-01
Q13 WORD1 special
WORD2 packages
Q14 DATE 1994-03-01
Q15 DATE 1995-12-01
Q16 BRAND Brand#53
TYPE PROMO ANODIZED
SIZE1 20
SIZE2 46
SIZE3 2
SIZE4 9
SIZE5 26
SIZE6 22
SIZE7 6
SIZE8 32
Q17 BRAND Brand#35
CONTAINER LG DRUM
Q18 QUANTITY 315
©Copyright IBM Corporation TPC Benchmark H Full Disclosure Report May 2005 Page: 76
Page 79

Q19 BRAND1 Brand#22
BRAND2 Brand#42
BRAND3 Brand#23
QUANTITY1 6
QUANTITY2 16
QUANTITY3 26
Q20 COLOUR cyan
DATE 1996-01-01
NATION ETHIOPIA
Q21 NATION ROMANIA
Q22 I1 16
I2 23
I3 32
I4 12
I5 25
I6 26
I7 11
Throughput Stream = 2 Seed = 507172915
-- TPC TPC-H Parameter Substitution (Version
1.3.0)
-- using 507172915 as a seed to the RNG
Q1 DELTA 87
Q2 SIZE 43
TYPE TIN
REGION MIDDLE EAST
Q3 SEGMENT BUILDING
DATE 1995-03-26
Q4 DATE 1997-01-01
Q5 REGION EUROPE
DATE 1993-01-01
Q6 DATE 1993-01-01
DISCOUNT 0.04
QUANTITY 24
Q7 NATION1 INDIA
NATION2 GERMANY
Q8 NATION GERMANY
REGION EUROPE
TYPE LARGE BRUSHED COPPER
Q9 COLOR papaya
Q10 DATE 1994-03-01
Q11 NATION JORDAN
FRACTION 0.0000000333
Q12 SHIPMODE1 FOB
SHIPMODE2 REG AIR
DATE 1994-01-01
Q13 WORD1 special
WORD2 requests
Q14 DATE 1994-07-01
Q15 DATE 1993-09-01
Q16 BRAND Brand#33
TYPE SMALL PLATED
SIZE1 2
SIZE2 32
SIZE3 24
SIZE4 42
SIZE5 19
SIZE6 22
SIZE7 27
SIZE8 37
Q17 BRAND Brand#32
CONTAINER MED BOX
Q18 QUANTITY 312
Q19 BRAND1 Brand#34
BRAND2 Brand#35
BRAND3 Brand#23
QUANTITY1 2
QUANTITY2 17
QUANTITY3 23
Q20 COLOUR orange
DATE 1995-01-01
NATION SAUDI ARABIA
Q21 NATION IRAQ
Q22 I1 10
I2 16
I3 19
I4 33
I5 34
I6 17
I7 23
Throughput Stream = 3 Seed = 507172916
-- TPC TPC-H Parameter Substitution (Version
1.3.0)
-- using 507172916 as a seed to the RNG
Q1 DELTA 95
Q2 SIZE 31
TYPE COPPER
REGION AMERICA
Q3 SEGMENT MACHINERY
DATE 1995-03-11
Q4 DATE 1994-10-01
Q5 REGION AFRICA
DATE 1993-01-01
Q6 DATE 1993-01-01
DISCOUNT 0.02
QUANTITY 25
Q7 NATION1 ALGERIA
NATION2 UNITED STATES
Q8 NATION UNITED STATES
REGION AMERICA
TYPE LARGE PLATED COPPER
Q9 COLOR navajo
Q10 DATE 1994-12-01
Q11 NATION ALGERIA
FRACTION 0.0000000333
Q12 SHIPMODE1 MAIL
SHIPMODE2 REG AIR
DATE 1994-01-01
Q13 WORD1 special
WORD2 requests
Q14 DATE 1994-10-01
Q15 DATE 1996-04-01
Q16 BRAND Brand#13
TYPE LARGE BRUSHED
SIZE1 46
SIZE2 3
SIZE3 8
SIZE4 45
SIZE5 12
SIZE6 14
SIZE7 33
SIZE8 41
Q17 BRAND Brand#34
CONTAINER MED PACK
Q18 QUANTITY 314
Q19 BRAND1 Brand#31
BRAND2 Brand#13
BRAND3 Brand#12
QUANTITY1 7
QUANTITY2 18
QUANTITY3 30
Q20 COLOUR bisque
DATE 1993-01-01
NATION IRAN
Q21 NATION CANADA
Q22 I1 20
I2 14
I3 10
I4 26
I5 30
I6 13
©Copyright IBM Corporation TPC Benchmark H Full Disclosure Report May 2005 Page: 77
Page 80

I7 23
Throughput Stream = 4 Seed = 507172917
-- TPC TPC-H Parameter Substitution (Version
1.3.0)
-- using 507172917 as a seed to the RNG
Q1 DELTA 103
Q2 SIZE 18
TYPE STEEL
REGION MIDDLE EAST
Q3 SEGMENT BUILDING
DATE 1995-03-28
Q4 DATE 1997-05-01
Q5 REGION AMERICA
DATE 1994-01-01
Q6 DATE 1994-01-01
DISCOUNT 0.07
QUANTITY 25
Q7 NATION1 PERU
NATION2 MOZAMBIQUE
Q8 NATION MOZAMBIQUE
REGION AFRICA
TYPE LARGE BURNISHED TIN
Q9 COLOR medium
Q10 DATE 1993-09-01
Q11 NATION JORDAN
FRACTION 0.0000000333
Q12 SHIPMODE1 TRUCK
SHIPMODE2 AIR
DATE 1994-01-01
Q13 WORD1 special
WORD2 requests
Q14 DATE 1995-01-01
Q15 DATE 1993-12-01
Q16 BRAND Brand#53
TYPE STANDARD ANODIZED
SIZE1 12
SIZE2 26
SIZE3 43
SIZE4 48
SIZE5 35
SIZE6 20
SIZE7 9
SIZE8 11
Q17 BRAND Brand#31
CONTAINER MED DRUM
Q18 QUANTITY 312
Q19 BRAND1 Brand#33
BRAND2 Brand#51
BRAND3 Brand#11
QUANTITY1 2
QUANTITY2 19
QUANTITY3 26
Q20 COLOUR lemon
DATE 1997-01-01
NATION ALGERIA
Q21 NATION VIETNAM
Q22 I1 15
I2 12
I3 19
I4 16
I5 32
I6 28
I7 22
Throughput Stream = 5 Seed = 507172918
-- TPC TPC-H Parameter Substitution (Version
1.3.0)
-- using 507172918 as a seed to the RNG
Q1 DELTA 111
Q2 SIZE 6
TYPE BRASS
REGION ASIA
Q3 SEGMENT HOUSEHOLD
DATE 1995-03-13
Q4 DATE 1995-01-01
Q5 REGION ASIA
DATE 1994-01-01
Q6 DATE 1994-01-01
DISCOUNT 0.05
QUANTITY 24
Q7 NATION1 INDONESIA
NATION2 INDIA
Q8 NATION INDIA
REGION ASIA
TYPE MEDIUM BRUSHED TIN
Q9 COLOR lemon
Q10 DATE 1994-06-01
Q11 NATION ARGENTINA
FRACTION 0.0000000333
Q12 SHIPMODE1 RAIL
SHIPMODE2 AIR
DATE 1995-01-01
Q13 WORD1 special
WORD2 requests
Q14 DATE 1995-04-01
Q15 DATE 1996-07-01
Q16 BRAND Brand#33
TYPE MEDIUM PLATED
SIZE1 33
SIZE2 45
SIZE3 15
SIZE4 30
SIZE5 28
SIZE6 49
SIZE7 14
SIZE8 50
Q17 BRAND Brand#33
CONTAINER JUMBO BOX
Q18 QUANTITY 313
Q19 BRAND1 Brand#45
BRAND2 Brand#33
BRAND3 Brand#15
QUANTITY1 8
QUANTITY2 20
QUANTITY3 22
Q20 COLOUR snow
DATE 1995-01-01
NATION KENYA
Q21 NATION JORDAN
Q22 I1 24
I2 11
I3 14
I4 17
I5 30
I6 16
I7 23
Throughput Stream = 6 Seed = 507172919
-- TPC TPC-H Parameter Substitution (Version
1.3.0)
-- using 507172919 as a seed to the RNG
Q1 DELTA 119
Q2 SIZE 44
TYPE NICKEL
REGION MIDDLE EAST
Q3 SEGMENT BUILDING
DATE 1995-03-30
Q4 DATE 1997-08-01
Q5 REGION EUROPE
DATE 1994-01-01
Q6 DATE 1994-01-01
©Copyright IBM Corporation TPC Benchmark H Full Disclosure Report May 2005 Page: 78
Page 81

DISCOUNT 0.02
QUANTITY 24
Q7 NATION1 ARGENTINA
NATION2 ALGERIA
Q8 NATION ALGERIA
REGION AFRICA
TYPE MEDIUM PLATED TIN
Q9 COLOR indian
Q10 DATE 1993-03-01
Q11 NATION KENYA
FRACTION 0.0000000333
Q12 SHIPMODE1 AIR
SHIPMODE2 TRUCK
DATE 1994-01-01
Q13 WORD1 special
WORD2 accounts
Q14 DATE 1995-08-01
Q15 DATE 1994-04-01
Q16 BRAND Brand#23
TYPE ECONOMY POLISHED
SIZE1 36
SIZE2 40
SIZE3 21
SIZE4 10
SIZE5 8
SIZE6 39
SIZE7 19
SIZE8 24
Q17 BRAND Brand#34
CONTAINER JUMBO PACK
Q18 QUANTITY 315
Q19 BRAND1 Brand#42
BRAND2 Brand#21
BRAND3 Brand#55
QUANTITY1 3
QUANTITY2 11
QUANTITY3 29
Q20 COLOUR forest
DATE 1994-01-01
NATION EGYPT
Q21 NATION ETHIOPIA
Q22 I1 22
I2 27
I3 16
I4 25
I5 30
I6 32
I7 10
Throughput Stream = 7 Seed = 507172920
-- TPC TPC-H Parameter Substitution (Version
1.3.0)
-- using 507172920 as a seed to the RNG
Q1 DELTA 66
Q2 SIZE 32
TYPE COPPER
REGION ASIA
Q3 SEGMENT HOUSEHOLD
DATE 1995-03-15
Q4 DATE 1995-05-01
Q5 REGION MIDDLE EAST
DATE 1994-01-01
Q6 DATE 1994-01-01
DISCOUNT 0.07
QUANTITY 25
Q7 NATION1 CHINA
NATION2 PERU
Q8 NATION PERU
REGION AMERICA
TYPE MEDIUM ANODIZED TIN
Q9 COLOR ghost
Q10 DATE 1994-01-01
Q11 NATION BRAZIL
FRACTION 0.0000000333
Q12 SHIPMODE1 REG AIR
SHIPMODE2 AIR
DATE 1995-01-01
Q13 WORD1 special
WORD2 accounts
Q14 DATE 1995-11-01
Q15 DATE 1996-11-01
Q16 BRAND Brand#53
TYPE SMALL ANODIZED
SIZE1 29
SIZE2 12
SIZE3 46
SIZE4 39
SIZE5 3
SIZE6 34
SIZE7 26
SIZE8 30
Q17 BRAND Brand#31
CONTAINER JUMBO DRUM
Q18 QUANTITY 312
Q19 BRAND1 Brand#44
BRAND2 Brand#54
BRAND3 Brand#54
QUANTITY1 8
QUANTITY2 12
QUANTITY3 26
Q20 COLOUR powder
DATE 1997-01-01
NATION ROMANIA
Q21 NATION RUSSIA
Q22 I1 21
I2 32
I3 26
I4 19
I5 14
I6 23
I7 17
Throughput Stream = 8 Seed = 507172921
-- TPC TPC-H Parameter Substitution (Version
1.3.0)
-- using 507172921 as a seed to the RNG
Q1 DELTA 74
Q2 SIZE 20
TYPE STEEL
REGION AFRICA
Q3 SEGMENT AUTOMOBILE
DATE 1995-03-01
Q4 DATE 1993-02-01
Q5 REGION AFRICA
DATE 1995-01-01
Q6 DATE 1995-01-01
DISCOUNT 0.05
QUANTITY 24
Q7 NATION1 IRAN
NATION2 INDONESIA
Q8 NATION INDONESIA
REGION ASIA
TYPE SMALL POLISHED TIN
Q9 COLOR drab
Q10 DATE 1994-10-01
Q11 NATION MOROCCO
FRACTION 0.0000000333
Q12 SHIPMODE1 FOB
SHIPMODE2 AIR
DATE 1996-01-01
Q13 WORD1 pending
WORD2 accounts
©Copyright IBM Corporation TPC Benchmark H Full Disclosure Report May 2005 Page: 79
Page 82

Q14 DATE 1996-02-01
Q15 DATE 1994-07-01
Q16 BRAND Brand#33
TYPE LARGE BURNISHED
SIZE1 43
SIZE2 8
SIZE3 30
SIZE4 28
SIZE5 42
SIZE6 26
SIZE7 10
SIZE8 14
Q17 BRAND Brand#33
CONTAINER WRAP BOX
Q18 QUANTITY 314
Q19 BRAND1 Brand#51
BRAND2 Brand#32
BRAND3 Brand#53
QUANTITY1 3
QUANTITY2 13
QUANTITY3 22
Q20 COLOUR chartreuse
DATE 1995-01-01
NATION INDIA
Q21 NATION KENYA
Q22 I1 18
I2 21
I3 22
I4 17
I5 19
I6 28
I7 33
Appendix D: Driver Source Code
ploaduf1
#!/bin/ksh
RFpair=$1
~/tpcd/tools/load_line_uf $RFpair &
~/tpcd/tools/load_orders_uf $RFpair
ploaduf2
#!/bin/ksh
RFpair=$1;
db2 connect to tpcd
db2 "load from delete.$RFpair of del
modified by coldel| fastparse messages
/dev/null replace into TPCDTEMP.ORDERS_DEL
nonrecoverable partitioned db config mode
load_only part_file_location /flat1/ufdata;"
db2 commit;
db2 connect reset
db2 terminate
load_line_uf
#!/bin/ksh
RFpair=$1;
db2 connect to tpcd
db2 "load from lineitem.tbl.u$RFpair of del
modified by coldel| fastparse messages
/dev/null replace into TPCDTEMP.LINEITEM_new
nonrecoverable partitioned db config mode
load_only part_file_location /flat1/ufdata;"
db2 commit;
db2 connect reset
db2 terminate
load_orders_uf
#!/bin/ksh
RFpair=$1;
db2 connect to tpcd
db2 "load from orders.tbl.u$RFpair of del
modified by coldel| fastparse messages
/dev/null replace into TPCDTEMP.ORDERS_new
nonrecoverable partitioned db config mode
load_only part_file_location /flat1/ufdata;
"
db2 commit;
db2 connect reset
db2 terminate
runpower
: # -*-Perl-*eval 'exec perl5 -S $0 ${1+"$@"}' # Horrible
kludge to convert this
if 0; # into a
"portable" perl script
# usage runpower [UF]
# where UF is the optional parameter that
says to run the power test
# with the update functions. By default,
the update functions are not
# run
push(@INC, split(':', $ENV{'PATH'}));
# Get TPC-D specific environment variables
require 'getvars';
# Use the macros in here so that they can
handle the platform differences.
# macro.pl should be sourced from cmvc,
other people wrote and maintain it.
require "macro.pl";
require "tpcdmacro.pl";
# Make output unbuffered.
select(STDOUT);
$| = 1 ;
if (@ARGV > 0)
{
$runUF=$ARGV[0];
}
else
{
$runUF="no";
}
©Copyright IBM Corporation TPC Benchmark H Full Disclosure Report May 2005 Page: 80
Page 83

if (length($ENV{"TPCD_AUDIT_DIR"}) <= 0)
{
die "TPCD_AUDIT_DIR environment variable
not set\n";
}
if (length($ENV{"TPCD_RUN_DIR"}) <= 0)
{
die "TPCD_RUN_DIR environment variable not
set\n";
}
if (length($ENV{"TPCD_DBNAME"}) <= 0)
{
die "TPCD_DBNAME environment variable not
set\n";
}
if (length($ENV{"TPCD_RUNNUMBER"}) <= 0)
{
die "TPCD_RUNNUMBER environment variable
not set\n";
}
if (length($ENV{"TPCD_SF"}) <= 0)
{
die "TPCD_SF environment variable not
set\n";
}
if (length($ENV{"TPCD_PLATFORM"}) <= 0)
{
die "TPCD_PLATFORM environment variable
not set\n";
}
if (length($ENV{"TPCD_PATH_DELIM"}) <= 0)
{
die "TPCD_PATH_DELIM environment variable
not set\n";
}
if (length($ENV{"TPCD_PRODUCT"}) <= 0)
{
die "TPCD_PRODUCT environment variable not
set\n";
}
if (length($ENV{"TPCD_AUDIT"}) <= 0)
{
die "Must set TPCD_AUDIT env't var.
Real audit timing sequence run if yes\n";
}
if (length($ENV{"TPCD_PHYS_NODE"}) <= 0)
{
die "TPCD_PHYS_NODE env't var not
set\n";
}
if (length($ENV{"TPCD_LOG_DIR"}) <= 0)
{
$ENV{"TPCD_LOG_DIR"} = "NULL";
}
if (length($ENV{"TPCD_MODE"}) <= 0)
{
die "TPCD_MODE environment variable not
set - uni/smp/mln \n";
}
if (length($ENV{"TPCD_ROOTPRIV"}) <= 0)
{
die "TPCD_ROOTPRIV environment variable
not set - yes/no \n";
}
#set up local variables
$runNum=$ENV{"TPCD_RUNNUMBER"};
$runDir=$ENV{"TPCD_RUN_DIR"};
$auditDir=$ENV{"TPCD_AUDIT_DIR"};
$dbname=$ENV{"TPCD_DBNAME"};
$sf=$ENV{"TPCD_SF"};
$platform=$ENV{"TPCD_PLATFORM"};
$delim=$ENV{"TPCD_PATH_DELIM"};
$gatherstats=$ENV{"TPCD_GATHER_STATS"};
$product=$ENV{"TPCD_PRODUCT"};
$RealAudit=$ENV{"TPCD_AUDIT"};
$inlistmax=$ENV{"TPCD_INLISTMAX"};
$pn=$ENV{"TPCD_PHYS_NODE"};
$logDir=$ENV{"TPCD_LOG_DIR"};
$rootPriv=$ENV{"TPCD_ROOTPRIV"};
$mode=$ENV{"TPCD_MODE"};
if (( $mode eq "uni" ) || ( $mode eq "smp"
))
{
$all_ln="once";
$all_pn="once";
$once="once";
}
else
{
$all_ln="all_ln";
$all_pn="all_pn";
$once="once";
}
if ($inlistmax eq "default")
{
$inlistmax = 400;
}
# the auditruns directory is where we have
already generate the sql files for the
# updates and the power tests
# append isolation level information about
tpcdbatch to the miso file
# the miso file is created here but appended
to for power and throughput
#information
$misofile="$runDir${delim}miso$runNum";
if ( -e $misofile )
{
&rm("$misofile");
}
# if we are in real audit mode then we must
start the db manager now since
# there must be no activity on the database
between the time the build script
# has finished and the time the power test
is started
if ( $RealAudit eq "yes" )
{
system("db2start");
system("db2 activate database $dbname");
}
if ( $RealAudit ne "yes" )
{
system("db2 activate database $dbname");
}
#Report current log info to the run#
directory in a file called startLog.Info
system("perl getLogInfo.pl startLog");
open(MISO, ">$misofile") || die "Can't open
$misofile: $!\n";
$curTs = `perl gettimestamp "long"`;
©Copyright IBM Corporation TPC Benchmark H Full Disclosure Report May 2005 Page: 81
Page 84

print MISO "Timestamp and isolation level of
tpcdbatch before power run at : $curTs\n";
close(MISO);
if ( $product eq "pe" )
{
system("db2 \"connect to $dbname\"; db2
\"select
name,creator,valid,unique_id,isolation from
sysibm.sysplan where name like 'TPCD%'\";
db2 connect reset; db2 terminate >>
$runDir${delim}miso$runNum ");
}
else
{
&verifyTPCDbatch("$misofile","$dbname");
}
if ($platform eq "aix")
{
# Create the sysunused file. This reports
what disks are attached, and which
# ones are being used. Its use spans both
the runpower and runthroughtput tests
system("echo \"The following disks are
assigned to the indicated volume groups\" >
$runDir/sysunused$runNum") && die "cannot
create $runDir/sysunused$runNum";
system("lspv >>
$runDir/sysunused$runNum");
system("echo \"The following volume groups
are currently online\" >>
$runDir/sysunused$runNum");
$curTs = `perl gettimestamp "long"`;
system("echo \"$curTs\" >>
$runDir/sysunused$runNum");
system("lsvg -o >>
$runDir/sysunused$runNum");
# show the disks that are used/unused
#system("getdisks \"Before the start of
the Power Test\"");
}
else
{
# for all other platforms
system("echo Assume that all portions of
the system are used >>
$runDir${delim}sysunused$runNum");
}
&getConfig("p");
if ( $rootPriv eq "yes" )
{
# get the o/s tuning
parameters...currently AIX only and only if
your
# user has root privileges to run this
&getOSTune("p");
}
if ($gatherstats eq "on")
{
# gather vm io and net stats
if ($platform eq "aix" || $platform eq
"sun" || $platform eq "ptx" ||
$platform eq "hp" || $platform eq
"linux")
{
# gather vmstats and iostats (and net
stats if in mpp mode)
system("perl getstats p &");
}
else
{
print "Stats gather not set up for
current platform $platform\n";
}
}
# print to screen what type of run is
running and set variables to run
# the query and update streams in parallel
if ($runUF ne "UF")
{
$semcontrol = "off";
print "Beginning power stream....no
update functions\n";
$streamEx = "";
$streamExNT = "";
}
else
{
$semcontrol = "on";
print "Beginning power stream....with
update functions\n";
if ( $platform eq "nt" )
{
$streamExNT = "start /b";
$streamEx = "";
}
else
{
$streamExNT = "";
$streamEx = "&";
}
}
# bbe This new line (below) runs queries for
power test
print "Starting tpcdbatch...\n";
$ret=system("$streamExNT
$auditDir${delim}auditruns${delim}tpcdbatch
-d $dbname -f $runDir${delim}qtextpow.sql -r
on -b on -s $sf -u p1 -m $inlistmax -n 0 -p
$semcontrol $streamEx");
if ( $runUF eq "UF" )
{
$ret2 =
system("$auditDir${delim}auditruns${delim}tp
cdbatch -d $dbname -f
$runDir${delim}qtextquf.sql -r on -b on -s
$sf -u p2 -m $inlistmax -n 0");
}
else
{
$ret2 = 0; # If UFs were not running,
then the stream cannot fail
}
if (($ret2 == 0) && ($ret == 0))
{
print "Power stream completed
succesfully.\n";
}
else
{
©Copyright IBM Corporation TPC Benchmark H Full Disclosure Report May 2005 Page: 82
Page 85

print "Power stream failed. ret=$ret\n";
}
if ($platform eq "aix")
{
# show that the same disks are still
used or unused
# system("getdisks \"After completion of
the Power Test\"");
#clean up
}
if ($gatherstats eq "on")
{
# gather vm io and net stats
if ($platform eq "aix" || $platform eq
"sun" || $platform eq "ptx" || $platform eq
"linux")
{
# kill the stats that were being
gathered
if ($platform eq "ptx")
{
$rc= `perl5 zap "-f" "sar"`;
$rc= `perl5 zap "-f" "sadc"`;
}
else
{
$rc= `perl5 zap "-f" "vmstat"`;
$rc= `perl5 zap "-f" "iostat"`;
}
if ( $pn > 1 )
{
$rc= `perl5 zap "-f" "netstat"`;
}
$rc= `perl5 zap "-f" "getstats"`;
}
}
open(MISO, ">>$misofile") || die "Can't open
$misofile: $!\n";
$curTs = `perl gettimestamp "long"`;
print MISO "Timestamp and isolation level of
tpcdbatch after power run at : $curTs\n";
close(MISO);
if ( $product eq "pe" )
{
system("db2 \"connect to $dbname\"; db2
\"select
name,creator,valid,unique_id,isolation from
sysibm.sysplan where name like 'TPCD%'\";db2
connect reset;db2 terminate >>
$runDir${delim}miso$runNum");
}
else
{
&verifyTPCDbatch("$misofile","$dbname");
}
if ( $RealAudit ne "yes" )
{
$curTs = `perl gettimestamp "short"`;
# grab the db and dbm snapshot before we
deactivate
system("db2 get snapshot for all on
$dbname >
$runDir${delim}dbrun$runNum.snap.$curTs");
system("db2 get snapshot for database
manager >>
$runDir${delim}dbrun$runNum.snap.$curTs");
}
######################
# now copy the reports from the count of
streams files into one final file
&cat("$runDir${delim}pstrcnt*","$runDir${del
im}mpstrcnt$runNum");
#(NOTE: there is a dependancy that this
mpstrcnt file exist before the
# calcmetrics.pl script is called, both
because it is used as input for
# calcmetrics.pl, and because the output
from calcmetrics is used as
# the trigger for watchstreams to complete,
and watchstreams cats its
# output at the end of the mstrcnt file.
# generate the mpinter?.metrics file in the
run directory
#require 'calcmetricsp.pl';
if ( $runUF eq "UF")
{
system("perl calcmetricsp.pl UF");
}
else
{
system("perl calcmetricsp.pl");
}
# concatenate all the throughput inter files
that were used to
# generate these results into the
calcmetrics output file (mpinterX.metrics)
#cd $TPCD_RUN_DIR
&cat("$runDir${delim}mpqinter*","$runDir${de
lim}mpinter$runNum.metrics");
if ($runUF eq "UF") {
&cat("$runDir${delim}mpufinter*","$runDir${d
elim}mpinter$runNum.metrics");
}
#if ($runUF eq "no") {
# &rm("$runDir${delim}mpuf*");
#}
#######################
# no longer activate/deactivate the database
#if ( $RealAudit ne "yes" )
#{
# # deactivate the database
# system("db2 deactivate database
$dbname");
#}
# do not stop the database after the power
test
#if ( $RealAudit ne "yes" )
#{
# system("db2stop");
#}
1;
sub getConfig
{
$testtype=$_[0];
print "Getting database configuration.\n";
©Copyright IBM Corporation TPC Benchmark H Full Disclosure Report May 2005 Page: 83
Page 86

$dbtunefile="$runDir${delim}m${testtype}dbtu
ne${runNum}";
open(DBTUNE, ">$dbtunefile") || die "Can't
open $dbtunefile: $!\n";
$timestamp=`perl gettimestamp "long"`;
print DBTUNE "Database and Database
manager configuration taken at :
$timestamp";
close(DBTUNE);
system("db2level >> $dbtunefile");
system("db2 get database configuration for
$dbname >> $dbtunefile");
system("db2 get database manager
configuration >> $dbtunefile");
system("db2set >> $dbtunefile");
if (( $mode eq "mln" ) || ( $mode eq
"mpp"))
{
$cfgfile="$runDir${delim}dbtune${runNum}.";
#removed by Alex due to hang
#system("db2_all '||\" typeset -i
ln=##; db2 get db cfg for $dbname >
$cfgfile\${ln} ; db2 get dbm cfg >>
$cfgfile\${ln}; db2set >> $cfgfile\${ln};
db2 terminate '");
}
}
sub getOSTune
{
$testtype=$_[0];
if ( $platform eq "aix" )
{
print "Getting OS and VMdatabase
configuration.\n";
$ostunefile="$runDir${delim}m${testtype}ostu
ne${runNum}";
open(OSTUNE, ">$ostunefile") || die
"Can't open $ostunefile: $!\n";
$timestamp=`perl gettimestamp "long"`;
print OSTUNE "Operating System and
Virtual Memory configuration taken at :
$timestamp";
close(OSTUNE);
system("${delim}usr${delim}samples${delim}ke
rnel${delim}schedtune >> $ostunefile");
system("${delim}usr${delim}samples${delim}ke
rnel${delim}vmtune >> $ostunefile");
}
else
{
print "OS parameters retrieval not
supported for $platform \n";
}
}
sub verifyTPCDbatch
{
$logfile=$_[0];
$dbname=$_[1];
$file="verifytpcdbatch.clp";
open(VERTBL, ">$file") || die "Can't open
$file: $!\n";
print VERTBL "connect to $dbname;\n";
print VERTBL "select
name,creator,valid,last_bind_time,isolation
from sysibm.sysplan where name like
'TPCD%';\n";
print VERTBL "connect reset;\n";
print VERTBL "terminate;\n";
close(VERTBL);
system("db2 -vtf $file >> $logfile");
}
_
runthroughput
: # -*-Perl-*eval 'exec perl5 -S $0 ${1+"$@"}' # Horrible
kludge to convert this
if 0; # into a
"portable" perl script
# usage runthroughput [UF]
# where UF is the optional parameter that
says to run the throughput test
# with the update functions. By default,
the update functions are not
# run
# If UF is not supplied and a number is
supplied, then that number is taken
# as the number of concurrent throughput
streams to run. This is also optional
push(@INC, split(':', $ENV{'PATH'}));
# Get TPC-D specific environment variables
require 'getvars';
# Use the macros in here so that they can
handle the platform differences.
# macro.pl should be sourced from cmvc,
other people wrote and maintain it.
require "macro.pl";
require "tpcdmacro.pl";
$runUF="no";
if (@ARGV > 0)
{
if ($ARGV[0] eq "UF")
{
$runUF=$ARGV[0];
}
}
@reqVars = ("TPCD_AUDIT_DIR",
"TPCD_RUN_DIR",
"TPCD_DBNAME",
"TPCD_RUNNUMBER",
"TPCD_SF",
"TPCD_PLATFORM",
"TPCD_PATH_DELIM",
"TPCD_PRODUCT",
"TPCD_AUDIT",
"TPCD_PHYS_NODE",
"TPCD_MODE",
"TPCD_ROOTPRIV",
"TPCD_NUMSTREAM");
&setVar(@reqVars, "ERROR");
©Copyright IBM Corporation TPC Benchmark H Full Disclosure Report May 2005 Page: 84
Page 87

if (length($ENV{"TPCD_LOG_DIR"}) <= 0)
{
$ENV{"TPCD_LOG_DIR"} = "NULL";
}
#set up local variables
$runNum=$ENV{"TPCD_RUNNUMBER"};
$numStream=$ENV{"TPCD_NUMSTREAM"};
$runDir=$ENV{"TPCD_RUN_DIR"};
$auditDir=$ENV{"TPCD_AUDIT_DIR"};
$dbname=$ENV{"TPCD_DBNAME"};
$sf=$ENV{"TPCD_SF"};
$product=$ENV{"TPCD_PRODUCT"};
$platform=$ENV{"TPCD_PLATFORM"};
$delim=$ENV{"TPCD_PATH_DELIM"};
$RealAudit=$ENV{"TPCD_AUDIT"};
$inlistmax=$ENV{"TPCD_INLISTMAX"};
$gatherstats=$ENV{"TPCD_GATHER_STATS"};
$logDir=$ENV{"TPCD_LOG_DIR"};
$rootPriv=$ENV{"TPCD_ROOTPRIV"};
$mode=$ENV{"TPCD_MODE"};
$path="$auditDir${delim}auditruns";
if (( $mode eq "uni" ) || ( $mode eq "smp"
))
{
$all_ln="once";
$all_pn="once";
$once="once";
}
else
{
$all_ln="all_ln";
$all_pn="all_pn";
$once="once";
}
# return 1 if the given pattern(parameter
$_[0]) matches any file
sub existfile {
if ($platform eq "aix" || $platform eq
"sun" || $platform eq "ptx" || $platform eq
"linux")
{
`ls $_[0] 2> /dev/null | wc -l` + 0 !=
0;
}
else
{
`dir /b $_[0] 2> NUL | wc -l` + 0 != 0;
}
}
if ($inlistmax eq "default")
{
$inlistmax = 400;
}
# no longer stop and start the dbm between
runs when not in realaudit mode
#if ( $RealAudit ne "yes" )
#{
# # if we are not in real audit mode then
we must start the db manager now
# system("db2start");
# # activate the database
# system("db2 activate database
$dbname");
#}
$misofile="$runDir${delim}miso$runNum";
# append isolation level information about
tpcdbatch to the miso file
open(MISO, ">>$misofile") || die "Can't open
$misofile: $!\n";
$curTs = `perl gettimestamp "long"`;
print MISO "Timestamp and isolation level of
tpcdbatch before throughput run at :
$curTs\n";
close(MISO);
if ( $product eq "pe" )
{
system("db2 \"connect to $dbname\"; db2
\"select
name,creator,valid,unique_id,isolation from
sysibm.sysplan where name like 'TPCD%'\" >>
$runDir${delim}miso$runNum ");
}
else
{
&verifyTPCDbatch("$misofile","$dbname");
}
# kick off the script that will monitor for
the database applications during
# the running of the throughput tests. This
will quit when the mtinterX.metrics
# (where X=runnumber) file has been created.
# set variables to run streams in parallel
if ( $platform eq "nt" )
{
$streamExNT = "start /b";
$streamEx = "";
}
else
{
$streamExNT = "";
$streamEx = "&";
}
if ( $platform eq "aix" || $platform eq
"sun" || $platform eq "nt" || $platform eq
"hp" || $platform eq "linux")
{
system("$streamExNT perl watchstreams
$streamEx");
}
else
{
die "platform not supported, can't start
watchstreams in background";
}
# show the disks that are used/unused
#if ($platform eq "aix")
#{
# system("getdisks \"Before the start of
the Throughput Test\"");
#}
if ($gatherstats eq "on")
{
# gather vm io and net stats
if ($platform eq "aix" || $platform eq
"sun" || $platform eq "ptx" || $platform eq
"hp" || $platform eq "linux")
{
# gather vmstats and iostats (and net
stats if in mpp mode)
©Copyright IBM Corporation TPC Benchmark H Full Disclosure Report May 2005 Page: 85
Page 88

system("perl getstats t &");
}
else
{
print "Stats gather not set up for
current platform $platform\n";
}
}
# the auditruns directory is where we have
already generated the sql files
# for the updates and the power tests
$loopStream=1;
for ( $loopStream = 1; $loopStream <=
$numStream; $loopStream++)
{
print "starting stream $loopStream\n";
system("echo Executing stream
$loopStream out of $numStream.");
# run the queries
if ( $platform eq "aix" || $platform eq
"sun" || $platform eq "nt" || $platform eq
"ptx" ||
$platform eq "hp" || $platform eq
"linux")
{
system("$streamExNT
$path${delim}tpcdbatch -d $dbname -f
$runDir${delim}qtextt$loopStream.sql -r on b on -s $sf -u t1 -m $inlistmax -n
$loopStream $streamEx");
}
else
{
die "platform $platform not
supported yet";
}
}
# run the update function stream....this
will wait until the queries have
# completed to kick off the updates
print "starting update stream\n";
if ($runUF eq "no") {
$ret=system("$auditDir${delim}auditruns${del
im}tpcdbatch -d $dbname -f
$runDir${delim}quft.sql -r on -b on -s $sf u t -m $inlistmax -n $numStream");
}
else {
$ret=system("$auditDir${delim}auditruns${del
im}tpcdbatch -d $dbname -f
$runDir${delim}quft.sql -r on -b on -s $sf u t2 -m $inlistmax -n $numStream");
}
print "update stream done\n";
&getConfig("t");
if ( $rootPriv eq "yes" )
{
# get the o/s tuning
parameters...currently AIX only and only if
your
# user has root privileges to run this
&getOSTune("t");
}
#if ($platform eq "aix")
#{
# show the disks that are used/unused
# system("getdisks \"After the completion
of the Throughput Test\"");
#}
if ($gatherstats eq "on")
{
# gather vm io and net stats
if ($platform eq "aix" || $platform eq
"sun" || $platform eq "ptx" || $platform eq
"linux")
{
# kill the stats that were being
gathered
if ($platform eq "ptx")
{
$rc= `perl5 zap "-f" "sar"`;
$rc= `perl5 zap "-f" "sadc"`;
}
else
{
$rc= `perl5 zap "-f" "vmstat"`;
$rc= `perl5 zap "-f" "iostat"`;
}
if ( $pn > 1 )
{
$rc= `perl5 zap "-f" "netstat"`;
}
$rc= `perl5 zap "-f" "getstats"`;
}
}
open(MISO, ">>$misofile") || die "Can't open
$misofile: $!\n";
$curTs = `perl gettimestamp "long"`;
print MISO "Timestamp and isolation level of
tpcdbatch after throughput run at :
$curTs\n";
close(MISO);
if ( $product eq "pe" )
{
system("db2 \"connect to $dbname\"; db2
\"select
name,creator,valid,unique_id,isolation from
sysibm.sysplan where name like 'TPCD%'\" >>
$runDir${delim}miso$runNum");
}
else
{
&verifyTPCDbatch("$misofile","$dbname");
}
if ( $RealAudit ne "yes" )
{
$curTs = `perl gettimestamp "short"`;
# grab the db and dbm snapshot before we
deactivate
system("db2 get snapshot for all on
$dbname >
$runDir${delim}dbTrun$runNum.snap.$curTs");
system("db2 get snapshot for database
manager >>
$runDir${delim}dbTrun$runNum.snap.$curTs");
}
©Copyright IBM Corporation TPC Benchmark H Full Disclosure Report May 2005 Page: 86
Page 89

# now copy the reports from the count of
streams files into one final file
&cat("$runDir${delim}strcnt*","$runDir${deli
m}mstrcnt$runNum");
#(NOTE: there is a dependancy that this
mstrcnt file exist before the
# calcmetrics.pl script is called, both
because it is used as input for
# calcmetrics.pl, and because the output
from calcmetrics is used as
# the trigger for watchstreams to complete,
and watchstreams cats its
# output at the end of the mstrcnt file.
# generate the mtinter?.metrics file in the
run directory
#require 'calcmetrics.pl';
if ( $runUF ne "no")
{
system("perl calcmetrics.pl $numStream
UF");
}
else
{
system("perl calcmetrics.pl $numStream");
}
# concatenate all the throughput inter files
that were used to
# generate these results into the
calcmetrics output file (mtinterX.metrics)
#cd $TPCD_RUN_DIR
&cat("$runDir${delim}mts*inter*","$runDir${d
elim}mtinter$runNum.metrics");
if ($runUF ne "no") {
&cat("$runDir${delim}mtufinter*","$runDir${d
elim}mtinter$runNum.metrics");
}
if (&existfile("$runDir${delim}mp*")) {
# generate the mplot stuff
system("perl gen_mplot");
# generate the mlog information file
require 'buildmlog';
}
#if ($runUF eq "no") {
# &rm("$runDir${delim}mtuf*");
#}
# deactivate the database this needs to
remain at the end of run throughput so
# asynchronous writing of the log files
completes.
system("db2 deactivate database $dbname");
$rc=&dodb_noconn("db2 get db cfg for $dbname
| grep -i log >>
$runDir${delim}endLog.Info",$all_ln);
if ( $logDir ne "NULL" )
{
$rc=&dodb_noconn("$dircmd $logDir >>
$runDir${delim}endLog.Info",$all_ln);
}
#system("db2_all \']}db2 get db cfg for tpcd
| grep -i log >> $runDir${delim}endLog.Info
; db2 terminate\' ");
#system("ls -ltra /node??vg.log/NODE00* >>
$runDir${delim}endLog.Info");
#Create Catalog info
$rc = system("perl catinfo.pl p");
if ( $rc != 0 )
{
warn "catinfo failed!!!\n";
}
#Report current log info to the run#
directory in a file called endLog.Info
system("perl getLogInfo.pl endLog");
# if we are in audit mode we must do a
db2stop at the end of the power/throughput
run
if ( $RealAudit eq "yes" )
{
system("db2stop");
}
1;
sub getConfig
{
$testtype=$_[0];
print "Getting database configuration.\n";
$dbtunefile="$runDir${delim}m${testtype}dbtu
ne${runNum}";
open(DBTUNE, ">$dbtunefile") || die "Can't
open $dbtunefile: $!\n";
$timestamp=`perl gettimestamp "long"`;
print DBTUNE "Database and Database
manager configuration taken at :
$timestamp";
close(DBTUNE);
system("db2level >> $dbtunefile");
system("db2 get database configuration for
$dbname >> $dbtunefile");
system("db2 get database manager
configuration >> $dbtunefile");
system("db2set >> $dbtunefile");
}
sub getOSTune
{
$testtype=$_[0];
if ( $platform eq "aix" || $platform eq
"linux")
{
print "Getting OS and VMdatabase
configuration.\n";
$ostunefile="$runDir${delim}m${testtype}ostu
ne${runNum}";
open(OSTUNE, ">$ostunefile") || die
"Can't open $ostunefile: $!\n";
$timestamp=`perl gettimestamp "long"`;
print OSTUNE "Operating System and
Virtual Memory configuration taken at :
$timestamp";
close(OSTUNE);
system("${delim}usr${delim}samples${delim}ke
rnel${delim}schedtune >> $ostunefile");
©Copyright IBM Corporation TPC Benchmark H Full Disclosure Report May 2005 Page: 87
Page 90

system("${delim}usr${delim}samples${delim}ke
rnel${delim}vmtune >> $ostunefile");
}
else
{
print "OS parameters retrieval not
supported for $platform \n";
}
}
sub verifyTPCDbatch
{
$logfile=$_[0];
$dbname=$_[1];
$file="verifytpcdbatch.clp";
open(VERTBL, ">$file") || die "Can't open
$file: $!\n";
print VERTBL "connect to $dbname;\n";
print VERTBL "select
name,creator,valid,last_bind_time,isolation
from sysibm.sysplan where name like
'TPCD%';\n";
print VERTBL "connect reset;\n";
print VERTBL "terminate;\n";
close(VERTBL);
system("db2 -vtf $file >> $logfile");
}
_
tpcdbatch.h
/*******************************************
***********************************
*
* TPCDBATCH.H
*
* Revision History:
*
* 27 may 99 bbe from (24 nov 98 jen)
fixNTtimestamp - fixed NT timestamp to print
millisecond correctly
* 27 may 99 bbe from (10 dec 98 jen) SUN added Haider's changes necessary for SUN
* 17 jun 99 jen Increased version to 5.1
* 10 aug 99 bbe Increased version to 5.2
* 13 aug 99 bbe Increased version to 5.3
* 18 mar 02 ken Increased version to 5.7
********************************************
***********************************/
/** Necessary header files **/
/** System header files **/
#include <stdio.h>
#include <stdlib.h>
#include <string.h>
#include <math.h>
#include <fcntl.h> /* SUN bbe
*/
#include <time.h>
#include <ctype.h>
#if (defined(SQLAIX) || defined(SQLPTX) ||
defined(LINUX) || defined(SQLHP))
#include <unistd.h> /* SUN */
#include <sys/stat.h> /* SUN */
#endif
#if ((defined(SQLAIX) || defined(SQLPTX)) &&
!defined(LINUX))
#include <sys/vnode.h> /* SUN
*/
#endif
#ifndef SQLWINT
#include <sys/time.h>
/*@d33143aha*/
#include <sys/ipc.h>
#include <sys/sem.h>
#if (!defined(SQLPTX) && !defined(LINUX)&&
!defined(SQLHP))
#include <sys/mode.h>
#endif
#include <sys/timeb.h>
#include <sys/types.h>
#else
#include <windows.h>
#include <sys\timeb.h>
#endif
#include <errno.h>
/** External header files **/
#include "sqlda.h"
#include "sqlenv.h"
#include "sql.h"
#include "sqlmon.h"
#include "sqlca.h"
#include "sqlutil.h"
#include "sqlcodes.h"
/** Internal header files **/
/** #ifdef __cplusplus **/
/** #include "sqlz.h" **/
/** #include "sqlzcopy.h" **/
/** #endif **/
/*******************************************
***************************/
/* Define synonyms here
*/
/*******************************************
***************************/
#define TPCDBATCH_VERSION "5.7"
#define TPCDBATCH_NONSQL 10
/* @d23684 tjg */
#define TPCDBATCH_SELECT 20
#define TPCDBATCH_NONSELECT 30
#define TPCDBATCH_EOBLOCK 40
/* @d30369 tjg */
#define TPCDBATCH_INSERT 50
#define TPCDBATCH_DELETE 60
#define TPCDBATCH_MAX_COLS 100
/* @d30369 tjg */
#define TPCDBATCH_CHAR char
#define TPCDBATCH_PRINT_FLOAT_WIDTH 20
/* kmw - allow 15 whole digit for %#.3f
format */
/* - note: use > 18, size of long
indentifier so that it will */
/* be larger than any column heading
*/
#define TPCDBATCH_PRINT_FLOAT_MAX 1e15
/* kmw */
©Copyright IBM Corporation TPC Benchmark H Full Disclosure Report May 2005 Page: 88
Page 91

/* #define TPCD_PREPARETIME 1 */ /* for
separate prep/exec on uf jen 1106 */
#ifdef SQLWINT
#define PATH_DELIM '\\'
#define sleep(a) Sleep((a)*1000)
#else
#define PATH_DELIM '/'
#endif
#define PARALLEL_UPDATES 1
#ifdef PARALLEL_UPDATES
#define UF1OUTSTREAMPATTERN
"%s%cuf1.%02d.%d.out"
#ifdef TPCD_NONPARTITIONED
#define UF2OUTSTREAMPATTERN
"%s%cuf2.%02d.%d.out"
#else
/* kelly add same as NONPART. */
#define UF2OUTSTREAMPATTERN
"%s%cuf2.%02d.%d.out"
/* kelly ... take this out ... should be
same name as for non-paritioned
#define UF2OUTSTREAMPATTERN
"%s%cuf2.%02d.%d.%d.out" */ /*DELjen
add delchunk*/
#endif
#define BUFSIZE 1024
#endif
#define T_STAMP_FORM_1 1
#define T_STAMP_FORM_2 2
/* jen TIME_ACC start */
#define T_STAMP_FORM_3 3
#define T_STAMP_1LEN 17
#if defined (SQLUNIX) || defined (SQLAIX) ||
defined (SQLHP)
#define T_STAMP_3LEN 24
#elif (defined (SQLOS2) || defined(SQLWINT)
|| defined (SQLWIN) || defined(SQLDOS))
#define T_STAMP_3LEN 21 /* WIN NT
timestamp fix bbe */
#else
#error Unknown operating system
#endif
/* jen TIME_ACC start */
#define BLANKS "\0"
#define READMODE "r\0"
#define WRITEMODE "w\0"
#define APPENDMODE "a\0"
#define mem_error(xx)
\
{ fprintf(stderr,"\n--Out of memory when
%s.\n",xx); }
/* Display out-of-memory and end */
#define TPCDBATCH_MIN(x,y) ((x) <
(y) ? (x) : (y))
/** Returns the smaller of both x and y **/
#define TPCDBATCH_MAX(x,y) ((x) >
(y) ? (x) : (y)) /* @d22817 tjg */
/** Returns the larger of both x and y **/
/** Defines needed for decimal conversion
**/
#define SQLZ_DYNLINK
#define TRUE 1
#define LEFT 1
#define RIGHT 0
#define FALSE 0
#define sqlrx_get_left_nibble(byte)
(((unsigned char)(byte)) >> 4)
#define sqlrx_get_right_nibble(byte)
((unsigned char) (byte & '\x0f'))
#define SQL_MAXDECIMAL 31
#define SQLRX_PREFERRED_PLUS 0x0c
/** Timer-necessary defines for portability
**/
#if (defined (SQLOS2) || defined(SQLWINT))
|| defined(SQLWIN) || defined(SQLDOS)
typedef struct timeb Timer_struct;
#elif (defined (SQLUNIX) || defined(SQLAIX)
|| defined(SQLHP)) /*TIMER
jen*/
typedef struct timeval Timer_struct;
#else
#error Unknown operating system
#endif
/* sleep time between starting subsequent
tpcdbatches running UF1 and UF2 */
#define UF1_SLEEP 1
#define UF2_SLEEP 1
#define UF_DEADLOCK_SLEEP 1 /* sleep between
deadlock retries in UF1,UF2 */
#define MAXWAIT 50 /* maximum retries for
deadlock encounters */
#define DEBUG 0 /* to be set to 1 for
diagnostic purposes if needed */
/* #define UF1DEBUG 1 */
/* #define UF2DEBUG 1 */
tpcdbatch.sqc
/*******************************************
**********************************
*
* TPCDBATCH.SQC
*
* Revision History:
*
* 21 Dec 95 jen Corrected calculation of
geometric mean to include in the
* count of statements the
update functions.
* 03 Jan 96 jen Corrected calculation of
arithmetic mean to not include the
* timings for the update
functions. (only want query timings
* as part of arithmetic
mean)
* 15 Jan 96 jen Added extra timestamps to
the update functions.
* 22 Jan 96 jen Get rid of checking of
short_time....we always use the long
* timings.
* Fixed timings to print
query/uf times rounded up to 0.1 seconds
©Copyright IBM Corporation TPC Benchmark H Full Disclosure Report May 2005 Page: 89
Page 92

* and uses these rounded
time values in subsequent calculations
* Fixed bug where last seed
in mseedme file wasn't getting read
* correctly - EOF processing
done too soon.
*
* 22 Feb 96 kbs port to NT
* 26 Mar 96 kbs Fix to avoid countig UFs
as queries for min max
* 27 Jun 97 wlc Temporarily fixed deadlock
problems when doing UF1, UF2
* 30 Jul 97 wlc Add in support for
load_update and TPCD_SPLIT_DELETES
* 13 Aug 97 wlc fixed UF1 log file
formatting problem,
* using TPCD_TMP_DIR for
temp files instead of /tmp,
* make summary table fit in
80-column,
* fixed UF2 # of deleted
rows reporting problem
* 18 Aug 97 wlc added command line support
for inlistmax
* 20 Aug 97 wlc added support for
runthroughput without UF
* 27 Aug 97 aph Replaced hardcoded
'tpcdaudit' with getenv("TPCD_AUDIT_DIR")
* 05 Sep 97 wlc fixing free() problem in NT
* 26 Sep 97 kmw change FLOAT processing in
echo_sqlda and print_headings
* 10 oct 97 jen add lock table in share
mode for staging tables
* 21 oct 97 jen added explicit rollback on
failure of uf1
* 27 oct 97 jen don't update
TPCD.xxxx.update.pair.num if not running UFs
in
* throughput run
* 01 nov 97 jen temp code to do a prep then
execute stmt in UFs so we can
* get timings
* 03 nov 97 jen realligned UF code for
readablility
* pushed UF2 commit into loop
for inlistmax
* fixed UF2 code so rollback
performed
* 04 nov 97 jen Added code to handle vldb
* 06 nov 97 jen Commented out temp code for
prep then execute stmts using
* TPCD_PREPARETIME def
* Updated version number to
2.2
* send all output during
update functiosn to output files, not
* stderr
* 10 nov 97 jen jenCI Updated version
number to 2.3
* Added handling of
TPCD_CONCURRENT_INSERTS. Change control of
* chunk processing to use the
concurrent_inserts value as the
* control. Now the inserts
will be run in TPCD_CONCURRENT_INSERTS
* sets, each having
concurrent_inserts/
* 13 nov 97 jen jen DEADLOCK. FIxed bug
that Alex found where deadlock count
* (maxwait) was incremented
on every execution of the stmt as
* opposed to just when
deadlock really happened.
* 14 nov 97 jen jenSEM - fix up error
reporting on semaphore failure
* sem_op now returns failure
to caller so caller can report where
* failure has happened.
* Forced dbname to be upper
case, an all other parts of update
* pair number to be lowercase
* 15 nov 97 jen SEED Reworked code to grab
the seed from the seed file. Now
* reusing seeds between runs,
so power run will always use first
* seed, throughput will use
the 2nd - #stream+1 seeds
*
* 13 jan 98 jen LONG Increase stmt_str to
be able to hold inlists with larger
* order key numbers
* 04 mar 98 jen IMPORT added support for
TPCD_UPDATE_IMPORT to chose whether
* using import or load api's
for loading data into the staging
* tables
* 04 mar 98 jen TIMER changed from using
gettimer to gettimeofday for unix
* 01 apr 98 jen Fixed IMPORT code to do the
proper checking on strcmp (ie !strcmp)
* 01 apr 98 jen removed code to handle vldb
- not needed
* Upgraded version to 2.4
for ( chunk
* 01 apr 98 jen Fixed up import code on NT
so the variable is recognized in the
* children
* 25 may 98 sks Reworked some of the
environment variable code so consolidate as
* much as possible. Not all
complete because of differences in
* the way nt and AIX calls
(and starts stuff in background) for UFs
* 29 may 98 jen REUSE_STAGE Changed UF1 so
we reuse the same staging tables
* instead of having a new set
for each update pair
* 06 jul 98 jen Removed locking of staging
tables since they are created with
* locksize table now
* 06 jul 98 jen 912RETRY - added code to
retry query execution on 912 as well
* as 911
* 07 jul 98 jen Fixed summary_table() so
1000x adjustment not based on UF (setting
* of max and min pointers
* Added generic SleepSome
function to handle NT vs AIX sleep
differences
* 01 apr 98 djd Added change to permit the
use of table functions for UF1.
* to enable this set
TPCD_UPDATE_IMPORT to tf in TPCD.SETUP file.
* MERGED this into base copy
on Jul 07
* 10 jul 98 jen haider's fix for
'outstream' var for error processing in
* runUF1_fn and runUF2_fn
* Updated version to 2.5
* 25 sep 98 jen Added stream number
printing into mpqry* files and increases
©Copyright IBM Corporation TPC Benchmark H Full Disclosure Report May 2005 Page: 90
Page 93

* accuracy of timestamp in
mpqry (and mts*qry*) files
* 06 oct 98 jen TIME_ACC Added accuracy of
timestamp in mpqry (and mts*qry*)
* files. Cleaned up misuse of
Sleep and flushed buffers on
* deadlocks
* 19 oct 98 kbs fix UF2_fn to correctly
count rows deleted in case of deadlock
* 20 oct 98 kbs rewrite UF2 and UF2_fn for
static SQL with staging table
* 23 oct 98 jen Cleaned up retrying of
order/lineitem on lineitem deadlock in UF1
* 24 oct 98 jen Used load_uf1 and load_uf2
instead of general load_updates
* 26 oct 98 kbs inject the UF1 with a
single staging table
* 02 nov 98 jen Fixed processing of
multiple chunks in uf2 so don't duplicate
* 21 nov 98 kmw Fixed BIGINT
* 05 dec 98 aph Moved runUF1_fn() and
runUF2_fn() into a separate file tpcdUF.sqc
* so that it can be bound
separately with a different isolation level.
* 21 dec 98 aph Integrated Jennifer's QppD
calculation (rounding & adjustment) fixes.
* 22 dec 98 aph For UFs during Throughput
run, defer CONNECT until children launched.
* 28 dec 98 aph Removed error_check() call
after CONNECT RESET
* 29 dec 98 aph For UFs do not COMMIT in
tpcdbatch.sqc. COMMITs happen in
tpcdUF.sqc.
* 18 jan 99 kal replaced header with
#include "tpcdbatch.h"
* 27 may 99 bbeaton from (03 mar 99 jen)
Fixed SUN fix that wasn't compatible with
* NT (using %D %T instead of
%x %X for strftime)
* 16 jun 99 jen Added missing LPCTSTR cast
of semaphore file name for NT
* 17 jun 99 jen SEMA Changes semaphore file
for update functions to look for tpcd.setup
* not for the orders.***
update data file
* 21 jul 99 bbeaton Added semaphore control
that allows runpower to be run as two
* separate streams (update
and query). This involves the use of
* two semaphores to be used
as it executes in three different
* sections. The first is the
update inserts. The next is the query
* stream which is started
with the update stream, but waits until
* the inserts are complete.
The third section is the update deletes
* which execute after the
queries are complete.
* 21 jul 99 bbeaton Added functions to
handle semaphore creation, control, etc.
* 21 jul 99 bbeaton Modified output to
mp*inter files. It now only outputs
* intermediate data that will
be calculated by calcmetricp.pl. This
* is a result of the runpower
being split into two streams and thus
* tpcdbatch not having access
to all data.
* 21 jul 99 bbeaton The start time for
runpower UF2 now does not start until after
* the query stream is
complete so that its wait time is not
included
* NOTE: The wait time that
the first UF1 in runthroughput still
* includes the wait period
that occurs waiting on queries.
* 18 mar 02 kentond removed the need for
list files. Instead of using the *.list
* files to determine the name
of the output files, the tags for the
* source sql files are used.
********************************************
**********************************/
/* included in tpcdbatch.sqc and tpcdUF.sqc
*/
#include "tpcdbatch.h"
/*******************************************
********************************/
/* global structure containing elements
passed between different functions */
/*******************************************
********************************/
struct global_struct
{
struct stmt_info *s_info_ptr;
/* ptr to stmt_info list */
struct stmt_info *s_info_stop_ptr;
/* ptr to last struct in list */
struct comm_line_opt *c_l_opt;
/* ptr to comm_line_opt struct */
struct ctrl_flags *c_flags;
/* ptr to ctrl_flags struct */
Timer_struct stream_start_time;
/* start time for stream TIME_ACC */
Timer_struct stream_end_time;
/* end time for stream TIME_ACC */
char file_time_stamp[50];
/* time stamp for output files */
double scale_factor;
/* scale factor of database */
char run_dir[150];
/* directory for output files */
int copy_on_load;
/* indication of whether or not */
/* to do use a copy directory */
/* (equiv to COPY YES) on load */
/* default is FALSE */
long lSeed;
/* seed used to generate the */
/* queries for this particular */
/* run. */
FILE *stream_list;
/* ptr to query list file */
char
update_num_file[150]; /* name of file that
keeps track */
/* of which update pairs have run*/
char sem_file[150];
/* semaphore name */
char sem_file2[150];
/* semaphore name bbe */
©Copyright IBM Corporation TPC Benchmark H Full Disclosure Report May 2005 Page: 91
Page 94

FILE *stream_report_file;
/* file to report start stop */
/* progress of the stream */
};
/*******************************************
***************************/
/* New type declaration to store details
about SQL statement */
/*******************************************
***************************/
struct stmt_info
{
long max_rows_fetch;
long max_rows_out;
int query_block;
/* @d30369 tjg */
unsigned int stmt_num;
/* @d24993 tjg */
double elapse_time;
/* @d24993 tjg */
double adjusted_time;
char start_stamp[50];
/* start time stamp for block */
char end_stamp[50];
/* end time stamp for block */
char tag[50];
/* block tag */
char qry_description[100];
struct stmt_info *next;
/* @d24993 tjg */
};
/*******************************************
***************************/
/* Structure containing command line options
*/
/*******************************************
***************************/
struct comm_line_opt
{
/* @d22275 tjg */
/* kjd715 */
/* char
str_file_name[256]; */ /* output filename
*/
/* kjd715 */
char infile[256]; /*
input filename */
int intStreamNum; /*
integer version of stream number */
int a_commit; /*
auto-commit flag */
int short_time; /*
time interval flag */
int update;
int outfile;
};
/*******************************************
***************************/
/* Structure used to hold precision for
decimal numbers */
/*******************************************
***************************/
struct declen
{/* kmw */
unsigned char m; /* # of digits
left of decimal */
unsigned char n; /* # of digits
right of decimal */
};
/*******************************************
***************************/
/* Structure containing control flags passed
between functions */
/*******************************************
***************************/
struct ctrl_flags
{
/* @d25594 tjg */
int eo_infile;
int time_stamp;
int eo_block;
/* @d30369 tjg */
int select_status;
};
/*******************************************
****************************/
/* Function Prototypes
*/
/*******************************************
****************************/
int SleepSome( int amount );
int get_env_vars(void);
int Get_SQL_stmt(struct global_struct
*g_struct);
void print_headings (struct sqlda *sqlda,
int *col_lengths); /* @d22817 tjg */
void echo_sqlda(struct sqlda *sqlda, int
*col_lengths);
void allocate_sqlda(struct sqlda *sqlda);
void get_start_time(Timer_struct
*start_time);
double get_elapsed_time (Timer_struct
*start_time);
long error_check(void);
/* @d28763 tjg */
void dumpCa(struct sqlca*); /*kmw*/
void display_usage(void);
char *uppercase(char *string);
char *lowercase(char *string);
void comm_line_parse(int agrc, char *argv[],
struct global_struct *g_struct);
int sqlrxd2a(char *decptr,char
*asciiptr,short prec,short scal);
void init_setup(int argc, char *argv[],
struct global_struct *g_struct);
void runUF1( struct global_struct *g_struct,
int updatePair );
void runUF2( struct global_struct *g_struct,
int updatePair );
/* These need to be extern because they're
in another SQC file. aph 981205 */
/*extern void runUF1_fn( int updatePair, int
i );*/ /* aph 981205 */
©Copyright IBM Corporation TPC Benchmark H Full Disclosure Report May 2005 Page: 92
Page 95

/*extern void runUF2_fn( int updatePair, int
i, int numChunks );*/ /* aph 981205 */
/* Added four new arguments because SQL host
vars can't be global. aph 981205 */
extern void runUF1_fn ( int updatePair, int
i, char *dbname, char *userid, char *passwd
);
extern void runUF2_fn ( int updatePair, int
thisConcurrentDelete, int numChunks, char
*dbname, char *userid, char *passwd );
int sem_op (int semid, int semnum, int
value);
char *get_time_stamp(int form, Timer_struct
*timer_pointer); /* TIME_ACC jen */
void summary_table (struct global_struct
*g_struct);
void free_sqlda (struct sqlda *sqlda, int
select_status); /* @d30369 tjg */
void output_file(struct global_struct
*g_struct);
int PreSQLprocess(struct global_struct
*g_struct, Timer_struct *start_time);
void SQLprocess(struct global_struct
*g_struct);
int PostSQLprocess(struct global_struct
*g_struct, Timer_struct *start_time);
int cleanup(struct global_struct *g_struct);
/* Semaphore control functions */
void create_semaphores(struct global_struct
*g_struct);
void throughput_wait(struct global_struct
*g_struct);
void runpower_wait(struct global_struct
*g_struct, int sem_num);
void release_semaphore(struct global_struct
*g_struct, int sem_num);
#ifdef SQLWINT
HANDLE open_semaphore(struct global_struct
*g_struct, int num);
#else
int open_semaphore(struct global_struct
*g_struct);
#endif
EXEC SQL INCLUDE SQLCA;
/*******************************************
************************/
/* Declare the SQL host variables.
*/
/*******************************************
************************/
EXEC SQL BEGIN DECLARE SECTION;
char stmt_str1[4000] = "\0"; /*
Assume max SQL statment
of
4000 char */
struct { /* jen
LONG */
short len;
char data[32700];
} stmt_str; /* jen
LONG */
char dbname[9] = "\0";
char userid[9] = "\0";
char passwd[9] = "\0";
char sourcefile[256]; /* used
for semaphores and table functions?*/
sqlint32 chunk = 0; /* jenCI
counter for within the set of chunks*/
EXEC SQL END DECLARE SECTION;
/*******************************************
************************/
/* Declare the global variables.
*/
/*******************************************
************************/
struct sqlda *sqlda; /*
SQL Descriptor area */
/* Global environment variables (sks May 25
98)*/
char env_tpcd_dbname[100];
char env_user[100];
char env_tpcd_audit_dir[150];
char env_tpcd_path_delim[2];
char env_tpcd_tmp_dir[150];
char env_tpcd_run_on_multiple_nodes[10];
char env_tpcd_copy_dir[150];
char env_tpcd_update_import[10];
/* Other globals */
FILE *instream, *outstream; /*
File pointers */
int verbose = 0; /*
Verbose option flag */
int semcontrol = 1;
/* allows/disallows smaphores usage */
int updatePairStart; /*
update pair to start at */
int currentUpdatePair; /*
update pair running */
int updatePairStop; /*
update pair to stop before */
char newtime[50]="\0"; /*
Des - moved from get_time_stamp */
char outstreamfilename[256]; /*
store filename of outstream
wlc 081397 */
int inlistmax = 400; /*
define # of keys to delete at a time
wlc 081897 */
int sqlda_allocated = 0; /*
fixing free() problem in NT
wlc 090597 */
int iImportStagingTbl=0; /*
IMPORT use import or load (default) */
char temp_time_stamp[50]; /*
holds end timestamp to be copied into
start_time_stamp of next query bbeaton */
Timer_struct temp_time_struct; /*
holds end time value to be copied into
start_time of next query bbeaton */
/* constants for the semaphores used; 1 for
throughput and 2 for power */
#define INSERT_POWER_SEM 1
#define QUERY_POWER_SEM 2
#define THROUGHPUT_SEM 1
©Copyright IBM Corporation TPC Benchmark H Full Disclosure Report May 2005 Page: 93
Page 96

/*******************************************
************************/
/* Start main program processing.
*/
/*******************************************
************************/
int main(int argc, char *argv[])
{
/* kjd715 */
/*struct comm_line_opt c_l_opt = {
"\0","\0", 0, 1, 0, 0, 0 };*/ /* kjd715 */
struct comm_line_opt c_l_opt = { "\0", 0,
1, 0, 0, 0 };
/* kjd715 */
/* command line options */
Timer_struct start_time;
/* start point for elapsed time */
struct stmt_info s_info = { -1, -1, 0,
1, -1, -1, "\0", "\0", "\0", "\0", NULL };
/* first stmt_info structure */
struct ctrl_flags c_flags = { 0, 1, 0,
TPCDBATCH_SELECT };
/* structure holding ctrl flags
passed between functions */
/* TIME_ACC jen start */
#if defined (SQLUNIX) || defined (SQLAIX)
struct global_struct g_struct =
{ NULL, NULL, NULL, NULL, {0,0}, {0,0},
"\0", 0.1, "\0", FALSE, 0,
NULL, "\0", "\0", "\0", NULL };
#elif (defined (SQLOS2) || defined(SQLWINT)
|| defined (SQLWIN) || defined(SQLDOS))
struct global_struct g_struct =
{ NULL, NULL, NULL, NULL, {0,0,0,0},
{0,0,0,0}, "\0", 0.1, "\0", FALSE, 0,
NULL, "\0", "\0", "\0", NULL };
#else
#error Unknown operating system
#endif
/* TIME_ACC jen end */
/* Get environment variables */
if (get_env_vars() != 0)
return -1;
/* perform setup and initialization and
get process id of agent */
outstream = stdout;
g_struct.c_flags = &c_flags;
g_struct.s_info_ptr = &s_info;
g_struct.c_l_opt = &c_l_opt;
init_setup(argc,argv,&g_struct);
/* @d22275 tjg */
if ((g_struct.c_l_opt->update == 1) &&
(semcontrol == 1))
/* runpower: wait for insert function to
complete */
/* waiting on the INSERT_POWER_SEM
semaphore */
runpower_wait(&g_struct,
INSERT_POWER_SEM);
strcpy(temp_time_stamp, "0");
/*******************************************
***********************************
*
*
* This is the transition from the
"driver" to the "SUT" *
*
*
********************************************
**********************************/
/*******************************************
****************************/
/* Read in each statement, prepare,
execute, and send output to file. */
/*******************************************
****************************/
while (!c_flags.eo_infile) { /* Check to
see if there's no more input */
c_flags.eo_block = 0;
if (c_l_opt.outfile)
output_file(&g_struct); /* determine
appropriate name for output files */
if ((g_struct.c_l_opt->update != 3) &&
(g_struct.c_l_opt->update != 4))
{
if (!strcmp(temp_time_stamp, "0")) /*
if first query, get timestamp */
{
get_start_time(&start_time);
strcpy(g_struct.s_info_ptr>start_stamp,
get_time_stamp(T_STAMP_FORM_3,&start_time
)); /* TIME_ACC jen*/
}
else /* else get the end timestamp
of previous query */
{
strcpy(g_struct.s_info_ptr>start_stamp, temp_time_stamp);
start_time = temp_time_struct;
}
/* write the start timestamp to the
file...if this is not a qualification */
/* run, then write the seed used as
well */
fprintf( outstream,"Start timestamp
%*.*s \n",
T_STAMP_3LEN,T_STAMP_3LEN,
/* TIME_ACC jen*/
g_struct.s_info_ptr>start_stamp);
if (c_l_opt.intStreamNum >= 0)
{
if (g_struct.lSeed == -1)
{
fprintf( outstream,"Using
default qgen seed file");
}
else
©Copyright IBM Corporation TPC Benchmark H Full Disclosure Report May 2005 Page: 94
Page 97

fprintf( outstream,"Seed used =
%ld",g_struct.lSeed);
fprintf( outstream,"\n");
}
}
do { /* Loop through these statements
as long as we haven't reached
the end of the input file or
the end of a block of statements
*/
/** Read in the next statment **/
c_flags.select_status=Get_SQL_stmt(&g_struct
);
if (PreSQLprocess(&g_struct,
&start_time) == FALSE)
/* if after reading the next
statement we see that we should
exit this loop (i.e. eof, update
functions, etc...), get out
*/
break;
/*******************************************
***********************************
*
*
* The SQLprocess function
implements the implementation specific
layer. *
* It can handle arbitrary SQL
statements.
*
*
*
********************************************
**********************************/
/* If we've got up to here then
processing
a regular SQL statement */
SQLprocess(&g_struct);
} while ((!c_flags.eo_block) &&
(!c_flags.eo_infile)); /* @d30369 tjg */
if
(PostSQLprocess(&g_struct,&start_time) ==
FALSE)
/* if we've reached the end of the
input file, then get out
of this loop (i.e. no more
statements). Otherwise get
elapsed times and display info
about rows */
break;
} /* end of for loop for multiple SQL
statements */
g_struct.s_info_ptr = &s_info; /* set the
global pointer to start of
linked
list */
cleanup(&g_struct); /* finish some
semaphore stuff, cleanup files,
and print out
summary table */
/*******************************************
***********************************
*
*
* In cleanup we make the transition
back from the "SUT" to the "driver" *
*
*
********************************************
**********************************/
return(0);
} /* end of main */
/*******************************************
****************************/
/* Generic form of Sleep */
int SleepSome( int amount)
{
#ifndef SQLWINT
sleep (amount);
#else
Sleep (amount*1000); /* 10x for
NT DJD Changed "sleep" to "Sleep" */
#endif
return 0;
}
/*******************************************
****************************/
/*******************************************
************************/
/* Get environment variables. (sks May 25
98) */
/*******************************************
************************/
int get_env_vars(void) {
if (strcpy(env_tpcd_dbname,
getenv("TPCD_DBNAME")) == NULL) {
fprintf(stderr, "\n The environment
variable $TPCD_DBNAME is not setup
correctly.\n");
return -1;
}
if (strcpy(env_user, getenv("USER")) ==
NULL) {
fprintf(stderr, "\n The environment
variable $USER is not setup correctly.\n");
return -1;
}
if (strcpy(env_tpcd_audit_dir,
getenv("TPCD_AUDIT_DIR")) == NULL) {
fprintf(stderr, "\n The environment
variable $TPCD_AUDIT_DIR is not setup
correctly.\n");
return -1;
}
if (strcpy(env_tpcd_tmp_dir,
getenv("TPCD_TMP_DIR")) == NULL) {
©Copyright IBM Corporation TPC Benchmark H Full Disclosure Report May 2005 Page: 95
Page 98

fprintf(stderr, "\n The environment
variable $TPCD_TMP_DIR is not setup
correctly.\n");
return -1;
}
#if 0
if (strcpy(env_tpcd_path_delim,
getenv("TPCD_PATH_DELIM")) == NULL ||
(strcmp(env_tpcd_path_delim, "/") &&
strcmp(env_tpcd_path_delim, "\\"))){
fprintf(stderr, "\n The environment
variable $TPCD_PATH_DELIM is not setup
correctly , env_tpcd_path_delim'%s'.\n",
env_tpcd_path_delim);
return -1;
}
#endif
strcpy( env_tpcd_path_delim , "/" );
/*kmw*/
if
(strcpy(env_tpcd_run_on_multiple_nodes,
getenv("TPCD_RUN_ON_MULTIPLE_NODES")) ==
NULL) {
fprintf(stderr, "\n The environment
variable $TPCD_RUN_ON_MULTIPLE_NODES");
fprintf(stderr, "\n is not setup
correctly.\n");
return -1;
}
if (strcpy(env_tpcd_copy_dir,
getenv("TPCD_COPY_DIR")) == NULL) {
fprintf(stderr, "\n The environment
variable $TPCD_COPY_DIR is not setup
correctly.\n");
return -1;
}
/* If TPCD_UPDATE_IMPORT is not set then,
the default is set to false, */
/* which is done in init_setup subroutine
*/
strcpy(env_tpcd_update_import,
getenv("TPCD_UPDATE_IMPORT"));
return 0;
}
/*******************************************
************************/
/* Get the SQL statement and any control
statements from input. */
/*******************************************
************************/
int Get_SQL_stmt(struct global_struct
*g_struct)
{
char input_ln[256] = "\0"; /*
buffer for 1 line of text */
char temp_str[4000] = "\0"; /* temp
string for SQL stmt */
char control_str[256] = "\0"; /*
control string */
char *test_semi; /* ptr
to test for semicolon */
char *control_opt; /* ptr
used in control_str parsing */
char *select_status; /* ptr
to first word in query */
char *temp_ptr; /*
general purpose temp ptr */
int good_sql = 0; /* goodsql stmt flag @d23684 tjg */
int stmt_num_flag = 1; /* first
line of SQL stmt flag */
int eostmt = 0; /* flag
to signal end of statement */
stmt_str.data[0]='\0'; /*
Initialize statement buffer */
if (verbose)
fprintf (stderr,"\n-------------------
--------------------------\n");
fprintf (outstream,"\n-------------------
--------------------------\n");
do {
/** Read in lines from input one at a
time **/
fscanf(instream, "\n%[^\n]\n",
input_ln);
if (strstr(input_ln,"--") == input_ln)
{ /* Skip all -- comments */
if (strstr(input_ln,"--#SET") ==
input_ln) {
/*
Store control string but
keep going to find SQL stmt */
strcpy(control_str,input_ln);
if (verbose)
fprintf(stderr,"%s\n",
uppercase(control_str));
fprintf(outstream,"%s\n",
uppercase(control_str));
/** Start parsing control str.
and update appropriate vars. **/
control_opt =
strtok(control_str," ");
while (control_opt != NULL) {
if (strcmp(control_opt,"-#SET")) { /* Skip the #SET token */
if
(!strcmp(control_opt,"ROWS_FETCH"))
g_struct->s_info_ptr>max_rows_fetch = atoi(strtok(NULL," "));
if
(!strcmp(control_opt,"ROWS_OUT"))
g_struct->s_info_ptr>max_rows_out = atoi(strtok(NULL," "));
}
control_opt = strtok(NULL,"
");
}
}
/* if the block option has been
set, then check if we've
reached the end of a block of
statements */
©Copyright IBM Corporation TPC Benchmark H Full Disclosure Report May 2005 Page: 96
Page 99

if (g_struct->s_info_ptr>query_block) /* @d30369
tjg */
if (strstr(input_ln,"--#EOBLK")
== input_ln) {
g_struct->c_flags->eo_block =
1;
return TPCDBATCH_EOBLOCK;
}
if (strstr(input_ln, "-- Query") ==
input_ln)
strcpy(g_struct->s_info_ptr>qry_description,input_ln);
if (strstr(input_ln, "--#TAG") ==
input_ln)
strcpy(g_struct->s_info_ptr>tag,(input_ln+sizeof("--#TAG")));
/* if we're using update functions,
return that info
appropriately */
if (g_struct->c_l_opt->update != 0)
{
if (strstr(input_ln, "-#INSERT") == input_ln)
return TPCDBATCH_INSERT;
if (strstr(input_ln, "-#DELETE") == input_ln)
return TPCDBATCH_DELETE;
}
if (strstr(input_ln, "--#COMMENT")
== input_ln) { /* @d25594 tjg */
temp_ptr = (input_ln + 11); /*
User-specified comments go to
the outfile */
if (verbose)
fprintf
(stderr,"%s\n",temp_ptr);
fprintf
(outstream,"%s\n",temp_ptr);
}
eostmt=0;
}
/* Need this hack here to check if
there's any more empty lines left
in the input file. Continue only
if there are aren't any */
else if (strcmp(input_ln, "\0")) /*
HACK */ { /* A regular SQL statement */
if (stmt_num_flag) { /* print this
out only if it's the first line
of the SQL
statement. We only want this
line to
appear once per statement */
if (verbose)
fprintf(stderr,"\n%s\n",
g_struct->s_info_ptr->qry_description);
fprintf(outstream,"\n%s\n",
g_struct->s_info_ptr->qry_description);
if (verbose)
fprintf(stderr,"\nTag: %-5.5s
Stream: %d Sequence number: %d\n",
g_struct->s_info_ptr>tag,g_struct->c_l_opt->intStreamNum,
g_struct->s_info_ptr>stmt_num); /*jen0925*/
fprintf(outstream,"\nTag: %-5.5s
Stream: %d Sequence number: %d\n",
g_struct->s_info_ptr>tag,g_struct->c_l_opt->intStreamNum,
g_struct->s_info_ptr>stmt_num); /*jen0925*/
/* Turn off this flag once the
number has been printed */
stmt_num_flag = 0;
} /** Print out this heading the
first time you encounter a
non-comment statement **/
/* Test to see if we've reached the
end of a statement */
good_sql = TRUE;
/* @d23684 tjg */
test_semi = strstr (input_ln,";");
if (test_semi == NULL) { /* if
there's no semi-colon keep on going */
strcat (stmt_str.data,input_ln);
/* jen LONG */
strcat (stmt_str.data," ");
/* jen LONG */
stmt_str.len = strlen(
stmt_str.data ); /* jen LONG */
eostmt = 0;
}
else { /* else
replace the ; with a \0 and continue */
*test_semi = '\0';
strcat (stmt_str.data,input_ln);
/* jen LONG */
stmt_str.len = strlen(
stmt_str.data ); /* jen LONG */
eostmt = 1;
}
fprintf(outstream, "\n%s",
input_ln);
if (verbose)
fprintf(stderr,"\n%s",
input_ln);
}
/** Test to see if we've reached the
EOF. Get out if that's the case **/
if (feof(instream)) {
eostmt = TRUE;
g_struct->c_flags->eo_infile =
TRUE; /* @d22275 tjg */
}
} while (!eostmt);
fprintf(outstream, "\n");
if (verbose)
fprintf(stderr,"\n");
/** erase the old control string **/
strcpy(control_str,"\0");
©Copyright IBM Corporation TPC Benchmark H Full Disclosure Report May 2005 Page: 97
Page 100

/** Determine whether statement is a
SELECT or other SQL **/
if (good_sql) {
strcpy(temp_str,stmt_str.data);
/* jen LONG */
uppercase(temp_str); /* Make sure
that select is made to SELECT */
select_status=strtok(temp_str," ");
if ( (stmt_str.data[0] == '(') ||
(!strcmp(select_status,"SELECT")) ||
(!strcmp(select_status,"VALUES"))
||
(!strcmp(select_status,"WITH")) )
return TPCDBATCH_SELECT;
else
return TPCDBATCH_NONSELECT;
}
/** If you go through a file with just
comments or control statments
with no SQL, there's nothing to
process...Exit TPCDBATCH **/
else
/* @d23684 tjg */
return TPCDBATCH_NONSQL;
} /* Get_SQL_stmt */
/*******************************************
************************/
/* allocate_sqlda -- This routine allocates
space for the SQLDA. */
/*******************************************
************************/
void allocate_sqlda(struct sqlda *sqlda)
{
int loopvar;
/* Loop counter */
for (loopvar=0; loopvar<sqlda->sqld;
loopvar++)
{
switch (sqlda>sqlvar[loopvar].sqltype)
{
case SQL_TYP_INTEGER:
/* INTEGER */
case SQL_TYP_NINTEGER:
if ((sqlda>sqlvar[loopvar].sqldata=
(TPCDBATCH_CHAR
*)malloc(sizeof(sqlint32))) == NULL)
mem_error("allocating INTEGER");
break;
case SQL_TYP_BIGINT:
/* BIGINT */ /*kmwBIGINT*/
case SQL_TYP_NBIGINT:
/*#ifdef SQLWINT */
/* if ((sqlda>sqlvar[loopvar].sqldata= */
/* (TPCDBATCH_CHAR
*)malloc(sizeof(__int64))) == NULL)*/
/* #else */
if ((sqlda>sqlvar[loopvar].sqldata=
(TPCDBATCH_CHAR
*)malloc(sizeof(sqlint64))) == NULL)
/* #endif*/
mem_error("allocating BIGINT");
break;
case SQL_TYP_CHAR:
/* CHAR */
case SQL_TYP_NCHAR:
if ((sqlda>sqlvar[loopvar].sqldata=
(TPCDBATCH_CHAR
*)calloc(256,sizeof(char))) == NULL)
mem_error("allocating
CHAR/VARCHAR");
break;
case SQL_TYP_VARCHAR:
/* VARCHAR */
case SQL_TYP_NVARCHAR:
if ((sqlda>sqlvar[loopvar].sqldata=
(TPCDBATCH_CHAR
*)calloc(4002,sizeof(char))) == NULL)
mem_error("allocating
CHAR/VARCHAR");
break;
case SQL_TYP_LONG:
/* LONG VARCHAR */
case SQL_TYP_NLONG:
if ((sqlda>sqlvar[loopvar].sqldata=
(TPCDBATCH_CHAR
*)calloc(32702,sizeof(char))) == NULL)
mem_error("allocating
VARCHAR/LONG VARCHAR");
break;
case SQL_TYP_FLOAT:
/* FLOAT */
case SQL_TYP_NFLOAT:
if ((sqlda>sqlvar[loopvar].sqldata=
(TPCDBATCH_CHAR
*)malloc(sizeof(double))) == NULL)
mem_error("allocating FLOAT");
break;
case SQL_TYP_SMALL:
/* SMALLINT */
case SQL_TYP_NSMALL:
if ((sqlda>sqlvar[loopvar].sqldata=
(TPCDBATCH_CHAR
*)malloc(sizeof(short))) == NULL)
mem_error("allocating
SMALLINT");
break;
case SQL_TYP_DECIMAL:
/* DECIMAL */
case SQL_TYP_NDECIMAL:
if ((sqlda>sqlvar[loopvar].sqldata=
(TPCDBATCH_CHAR
*)malloc(20)) == NULL)
mem_error("allocating DECIMAL");
break;
case SQL_TYP_CSTR:
/* VARCHAR (null terminated) */
case SQL_TYP_NCSTR:
if ((sqlda>sqlvar[loopvar].sqldata=
(TPCDBATCH_CHAR
*)calloc(4001,sizeof(char))) == NULL)
mem_error("allocating
CHAR/VARCHAR");
break;
©Copyright IBM Corporation TPC Benchmark H Full Disclosure Report May 2005 Page: 98
 Loading...