

Page 1
Performance Management
Performance Management
for Power Systems:
for Power Systems:
Getting Started Guide
Getting Started Guide
http://www.ibm.com/systems/power/support/perfmgmt/
© 2010 IBM Corporation
Page 2

IBM Global Technology Services
PM for Power Systems levels of support
Summary (No Charge) support
This level of support is available for systems under warranty or a
maintenance agreement. Users with Summary support have access to
monthly statistics for the Server or LPAR via the Server Information Page,
as well as the Management Summary Graph report.
Full Function support
This level of support is available for a nominal fee as either a standalone
offering, or included in a comprehensive services package such as
Enhanced Technical Support. This option gives the user access to a
monthly detailed report, as well as the Interactive Graphing capability of
PM for Power Systems. With Interactive Graphing, a user is able to view
the PM data within 1 business day of IBM receiving the data.
2
© 2010 IBM Corporation
Page 3
IBM Global Technology Services
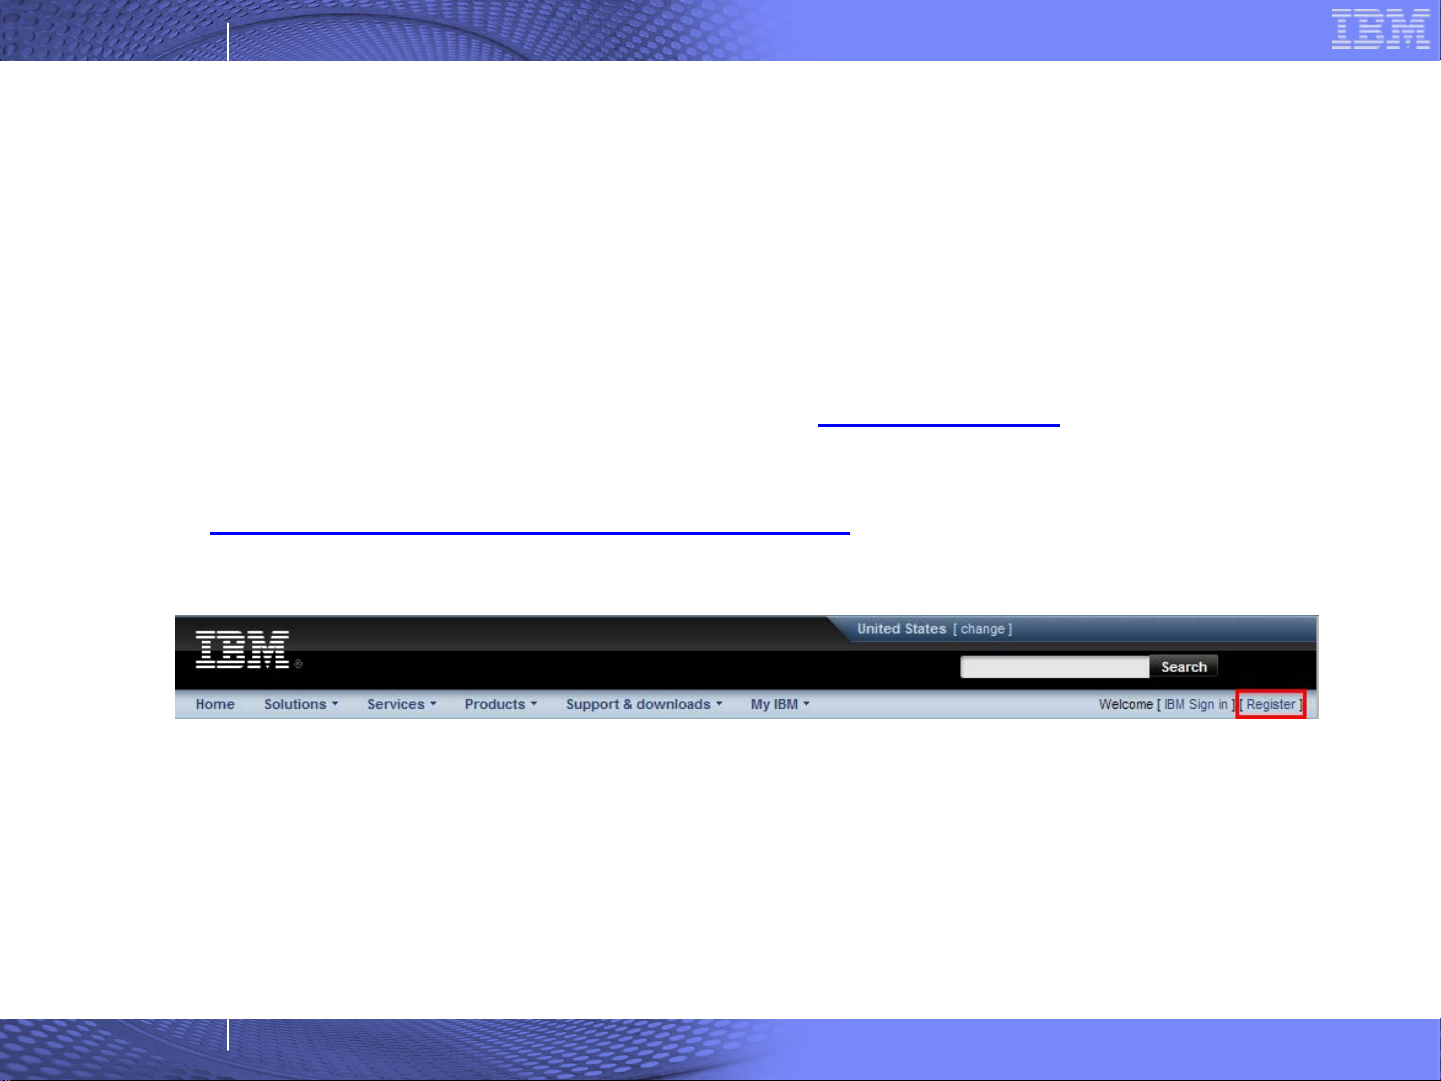
Registering for an IBM ID
An IBM ID is required in order to securely access the PM for Power
Systems Web application.
To register for an IBM ID, please visit www.ibm.com
the “Register” link at the top of the page or visit
https://www.ibm.com/account/profile/
and click on
Complete the form to receive an IBM ID.
3
© 2010 IBM Corporation
Page 4
IBM Global Technology Services
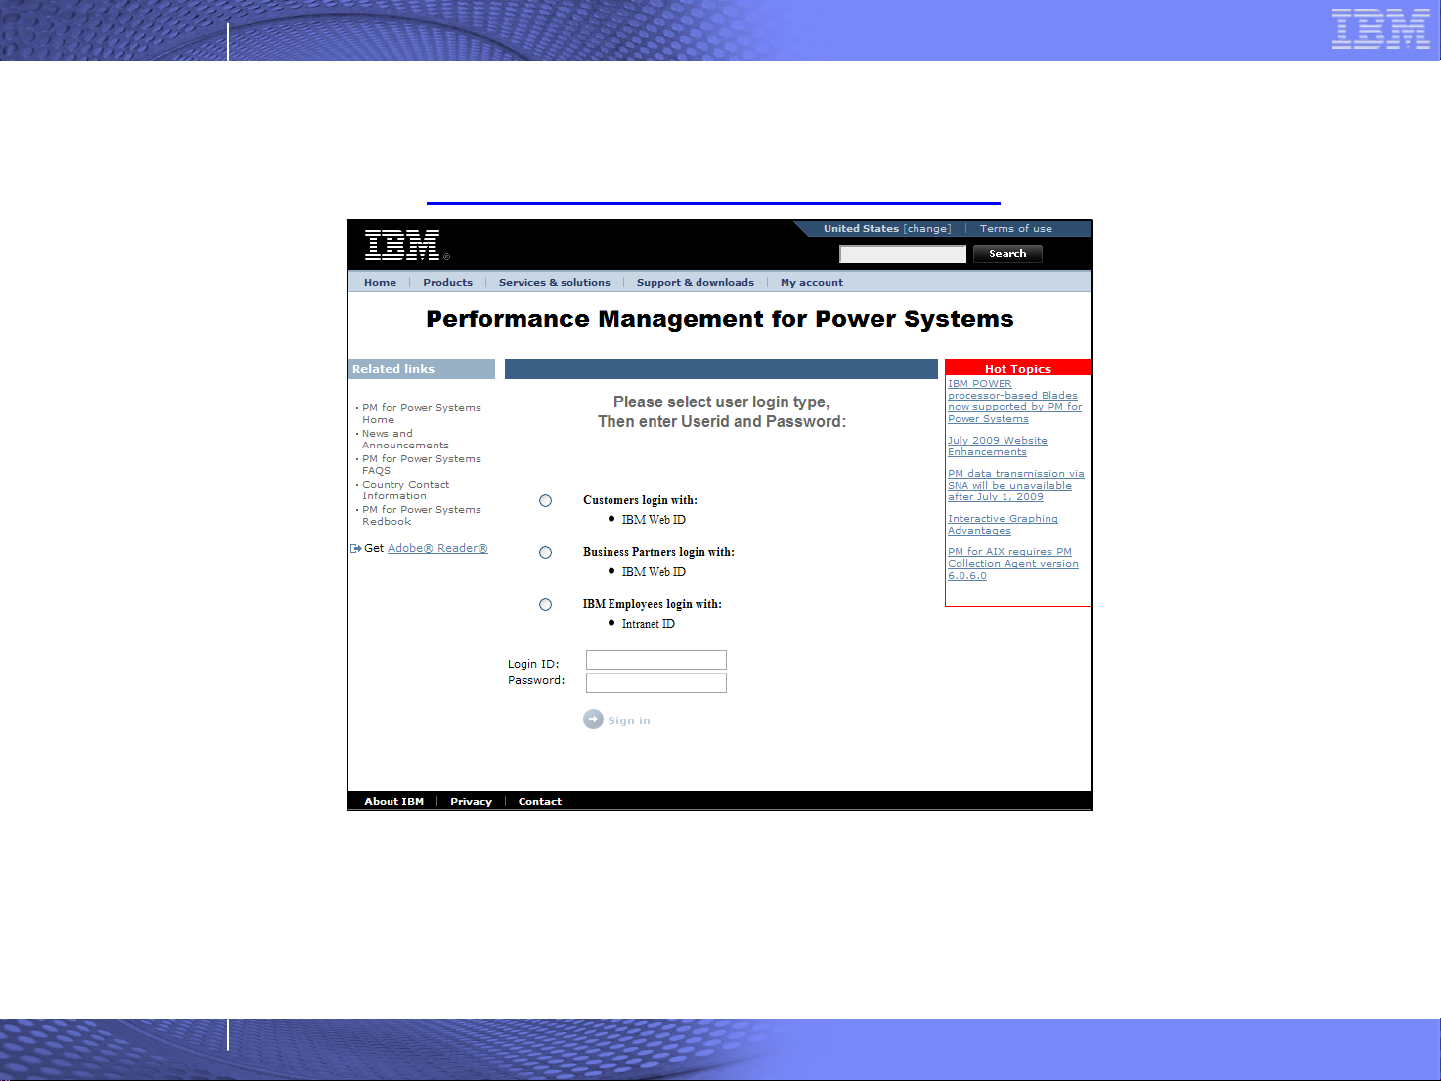
Login Page and URL
https://pmeserver.rochester.ibm.com/
Important information regarding updates or changes to PM for Power
Systems can be found in the Hot Topics section, on the right side of
the PM Login Page.
4
© 2010 IBM Corporation
Page 5

IBM Global Technology Services
Welcome Page
5
© 2010 IBM Corporation
Page 6

IBM Global Technology Services
Creating a Group
One of the features of PM for Power Systems is the ability to create
groups of servers. A group is a collection of servers/LPARs based on
the user’s business requirements. For example, a user might have
several groups that are based on business regions.
6
© 2010 IBM Corporation
Page 7

IBM Global Technology Services
Authorize Additional Users
The creator of a group, or “group owner”, can also grant authorization
to other users. These “authorized users” are allowed to view the
group, but not make any changes.
7
© 2010 IBM Corporation
Page 8

IBM Global Technology Services
Adding Servers to a Group
Once a group is created, servers may be added to it. To add a server, use the
information provided in the registration letter which was sent after the server or
LPAR’s first PM data transmission. If the registration key has been lost or
forgotten, a link is provided on the Add Server page to request a new one.
8
© 2010 IBM Corporation
Page 9

IBM Global Technology Services
Confirmation of Server Addition
If there are additional servers or LPARs to add, click on Add Another
Server to this Group. Otherwise, click Finish to return to the Server
Information Page.
9
© 2010 IBM Corporation
Page 10

IBM Global Technology Services
Server Information Page
The Server Information Page displays monthly statistics for the first and second
shift for each server in the group. Action Buttons, which provide access to
additional functions, are located to the left of each server or LPAR.
10
© 2010 IBM Corporation
Page 11

IBM Global Technology Services
Action Buttons
Interactive Graphing – Detailed performance reports and graphs at
the monthly, daily, and hourly levels, with customizable date ranges.
Servers with the Summary option will only have access to the
interactive Management Summary Graphs (MSG). See the Interactive
Graphing Tours for more information.
PDF Report – A detailed monthly version of the performance reports
and graphs in document format. Servers with the Summary option
will only have access to a single-page Management Summary
Report.
11
Transmission History – A chart of which days and shifts have been
processed to quickly identify any problems in transmitting PM data.
Authorize a Business Partner – Give a Business Partner access to
view the reports.
Contact Information – Access the contact information for the server or
LPAR.
© 2010 IBM Corporation
Page 12

IBM Global Technology Services
Explanation of Status Indicators
Yellow Triangle- Indicates a resource is marginal or a
tuning metric is marginal. Marginal means that periodic
degradation is occurring due to the condition.
Red Box with white X - Indicates a resource is critical or a
tuning metric is critical. Critical means that degradation is
occurring due to the condition.
12
On many PM graphs, colored bars are used to indicate
resource or metric guidelines. Green indicates acceptable
ranges. Yellow indicates marginal ranges, and red
indicates the range considered to be above the critical
guideline. The current or trended usage for the period is
then overlaid on the colored bars.
© 2010 IBM Corporation
 Loading...