

Page 1

Sterling B2B Integrator
Performance Management
Version 5.2
IBM
Page 2

Page 3

Sterling B2B Integrator
Performance Management
Version 5.2
IBM
Page 4

Note
Before using this information and the product it supports, read the information in “Notices” on page 247.
Copyright
This edition applies to Version 5 Release 2 of Sterling B2B Integrator and to all subsequent releases and
modifications until otherwise indicated in new editions.
© Copyright IBM Corporation 2000, 2015.
US Government Users Restricted Rights – Use, duplication or disclosure restricted by GSA ADP Schedule Contract
with IBM Corp.
Page 5

Contents
Performance Management ....... 1
Overview ............... 1
Intended Audience ........... 2
System Components ........... 2
Performance Tuning Methodology ...... 4
Performance Recommendations Checklists .... 5
Sterling B2B Integrator: General Recommendations
Checklist .............. 5
IBM Sterling File Gateway: Specific
Recommendations Checklist ........ 9
EBICS Banking Server: Specific
Recommendations ........... 12
Database Management........... 13
Planning .............. 13
Server Sizing ............. 14
Storage and File Systems ......... 14
Database management for Sterling B2B Integrator 16
Oracle Database Configuration and Monitoring 22
IBM DB2 for LUW Configuration and Monitoring 35
Microsoft SQL Server Configuration and
Monitoring ............. 51
Java Virtual Machine ........... 61
Garbage Collection Statistics ........ 62
JVM Verbose Garbage Collection ...... 62
IBM JVM Garbage Collection Example .... 62
Introduction to HotSpot JVM Performance and
Tuning ............... 63
Introduction to the IBM JVM Performance and
Tuning Guidelines ........... 78
Monitoring Operations .......... 82
Managing System Logs ......... 82
Auditing .............. 93
Monitoring a Business Process Thread .... 94
Monitoring Messages .......... 96
Reviewing System Information ....... 97
Monitoring Node Status ......... 106
Monitoring Deprecated Resources ..... 109
Soft Stop of Sterling B2B Integrator ..... 110
Hard Stop of Sterling B2B Integrator .... 120
Performance Tuning ........... 120
Performance Tuning Utility........ 120
Manual Performance Tuning ....... 166
Performance Statistics .......... 203
Turning On and Turning Off Performance
Statistics .............. 213
Reporting Performance Statistics ...... 213
Troubleshooting ............ 214
Database Maintenance Check ....... 214
Full Database Issues and Resolution ..... 218
Database Connection Issues ....... 222
Database Down Check ......... 224
Tracking JDBC Connections ....... 226
Types of Cache Memory......... 227
Symptoms and Causes of Inefficient Cache
Usage ............... 228
Resolving Inefficient Cache Usage ..... 228
Correcting Dropped Data Problems ..... 229
Correcting Out-Of-Memory Errors ..... 230
Understanding Business Process ...... 230
Symptoms and Causes of Poor Business Process
Execution Time ............ 230
Resolving Halted, Halting, Waiting, or
Interrupted Business Processes ...... 232
Slow System: Symptoms, Causes, and
Resolution ............. 234
Performing a Thread Dump ....... 236
Scenario-Based Troubleshooting Tips and
Techniques ............. 239
Performance and Tuning Worksheet ...... 241
workflowLauncher: Running a Business Process
from a Command Line .......... 244
Notices .............. 247
Index ............... 251
© Copyright IBM Corp. 2000, 2015 iii
Page 6

iv Sterling B2B Integrator: Performance Management
Page 7

Performance Management
You can manage the performance of Sterling B2B Integrator according to your
needs.
Overview
Typically, performance in general, and optimal performance in particular, are
associated with the following criteria: latency, throughput, scalability, and load.
v Latency – The amount of time taken to generate a response to a request (speed).
v Throughput – The amount of data transferred during a specified period
(volume).
v Scalability – The ability of the system to adapt to increasing workload
(additional hardware).
v Load – The ability of the system to continue performing at optimal level even
when the load on the system increases.
Sterling B2B Integrator performance can be tuned to meet various processing
requirements, including higher processing speed and ability to sustain high
volumes. The amount of resources given to the interactive and batch components
of a mixed workload determines the trade-off between responsiveness (speed) and
throughput (work completed in a certain amount of time).
When using Sterling B2B Integrator, if you face any performance issues, perform
the applicable task or tasks from the following list:
v Change performance parameters in the properties files or through the
performance tuning utility. For more information about changing performance
parameters, refer to “Performance Tuning Utility” on page 120.
v Add additional hardware.
v Tune your business processes to run more efficiently on Sterling B2B Integrator.
v Monitor and archive the database to free up resources.
v Create Sterling B2B Integrator cluster for load balancing and scaling.
Before You Begin Performance Tuning
Before you carry out performance tuning actions, you must consider capacity
planning issues. The “Performance and Tuning Worksheet” on page 241 provides
information about how to determine your capacity requirements. This worksheet,
and other capacity planning tools, also help you adjust your current workload,
regardless of your future requirements.
Following is a list of some capacity issues that impact performance and tuning:
v Daily volume requirements, including the average size and number of
transactions to be processed.
v Additional processing requirements, for example, translation, and
straight-through processing.
v Types of pay loads, including EDIFACT, XML, and other formats.
v Translation requirements, for example, translation from EDIFACT to XML.
© Copyright IBM Corp. 2000, 2015 1
Page 8

v Enterprise Resource Planning (ERP) integration requirements, for example,
integration with SAP®or PeopleSoft®.
v Number of processors that are available and can be dedicated to Sterling B2B
Integrator.
v Memory available to meet your processing requirements.
v Disk space available.
v Hard disk Redundant Array of Independent Disks (RAID) level. RAID arrays
use two or more drives in combination for fault tolerance and performance. The
recommended RAID level for Sterling B2B Integrator is Level 5.
v Database size requirements.
Note: When conducting a performance tuning activity, keep the information
provided in this topic at hand for easy reference and future planning.
Intended Audience
This document is intended for, but not limited to:
v Technical Architects
v Performance Engineers
v Configuration Engineers
v Application Administrators
v Database Administrators
v System Administrators
System Components
Performance management activities affect all aspects of the system, including
computer nodes, network, disks, database, and so on.
One person or role may be responsible for one, several, or all the components.
Some of the roles include:
v Hardware Engineer
v System Administrator
v Network Engineer - Local Area or Wide Area
v Application Server Administrator
v Database Administrator
v Capacity Planning Engineer
v Performance Analyst
v IBM®Sterling B2B Integrator Administrator
Performance management documentation includes the following information:
v Background information about the different performance and tuning issues
when running Sterling B2B IntegratorSterling B2B Integrator.
v Step-by-step information that helps you:
– Optimize the performance.
– Diagnose and resolve performance issues, if any, to suit your environment.
You can work through most performance and tuning issues using the following
tools:
v Properties file settings, which you can access through the properties directory in
your installation directory.
2 Sterling B2B Integrator: Performance Management
Page 9

v The Sterling B2B Integrator user interface. Use the Operations option in the
Administration menu to access the following tools:
– JDBC Monitor (Operations > JDBC Monitor)
– JVM Monitor (Operations > System > Performance > JVM Monitor)
– Message Monitor (Operations > Message Monitor)
– Performance Statistics Report (Operations > System > Performance >
Statistics)
– Performance Tuning Wizard (Operations > System > Performance > Tuning)
– System Troubleshooting (Operations > System > Troubleshooter)
– Thread Monitor (Operations > Thread Monitor)
Based on the diversity of the roles and the responsibilities associated with them,
the Sterling B2B Integrator Performance Management Guide is divided into the
following sections:
v Overview - Provides performance tuning overview, audience information,
performance concepts overview, performance tuning methodologies, and tuning
issues that may arise when running Sterling B2B Integrator.
v Performance recommendations checklist - Provides general, planning, and
implementation (single node and cluster) checklists. This topic caters to
hardware engineers, system administrators, network engineers, capacity
planners, and Sterling B2B Integrator administrators.
v Database management system - Discusses key recommendations for Oracle®,
IBM DB2®, Microsoft SQL Server™, and MySQL databases. This topic caters to
database administrators.
v Java™Virtual Machines - Explains configuration, recommendations, and so on.
This topic caters to application server administrators.
v Monitoring operations, performance tuning, and performance statistics -
Discusses monitoring operations, performance tuning (utility and manual), and
management of performance statistics.
v Monitoring operations - Provides information about system logs, auditing,
business process threads, messages, system information, and cluster node status.
v Performance tuning - Explains performance tuning using the performance tuning
wizard, and manual performance tuning recommendations such as scheduling
policies, cache contents, persistence levels, property files, and system recovery.
v Performance statistics - Provides information about managing, enabling and
disabling, and reporting performance statistics.
v Troubleshooting - Provides information about resolving full database issues, Java
Database Connectivity (JDBC™) connections, cache issues, memory issues, slow
system issues, and improving business process execution time.
v Performance and tuning worksheet - Helps you to take an inventory of the
different parts of your Sterling B2B Integrator installation that affects
performance.
v workFlow Launcher - Explains how to run business processes from the
command line.
Note: It is recommended that the performance analyst, capacity planner, and
Sterling B2B Integrator administrators read all the topics.
Performance Management 3
Page 10

Performance Tuning Methodology
For effective performance tuning, you must first identify the performance issues
and determine the corrective actions. Following is a methodology that helps you
focus your efforts and reduce redundant tasks.
Use the following methodology to identify and resolve performance issues in
Sterling B2B Integrator:
1. Fill out the Requirements Planning Worksheet to determine the hardware
requirements for a given processing volume and speed.
Note: If you purchased IBM Consulting Services, you would have received a
report containing information about your hardware requirements based on
your business needs.
2. Verify that your hardware and memory specifications match the hardware and
memory recommendations provided during the performance planning phase.
3. Verify that you have installed the requisite patches on your system, which will
help you fix your performance issues from the IBM Customer Center Web site
at https://cn.sterlingcommerce.com/login.jsp.
4. Verify that you have the supported Java Virtual Machine (JVM™) on the
computer running Sterling B2B Integrator, and on the DMZ computer if you
are running perimeter servers. Both the JVM versions must match each other
and your Sterling B2B Integrator version requirements. The build date and
lower release numbers must also match.
5. Verify that you are running the supported version of your operating system.
6. Verify that you are running the supported versions of the JDBC drivers.
7. Verify that you have created your business processes using the most current
adapters and services, well-structured XPath statements, and the lowest
persistence by step and business process.
8. Tune Sterling B2B Integrator using the Performance Tuning Utility and the
information that you provided in the Requirements Planning Worksheet (refer
to the topic Performance and Tuning Worksheet). The Performance Tuning
Utility enables you to tune the cache, memory, and other system components,
but not the business processes.
For more information about this utility, refer to “Performance Tuning Utility”
on page 120.
9. Navigate to Operations > System > Performance > Statistics. In the Statistics
page, select the Enable Performance Statistics option. The Performance
Statistics reports provide information about the time taken to perform
business processes and execute activities, database connections and
persistence, and business process queue performance. You can use this
information to tune your system according to your volume and speed
requirements.
For more information about performance statistics, refer to the topic Manage
Performance Statistics.
10. Review your history of incoming and outgoing documents and enter this
information in charts, showing daily, weekly, and monthly processing trends.
Use these charts to determine your peak volume processing levels based on
your processing pattern history.
11. Conduct initial performance testing by running your business processes with
sample data that is the same size as the data that will be processed in
production. In addition, run your business processes with data that
4 Sterling B2B Integrator: Performance Management
Page 11

approximates your anticipated peak processing volume. This helps you tune
your system as close to your production environment as possible.
12. Review the Performance Statistics Report for processing speeds, volumes, and
database connections.
13. Review the other reports, such as the Database Usage Report and the Cache
Usage Report, for information about the areas that can be tuned.
14. Retune Sterling B2B Integrator using the Performance Tuning Utility, based on
the information you gathered from your initial performance testing.
Continue this process until your processing time and volume requirements are
met.
15. Create a new Performance Statistics Report called Benchmarksdd/mm/yy.
16. Conduct the same test that you conducted in step 11.
17. Review the Benchmarksdd/mm/yy Performance Statistics Report. If the statistics
in this report are not similar to your previous statistics, repeat steps 11 - 14.
18. Compare your monthly or weekly Performance Statistics Reports with this
Benchmark report to verify that your system is processing business processes
efficiently and that your resources are being used efficiently. Using this
methodology as a proactive measure may reduce downtime and processing
issues.
Performance Recommendations Checklists
Performance Recommendations Checklists provide guidelines to plan for the
required elements, and enhance the performance of Sterling B2B Integrator and
related components.
Sterling B2B Integrator: General Recommendations Checklist
The general recommendations checklist provides a list of guidelines to plan for the
required elements, and to enhance the performance of Sterling B2B Integrator.
In the following table, the Test and Production columns indicate whether the
recommendations are Recommended (R), Critical (C), or Not Applicable (NA) in
the test and production environments.
Note: It is recommended to setup a Sterling B2B Integrator test environment with
a sample set of data to verify the recommendations provided in this checklist.
Recommendation Test Production Comments
OS version and OS
kernel parameters
Network speed C C You should ensure that your
C C You should ensure that you install
Sterling B2B Integrator on certified
OS versions and levels.
Refer to the System Requirements
documentation of the corresponding
OS versions.
network cards are operating at the
highest speeds. The network
interface and the network switch can
negotiate to lower speed. When that
happens, performance degrades even
under normal processing periods.
Performance Management 5
Page 12

Recommendation Test Production Comments
AIX page space
allocation
Monitor CPU Utilization NA C You should monitor CPU utilization
Monitor Swap Usage C C If not enough space is left on the
Monitor Paging C C The JVMs and database management
C C The AIX default page space
allocation policy does not reserve
swap space when processes allocate
memory. This can lead to excessive
swap space, which forces AIX to kill
processes when it runs out of swap
space.
You should ensure that you either
have sufficient swap space, or set the
following environment policy
variables:
PSALLOC=EARLY
NODISCLAIM=TRUE
to ensure that there is no CPU
contention.
swap device (or paging file), the
operating system may prevent
another process from starting, or in
some cases, be forced to kill the
running processes.
systems rely on large memory
buffers or heaps, and are sensitive to
paging. Performance can noticeably
degrade if enough memory is not
available to keep the JVM heap in
memory.
Monitor Heap
Garbage Collection
Performance
You can monitor paging levels using
standard operating system or
third-party measurement tools, such
as:
v UNIX/Linux – SAR
v Windows – System Monitor
C C Monitoring heap GC performance is
critical for performance and
availability. For example, if the
amount of heap that is free after a
GC is continually increasing, and
approaching the maximum heap
size, the JVM can experience
OutOfMemory exceptions.
6 Sterling B2B Integrator: Performance Management
Page 13

Recommendation Test Production Comments
EDI Encoder Service
R R As of Sterling B2B Integrator 5.2, the
EDI Encoder Service and EDI
EDI Envelope Service
Envelope Service notify the user of
an incorrect value or mismatch in
the Mode parameter by writing
information on how to correct the
problem in the status report of the
business process step. This can cause
a performance degradation in some
very heavy usage scenarios by
adding additional load on the
database. It is recommended that all
business processes that use the EDI
Encoder Service and/or EDI
Envelope Service be reviewed to
make certain they are using the
correct Mode parameter, and that the
values match in the business process.
v EDI Encoder Service should be set
as Mode. For example: <assign
to="Mode">IMMEDIATE</assign>
v EDI Envelope Service should be
set as MODE. For example: <assign
to="MODE">IMMEDIATE</assign>
Planning
Server node sizing NA C You should ensure that you have
sufficient computing capacity to
process peak transaction volumes.
Refer to System Requirements
documentation to get an estimate of
the processor, memory, and other
requirements.
You can also engage IBM
Professional Services to conduct a
capacity plan study of your system.
This study involves measuring your
system, and using the measurements
to forecast resource requirements at
anticipated peak processing periods.
Database disk sizing NA C You should ensure that you have
sufficient disk space for the database
server.
The size of the database disk
subsystem may vary from a few
gigabytes to several terabytes. The
size depends on the processing
volume, its complexity, and the
length of time you want to keep the
data active in the database.
JVM
Performance Management 7
Page 14

Recommendation Test Production Comments
JVM version C C You must ensure that you install
Sterling B2B Integrator on certified
JVM versions and levels.
Run the –version command in the
command prompt to ensure that you
have installed the correct version.
Verbose GC statistics NA C You can enable verbose GC statistics
collection. Understanding the health
of GCs for each JVM is critical for
performance.
Paging C C The JVM heap must be resident in
the memory. The performance can
noticeably degrade if the operating
system has to page portions of the
heap out to disk.
OutOfMemory
Exceptions
JVM VM mode C C For HotSpot JVM, the server mode is
Heap size C C Correct heap size configuration is
C C OutOfMemory exceptions can cause
unpredictable behavior. You should
ensure that you have allocated
sufficient physical memory to
Sterling B2B Integrator based on
your processing requirements.
applicable for long-running
workloads.
critical for both performance and
availability. If the heap size is too
big, the GC pauses can be long.
Similarly, if the heap size is too
small, it can lead to OutOfMemory
exceptions. You should ensure that
heap size is not set larger than
physical memory to avoid thrashing.
Database
Monitor and regulate
indexes
8 Sterling B2B Integrator: Performance Management
Sterling B2B Integrator supports both
32-bit and 64-bit JVMs. You should
allocate more heap space when you
are running a 64-bit JVM.
C C Sterling B2B Integrator comes with a
default set of indexes. In some cases,
the indexes may not apply to your
operational environment.
You should regularly monitor the
resource cost of frequently used
queries to check if additional indexes
are required. Similarly, you can also
monitor the database to delete
indexes if they are not required.
Page 15

Recommendation Test Production Comments
Cursor sharing C C If you are using Oracle database,
cursor sharing enables dynamic SQL
to be reusable, thereby reducing the
contention on the shared pool.
You should ensure that you set
cursor_sharing=EXACT
Parameters governing
DB2 locking strategy
Parameters governing
DB2 memory
Volatile table NA C Mark tables that change significantly,
C C Set DB2_EVALUNCOMMITTED,
DB2_SKIPDELETED, and
DB2_SKIPINSERTED to reduce lock
contention.
C C Set parameters to manage various
memory structures such as
LOCKLIST, SORTHEAP, and so on,
to AUTOMATIC.
as volatile.
IBM Sterling File Gateway: Specific Recommendations Checklist
IBM Sterling File Gateway is installed on an instance of Sterling B2B Integrator,
and shares many of the resources with the latter, including:
v Communication Adapters
v Business Processes
v Security Services
v Perimeter Services
v Encryption
v Decryption
v Account Management
You should, therefore, tune your Sterling B2B Integrator installation first, and then
perform the Sterling File Gateway-specific tuning and troubleshooting tasks. Be
aware that the changes you make to Sterling File Gateway can also affect the
performance of Sterling B2B Integrator.
Note: Do not edit the properties files. Make all the changes in the
customer_overrides.properties file. For example, to change the
pgpCmdline2svcname property, enter the following line in the
customer_overrides.properties file:
filegateway.pgpCmdline2svcname=CUSTOM
In this line, replace CUSTOM with the name of your Command Line 2 adapter. For
more information about the customer_overrides.properties file, refer to the
property files documentation in the online documentation library.
The following table describes some of the key parameters that must be configured
to optimize Sterling File Gateway performance.
In the following table, the Test and Production columns indicate whether the
recommendations are Recommended (R), Critical (C), or Not Applicable (NA) in
the test and production environments.
Performance Management 9
Page 16

Recommendation Test Production Comments
Increase the value of Sterling File
Gateway.
If you are processing very large
files, increase the probe values to
avoid timeout conditions.
R R Number of Sterling File Gateway services that can
be run concurrently. The services are split into
two groups, and each group has this value as the
limit. Therefore, the total number of services that
can run concurrently is equal to the value for this
property multiplied by two. Set this to a value
that is higher than the sum of business process
threads in queues 4 and 6 (where Sterling File
Gateway services run).
Default value: 8 (Maximum: 64)
R R Timeouts and sleep intervals that control the
period for which Sterling File Gateway waits for
each of the sub-business process it invokes. The
timeouts and sleep intervals control the timeouts
when a business process is executed
synchronously during routing. The types of
business processes that run during routing are
consumer identification and PGP processing.
Setting the values for these properties also enables
one set of relatively quick probes, followed by a
second set of slower probes. The first set will be
reactive, but consumes more processor capacity.
The second set will be activated for
longer-running processes and will consume less
processor capacity.
If you have a high volume of
PGP traffic, you can improve
your performance by specifying a
group for the file gateway.
If you have very large files that
will be processed by PGP,
increase the value of the file
gateway.
First, probe 120 times, with 100 milliseconds
between each probe, for a total of 12 seconds.
Default value:
v bpCompletionProbes.1=120
v bpCompletionSleepMsec.1=100
Then, probe 600 times with 2000 milliseconds
between each probe, for a total of 1200 seconds
(20 minutes).
Default value:
v bpCompletionProbes.2=600
v bpCompletionSleepMsec.2=2000
R R The name of the Command Line 2 adapter to be
used for PGP packaging and unpackaging. You
can override this property in the
customer_overrides.properties file if a custom
Command Line 2 adapter is used for PGP
operations. You can also specify an adapter group
name to balance the outbound PGP sessions load
across multiple adapter instances.
Default value: pgpCmdline2svcname=
PGPCmdlineService
R R Timeout value, in milliseconds, for PGP package
and unpackage operations invoked by Sterling
File Gateway.
Default value: 240000 milliseconds (4 minutes)
10 Sterling B2B Integrator: Performance Management
Page 17

Recommendation Test Production Comments
R R The FTP Client Adapter instance or service group
If you have high volumes of FTP
traffic, you can improve your
performance by specifying a
group.
that the FileGatewayDeliverFTP business process
will use. You can override this property in the
customer_overrides.properties file to use a
custom FTP Client Adapter instance to contact
trading partners. You can also specify an adapter
group name to balance the outbound FTP sessions
load across multiple adapter instances.
Default value: ftpClientAdapterName=
FTPClientAdapter
Decrease the value of evaluation
frequency.
R R You can enable either
MailboxEvaluateAllAutomaticRules or
MailboxEvaluateAll
AutomaticRulesSubMin.
MailboxEvaluateAll
AutomaticRulesSubMin verifies the presence of
routable messages once every 10 seconds, and can
be edited for other intervals of less than one
minute by modifying the MailboxEvaluateAll
AutomaticRulesSubMin business process.
Suppress Duplicate Messages R R Prevents duplicate messages from using system
resources.
Increase the number of steps a
business process must complete
prior to returning to the queue.
R R Number of steps involved in the completion of a
business process before the business process
returns to the queue. Higher values will accelerate
individual business process execution, while
lower values will provide smoother multitasking
capabilities. Interactive use favors a lower number
of steps, while batch processing favors a higher
number of steps. The value of
noapp.AE_ExecuteCycle.# can be different for
each queue. .# indicates the queue number.
Increase the time period that a
business process can use a
thread, before releasing it to be
used for another business
process.
When a business process has one service to begin
a protocol session and another service to use the
protocol session, a very low AE_ExecuteCycle
may lead many business processes to be in the
queue, with only the first service running. This
may result in many protocol sessions
accumulating in an open state, and session limits
being met sooner than is necessary.
R R Maximum time period, in milliseconds, for which
a business process can use a thread before
releasing it for use by another business process.
This value will override the value set for
AE_ExecuteCycle. Tuning the value for this
property ensures that a series of unusually slow
steps will not tie up a thread completely. This
value can be different for each queue. .# indicates
the queue number. A value that is too low may
result in the accumulation of more sessions than
are recommended.
Performance Management 11
Page 18

Recommendation Test Production Comments
Increase the number of
concurrent threads.
Set storage type. R R File System is more efficient.
R R Total number of concurrent threads that Sterling
File Gateway is allowed to use. This number may
be verified against the licensed number of
threads. This value is the total number of threads
available to a workflow engine to execute
business process steps. Other, non-workflow
engine threads do not come under the purview of
this limit. For example, the threads set in
fgRouteConcurrentSessionLimit do not come
under the purview of this limit.
Default value: database
The following table shows the properties that control the above parameters:
Recommendation Property
Increase the value of Sterling File Gateway. fgRouteConcurrentSessionLimit
If you are processing very large files, increase the probe
values to avoid timeout conditions.
If you have a high volume of PGP traffic, you can
improve your performance by specifying a group for the
file gateway.
If you have very large files that will be processed by
PGP, increase the value of the file gateway.
If you have high volumes of FTP traffic, you can
improve your performance by specifying a group.
Decrease the value of evaluation frequency.
Suppress Duplicate Messages mailbox.disallowDuplicateMessages=true
Increase the number of steps a business process must
complete prior to returning to the queue.
Increase the time period that a business process can use
a thread, before releasing it to be used for another
business process.
Increase the number of concurrent threads. noapp.MaxThreads
Set storage type. N/A
v filegateway.bpCompletionProbes.2
v filegateway.bpCompletionSleepMsec.2
pgpCmdline2svcname
fgRoutePGPCmdLineSocketTimeout
filegateway.ftpClientAdapterName
v MailboxEvaluateAllAutomaticRules
or
v MailboxEvaluateAllAutomaticRulesSubMin
noapp.AE_ExecuteCycle.#
noapp.AE_ExecuteCycleTime.#
EBICS Banking Server: Specific Recommendations
The EBICS Banking Server is installed on an instance of Sterling B2B Integrator,
and shares many of the resources with the latter.
You should, therefore, tune your Sterling B2B Integrator installation first, and then
perform the EBICS Banking Server-specific tuning. Be aware that the changes you
make to the EBICS Banking Server can also affect the performance of Sterling B2B
Integrator.
12 Sterling B2B Integrator: Performance Management
Page 19

The following table describes some of the key parameters that must be configured
to optimize the EBICS Banking Server's performance:
Recommendation Comments
Allocation of
additional threads to
the HTTP Server
Adapter
Reduction of the disk
I/O amount
Storage size The database space required to store the files processed by the
Purge documents The document lifespan in an EBICS transaction is set to ten years.
You can allocate additional threads to the HTTP Server adapter
when the rate of concurrent requests to the EBICS Banking Server
is moderately high. Complete the following steps to allocate
additional threads to the HTTP Server adapter:
1. Modify the numOfmaxThread parameter in the
http.properties.in file by setting numOfmaxThread to four
times the number of processor cores on the system the HTTP
Server Adapter is running on. For more information about
calculating the settings to tune the performance of your system,
refer to the topic “View and Restore Performance Configuration
Settings” on page 121.
2. Run the setupfiles.sh (setupfiles.cmd for Windows) script to
apply the changes.
In order to reduce the amount of disk I/O on the system, change
the persistence of the following EBICS business processes to Error
Only:
v handleEBICSRequest
v EBICSOrderAuthorisationProcessing
v EBICSOrderProcessing
EBICS Banking Server is approximately 2.5 times the size of the
transacted files. For more information about managing databases in
Sterling B2B Integrator, refer to “Database management for Sterling
B2B Integrator” on page 16.
As a result, the business processes associated with the documents
remain in the live system databases, and may occupy a large
memory and slow down the performance of the system.
Database Management
For optimal performance in Sterling B2B Integrator, you must properly plan,
configure and manage your database.
Planning
This section provides information about the tasks elements that have to be
completed prior to the implementation phase. The key planning tasks include, but
are not limited to:
The Index Business Process service scans the live systems, and
flags the records that have reached their purge eligibility date and
time. To reset the document lifespan, schedule the Index Business
Process to run every ten minutes. The Index Business Process
resets the lifespan after you delete the messages from the mailbox.
For more information about implementing and configuring the
Index Business Process service and scheduled purge, refer to Index
Business Process Service and Purge Service documentation
respectively in the online documentation library.
Performance Management 13
Page 20

v Selecting a certified database management server software and version. Refer to
the Sterling B2B Integrator System Requirements for a list of supported database
configurations.
v Determining the size and configuration of the database server node
v Determining the size and configuration of the database disk subsystem
v Determining the disk technology
Monitoring Disk Space
At the operating system level, it is important to monitor disk space utilization, as
this is one of the most common causes of database freeze up. On various
UNIX/Linux-based platforms, run the df command as a line command or in a
shell script. Various third-party tools are also available.
Server Sizing
At appropriate times in the project lifecycle, you can request a Server Sizing study
from your IBM Professional Services Project Manager or a IBM Sales Executive.
This study starts with the Sterling B2B Integrator Server Sizing Questionnaire. IBM
Performance Engineering creates a sizing document that provides information
about the estimated processor, memory, and network requirements for the
standard/baseline Sterling B2B Integrator. On your part, you must consider
additional requirements such as other workloads on the same node (for example,
additional third-party software, customization, performance monitors, and so on).
Storage and File Systems
This section covers the following topics:
v Capacity Requirements
v Use of Native File Systems
v Monitoring Disk Space
Capacity Requirements
Your disk capacity requirement is a very important input to the disk configuration
planning process. This involves many considerations to ensure survivability,
manageability, scalability, and performance.
The following table provides information about the tasks that you must perform to
ensure that the required behavior is achieved.
Goal Strategy
Survivability
Manageability If you have limited-time windows to back up the database, select techniques such as
v Configure disks with the ability to survive single or multiple disk failures (for
example, RAID-1, RAID-5, or RAID-10).
v Configure the disk array with multiple I/O paths to the server to survive I/O path
failures.
v Configure disks to be accessible from multiple server nodes to tolerate single-node
failures.
array snapshots or SAN-based (storage area network) mirroring that allow logical
backups.
14 Sterling B2B Integrator: Performance Management
Page 21

Goal Strategy
Scalability and Performance
v Configure the disk array with many small disks instead of a few large disks to
increase the number of I/O paths.
v Configure the disk array with large NVRAM cache to improve read and write
performance.
v Configure the disks with stripping (for example, RAID-0 or RAID-10).
v In some circumstances, you may also want to consider using solid-state disks.
Capacity Requirements: An Example
Let us consider the following example to understand the concept of capacity
requirements better. Assume you require 900 GB of storage and you have disk
arrays or SANs that are made up of 93 GB disks. Let us further assume that the
database is implemented over ninety 10 GB data files.
The following table summarizes the choices for the common disk organizations
and the trade-offs involved.
Technology Scalability Survivability Maintainability Num Disks
JBOD Poor. Subject to throughput
of individual disks
RAID-0 Excellent. Striping n disks
provides read/write
throughput at n times a
single disk.
RAID-1 Poor. Similar performance
to that of JBOD.
RAID-5 Excellent for read (similar
to RAID-0). Potentially
poor for write performance.
RAID-6 Excellent for read (similar
to RAID-0). Potentially
poor for write performance
as parity calculations need
to happen. The
performance of RAID-6 and
RAID-5 is about the same
and dependent on the
controllers.
RAID-01 Excellent read/write
performance.
Poor. Single-disk failure
creates outage and requires
database recovery
Poor. Single-disk failure
creates outage and requires
database recovery.
Better. Can survive
multiple disk failures,
assuming that these occur
in different mirrored sets.
Better. Able to survive a
single-disk failure. Multiple
disk failures create an
outage and require
database recovery.
Better. Can survive a
double-disk failure. This
gives it an edge over
RAID-5. A failure of more
than two disks creates an
outage.
Can tolerate up to two disk
failures as long as both
failures are not in the same
mirrored set.
Poor. High disk utilization
skew.
Excellent. Expect
near-uniform disk
utilization within a logical
unit. Potential LUN
utilization skew.
Poor. High disk utilization
skew.
Excellent. Low disk
utilization skew. Possible
LUN utilization skew.
Excellent. Low disk
utilization skew. Possible
LUN utilization skew.
Excellent. Low disk
utilization skew.
Possible LUN utilization
skew.
10
10
20
11
12
20
Performance Management 15
Page 22

Technology Scalability Survivability Maintainability Num Disks
RAID-10 Excellent read/write
performance.
Can tolerate up to n disk
failures as long as two
failures do not occur in the
same mirrored set.
Excellent. Low disk
utilization skew.
Possible LUN utilization
skew.
20
Use of Native File Systems
Using file systems for storage can simplify administration tasks, although
potentially at some loss of some performance over using raw disks. It is
recommended that you consult with your storage administrator and storage
vendor.
Operating System Native File System
Windows NTFS
Linux EXT3
Solaris UFS
®
AIX
HP-UX VxFS
JFS2
Database management for Sterling B2B Integrator
Sterling B2B Integrator uses a database server as a repository for transactional,
reference, and history data that it generates and uses.
Refer to the system requirements for a list of supported database configurations.
This topic covers the following concepts:
v JDBC Connection Pool Overview
v Configuring Parameters for a Database Pool
v Schema Objects
JDBC connection pool overview
Sterling B2B Integrator uses internal connection pooling to minimize delays in the
creation of new connections to the database server. When a connection is
requested, an existing connection is used whenever possible. Internal connection
pooling improves performance by removing the need to go to the driver and
creating and delete a new connection each time one is needed.
Internal connection pooling mechanism implements a connection pool in every
JVM started for the product. In a cluster with multiple nodes, the number of
connections the database must establish is the total of all connections for all the
connection pools.
For example, if you have four JVM instances and each connection pool averages
around 30 connections, your database server must establish 120 database
connections.
16 Sterling B2B Integrator: Performance Management
Page 23

With this implementation, the database reports any idle connections to the system,
which is the expected behavior. JDBC properties can be tuned in the
jdbc.properties file to delete idle connections and minimize usage.
Note: Override the JDBC properties in the customer_overrides.properties file. Do
not modify the jdbc.properties file directly. For more information about the
jdbc.properties file, see the properties file documentation.
Implementation of connection pooling
Each database pool is created with an initial number of connections, as defined by
the initsize property in the jdbc.properties file. As more connections are
required, Sterling B2B Integrator requests additional connections up to the
maximum number defined by the maxsize property. When Sterling B2B Integrator
finishes with a connection, the connection is returned to the pool of connections for
later use.
If Sterling B2B Integrator requires connections beyond the maximum size limit for
each database pool, and every pool is in use, Sterling B2B Integrator can request
new connections up to the value defined by the buffer_size property. Connections
in this “buffer range” (that is, beyond the number of connections that are defined
by the maxsize property) are created as needed, and deleted when the calling
process is completed. To detect this condition, search for warning messages such as
connections exceeded in the noapp.log file. Performance drops if Sterling B2B
Integrator runs in this range for a long time.
The buffer_max value is a hard maximum. When the number of connections that
are defined by buffer_max (maxsize + buffersize) is reached, additional requests
for connections are denied. An error is written to the logs that indicates that the
pool is exhausted and the attempt to create a new connection failed.
Summary
Each JVM can create connections for each of the pools that are defined in the
jdbc.properties file and configured in the customer_overrides.properties file.
Each pool grabs the initial number of connections (initsize) configured.
Because a pool requires additional connections beyond the initial size, it creates
new connections up to the maxsize limit for that pool. Connections that are created
with fewer than the maxsize are returned to that pool for reuse, thus improving
performance.
If a pool is using all the connections up to the maxsize limit, it creates a new
connection as needed within the buffer size limit. Connections beyond maxsize and
below the buffersize are not reused. Each connection is created when needed, and
deleted when no longer needed by the calling process. This method is expensive
and harms performance if Sterling B2B Integrator runs for continued amounts of
time in this state.
When the number of connections (maxsize + buffersize) is reached, new requests
for connections are refused.
You can now manage JDBC pools dynamically. For more information about
dynamically managing JDBC pools, see “Dynamically Manage JDBC Pools” on
page 20.
Performance Management 17
Page 24

Configuring parameters for a database pool
The following table describes the primary parameters of a database pool and the
recommended value for each parameter:
Parameter Description and recommended value
initsize When a JVM is created and connection pool objects are instantiated
for each of the pools, a call is made to the JDBC driver for each
pool and an initial number of connections are created for each
pool. Connections that are created from the initsize are part of
the connections that exist in the pool for reuse, as needed.
Since various JVMs can load the initial number of connections, but
might not really need them, it is recommended that you do not set
the initsize to a large value.
Default value: 0 or 1
Recommended value: 1
maxsize Maximum size of the connection pool that pertains to a database
pool. After a connection is created up to this value, it is not
deleted. It remains idle until needed.
Buffersize Maximum number of connections that can be created. Connections
that are created beyond the maxsize value are created and deleted
as needed.
After all the connections are used (maxsize + buffersize), and a
new request for a connection comes in, the new request is denied,
and an error is written stating that a connection cannot be created
and that the connection pool is exhausted.
maxConn This parameter is not used in Sterling B2B Integrator.
Frequently asked questions
v Q: How many connections will I need?
A: You can start with the recommended settings provided by the tuning wizard
and then monitor the noapp.log file to ensure that you are not close to the
maximum size of the connection pool (maxsize). Monitor the usage over a
period of time and observe if the usage is increasing. If the usage limits exceed
25% of the settings that are recommended by the tuning wizard and the demand
for connections is increasing, contact the IBM Professional Services onsite
consultant or IBM Customer Support.
v Q: Why are connections shown as being idle?
A: Getting a new connection from the database is expensive. Connections are
held in a pool to be available when the system needs them, which means that
connections are often shown as being idle. This method is a performance
trade-off that enables connections to be available when needed.
v Q: Can I kill idle connections?
A: Configure the pool to keep fewer connections, and release connections after a
specified amount of time.
Schema objects
This topic covers the following concepts:
v Placement of Schema Table Objects
18 Sterling B2B Integrator: Performance Management
Page 25

v Placement of Indexes
v Sterling B2B Integrator Database Tables
Placement of Schema Table Objects
The Sterling B2B Integrator installation guide provides directions about how to
create the database, including the necessary changes to some critical parameters.
The DDL statements allow you to create a simple schema that is suitable for
general use. You need to review, and possibly modify, these statements before
production.
Placement of Indexes
The DDL statements create a minimal set of indexes for general use. You might
need to create more indexes to suit your business needs. Contact IBM Professional
Services or IBM Customer Support to create more indexes. You should also
maintain a list of the indexes added and ensure that they are present after you
upgrade Sterling B2B Integrator and monitor its usage. These indexes may or may
not be added to the Sterling B2B Integrator and is specific to your operating
environment.
You might want to create more table spaces for storing indexes in addition to those
table spaces for the base tables. Table spaces should have multiple data files for
I/O load balancing.
Important: Indexes can also be separated out into different storage areas. This
action should be done in coordination with your database administrator. However,
if you are moving tables to different storage areas, do so only in coordination with
IBM Professional Services to prevent upgrade issue in the future.
Database tables that can substantially grow
The following table lists some of the tables that are defined in Sterling B2B
Integrator experience substantial input, output, and rapid growth.
Table name Table function
DATA_TABLE These tables hold the binary payload of documents that
are used for processing within Sterling B2B Integrator.
v DOCUMENT
v CORRELATION_SET
WORKFLOW_CONTEXT Contains step status and business process flow
ARCHIVE_INFO Holds lifespan information that pertains to all business
These tables are candidates for moving to a table space or segment that is separate
from the rest of the database.
Contain document metadata that is used for searchability
and enablement of various document processing tasks.
information.
processes and document storage in the system.
Important: Move these tables only in coordination with IBM Professional services.
When patches or upgrades that need to re-create a table are installed, the
installation attempts to create them in the default table space.
Performance Management 19
Page 26

Controlling entries in the CORRELATION_SET table
You can control when correlation entries for different activities of Sterling B2B
Integrator are written to the CORRELATION_SET table. Reducing the number of
records in the CORRELATION_SET table improves the performance of Sterling B2B
Integrator.
The doc_tracking.properties file includes properties that enable or disable
correlation entries for the following activities. The properties are in parentheses.
v Mailbox (makeCorrelationForMailbox)
v FTP (makeCorrelationForFTP)
v SFTP (makeCorrelationForSFTP)
v System tracking extension (makeTrackingExtensions)
The default value for each property is true, which means that correlation entries
are written to the CORRELATION_SET table.
Attention: If makeTrackingExtensions=false, then no mailbox correlation entries
are created, even if makeCorrelationForMailbox=true.
The doc_tracking.properties file is in the install_dir\install\properties
directory.
Dynamically Manage JDBC Pools
Sterling B2B Integrator now has the ability to dynamically add, modify, remove
JDBC Pools and manage JDBC pools with effective dates for passwords.
Adding JDBC Pools:
About this task
This procedure shows how to add JDBC pools using the
customer_overides.properties file.
Procedure
1. In the customer_overrides.properties file, specify the database server name, port
number, database/catalog name, user ID, and password. To encrypt your
database password, use the encrypt_string.sh or encrypt_string.cmd utility in
the bin directory. Then place the encrypted password, prefixed by an
encryption indicator, in the customer_overrides.properties file.
2. To update Sterling B2B Integrator with this new pool information, restart the
application.
Modifying a Database Pool in jdbc.properties:
Procedure
1. In the install_dir/install/properties directory, locate the
customer_overrides.properties file.
2. Open the customer_overrides.properties file in a text editor.
3. Modify the properties you want to change in the customer pools list of
properties.
Note: You can modify any properties for user added pools. For system pools,
you cannot change the database type (for example, Oracle to MSSQL), but you
can change the database type for customer pools.
4. Save the customer_overrides.properties file.
20 Sterling B2B Integrator: Performance Management
Page 27

5. After modifying the pool properties in customer_overrides.properties, go to
JDBC monitor page and click the Refresh JDBC Pools button, or run the
REFRESHJDBC OPS command from the install root directory: ./bin/opscmd.sh
-cREFRESHJDBC -nnode1
Removing Pool from jdbc.properties:
Procedure
1. In the install_dir/install/properties directory, locate the
customer_overrides.properties file.
2. In the customer_overrides.properties file, delete the pool you want to remove.
Note: Verify that all the pool properties are removed for the pool you want to
delete, including, jdbc.properties_*_ext, jdbc_customer.properties,
customer_overrides.properties files and system_overrides.properties.
3. Save the customer_overrides.properties file.
4. After removing the pool properties in customer_overrides.properties, go to
JDBC monitor page and click the Refresh JDBC Pools button, or run the
REFRESHJDBC OPS command from the install root directory: ./bin/opscmd.sh
-cREFRESHJDBC -nnode1
Controlling User and Password Credentials with Effective Dates: You can now
change database passwords on a scheduled basis in Sterling B2B Integrator. When
you add or modify a pool, you now can control user and password credentials
with effective dates. Multiple user and password credentials are associated with a
pool. A date/time entry indicates to Sterling B2B Integrator when to start using
that credential for new connections. This applies primarily to external pools,
although Sterling B2B Integrator database pools will also work.
You can use the following variables for the date format:
v 15:00:00 3/16/09
v 3/16/09 15:00:00
v 3/16/2009 15:00:00
v Sat, 12 Aug 1995 13:30:00 GMT
v Sat, 12 Aug 1995 13:30:00 GMT+0430
Note: Other formats may be used as long as they follow the Internet Engineering
Task Force (IETF) standard date syntax. For additional information, see
http://www.ietf.org/rfc/rfc3339.txt.
Pool Property Description
newDBPool.password.1 =
<new password>
You can specify alphabets and combination of alphabets and
numbers for the password. You can use numbers for
newDBPool.password.1 or newDBPool.password.2 as well as
following examples:
v newDBPool.password.a=password_a
v newDBPool.effective.a=1/01/2005 09:35:00
v newDBPool.password.b=password_b
v newDBPool.effective.b=02/01/2009 09:35:00
v newDBPool.password.c=password_c
v newDBPool.effective.c=06/18/2009 11:07:00
Performance Management 21
Page 28

newDBPool.effective.1 =
<The date for the new
password starts to take
affect>
You can specify alphabets and combination of alphabets and
numbers for the password. You can use numbers for
newDBPool.password.1 or newDBPool.password.2 as well as
following examples:
v newDBPool.password.a=password_a
v newDBPool.effective.a=1/01/2005 09:35:00
v newDBPool.password.b=password_b
v newDBPool.effective.b=02/01/2009 09:35:00
v newDBPool.password.c=password_c
v newDBPool.effective.c=06/18/2009 11:07:00
System Logs and Error Logs: System Logs
When applicable, the following items are logged in system logs:
v Logging the switch from one credential to the next, as well as the initialization
of the pool dates and user IDs being used (not the passwords).
v Logging if the connection is expired when it returns to the pool.
v Logging if two passwords have the same effective dates. In this case, the system
randomly selects a password and log that two passwords had the same effective
dates. Additional logs on passwords and effective dates may be added.
v Logging when pool properties are changed. If you changed the pool related
property like maxSize, or lifespan the following message appears in the system
log: "for pool name ***** <PROPERTY> is changed".
Error Logs
The following list provides descriptions of the different types of errors that can be
logged:
v Failed to add the pool <pool name>
v Failed to delete the pool <pool name>
v Failed to modify the pool <pool name>
v Failed to create the connections from the pool <pool name>
Oracle Database Configuration and Monitoring
This topic provides information about configuring and monitoring Oracle database.
It also provides information about concepts such as init parameter configuration,
rolling back or undoing changes to the database, database storage, and monitoring
with Automatic Workload Repository (AWR) reports.
Oracle init parameter configuration checklist
The Oracle init parameters have mandatory and recommended settings for Sterling
B2B Integrator performance with an Oracle database.
Mandatory Oracle init parameters:
The Oracle init parameters have mandatory settings for Sterling B2B Integrator
performance with an Oracle database.
Parameter Mandatory value
cursor_sharing Exact
Character set AL32UTF8
22 Sterling B2B Integrator: Performance Management
Page 29

Recommended Oracle init parameters:
The Oracle init parameters have recommended settings for Sterling B2B Integrator
performance with an Oracle database.
Parameter Recommended value
processes Must be greater than the number of connections that are
required by Sterling B2B Integrator (sum of transactional or
local and NoTrans pools in the jdbc.properties file), and
operational management tools.
v sga_max_size
v sga_target
v pga_aggregate_target
timed_statistics True
optimizer_mode All_rows
open_cursors 2000 or higher if prepared statement caching is to be used.
1 GB to n GB, depending on the amount of physical
memory on your database server. If the server is running
only this database, up to 80% of physical memory.
To size SGA (Shared Global Area) pools automatically, see
“SGA pool sizing” on page 25.
Oracle init parameter descriptions:
The Oracle init parameters have mandatory and recommended settings for the
performance of Sterling B2B Integrator with an Oracle database.
Parameter Description
Number of processes Maximum number of processes that the Oracle server can create.
Each inbound connection from a client requires an available
process on the Oracle serverand internal processes that run in the
Oracle server itself.
This setting needs to be set high enough to accommodate the
expected peak connections from Sterling B2B Integrator as well as
additional processes for internal server processes plus the possible
usage of buffer connections from the Sterling B2B Integrator pools.
Note that the expected peak connections from Sterling B2B
Integrator are per node, and this number should be multiplied by
the number of nodes in a cluster.
Important: Exceeding the allocated processes can destabilize the
entire Oracle server and cause unpredictable issues.
Normally, the Sterling B2B Integrator logs a report if this has
occurred, by logging an “ORA-00020 maximum number of
processes exceeded” error.
Performance Management 23
Page 30

Parameter Description
open_cursors Number of cursors that the Oracle server can create. Each process
that is servicing a connection will normally spawn two or more
cursors, plus additional cursors that are needed for internal server
processes.
As with the processes, this needs to be set high enough to
accommodate the expected peak connections, multiplied by two,
plus an allocation for possible buffer connections. This should also
be multiplied by the number of nodes in the cluster.
A simple rule of thumb is to set this to four times the number of
processes, four times the number of nodes of Sterling B2B
Integrator, plus an additional 10%.
If the number of cursors is exceeded, Sterling B2B Integrator logs
“ORA-01000: maximum open cursors exceeded.”
Character Set Controls the storage of character data in the Oracle database. The
UTF8 set most closely matches the default character set for Java
and will prevent any conversion of character data.
AL32UTF8 is the preferred setting for Oracle database.
cursor_sharing Controls whether SQL sent from a client is reparsed each time, or
if the server can reuse (“share”) the complied plan.
Sterling B2B Integrator requires the setting to be “exact” for both
performance and data integrity.
sga_max_size Maximum size of the memory allocated to the System Global Area
(SGA). This controls the maximum memory that can be allocated
to the system area of the Oracle instance. The size of the SGA
should never exceed the size of the actual memory (RAM) installed
on the server.
A rule of thumb is that the SGA maximum size should be allotted
as much memory as possible, but should not exceed 80% of the
total memory of the server.
sga_max_target Target value that Oracle uses for automatic allocation of SGA pool
resources.
Recommended setting is equal to the sga_max_size. The exception
is for extremely large databases, where this may need to be
adjusted manually.
pga_aggregate_target Specifies the target aggregate Program Global Area memory
available to all server processes attached to the Oracle instance.
These are normally internal Oracle processes, and are not used by
clients connecting to the instance.
Recommended setting is a non-zero value. This allows the Oracle
instance to size the SQL working areas automatically as needed.
timed_statistics Controls whether database statistics for particular times are logged
by Oracle. This information may be useful to monitor system or
application performance.
Setting timed_statistics to TRUE may incur a slight overall load
increase on the Oracle instance. However, the information it creates
is valuable for diagnosing issues with performance of the instance.
24 Sterling B2B Integrator: Performance Management
Page 31

Parameter Description
optimizer_mode Controls the mode that the optimizer uses to select the proper
execution path for fulfilling query results, among other functions.
Setting this to an incorrect mode can dramatically affect the overall
performance of the server.
Recommended setting for Sterling B2B Integrator: all_rows
SGA pool sizing:
As an alternative to manually sizing the main SGA pools in an Oracle database,
IBM recommends that you use Automatic Shared Memory Management (ASMM).
This feature controls pool size dynamically at run time, readjusting the sizes of the
main pools (db_cache_size, shared_pool_size, large_pool_size, java_pool_size)
based on existing workloads.
Set the following values to enable Oracle ASMM:
v Use an spfile for the init.ora values
v Set sga_target to a non-zero value
v Set statistics_level to TYPICAL (the default) or ALL
v Set shared_pool_size to a non-zero value
Rolling Back or Undoing Changes in Oracle Database
Oracle database supports AUTO UNDO management. Its use is recommended to
avoid manual monitoring of UNDO segments. Set the
UNDO_MANAGEMENT=AUTO parameter in init<SID>.ora. Your database
administrator needs to determine the UNDO_RETENTION setting.
Ensure that the file system where UNDOTBS1 tablespace is located has enough
space to use the AUTOGROW setting. As a starting point, size the undo tablespace
at 20% of the total database size.
Redo Logs
Redo logs are critical for database and instance recovery. Correct redo log
configuration is also critical for performance. We have seen best performance while
implementing redo logs on ASM. The following is recommended:
v Consider implementing redo logs on dedicated disk devices, preferably RAID 10.
v Consider implementing redo log group log files on alternating disks.
Redo File Size
Your choice of redo file size depends on your trade-off between performance and
availability, specifically the time required to recover the Oracle instance in the
event of a failure. For performance, some installations opt to create large redo logs
in order to reduce the frequency of log switches. However, this means potentially
more transactions in the redo logs that must be replayed during recovery.
The general rule for sizing redo log files is to consider the time it takes to switch
log files. Generally, do not switch logs more than once every 20 to 30 minutes.
Issue the following query to see how often the redo log files are changing:
Performance Management 25
Page 32

select * from v$loghist order by first_time desc
Following is an example of the output:
THREAD# SEQUENCE# FIRST_CHANGE# FIRST_TIME SWITCH_CHANGE#
1 97 7132082 10/20/2008 11:47:53 PM 7155874
1 96 7086715 10/20/2008 11:32:04 PM 7132082
1 95 7043684 10/20/2008 11:15:07 PM 7086715
1 94 6998984 10/20/2008 11:00:57 PM 7043684
1 93 6950799 10/20/2008 10:48:03 PM 6998984
In this example, the logs are switched every 15 minutes.
Rollback Transaction Errors
If Sterling B2B Integrator is running with Oracle and is under load, the snap shot
too old SQL error may be found in the wf.log file. The SQL error can be resolved
with the following:
v Tune the Oracle database by increasing undo_retention and redo table space.
v If the SQL error is from WFReportService (from the stack trace in wf.log),
change the useNewStateAndStatusLogic property in jdbc.properties and
jdbc.properties.in to false. This will prevent the snap shot too old SQL error, but
it might cause the Recover process to run longer.
Database Storage
This topic provides information about database storage.
ASM
It is recommended that you use Oracle Automatic Storage Management (ASM) to
manage database storage. The benefits of using ASM include:
v Improved I/O performance and scalability
v Simplified database administration
v Automatic I/O tuning
v Reduction in number of objects to manage
For more information, consult these sources:
v ASM documents available on the Oracle Web site.
v Storage vendor best practice papers about how to configure ASM for their
storage products.
Raw Disks
For performance-critical systems, importing only raw devices into ASM is
recommended. For high-volume processing environments, ensure that ASM is
configured with disk devices from high-performance disk storage arrays. Some
characteristics that you should look for include large NVRAM caches in order to
buffer the disk reads and writes, and for efficient RAID implementation.
26 Sterling B2B Integrator: Performance Management
Page 33

Configure ASM with External Redundancy to ensure that redundancy is provided
by your storage array.
Raw devices (raw partitions or raw volumes) can be used directly under Oracle on
UNIX-based or Linux-based systems and can help performance. However, raw
disks have the following potential disadvantages:
v Raw devices may not solve problems with file size writing limits.
To display current UNIX file size limits, run the following command:
ulimit -a
v It may not be possible to move files to other disk drives if you are using raw
devices. If a particular disk drive has intense I/O activity, and performance will
benefit from the movement of an Oracle data file to another drive, it is likely
that no acceptably-sized partition or volume exists on a drive with less I/O
activity.
v Raw devices are more difficult to administer than data files stored on a file
system or in an Automatic Storage Management disk group.
When deciding whether to use raw devices, consider the following issues:
v Raw disk partition availability
Use raw partitions for Oracle files only if you have at least as many raw disk
partitions as Oracle data files. If disk space is a consideration, and the raw disk
partitions are already created, match the data file size to the partition size as
closely as possible to avoid wasting space.
You must also consider the performance implications of using all the disk space
on a few disks as opposed to using less space on more disks.
v Logical volume manager
Logical volume managers manage disk space at a logical level and hide some of
the complexity of raw devices. With logical volumes, you can create logical disks
based on raw partition availability.
The logical volume manager controls fixed-disk resources by:
– Mapping data between logical and physical storage
– Enabling data to span multiple disks and to be discontiguous, replicated, and
dynamically expanded
For RAC, you can use logical volumes for drives associated with a single
system, as well as those that can be shared with more than one system of a
cluster. Shared drives enables all the files associated with a RAC database to be
placed on these shared logical volumes.
v Dynamic performance tuning
To optimize disk performance, you can move files from disk drives with high
activity to disk drives with low activity. Most hardware vendors who provide
the logical disk facility also provide a graphical user interface (GUI) that you can
use for tuning.
Refer to your operating system documentation on how to use raw devices with
your OS.
Tablespaces (Single or Multiple)
Prior to production, you should plan the overall storage strategy. The DDLs to
create temporary tablespaces and data tablespaces are left to the discretion of the
customer. General recommendations include:
Performance Management 27
Page 34

v Implement these tablespaces as locally managed tablespaces (LMTs) by
specifying extent management as local when creating the tablespace.
v Implement tablespaces with Automatic Space Management by specifying
segment space management as auto.
v With LMTs, you may want to consider creating tablespaces that store small
reference tables with the autoallocate extent allocation model.
v Consider putting large tables into their own tablespace and using the uniform
extent allocation model. Use the default extent size 1 MB.
v Create your temporary tablespace as a temporary data file (temp files). Temp
files are used to store intermediate results, such as from large sort operation.
Changes to temp files are not recorded in the redo logs.
I/O Sub-System Response Time
Sterling B2B Integrator is an On-Line Transaction Processing (OLTP) application.
As an OLTP application, database response time to the I/O sub-system needs to be
in the single digit range even during the peak periods. The database response time
to the I/O sub-system should be less than:
v 5 ms for logs. 1ms or better is recommended.
v 10 ms or better for data. 5ms is recommended.
Monitoring with the AWR Report
Important: The information in an Automatic Workload Repository (AWR) report
needs to be considered in relation to Sterling B2B Integrator performance. This
information is not meaningful in isolation. You should monitor AWR over a period
of time to establish your steady state performance baseline. You should monitor
AWR even if Sterling B2B Integrator is performing to your satisfaction; doing so
could uncover issues before they become noticeable.
The AWR is used to collect performance statistics, including:
v Wait events used to identify performance problems
v Time model statistics indicating the amount of DB time associated with a process
from the V$SESS_TIME_MODEL and V$SYS_TIME_MODEL views
v Active Session History (ASH) statistics from the V$ACTIVE_SESSION_HISTORY
view
v Selected system and session statistics from the V$SYSSTAT and V$SESSTAT
views
v Object usage statistics
v Resource-intensive SQL statements
The repository is a source of information for several other Oracle database features,
including:
v Automatic Database Diagnostic Monitor
v SQL Tuning Advisor
v Undo Advisor
v Segment Advisor
By default, AWR snapshots of the relevant data are taken every hour and retained
for seven days. It is recommended to set shorter intervals, for example, 30 minutes,
because at longer intervals, the issues are less noticeable. Default values for these
settings can be altered with statements such as:
28 Sterling B2B Integrator: Performance Management
Page 35

BEGIN
DBMS_WORKLOAD_REPOSITORY.modify_snapshot_settings(
retention => 43200, -- Minutes (= 30 Days).
Current value retained if NULL.
interval => 30); -- Minutes. Current value retained if NULL.
END;
/
A typical Sterling B2B Integrator deployment contains characteristics of both
interactive and batch data processing systems, including a high volume of small
transactions that rapidly update the database and periodic long-running
transactions that touch many records.
The key areas to inspect in an AWR report are:
v Top SQL (by CPU or I/O)
v Top wait events
v Buffer cache hit ratio (refer to the topic "Instance Efficiency Percentages")
v I/O contention (hot spots) on disks (refer to the topic " Tablespace IO Stats and
File IO Stats")
Instance Efficiency Percentages
When viewing the Instance Efficiency Percentages area, focus on Buffer Hit % and
Buffer Nowait % as shown in the following figure. These are the key performance
indicators on the Oracle database server. The goal is to keep these values at 95% or
greater, which can typically increase efficiency by increasing buffer cache available
to the DB server.
Note: When Sterling B2B Integrator performs internal maintenance, these values
may be affected.
The following figure shows the buffer pool statistics.
Performance Management 29
Page 36
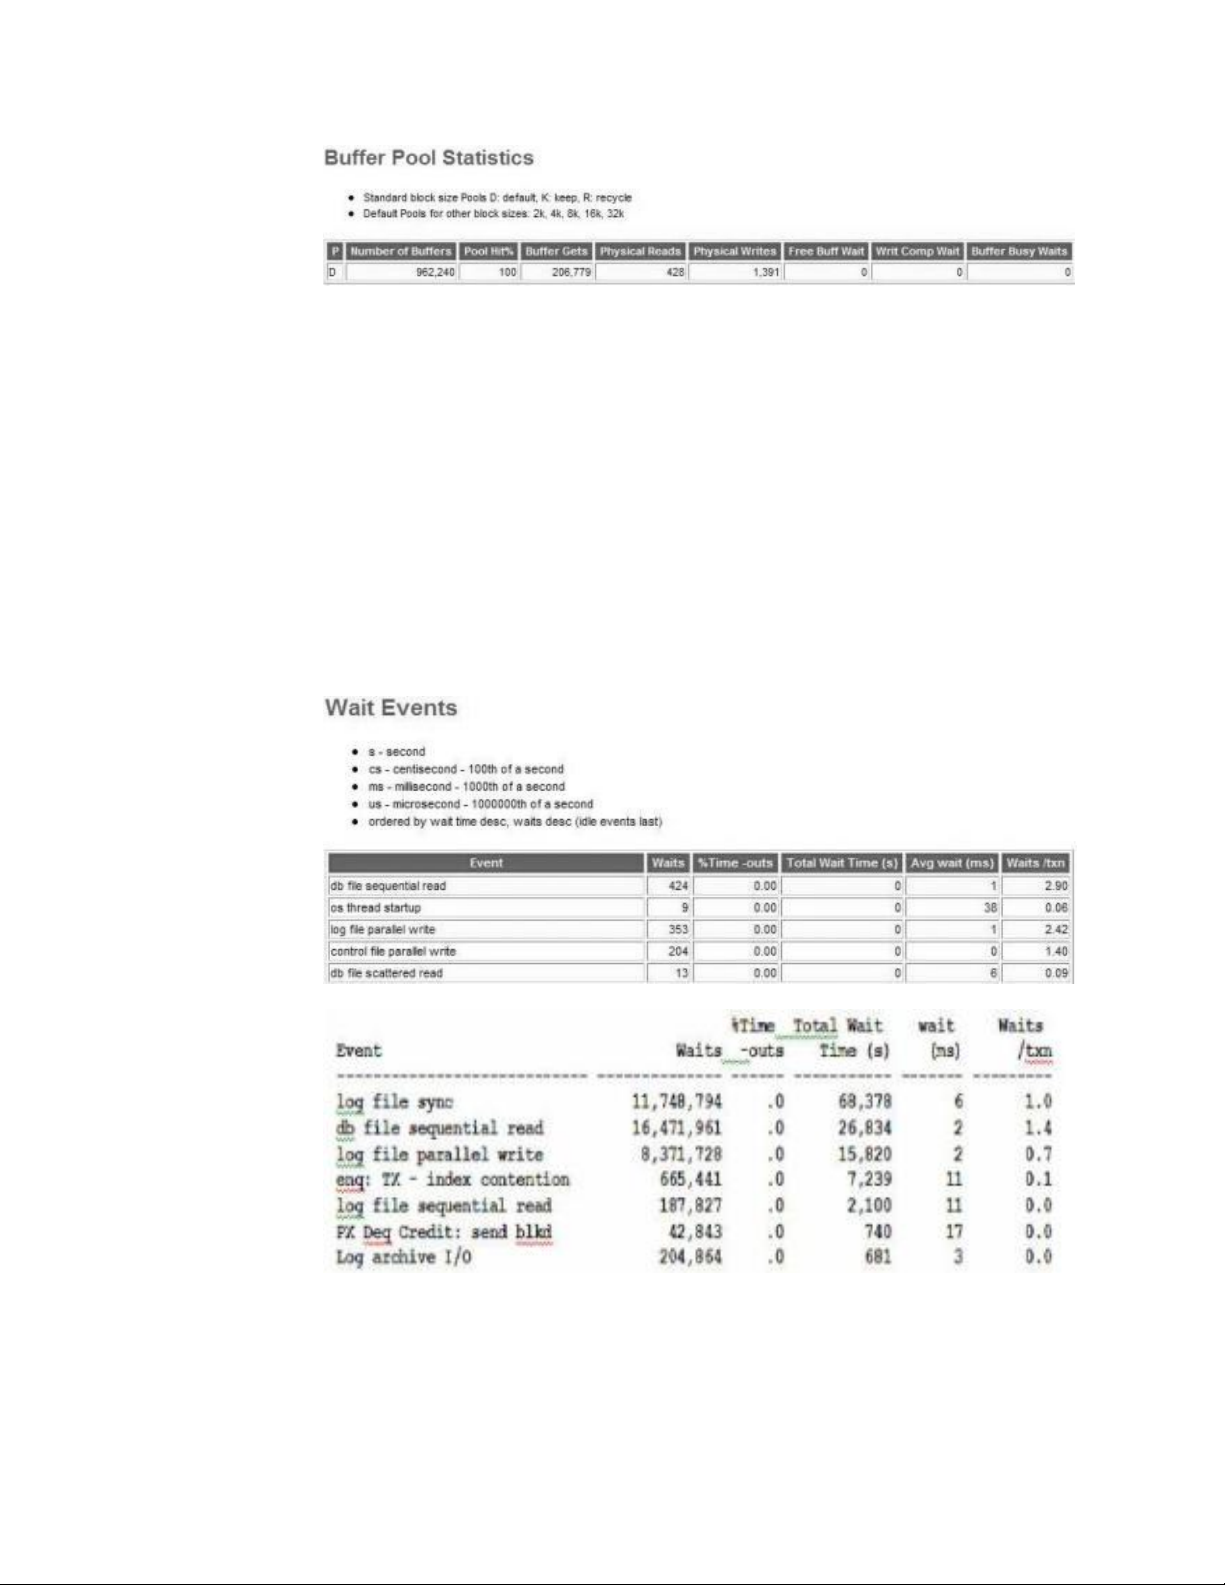
Tablespace IO Stats and File IO Stats
Review the IO Stats area to obtain information about hotspots or drive contention.
Analysis of information such as Buffer Wait and Average Buffer Waits can help you
determine whether you are getting the best performance from your drives, and
identify potential bottlenecks. Separation of objects into their own unique
tablespaces can contribute to performance tuning of specific areas.
Wait Events
The AWR report for Sterling B2B Integrator shows typical wait events as displayed
in the following figure. To see if the wait events are problematic, compare it to a
baseline in your environment. The following figures are an example of what you
can see normally for Sterling B2B Integrator.
The SQL statements that should be inspected are SQL ordered by Gets and SQL
ordered by Reads as shown in the following figure. Again, compare these with the
baseline of the system to determine if any SQL statement is behaving oddly. If yes,
refer to the query plans to determine if the query plan is appropriate.
30 Sterling B2B Integrator: Performance Management
Page 37
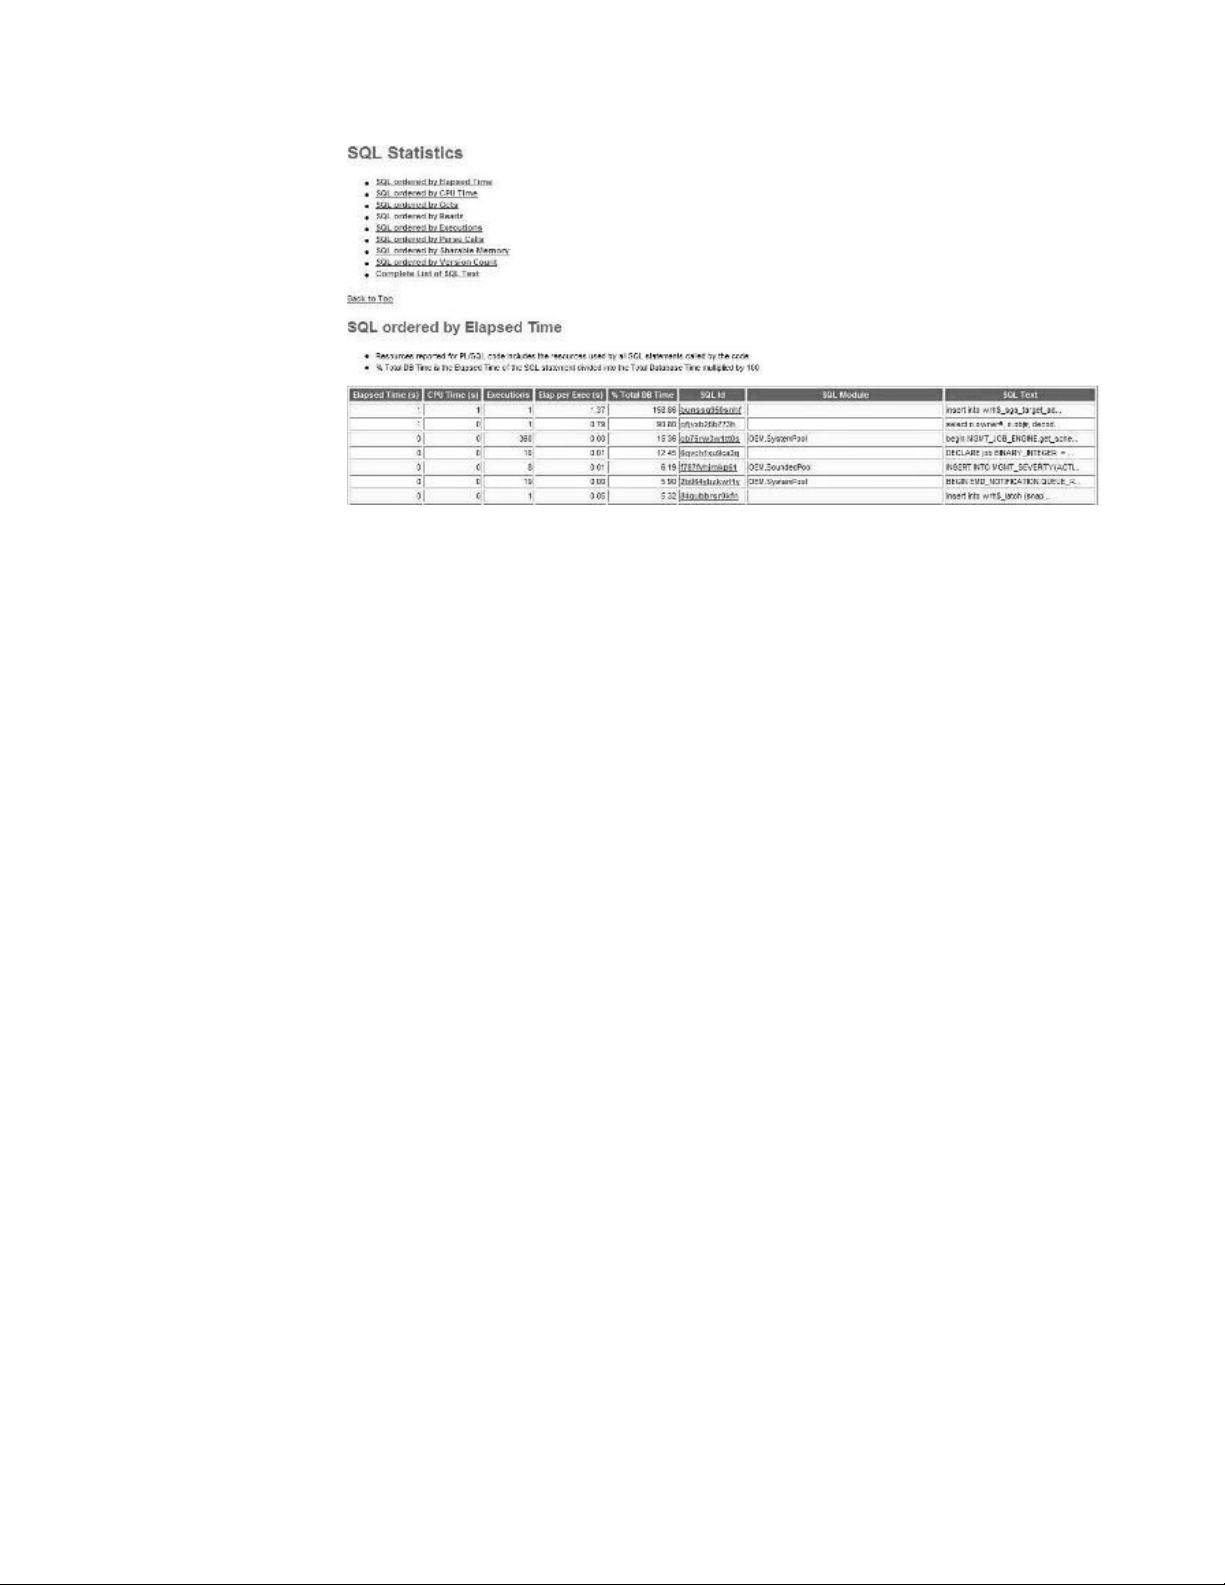
Occasionally, you may observe full table scans on some tables. It is not a cause for
concern unless the overall system performance is slow or business level SLAs are
not met.
Index and Table Statistics
Database optimizers rely on relatively up-to-date table and index statistics to
generate optimal access plans.
Oracle does not require statistics to be absolutely correct or current, just relatively
correct and representative. You should refresh statistics periodically (several times
in a day or at least one time every day). You can refresh statistics by using the
default job that is provided in Oracle or by creating the custom jobs. Ensure that
you update statistics when there is a significant change in data (20% or more).
Oracle database gathers statistics automatically during its maintenance window (10
p.m. to 2 a.m. on week nights and all day on weekends) for tables with sufficient
changes. Oracle bypasses statistics generation for tables that did not change
significantly.
To manually refresh statistics, use the DBMS_STATS package. This sample
invocation refreshes the statistics for the entire database:
EXECUTE DBMS_STATS.GATHER_SCHEMA_STATS(<schema owner>,CASCADE => TRUE, OPTIONS =>’GATHER AUTO’)
where <schema owner> = Sterling B2B Integrator schema owner.
One way to determine the update frequency for statistics is when the data for one
customer changes by approximately 20%. The update frequency is governed by the
document's lifespan.
Speak with the Sterling B2B Integrator Administrator to find out more about
document lifespans. Generally, updating statistics one time every 24 hours is
sufficient.
Index Rebuilds
Index rebuilds are also recommended for the Sterling B2B Integrator schema when
the data in the tables changes by approximately 20%. However, the rebuild must
be validated by looking at the system performance as a whole. Online index
rebuilds, which cause minimal impact to the system, is possible.
Performance Management 31
Page 38

The Sterling B2B Integrator system administrator must work with the DBA to
identify the indexes that must be rebuilt. You must always rebuild indexes at
schema level.
Sterling B2B Integrator is a high-volume OLTP application, and rarely, there might
be times when you might need to shrink the tables or rebuild indexes. Oracle
documentation provides details about the following tasks:
v Shrinking database segments online
– http://docs.oracle.com/cd/B28359_01/server.111/b28310/
schema003.htm#ADMIN10161 (Oracle Database 11g Release 1)
– http://docs.oracle.com/cd/E18283_01/server.112/e17120/
schema003.htm#ADMIN10161 (Oracle Database 11g Release 2)
– http://docs.oracle.com/database/121/ADMIN/schema.htm#CBBBIADA
(Oracle Database 12c Release 1)
v Rebuilding an existing index
– http://docs.oracle.com/cd/B28359_01/server.111/b28310/
indexes004.htm#ADMIN11734 (Oracle Database 11g Release 1)
– http://docs.oracle.com/cd/E18283_01/server.112/e17120/
indexes004.htm#insertedID2 (Oracle Database 11g Release 2)
– http://docs.oracle.com/database/121/ADMIN/indexes.htm#i1006864 (Oracle
Database 12c Release 1)
Enable BLOB Caching
By default, Oracle database configures itself with the BLOB caching disabled when
you choose Oracle as your database during Sterling B2B Integrator installation.
You can significantly improve performance by enabling the cache on the BLOB
data object,. Run the following commands while connected to the database:
ALTER TABLE DATA_TABLE MODIFY LOB (DATA_OBJECT) (CACHE)
ALTER TABLE TRANS_DATA MODIFY LOB (DATA_OBJECT) (CACHE)
For regular tuning and best practices pertaining to Oracle, refer to the
corresponding Oracle documentation.
Using Oracle Real Application Clusters (RAC) for High Availability
Oracle Real Application Clusters (RAC) ensures high availability by supporting the
deployment of a database across multiple machines, thereby reducing the
downtime due to hardware failures or outages, planned or unexpected.
The following diagram shows how all transactions should be sent to one Oracle
RAC node at a time. If that database node goes down, all Sterling B2B Integrator
nodes reconnect to the second available database node. This scenario requires that
load balancing is turned off, and provides better overall system performance.
32 Sterling B2B Integrator: Performance Management
Page 39
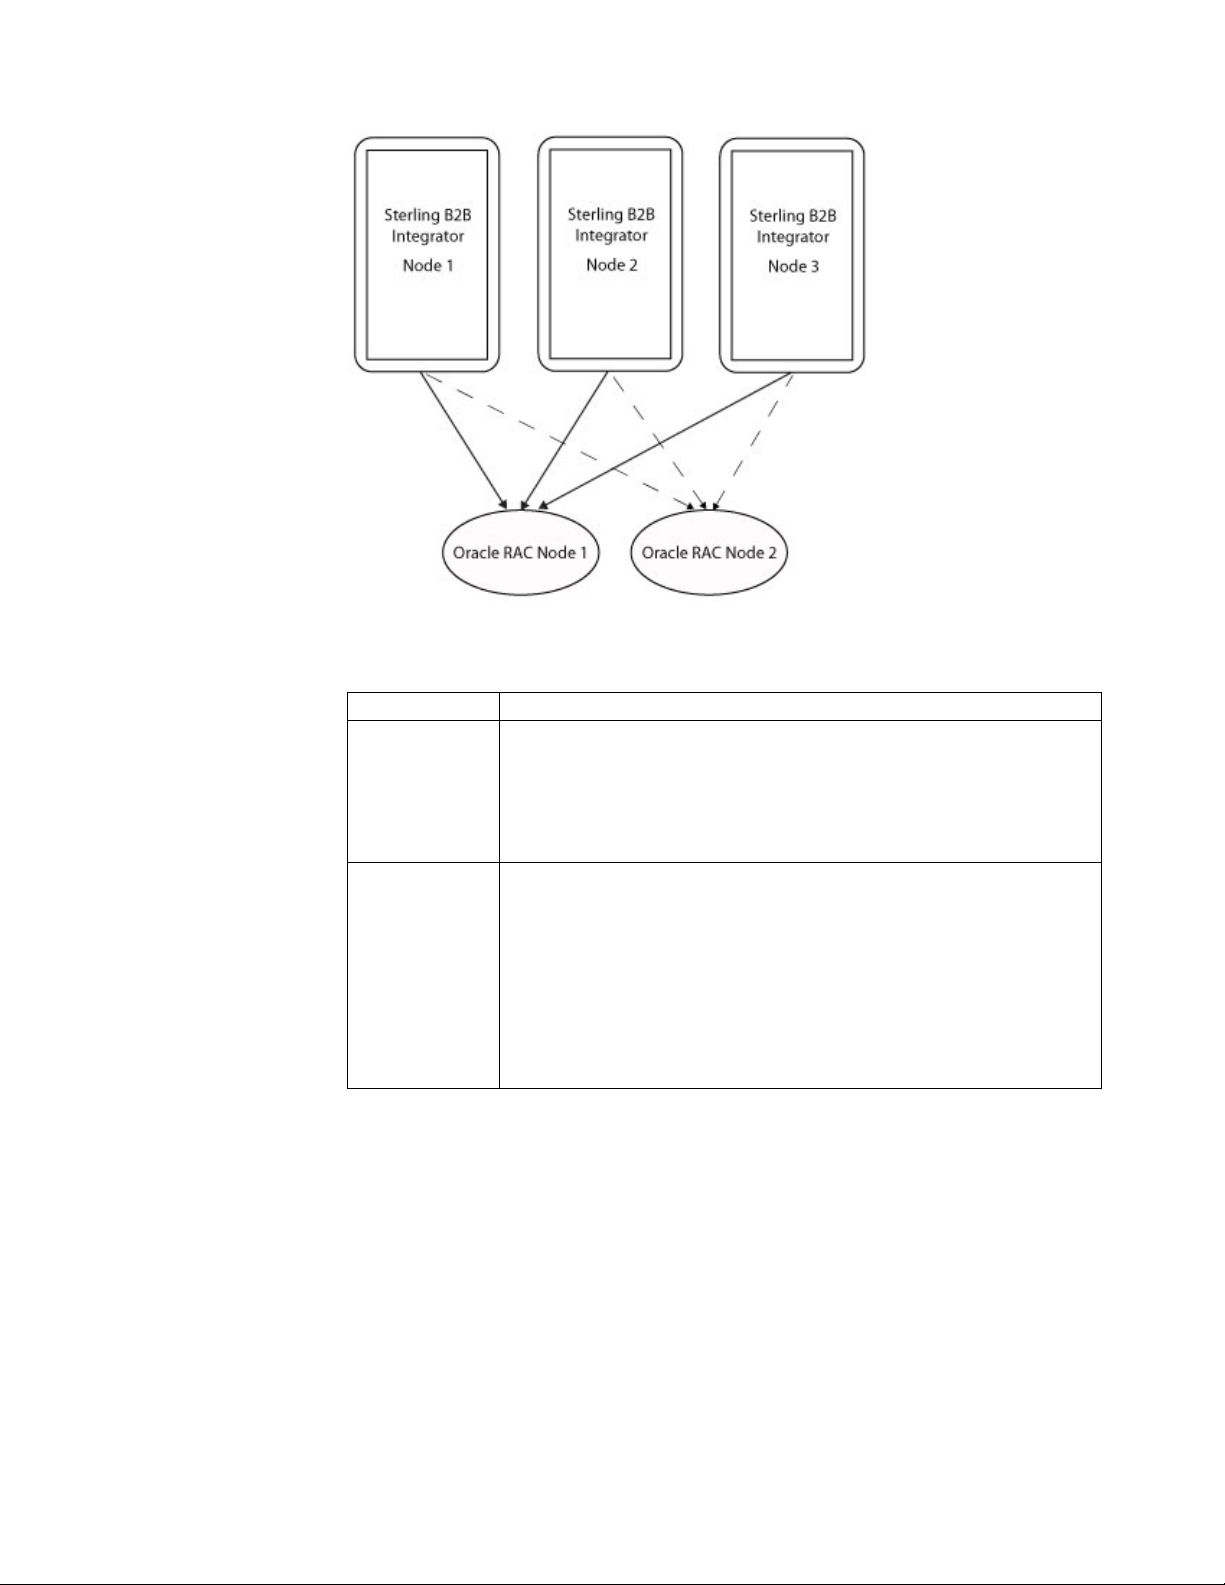
The following table lists the features and benefits of Oracle RAC when used with
Sterling B2B Integrator:
Features Benefits
Load balancing Oracle RAC supports initial connection time load balancing and runtime
connection load balancing. However, running Sterling B2B Integrator
with load balancing turned on is likely to result in performance issues.
On the client side (jdbc url), you should set the parameter LOAD_BALANCE
to OFF. On the server side, turn off load balancing on the database
service.
SCAN (Single
Client Access
Name)
Available in Oracle RAC 11g R2, SCAN allows you to set up RAC
failover without specifying nodes. Using traditional RAC in Sterling B2B
Integrator, you configure the JDBC URL to name an initial node and a
failover node. With SCAN, you configure the JDBC URL so that SCAN
selects the initial node and fails over to the other available node.
A benefit to using SCAN over traditional RAC is that you do not need
to update the URL when a node name changes. There is, however, a
potential performance degradation as SCAN searches for an available
node.
Performance Management 33
Page 40

Features Benefits
High availability
(Failover)
Oracle RAC supports high availability by eliminating the dependence
on a single server, where the chances of database downtime are more
due to hardware failure.
v Initial connection time failover
In initial connection time failover, the database node availability is
determined while establishing the connection. The connection is
established with the available database node. However, if a database
node goes down while a transaction is in progress, the transaction
will fail and throw a SQLException error, and a new connection will
be established with the available node.
Initial connection time failover can be configured on the JDBC
multi-instance URL on the client side by setting this parameter:
FAILOVER=ON
Sterling B2B Integrator supports two-node Oracle RAC setup.
To establish initial time connection failover in Sterling B2B Integrator,
perform the following tasks:
1. Configure the following properties in ASI node and in
customer_overrides.properties.in file in containers. You can set
values for these properties (in milliseconds) that are suitable for
your operating environment.
Setting a value too low would result in genuine SQL queries
getting terminated before they have a chance to be processed and
return the dataset. A value too high means that the application
threads are holding connections which are waiting on a query
timeout for that duration and are not available for other tasks.
This could result in lower throughput. An optimum setting
depends on the customer's environment.
jdbcService.oraclePool.prop_oracle.jdbc.
ReadTimeout=<milliseconds>
jdbcService.oraclePool_local.prop_oracle.jdbc.
ReadTimeout=<milliseconds>
jdbcService.oraclePool_NoTrans.prop_oracle.jdbc.
ReadTimeout=<milliseconds>
jdbcService.oracleUIPool.prop_oracle.jdbc.
ReadTimeout=<milliseconds>
jdbcService.oracleArchivePool.prop_oracle.jdbc.
ReadTimeout=<milliseconds>
2. From the install_dir/install/bin (install_dir\install\bin for
Windows) directory, run (UNIX or Linux) setupfiles.sh or
(Windows) setupfiles.cmd.
3. Restart the ASI and container JVMs to apply the changes.
34 Sterling B2B Integrator: Performance Management
Page 41

Features Benefits
High availability
(Failover),
continued
v Runtime connection failover
When one Oracle RAC node goes down, the active connections from
the node that went down will failover to the active node. When the
node that went down is up and running again, the connections are
not redistributed. You can redistribute the connection pools by setting
lifespan parameter to a value greater than 0, which ensures that
connection pools are terminated after the lifespan value is met and
load balancing occurs when new connections are established.
However, configuring a low value lifespan may lead to connections
being terminated quickly thereby losing the benefit of connection
pool.
To override all the Oracle pools lifespan to a value greater than 0, set
the following value in the customer_overrides.properties file:
jdbcService.<oraclepool>.
lifespan=180000
Visibility Event
Queues
Fast Connection
Failover (FCF)
Transparent
Application
Failover (TAF)
You can increase the number of visibility queues and event input queue
capacity in customer_overrides.properties to ensure that adapters are
responsive.
To increase the default queue size and the thread counts, perform the
following tasks:
1. Set the following values in the ASI node and in
customer_overrides.properties.in file in containers:
dmivisibility.number_visibility_threads=6
dmivisibility.event_input_queue_capacity=3072
2. From the install_dir/install/bin (install_dir\install\bin for Windows)
directory, run (UNIX or Linux) setupfiles.sh or (Windows)
setupfiles.cmd.
3. Restart the ASI and container JVMs to apply the changes.
Sterling B2B Integratordoes not support Fast Connection Failover (FCF).
Sterling B2B Integratordoes not support Transparent Application
Failover (TAF).
IBM DB2 for LUW Configuration and Monitoring
This topic provides information about configuring and monitoring IBM DB2®for
LUW (Linux, UNIX, and Windows). It describes the recommended registry
variables and DBM CFG parameters. It also provides details about the storage
subsystem, log configuration, database monitoring, and index and table statistics.
Mandatory settings for IBM DB2 registry variables
Mandatory IBM DB2 registry values are critical for IBM DB2 performance with
Sterling B2B Integrator.
Performance Management 35
Page 42

Variable Mandatory value
DB2_SKIPDELETED ON
Allows index-range queries or table-scan queries to skip
records that are in an uncommitted delete state. This
reduces the amount of lock contention from Read Share
and Next Key Share locks from range queries in tables
with a high frequency of deletes.
When enabled, DB2_SKIPDELETED allows, where
possible, table or index access scans to defer or avoid
row locking until a data record is known to satisfy
predicate evaluation. This allows predicate evaluation
to occur on uncommitted data.
This variable is applicable only to statements using
either Cursor Stability or Read Stability isolation levels.
For index scans, the index must be a type-2 index.
Deleted rows are skipped unconditionally on table scan
access while deleted keys are not skipped for type-2
index scans unless DB2_SKIPDELETED is also set.
Recommended value: ON
DB2_SKIPINSERTED ON
Allows SELECTs with Cursor Stability or Read Stability
isolation levels to skip uncommitted inserted rows. This
reduces record lock contention on tables with heavy
insert rates.
Recommended settings for IBM DB2 registry variables
IBM DB2 registry values include recommended settings for IBM DB2 performance
with Sterling B2B Integrator.
Variable Recommended value
DB2_USE_ALTERNATE_
PAGE_CLEANING
DB2_
EVALUNCOMMITTED
ON
ON
Enabling this variable can reduce the amount of
unnecessary lock contention from Read Share and Next
Key Share. By default, DB2 requests share locks on the
index or record before verifying if the record satisfies
the query predicate. Queries that scan a set of records
in tables with high frequency of inserts or updates can
unnecessarily block records that do not belong to its
result set.
When you set DB2_EVALUNCOMMITTED to ON, DB2
performs an uncommitted read on the record to
perform the predicate verification. If the record satisfies
the predicate, DB2 requests a share lock on that record.
36 Sterling B2B Integrator: Performance Management
Page 43

Variable Recommended value
DB2_PARALLEL_IO Changes the way in which DB2 calculates I/O
parallelism to the tablespace. By default, DB2 sets I/O
parallelism to a tablespace equal to the number of
containers in that tablespace. For example, if the
tablespace has four containers, prefetches to that
tablespace are performed as four extent-sized prefetch
requests.
Set the DB2_PARALLEL_IO variable if you have
implemented containers on stripped devices (for
example, RAID-5, RAID-10, or RAID-01). If you set
DB2_PARALLEL_IO=ON or DB2_PARALLEL_IO=*,
DB2 assumes that containers are implemented on a
RAID 5 (6+1) configuration: six data disks plus one
parity disk.
In this example, prefetches to the four-container
tablespace mentioned above are performed in 24
extent-sized prefetch requests.
To assess the effectiveness of your prefetch parallel I/O
settings, monitor the unread_prefetch_pages and
prefetch_wait_time monitor element with the
snapshot_database monitor. The unread_prefetch_pages
monitor element tracks the number of prefetch pages
that were evicted from the buffer pool before it was
used. A continually growing number indicates that the
prefetch requests are too large, either because the
prefetch size is larger than the pages needed or the
prefetch activities are bringing in too many pages for
the capacity of the buffer pool. In either case, you may
want to consider reducing the prefetch size.
If you have high prefetch_wait_time values, the
application might be waiting for pages.
DB2_NUM_
0
CKPW_DAEMONS
Set this on IBM AIX 5.3 only if you observe a memory
leak during connect authentication within DB2's
authentication daemons (db2ckpwd processes) as a
result of calling the AIX loginsuccess() API.
Symptoms may include excessive memory usage, an
instance crash due to a trap in the db2ckpwd process,
or general authentication failures. Verify by monitoring
the SZ and RSS values for db2ckpwd processes. Use the
ps aux | grep db2ckpwd command and look at the fifth
and sixth columns of output.
DB2 workaround exists for this problem. Set the
following registry variable, and recycle this instance:
db2set DB2_NUM_CKPW_DAEMONS=0
Also see IBM APAR IY78341.
DB2LOCK_TO_RB STATEMENT
Performance Management 37
Page 44

Recommended Settings for DBM CFG Parameters
Let DB2 automatically manage the following parameters for DB2 9.x by accepting
the default values:
v INSTANCE_MEMORY
v FCM_NUM_BUFFERS
v FCM_NUM_CHANNELS
Enabling the following monitor switches is recommended in production:
Mandatory or
Parameter
DFT_MON_BUFPOOL Recommended ON
DFT_MON_LOCK Recommended ON
DFT_MON_SORT Recommended ON
DFT_MON_STMT Recommended ON
DFT_MON_TABLE Recommended ON
DFT_MON_TIMESTAMP Recommended ON
DFT_MON_UOW Recommended ON
MON_HEAP_SZ Recommended AUTOMATIC
Recommended Recommended Value
38 Sterling B2B Integrator: Performance Management
Page 45

Mandatory or
Parameter
MAXAGENTS Recommended Limits the number of database
Recommended Recommended Value
manager agents (both coordinator
or subagents) that can run
concurrently. Pick a high enough
number so that the combined
connection requirements from the
application servers, agents,
monitoring tools, and so on do not
exceed the MAXAGENTS limit
during peak processing periods. If
you do, you must restart the DB2
instance to increase this limit.
Recommend value: Must be greater
than the number of connections
needed by Sterling B2B Integrator
(that is, the sum of transactional
(local) plus NoTrans pools in
jdbc.properties file) plus the
connections needed by operational
management tools.
With the use of connection pooling
in the NoApp Server, the number
of database connections is less than
the number of users who are
logged in. Depending on your
anticipated peak workload traffic,
this parameter may range from a
small number such as 25 to a large
number in the thousands.
Monitor the number of concurrent
connections in production
(especially during peak periods) to
ensure that it does not reach the
maximum. When the
MAXAGENTS limit is reached,
DB2 refuses to establish new
connection requests.
Estimation Guidelines for Number of Connections
You can roughly estimate the number of concurrent user connections required for
Sterling B2B Integrator with this formula:
Concurrent (DB2) connections = A + B + C + D
Variable Description
A Maximum number of UI-based connections
B Maximum NoApp Server connection pool max size times the
number of NoApp Server instances (as in a cluster)
Performance Management 39
Page 46

Variable Description
C Any additional connections that are opened by customized code or
user exits that do not go through the NoApp Server connection
pools. This connection requirement is specific to your
implementation.
D Number of connections required by the containers.
Benchmarking
Benchmarking your system to validate assumptions and estimates prior to a
production implementation is strongly recommended. During the test, monitor the
connection pool usage levels in each of the application server instances, the
number of agents to run to meet your processing and service levels, and the actual
DB2 database connections established.
Mandatory settings for DB CFG parameters
For optimal performance, certain parameters and values are mandatory for DB2
9.x.
Parameter Mandatory value
Database Code Set UTF-8
Recommended settings for DB CFG parameters
For optimal performance, follow the recommended settings for DB2 9.x.
The parameters and values described in the following table are recommended:
Parameter Recommended value
SELF_TUNING_MEM Enables the DB2 self-tuning memory manager (STMM) to automatically and
dynamically set memory allocations to memory consumers such as buffer
pools, lock lists, package cache, and sort heap.
Recommended value: ON
DATABASE_MEMORY Allows DB2 to adjust the amount of database memory depending on load,
memory pressures, and other factors.
Recommended values:
AUTOMATIC (for Windows and AIX)
COMPUTED (for Linux, HP-UX, and Solaris)
LOCKLIST Allows STMM to dynamically manage memory allocations.
Recommended value: AUTOMATIC
MAXLOCKS Allows STMM to dynamically manage memory allocations.
Recommended values:
AUTOMATIC
If AUTOMATIC is not supported: 100
PCKCACHESZ Allows STMM to dynamically manage memory allocations.
SHEAPTHRES_SHR
SORTHEAP
Recommended value: AUTOMATIC
40 Sterling B2B Integrator: Performance Management
Page 47

Parameter Recommended value
NUM_IOCLEANERS Recommended value: AUTOMATIC
NUM_IOSERVERS Recommended value: AUTOMATIC
DFT_PREFETCH_SZ Recommended value: AUTOMATIC
MAXAPPLS Recommended value: AUTOMATIC
APPLHEAPSZ Recommended value: AUTOMATIC
APPL_MEMORY Recommended value: AUTOMATIC
APP_CTL_HEAP_SZ 512
Note: APP_CTL_HEAP_SZ is deprecated in DB2 9.5.
DBHEAP Amount required depends on the amount of memory available and the
traffic volume.
Recommended value: AUTOMATIC
Note: The default DBHEAP value is inadequate.
LOGFILSIZ Refer to the topic Log Configuration.
Recommended value: 65536 if configuring 20 transaction logs of 256 MB
(65536 4 K pages)
LOGPRIMARY Number of primary transaction logs. Refer to the topic Log Configuration.
Recommended value: 40 or more
LOGSECOND Number of secondary transaction logs. These are allocated by DB2 when it
cannot reuse any of the primary logs due to active transactions. Refer to the
topic Log Configuration.
Recommended value: 12
NUM_LOG_SPAN Refer to the topic Log Configuration.
Recommended value: LOGPRIMARY - Safety buffer
DFT_DEGREE Sets the default degree of parallelism for intrapartition parallelism. In
general, online transactional applications such as Sterling B2B Integrator
typically experience a high volume of short queries that do not benefit from
parallel queries.
Recommended value: 1 – Disable intrapartition parallelism
DB2LOCK_TO_RB Recommended value: STATEMENT
Performance Management 41
Page 48

Recommended Settings for DB2 9.7
The following table lists the recommended settings specific to DB2 9.7:
Feature Description Value
Currently Committed
Semantics
The DB2 database used the default Cursor
Stability (CS) isolation level in all versions
until DB2 9.7. If an application changed a
row and another application tried to read
that row before the first application
committed the changes, the second
application waited until the commit.
You can now set the currently committed
semantics of the CS level, which informs
DB2 that when the second application tries
to read a locked row, it will get an image of
what the row looked like before committing
the change.
In the enhanced currently committed
semantics, only committed data is returned,
as it used to be earlier. However, now read
operation does not wait for the write
operation to release the row locks. Instead,
the read operation returns the data prior to
the start of the write operation.
Recommended value:
ON
The currently committed semantics is
turned on by default in the new DB 9.7
database. The new database configuration
parameter, cur_commit is used to override
this behavior.
Currently committed semantics requires
more log space for write operations. In
addition, extra space is required for logging
the first update of a data row during a
transaction, which can have an insignificant
or measurable impact on the total log space
used.
42 Sterling B2B Integrator: Performance Management
Page 49

Feature Description Value
Limitations
The following list provides limitations that
apply to the currently committed semantics:
v The target table in sections that is used
for data update or delete operation does
not use currently committed semantics.
v An uncommitted modification to a row
forces the currently committed read
operation to access appropriate log
records and determine the currently
committed version of the row. Although
log records that are no longer present in
the log buffer can be physically read,
currently committed semantics does not
support the retrieval of log files from the
log archive.
v The following scans does not use
currently committed semantics:
– Catalog table scans
– Referential integrity constraint
enforcement scans
– LONG VARCHAR or LONG
VARGRAPHIC column reference scans
– Range-clustered table (RCT) scans
– Spatial or extended index scans
Statement
concentrator
DB2 uses less server resources while
processing queries that have parameters
instead of queries that have literal values in
them. DB2 will compile an SQL statement
once and will cache it. It presents the same
You can enable
statement
concentrator by
running the following
SQL statement:
query execution plan from the cache the
next time for the same query thereby
utilizing fewer resources to
compile/prepare the same statement.
db2 update db cfg
for <db-alias> using
stmt_conc literals
However, it becomes a difficult task when
SQL statements use literal values instead of
parameters matching incoming statements
to what is already present in the statement.
To prevail over this situation, statement
concentrator modifies dynamic SQL
statements at the database server so that
similar, but not identical, SQL statements
can share the same access plan.
Performance Management 43
Page 50

Feature Description Value
Inline LOBs Sterling B2B Integrator extensively uses
large objects (LOBs). These LOBs are
usually a few kilobytes in size.
The LOB data access performance can be
improved by placing the LOB data within
the rows on data pages instead of the LOB
storage object.
Typically, LOBs are stored in a separate
storage object that is outside the base table.
LOBs can be stored in the formatted rows
of the base table if they are sufficiently
sized. Depending on the page size, the
maximum length of a LOB that can qualify
for in table in-lining is 32660 bytes. Such
LOBs are commonly known as inline LOBs.
Earlier, the processing of such LOBs created
bottlenecks for application. However, now
LOBs improve the performance of queries
that access the LOB data as there is no
additional I/Os required for fetching,
inserting, or updating the data.
LBO inlining is enabled for all LOB
columns in the new or existing tables for
DB2 9.7 and for all existing LOB columns in
an upgrade.
Enable LOB inlining
through the INLINE
LENGTH option on
the CREATE TABLE
statement or the
ALTER TABLE
statement.
Recommended Settings for DB2 for Linux on System z (5.2.4.0 or later)
IBM recommends special settings for DB2 when using Sterling B2B Integrator
5.2.4.0 or later on the Linux operating system on System z.
When you are running Sterling B2B Integrator 5.2.4.0 or later using the DB2
database on the Linux operating system on System z (or zLinux), IBM recommends
the following settings:
v SCSI over FCP (fiber channel protocol) disks for data and transaction logs.
v RAID 5 for data logs and RAID 10 or solid state drives (SSDs) for transaction
logs. All volumes should be striped across as many disks as possible. With this
setup, DB2 can be configured to use direct input and output.
An alternative setup is the use of separate extended count key data (ECKD) disks
with PAV (parallel access volumes) or HyperPAV for data and transaction logs. The
PAV and HyperPAV features are available on the IBM DS8000 series of IBM SANs.
This setup tries to overcome the limitations of the typical ECKD disk setup. All
ECKD volumes should be striped.
Storage Subsystem
Prior to production, plan the overall storage strategy. The DDLs to create
temporary tablespaces and data tablespaces are left to the discretion of the
customer. This topic discusses some general recommendations.
The Sterling B2B Integrator installation creates tables and indexes. The tables use
different page sizes: 4K, 8K, and 16K. You should have a tablespace to
44 Sterling B2B Integrator: Performance Management
Page 51

accommodate tables with these page sizes. DB2 automatically places tables and
indexes in the available tablespaces using its internal logic.
SMS Tablespaces in DB2
In an SMS (System Managed Space) table space, the operating system's file system
manager allocates and manages the space where the table is stored. The storage
model typically consists of many files, representing table objects, stored in the file
system space. The user decides on the location of the files, DB2 controls their
names, and the file system is responsible for managing them. By controlling the
amount of data written to each file, the database manager distributes the data
evenly across the table space containers. By default, the initial table spaces created
at database creation time are SMS.
SMS table spaces are defined using the MANAGED BY SYSTEM option in the
CREATE DATABASE command, or in the CREATE TABLESPACE statement.
Consider two key factors when you design your SMS table spaces:
v Containers for the table space. You must specify the number of containers that
you want to use for your table space. It is crucial to identify all the containers
you want to use, because you cannot add or delete containers after an SMS table
space is created.
v In a partitioned database environment, when a new partition is added to the
database partition group for an SMS table space, the ALTER TABLESPACE
statement can be used to add containers for the new partition.
Each container used for an SMS table space identifies an absolute or relative
directory name. Each of these directories can be located on a different file system
(or physical disk). Estimate the maximum size of the table space with:
Number of containers * maximum file system size supported by the operating
system
This formula assumes that there is a distinct file system mapped to each
container, and that each file system has the maximum amount of space available.
In practice, this may not be the case, and the maximum table space size may be
much smaller. There are also SQL limits on the size of database objects, which
may affect the maximum size of a table space.
v Extent size for the table space
The extent size can only be specified when the table space is created. Because it
cannot be changed later, it is important to select an appropriate value for the
extent size. If you do not specify the extent size when creating a table space, the
database manager will create the table space using the default extent size as
defined by the dft_extent_sz database configuration parameter. This
configuration parameter is initially set based on the information provided when
the database is created. If the dft_extent_sz parameter is not specified in the
CREATE DATABASE command, the default extent size is set to 32.
DMS Tablespaces in IBM DB2
In a DMS (Database Managed Space) table space, the database manager controls
the storage space. The storage model consists of a limited number of devices or
files whose space is managed by DB2. The database administrator decides which
devices and files to use, and DB2 manages the space on those devices and files.
The table space is essentially an implementation of a special-purpose file system
designed to meet the needs of the database manager.
Performance Management 45
Page 52

A DMS table space containing user-defined tables and data can be defined as:
v A regular table space to store any table data, and optionally, index data
v A large table space to store long field or LOB data, or index data
When designing your DMS table spaces and containers, you should consider the
following:
v The database manager uses striping to ensure an even distribution of data across
all containers.
v The maximum size of regular table spaces is 64 GB for 4 KB pages, 128 GB for 8
KB pages, 256 GB for 16 KB pages, and 512 GB for 32 KB pages. The maximum
size of large table spaces is 2 TB.
Unlike SMS table spaces, the containers that make up a DMS table space do not
have to be the same size. However, the use of unequal container sizes is not
usually recommended because it results in uneven striping across the containers,
and results in suboptimal performance. If any container is full, DMS table spaces
use the available free space from other containers.
v Because space is preallocated, it must be available before the table space can be
created. When using device containers, the device must also exist with enough
space for the definition of the container. Each device can have only one
container defined on it.
To avoid wasted space, the size of the device and the size of the container
should be equivalent. If, for example, the device is allocated with 5000 pages,
and the device container is defined to allocate 3000 pages, 2000 pages on the
device will not be usable.
By default, one extent in every container is reserved for overhead. Only full
extents are used. For optimal space management, use the following formula to
determine an appropriate size when allocating a container:
extent_size * (n + 1)
In this formula:
– extent_size is the size of each extent in the table space
– n is the number of extents that you want to store in the container
v Device containers must use logical volumes with a "character-special interface,"
and not physical volumes.
You can use files instead of devices with DMS table spaces. No operational
difference exists between a file and a device; however, a file can be less efficient
because of the run-time overheads associated with the file system. Files are
useful when devices are not directly supported, a device is not available,
maximum performance is not required, or you do not want to set up devices.
If your workload involves LOBs or LONG VARCHAR data, you can derive
performance benefits from file system caching.
Automatic Storage Management (ASM)
Automatic storage grows the size of your database across disk and file systems. It
removes the need to manage storage containers manually by taking advantage of
the performance and flexibility of database managed storage. In DB2 9.x, automatic
storage is enabled by default.
A database needs to be enabled for automatic storage when it is created. DB2 9.5
and DB2 9.7 enable automatic storage by default when you create new databases.
46 Sterling B2B Integrator: Performance Management
Page 53

You cannot enable automatic storage for a database if it was not created to
accommodate for it. Similarly, you cannot disable automatic storage for a database
that was originally created to use it.
With automatic storage, you no longer need to worry about tasks such as creating
additional table spaces for capacity, adding containers, and monitoring container
growth. When you want to restore a database backup, on a different system (using
different directory or path structures), you can redefine the storage paths, such that
the new paths are used instead of the ones stored in the backup.
The following examples illustrate automatic storage usage on UNIX and Linux
systems.
When a database is created, you can specify the storage pool for use by the
database. If no storage paths are specified, the default database path (dftdbpath) is
used.
CREATE DATABASE test on /data/path1, /data/path2
You can add additional storage paths to the pool:
ALTER DATABASE ADD STORAGE /data/path3, /data/path4
Earlier, when you created tablespaces, you had to specify containers for them. You
can now specify that they automatically use the database storage pool:
CREATE TABLESPACE ts1 MANAGED BY AUTOMATIC STORAGE
You can also define policies for storage growth and limits:
CREATE TABLESPACE ts2
INITIAL SIZE 500K
INCREASE SIZE 100K
MAXSIZE 100M
Note: For performance and simplicity, Automatic Storage Management is
recommended. If this is not possible, define SYSCATSPACE and SYSTOOLSPACE,
temporary tablespaces as SMS, and other tablespaces holding application data as
DMS.
I/O Sub-System Response Time
Sterling B2B Integrator is an On-Line Transaction Processing (OLTP) application.
As an OLTP application, database response time to the I/O sub-system needs to be
in the single digit range even during the peak periods. The database response time
to the I/O sub-system should be less than:
v 5 ms for logs. 1ms or better is recommended.
v 10 ms or better for data. 5ms is recommended.
Log Configuration
This topic provides information about the following logs:
v LOGFILSIZ, LOGPRIMARY, LOGSECOND
Performance Management 47
Page 54

v NUM_LOG_SPAN
LOGFILSIZ, LOGPRIMARY, LOGSECOND
At a minimum, configure 20 transaction logs (LOGPRIMARY=20) of 256 MB
(LOGFILSIZ=65536 4K-pages) for Sterling B2B Integrator.
As an additional precaution, configure at least 12 secondary transaction logs
(LOGSECOND=12). DB2 allocates secondary logs when it cannot reuse any of the
primary logs due to active transactions.
Track the following monitor elements to assess the effectiveness of these settings,
and adjust as needed:
v total_log_used and tot_log_used_top to see how much of the logs are used
v Which workloads are consuming or holding the transaction logs when
LOGPRIMARY approaches the total primary log capacity. If needed, raise the
setting for LOGPRIMARY.
v sec_log_used_top and sec_logs_allocated to see if secondary transaction logs are
used. Investigate how often logging spills over to the secondary logs and what
workloads are running during the spill. If needed, increase LOGPRIMARY to
prevent log spills.
NUM_LOG_SPAN
This parameter limits the number of logs a transaction can span, which prevents
situations where DB2 cannot switch transaction logs because all the transaction
logs are active. For example:
v Someone may have updated a record in IBM Sterling Control Center, but may
have forgotten to commit the change.
v Updates to one or more database records might not get committed due to a
software bug.
Set NUM_LOG_SPAN to a minimum of 12 so that valid long-running transactions
are not prematurely forced, and a maximum of LOGPRIMARY minus a safety
buffer. For example, if LOGPRIMARY=20 and you decide upon a safety buffer of 4,
the maximum NUM_LOG_SPAN=16.
DB2 Monitoring
DB2 includes many facilities for tracing system activity at just about any level of
detail. This section covers the following topics:
v Snapshot Monitors
v Snapshot Monitor Commands
v DB2 Event Monitors
v Use an Event Monitor to Diagnose and Flush Deadlocks
v DB2 Performance Expert
Snapshot Monitors
Information about snapshot monitors is available by searching at
http://www.ibm.com/developerworks/.
Snapshot monitors collect information about the state of a DB2 instance and any
databases it controls at a specific point in time. Snapshots are useful for
determining the status of a database system. When taken at regular intervals, they
48 Sterling B2B Integrator: Performance Management
Page 55

can provide information that lets you observe trends and identify potential
problem areas. Snapshot monitoring is performed by executing the GET SNAPSHOT
command from the DB2 Command-Line Processor (CLP).
Snapshot Monitor Commands
To use snapshot monitors, turn on the monitor switches and view data. The
following table describes the command and syntax for specific tasks:
Task Command and Syntax
Turn on monitor
switches
Check status of
monitor switches
View snapshot data Switches must be turned on to view data.
db2 UPDATE MONITOR SWITCHES USING options
Options are:
lock on
sort on
statement on
table on
timestamp on
uow on
Note: Monitor switches can also be controlled in the database
manager configuration.
GET MONITOR SWITCHES
GET SNAPSHOT FOR options
Options:
bufferpools on database_name
locks on database_name
dynamic sql on database_name
tables on database_name
applications on database_name
tablespaces on database_name
database on database_name
DB2 Event Monitors
Information about snapshot monitors is available by searching at
http://www.ibm.com/developerworks/.
Event monitors are used to monitor events in an area over time, such as by
producing event records at the start and end of multiple events. These records are
useful for resource planning, trend analysis, and so on.
Performance Management 49
Page 56

The most common uses for event monitors are for connections, locks, and
statements. Output can be written to files, named pipes (useful if writing programs
to retrieve monitor data), or to tables.
Event monitor output can be either blocked or nonblocked. Blocked output ensures
against data loss, but should generally be avoided for systems that produce a large
volume of records and for statement event monitors to avoid crashes.
You can limit the granularity of an event monitor to a single user or application.
Connection events can be used to track system usage on a user basis or application
basis. This data allows you to identify poorly performing programs, the heaviest
users, and usage trends. Daily review facilitates discussions with users about the
activity or about adjusting the DB2 physical design.
Use an Event Monitor to Diagnose and Flush Deadlocks
Sterling B2B Integrator, along with the necessary DB2 registry variables, is
designed to minimize the occurrence of deadlocks. However, deadlocks may still
occur in some situations, including the following:
v Custom BP code may obtain records in a different order.
v DB2 may choose an access plan that retrieves records in a different order.
The following table describes the actions to be performed for specific tasks:
Task What to Do
Set an event monitor
to help diagnose
deadlocks
Determine that a
deadlock has occurred
Release a deadlock by
flushing buffers
Run this command:
db2 -v create event monitor $MON for deadlocks with details
write to file $OUTDIR buffersize 64 nonblocked
db2 -v set event monitor $MON state = 1
Options:
MON – Monitor name (for example, DLMON)
OUTDIR – directory to store deadlock information
View data in the db2diag.log or in the Sterling B2B Integrator logs
Run the following command:
db2 flush event monitor $MON
db2evmon -path $OUTDIR
The flush ensures that the deadlock records in the buffers are
written out. The db2evmon command formats the deadlock
information.
Optim™Performance Manager Extended Edition
Optim Performance Manager is a performance analysis and tuning tool for
managing a mix of DB2 systems. It can be used to identify, diagnose, solve, and
prevent performance problems.
50 Sterling B2B Integrator: Performance Management
Page 57

For more information about the Optim Performance Manager Extended Edition,
refer to:
http://www-01.ibm.com/software/data/optim/performance-manager-extendededition
DB2 Index and Table Statistics
DB2 uses catalog statistics to determine the most efficient access plan for a query.
Out-of-date or incomplete statistics for a table or an index may slowdown query
execution.
Manual statistics management can be time-consuming. Automatic statistics
collection can run the RUNSTATS utility in the background to collect and maintain
the statistics you require.
To configure your database for automatic statistics collection, set each of the
following parameters to ON:
v AUTO_MAINT
v AUTO_TBL_MAINT
v AUTO_RUNSTATS
Volatile Tables
In some cases, the content of the WORKFLOW_CONTEXT, TRANS_DATA, and
other tables can fluctuate significantly during the day. The resulting statistics,
which represent a table at a single point in time, can be misleading. In such
situations, mark the table as volatile with the following command:
alter table <table name> volatile cardinality
For information about regular tuning and best practices for DB2, refer to the
corresponding IBM documentation.
Update Table Statistics Manually
In rare cases you may need to update statistics for a table manually. Run the
following command for the table in the Sterling B2B Integrator schema:
db2 runstats on table <table name> on key columns with distribution on key
columns and sampled detailed indexes all allow read access
Microsoft SQL Server Configuration and Monitoring
This section provides information about configuring and monitoring Microsoft
SQL Server®2005, Microsoft®SQL Server®2008, and Microsoft®SQL Server®2012.
It describes the recommended instance-specific settings, database-specific settings,
maintenance plan, and system monitoring. It also provides information about
Address Windowing Extensions (AWE), storage subsystem, dynamic management
views, and index and table statistics.
Mandatory settings for Microsoft SQL Server
The default collation of Microsoft SQL Server must match the collation for the
Sterling B2B Integrator database to prevent collation conversions.
®
Performance Management 51
Page 58

The tempdb database that is used by Microsoft SQL Server must be created with the
same collation as the default collation of Microsoft SQL Server. The Microsoft SQL
Server uses the tempdb database for results that are too large to fit in memory.
If the collations of the tempdb database and the Sterling B2B Integrator database
differ, the database engine must convert from the Sterling B2B Integrator collation
to the tempdb collation, and then back again before it sends the results to the
Sterling B2B Integrator server. These conversions might lead to severe performance
issues.
The collation that is required for the Sterling B2B Integrator database is a collation
that most closely matches the character set used by Java. By using this collation,
you can avoid character data conversions before the data is stored in the database
tables. Use the mandatory parameter that is described in the following table when
you configure the collation setting:
Parameter Value
Database Collation SQL_Latin1_General_CP850_Bin
Additionally, you must perform these tasks:
v Allow Microsoft SQL Server to manage memory dynamically (default).
v Disable any antivirus software that is running on the Microsoft SQL Server
data, transaction log, and binary files directory.
Recommended instance-specific settings for Microsoft SQL Server
The use of the Microsoft SQL Server database with Sterling B2B Integrator includes
some recommended instance-specific settings for the database.
Parameter Value
Max server memory (MB) 500 MB to x MB depending on the amount of physical
memory available on your database server. if the server is
running only this SQL Server instance; x can be up-to 80%
of the physical memory (RAM).
Min server memory (MB) 0
Recommended database-specific settings for Microsoft SQL Server
The use of the Microsoft SQL Server database with Sterling B2B Integrator includes
some recommended database-specific settings.
Parameter Value Notes
IsAutoCreateStatistics True This parameter
IsAutoUpdateStatistics True This parameter
®
can be set to
False if you
have a
maintenance
plan.
can be set to
False if you
have a
maintenance
plan.
52 Sterling B2B Integrator: Performance Management
Page 59

Parameter Value Notes
Page_verify_option Checksum (Microsoft SQL Server
default)
READ_COMMITTED_
SNAPSHOT
On
®
Microsoft SQL Server Memory with Address Windowing Extensions (AWE)
You can use the Microsoft SQL Server memory (with AWE) when running
Microsoft SQL Server (32 bit) on Windows Server (32 bit).
This is helpful when your server has more than 4 GB of RAM and you want
Microsoft SQL Server to be able to use that. For using Microsoft SQL Server with
AWE, use the recommended values for Min and Max server memory for instance
level settings.
For more information on Enabling AWE Memory for Microsoft SQL Server
Memory, refer to the Microsoft Developer Network Web site:
v http://msdn.microsoft.com/en-us/library/ms190673(SQL.90).aspx (Microsoft
SQL Server 2005)
v https://technet.microsoft.com/en-us/library/ms190673%28v=sql.105%29.aspx
(Microsoft SQL Server 2008)
This feature was removed in Microsoft SQL Server 2012. For more information, see
https://support.microsoft.com/en-us/kb/2663912.
Row Versioning-Based Isolation Level (READ_COMMITTED_SNAPSHOT) for Microsoft SQL Server
This feature is available in Microsoft SQL Server 2005 and later versions,
This feature can help in the following ways:
v Resolve concurrency issues such as excessive blocking
v Reduce deadlocks
The following T-SQL statement enables the READ_COMMITTED_SNAPSHOT for
a database:
ALTER DATABASE <DB NAME> SET READ_COMMITTED_SNAPSHOT ON;
This snapshot option increases the number of I/Os as well as the size of tempdb. It
is important to have tempdb on fast disks as well as to have it sized according to
your workload.
For more information about Using and Understanding Snapshot Isolation and Row
Versioning, refer to the Microsoft Developer Network Web site, which can be
accessed from: http://msdn.microsoft.com/en-us/library/tcbchxcb(VS.80).aspx.
Recommended Settings for Microsoft SQL Server 2008 and 2012
Recommended settings for Microsoft SQL Server 2008 and Microsoft SQL Server
2012 are provided.
These are shown in the following table:
Performance Management 53
Page 60

Feature Description
Activity Monitor During troubleshooting, a database administrator (DBA) executes
several scripts or verifies number of sources to collect general
information about the processes being executed and to find out the
source of the problem. Microsoft SQL Server consolidates this
information in detail graphically by running the recently executed
processes.
For more information about Activity Monitor, refer to the Microsoft
Developer Network Web site:
v https://technet.microsoft.com/en-us/library/cc879320
%28v=sql.105%29.aspx (Microsoft SQL Server 2008)
v https://msdn.microsoft.com/en-us/library/hh212951
%28v=sql.110%29.aspx (Microsoft SQL Server 2012)
54 Sterling B2B Integrator: Performance Management
Page 61

Feature Description
Data Compression The following list describes the two type of data compression
supported by Microsoft SQL Server:
v Row compression
Row compression compresses the individual columns of a table.
Row compression results in lower overhead on the application
and utilizes more space.
v Page compression
Page compression compresses the data pages using row, prefix,
and dictionary compression. Page compression affects
application throughput and processor utilization, but requires
less space. Page compression is a superset of row compression,
which implies that an object or a partition of an object that is
compressed using page compression is compressed at the row
level too.
The amount of compression achieved is dependent on the data
types and the data contained in the database.
Compression, row or page, can be applied to a table or an index in
an online mode without interrupting the availability of Sterling
B2B Integrator. The hybrid approach, where only the largest tables
that are few in number, are compressed, results in best
performance in saving significant disk space and resulting in
minimal negative impact on performance. Disk space requirements
should be considered before implementing compression.
Compressing the smallest objects first minimizes the additional
disk space requirements.
Run the following SQL query to determine how compressing an
object may affect its size:
sp_estimate_data_compression_savings
The following Sterling B2B Integrator tables may be the most likely
candidates for compression:
v DATA_TABLE
v TRANS_DATA
v CORRELATION_SET
v WORKFLOW_CONTEXT
v ARCHIVE_INFO
For more information about implementing row and page
compression, refer to the Microsoft Developer Network Web site:
v https://msdn.microsoft.com/en-us/library/cc280576
%28v=sql.105%29.aspx (Row compression)
v https://msdn.microsoft.com/en-us/library/cc280464
%28v=sql.105%29.aspx (Page compression)
v https://msdn.microsoft.com/en-us/library/cc280449
%28v=sql.110%29.aspx (Data compression)
Performance Management 55
Page 62

Feature Description
Hot Add CPU and
Hot Add Memory
Extended Events The extended events infrastructure enables administrators to
Hot Add CPU enables you to add CPUs dynamically to the servers
without shutting down the server or limiting client connections.
Hot Add Memory enables you to add physical memory
dynamically without restarting the server.
For more information about dynamically adding CPU and physical
memory, refer to the Microsoft Developer Network Web site, which
can be accessed from:
v http://msdn.microsoft.com/en-us/library/bb964703.aspx (Hot
Add CPU)
v http://msdn.microsoft.com/en-us/library/ms175490.aspx (Hot
Add Memory)
Note: The above pages are for Microsoft SQL Server 2008.
However, Hot Add CPU and Hot Add Memory are also supported
in Microsoft SQL Server 2012. For more information, see the High
Availability section at https://msdn.microsoft.com/en-us/library/
bb630282%28v=sql.110%29.aspx.
investigate and address complex problems such as excessive CPU
usage, deadlocks, application timeouts, and so on. Extended events
can be correlated with Windows events to obtain more information
of the problem.
For more information about extended events, refer to the Microsoft
Developer Network Web site:
v http://msdn.microsoft.com/en-us/library/bb630354.aspx
(Microsoft SQL Server 2008)
v https://msdn.microsoft.com/en-us/library/bb630282
%28v=sql.110%29.aspx (Microsoft SQL Server 2012)
Storage Subsystem
Prior to production, you should plan the overall storage strategy.
You must have DDLs to create and place tempdb and the user database for
Sterling B2B Integrator. A typical subsystem configuration would be:
v OS and SQL Server binaries on a RAID 1 disk set
v SQL Server data files on one or more RAID 5 disk sets
v SQL Server transaction logs on a RAID 10 disk set
Consider and ensure the following when planning a storage subsystem:
v Place SQL Server binaries on a separate set of physical disks other than the
database data and log files.
v Place the log files on physical disk arrays other than those with the data files.
This is important because logging is more write-intensive, and the disk arrays
containing the SQL Server log files require sufficient disk I/O to ensure that
performance is not impacted.
v Set a reasonable size for your database. Estimate how big your database will be.
This should be done as part of presales exercise working with IBM Professional
Services.
v Set a reasonable size for the transaction log. The transaction log's size should be
20–25 per cent of the database size.
56 Sterling B2B Integrator: Performance Management
Page 63

v Leave the Autogrow feature on for the data files and the log files. This helps
the SQL Server to automatically increase allocated resources when necessary.
v Set a reasonable size for the Autogrow increment. Setting the database to
automatically grow results in some performance degradation. Therefore you
should set a reasonable size for the Autogrow increment to prevent the database
from growing automatically often.
v Set the maximum size for the data files and log files in order to prevent the
disk drives from running out of space.
v If you have several physical disk arrays, try to create at least as many files as
there are physical disk arrays so that you have one file per disk array. This
improves performance because when a table is accessed sequentially, a separate
thread is created for each file on each disk array in order to read the table's data
in parallel.
v Place the heavily accessed tables in one file group and place the tables' indexes
in a different file group on a different physical disk arrays. This improves
performance, because separate threads will be created to access the tables and
indexes. For more information about Sterling B2B Integrator tables, refer to the
"Schema Objects" and "Sterling B2B Integrator Database Tables" sections in the
topic “Database management for Sterling B2B Integrator” on page 16.
I/O Sub-System Response Time
Sterling B2B Integrator is an On-Line Transaction Processing (OLTP) application.
As an OLTP application, database response time to the I/O sub-system needs to be
in the single digit range even during the peak periods. The database response time
to the I/O sub-system should be less than:
v 5 ms for logs. 1ms or better is recommended.
v 10 ms or better for data. 5ms is recommended.
Monitoring Microsoft SQL Server Using Microsoft SQL Server Management Studio
Microsoft SQL Server Management Studio is a tool kit for configuring, managing,
and administering all components of Microsoft SQL Server.
Microsoft SQL Server Management Studio combines the features of Enterprise
Manager, Query Analyzer, and Analysis Manager.
For more information about Microsoft SQL Server Management Studio, refer to the
Microsoft Developer Network Web site, which can be accessed from:
http://msdn.microsoft.com/en-us/library/ms174173(SQL.90).aspx.
Monitoring Microsoft SQL Server Using SQL Server Profiler
SQL Server Profiler is a graphical tool used to monitor an instance of Microsoft
SQL Server.
This tool is a good troubleshooting tool, but should not be enabled for day-to-day
operations because there is an inherent overhead in capturing this data daily. The
data about each event can be captured to a file or a table for analysis at a later
date.
The SQL Server Profiler can be used to:
v Monitor the performance of an instance of the SQL Server Database Engine
v Identify procedures and queries that are executing slowly
v Replay traces of one or more users
Performance Management 57
Page 64

v Perform query analysis
v Troubleshoot problems
v Audit and review activity
v Correlate performance counters
v Configure trace problems
For more information about Using the SQL Server Profiler, refer to the Microsoft
Developer Network Web site, which can be accessed from: https://
technet.microsoft.com/en-us/library/ms181091%28v=sql.105%29.aspx.
Enable the following events in SQL Server Profiler to capture deadlock-related
information:
v Deadlock graph
v Lock: Deadlock
v Lock: Deadlock Chain
v RPC:Completed
v SP:StmtCompleted
v SQL:BatchCompleted
v SQL:BatchStarting
For more information about Analyzing Deadlocks with SQL Server Profiler, refer to
the Microsoft Developer Network Web site, which can be accessed from:
http://msdn.microsoft.com/en-us/library/ms188246(SQL.90).aspx.
For more information about Troubleshooting Deadlocks in Microsoft SQL Server,
refer to the Microsoft Developer Network Web site, which can be accessed from:
http://blogs.msdn.com/sqlserverstorageengine/archive/2006/06/05/617960.aspx.
Microsoft SQL Dynamic Management Views
The Dynamic Management Views (DMVs) introduced in Microsoft SQL Server 2005
provide DBA information about the current state of the SQL Server machine.
These values help an administrator diagnose problems and tune the server for
optimal performance. For more information about dynamic management views
and functions, refer to the Microsoft Developer Network Web site, which can be
accessed from:
http://msdn.microsoft.com/en-us/library/ms188754(SQL.90).aspx
Microsoft SQL System Monitor
The performance monitor (Perfmon) or system monitor is a utility used to track a
range of processes and provide a real-time graphical display of the results.
It can also be used to measure SQL Server performance. You can view SQL Server
objects, performance counters, and the behavior of other objects, such as
processors, memory, cache, threads, and processes. For more information about
Monitoring Resource Usage (System Monitor), refer to the Microsoft TechNet Web
site, which can be accessed from: http://technet.microsoft.com/en-us/library/
ms191246(SQL.90).aspx.
Microsoft SQL Server Maintenance Plan
A maintenance plan is a set of measures (workflows) taken to ensure that a
database is properly maintained and routine backups are scheduled and handled.
58 Sterling B2B Integrator: Performance Management
Page 65

Microsoft SQL Server maintenance plans can be configured by a wizard in
Microsoft SQL Server Management Studio, which can help alleviate some of the
burden involved in creating the plan. In Microsoft SQL Server Database Engine,
maintenance plans create an Integration Services package, which is run by an SQL
Server Agent job. The goal of a maintenance plan is to:
v Back up the Sterling B2B Integrator database regularly using either the simple
model or the full recovery model
v Update the statistics on all Sterling B2B Integrator tables and associated indexes
v Rebuild or reorganize indexes on Sterling B2B Integrator tables
v Run database consistency checks
For more information about MS SQL Maintenance Plans, see the Microsoft
Developer Network Web site: https://msdn.microsoft.com/en-us/library/
ms187658%28v=sql.105%29.aspx
You can use either the simple recovery model or the full recovery model with the
database. If you are unsure about which model to use, use the full recovery model.
Consider the simple recovery model if you are agreeable to the following:
v Point of failure recovery is not necessary. If the database is lost or damaged,
you are willing to lose all the updates between a failure and the previous
backup.
v You are willing to risk the loss of some data in the log.
v You do not want to back up and restore the transaction log, preferring to rely
exclusively on full and differential backups.
v You are willing to perform a differential database backup every day and a full
database backup over the weekends (during low activity period).
For more information about Backup Under the Simple Recovery Model, see the
Microsoft Developer Network Web site: https://msdn.microsoft.com/en-us/
library/ms191164%28v=sql.105%29.aspx or https://msdn.microsoft.com/en-us/
library/ms186289%28v=sql.105%29.aspx
Consider the full recovery model if you are agreeable to the following:
v You want to recover all the data.
v You want to recover to the point of failure.
v You want to be able to restore individual pages.
v You are willing to incur the cost of additional disk space for transaction log
backups.
v Performance of transaction log backups every 30-45 minutes.
For more information about Backup Under the Full Recovery Model, refer to the
Microsoft Developer Network Web site, which can be accessed from:
https://msdn.microsoft.com/en-us/library/ms186289%28v=sql.105%29.aspx.
For more information about Transaction Log Backups, refer to the Microsoft
Developer Network Web site, which can be accessed from: https://
msdn.microsoft.com/en-us/library/f4a44a35-0f44-4a42-91d5-d73ac658a3b0
%28v=sql.105%29 .
Note: The Microsoft Developer Network Web site links provided access pages for
Microsoft SQL Server 2008 R2. To view pages for other versions, such as Microsoft
SQL Server 2012, use the Other Versions feature on the viewed page.
Performance Management 59
Page 66

Microsoft SQL Server Index, Table Statistics, and Index Rebuilds
Your maintenance plan should include updating of statistics and rebuilding or
reorganizing indexes.
If you have a maintenance plan for updating statistics, set IsAutoCreateStatistics
and IsAutoUpdateStatistics, at the database level, to False. This helps control when
the maintenance plan runs, which should be at low load periods. If you have not
included this in your maintenance plan, then set IsAutoCreateStatistics and
IsAutoUpdateStatistics, at the database level to True.
Following is an example of a T-SQL statement for updating the statistics on a table,
including the statistics pertaining to all the indexes on the table:
UPDATE STATISTICS <TABLE NAME>
When the data in the tables have changed by approximately 20 per cent, index
rebuilds are recommended for the Sterling B2B Integrator database. This must be
validated by looking at system performance as a whole. Online index rebuilds,
which cause minimal impact to the system, are possible. To find out more about
document life-spans, and when the data in the tables change by approximately 20
per cent, speak to the Sterling B2B Integrator system administrator.
You can rebuild indexes either online or offline. Online indexes can be rebuilt, with
the following exceptions:
v Clustered indexes if the underlying table contains LOB data types
v Nonclustered indexes that are defined with LOB data type columns.
Nonclustered indexes can be rebuilt online if the table contains LOB data types,
but none of these columns are used in the index definition as either key or
nonkey columns.
For ease of maintenance, it is easier to either build all the indexes offline because
offline rebuilding does not have the restrictions listed previously, or reorganize the
index.
Following is an example of a T-SQL statement for rebuilding indexes offline:
ALTER INDEX ALL ON <TABLE NAME> REBUILD
Following is an example of a T-SQL statement for reorganizing indexes offline:
ALTER INDEX ALL ON <TABLE NAME> REORGANIZE
For more information about Reorganizing and Rebuilding Indexes, refer to the
Microsoft Developer Network Web site, which can be accessed from:
http://msdn.microsoft.com/en-us/library/ms189858(SQL.90).aspx.
For more information about Alter index (Transact-SQL), refer to the Microsoft
Developer Network Web site, which can be accessed from: http://
msdn.microsoft.com/en-us/library/ms188388(SQL.90).aspx.
Windows Defragmentation
You must run Windows defragmentation on disks with SQL Server data files and
transaction logs once a month.
60 Sterling B2B Integrator: Performance Management
Page 67

This helps reduce the fragmentation in the SQL Server files at the file system level.
You can create a schedule for this using Windows Task Scheduler.
For more information about the Disk Defragmenter Tools and Settings, refer to the
Microsoft TechNet Web site, which can be accessed from: http://
technet.microsoft.com/en-us/library/cc784391(WS.10).aspx.
Microsoft SQL Server Tips
Additional tips are provided pertaining to Microsoft SQL Server in the context of
Sterling B2B Integrator.
v When using Sterling B2B Integrator with Microsoft SQL Server, Windows
Integrated authentication is not supported.
v Ensure that network components such as routers, firewalls, and so on, do not
drop the idle connections between Sterling B2B Integrator and Microsoft SQL
Server where they are on separate physical servers. Sterling B2B Integrator uses
JDBC connection pool, and idle connections are typical.
v It is recommended that you run Microsoft SQL Server and Sterling B2B
Integrator on separate physical servers because this helps improve performance,
ease of maintenance, and recoverability.
v It is important to understand the difference between simple blocking and
deadlocks:
– Blocking is an unavoidable characteristic of Microsoft SQL Server because it
uses lock-based concurrency. Blocking occurs when one session holds a lock
on a specific resource, and a second session attempts to acquire a conflicting
lock type on the same resource. Typically, the time frame for which the first
session locks the resource is small. When it releases the lock, the second
session is free to acquire its own lock and continue processing. This is the
normal behavior of Microsoft SQL Server with Sterling B2B Integrator, and is
generally not a cause for concern. It is a cause for concern only when sessions
are getting blocked for a long time.
– Deadlocks are much worse than simple blocking. A deadlock typically occurs
when a session locks the resources that another session has to modify, and the
second session locks the resources that the first session intends to modify.
Microsoft SQL Server has a built-in algorithm for resolving deadlocks. It will
select one of the deadlock participants and roll back its transaction. This
session becomes the deadlock victim. Microsoft SQL Server has two trace
flags that can be set to capture deadlock-related information. The flags are
Trace Flag 1204 and Trace Flag 1222. These trace flags can be used as an
alternative to using SQL Server Profiler.
For more information about trace flags, see https://msdn.microsoft.com/enus/library/ms188396%28v=sql.105%29.aspx
For more information about Detecting and Ending Deadlocks in Microsoft
SQL Server 2005 and Microsoft SQL Server 2008, refer to the Microsoft
Developer Network Web site, which can be accessed from:
http://msdn.microsoft.com/en-us/library/ms178104(SQL.90).aspx.
In Microsoft SQL Server 2012, the System Health session detects deadlocks.
See https://technet.microsoft.com/en-us/library/ff877955%28v=sql.110
%29.aspx for more information.
Java Virtual Machine
Java Virtual Machine (JVM) is a platform-independent programming language that
converts Java bytecode into machine language and executes it.
Performance Management 61
Page 68

When you compile a Java source, you get an intermediate Java file called the Java
class. The class file is made up of bytecodes representing abstract instruction codes.
These codes are not directly executable by any computer processor.
To run a Java program, you start a JVM and pass the class file to the JVM. The
JVM provides many services, including loading the class file and interpreting
(executing) the byte codes. The JVM is the core technology that provides the
runtime environment in which a Java application runs.
Each Java program or application runs in its own JVM. For example, if you
configured an application server cluster with ten managed server instances that are
controlled by one administrative instance, your configuration runs 11 JVM
processes.
Since JVM is the underlying processing engine, it is critical that the JVMs are
optimally configured and are running efficiently. Incorrect JVM settings may lead
to poor application performance or JVM outages.
Run the following command to find out the JVM version installed in your system:
$JAVA_HOME/bin/java -version
Note: If your environment handles large concurrent communications traffic, it is
recommended to increase the value of the gmm.maxAllocation property in the
perimeter.properties file, along with increasing the maximum heap size of your
JVM. In such a scenario, set gmm.maxAllocation to a value greater than 384 MB. For
more information about the gmm.maxAllocation property, refer to the inline
comments in the perimeter.properties file.
Garbage Collection Statistics
Garbage Collection (GC) statistics provide heap-related information such as:
v What are the sizes of the different heaps?
v How full is each section of heap?
v How fast is the heap getting full?
v What is the overall overhead of GC to clean the non-live objects?
Collecting and analyzing GC statistics help size the different sections of a heap
correctly. It is recommended that you continuously collect garbage collection
statistics for all the JVMs, even in production. The collection overhead is minor
compared to the benefit. With these statistics, you can tell if:
v The JVM has or is about to run into a memory leak
v Garbage collection is efficient
v Your JVM heap settings are optimal
JVM Verbose Garbage Collection
JVM Verbose garbage collection (GC) statistics are critical and must always be
enabled in production environments. These statistics can be used to understand the
behavior of the JVM heap management and the efficiency of the JVM.
IBM JVM Garbage Collection Example
Following is an example of the GC output for JVM:
62 Sterling B2B Integrator: Performance Management
Page 69

<af type="tenured" id="100" timestamp="Sun Nov 25 15:56:09 2007"
intervalms="120245.593">
<minimum requested_bytes="10016" />
<time exclusiveaccessms="0.045" />
<tenured freebytes="2704" totalbytes="1073741824" percent="0" >
<soa freebytes="2704" totalbytes="1073741824" percent="0" />
<loa freebytes="0" totalbytes="0" percent="0" />
</tenured>
<gc type="global" id="100" totalid="100" intervalms="120245.689">
<refs_cleared soft="0" threshold="32" weak="0" phantom="0" />
<finalization objectsqueued="0" />
<timesms mark="35.301" sweep="5.074" compact="0.000" total="40.426" />
<tenured freebytes="808526296" totalbytes="1073741824" percent="75" >
<soa freebytes="808526296" totalbytes="1073741824" percent="75" />
<loa freebytes="0" totalbytes="0" percent="0" />
</tenured>
</gc>
<tenured freebytes="808516280" totalbytes="1073741824" percent="75" >
<soa freebytes="808516280" totalbytes="1073741824" percent="75" />
<loa freebytes="0" totalbytes="0" percent="0" />
</tenured>
<time totalms="40.569" />
</af>
In this example, <af type=”tenured” id=”100” indicates that this is the 100th time
an attempt to allocate memory has failed, and as a result, a GC was initiated. An
allocation failure is not an error in the system or code. When enough free space is
not available in the heap, the JVM automatically initiates a garbage collection. The
last time an allocation failure occurred was 120245.593 milliseconds ago (or 120.245
seconds).
The lines starting with <gc type=”global” id=”100” provide information about the
collection process. In this example, garbage collection initiated the mark phase and
the sweep phase, which were completed in 35.301 and 5.074 milliseconds
respectively. The JVM determined that the heap was not fragmented, and that
compacting the heap was not required. At the end of the GC, the heap had
808,516,280 bytes of available memory.
It is important that the frequency of GCs be monitored. This can easily be achieved
by looking at the time between the allocation failures. Typically, a healthy JVM will
spend less than 0.5 seconds in each GC cycle. Also, the overall percentage of time
spent on garbage collection should be less than 3 percent. To calculate the percent
of time spent performing garbage collection, divide the sum of the garbage
collection time over a fixed interval by the fixed interval.
IBM provides documentation pertaining to its Garbage Collector and how to
interpret its GC statistics.
Refer to either the IBM JDK 6.0: Java Diagnostics Guide or the IBM DeveloperWorks
article "Fine-tuning Java garbage collection performance", which is available at the
following Web site:
http://www.ibm.com/developerworks/ibm/library/i-gctroub/
Introduction to HotSpot JVM Performance and Tuning
The Sun HotSpot JVM is used when you deploy Sterling B2B Integrator on a Sun
Solaris operating system running on Sun UltraSPARC processor-based servers and
on a Windows operating system.
Performance Management 63
Page 70

The HP HotSpot JVM is used when you deploy Sterling B2B Integrator on a
HP-UX for IA64 (Itanium) or HP-UX on any other processor.
HotSpot JVMs provide many tuning parameters. There is no golden set of JVM
settings that apply to all customers and conditions. Fortunately, the HotSpot JVMs
provide good measurement feedback that allows you to measure the effectiveness
of the settings. The settings, especially memory settings, are highly dependent on:
v Transaction mix
v Amount of data cached
v Complexity of the transactions
v Concurrency levels
This topic describes the processes involved in planning, implementing, configuring,
monitoring, and tuning the HotSpot Java Virtual Machines.
To enable JVM verbose garbage collection, refer to the documentation on JVM
parameters for the server in “Edit Performance Configuration Settings” on page
123.
To enable JVM verbose garbage collection for the container JVM, refer to the
documentation on JVM parameters for container nodes in “Edit Performance
Configuration Settings” on page 123.
For information on the default parameters for the HotSpot JVM, refer to “HotSpot
JVM Default Parameters” on page 66.
HotSpot JVM Heap Memory and Garbage Collection
The JVM run-time environment uses a large memory pool called the heap, for
object allocation. The JVM automatically invokes garbage collections (GC) to clean
up the heap of unreferenced or dead objects. In contrast, memory management in
legacy programming languages such as C++ is left to the programmer. If the JVM
heap settings are not set correctly, the garbage collection overheads can make the
system appear unresponsive. In the worst case, your transactions or the JVM may
abort due to outOfMemory exceptions.
Garbage collection techniques are constantly being improved. For example, the Sun
JVM supports a "stop-the-world" garbage collector where all the transactions have
to pause at a safe point for the entire duration of the garbage collection. The Sun
JVM also supports a parallel concurrent collector, where transactions can continue
to run during most of the collection.
The Sun heap and HP heap are organized into generations to improve the
efficiency of their garbage collection, and reduce the frequency and duration of
user-perceivable garbage collection pauses. The premise behind generational
collection is that memory is managed in generations or in pools with different
ages. The following diagram illustrates the layout of the generational heap.
64 Sterling B2B Integrator: Performance Management
Page 71

At initialization, a maximum address space is virtually reserved, but not allocated,
to physical memory unless it is needed. The complete address space reserved for
object memory can be divided into young and tenured (old) generations.
New objects are allocated in the Eden. When the Eden fills up, the JVM issues a
scavenge GC or minor collection to move the surviving objects into one of the two
survivor or semi spaces. The JVM does this by first identifying and moving all the
referenced objects in the Eden to one of the survivor spaces. At the end of the
scavenge GC, the Eden is empty (since all the referenced objects are now in the
survivor space) and ready for object allocation.
The scavenge GC's efficiency depends on the amount of referenced objects it has to
move to the survivor space, and not on the size of the Eden. The higher the
amount of referenced objects, the slower the scavenge GC. Studies have, however,
shown that most Java objects live for a short time. Since most objects live for a
short time, one can typically create large Edens.
Referenced objects in the survivor space bounce between the two survivor spaces
at each scavenge GC, until it either becomes unreferenced or the number of
bounces have reached the tenuring threshold. If the tenuring threshold is reached,
that object is migrated up to the old heap.
When the old heap fills up, the JVM issues a Full GC or major collection. In a Full
GC, the JVM has to first identify all the referenced objects. When that is done, the
JVM sweeps the entire heap to reclaim all free memory (for example, because the
object is now dead). Finally, the JVM then moves referenced objects to defragment
the old heap. The efficiency of the Full GC is dependent on the amount of
referenced objects and the size of the heap.
The HotSpot JVM sets aside an area, called permanent generation, to store the
JVM's reflective data such as class and method objects.
HotSpot JVM Garbage Collection Tools
If you want to analyze the Garbage Collection (GC) logs, use some of the tools
described in the following table:
Tool Name For Additional information, Refer To
GCViewer http://www.tagtraum.com/gcviewer.html
Performance Management 65
Page 72

Tool Name For Additional information, Refer To
IBM Pattern Modeling
and Analysis Tool for
Java Garbage
Collector
visualgc http://java.sun.com/performance/jvmstat/visualgc.html
HPjmeter https://h20392.www2.hp.com/portal/swdepot/
http://www-01.ibm.com/support/docview.wss?uid=swg27015310
Note: Visaulgc can be tied to running JVM processes at any time.
It is helpful if you have not enabled the GC flags, but want to take
a look at the heaps and GC overheads, and you do not want to
restart your JVM.
displayProductInfo.do?productNumber=HPJMETER
HotSpot JVM Startup and Runtime Performance Optimization
In some cases, an application's startup performance is more important than its
runtime performance. Applications that start once and run for a longer period
should be optimized for runtime performance. By default, HotSpot JVMs are
optimized for startup performance.
The Java Just-In-Time (JIT) compiler impacts the startup and runtime performance.
The time taken to compile a class method and start the server are influenced by
the initial optimization level used by the compiler. You can reduce the application
startup times by reducing the initial optimization level. This degrades your
runtime performance because the class methods will now compile at the lower
optimization level.
It is not easy to provide a specific runtime performance impact statement, because
compilers may recompile the class methods based on the impression that
recompiling provides better performance. Short-running applications will have
their methods recompiled more often than long-running applications.
HotSpot JVM Default Parameters
The following tuning options are configured and shipped out-of-the-box in Sterling
B2B Integrator on HotSpot JVMs in Windows, Solaris, and HP-UX.
The options, -d32 and –d64 are added to the Java launcher to specify if the
program should be run in a 32-bit or a 64-bit environment. On Solaris, they
correspond to the ILP32 and LP64 data models. Since Solaris contains both 32-bit
and 64-bit J2SE implementation within the same Java installation, you can specify
either version. If neither –d32 nor –d64 is specified, it will run in 32-bit
environment by default. Java commands such as javac, javadoc, and so on may
rarely need to be run in a 64-bit environment. However, it may be required to pass
the -d32 or –d64 options to these commands and then to the Java launcher using –J
prefix option, for example, -J-d64. For other platforms such as Windows and Linux,
32-bit and 64-bit installation packages are separate. If you have installed both
32-bit 64-bit packages on a system, you can select either one of them by adding the
appropriate bin directory to the path.
Sterling B2B Integrator 5.2 supports 64-bit architecture on most operating systems.
The –d64 option is the default value on Windows Server 2008, Solaris, and HP-UX
for both noapp JVM and container JVM. However, on Windows Server 2003, the
–d32 option is default as it uses a 32-bit JDK.
66 Sterling B2B Integrator: Performance Management
Page 73

Parameter / Description Default Value
-server
HotSpot-based JVMs generally use
low optimization levels, which
For both noapp and container JVMs:
v Solaris = -server (optimizing compiler)
v HP-UX = -server (optimizing compiler)
takes less time to start up, but leads
to low runtime performance.
Normally, a simple JIT compiler is
used. To increase the runtime
performance for applications such
as Sterling B2B Integrator, an
optimizing compiler is
recommended. Using this method
may, however, lead a JVM to take
longer time to warm up.
-Xmx
Refer to “Edit Performance Configuration Settings”
on page 123 for the default values for the:
If this parameter is tuned correctly,
it can:
v Reduce the overhead associated
with the garbage collection and
the risk of encountering an
v Maximum heap size for the server JVM
(MAX_HEAP)
v Maximum heap size for the container JVM
(MAX_HEAP_CONTAINER)
Out-Of-Memory (OOM)
condition
v Improve the server response time
and throughput
If you see a large number of
garbage collections, try increasing
the value. You can set a maximum
heap limit of 4 GB for a 32-bit JVM.
However, due to various
constraints such as available swap,
kernel address space usage,
memory fragmentation, and VM
overhead, it is recommended to set
a lower value. In 32-bit Windows
systems, the maximum heap size
can be set in the range from 1.4 GB
to 1.6 GB. Similarly, on 32-bit
Solaris kernels, the address space is
limited to 2 GB. The maximum
heap size can be higher if your
64-bit operating system is running
32-bit JVM, reaching until 4 GB on
Solaris systems. Java SE 6 does not
support Windows /3GB boot.ini
feature. If you require a large heap
setting, you should use a 64-bit
JVM on an operating system
supporting 64-bit applications.
Performance Management 67
Page 74

Parameter / Description Default Value
-XX:+DisableExplicitGC
Disables the explicit garbage
collection calls that are caused by
invoking System.gc() inside the
application.
It is recommended that the
developers avoid the System.gc()
calls to cause programmer-initiated,
full-compaction garbage collection
cycles, because such calls can
interfere with the tuning of
resources and garbage collection for
the entire application system. If
your application pause times
caused by System.gc() are more
than your expected pause times, it
is strongly recommended that you
use this option to disable the
explicit GC, so that the System.gc()
calls will be ignored.
-XX:NewSize= and -Xmn<Size>=
–XX:NewSize controls the
minimum young generation size in
a heap, and the –Xmn sets the size
of the young generation heap.
It is recommended to use the
following formula to compute XX:NewSize and -Xmn values
when the minimum heap size and
maximum heap sizes are modified.
v -XX:NewSize = (0.33333* value of
–Xms)
v -Xmn = (0.33333 * value of -Xmx)
-XX:MaxPermSize
Stores all the class code and
class-like data. The value of the
parameter should be large enough
to fit all the classes that are
concurrently loaded. Sometimes, it
is difficult to determine the actual
value of this parameter because
generally, this region is smaller and
expands slowly, and the utilization
is commonly observed at 99-100
percent of its current capacity. If
you have not configured this region
correctly, the JVM might fail with
the Java.lang.OutOfMemoryError:
PermGen space error.
For both 32-bit/64-bit noapp and container JVMs:
v Windows = -XX:+DisableExplicitGC
v Solaris = -XX:+DisableExplicitGC
v HP-UX = -XX:+DisableExplicitGC
Refer to “Edit Performance Configuration Settings”
on page 123 for the default values for the:
v Initial new heap size for the server JVM
(INIT_AGE)
v Initial new heap size for the container JVM
(INIT_AGE_CONTAINER)
v Maximum new heap size for the server JVM
(MAX_AGE)
v Maximum new heap size for the container JVM
(MAX_AGE_CONTAINER)
Refer to “Edit Performance Configuration Settings”
on page 123 for the default values for the:
v Maximum permanent generation heap size for the
server JVM (MAX_PERM_SIZE)
v Maximum permanent generation heap size for the
container JVM (MAX_PERM_SIZE_CONTAINER)
68 Sterling B2B Integrator: Performance Management
Page 75

Parameter / Description Default Value
-Xss
Determines the stack size for each
thread in the JVM.
Every thread in a JVM gets a stack,
and this value determines the
number of threads you can start in
a JVM. If this value is too large,
you might run into an OOM. Each
time a method is invoked, a stack
frame is created and pushed into
the thread stack. At a minimum, a
stack frame contains a method's
local variables and arguments. If a
thread's actual stack size reaches
beyond this limit, you will get a
java.lang.StackOverflowError
exception.
-XX:CompileThreshold
Determines the number of method
invocations and branches before
compiling.
Setting a low value for this
parameter will trigger the
compilations of hot methods
sooner.
-Xnocatch
Refer to “Edit Performance Configuration Settings”
on page 123 for the default values for the:
v Maximum Java stack size for any thread for the
server JVM (STATIC_STACK)
v Maximum Java stack size for any thread for the
container JVM (STATIC_STACK_CONTAINER)
For both 32-bit/64-bit noapp and container JVMs:
v Windows = -XX:CompileThreshold=1000
v Solaris = -XX:CompileThreshold=1000
For both noapp and container JVMs:
Disables the Java catch-all signal
handler. This option is used to get
clean, native code stack traces.
HP-UX = -Xnocatch
Display HotSpot Statistics for HP JVM
To display HotSpot Statistics for the HP JVM, enable one of the following options:
v -XX:+PrintGCDetails -XX:+PrintGCTimeStamps –Xloggc:<gcfilename>
-verbose:<gc>
This displays the following:
11.010: [GC [PSYoungGen: 196608K->20360K(229376K)] 196608K>20360K(753664K), 0.0514144 secs] 13.987: [GC [PSYoungGen:
216968K->32746K(229376K)] 216968K->48812K(753664K), 0.1052434 secs]
v -Xverbosegc [:help] | [0 | 1] [:file = [stdout | stderr | <filename>]]
This displays the following:
<GC: 1 4 11.988605 1 64 7 201326592 64 201326592 0 20850824 33554432 0 0
536870912 15563792 15563792 21757952 0.040957 0.040957 > <GC: 1 4
13.400027 2 864 7 201326592 864 201326592 20850824 33539216 33554432 0
16479936 536870912 17504224 17504224 21757952 0.088071 0.088071 >
Display HotSpot Statistics for Sun JVM
To display HotSpot Statistics for the Sun JVM, enable the following option:
-XX:+PrintGCDetails -XX:+PrintGCTimeStamp –Xloggc:<gcfilename>
Performance Management 69
Page 76

This displays the following:
0.000: [GC 0.001: [DefNew: 32192K->511K(33152K), 0.0383176 secs]
32192K->511K(101440K), 0.0385223 secs] 1.109: [GC 1.110: [DefNew:
32703K->198K(33152K), 0.0344874 secs] 32703K->697K(101440K), 0.0346844
secs]
Refer to the corresponding Sun documentation, which can be accessed from the
following Web site:
http://java.sun.com/javase/technologies/hotspot/gc/gc_tuning_6.html
HotSpot JVM Heap Monitoring
You may want to monitor the following items in a healthy heap:
v During steady state, you should mostly see minor Garbage Collections (GC)
and an occasional full GC caused by allocation failures.
v The sum of the GC times should not exceed 3 percent of the measurement
interval. For example, in a 1-hour measurement interval, the time taken for all
the GCs should not be more than 108 seconds.
v The JVM will choose to perform a full GC when it realizes that the live objects
in the Eden and Survivor spaces cannot fit in the old generation. The JVM then
tries to free up the space in the old generation by performing a full GC. The full
GC pauses the application. The amount of pause time depends on the GC
algorithm you are using (Sterling B2B Integrator uses the default JVM GC
algorithm, that is, Parallel GC algorithm on 1.6 JDK on server class machines),
and the size of the heap. The JVM will choose to perform a full GC when it
realizes that the live objects in the Eden and Survivor spaces will not fit into the
old generation. In an attempt to free up the space in the old generation, the JVM
will perform a full GC, which pauses the application. The amount of pause time
depends on:
– Type of GC algorithm currently in use. Sterling B2B Integrator uses the
default JVM GC algorithm, that is, Parallel GC algorithm, on 1.6 JDK on
server class machines.
– Size of the heap. Too many full GCs have a negative effect on performance.
If you observe many full GCs, try to determine if your old generation is sized
too small to hold all the live objects collected from the Survivor and Eden
spaces. Alternatively, there may be too many live objects that do not fit into the
configured heap size. If it is the latter, increase the overall heap size.
v If you are monitoring the heap and notice an increase in the number of live
objects, and see that the GC is not able to clear these objects from the heap, you
might run into an Out-Of-Memory (OOM) condition, and there may be a
possible memory leak. In such a situation, take a heap dump at various intervals
and analyze the dump for the leak suspect.
HotSpot JVM Thread Monitoring
Monitoring JVM threads will help you locate thread deadlocks if there are blocked
threads in a Java code or in SQL. It also helps you to understand which part of the
code the threads are blocked in a hung application or running application.
Following is an example of a thread dump:
"Thread-817" daemon prio=10 tid=0x00b9c800 nid=0x667 in Object.wait() [0xa4d8f000..0xa4d8faf0]
at java.lang.Object.wait(Native Method)
- waiting on <0xf678a600> (a EDU.oswego.cs.dl.util.concurrent.LinkedNode)
at EDU.oswego.cs.dl.util.concurrent.SynchronousChannel.poll(SynchronousChannel.java:353)
- locked <0xf678a600> (a EDU.oswego.cs.dl.util.concurrent.LinkedNode)
at EDU.oswego.cs.dl.util.concurrent.PooledExecutor.getTask(PooledExecutor.java:707)
70 Sterling B2B Integrator: Performance Management
Page 77

at EDU.oswego.cs.dl.util.concurrent.PooledExecutor$Worker.run(PooledExecutor.java:731)
at java.lang.Thread.run(Thread.java:595)
"Low Memory Detector" daemon prio=10 tid=0x001e64e8 nid=0x19 runnable [0x00000000..0x00000000]
"CompilerThread1" daemon prio=10 tid=0x001e5388 nid=0x18 waiting on condition [0x00000000..0xb72fed2c]
"CompilerThread0" daemon prio=10 tid=0x001e4510 nid=0x17 waiting on condition [0x00000000..0xb73febac]
"AdapterThread" daemon prio=10 tid=0x001e3698 nid=0x16 waiting on condition [0x00000000..0x00000000]
"Signal Dispatcher" daemon prio=10 tid=0x001e2928 nid=0x15 waiting on condition [0x00000000..0x00000000]
"Finalizer" daemon prio=10 tid=0x001d6078 nid=0x14 in Object.wait() [0xfdf6f000..0xfdf6fa70]
at java.lang.Object.wait(Native Method)
at java.lang.ref.ReferenceQueue.remove(ReferenceQueue.java:116)
- locked <0xc9e89940> (a java.lang.ref.ReferenceQueue$Lock)
at java.lang.ref.ReferenceQueue.remove(ReferenceQueue.java:132)
at java.lang.ref.Finalizer$FinalizerThread.run(Finalizer.java:159)
"Reference Handler" daemon prio=10 tid=0x001d5b20 nid=0x13 in Object.wait() [0xfe04f000..0xfe04f8f0]
at java.lang.Object.wait(Native Method)
at java.lang.Object.wait(Object.java:474)
at java.lang.ref.Reference$ReferenceHandler.run(Reference.java:116)
- locked <0xc9e90860> (a java.lang.ref.Reference$Lock)
"VM Thread" prio=10 tid=0x001d3a40 nid=0x12 runnable
"GC task thread#0 (ParallelGC)" prio=10 tid=0x000d8608 nid=0x2 runnable
The output consists of a header and a stack trace for each thread. Each thread is
separated by an empty line. The Java threads (threads that are capable of executing
Java language code) are printed first. These are followed by information on VM
internal threads.
The header line contains the following information about the thread:
v Thread Name indicates if the thread is a daemon thread
v Thread Priority (Prio)
v Thread ID (TID) is the address of a thread structure in memory
v ID of the native thread (NID)
v Thread State indicates what the thread was doing at the time of the thread
dump
v Address range gives an estimate of the valid stack region for the thread
The following table lists the possible thread states that can be printed:
Thread State Definition
NEW The thread has not yet started.
RUNNABLE The thread is executing in the JVM.
BLOCKED The thread is blocked, waiting for a monitor lock.
WAITING The thread is waiting indefinitely for another thread to perform
a particular action.
TIMED_WAITING The thread is waiting for another thread to perform an action
for up to a specified waiting time.
TERMINATED The thread has exited.
Note: The thread header is followed by the thread stack.
Performing a Thread Dump
About this task
To perform a thread dump in UNIX (Solaris and HP-UX):
Performance Management 71
Page 78

Procedure
1. From the Administration menu, select Operations > System > Performance >
JVM Monitor.
2. In the JVM MONITOR page, under Thread Dump, next to Take Thread Dump,
click Go!. The Thread Dump pop-up window is displayed.
3. To see the latest Dumps in the View Dumps list, click Go! in the Thread Dump
pop-up window.
4. Close the Thread Dump pop-up window.
5. Under View Dumps, select the Name of the thread dump file and click Go! to
view it. The Download Dumps pop-up window is displayed.
6. Click the Dumps download link.
7. Open or save the file.
8. Close the Download Dumps pop-up window.
What to do next
For Windows, if you have started Sterling B2B Integrator as a Windows service,
use the stacktrace tool to take a thread dump. Follow the same procedure to
perform a thread dump for container JVMs.
For more information, refer to the following Web site: http://www.adaptj.com/
main/stacktrace.
You can use VisualVM in remote mode to take a thread dump on Windows when
you start Sterling B2B Integrator noapp or container in service mode.
Refer to the corresponding VisualVM documentation for information about remote
monitoring of JVM, which is available in the following Web site:
https://visualvm.dev.java.net/
HotSpot Thread Dump Analysis Tools
Following is a list of tools that can be used to analyze thread dumps:
v Thread Dump Analyzer (TDA): (Refer to https://tda.dev.java.net/)
Note: In order to use TDA, you must strip off any starting “< “ symbols in the
thread dump if you are using Sterling B2B Integrator UI to take thread dumps.
v You can also use VisualVM for live monitoring of threads in JVM. (Refer to
https://visualvm.dev.java.net/)
HotSpot JVM DeadLock Detection
In addition to the thread stacks, the Ctrl+Break handler executes a deadlock
detection algorithm. If any deadlocks are detected, it prints additional information
after the thread dump on each deadlocked thread.
Found one Java-level deadlock:
=============================
"Thread2":
waiting to lock monitor 0x000af330 (object 0xf819a938, a java.lang.String),
which is held by "Thread1"
"Thread1":
waiting to lock monitor 0x000af398 (object 0xf819a970, a java.lang.String),
which is held by "Thread2"
Java stack information for the threads listed above:
===================================================
"Thread2":
72 Sterling B2B Integrator: Performance Management
Page 79

at Deadlock$DeadlockMakerThread.run(Deadlock.java:32)
- waiting to lock <0xf819a938> (a java.lang.String)
"Thread1":
Found 1 deadlock.
- locked <0xf819a970> (a java.lang.String)
at Deadlock$DeadlockMakerThread.run(Deadlock.java:32)
- waiting to lock <0xf819a970> (a java.lang.String)
- locked <0xf819a938> (a java.lang.String)
If the Java VM flag -XX:+PrintConcurrentLocks is set, Ctrl+Break will also print
the list of concurrent locks owned by each thread.
HotSpot JVM Blocked Thread Detection
Look for threads that are blocked. Threads might be waiting on SQL or might be
serialized on a synchronized block. If you see threads that are blocked they are
waiting on another thread to complete, it means that you are serializing on some
part of code.
HotSpot JVM Troubleshooting Tips
Java.lang.OutOfMemory errors occur when either the Java heap or the native heap
run out of space. These exceptions may indicate that the number of live objects in
the JVM require more memory than what is available (which can be adjusted by
tuning the heap), or that there is a memory leak (which may indicate a problem
with an application component, the JVM, or the OS). There are many variants of
this error, with each variant having its own cause and resolution.
Generally, java.lang.OutOfMemory (OOM) indicates that insufficient space has
been allocated for a requested object in the heap, or in a particular area of the
heap, even after a garbage collection is attempted. An OutOfMemory exception
does not always indicate a memory leak. It could indicate that the heap parameters
are not configured properly for an application or that the bug is complex, with you
having to troubleshoot different layers of native code.
When an OOM error is from the native code, it is difficult to tell whether it is from
Java heap exhaustion or native heap exhaustion because of low space. The first
step in diagnosing an OOM is identifying whether the Java heap is full or the
native heap is full.
Exception in thread “main” java.lang.OutOfMemoryError
This error condition might be due to a simple configuration issue. It might be that
the –Xms value configured for this type of application is throwing the error. This
error generally occurs when object allocation fails even after a Garbage Collection
(GC).
This error condition may be because of a memory leak, in which case, the object
references are held by the application even if they are no longer needed. Over a
period of time, this unintentional object growth increases and causes this OOM.
This type of OOM error can also be seen in applications in which excessive
finalizer calls are made. In such applications, where the finalizer call is made, the
GCs cannot reclaim the object space. Instead, they are queued for finalization to
occur, which might happen some time later. In a Sun implementation, the finalizer
call is made by a separate daemon thread. If there are excessive finalize calls, the
finalization thread cannot keep up with the load, and eventually, the heap might
become full and an OOM might occur. For example, applications that create
high-priority threads that cause the finalization to increase at a rate that is faster
Performance Management 73
Page 80

than the rate the finalization thread can process, may generate this error.
Exception in thread “main” java.lang.OutOfMemoryError: PermGen
space
This error is seen when permanent generation is full. Permanent generation is the
area in which the class and method objects are stored. For an application that loads
a large number of classes, the value of –XX:MaxPermSize should be sized
accordingly. Permanent generation also gets used when the java.lang.String intern()
method is invoked on an object of class java.lang.String. Exhaustion of the
permanent generation area may occur if an application interns a large number of
strings.
Generally, java.lang.String maintains the string pool, and when an interned method
is called on a string, it first verifies that an equal string is already present in the
pool. If an equal string exists, java.lang.String returns the canonical representation
of the string, which points to the same class instance; otherwise, java.lang.String
adds the string to the pool.
Exception in thread “main” java.lang.OutOfMemoryError: Requested
array size exceeds VM limit
This error occurs when the application requests the JVM to allocate an array that is
larger than the heap size. For example, if the application requests an allocation of
512 MB array and your heap size is only 256 MB, this error will be seen. This error
may occur because of a low –Xms value, or a bug in the application in which it is
trying to create a huge array.
Exception in thread “main” java.lang.OutOfMemoryError: request
<size> bytes for <reason>. Out of swap space?
Although the error is an OOM condition, the underlying cause is that the JVM
failed to allocate the requested size from the native heap, and the native heap is
close to exhaustion.
The <size> in the error message is the size that failed to allocate. The <reason> is
the name of the source module reporting failure. In a few cases, the actual reason
is printed.
In order to troubleshoot this error, use the OS utilities to find the actual cause. One
possible cause is that the OS has been configured with insufficient swap space.
Another possible cause is that other processes in the machine are consuming all the
memory, or possibly a native leak, in which the application or the library code is
continuously allocating memory, and the OS is not releasing it.
Exception in thread "main" java.lang.OutOfMemoryError: <reason>
<stack trace>(Native method):
If you see this OOM, it means that the native method encountered an allocation
failure. The main difference between this error and the Exception in thread
“main” java.lang.OutOfMemoryError: request <size> bytes for <reason>. Out
of swap space? error is that the allocation failure in this case occurred in the
JNInative method rather than the JVM code. In order to troubleshoot this error, use
the OS utilities to find the actual cause.
74 Sterling B2B Integrator: Performance Management
Page 81

A Crash, Instead of an OutOfMemoryError
In rare cases, you may have a JVM crash instead of OOM because of the allocation
from the native heap failing because the native code that does not check for errors
returns memory allocation functions. For example, this may occur if the native
code malloc returns NULL (no memory available), and if the native code is not
checking for that error, and references the invalid memory location. If the diagnosis
of this failure results in native code not checking for errors because of memory
allocation failures, the reasons for memory allocation failures should be examined.
The failures may be due to reasons such as insufficient swap space, some other
processes consuming all the memory, or a native leak.
Hung Processes or Looping Processes
Generally, the most common reasons for a hang to occur are deadlocks in
application code, API code, library code, or a bug in the HotSpot VM. However, in
a few cases, the hang might be because of a JVM consuming all the available CPU
cycles, most likely because of a bug, which in turn causes one or more threads to
go into an infinite loop.
If a hang is seen, determine whether the JVM is idle or consuming all the CPU
cycles. You can use the OS utilities to determine the CPU utilization. If you
conclude that the hang process is using the entire CPU, the hang might be because
of a looping thread. On the other hand, if the process is idle, it is most likely
because of deadlock. On Solaris, for example, prstat -L -p <pid> can be used to
report the statistics for all the LWPs in the target process. This will identify the
threads that are consuming a lot of CPU cycles.
Diagnosing a Looping Process
If your observations on CPU utilization indicate that the process is looping, take a
thread dump, and from the thread dump and stack trace, you should be able to
gather information about where and why the thread is looping.
In the thread dump, look for the runnable threads. You will in all probability find
the threads that are looping. In order to be certain about the threads that are
looping, take multiple thread dumps to see if the thread remains busy.
Diagnosing a Hung Process
If you have determined that a process is hanging, and not looping, the cause is
likely to be an application (thread) deadlock.
Take a thread dump and analyze it to find the deadlocked threads.
When you take a thread dump on a HotSpot JVM, the deadlock detection
algorithm is also executed and the deadlock information in the thread dump
printed.
Following is an example of some deadlock output from a document. For more
information, refer to the Java Troubleshooting and Diagnostic Guide.
Found one Java-level deadlock:
=============================
"AWT-EventQueue-0": waiting to lock monitor 0x000ffbf8 (object 0xf0c30560, a
java.awt.Component$AWTTreeLock),
which is held by "main"
"main":
Performance Management 75
Page 82

waiting to lock monitor 0x000ffe38 (object 0xf0c41ec8, a java.util.Vector),
which is held by "AWT-EventQueue-0"
Java stack information for the threads listed above:
===================================================
"AWT-EventQueue-0":
at java.awt.Container.removeNotify(Container.java:2503)
- waiting to lock <0xf0c30560> (a java.awt.Component$AWTTreeLock)
at java.awt.Window$1DisposeAction.run(Window.java:604)
at java.awt.Window.doDispose(Window.java:617)
at java.awt.Dialog.doDispose(Dialog.java:625)
at java.awt.Window.dispose(Window.java:574)
at java.awt.Window.disposeImpl(Window.java:584)
at java.awt.Window$1DisposeAction.run(Window.java:598)
- locked <0xf0c41ec8> (a java.util.Vector)
at java.awt.Window.doDispose(Window.java:617)
at java.awt.Window.dispose(Window.java:574)
at
javax.swing.SwingUtilities$SharedOwnerFrame.dispose(SwingUtilities.java:1743)
at
javax.swing.SwingUtilities$SharedOwnerFrame.windowClosed(SwingUtilities.java:172
2)
at java.awt.Window.processWindowEvent(Window.java:1173)
at javax.swing.JDialog.processWindowEvent(JDialog.java:407)
at java.awt.Window.processEvent(Window.java:1128)
102
at java.awt.Component.dispatchEventImpl(Component.java:3922)
at java.awt.Container.dispatchEventImpl(Container.java:2009)
at java.awt.Window.dispatchEventImpl(Window.java:1746)
at java.awt.Component.dispatchEvent(Component.java:3770)
at java.awt.EventQueue.dispatchEvent(EventQueue.java:463)
at
java.awt.EventDispatchThread.pumpOneEventForHierarchy(EventDispatchThread.java:2
14)
at
java.awt.EventDispatchThread.pumpEventsForHierarchy(EventDispatchThread.java:163
)
at java.awt.EventDispatchThread.pumpEvents(EventDispatchThread.java:157)
at java.awt.EventDispatchThread.pumpEvents(EventDispatchThread.java:149)
at java.awt.EventDispatchThread.run(EventDispatchThread.java:110)
"main":
at java.awt.Window.getOwnedWindows(Window.java:844)
- waiting to lock <0xf0c41ec8> (a java.util.Vector)
at
javax.swing.SwingUtilities$SharedOwnerFrame.installListeners(SwingUtilities.java
:1697)
at
javax.swing.SwingUtilities$SharedOwnerFrame.addNotify(SwingUtilities.java:1690)
at java.awt.Dialog.addNotify(Dialog.java:370)
- locked <0xf0c30560> (a java.awt.Component$AWTTreeLock)
at java.awt.Dialog.conditionalShow(Dialog.java:441)
- locked <0xf0c30560> (a java.awt.Component$AWTTreeLock)
at java.awt.Dialog.show(Dialog.java:499)
at java.awt.Component.show(Component.java:1287)
at java.awt.Component.setVisible(Component.java:1242)
at test01.main(test01.java:10)
Found 1 deadlock.
Note: In J2SE 6.0, the deadlock detection algorithm works only with the locks that
are obtained using the synchronized keyword. This means that deadlocks that arise
through the use of the java.util.concurrency package are not detected.
In the deadlock output, you can see that the thread main is the locking object
<0xf0c30560>, and is waiting to enter <0xf0c41ec8>, which is locked by the thread
“AWT-EventQueue-0”. However, the thread “AWT-EventQueue-0” is also waiting
to enter <0xf0c30560>, which is in turn locked by “main”.
76 Sterling B2B Integrator: Performance Management
Page 83

Stack Overflow
This error generally occurs when the stack space is exhausted in a JVM. Generally,
this occurs because of:
v A deeply nested application
v An infinite loop within an application
v A problem in the Just-In-Time (JIT) compiled code
Not all instances of this error should be considered as programming errors. In the
context of some applications, you may require a greater value for the stack size
(-Xss), for example, applications having intensive graphics might require more
stack size.
The stack overflow error can be either from the native code or because of an
infinite loop in the Java program.
To determine if the error is in the native code, review the stack trace. In most
cases, the information you get will be difficult to interpret. However, if the error is
due to an infinite loop, you can see the stack trace of the error. Verify whether
there are any recursive method calls, and whether they are deep. If it does not
appear to be an infinite loop, try increasing either the Java stack or the native stack
to resolve the issue.
Taking Heap Dumps and Profiling JVM Using Hprof
A JVM's HPROF can be used get information about CPU usage and heap allocation
statistics, and to monitor contention profiles. You can also get complete heap
dumps and the states of all the monitors and threads in the JVM.
In Sterling B2B Integrator, HPROF can be invoked by adding the following option
as a JVM parameter by using the Sterling B2B Integrator tuning wizard and adding
the below option to the JVM argument suffix option for both noapp and container.
For more details, please refer to “Edit Performance Configuration Settings” on
page 123. Run the setupfiles.sh command (UNX/Linux) or the setupfiles.cmd
command (Windows) and restart ASI and container JVMs.
-agentlib:hprof[=options]
Or
-Xrunhprof[:options]
For more information about how to use HPROF on Sun JVM, refer to the following
Web site:
http://java.sun.com/developer/technicalArticles/Programming/HPROF.html
For more information about how to use HPROF HP JVM, refer to the following
Web site:
http://bizsupport2.austin.hp.com/bc/docs/support/SupportManual/c02697864/
c02697864.pdf
On HP JVM, you can also use –Xeprof to collect profiling data for performance
tuning. For information about –Xeprof, refer to the following Web site:
Performance Management 77
Page 84

http://bizsupport2.austin.hp.com/bc/docs/support/SupportManual/c02697864/
c02697864.pdf
In order to analyze the data using -agentlib:hprof and –Xeprof, you can use
HPJmeter. For more information about this tool, refer to the following Web site:
http://www.hp.com/go/hpjmeter
Introduction to the IBM®JVM Performance and Tuning Guidelines
The IBM®Java™Virtual Machine (JVM) contains a number of private and
proprietary technologies that distinguish it from other implementations of JVM.
For instance, the IBM JVM uses mixed-mode interpretation (MMI). When the MMI
detects that bytecodes have been interpreted multiple times, it invokes a
just-in-time (JIT) compiler to compile those bytecodes to native instructions. Due to
the significant performance benefits, the JIT and MMI are enabled by default. The
JVM performance degrades considerably when JIT is disabled. For more
information about the JIT compiler and MMI, refer to the IBM JDK 6.0: Java
Diagnostics Guide.
Refer to the Sterling B2B Integrator System Requirements documentation for the
supported operating system and JVM combination.
This topic describes the processes involved in tuning, monitoring, and performing
basic troubleshooting when deploying the Sterling B2B Integrator using the IBM
JVM.
For information about using the tuning wizard to set the IBM JVM parameters, see
“Edit Performance Configuration Settings” on page 123.
Before You Begin Tuning Your IBM®JVM
Using the Performance Tuning Utility, Sterling B2B Integrator calculates the
recommended settings based on the number of cores and the amount of physical
memory that is being made available to Sterling B2B Integrator.
The resulting performance properties are stored in the tuning.properties file in the
install_dir/properties directory. The formulae used to calculate these setting can be
found in the tuningFormulas.properties file in the install_dir/properties directory.
The calculated values should be used as a guideline. Further tuning may be
necessary to attain a well-tuned system. If you are still unable to attain a
well-tuned system, you may want to engage IBM Professional Services. Contact
your Sales Representative for more information about this.
IBM®JVM Default Parameters for Sterling B2B Integrator
The follow table provides the IBM®JVM parameters and the default values you
should use when configuring the system.
Note: For information about using the tuning wizard to set the IBM JVM
parameters, see “Edit Performance Configuration Settings” on page 123.
78 Sterling B2B Integrator: Performance Management
Page 85

Parameter Description
-Xmns
-Xmnx
-Xjit:count
-Xgcpolicy:gencon Controls the behavior of the Garbage Collector. They make
v Controls the initial size of the new area to the specified value
when using -Xgcpolicy:gencon.
v Corresponds to the JVM short-lived memory (min) value
It is recommended to use the following formula to compute –Xmns
value when the minimum heap size is modified.
-Xmns = (0.33333 * value of -Xms)
v Controls the maximum size of the new area to the specified
value when using -Xgcpolicy:gencon
v Corresponds to the JVM short-lived memory (max) value
It is recommended to use the following formula to compute –Xmnx
value when the maximum heap size is modified.
-Xmnx = (0.33333 * value of -Xmx)
v Controls the compilation threshold of the JIT compiler
v Value given to count causes the Java method to be compiled
after n runs
For 64-bit noapp JVM and 64-bit container JVM:
v Default Value for Linux: 1000
v Default Value For AIX: 1000
trade-offs between the throughput of the application and the
overall system, and the pause times that are caused by garbage
collection. By specifying the gencon value, the GC policy requests
the combined use of concurrent and generational GC to help
minimize the time that is spent in any garbage collection pause.
IBM®JVM Troubleshooting Tips
This topic describes the various issues that may arise when using the IBM®JVM
and the troubleshooting tip pertaining to each of these errors.
OutOfMemoryError Exceptions and Memory Leaks
OutOfMemoryError exceptions occur when either the Java heap or the native heap
run out of space. These exceptions indicate that there is either a memory leak or
that the number of live objects in the JVM require more memory than is available.
The first step to troubleshooting an OutOfMemoryError exception is to determine
whether the error is caused because of lack of space in either the Java heap or the
native heap. When the OutOfMemoryError is caused because of lack of space in
the native heap, an error message is displayed with an explanation about the
allocation failure. If an error is not present, the exception is likely to have occurred
because of lack of space in the Java heap. In the latter scenario monitor the Java
heap by using the Verbose GC output.
The Java heap is consumed when the Garbage Collector is unable to compact or
free the objects being referenced. Objects that are no longer referenced by other
objects, or are referenced from the thread stacks, can be freed by performing the
garbage collection task. As the number of referenced objects increases, garbage
collection will take place more frequently. With each garbage collection instance,
Performance Management 79
Page 86

less memory will be freed. If this trend continues, the Garbage Collector will not
be able to free enough objects to allocate new objects. When this happens, the heap
will be near 100% utilized and the JVM will fail with an OutOfMemoryError
exception.
Increasing the size of the Java heap may resolve an OutOfMemoryError exception.
However, if the exception is due to a memory leak, increasing the heap size will
not resolve this issue. In this case, further troubleshooting, including analyzing the
contents of the heap using heap dump analysis or a tool such as JProbe®or
OptimizeIt™is necessary. Refer to the IBM 6.0: Java Diagnostics Guide for more
information about heap dump analysis.
The Application Hangs
The application hangs when either a deadlock occurs or a loop is encountered. A
potential deadlock scenario is one in which multiple threads in the JVM are
blocked and are waiting on the same object resource. Another situation that may
result in a deadlock is when there is a missed notification between threads because
of a timing error. Similarly, a loop may be encountered if there is a missed flag,
which in turn may terminate the loop. A loop can also be encountered if the wrong
limit has been set for the loop iterator. In either of these cases, the thread will fail
to exit in a timely manner.
The recommended approach is to trigger a thread dump and interpret it. The
thread dump provides all the information pertaining to the object resources in the
JVM. A thread dump can be triggered to take a snapshot of all the information
related to the JVM and a Java application at a particular point during execution.
The information that is captured includes the OS level, hardware architecture,
threads, stacks, locks, monitors, and memory.
By default, thread dumps are enabled. A thread dump is triggered when the JVM
is terminated unexpectedly, an OutOfMemoryError is encountered, or when a user
sends specific signals to the JVM. Sterling B2B Integrator also enables users to
trigger a thread dump through the Sterling B2B Integrator UI.
Trigger Thread Dump
To trigger a thread dump for the ASI JVM:
1. From the Administration menu, select Operations > System > Performance >
JVM monitor.
2. In the JVM MONITOR page, under Thread Dump, next to Take Thread
Dump, click Go!.
The Thread Dump Taken page is displayed. It may take some time to generate
the thread dump. During this time you may not be able to access other pages.
If heap dumps are enabled, the delay will be longer before the process is
completed.
3. Click Go! in the Thread Dump pop-up window to have the thread dumps
populated on the JVM MONITOR page.
4. Close the Thread Dump Taken pop-up window.
5. To view the dump, in the JVM MONITOR page, under View Dumps, select the
dump file, and click Go!.
6. In the Dumps download pop-up window, click the Download link to
download the file to the local machine.
80 Sterling B2B Integrator: Performance Management
Page 87

The thread dump can also be found on the host machine in the
install_dir/noapp/bin directory. After the download is complete, close the Dumps
download pop-up window.
To trigger a thread dump for the container JVM:
1. Change your working directory to install_dir.
2. In the command line, enter ps -ef | grep <container_name>.
This lists the container Java process id.
3. Enter kill -3 <pid>.
The thread dump is placed in the install_dir/noapp/bin directory for your
analysis.
Because thread dumps are created in a text format, they do not require any
software to make them human readable. A thread dump is broken into sections.
Following is a brief description of each thread dump tag:
Thread Dump Tag Description
TITLE Basic information about the event that caused the thread dump,
along with the timestamp and the generated name.
GPINFO Contains general information about the operating system. General
Protection Fault (GPF) information is included in this section if the
failure was caused by a GPF.
ENVINFO Contains the JRE level and details about the environment and
command-line arguments that were used to launch the JVM
process.
MEMINFO Contains information about the Memory Manager, and free space,
current size of the heap and the garbage collection history data.
LOCKS Contains information about the locks and monitors being held by
each Java object.
THREADS Contains a complete list of threads that have not been stopped.
CLASSES Contains the class loader summaries, including the class loaders
and their relationships.
For more information about interpreting thread dump, refer to the IBM JDK 6.0:
Java Diagnostics Guide.
Heapdumps
Heapdumps are useful for troubleshooting memory-related issues since they
contain all the live objects used by the Java application. With this information, the
objects that are using large amounts of memory can be identified. The contents of a
heapdump can also help a user understand why objects cannot be freed by the
Garbage Collector.
By default, a heapdump is generated in a compressed binary format know as
Portable Heap Dump (PHD). Several tools are available to help analyze the dump.
IBM recommends the use of the Memory Dump Diagnostic for Java (MDD4J) when
performing the heapdump analysis. This tool can be downloaded from IBM
Support Assistant (http://www-01.ibm.com/software/support/isa/).
Performance Management 81
Page 88

Heapdumps are generated when the Java heap is exhausted by default. They can
also be configured so that they are generated when a user sends a specific signal to
the JVM.
To enable a heapdump, refer to the documentation on JVM parameters for the
server in “Edit Performance Configuration Settings” on page 123.
For more information about heapdumps, refer to the IBM JDK 6.0: Java Diagnostics
Guide.
Monitoring Operations
The Operations functions enable you to monitor the operational status of Sterling
B2B Integrator, its components and services, current threads and system logging,
and to troubleshoot system problems.
Managing System Logs
Sterling B2B Integrator comprises multiple components, including software
applications such as archive tools, Web servers, and database servers. To monitor
the activities of each component, Sterling B2B Integrator generates log files based
on the system's monitoring activity. These log files are one of the tools that enable
you to monitor the way the system operates.
Each operations server on a host has its own operations log file. Log files are
created in the logs directory of the installation directory. To prevent the system log
files from taking up excessive storage space and main memory, Sterling B2B
Integrator generates a log file only when a component runs. This in turn improves
the performance of Sterling B2B Integrator.
Each open log file is closed once every 24 hours (usually at midnight), and a new
file is created. When moving into or out of Daylight Savings Time (DST), you must
stop and restart both Sterling B2B Integrator and its database to ensure that log
files are created with the correct timestamp.
Log files are allowed to grow only up to a maximum size. If a log file reaches its
maximum size, it is closed and another file is created. There is a limit to the
number of log files that can exist simultaneously. If this limit is exceeded, the old
logs files are automatically deleted. If the Sterling B2B Integrator Dashboard
interface links to a deleted log file (which will display a blank page), click the link
to a newer log file.
Note: If you are working in a clustered environment, the log information that is
displayed is determined by the node you select from the Select Node list.
Naming Conventions
This section provides information about the naming conventions to be used in
Sterling B2B Integrator.
Use the following naming convention for a directory:
v UNIX - install_dir/logs/directory
v Windows - install-dir\logs\directory
In this convention:
v install_dir or install-dir refers to the name of the installation directory.
82 Sterling B2B Integrator: Performance Management
Page 89

v logs refers to the primary log directory.
v directory refers to the subdirectory created when you start Sterling B2B
Integrator.
All the old log files are moved to this subdirectory for archiving. The naming
convention to be used for the old log directory is logs_mmddyy_hhmmss.
Use the following naming convention for a log file:
name.log.Dyyyymmdd.Thhmmss_#
In this convention:
v name identifies the type of the log file.
v log refers to the file name extension, which indicates the file type.
v Dyyyymmdd refers to the date in the year, month, and day format. The D at the
beginning refers to Date.
v Thhmmss refers to the time in hours, minutes, and seconds format. The T at the
beginning refers to Time.
v _# is the increment of the log file. If you attempt to write a log file that already
exists, _# is appended to the log file name, allowing you to write a new file and
save the integrity of the existing file.
For example, if mylog.D20041101.T092022 exists, and you try to save a new log
file with the same name, the new file becomes mylog.D20041101.T092022_2,
where _2 indicates that it is the second log in a sequence using the same file
name.
Note: The date and time components in a naming convention may or may not be
present, depending on the type of the log. For example, the noapp.log does not
include date and time information, but ui.log.Dyyyymmdd.Thhmmss includes date
and time information.
Each time Sterling B2B Integrator is started, the log files created since the last time
it was started are archived in a time-stamped subdirectory. New log files, those
created subsequent to the most recent execution of Sterling B2B Integrator, are
written to the install_dir/logs directory.
Viewing Log File Contents
Users of Sterling B2B Integrator can view the contents of both current log files and
old log files.
Note:
v If you are working in a clustered environment, the log information that is
displayed is determined by the node you select from the Select Node list.
v The Sterling B2B Integrator interface displays only the last 2500 lines of a current
log file. To view the entire log, you must have read permission for the file
system on which Sterling B2B Integrator is installed. Open the log file in
read-only mode using a text editor.
To view the current log file contents in Sterling B2B Integrator:
1. From the Administration menu, select Operations > System > Logs.
2. Click the appropriate log file.
To view the old log file contents in Sterling B2B Integrator:
Performance Management 83
Page 90

1. In the install_dir/logs/log directory, locate the old log file that you want to
view.
2. Open the log file in read-only mode using a text editor.
Analyzing Log File Contents
The contents of a log file provide information about system activities and
problems. The format used for entries written to a log file is [YYYY-MM-DD
HH:MM:SS.ss] loglevel ‘message code' Scope.Subsystem.Name ‘information
string'
[2008-04-22 09:02:43.404] ERROR 000310160001 UTIL.FRAME_POOL.ERR_Pool [Pool] Could not create the initial objects for the pool gentranTPPool
[2008-04-22 09:02:43.405] ERROR 000000000000 GLOBAL_SCOPE [1208869363405] The driver manager could not obtain a database connection.
In this convention:
v YYYY-MM-DD refers to the date in year, month, day format.
v HH:MM:SS.ss refers to the time in hour, minutes, seconds, and hundredths of a
second format.
v loglevel indicates how much information is logged and the relative importance
of the message. A subsystem may log only a subset of these messages (as
defined in the subsystem.loglevel property of log.properties), discarding those
that have a severity that is lower (less severe) than the current log level set for
that subsystem.
Log Level Description
FATAL Collects fatal and critical error information.
ERRORDTL Collects only error conditions, with a detailed description of the
error.
ERROR Collects only error conditions such as exceptions and error
messages (including errors from the user interface).
WARN Collects non-fatal configuration messages.
SQLDEBUG Collects SQL statements that are being executed.
INFO Collects basic operational information.
TIMER Collects timing information.
COMMTRACE Collects communication trace information.
DEBUG Collects basic debugging statements including system state and
code paths.
VERBOSE Collects extra debugging statements (like XML information) that
describe and explain what is happening in the system.
ALL Collects information about all the conditions.
v message code describes the activity or problem, using the following format:
– The first four digits specify the scope (like Workflow, Ops, Util).
– The next digit specifies the log severity level (default conventions use 1 for
error or exception, 2 for debug messages, 3 for warnings, and 4 for
information or all messages.
– The next three digits specify the subsystem (like Workflow Queue or
Workflow Engine).
– The last four digits specify the error number.
v Scope.Subsystem.Name is a text description of the affected part of Sterling B2B
Integrator (such as WORKFLOW, OPS, or UTIL), the Sterling B2B Integrator
84 Sterling B2B Integrator: Performance Management
Page 91

subsystem (such as FRAME_POOL, NOAPP, or SERVER), and what occurred
(such as ERR_Pool or INFO_NamingException1).
v information string is a brief description of the activity that occurred.
Following is an example of this format:
[2006-05-30 11:06:55.661] ALL 000440020297
SERVICES.SERVICES_CONTROLLER.INFO_sdi_getName startup: loading HTTP_SEND_ADAPTER
This indicates that at 11:06:55.661 a.m. on May 30, 2006, Sterling B2B Integrator
was started, and attempted to load the HTTP Send adapter
(HTTP_SEND_ADAPTER). The message also provides information about:
v Scope (Services)
v The affected part of Sterling B2B Integrator (Services Controller)
v What occurred (INFO_sdi_getName)
v Error code (0297)
Changing Log Settings
Sterling B2B Integrator enables you to change the log settings globally and locally.
Changing Log Settings Globally
You can change log settings globally using the customer_overrides.properties file,
which prevents customized property file changes from being overridden by
updates or patches. You can change global settings in the log.properties file. For
more information about the customer_overrides.properties file, refer to Sterling B2B
Integrator Property Files documentation.
Note: The customer override property file is not a part of the initial Sterling B2B
Integrator installation. It must be created and named
customer_overrides.properties.
To change the property file settings using the customer_overrides.properties file,
perform the following tasks:
1. In the install_dir/properties directory, either create or locate the
customer_overrides.properties file.
2. Open the customer_overrides.properties file using a text editor.
3. Specify the settings for the global log properties described in the following
table. These properties are displayed in the following format:
logService.Property=Value
v logService identifies the log.properties file in the
customer_overrides.properties file.
v Property is the global property of the log.properties file that you want to set.
See the following table for a list of properties.
v Value is the property setting of the log.properties file.
Property Description
newloggers Specifies whether to allow new log files to be created when the
maximum log file size setting has been exceeded. Valid values:
v true – Allow new logs to be created (Default)
v false – Do not allow new logs to be created
Example: logService.newloggers=true
Performance Management 85
Page 92

Property Description
defaultlog Specifies the name of the default log. Default is systemlogger.
Example: logService.defaultlog=logtype
logtype.maxnumlogs Specifies the maximum number of logs to retain before deleting the
old logs. Default is 10.
Examples:
logService.defaultlog.maxnumlogs=15 sets the maximum number
of a log type specified as the default log (systemlogger, by default)
to 15.
logService.uilogger.maxnumlogs=20 sets the maximum number of
UI type logs to 20.
The following table provides the log type name for each log file name defined
by default in the log.properties file and extension files. If you have changed the
file name, use the original file name to find the log type name.
File Name of Log
(As Shown on the System Logs Screen)
alerterlogger.log alerterlogger
archive.log archivelogger
Authentication.log AuthenticationLogger
cdinterop.log cdinteroplogger
cdinterop_cdjava.log cdinteropcdjavalogger
ceuinterop.log ceulogger
common3splogger.log common3splogger
delete.log deletelogger
ebXML.log ebXMLlogger
EDIINT.log EDIINTLogger
event.log event
ftp.log ftplogger
ftpclient.log psftpclientlogger
http.log httplogger
httpclient.log httpclientlogger
jetty.log jettylogger
lifecycle.log lifecycleLogger
mailbox.log mailboxlogger
mgmtdash.log neo
noapp.log noapplogger
ocsp.log ocsplogger
oftp.log oftplogger
ops_exe.log opslogger
Perimeter.log PSLogger
pipeline.log pipelinelogger
Log Type
(For the customer_overrides.properties file)
86 Sterling B2B Integrator: Performance Management
Page 93

File Name of Log
Log Type
(As Shown on the System Logs Screen)
report.log reportlogger
resourcemonitor.log resourcemonitorlogger
mif.log rnlogger
sap.log saplogger
schedule.log schedulelogger
Security.log SecurityLogger
servicesctl.log sclogger
sftpclient.log sftpclientlogger
sftpserver.log sftpserverlogger
si_exe.log silogger
sql.log sqllogger
system.log systemlogger
system.log purgelogger
test.log testlogger
tracking.log tracking
txtrace.log txtracelogger
ui.log uilogger
ui_performance.log ui_perf_logger
webdav.log webdavlogger
WebSphereMQSuite.log wsmqSuiteLogger
webx.log webxlogger
wf.log wflogger
wfexception.log wfexception_logger
wfstatistics.log wfstatistics
(For the customer_overrides.properties file)
4. Save and close the customer_overrides.properties file.
5. Stop the Sterling B2B Integrator and restart it to use the new values.
Changing Log Settings for an Individual Log Type
For each log, you can specify the following information:
v Location of the log file
v The number of lines pertaining to the log file to be saved
v The amount of details to log
Note: If you are working in a clustered environment, the information that is
displayed is determined by the node you select from the Select Node list.
To change the log settings for an individual log type:
1. From the Administration menu, select Operations > System > Logs.
2. Click the icon next to the log type whose log settings you want to change.
3. In the Log Settings page, specify the settings for the options described in the
following table:
Performance Management 87
Page 94

Option Description
Location Specifies the absolute path for the log file.
Rollover Interval If newloggers is set to false, the rollover interval specifies the point
at which the oldest lines in the log file are deleted as new lines are
created. If newloggers is set to true (default), the rollover interval
is the maximum number of lines allowed in the log file before a
new file is created. Select one of the following rollover interval
values:
v 50000 lines
v 100000 lines
v 150000 lines
v 200000 lines
Note: Here, the term “lines” refers to logical lines (entries) and not
physical lines. For example, following is a “line”:
[2005-07-11 08:12:07.679] ALL 000440020297
SERVICES.SERVICES_CONTROLLER.INFO_sdi_getName
startup: loading HTTP_SEND_ADAPTER
FtpConfig.logConfiguration()
client configuration: ftpListenPort=[10021]
localDataPortCollection=[null]
localControlPortCollection=[null]
minThreadPoolSize=[3]
maxThreadPoolSize=[6]
systemCertificateId=[null]
caCertificatesIds=[null]
passphrase=[******]
cipher=[Strong]
sslOption=[SSL_NONE]
sslAllowed=[false]
sslRequired=[false]
sslImplicit=[false]
cccAllowed=[false]
cccRequired=[false]
clusterNodeName=[Node1]
perimeterServerName=[local]
nonTerminationCharsToTotalCharsRatio=[0.9]
Logging Level Specifies the amount of details to log. Select one of the following
values:
v On – Set the logging level to ALL, which includes debugging
(creates larger files)
v Off – Set the logging level to ERROR (Default), which only logs
errors (creates smaller files)
Note: Setting the logging level to ALL may generate an excessive
amount of debugging information. You should lower the logging
level after you have retrieved the debugging information you
require.
4. Click Save.
Changing Log File Location
Sterling B2B Integrator enables you to modify the location of the log files. Perform
the following tasks:
1. Modify the LOG_DIR setting in sandbox.cfg.
2. Run the setupfiles.sh script to apply the changes.
88 Sterling B2B Integrator: Performance Management
Page 95

However, the following log files created by the Sterling B2B Integrator dashboard
interface are not moved to the changed location indicated in sandbox.cfg:
v jetspeed.log
v jetspeedservices.log
v torque.log
v turbine.log
v access.log
To modify the location of these log files, run the deployer.sh script. This script
rebuilds and redeploys the Web ARchive (WAR) files of the dashboard interface.
The locations of the log files created by the service configuration are hard coded in
the configuration. As a result, the location of the einvoicing.log files cannot be
changed by modifying the setting in sandbox.cfg. To modify the location of these
log files, you must modify the settings at the service configuration level.
Log File Types
The log files in Sterling B2B Integrator can be classified under various types. The
following table lists these types along with a description of the same.
Note: If you are working in a clustered environment, the log information that is
displayed is determined by the node you select from the Select Node list.
Log Type Log Name Description
Central Operations Server
Operations Security opsSecurity.log Used by the security components.
Indicates problems with startup,
passwords, and passphrases.
Operations Server ops.log Used by the operations server.
opsServer.log Receives all the log messages the
operations servers generate during
startup.
IBM Sterling Gentran:Server®for UNIX
Data Adapter Logs activities of the Sterling
Gentran:Server for UNIX adapter.
You cannot turn logging on or off for
Sterling Gentran:Server for UNIX
data adapter.
Note: The Sterling Gentran:Server for
UNIX logs are displayed only if you
have Sterling B2B Integrator
configured for Sterling
Gentran:Server for UNIX.
Application Logs
Adapter Server servicesctl.log Used by the service controller
component.
AFT Routing aftrouting.log
Performance Management 89
Page 96

Log Type Log Name Description
Alerter alerterlogger.log Logs notification failures and Alert
own errors in the Alert Service. When
debug is turned on, the alerter log
type also logs all the alert
information, such as defined alerter
and filter information.
Archive archive.log Used by the archive components.
Business Process
Exceptions
Business Process
Execution
Business Process Policy
Statistics
wfexception.log Tracks the exceptions that occur
while a business process is running.
wf.log Captures information that is specific
to running a business process.
wfstatistics.log Contains workflow policy statistics
generated by the workflow
scheduling policy. Although the
actual content depends on the
scheduling policy in place, the
business process policy statistics log
type basically contains XML
timestamps followed by XML
records.
IBM Sterling
cdsp.log
Connect:Direct®Secure
Perimeter Adapter
Sterling Connect:Direct
Server Adapter Protocol
cdinterop_cdjava.log Used by the Sterling Connect:Direct
Server adapter.
Layer
Sterling Connect:Direct
Server and Requester
Adapter and Services
IBM Sterling
Connect:Enterprise
®
cdinterop.log Used by the Sterling Connect:Direct
Server and Requester Adapter and
related services
ceuinterop.log Used by the Sterling
Connect:Enterprise Server adapter.
Server Adapter and
Services
Crypto crypto.log
CSP2 FTP Adapter cspftp.log
CSP2 Http Adapter csphttp.log
Dashboard mgmtdash.log Used by the Dashboard component.
Delete Resources delete.log Logs information about resources that
have been deleted from Sterling B2B
Integrator.
Document Tracking tracking.log Logs document tracking activities.
ebXML Business Process
Execution
ebXML.log Logs ebXML business process
execution activities.
EDI Log edi.log
EDIINT
EDIINT.log Used by the EDIINT components.
AS1 and AS2
Embedded Engine embeddedEngine.log
90 Sterling B2B Integrator: Performance Management
Page 97

Log Type Log Name Description
Event Framework event.log Logs event framework activities for
events completed in Sterling B2B
Integrator.
FTP Client Adapter and
Services
ftpclient.log Used by the FTP Client Adapter and
related services.
FTP Server ftp.log Used by the FTP server components.
Sterling Gentran:Server
for UNIX Lifecycle
lifecycle.log Used by the Sterling Gentran:Server
for UNIX Lifecycle components when
loading lifecycle records.
Sterling Gentran:Server
for UNIX Lifecycle Purge
Service
HTTP Client Adapter
and Services
system.log Used by the Sterling Gentran:Server
for UNIX Lifecycle purge components
when purging lifecycle records.
httpclient.log Used by the HTTP Client Adapter
and related services.
HTTP Server Adapter http.log Used by the HTTP Server Adapter.
Integrator
Administration
ui.log Used by the Sterling B2B Integrator
interface.
Jetty HTTP Server jetty.log Used by the Jetty HTTP Server.
JMX Agent jmx.log
Log.ResourceMonitorLog resourcemonitor.log Used by the Resource Monitor.
Mailboxing Subsystem mailbox.log Used by the mailbox components in
Sterling B2B Integrator.
OCSP ocsp.log Used by the Online Certificate Status
Protocol.
Odette FTP Adapter
OdetteFTP.log
Administration
OFTP Administration oftp.log Logs OFTP administration activities.
Perimeter Services Perimeter.log Used by the perimeter server
components in Sterling B2B
Integrator.
Pipeline pipeline.log Used by the pipeline components.
Platform platform.log
Report report.log Used by the reporting components.
Reporting Services bizIntel.log
Resource Monitor resourcemonitor.log
RosettaNet Business
Process Execution
SAP Adapter
rnif.log Used by the RosettaNet
components.
sap.log Used by the SAP®components.
™
Administration
SAP XI Adapter
sapxi.log
Administration
Schedule schedule.log Logs scheduling activities.
Schedule Monitor schedulemonitor.log
Security security.log Used by the security components.
Indicates problems with startup and
component licensing.
Performance Management 91
Page 98

Log Type Log Name Description
SFTP Client Adapter and
Services
SFTP Common Log common3splogger.log Logs SFTP security errors.
SFTP Server Adapter sftpserver.log Used by the SFTP Server adapter.
SQL Manager sql.log Logs queries sent to the database by
IBM Sterling Secure
Proxy
System system.log Used as a general logging service,
System Output/Error
Redirect
Translation Log tx.log
Translation Trace Output txtrace.log Used as a logging service that helps
User Authentication Authentication.log Logs user authentication attempts
Visibility visibility.log
Web Extension webx.log Used by the Web Extensions
Web Services Security wssec.log
WebDAV Server webdav.log
WebSphereMQ Suite WebSphereMQSuite.log Used by the WebSphereMQ Suite
Windows Service GI si_exe.log Log file created by the Sterling B2B
Windows Service Ops
log
WorkFlow Deadline bpdeadline.log
WS-Reliability Routing wsrm.log
sftpclient.log Used by the SFTP Client adapter and
related services.
the SQL Query service.
secureproxy.log
typically the default system log.
noapp.log Used on an application
server-independent system as a
general activity log.
noapp.log Used to provide additional system
log information.
with map debugging. This log
contains debugging messages that
show how the translator traversed
the maps definition and matched
each block of data against the map.
and activities.
components in Sterling B2B
Integrator.
Async Receiver adapter and related
services.
Integrator Windows service.
ops_exe.log Log file created by the Opserver
Windows service.
The following table describes the log files pertaining to the Sterling B2B Integrator
Windows service:
Log Name Description
ScheduleBackup.log Temporary file that is created when Sterling
Backuplogs.log Temporary file that is created when Sterling
92 Sterling B2B Integrator: Performance Management
B2B Integrator Windows service stops.
B2B Integrator Windows service stops.
Page 99

Log Name Description
ScheduleStopOps.log Temporary log file that can be ignored.
The following table describes the log files pertaining to the DMZ perimeter server:
Log Name Description
PSLogger.Dyyyymmdd.Thhmmss Logs perimeter server information for the
StartupPS.log Logs startup activities for the DMZ
Auditing
In Sterling B2B Integrator, you can find information about the creation,
modification, and deletion of a Sterling B2B Integrator resource, using the
AUDIT_ADMIN table. Resources include business processes, certificates (CA,
trusted, system), maps, and schemas. You can access the AUDIT_ADMIN table
through a simple database query.
The AUDIT_ADMIN table contains the following information:
v The date and time of a resource operation.
v The resource that was created, modified, or deleted.
v The resource operation (creation, modification, or deletion).
v The User ID of the user who performed the operation.
DMZ perimeter server.
perimeter server.
The AUDIT_ADMIN table also contains information about when a user obtains or
releases a lock on a resource using the Lock Manager, if the type of modification
cannot be determined in the Lock Manager.
You can generate reports (by Resource Type or User ID) from the AUDIT_ADMIN
table. Use the following procedure to generate an Admin-Audit Report:
1. In the Administration Menu, select Operations > Reports.
2. In the Search section of the screen that is displayed, select the Admin Audit
type.
3. Click source manager icon adjacent to the report you want to generate:
v AdminAuditByObjectType (by Resource Type)
v AdminAuditByPrincipal (by User ID)
4. In the Report Source Manager page that is displayed, click the execute icon.
The Admin-Audit Report is displayed.
The Admin-Audit Report (whether by Report Type or User ID), includes the
following columns. The AUDIT_ADMIN table field name is displayed within
parentheses after the column name.
v Action Type (ACTION_TYPE)
Example: Modified
v Action Value (ACTION_VALUE)
Example: Message Purge
v Principal (PRINCIPAL)
Example: UserID
Performance Management 93
Page 100

v Resource Name (OBJECT_NAME)
Example: Message Maintenance
v Resource Type (OBJECT_TYPE)
Example: User News
v Time (TIME)
Example: 07/15/2008 12:48:54 PM
The AUDIT_ADMIN table also includes the ARCHIVE_DATE field, which is the
earliest date on which the data can be purged.
The audit process tracks the following resources:
v Accounts
v Application Configurations
v Business Processes
v Digital Certificates
v Communities
v ebXML Specifications
v Extended Rule Libraries
v Maps
v Mail Boxes
v PGP Profiles
v Proxy policies
v Proxy Setmaps
v Perimeter Servers
v Report Configurations
v Schedules
v XML Schemas
v Security Tokens
v Service Configurations
v SSH Resources
v SWIFTNet Routing Rules
v Trading Partner Data
v Web Resources
v Web Services
v WSDL
v Web Templates
v XSLTs
Monitoring a Business Process Thread
A thread is a basic unit of program execution. Threads perform the actual work in
a process. A process can have several threads working concurrently, for example,
transferring a file to one node using FTP, and to another node using HTTP. The
Activity Engine is that part of a business process workflow engine (WFE) that calls
the business process service, takes the results from the service, and immediately
starts the next business process service cycle.
You can monitor the threads related to business processes in Sterling B2B
Integrator using the Thread Monitor. The Thread Monitor lists all the threads that
94 Sterling B2B Integrator: Performance Management
 Loading...