

Page 1

USER’S MANUAL
for HD-BSC 960 and HD-MIC 1900
1999. 3
Copyright 1999 Hyundai Electronics Industries Co., Ltd.
All rights are reserved. No part of this document may be used or
reproduced in any means without the prior written permission of
the copyright holders.
Page 2

PROPRIETARY & CONFIDENTIAL
Table of Contents
Chapter 1. System Overview
1.1 Purpose of this document
1.2 Features of Hyundai CDMA System
1.3 Overview
Chapter 2. BSC Basics
2.1 System Overview and Specification
2.1.1 Overview
2.1.2 Specifications and Characteristics
2.2 H/W Structure and Function
2.2.1 Overview
User’s Manual
2.2.2 Structure of Subsystem
2.3 S/W Structure and Function
2.3.1 Overview
2.3.2 Structure
Chapter 3. BSM Operation & Administration
3.1 BSM Operation
3.1.1 Overview
3.1.2 Main Display Structure
3.1.3 Main Button
3.1.4 Command Buttons
3.1.5 Service Button
3.1.6 Operations of “Alarm” window
3.2 System Status Management
3.2.1 System Status Test
3.2.2 System Diagnosis
3.2.3 Statistics
3.3 Data Management
3.3.1 Access Channel Parameter
3.3.2 Access Parameter
Page 3

User’s Manual
PROPRIETARY & CONFIDENTIAL 1-1
Chapter 1 System Overview
1.1 Purpose of this document
This chapter contains description of Hyundai Micro-BTS PCS System that is operating on
800MHz and 1.9GHz frequency band, repectively.
1.2 Features of Hyundai CDMA System
There are two sub-systems in Hyundai CDMA system ; Micro-BTS and BSC. BSC
interfaces with switching equipment and has roles of vocoding and call processing. MicroBTS is functionally located between MS (Mobile Station) and BSC. Hyundai Micro-BTS
has channel resource unit and radio frequency RF unit similar to the conventional 3-Sector
BTS. Contrary to conventional 3-Sector BTS, Hyundai Micro-BTS is small in size, easily
can be installed and maintained, and is very cheap in cost.
1.3 Overview
Hyundai Micro-BTS system can support 2FA/3Sector using 2 racks, but Micro-BTS system
is composed of 1FA/3sector system for the FCC authorization. Thus this manual will
describe all of the specifications based on 1FA/3sector system.
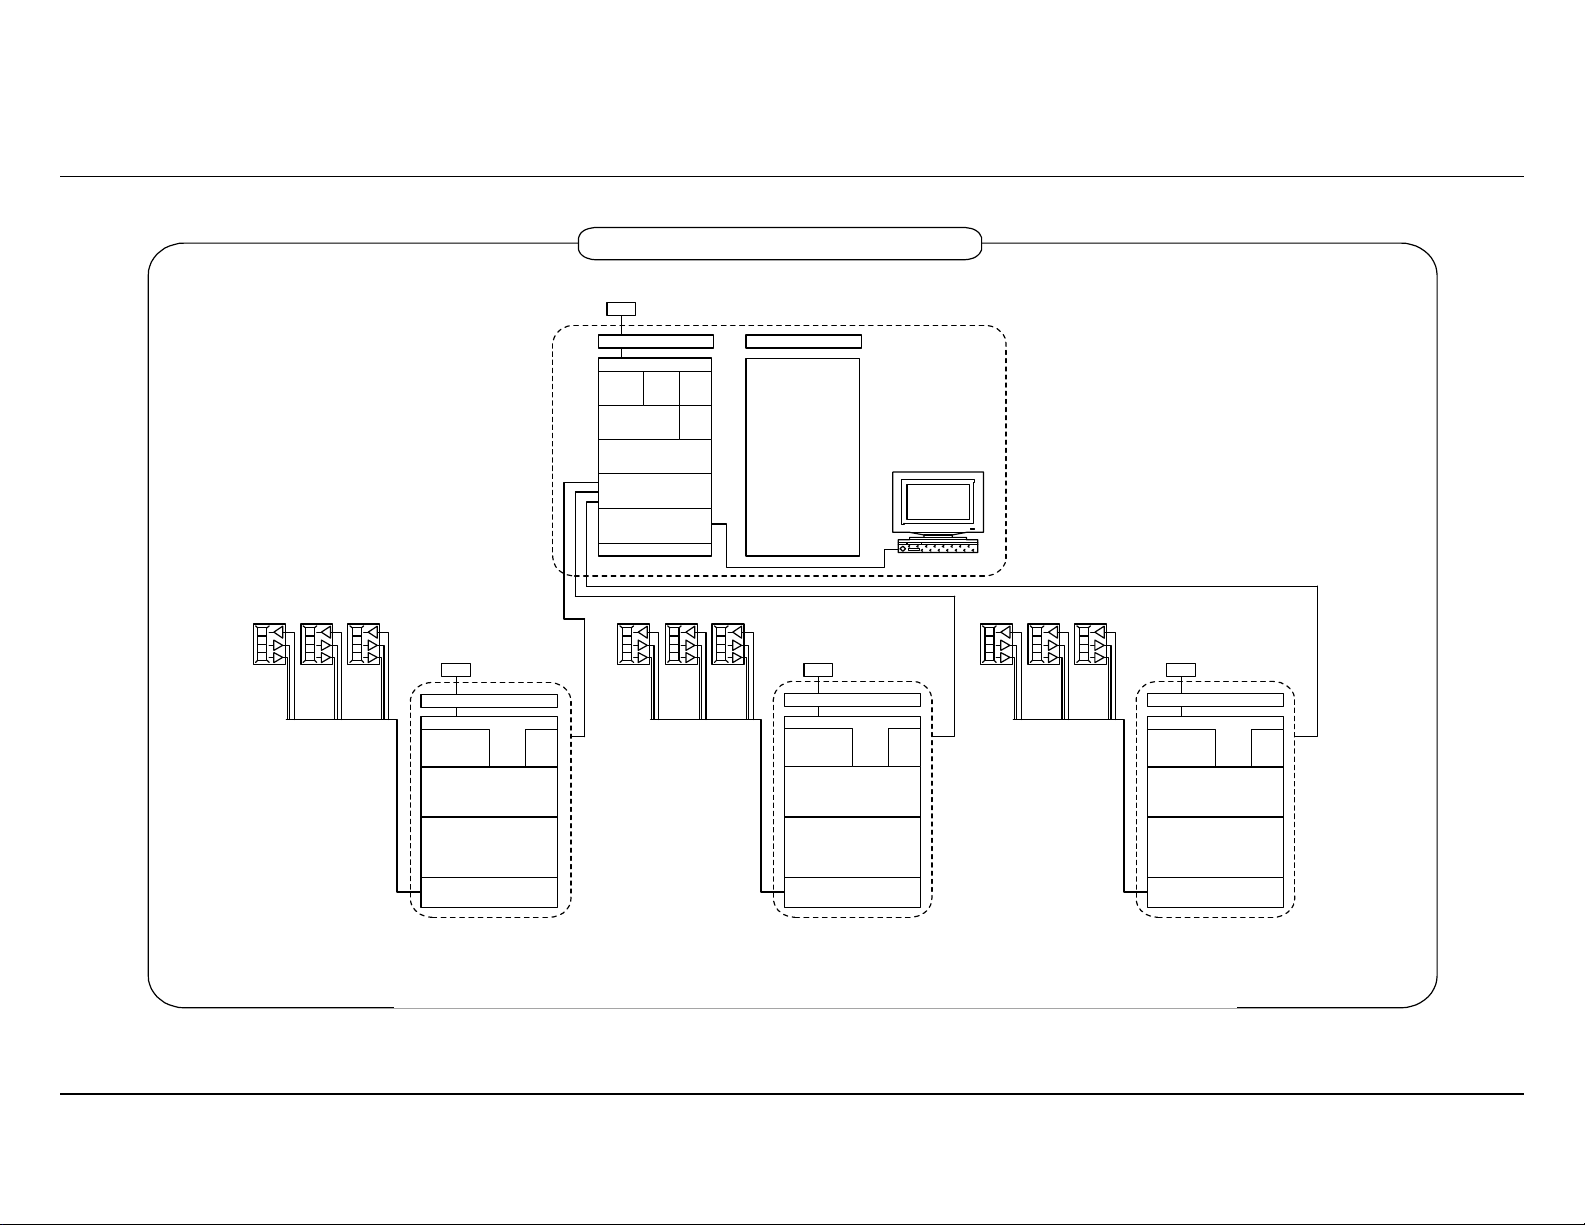
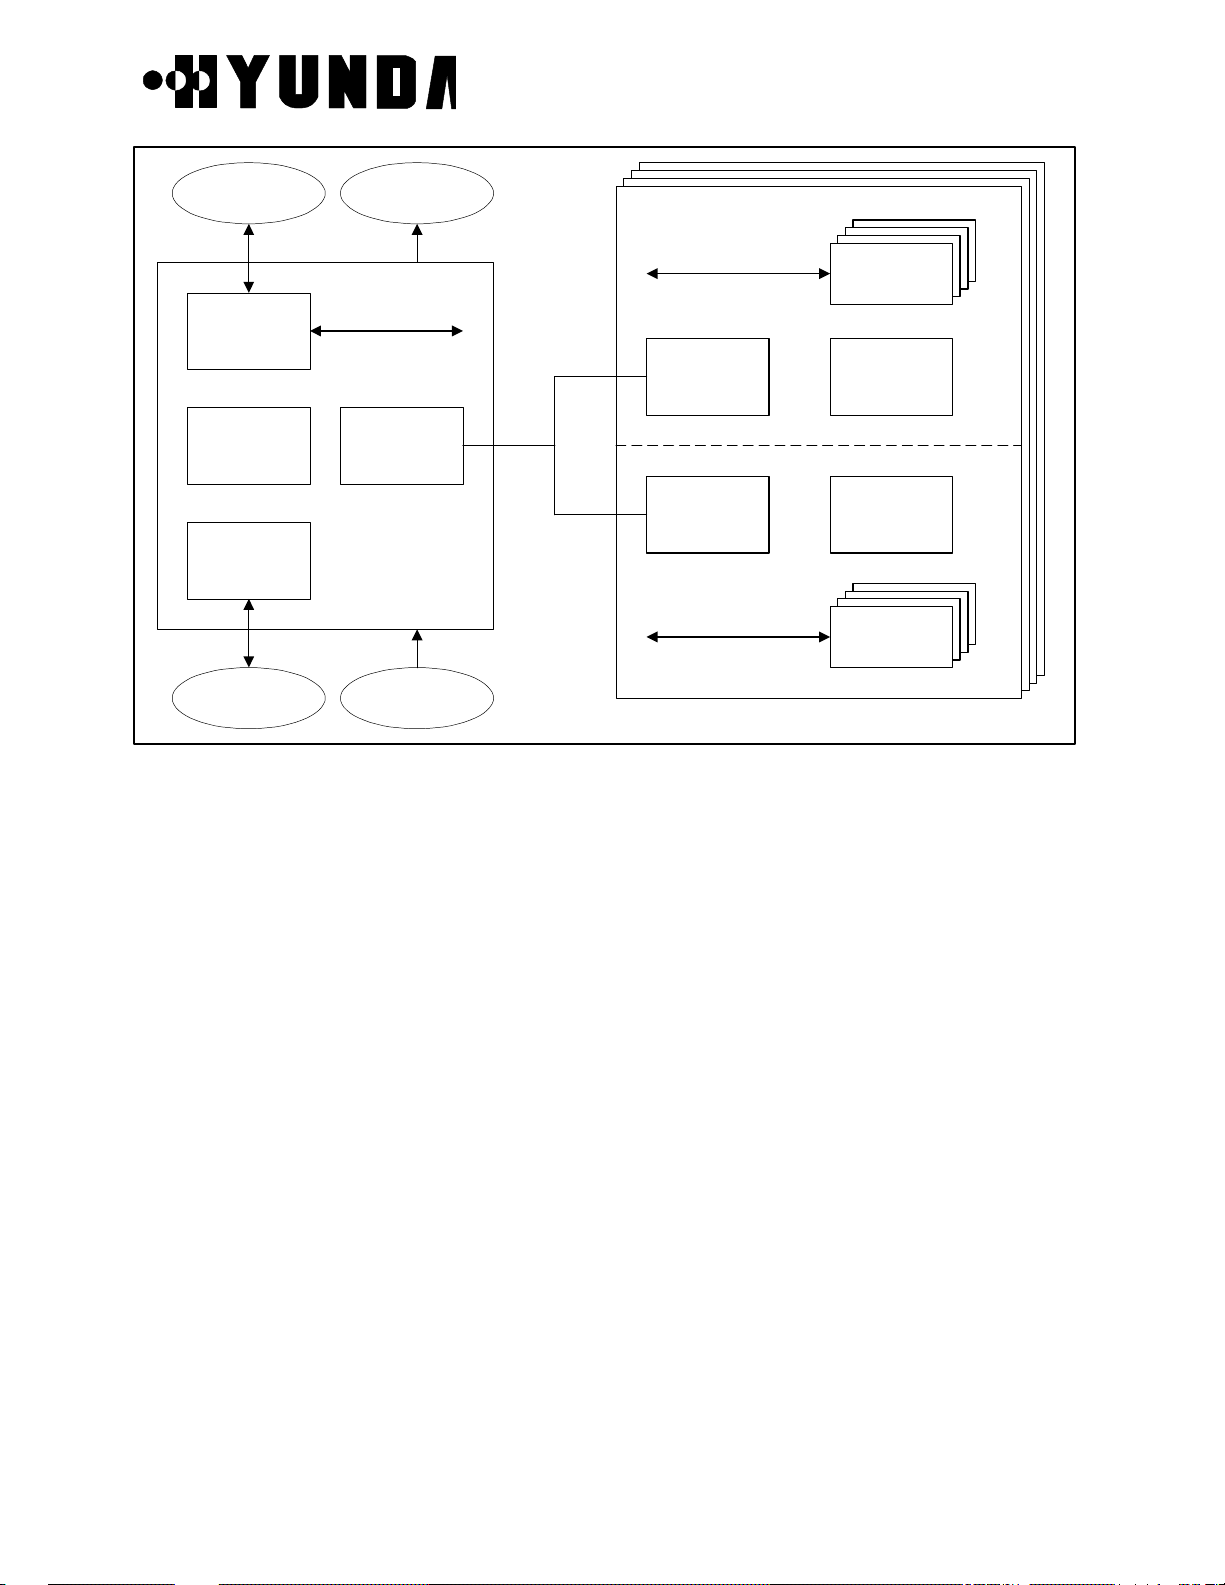
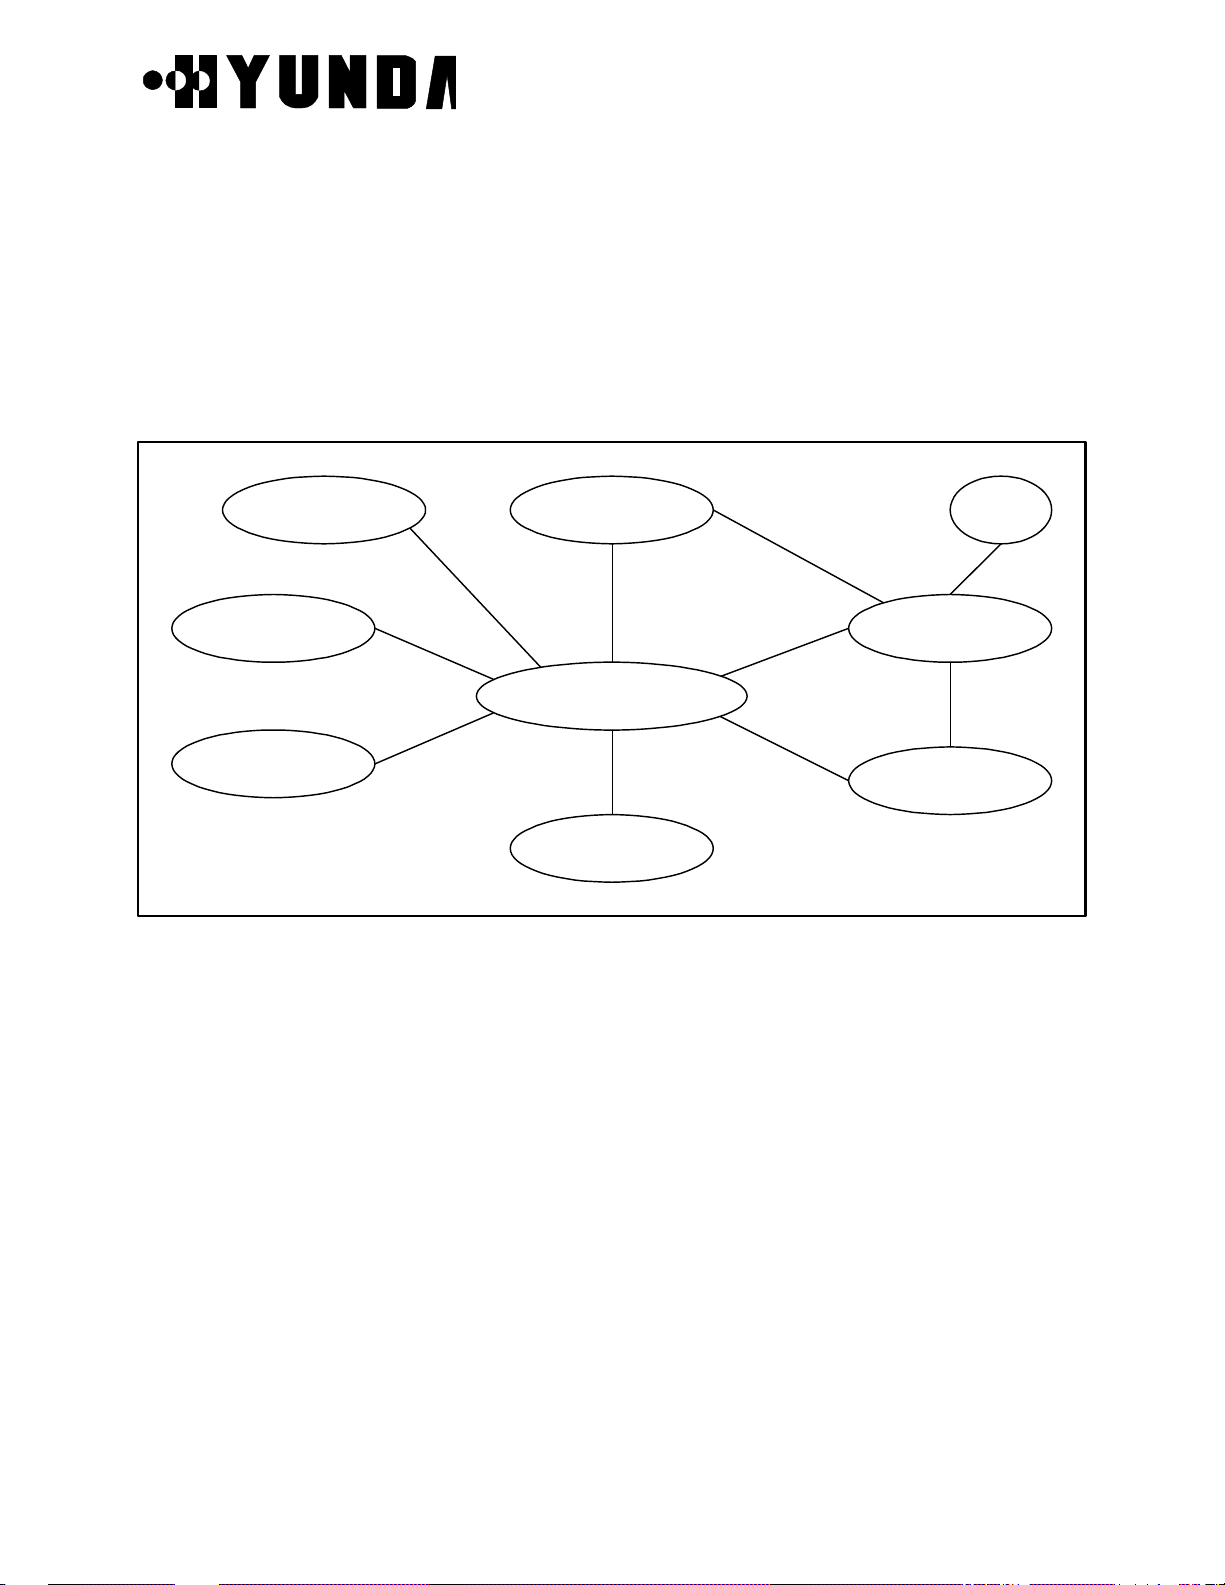
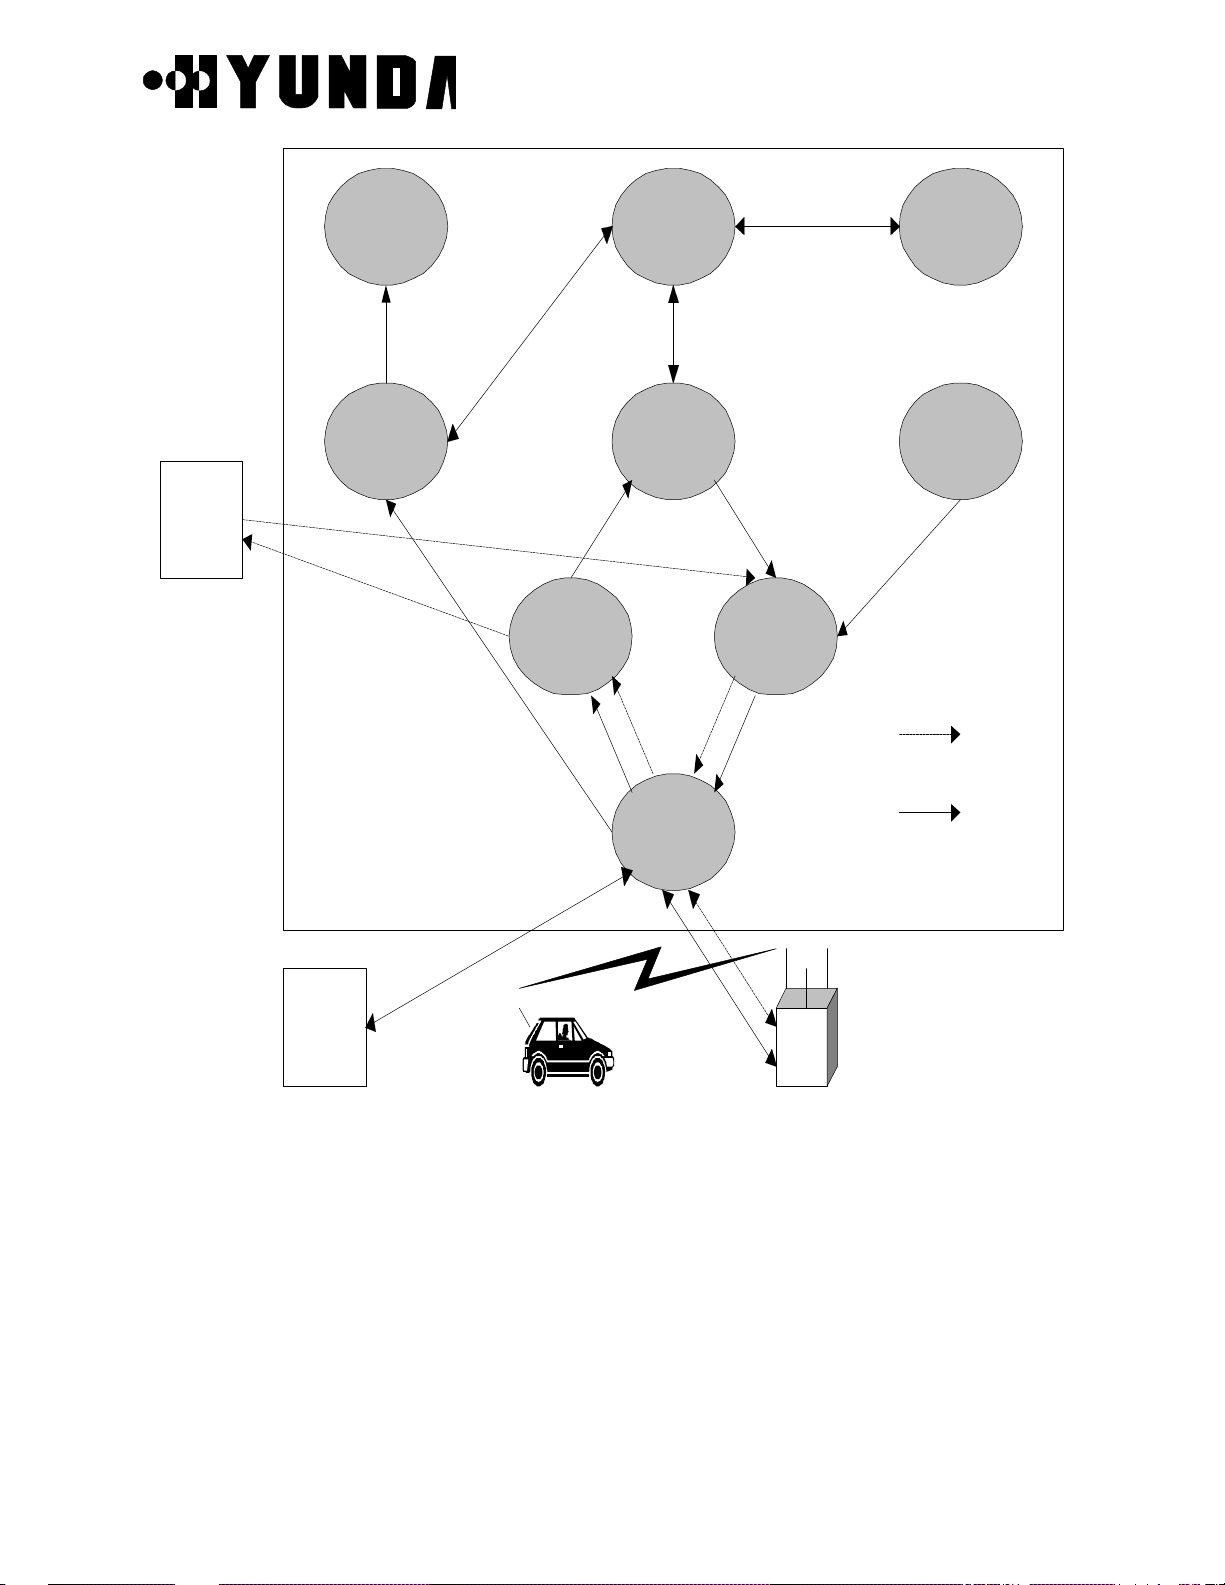
The system configuration is shown in Figure 1.1. In this configuration, there are 1 BSC and
3 Micro-BTS systems. Each Micro-BTS system is separately located in 3 sites. Micro-BTS
can use 2 types of antenna subsystem, RRU (Remote RF Unit) and AAU (Active Antenna
Unit). RRU is connected to Micro-BTS main system through AIU (Antenna Interface Unit)
and AAU through AIDU (Active Internal Distribution Unit). In case of trunk line, we have
several solutions, T1 and E1. We use T1 trunk line in USA. It means that we do not use
HLEA but HLTA as trunk card.
BSM manages and maintains Micro-BTS and BSC. It communicates with each system by
transmitting and receiving packets through LCIN. Its features include performance
management, configuration management, fault management, etc..
Page 4
User’s Manual
RRU-B1
GPS Antenna
DU
System Configuration for Test_Bed
GPS Antenna
BSC_COMR
FANU
BSC-
GPS
1x T1 leased line
MBTR1
BMP
TFU DU
RFU
ACP
ACP
CSB
CCP
TSB
LCIN
FANU
GCIN
FANU
RRU-B1 RRU-B1
MSC RACK
MSC(Switch)
1x T1 leased line
GPS Antenna
DU
MBTR1
RFU
BMP
BSM
TFU
1x T1 leased line
GPS Antenna
MBTR1
RFU
BMP
DEC, 8, 1998
TFU
RPU
AIU-B1
MBTR : Micro-BTS Rack
DU : Digital Unit
BMP : BTS Main Processor
TFU : Time & Frequency Unit
RFU : Radio Frequency Unit
RPU
AIU : Antenna Interface Unit
RRU : Remote RF Unit
: Rectifier Power Unit
RPU
AIU-B1
GPS : Global Positioning System
MSC : Mobile Switching Center
BSC : Base Station Controller
BSM : Base Station Manager
RPU
AIU-B1
Figure 1.1 Configuration of system for field trial
PROPRIETARY & CONFIDENTIAL 1-2
Page 5

PROPRIETARY & CONFIDENTIAL
3.3.3 Information of Micro-BTS Configuration
3.3.4 Base Station CDMA Environment
3.3.5 Base Station CDMA Information
3.3.6 Base Station Channel List Message
3.3.7 Extended System Parameter Information
3.3.8 Forward Link Power Information
3.3.9 Paging Channel Parameter
3.3.10 Psync Channel Parameter
3.3.11 RFC Parameter
3.3.12 Forward Link Power Control Data
3.3.13 Reverse Link Power Control Data
3.3.14 Base Station Cell Information
3.3.15 Corresponding Sector Information of Micro-BTS
User’s Manual
3.3.16 Sync Channel Message
3.3.17 System Parameter
3.3.18 System Parameter Message
3.3.19 Traffic Channel Parameter
3.4 Call Processing System
3.4.1 Overview
3.4.2 Call Processing Flow
3.4.3 Call Trace
3.4.4 Call Release Reason and State
Chapter 4. BSC References
4.1 Rack Configuration
4.2 DIP Switch & Strap
4.2.1 Summary
4.2.2 Purpose
4.2.3 Address Setting in Common
4.2.4 MCDA (Main Control & Duplication board Assembly-A1)
4.2.5 CIFA-A1 (Cin Interface Function board Assembly-A1)
4.2.6 HICA-A2 (High capacity Ipc Control board Assembly-A2)
4.2.7 HRNA-A2 (High capacity Routing Node Assembly-A2)
Page 6

User’s Manual
PROPRIETARY & CONFIDENTIAL
4.2.8 HNTA-A2 (High capacity ipc Node & T1 interface Assembly-A2)
4.2.9 TFSA-A1 (Time & Frequency Split Assembly-A1)
4.2.10 TSGA-A1 (Time & frequency Splitting Generation Assembly-A1)
4.2.11 TFDA-A1 (Time & Frequency Distribution Assembly-A1)
4.2.12 VSIA-C1 (Vocoder Selector Interface Assembly-C1)
4.2.13 VSOA-A1 (Vocoder Selector Operation Assembly-A1)
4.2.14 CHBB-A1 (Cin Hipc Back Board-A1)
4.2.15 CCBB-A1 (CCp Back wiring Board-A1)
4.2.16 ACPA-A1 (Alarm Control Processor Assembly-A1)
4.2.17 SDBB-A1 (CKd Split & Distributed Back Board-A1)
4.2.18 TSBB-A1 (TSb Back Board-A1)
4.2.19 BABB-A1 (Bsc Alarm Back Board-A1)
4.2.20 HSBB-A1 (HIPC Small BackBoard-A1)
4.3 LED Descriptions
4.4 Command List
4.5 Acronym
Chapter 5. Micro-BTS Basics
5.1 System Overview and Specification
5.1.1 Overview
5.1.2 Functions
5.1.3 System Specification
5.2 Micro-BTS Structure and Configuration
5.2.1 Micro-BTS Structure
5.2.2 Micro-BTS Block Configuration
5.3 H/W Structure and Function
5.3.1 BMP
5.3.2 DU
5.3.3 TFU
5.3.4 RFU
5.3.5 Antenna Subsystem (AIU-RRU, AIDU-AAU)
5.3.6 BTU
5.3.7 RPU
Page 7

PROPRIETARY & CONFIDENTIAL
5.4 S/W Structure and Function
5.4.1 Overview
5.4.2 Basic Functions
5.5 Abbreviations
Chapter 6. Micro-BTS References
6.1 Rack Configuration
6.1.1 MBTR I (1.9GHz)
6.1.2 MBTR I (800MHz)
6.2 DIP Switch and Strap
6.2.1 Summary
6.2.2 Purpose
6.2.3 Address Setting in Common
User’s Manual
6.2.4 BMPA-B1
6.2.5 CDCA-B1
6.2.6 BICA-B1
6.2.7 HLTA-B1
6.3 LED Descriptions
6.3.1 BMP
6.3.2 DU
6.3.3 TFU
6.3.4 RPU
6.4 Alarm Source List
6.5 Abbreviations
Page 8
User’s Manual
PROPRIETARY & CONFIDENTIAL
Chapter 2 BSC Basics
2.1 System Overview and Specification
2.1.1 Overview
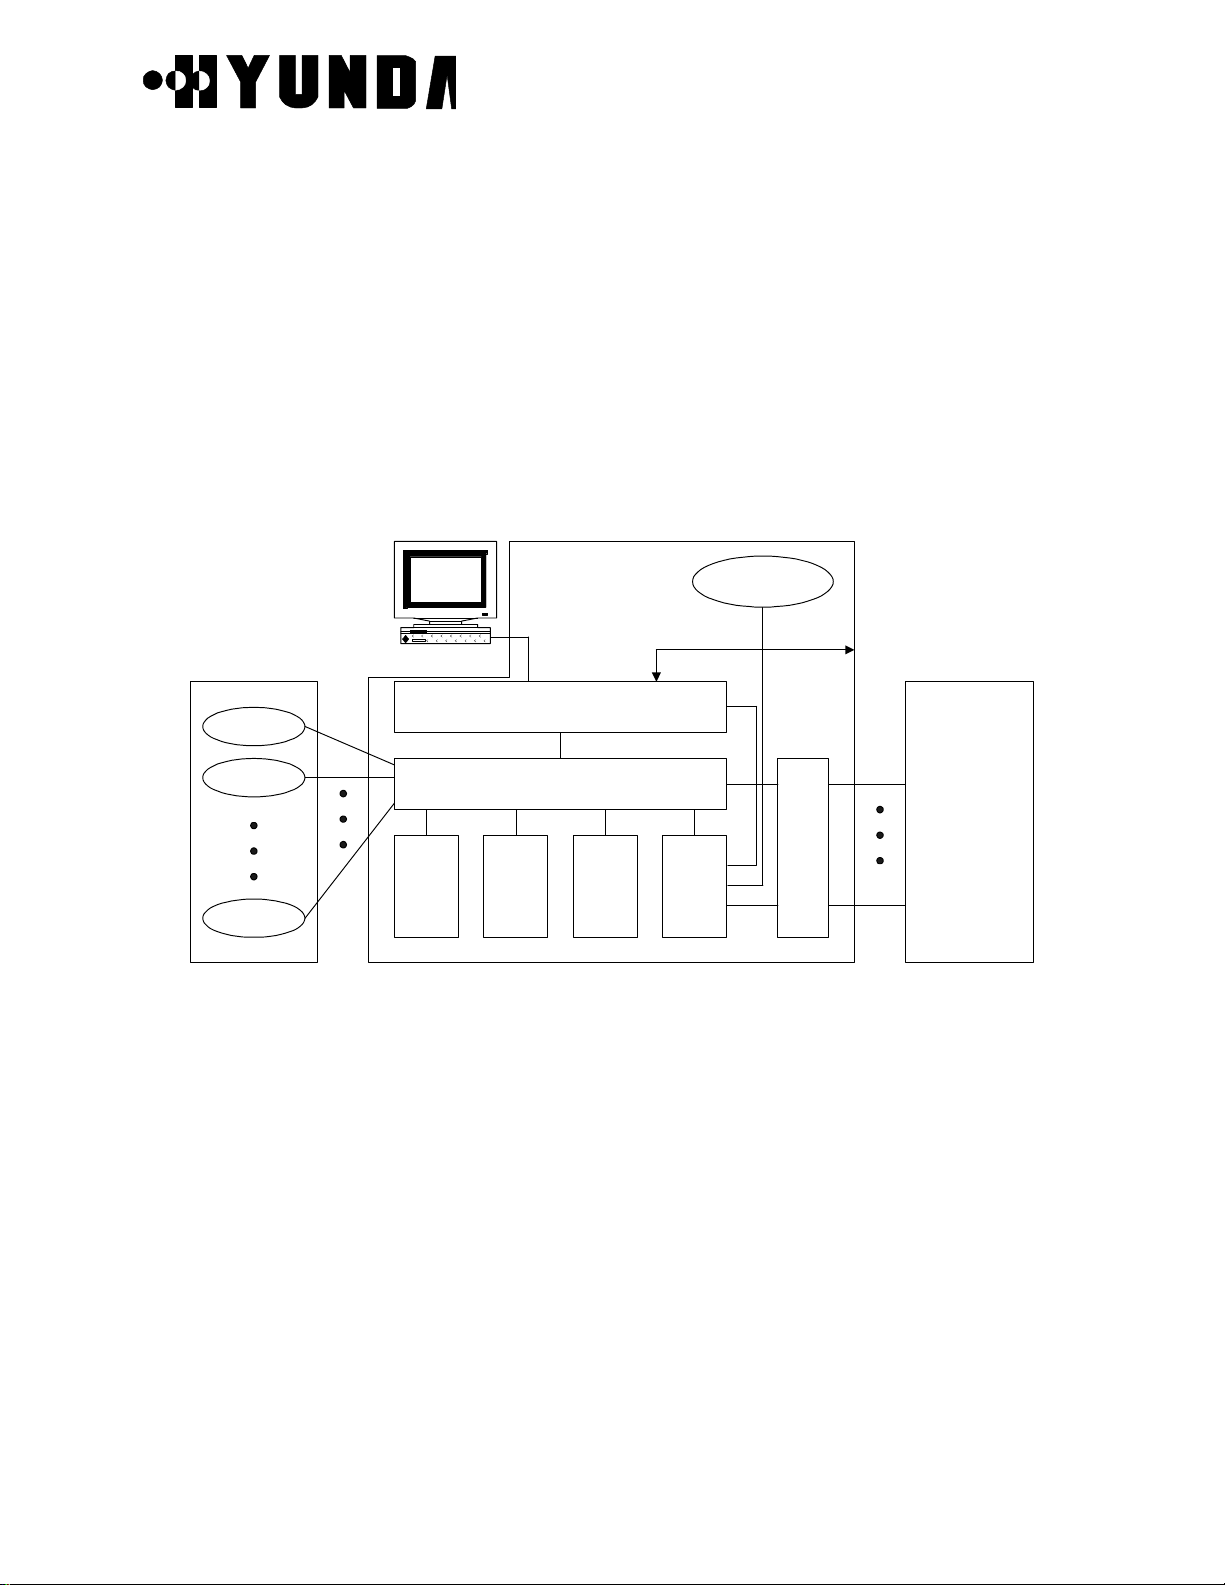
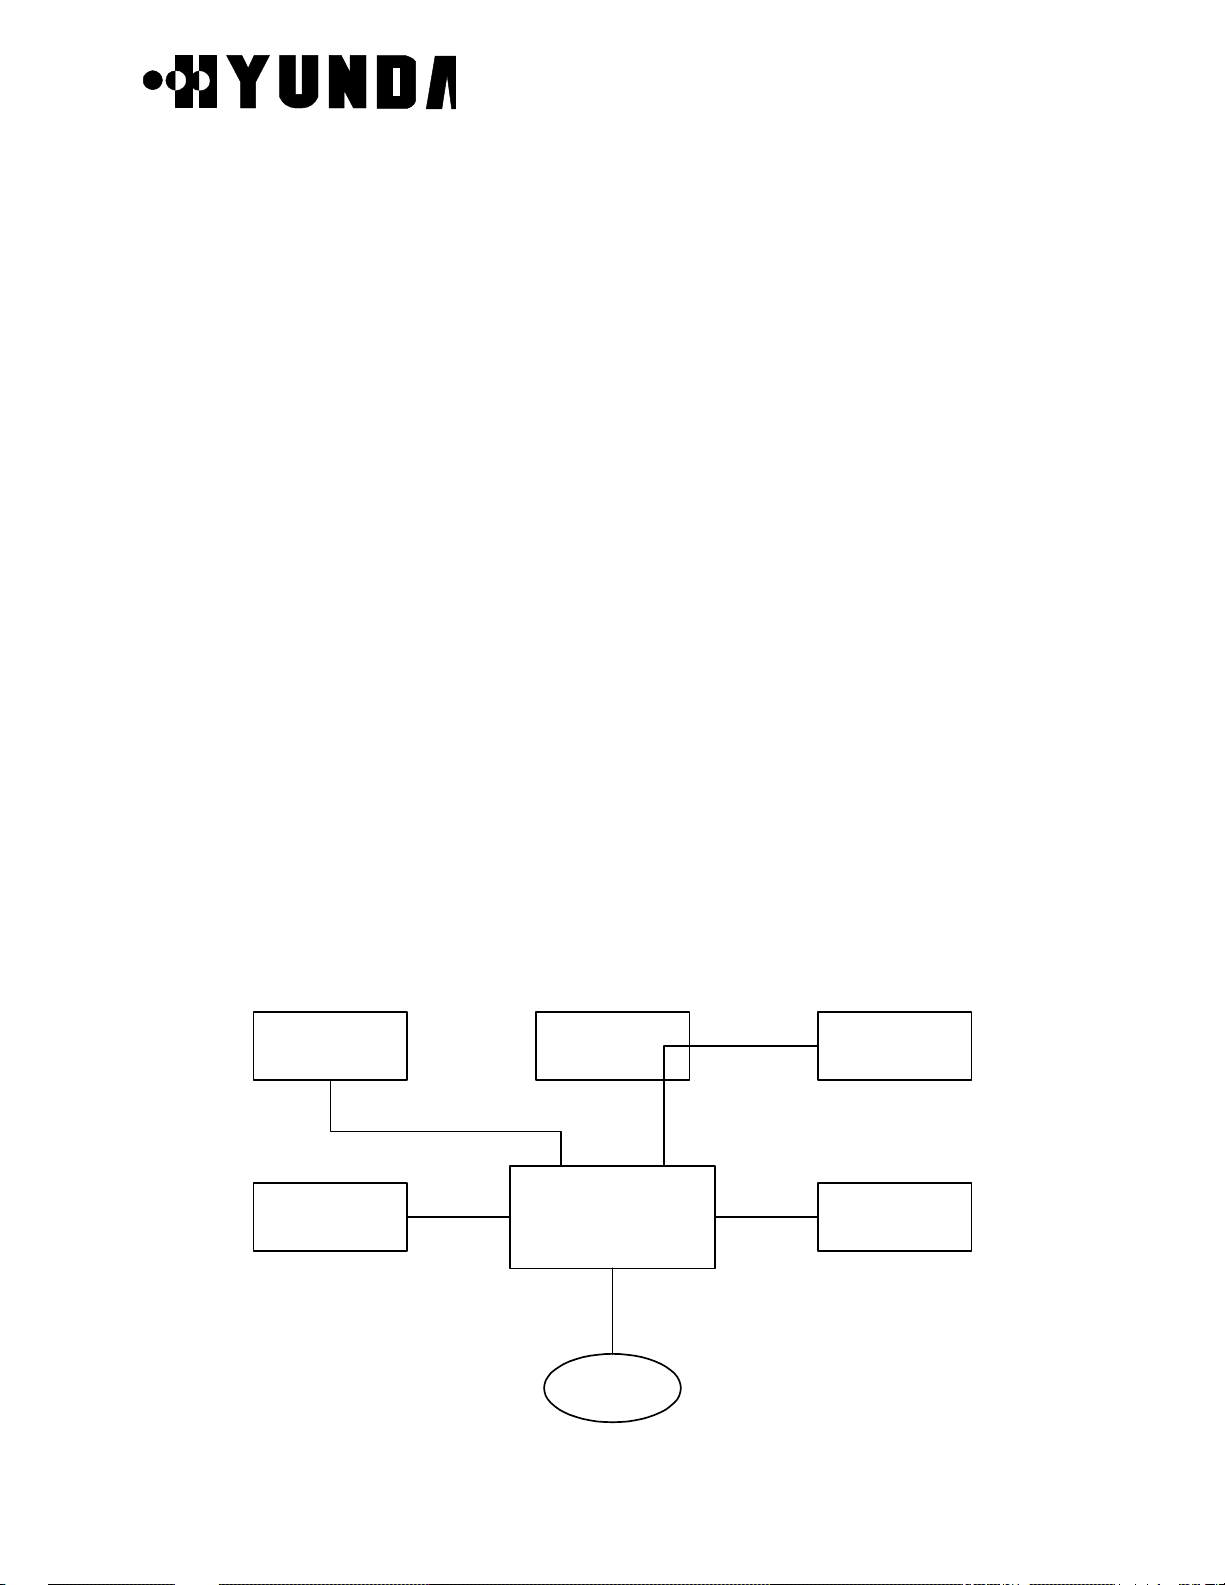
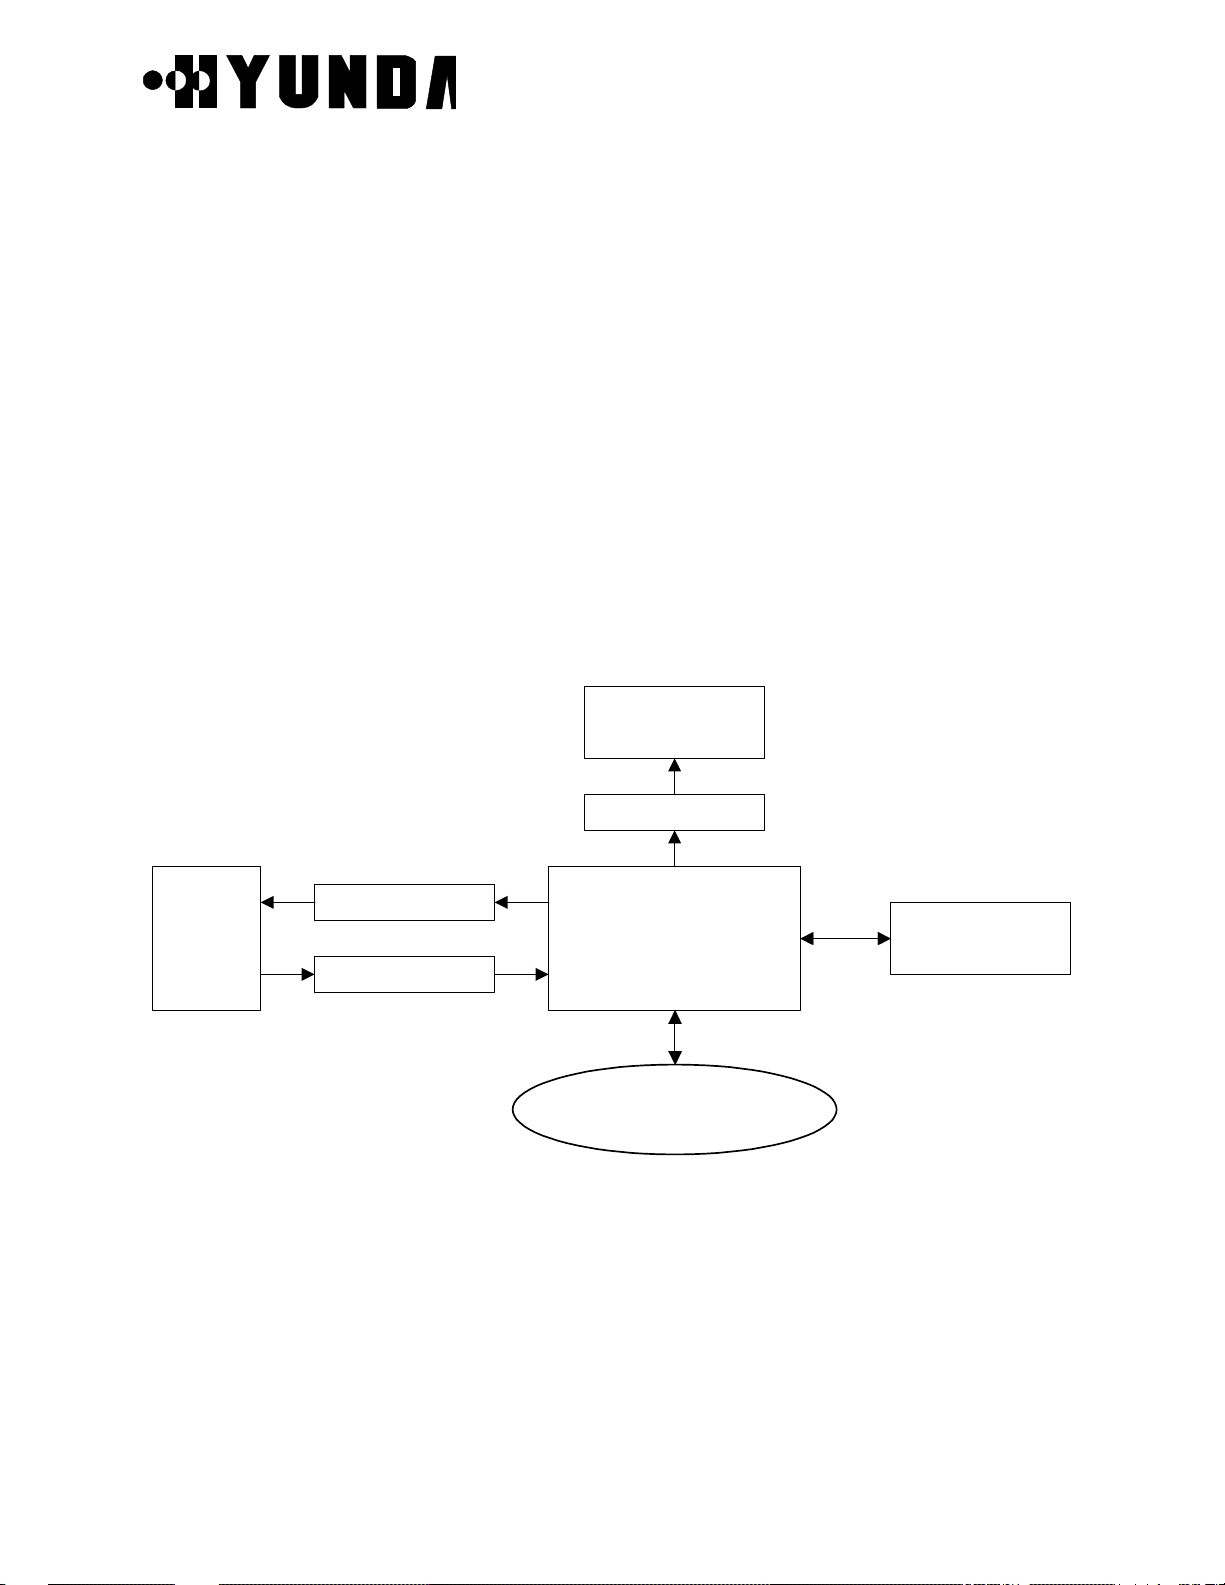
BSC is located between MSC and BTS. It carries out a wire/wireless link control function,
handoff function and transcoding function. And it is made up of a LCIN, GCIN, TSB, CCP,
CSB, CKD, BSC-GPS, and BSM block. [Refer to Fig.2.1].
BSC-GPS
IPC
IPC
IPC
Others BSC
T1
TSB
T1
BSM
BTS0
BTS1
BTS59
BTS BSC MSC
T1
T1
IPC IPC IPC
T1
CCP CSB
IPC
GCIN
IPC
LCIN
ACP CKD
Figure 2.1 Configuration of BSC
Each block does following functions.
• BSM is a system used to operate the entire BSC and BTS, to manage their resources,
status and configuration, and to execute the user interface, and maintenance. It consists
of a SUN Sparc Workstation and the various types of input/output devices for enhancing
user's convenience.
• LCIN is a network that provides the communication paths of packet-type data between
subsystems. LCIN routes and transmits packet data within BSC and it has trunk interface
function between BSC and BTS.
Page 9

User’s Manual
PROPRIETARY & CONFIDENTIAL
• GCIN is a network that provides the communication paths of packet-type data between
LCINs. GCIN also provides the communication path between BSM and other processor.
• CCP is a processor system that carries out the call processing and soft-handoff
processing function for entire BSC, allocates wireless resource of BSC, and controls
overload of vocoders and the main processor of BSC.
• CSB converts the IPC protocol of CCP into the No.7 protocol to access to MSC through
the trunk of TSB block.
• BSC-GPS is a system for providing the reference time used in the CDMA system. CKD
converts the clocks received from BSC-GPS and then, distributes synchronization
signals required for the system.
• ACP collects the various types of alarm status in BSC and then, reports them to BSM in
order to carry out system O & M efficiently.
• TSB is connected to MSC with T1 trunk. TSB converts the PCM voice signal of 64Kbps
received through this with the QCELP algorithm and it sends the converted signal to the
channel unit of BTS. In addition, it carries out the reverse function of the above.
Moreover, after being linked to the BTS, it executes a handoff function and power control
function on radio link.
2.1.2 Specifications and Characteristics
2.1.2.1 Specifications of BSC
(1) Capacities
• Number of controlled BTS : 60BTS/BSC
• Number of voice channel : 960 CH/BSC
• Number of BSC which are inter-accessible : 12BSC/MSC
• Maximum capable subscribers : 30,000 subscribers/BSC (Br 1%, 0.03Erlang)
(2) Link protocol
Page 10

PROPRIETARY & CONFIDENTIAL
• BSC-MSC Link
T1 for Traffic
SS No.7 for signaling & control (ITU-T STD)
• BTS-BSC Link
Un-channelized T1
(3) Power
• DC - 48 V
• Integration of storage battery is possible.
(4) Specification of LCIN
• Up to 112 T1 Trunk to BTS
• Function of Remote Loop-back
• Function of transmit/receive of Remote alarm
(5) Specification of CCP & CSB
User’s Manual
• Use 32bit Main Processor
• Interface function with LCIN
• Interface to MSC
(6) Specification of TSB
• Interface to MSC with T1
• Accepts 48 Transcoding channel per TSB
• 12 Vocoder Channels/Channel Card
(7) Specification of GCIN
• 4 links to a LCIN
• Up to 12 LCIN connection capability
• RS-422 links for LCIN links, BSM and other processors
(8) Specification of BSM
• Main Frame : Use commercial workstation
• Main Processor : SPARC Processor processing rate more than 80MIPS
• Main Memory : more than 64Mbyte
• Hard Disk : more than 2Gbyte
• Tape Drive : more than 150Mbyte
• Parallel Port : Connect with High Speed Printer
• HDLC Card : support the rate more than 2.048Mbps and functions of X.25
connection
Page 11

User’s Manual
PROPRIETARY & CONFIDENTIAL
• Audio I/O Port : supply alarm function
• Software : Motif/X11, Informix DBMS
2.1.2.2 Characteristics
(1) Distributed control structure and duplication of main part
(2) Using the link that is capable of high reliability and high speed data transmit
(3) Increasing the trunk efficiency by packet transmit
(4) Real-time processing of system by real-time OS
Page 12
User’s Manual
PROPRIETARY & CONFIDENTIAL
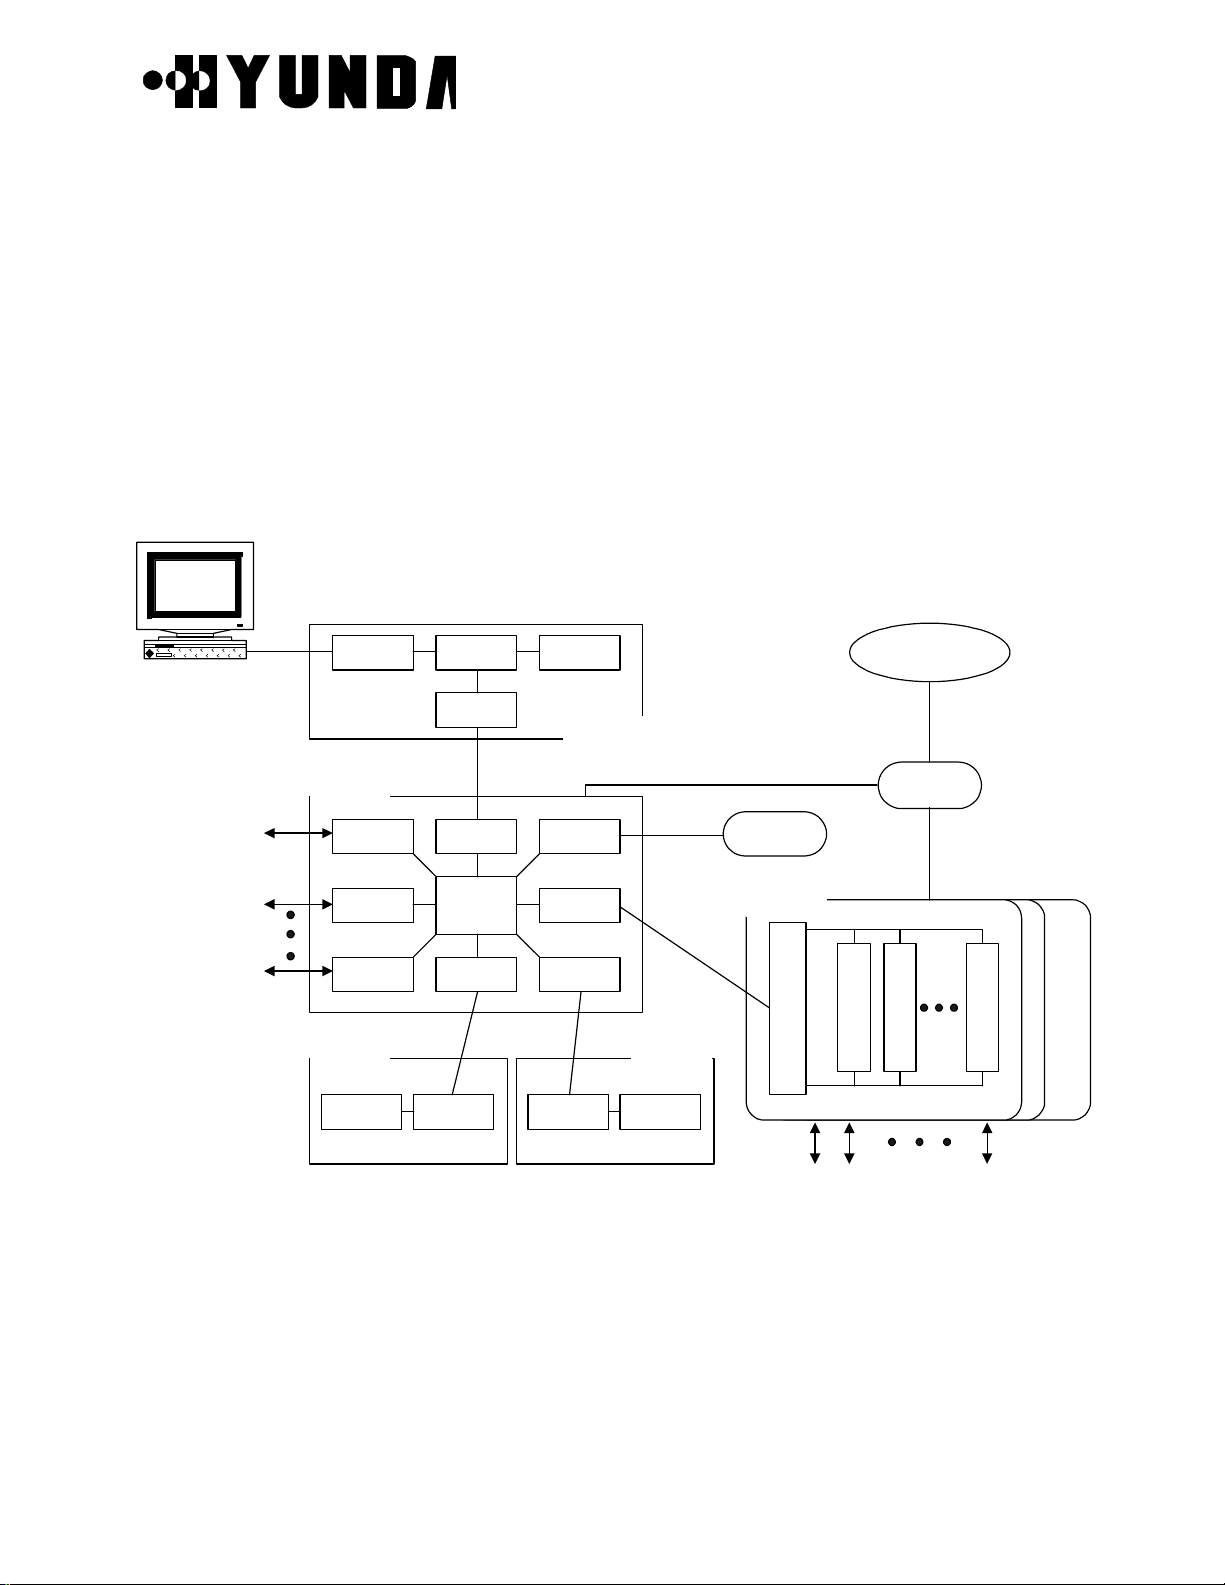
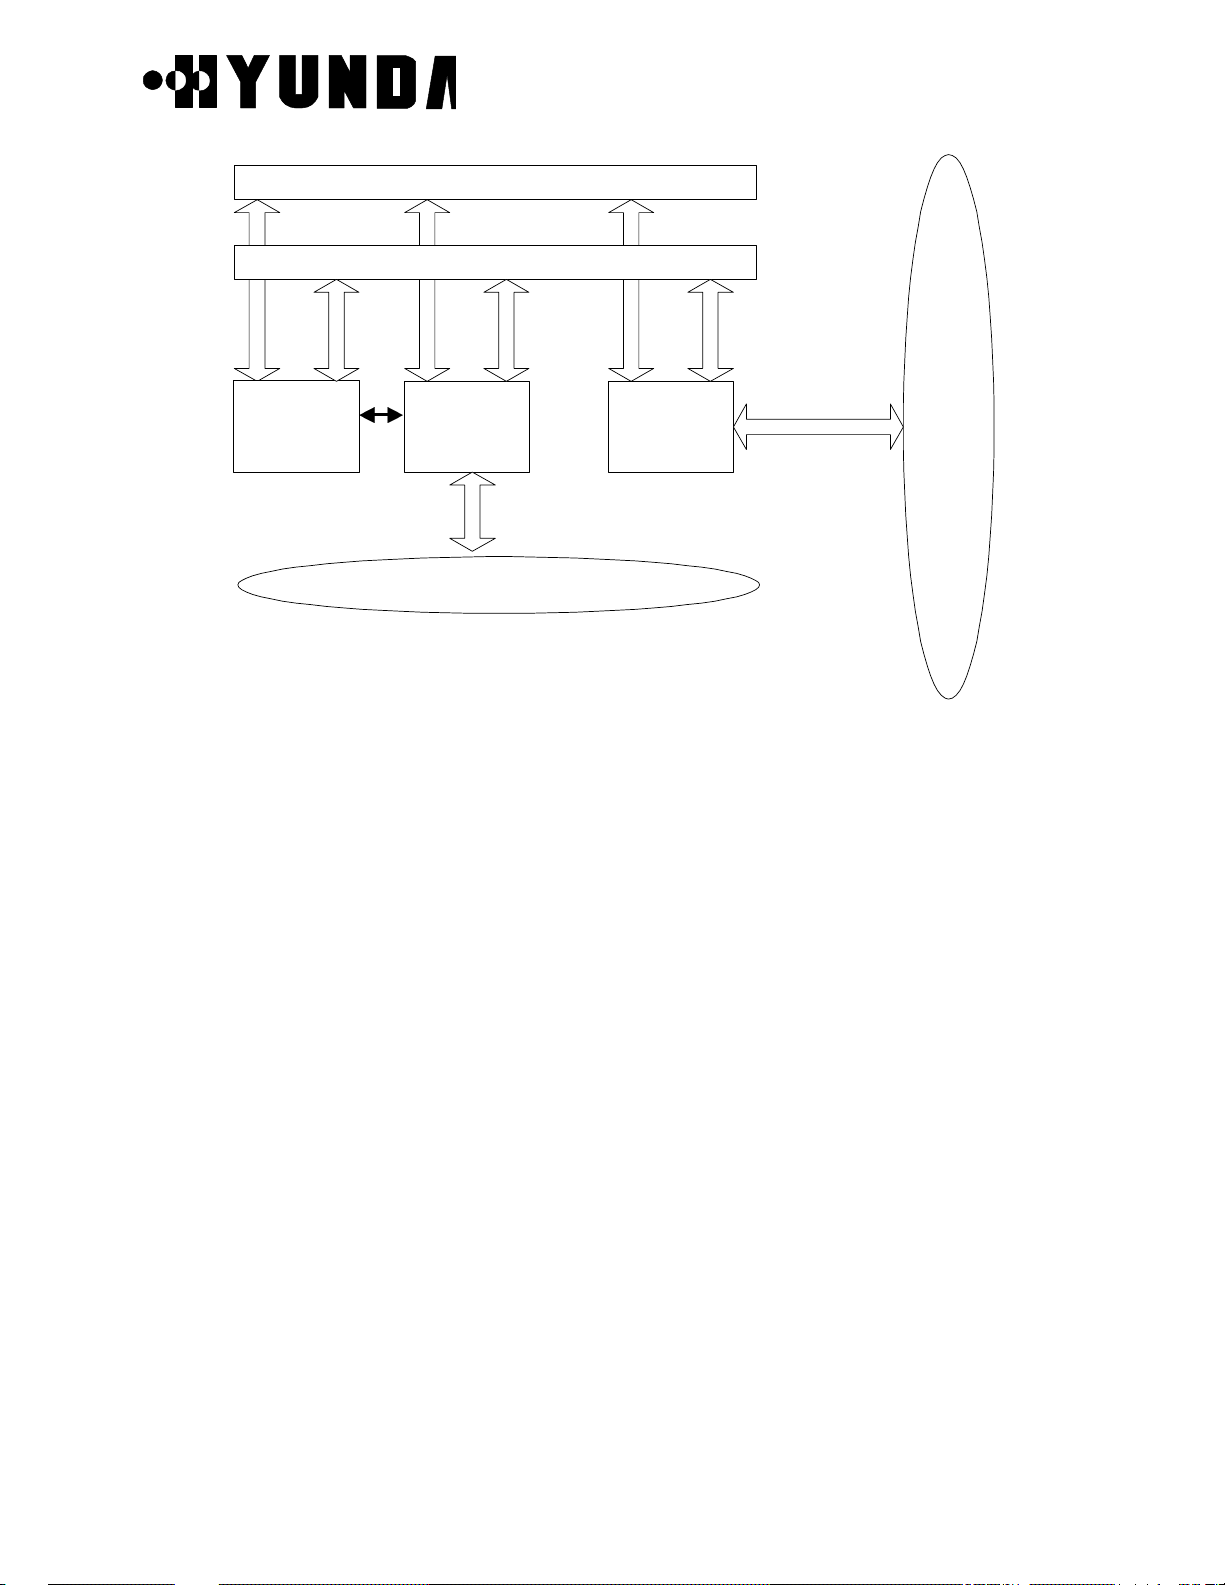
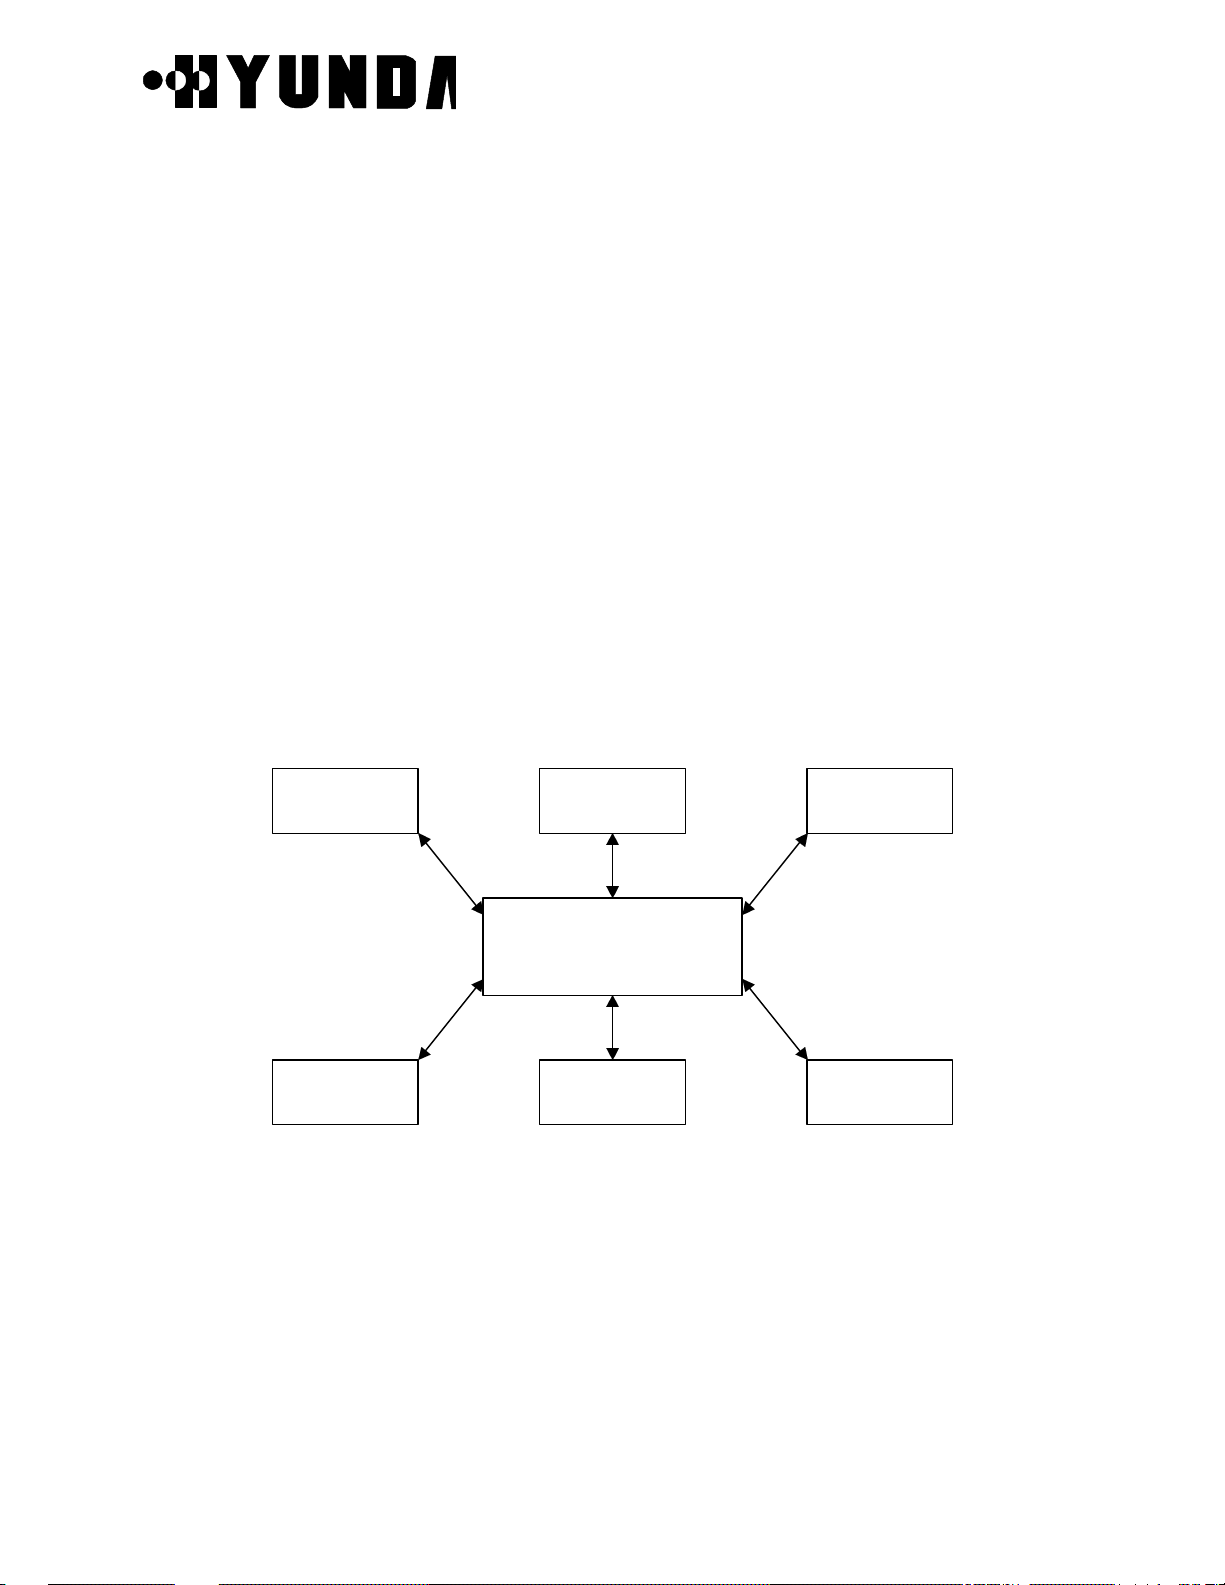
2.2 H/W Structure and Function
2.2.1 Overview
Hardware structure of BSC is shown in Fig.2.2 and traffic and data communication is
accomplished in connection with BTS, CCP, CSB, TSB, BSC-GPS & ACP and BSM with
placing LCIN and GCIN as a Packet Router. For interconnection between BSC, extension
of system is possible using private Router (HRNA-A2). Therefore, structure is designed
that soft handoff is possible between BTSs controlled by different BSCs
BSM
To/From
BTS0
~
BTS59
IPC
LCIN
T1
HRNA
T1
T1
HRNA
HRNA
CCP
MCDA CIFA
HICA HRNAHRNA
HRNA
IPC
HRNA HRNA
HICA
HRNA
HRNAHRNA
IPC IPC
GCIN
MCDACIFA
IPC
CSB
IPC
ACP
TSB
V
S
I
A
BSC-GPS
CKD
SYSTEM BUS
V
V
S
S
O
O
A
A
ST-BUS
To/From MSC
0 1 31
V
S
O
A
T1
Figure 2.2 H/W Structure of BSC
Page 13

User’s Manual
PROPRIETARY & CONFIDENTIAL
2.2.2 Structure of Subsystem
2.2.2.1 LCIN (Local CDMA Interconnection Network)
LCIN receives Packet Data transmitted by each subsystem connected to BSC and routes
the Packet Data to destination address that are added in overhead of Packet.
(1) Functions of LCIN
• CDMA Traffic Information Routing between BTS and TSB
• Information Routing between BTS, CCP.
• Internal information Routing among TSB, CCP, CSB, TFGA-A1 and ACP
(2) H/W Structure of LCIN
After LCIN converts Packet Data which are inputted by each subsystem in BSC to
16-bit parallel data, analyzes Packet Address and converts them again to Serial data
via internal Routing and routes them to corresponding subsystem. LCIN consists of
HICA-A2, HRNA-A2, HNTA-A2 and backboard CHBB-A1 card.
1) HICA-A2 (High-performance IPC Control Board Assembly-A2)
HICA-A2 performs network management functions of LCIN that is made up of
nodes providing communication path between processor of BSC and BTS.
For management of communication network, LCIN have control and maintenance
channel (M-BUS) responsible for fault processing and node status monitoring and
communication channel (U-Link) with other processor. HICA-A2 generates BUS
arbitration control signal between nodes of D-BUS and exchanges common bus for
data of each node. HICA-A2 performs each PBA’s status management and
maintenance of LCIN block, and status management and maintenance of Link.
2) HRNA-A2 (High performance IPC Routing Node Assembly-A2)
HRNA-A2 have 8 Nodes. It is a PBA having the function of node that is basic unit of
IPC (Inter Processor Communication) in LCIN. HRNA-A2 is an interface board by
which each subsystem can be accessed to LCIN. After converting the packet data
that are inputted through RS-422 parallel interface, it outputs the converted data on
packet bus (D-BUS) of LCIN according to the routing control signal of HICA-A2.
HRNA-A2 performs that extracts 3 bytes destination address of Packet Data that is
loaded on D-Bus and accepts the packet only if the compared result of destination
address of Packet Data with node address of itself are equal, then converts it to
serial type and transmits it to each subsystem.
Page 14
User’s Manual
PROPRIETARY & CONFIDENTIAL
HRNA-A2 performs the functions that receives control command from HICA-A2 and
reports the status of HRNA-A2 using dualized serial control bus (M-BUS).
HRNA-A2 has the functions that detects various fault per node and D-BUS fault
occurs in operation, and reports detected faults to HICA-A2 through M-BUS.
HRNA-A2 performs fault recovery functions by initializing fault detected node and
switching of D-BUS.
3) HNTA-A2 (High Performance IPC Node & T1 trunk interface Board Assembly-A2)
HNTA-A2 is used for linking T1 trunk in LCIN. BSC and BTS are accessed each
other through Digital Trunk and HNTA-A2 performs link functions of T1 Trunk Line.
HNTA-A2 performs functions of Node and link of Trunks simultaneously, and have 8
node and 8 T1 digital trunk interface.
HNTA-A2 performs the functions that receives control command from HICA-A2
through M-BUS and exchanges packet between node through D-BUS.
HNTA-A2 performs the functions that tries to recover by fault detection of D-BUS
and monitors and reports the status of Trunk.
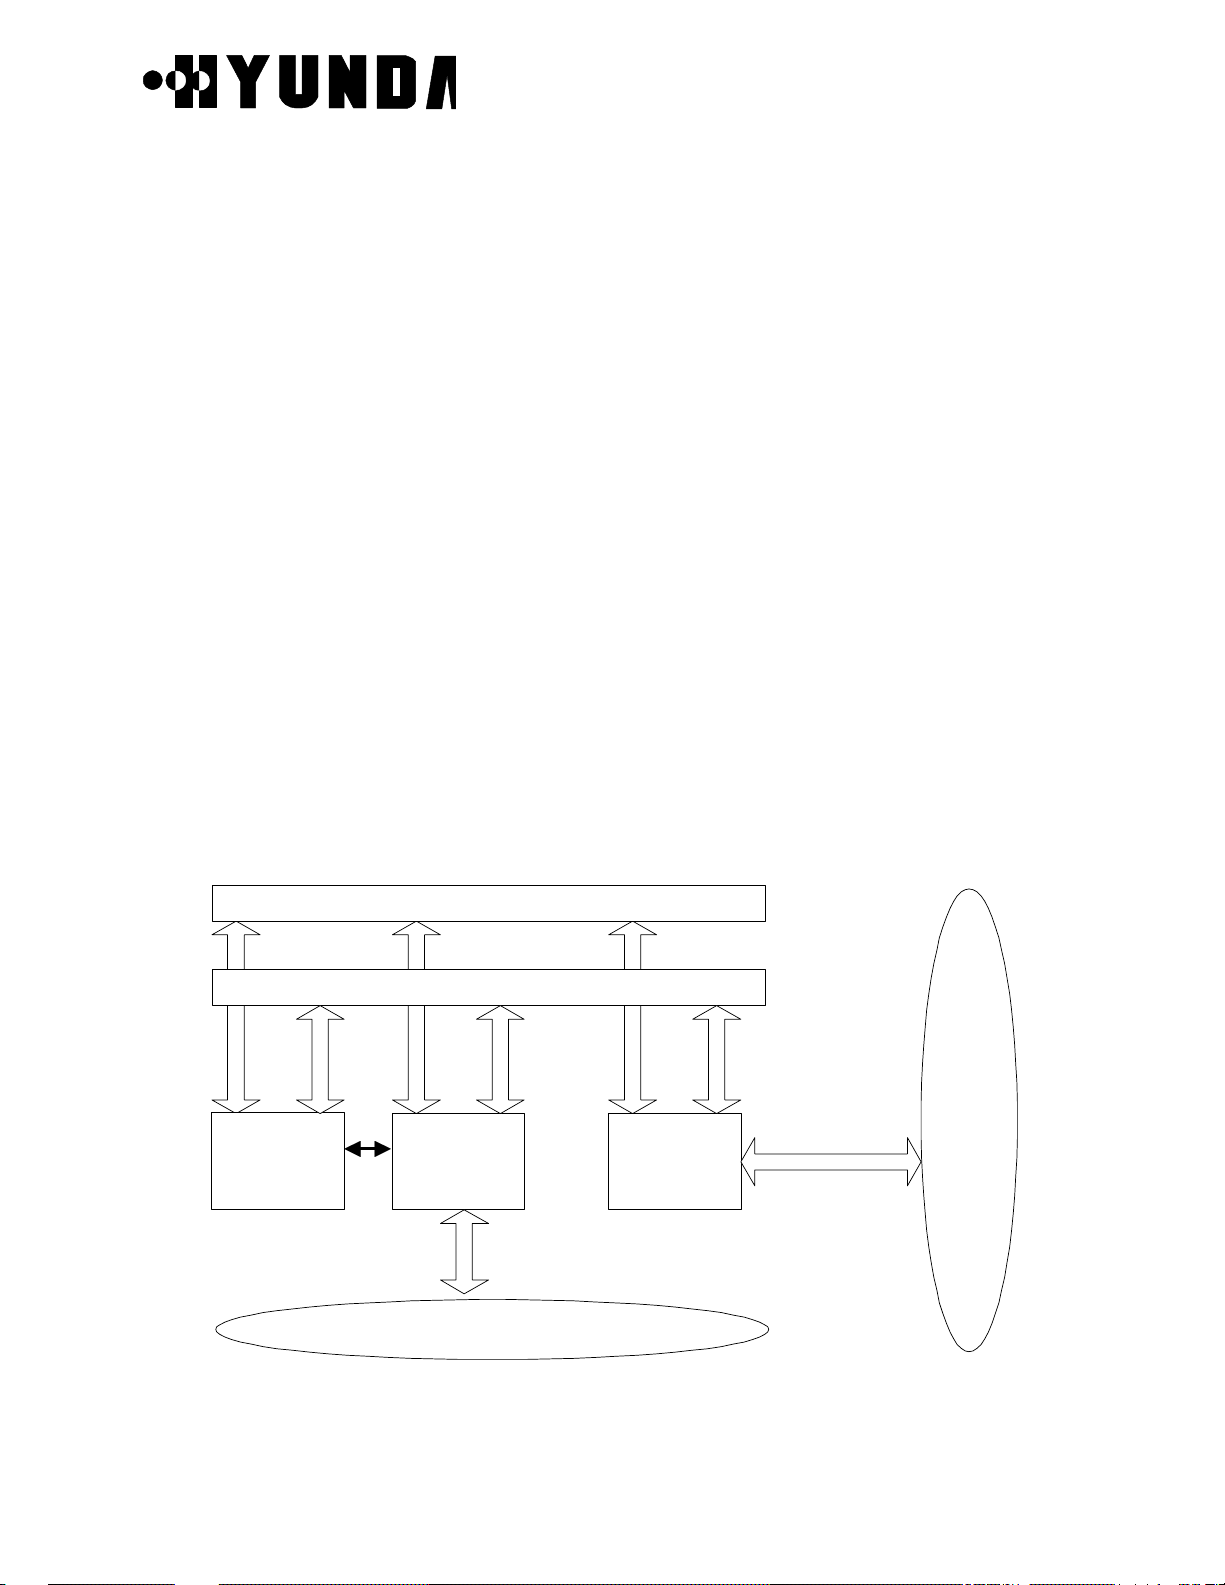
(3) Structure Diagram of LCIN
• LCIN consists of Routing functions based on BSC unit.
• LCIN consists of BTS link interface functions using T1 Trunk Line.
The following Fig.2.3 describes structure diagram of LCIN
Data Bus (D-Bus)Data Bus (D-Bus)
Maintenance Bus (M-Bus)Maintenance Bus (M-Bus)
HICA-A2HICA-A2
u-link
HRNA-A2HRNA-A2
U-LinkU-Link
HNTA-A2HNTA-A2
T1
BTSBTS
BSC Blocks & UnitsBSC Blocks & Units
Figure 2.3 Structure Diagram of LCIN
Page 15

User’s Manual
PROPRIETARY & CONFIDENTIAL
(4) Address System
LCIN uses 3 byte address system enough to process traffic resources in BS (BTS &
BSC).
2.2.2.2 TSB (Transcoding & Selector Bank)
(1) Functions of TSB
• CCP by MSC allocates resources when call setup
• provides information about code transition by mobile and registration in the process of
call processing
• removes vocoder when call releases
• corresponding Card to Channel Element of BTS
• performs vocoder functions of voice
• performs functions of Rate Adaptation of Data and Coder/Decoder
• performs function of Selection for Soft-Handoff
• performs Power Control functions (Forward Power Control & Open Loop Power
Control)
(2) Hardware structure of TSB
• TSB consists of VSIA-C1 connected to LCIN and VSOA-A1 mounted with vocoder
• has 92 Transcoding Channel per TSB 1Unit (T1)
• VSIA-C1 performs functions that receives serial Packet data inputted from LCIN,
converts to parallel data, transmits to VSOA-A1 mounted with vocoder, receives data
vocoded in VSOA-A1 and converted to PCM type through ST-BUS, makes data
multiplex and transmits to MSC.
• VSOA-A1 is mounted with 12 vocoder performs functions that converts QCELP Packet
Data to PCM Voice Code and PCM Voice Code to QCELP Packet Data.
(3) Structure Diagram of TSB
The following Fig.2.4 describes structure diagram of TSB
Page 16
PROPRIETARY & CONFIDENTIAL
MSC ALM
2 T1
ST-BUS
User’s Manual
DSP
DSP
DSP
Module
DSP
Module
Module
Module
T1
CPU
MC68360
HDLC
ST-BUS
ROUTER
I/F
VSIA-C1
RS-422
LCIN CKD
Figure 2.4 Structure Diagram of TSB
2.2.2.3 CCP (Call Control Processor)
ROUTER
ROUTER
VSOA-A1
I/F
I/F
ST-BUS
MCU
AM29240
MCU
AM29240
DSP
DSP
DSP
Module
DSP
Module
Module
Module
(1) Functions of CCP
• performs all of call processing related control functions of BSC
• exchanges CDMA related information among BTS, TSB and MSC
• controls Soft-Handoff and Hard-Handoff
• supports Paging
• controls overload and manages TSB
(2) Hardware structure of CCP, CSB
CCP consists of main processor MCDA and CIFA responsible for inter-processor
communication with HRNA in LCIN.
When using No.7 Signaling mode, CCP system is connected to CSB block through
CIFA-A1 via LCIN block and CSB block transfers this message to MSC through Trunk
after converting this message appropriate for No.7 Protocol.
1) MCDA (Main Control Duplication Assembly)
MCDA communicates with CIFA-A1 using MPS-bus. It is responsible for
communication with dualized block. If Power of MCDA is ON, Booter operates, and
Page 17

User’s Manual
PROPRIETARY & CONFIDENTIAL
MCDA determines whether active or standby of itself through S channel of MFP in
result of negotiation with other MCDA and requests loading. If MCDA operates
normally after OS Loading, MCDA controls call processing and manages Selector.
2) CIFA-A1 (CIN Interface Board Assembly)
CIFA-A1 is an interface board responsible for communication with external and has
functions of MPS-bus link and direct DATA communication with CIN block.
For connection with LCIN, CIFA-A1 transmits and receives control information using
Address Decoding & Zero insertion/deletion, CRC generation and check function
through HDLC Protocol.
3) Structure Diagram of CCP, CSB
The following Fig.2.5 describes structure of CCP
LCIN
VSIA-C1
CIFA-A1MCDA
MSC
Figure 2.5 Structure of CCP
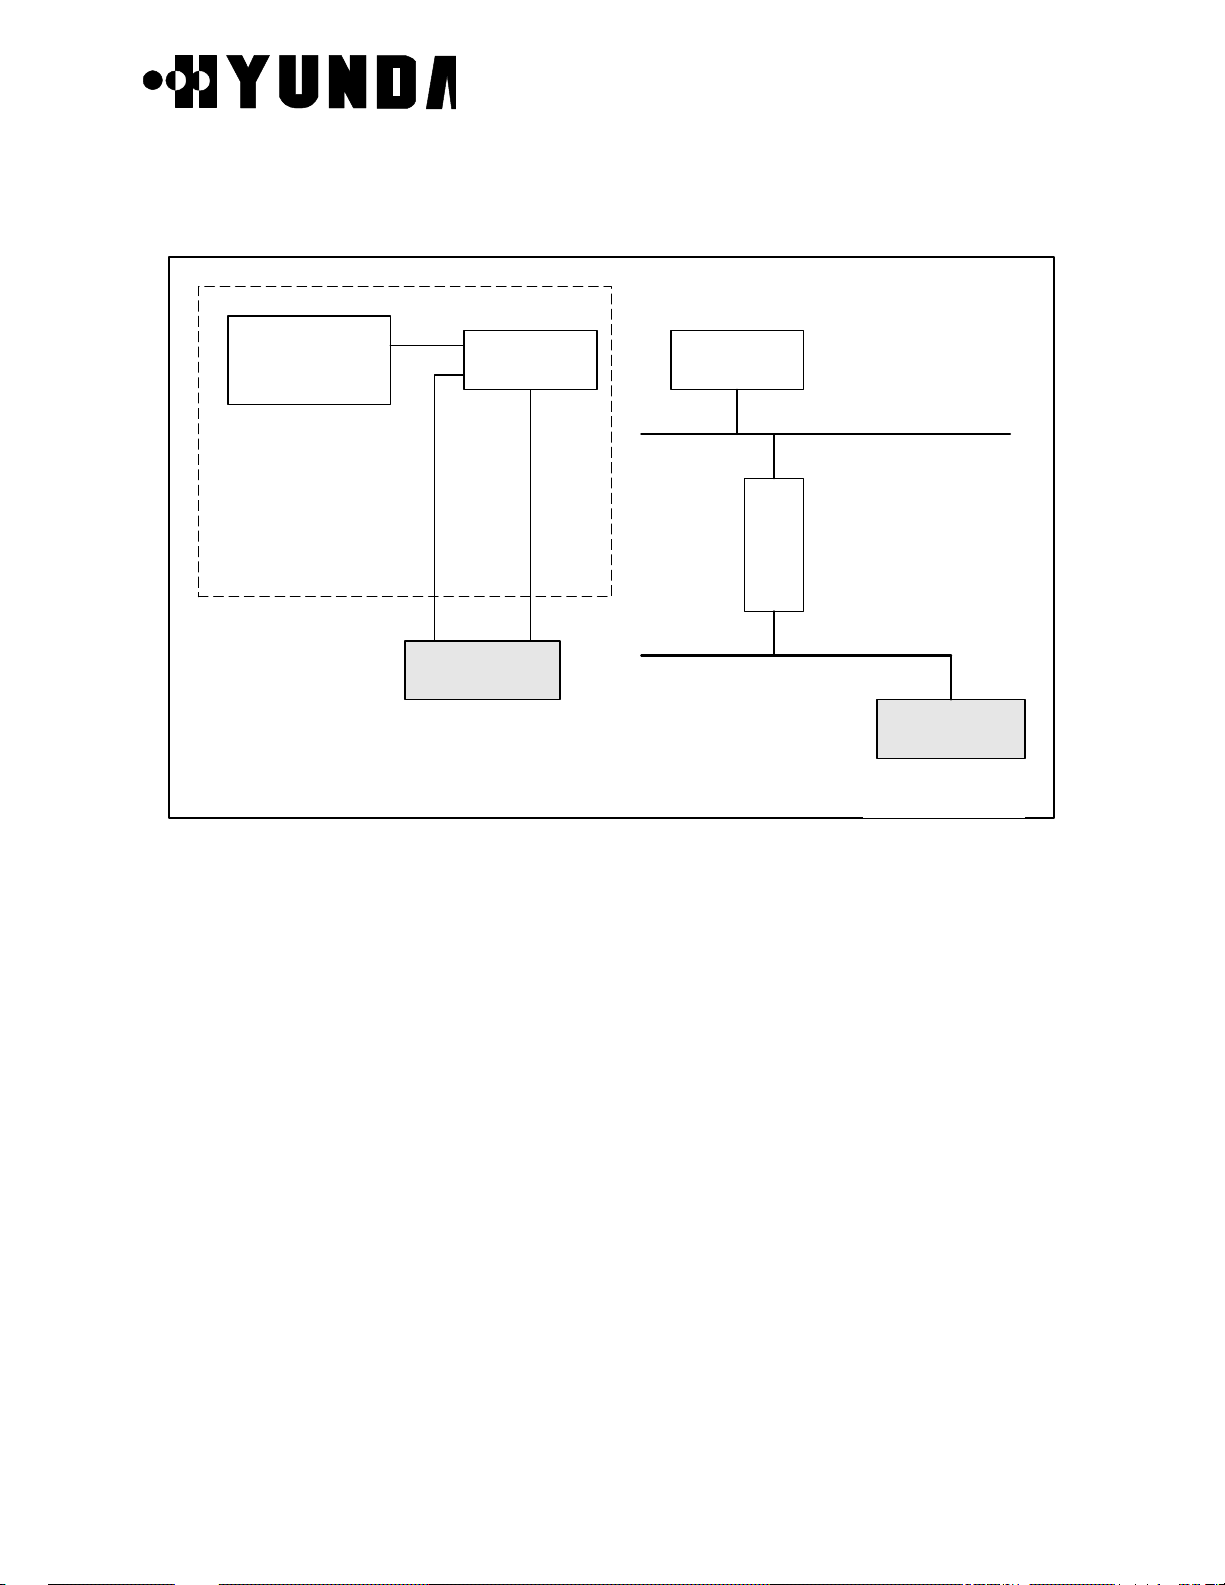
2.2.2.5 BSC-GPS/CKD (Clock Distributor)
(1) Functions of BSC-GPS/CKD
• BSC-GPS block is located in CMNR of BSC (Base Station Controller). When 1PPS and
10MHz from GBSU-A1 (GPS) are inputted to TFSA-A1, then it converts and distributes
them into clock necessary in BSC, and provides them through TFDA-A1 to TSB and
LCIN. Number of providing clocks is 16 in minimum and 32 clocks in maximum.
• Distributed Clock : 4.096MHz, 2.048MHz, 1.544MHz, FP (8KHz), FOI (8KHz), 50Hz,
1Hz
(2) Hardware structure of BSC-GPS/CKD
BSC-GPS/CKD consists of GPS Receiver, TFSA-A1 that receives clock, Clock
Page 18
PROPRIETARY & CONFIDENTIAL
generator (TFGA-A1) and Clock distributor (TFDA-A1).
The structure Diagram of CKD is shown in Figure 2.7.
User’s Manual
GPS
RECEIVER-A
TFSA-A1 TFGA-A1
HDLC
RS-422
TOD
BSM
Figure 2.7 Structure Diagram of CKD
T
F
D
A
RS-422
Clocks
TSB or CIN
16CLK PORT
Page 19
User’s Manual
PROPRIETARY & CONFIDENTIAL
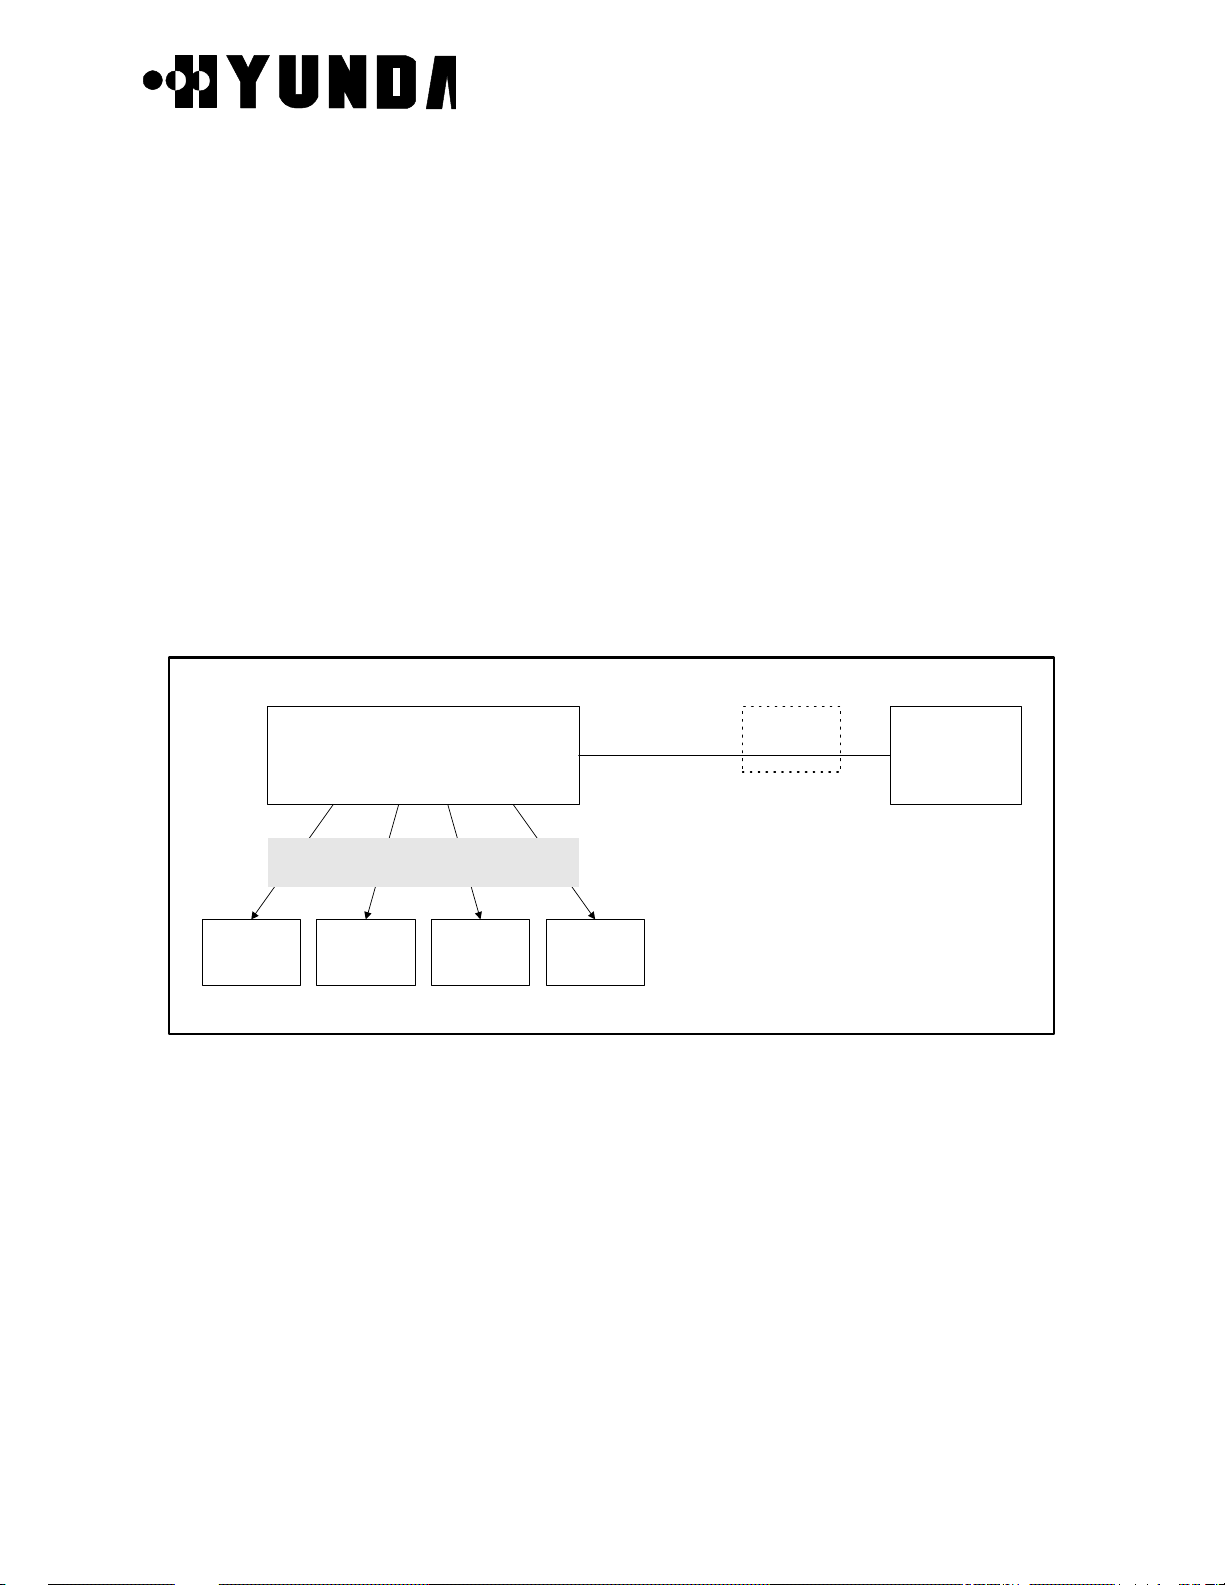
2.2.2.6 ACP (Alarm Control Processor)
(1) Structure and Functions of ACP
ACP block is located in BSC (Base Station Controller) and has functions of collecting
alarm sources of each subsystem by H/W and reporting to BSM by S/W. This block is
mounted one per one BSC and one ACP block is mounted on a ACPA-A1 board and
can monitor 26 alarm ports in maximum. Each alarm port is connected to each
subsystem of BSC more than one and monitors OFF-FAIL of important board and
power module.
If system extends and number of alarm port is increased, additional ACP blocks can be
mounted.
(2) Structure Diagram of ACP
The following Fig.2.8 describes structure diagram of ACP
ACPA-A1 BSM
Alarm Information
CCP LCIN CKD TSB
IPC-HDLC
LCIN
Figure 2.8 Structure Diagram of ACP
2.2.2.7 GCIN (Global CDMA Interconnection Network)
GCIN receives Packet Data transmitted by each subsystem connected to GCIN . GCIN
also receives Packet Data transmitted from a LCIN to other LCIN. GCIN routes the Packet
Data to destination address which are added in overhead of Packet.
(1) Functions of GCIN
• CDMA Traffic Information Routing between LCINs
• Information Routing between LCINs and BSM.
Page 20

User’s Manual
PROPRIETARY & CONFIDENTIAL
• Internal information Routing among TFSA-A1, HICA-A2 , BSM.
(2) H/W Structure of GCIN
GCIN converts Packet Data which are inputted by each link from LCIN or subsystems
in GCIN to 16-bit parallel data, GCIN analyzes Packet Address and converts them
again to Serial data via internal Routing and routes them to corresponding subsystem
or links. GCIN consists of HICA-A2, HRNA-A2, and backboard HSBB-A1 card.
1) HICA-A2 (High-performance IPC Control Board Assembly-A2)
HICA-A2 performs network management functions of GCIN which is made up of
nodes providing communication path between processor of BSC and BTS.
For management of communication network, GCIN has control and maintenance
channel (M-BUS) responsible for fault processing and node status monitoring and
communication channel (U-Link) with other processor. HICA-A2 generates BUS
arbitration control signal between nodes of D-BUS, common bus for data exchange
of each node. HICA-A2 performs each PBA’s status management and maintenance
of LCIN block, and status management and maintenance of Link.
2) HRNA-A2 (High performance IPC Routing Node Assembly-A2)
HRNA-A2 has 8 Nodes. It is a PBA having the function of node which is basic unit of
IPC (Inter Processor Communication) in GCIN. HRNA-A2 is an interface board by
which each subsystem can be accessed to GCIN. After converting the packet data
which are inputted through RS-422 parallel interface, it outputs the converted data
on packet bus (D-BUS) of GCIN according to the routing control signal of HICA-A2.
HRNA-A2 performs that extracts 3 bytes destination address of Packet Data which
are loaded on D-Bus and accepts the packet only if the compared results of
destination address of Packet Data with node address of itself are equal, then
converts it to serial type and transmits it to each subsystem.
HRNA-A2 performs the functions that receives control command from HICA-A2 and
reports the status of HRNA-A2 using dualized serial control bus (M-BUS).
HRNA-A2 have the functions that detects various fault per node and D-BUS fault
occurs in operation, and reports detected faults to HICA-A2 through M-BUS.
HRNA-A2 performs fault recovery functions by initializing fault detected node and
switching of D-BUS.
(3) Structure Diagram of GCIN
• GCIN consists of Routing functions between LCINs.
• GCIN consists of Routing functions between subsystems in GCIN.
The following Fig.2.9 describes structure diagram of GCIN
Page 21
PROPRIETARY & CONFIDENTIAL
Data Bus (D-Bus)Data Bus (D-Bus)
Maintenance Bus (M-Bus)Maintenance Bus (M-Bus)
User’s Manual
T1/E1
HICA-A2HICA-A2
HRNA-A2HRNA-A2
u-link
BSC Blocks & UnitsBSC Blocks & Units
HNTA-A2/HNTA-A2/
HNEA-A2HNEA-A2
U-LinkU-Link
BTSBTS
Figure 2.9 Structure Diagram of GCIN
(4) Address System
GCIN uses 3 byte address system enough to process traffic resources in BS (BTS &
BSC).
Page 22

User’s Manual
PROPRIETARY & CONFIDENTIAL
2.3 S/W Structure and Function
2.3.1 Overview
Software of CCP and TSB consists of an operation and maintenance Software and a
control and resource management Software of each subsystem.
Software of BSM can largely be divided into an operation function and a general function.
The operation function consists of a software taking charge of system loading, system
structure management and performance management and a software taking charge of
maintenance function that detects, isolates and recovers abnormally-running device.
The general function consists of software taking charge of data communication function,
data management function, and manager link function.
2.3.2 Structure
2.3.2.1 CCP Software
(1) CCOX (Call Control eXecution)
• Origination and Termination call processing processed by the unit of Process CCOX
registers and manages their call by the unit of Process and releases Process by Call
Release function.
• Origination call processing, in case of receiving Call Request of Handset from BS,
allocates selector and ensures traffic channel by using resource allocation function
and requests Call Setup to MSC. If the approval from MSC is identified, Call Setup of
Origination call processing is completed
• Termination call processing, in case of receiving Paging Request from MSC, allocates
selector and ensures traffic channel by using resource allocation function and
completes Call Setup of termination call processing
• Origination and Termination Call Release are performed in case of requesting Call
Release by telephone network subscriber or Handset, and cause Call Path and
wireless channel and inform it of data processing function
• also, performs designated path CALL SETUP and CALL TRACE function
Page 23

User’s Manual
PROPRIETARY & CONFIDENTIAL
(2) CDAX (CCP Database Access eXecution)
• It is a library that supplies various functions able to read, write and access the
operation information in CCP and the PLD saving configuration information.
(3) CRAX (CCP Resource Allocation eXecution)
• initialization of configuration information of CCP
• statistics library supply
• available call resource library supply
(4) CMMX (CCP Measurement Manager eXecution)
This block has a function for measurement and statistics processing.
• statistics data collection & measurement
• statistics data report
• linking with call processing S/W & library call
• statistics count decision (event collection /accumulation/totalization)
(5) CDIAX (CCP DIAgnosis eXecution)
It consists of diagnostic function and performance drop prevention function by
diagnosis in initialization and system operation
• diagnosis for process, Device, path
• automatic diagnosis for vocoder and link
(6) CSHX (CCP Status Handling eXecution)
It consists of functions for state management of system
• processor state checking
• management of vocoder and link state
• information supply for available resource
(7) CRMX (CCP Resource Management eXecution))
It consists of functions for resource configuration management
• configuration control of resource
• resource data processing by MMC
• common data (BCP&CCP Common Data) loading and data display
(8) CPLX (CCP Process Loader eXecution)
It consists of initial Loading and Loading function in operation.
• Start and Restart of initial system
Page 24
User’s Manual
PROPRIETARY & CONFIDENTIAL
• Start and Restart of process
• Stand-by Loading
• initialization (data initialization, process initialization and state identification)
2.3.2.2 Software Structure of CCP
The following Fig.2.10 describes S/W structure of CCP
CCOX CRMX
CDIAX
2.3.2.3 TSB S/W Structure
PLD
CDAXCSHX
CRAX
CPLX
CMMX
Figure 2.10 S/W Structure of CCP
TSB S/W (from now on, SVPX) is the S/W block driven over VSOA board, since two
Processors exist in one board, each Processor process six channels. SVPX processes
traffics and signals coming from Mobile, CE and CCP. SVPX consists of following Tasks.
[Refer to Fig.2.11]
Page 25
User’s Manual
PROPRIETARY & CONFIDENTIAL
Vocoder
Main Task
CCP msg
routine
Call proc Task
Layer2 Task
Rx Int Server
Handoff Task
Power Control
Task
Tx Int Server
Voice
29K Driver
Signal
CCP
BTS
(CE)
Figure 2.11 TSB S/W Structure
(1) 29K Driver
As initial Task after SVPX is loaded , it initializes processor and plays an interface role
between AP and Devices. Other tasks are processed over this Driver
(2) Main Task
If main task takes over control from Driver, it initializes Queue and Vocoder state and
generates task and initializes it.
Page 26

User’s Manual
PROPRIETARY & CONFIDENTIAL
(3) Rx Interrupt Server
Traffic Frame transmits and receives one frame every 20msec per call. Some of
reverse frame coming from Mobile every 20msec contain a vocoded voice data and a
CAI (Common Air Interface) message for call processing.
The Voice data is transmitted into Vocoder, the CAI message is transmitted into
Callproc Task, and control message coming from CE is also transmitted into Callproc
Task.
Rx Interrupt server estimates frame quality by Quality Metric value and transmits that
into Reverse Power Control, practices Rx Frame Selection in case of handoff.
(4) Tx Interrupt Server
It makes Forward Frame every 20ms and also transmits that. In case of handoff, it
multicasts to maximum three BTSs.
(5) Layer2 Task
It processes ACK_SEQ, MSG_SEQ and ACK_REQ field of respective message to
accomplish reliable message exchange between Mobile, CE and BS.
It processes Ack of a receiving message and retransmits a transmitting message in
case of necessity
(6) Callproc Task
It performs appropriate call processing according to signal from Mobile, CE and CCP.
(7) Handoff Task
In case of processing control message related to Handoff, it is according to handoff
decision of CCP. And it performs corresponding handoff type. Handoff type is largely
divided into SOFTER H/O, SOFT H/O and HARD H/O.
(8) Power Control Task
According to PMRM (Power Measurement Report Message) or Erasure Indicator Bit
coming from Mobile, it performs Forward Power Control indicating Forward Traffic
Channel Gain adjustment into CE every 20ms and indicates Reverse Traffic Power
adjustment of Mobile through CE every 1.25ms, after checking FER of Reverse Traffic
Frame
2.3.2.4 BSM Software
Page 27
PROPRIETARY & CONFIDENTIAL
(1) CDMX (Configuration Data Manager eXecution)
1) Block Summary and Working Function
A CDMX block manages some data such as operation parameter requested to
perform Inherent function of BTS and BSC subsystems and hardware placement
information. Also, the CDMX receives a command through manager link in BSM to
supply coherence of data alternation and adaptation and processes that. And the
CDMX saves the processed result in database and reports it to manager.
The CDMX consists of a CDM_interface unit which makes corresponding function
work by analyzing the message received from UIM (User Interface Manager), a
PLD_access unit for PLD access and a Data_send unit for data transmission into
subsystem. After classifying the received message, The CDMX process the
command and sends the processing result to UIM
2) Block Flowchart
User’s Manual
The following Fig.2.12 describes CDMX block flowchart.
a. informs BIM that CDM is in normal state.
b. sends the processing results received from UIM for mamager's command for
data processing.
c. In case of Data Change Request, send data to the CRM and receive result.
d. receives a PLD Change Request Message from the APP
e. sends processing result to the APP.
BIM UMH BSM APPs
a
c
CDMCRM UIM
b
d
e
PLD
Page 28

PROPRIETARY & CONFIDENTIAL
Figure 2.12 CDMX block flowchart
User’s Manual
Page 29
PROPRIETARY & CONFIDENTIAL
(2) SLX (System Loader Execution)
1) Block Summary and Working Function
During initialization of CCP and ACP subsystem, a SLX loads application blocks
performed in CDMA system into CCP and ACP. The SLX renew database to
manage loading history according to location information and state of system loaded
in case of performing loading of each subsystem.
Function related to CCP out of Subsystem Restart and Block Switch function by
MMC is processed by CPL. Function related to BCP, SIP and SVP is performed by
inter-working with CPL, Booter of BCP, SIP, SVP, and PL. It supplies a loading
history by MMC for manager.
Also, The SLX removes specific block out of application blocks performed in each
subsystem or adds application block to specific subsystem.
2) Block Flowchart
User’s Manual
The following Fig.2.13 describes SLX block flowchart.
CDM UIM FLM
SL
CBOOT ACP BOOTCPL
Figure 2.13 SLX Block Flowchart
(3) SMMX (Statistics Measurement Manager eXecution)
1) Block summary and working function
A SMMX block requests BSC system to measure performance data. The SMMX
processes statistics of the measured data, saves it and outputs it. Also, the SMMX
outputs statistics report output according to user’s request by using a periodically
Page 30
User’s Manual
PROPRIETARY & CONFIDENTIAL
receiving performance data in BSC system. The SMMX can stop and start the
measurement on system.
Software unit of SMM block consists of Command Processing Part, Signal Message
Format Processing Part, Screen Output Format Part, and Database Processing
Part. Command Processing Part processes command inputted by manager. Signal
Message Format Processing Part formats the signal message which will be
transmitted. Signal Message Unformatting Processing Part unformats the signal
message. Screen Output Format Part outputs a statistical data on the BSM
message output window. Database Processing Part manages the statistical
database.
2) Block Flowchart
The following Fig.2.14 describes SMMX block flowchart.
DCI
block
Message Queue
Message Queue
Figure 2.14 SMMX Block Flowchart
BIM block
Message Queue
SMM block
Memory Map
Statistics Database
UIM block
Page 31

PROPRIETARY & CONFIDENTIAL
(4) FLMX (FauLt Management eXecution)
1) Block Summary and Working Function
A FLMX block has functions which process a fault and alarm message caused at
BTS and BSC system. The received fault message of the FLMX block is related to
the Fault detected by test and maintenance function of BTS and BSC system. If the
state of fault is serious (i.e. fault classified into alarm), the FLMX informs manager of
that by driving a message and an audible and visible alarm after deciding
corresponding alarm grade. If the FLMX receives a command from manager, the
FLMX initializes the database that has the current state information of alarm. Also
the FLMX initializes a database for visible alarm which appears at the terminal and
a database for audible alarm.
2) Block Flowchart
The following Fig.2.15 describes FLMX block flowchart.
User’s Manual
a. receipt of manager’s command from UIM block and report of result.
b. report Alarm and Fault processing result to OFH block .
c. send signal to STM block.
d. receipt of GPS state alarm from the SCM block
e. receipt of H/W alarm from ACP block
f. receipt of alarm from CIN
g. receipt of LCIN S/W alarm from CCP
h. receipt of BTS S/W alarm from BMP
Page 32

User’s Manual
PROPRIETARY & CONFIDENTIAL
UIM OFH
a b
c d
STM
f
CCP
BSCBSC
(5) TSMX (TeSt Manager eXecution)
1) Block Summary and Working Function
ACP
Figure 2.15 FLMX Block Flowchart
BSMBSM
FLM
eg
SCM
h
BMPGCIN
Micro-BTSMicro-BTS
A TSMX block tests for the fault diagnosis of BTS and BSC system. The TSMX
consists of a unit which analyzes command of manager, a unit which packs to send
the analyzed message to corresponding subsystem, a unit which analyzes a
execution result transmitted from subsystem and a unit for accessing database.
Also, the TSMX consists of a Temporary Processor executed by manager’s request
and a Permanent Processor which performs data management and processing of a
receiving message.
2) Block Flowchart
The following Fig.2.16 describes TSMX block flowchart.
a. Test Request for DEVICE
b. Response for DEVICE Test Request
c. Test Request for BTS LINK and Channel Element
d. Response for BTS LINK and Channel Element Test Request
e. Test Request for Vocoder
f. Response for Vocoder Test Request
g. Request for virtual call test and BTS output adjustment
Page 33

User’s Manual
PROPRIETARY & CONFIDENTIAL
h. Virtual test and BTS output adjustment result
i. Virtual Call Set up Request and BTS output adjustment Request
j. Virtual Call Set up and BTS output adjustment result
k. BTS output adjustment Request
l. BTS output adjustment result
m. antenna test, remote call test and test terminal operation information output
Request
n. antenna test, remote call test result and test terminal operation information
i
CCOX
g
BDIAX
(6) STMX (Status Management eXecution)
1) Block Summary and Working Function
j l
h
a b
c
d
Figure 2.16 TSMX block flowchart
k
BCOX BTCA
m
n
TSMX
e
f
TMNXCDIAX
A STMX block displays the things (which result from monitoring state of main
processors in BSC system and searching each processor and device state and call
resource state of BSC and BTS system, in case of manager’s demand) on
manager’s screen .
The STMX also manages and maintains BTS and BSC system or state of device
with interworking with the structure management and the fault management
function.
There are some functions in STMX, a monitoring function of BSC main processor
Page 34

User’s Manual
PROPRIETARY & CONFIDENTIAL
state, a processor and device state search function of BTS and BSC by manager’s
request, a overload Control function and a call resource state search function of
GUI (Graphic User Interface) screen.
The function monitoring Processor state is to monitor action state of these
subsystem by polling CCP, ACP, HICA, TSGA processor periodically. The
processor and device state search function of BTS and BSC by manager’s request
has a responsibility for request and output for device state which each subsystem is
managing now.
The overload control function is to output overload state of CCP and BCP and
change overload critical value of CCP and BCP.
The call resource state search function of GUI screen is ,when manager is on call
resource state screen, to reflect it on screen by searching current accurate call
resource state periodically.
2) Block Flowchart
The following Fig.2.17 describes STMX block flow chart.
Figure 2.17 STMX Block Flowchart
a Monitoring and Request of ACP Processor State
b Report of ACP Processor State
c Monitoring of CCP Processor State, State Request of processor and devices,
Overload Control and Report of State
d Monitoring of CCP Processor State, State Report of processor and devices,
Report of Overhead State
e Monitoring and Request of TSGA Processor State , Request of TFDA State
f Report of TSGA Processor State , Report of TFDA State
g Monitoring of GCIN/LCIN Processor State, Request of GCIN/LCIN/BIN
Processor and Node State and Request of Active Side Switch
h Report of GCIN/LCIN Processor State, Report of GCIN/LCIN/BIN Processor
and Node State, Report of Active Side Switch
Page 35

User’s Manual
PROPRIETARY & CONFIDENTIAL
i Request of TFSA and GPS Processor State
j Report of TFSA and GPS Processor State
k Request of SACA Processor State
l Report of SACA Processor State
m Request of BTS Processor and device State and Request of Overload Control
and State
n Report of BTS Processor and device State and Report of Overload State
(6) DCIX (Data Communication Interface eXecution)
A DCIX block supplies a path for transmitting/receiving a management information
between application blocks in BSM and other subsystems in BTS and BSC system,
and communicates with other system by HDLC.
Communication with other system is accomplished through RS-422 at the speed of
2.048Mbps. and a data link uses point-to-multipoint method.
The DCI block is generated by BIM block, initializes a necessary data for setting up a
data link between other subsystems and must be in a standby state to set up the data
link with other subsystem .
Application block in BSM (in case of establishing data link) or DCI block (in case of
receiving message from other subsystem) must perform procedure which processes
this message.
(7) DBHX (DataBase Handler eXecution)
1) Block Summary and Working Function
A DBHX block establishes, initializes and manages a database which application
block in BSM need.
The DBHX block consists of a DBD (DataBase Definition) software unit and a
DBM (DataBase Management) software unit.
The DBD function is to generate a database through setting up relation between
each entities to remove overlap properties of data which each application block
needs.
The DBM supplies a function which ,in case of using a database of a application in
BSM, processes the data efficiently and exactly.
Page 36

PROPRIETARY & CONFIDENTIAL
2) Block Flowchart
The following Fig.2.18 describes DBHX block flow chart.
User’s Manual
Message Queue
Figure 2.18 DBHX Block Flowchart
(9) UIMX (User Interface Manager eXecution)
1) Block Summary and Working Function
A UIMX block performs all functions related to window such as creation and removal
of window and event processing, and supplies a function which outputs a system
state and information as to alarm and statistics with simply and logically
recognizable graphic type
DBH blockBIM block
Memory Map
BSM DATABASE
UIM block
Also, the UIMX processes events caused from manager and displays a information
supplied from each application block on manager’s terminal screen with text or
graphic. Also, the UIMX block supplies a command input type about GUI (graphic
user interface) such as menu and dialogue box .
After formatting a voluntary message received from system (i.e. fault and alarm
message, state, statistics report and test result) , the UIMX block displays that on
the system display window.
2) Block flowchart
The following Fig.2.19 describes UIMX block flowchart.
Page 37

User’s Manual
PROPRIETARY & CONFIDENTIAL
fork
U
I
M
(10) COHX (COmmand Handling eXecution)
1) Block Summary and Working Function
A COHX block performs a syntax and meaning analysis function of input command
and a execution control function. The Syntax analysis checks the accuracy of the
read
fork
Figure 2.19 UIMX Block Flowchart
BIM
write
Message
Queue
COH
write
APP
pipe (r/w)
grammar of a inputted command and the Meaning analysis checks the meaning of
command and the range of parameter.
If format error occurs on analysis procedure, Command Analysis block supplies the
location of error, the kind of error and the information for error correction.
On the other hand, if analysis result of command prove to be out of error, the
command drives application function to perform the command, receives execution
result from application function and displays it on display window by transmitting it
into UIM block.
2) Block Flowchart
The following Fig.2.20 describes COHX block flowchart.
Page 38

User’s Manual
PROPRIETARY & CONFIDENTIAL
input command
output command
Figure 2.20 COHX Block Flowchart
(11) BIMX (BSM Initialization and Maintenance eXecution)
1) Block Summary and Working Function
fork
pipe
COHCOH
CDD
CDD
file
file
fork
pipe
Application Blocks
(FLM, SL, STM,
TSM, CDM, SMM)
A BIMX block is first initiated at the BSM software. Also, the BIMX block is initiated
in case of booting of BSM system or by manager. In case of initialization of BSM,
BIM initializes all necessary internal data of BSM, executes a permanent process
block and initializes a necessary IPC function for data communication between
blocks in BSM.
If all block is run, BIM monitors the action state of permanent process. while, If the
action of these process is stopped abnormally, BIM takes an appropriate recovery
procedure and reports this fact to manager.
2) Block Flowchart
The following Fig.2.21 describes BIMX block flowchart.
a. SCM drive and state management by BIM
b. DCI drive and state management by BIM
c. BSM application- part drive and state management by BIM
d. UIM drive and state management by BIM
e. LJH drive and state management by BIM
f. UIM drive and state management by BIM
g. UMH drive and state management by BIM
Page 39

PROPRIETARY & CONFIDENTIAL
B I M
User’s Manual
SCM
DCI
(12) UMHX (Unsolicited Message Handler eXecution)
1) Block Summary and Working Function
In case of receiving a initial message from BTS or BSC system, a UMHX block
generates a corresponding application block for processing the message and let it
perform the requested application function.
After adding a corresponding permanent process ID to the received message, the
BSM Ap-part
SL,CDM
SMM, STM
TSM, FLM
etc.
Figure 2.21 BIMX Block Flowchart
LJH
UIM
UMH
UMHX makes the corresponding process the message by transmitting it into a
message Queue. The UIM block is driven as a permanent processor by BIM block.
After reporting current state to BIM block, if UIM receives processors of STM, SMM,
TSM, FLM and SL block from BIM block, before receiving a system output message
corresponding to STM, SMM, TSM, FLM and SL block, after UMH block prepares
for receiving the system output message of other subsystem, when a corresponding
message is delivered, the UMH block analyzes Signal_id and performs a function
which generates a corresponding block in BSM.
2) Block Flowchart
The following Fig.2.22 describes UMHX block flowchart.
a. BIM reports UMH drive and drive state to the BIM
b. receipt of unidentified initial message
c. Temporary processor generation and message transmission and management
Page 40

User’s Manual
PROPRIETARY & CONFIDENTIAL
d. permanent processor id management and corresponding message transmission
e. transmit UMH state information into the UIM
B I M
Permanent
Processor
(SL, SMM,
STM, TSM,
FLM)
DCI
b
Figure 2.22 UMHX Block Flowchart
(13) LJHX (Long-term Job Handler eXecution)
1) Block Summary and Working Function
A LJHX block performs a application function by generating a application block
which requires a long time requested by manager and manages the state of this.
d
UMH
a
c
e
Temporary
processor
SL, CDM
UIM
The LJH block is driven as a permanent processor by BIM block. And after reporting
current state to BIM block, the LJH block prepares for generating a processor which
requires the long time requested by manager.
If the LJHX block receives a processor performed for long time by manager’s
request, the LJHX performs a function which generates a corresponding block in
BSM by analyzing the corresponding command
2) Block Flowchart
The following Fig.2.23 describes LJHX block flowchart.
Page 41

User’s Manual
PROPRIETARY & CONFIDENTIAL
BIM
JH block
Message
Queue
Message
Queue
Figure 2.23 LJHX Block Flowchart
(14) SCMX (System Clock Manager eXecution)
1) Block Summary and Working Function
A SCMX block receives periodically TOD (Time Of Day) from GPS, sets up BSM
Message
Queue
Manager request
block
Message
Queue
UIM block
time and reports that to application block which requires TOD. The SCM block is
driven as a permanent processor by BIM block .
After reporting current state to BIM block, the SCM block prepares for receiving
TOD
Clock from GPS every two seconds. In case that the receiving Clock is out of error,
the SCM block compares it with current BSM System Clock.
If range of error is within 3 second, the SCM block don’t reset the BSM System
Clock, and If range of error is over 3 second, the SCM block resets the BSM System
Clock.
2) Block Flowchart
The following Fig.2.24 describes SCMX block flowchart.
a. BIM control SCM drive and drive state
b. receive TOD Clock from GPS
c. transmit SCM state information into the FLMX
Page 42

PROPRIETARY & CONFIDENTIAL
BIM
User’s Manual
a
GPS SCM
Figure 2.24 SCMX Block Flowchart
b
c
FLMX
Page 43

PROPRIETARY & CONFIDENTIAL
2.3.2.5 BSM Software Structure
The following Fig.2.25 describes BSM system s/w block structure
Figure 2.25 BSM System S/W Block Structure
User’s Manual
Page 44

User’s Manual
Chapter 3 BSM Operation & Administration
3.1 BSM Operation
3.1.1 Overview
This chapter describes the operations and functions of BSM (Base Station Manager) which
takes a part of system operation, administration, and maintenance of the subsystems of
BSC (Base Station Controller) in the mobile communication systems.
BSM provides GUI (Graphic User Interface) for OAM (Operation, Administration, and
Maintenance) which is status monitoring, performance measurement, statistics processing,
configuration management, alarm handling and so on. So, operators can use and
understand easily.
Figure 3.1 represents the initial display window of BSM when you start the BSM system up
in the workstation with the command, “bimx” without logging in it.
Figure 3.1 BSM Initial Display
Page 45

User’s Manual
3.1.2 Main Display Structure
When you log in BSM with the specific user ID and password, the window such as Figure
3.2 is displayed.
Figure 3.2 BSM Main Display
3.1.3 Main Button
3.1.3.1 Operation by “Login” Button
Page 46

User’s Manual
You can use the command for the CDMA System and service for the User by using login.
Figure 3.3 represents the login dialog box in BSM.
(1) Login Procedure
1) If you choose the "Login" Button in the main display window, "Login Dialog"
window is displayed.
2) You input the Login name and Password in the "Login Dialog" window and then
press the "OK" Button.
3) When the wrong spell is inputted or the login name or password is mistyped, the
login name or password, you can modify it using "Back space" key or "DEL" key.
Figure 3.3 BSM Login Window
Page 47

User’s Manual
3.1.3.2 Operation by "History" Button
(1) If you choose the "History" button such as Figure 3.4 in the BSM Tile window, "History
Tool" window is displayed like Figure 3.5.
Figure 3.4 HISTORY Button
Figure 3.5 History Tool
(2) In the "History Tool" window, "File Handling" item functions "Display", "Print", and
"Delete" of the history file. The user of being good at UNIX system uses "VI Editor"
item to do them. First, if you press the "File Handling" button, "File Selection Dialog"
window such as Figure 3.6 displays.
Page 48

User’s Manual
Figure 3.6 File Selection Dialog
(3) If you choose a certain date of date list in the "Directories" field of "File Selection
Dialog" window and then press the "Filter" button, "CHD" and "MHD" directories
display in the "Directories" field (Because both directories are operated in the same
manner, here deals with only the "CHD" directory).
(4) If you choose "CHD" directory and then press "Filter" button, a lot of files display in the
"Files" field, which is stored to command list by the elapsed time.
(5) If you choose a file of the list in the “Files” field of “File Selection Dialog” and press
“OK” button, the following window such as Figure 3.7 is represented. This list is sorted
to time.
Note – You can also use this shortcut: double-click the file name in the dialog box.
Page 49

User’s Manual
Figure 3.7 Result of “File Handling”
(6) Figure 3.7 shows the function of searching words. If you enter the word that you want
to search in the “Search : “ Text Field and push the Arrow Button () (or enter the
RETURN Key). Then the screen moves the location of the word to the first location
you want to search. It is possible to use the Down Arrow button or Return Key if you
want another locations of the word, The Up Arrow Button is used for searching the
word to upper field.
(7) If you choose the "Close” button, the window such as Figure 3.7 is closed.
(8) If you choose "VI editor" button in the History Tool of Figure 3.5, "File Selection
Dialog" window such as Figure 3.6 displays and you can select the specific file in
Page 50

User’s Manual
order to open it. After the procedures such as (3), (4), and (5) are processed, vi editor
window is created.
Figure 3.8 Result of “Vi Editor”
• VI Basic Commands
In the descriptions, CR stands for carriage return and ESC stands for the escape key.
:q!CR quit
/textCR search for text
(ex) /M5015 DISPLAY <enter>
^U ^D scroll up or down
^L clear and redraw window
Page 51

User’s Manual
3.1.3.3 Operation by System Button
Pressing this button presented to Figure 3.9 enables the operator to control user related
information, command structures, peripheral devices of BSM. When you log in to the BSM,
you are limited the control authorization according to user’s level or grade.
Figure 3.9 System Button
To Start BSM System Manager :
• Click the System button in the BSM main window and User Information Dialog of
Fig.3.10 is displayed.
Figure 3.10 User Information Dialog
• Type the User ID and the Password in the corresponding field and then press “OK”
button
3.1.3.3.1 Operations by Super-user (root)
If you type “root” and its password in the User Information Dialog of Fig. 3.10 , the window
such as Figure 3.11 is displayed.
Page 52

User’s Manual
Figure 3.11 System Control Window
3.1.3.3.2 User Menu
The only super-user can manage all grades of registered users. That is, the super-user
can add, register, modify, and delete user.
• ADD submenu : Super-user uses this menu to register a new user. The default grade of
user created newly is level 2. Figure 3.12 presents the input window in order to create or
add a new user in BSM.
• Delete submenu : This menu is used to delete the registered user. If you input a specific
user ID to the window such as Figure 3.13, you can delete it.
• Modify submenu : This menu is used to change the contents of the registered user. If
you select “Modify” menu, the input window is displayed and you can modify the user ID
in this window. If you input the modifying user Id and click “OK” button, the output
window is represented. This output window indicates the information of “User ID”,
“Password”, “Class” and “Name”. You can edit each fields and you can modify the user
information by pressing ”OK” button. The window of modifying the user information is
presented in Figure 3.14. Figure 3.14 represents the example of changing the user
grade of authorization for the command. That is, this figure presents changing the
authorization level of “test” user.
Page 53

User’s Manual
Figure 3.12 User Add
Figure 3.13 User Delete
Figure 3.14 Modify a user
Page 54

User’s Manual
Figure 3.15 List up the user information
Figure 3.16 Change user’s password
• Display submenu : This button is used to output or display all the registered users.
Figure 3.15 presents the output window of the user information.
• Passwd submenu : This is used to modify the password of current log-on user in BSM.
In other words, this menu modifies root’s password. Figure 3.16 presents the window,
which changes the password of specific user.
• Close submenu : Termination of system function
3.1.3.3.3 Operations by Command menu
This menu is used to create or edit a CDD(Command Data Description) file and check the
contents of CDD file that currently registered in the system.
• File submenu : This menu is used to manipulate the CDD file. It consists of these
submenus: New, Open, Save, SaveAs, Print, Delete, and Quit
Page 55

User’s Manual
• Check submenu :This menu is used to check all the CDD file and then displays its result
in the corresponding window.
3.1.3.3.4 Operations by Window menu
This menu is used to arrange several windows.
• Tiling submenu : It arranges and adjusts the unsettled windows.
3.1.3.3.5 “Device” menu
This menu is used to control the peripheral devices connected to the BSM workstation.
There are three submenus in this menu as follows:
• Printer submenu : This menu is set to the kind of printer, and decides the setting of the
printer mode, On/Off.
• Speaker submenu : This menu is set to audio device mode, On/Off.
• Modem submenu : Not implemented
Page 56

User’s Manual
3.1.4 Command Buttons
BSM system provides dozens of commands for CDMA system. These buttons are
presented in Figure 3.17.
Figure 3.17 BSM Main Screen
Figure 3.18 Command Panel
3.1.4.1 Operation of Alarm Command
Page 57

User’s Manual
(1) If you select “Alarm” button in the Command Panel of Figure 3.18, “Alarm Command
Dialog” window is represented. In this window, if you select the command button to
process, BSM displays the window that you are able to input parameters for the
corresponding command.
Figure 3.19 Alarm Command Dialog
(2) If the window displays, which operators can input the related parameters to the system
for the corresponding command in Figure 3.19, you may enter the values of
parameters and then press “Run” button.
Figure 3.20 Parameter Input Window : Example of CHG-ALM-BCP
(3) In the command window, the corresponding message for the parsed command is
Page 58

User’s Manual
represented and BSM executes it.
(4) If you need to help for the corresponding command, you can click “Help” button and
refer to help message.
3.1.4.2 Operations by Loading Command
If you select “Loading” button in the Command Panel of Figure 3.18, “Loading Command
Dialog” window is represented.
Its function is same to that of the “Alarm” command.
Figure 3.21 Loading Command Dialog
3.1.4.3 Operation by Status Command
If you select “Status” button in the Command Panel of Figure 3.18, the Status Command
Dialog window is represented as follows.
Its function is same to that of the “Alarm” command.
Figure 3.22 Status Command Dialog - CCP
Page 59

Figure 3.23 Status Command Dialog - BCP
User’s Manual
Figure 3.24 Status Command Dialog – CIN
Figure 3.25 Status Command Dialog – CCP-BCP
Page 60

Figure 3.26 Status Command Dialog – ACP-CKD
User’s Manual
Figure 3.27 Status Command Dialog – OTHERS
3.1.4.4 Operations to Diagnosis Command
If you select “Diagnosis” button in the Command Panel of Figure 3.18, the Diagnosis
Command Dialog displays as follows.
Its function is same to that of the “Alarm” command.
Page 61

Figure 3.28 Diagnosis Command Dialog
3.1.4.5 Operations by Configuration Command
User’s Manual
If you select “Config” button in the Command Panel of Figure 3.18, the Configuration
Command Dialog is represented as follows.
Its function is same to that of the “Alarm” command.
Figure 3.29 Configuration Command Dialog
Page 62

User’s Manual
3.1.4.6 Operations by Statistics Command
If you select “Statistics” button in the Command Panel of Figure 3.18, the Statistics
Command Dialog is represented as follows.
Its function is same to that of the “Alarm” command.
Figure 3.30 Statistics Command Dialog
3.1.4.7 Operations by No.7 Command
If you select “No.7” button in the Command Panel of Figure 3.18, the No.7 Command
Dialog is represented as follows.
Its function is same to that of the “Alarm” command.
Figure 3.31 No.7 Command Dialog
Page 63

User’s Manual
3.1.5 Service Button
There are five service buttons in the Service Panel of Figure 3.32. These buttons help to
the operators managing the systems efficiently or easily.
Figure 3.32 BSM Main Screen
3.1.5.1 Change the user grade of command
The function of this button in the Service Panel of Figure 3.33 is to output the command list
by user grade or authorization and change the grade or authorization of the specific
command. This function is used by the only super-user(root). There are three authorization
grades: Super-user, First class user who is able to verify and change the parameters of
Page 64

User’s Manual
system, and Second class user who is able to use basic function and confirm the status of
system. Command list is arranged by alphabet order.
Figure 3.33 Service Panel – Change Command Class
• Pressing the button in the Service Panel of Figure 3.33 displays the screen to change
the command class.
Figure 3.34. Change Command Class Window
• In the command list of the Change Command Class Window of Fig. 3.34, all the
commands are listed in alphabetical order and the number in the parentheses means
the class. Double click an item to change the class.
Page 65

User’s Manual
Figure 3.35 Double Click Command to Change Class
• Clicking the pop-down button of the Change Command Class Window shows as follows.
Click one of these classes and press Apply button, then the changed class is applied to
the command list.
Page 66

User’s Manual
Figure 3.36. Change the Class of ACT-BDTU to Class 1
• If you want to turn it back to the original class, press Reset button.
• Pressing Quit button ends the function.
3.1.5.2 Batch
This service button in Figure 3.37 is able to write, edit, and execute the batch file. This file
is composed of a series of BSM commands.
Figure 3.37 Service Panel - Batch
• If you press “Batch” button in the Service Panel, BSM displays such as Figure 3.38.
• The File menu in the Batch File Editor of Figure 3.38 has several commands as below:
a) New - New batch file.
Page 67

b) Open - Open and read an existing batch file.
c) Save - Save the batch file written by operator.
d) SaveAs - Save the batch file to another file name.
e) Delete - Delete the batch file.
f) Run - execute Batch in the editor window.
g) Vi - run Vi editor
h) Print - Print the contents of file.
i) Quit - Quit Batch File Editor.
User’s Manual
Example of Batch file :
Figure 3.38 Batch File Editor
Page 68

User’s Manual
3.1.5.3 Statistics Data Viewer
Figure 3.39 Service Panel – Statistics Data Viewer
• If you press the button “Statistics Data Viewer” in Service Panel, you can see the
window such as Figure 3.40. The function of this window is that the binary statistic data
occured for 10 minute , 1 hour or 1 day is converted to the text type data.
Figure 3.40 Statistics Data Viewer
• For example, if you press “00-10” button in the window of the Figure 3.40, the statistic
text data for 10 minutes ( 00 - 10 minutes ) is displayed in the following window. Scroll
Bar is used for moving the screen or searching any words.
• Usage of the word searching function : If you enter the word that you want to search in
the “Search : “ Text Field and push the Arrow Button () (or enter the RETURN Key).
Then the screen moves the location of the word to the first location of word or string that
you want to search. It is possible to use the Down Arrow button or Return Key if you
Page 69

User’s Manual
want another locations of the word, The Up Arrow Button is used for searching the word
to the upper field.
Figure 3.41 Statistics Data Viewer : 00-10
3.1.5.4 History Search
Figure 3.42 Service Panel – History Search
• The “History Search” of the Service Panel provides the fuction of “History search”,
shown in Figure 3.42. It is possible to search the types of date, time, kind, and code for
Page 70

command and message history in BSM.
3.1.5.4.1 Search Message History
User’s Manual
Figure 3.43 Search Message History
• Message History Search Initial Screen is shown in Figure 3.43. The default values for
DATE and TIME are current values for one hours. If You don’t set the TYPE and CODE,
all messages are displayed for the setting values.
• TYPE can be selected several items at one time. Also, CODE can be inputted several
values by using comma(,), Among messages of selected type, the messages related to
inputted CODE are displayed
• For example, in case Figure 3.44, messages related to CODE number 4207, 4209, and
4001 among alarm, fault, and status messages occured from 17:14 to 18:14 in
09/12/1998 would be searched and displayed.
Page 71

User’s Manual
Figure 3.44 Example of Search Message History
• If “OK” button is clicked, the window like Figure 3.45 would be poped up at center of
screen.
Page 72

User’s Manual
Figure 3.45 Result of Search Message History
3.1.5.4.2 Search Command History
• “Command history search initial window” is showned in Figure 3.46. Operation can be
refferd to “message history search”.
Page 73

User’s Manual
Figure 3.46 Search Command History
3.1.5.5 Help
Figure 3.47 Service Panel – Help of Commands
• Press “Help” in the Service Panel of Figure 3.47, and “Help Selection Dialog” window of
Figure 3.48 is represented.
Page 74

User’s Manual
Figure 3.48 Help Selection Dialog
• Select one command in the command list and press “OK” button(or Double-click one
command), and the help message for the command appears:
Figure 3.49 Help Message
Page 75

User’s Manual
3.1.6 Operations of “Alarm” window
Alarm window displays the fault status of each subsystem in the system. It uses several
colors to report the status of system to the operator efficiently and effectively in the window
with text message. So, you can understand easily in overall of system.
3.1.6.1 Types of Alarm Displays
The fault that operators take action rapidly must create the alarms. There are three types
of alarms as follows:
(1) Audible alarm – outputs the voice and sound alarms through the speaker.
(2) Visible alarm – outputs the colorful alarm display through the monitor.
(3) Alarm message – outputs the text alarm messages in the output window.
3.1.6.2 Grades of Alarms
(1) Normal alarm
This represents a normal status of subsystem and BSM displays this status with green
color.
(2) Critical alarm
This grade of alarm is critical to the system. So, this alarm is required to take
emergency actions for the fault status with no regard to the occurrence time of fault.
BSM displays these alarms with red color.
(3) Major alarm
This grade of alarm has an effect on services of system. It represents the fault status
or malfunction of main circuits. These faults are reported to operator immediately and
enable him to diagnose the functions of system or to recover the errors. The priority of
this alarm is not prior to that of critical alarm. So, this alarm effects on the
performance of the system directly or steadily (Orange).
(4) Minor alarm
This grade of alarm has a little effect on services of the system or subscribers. That is,
this alarm hardly effects on the functions of call processing. The priority of this alarm
Page 76

User’s Manual
is lowest (Yellow).
(5) Not Configured / Not Equip
This grade of alarm is not equipped to devices or cards (Gray).
3.1.6.3 The method of alarm detection
If the system reports the alarms to the operator and BSM, BSM displays the alarm status
to the corresponding location in BSM using colors according to the grade of alarm.
3.1.6.4 Main window of subsystems
Main window is composed of four parts: BSC, GCIN, GPS and BTS. If you want to know
the status of corresponding subsystems, you move the mouse to the button of
corresponding subsystem and click it.
Figure 3.50 Main window of subsystems
Page 77

User’s Manual
3.1.6.4.1 Main window of BTS
If you intend to know the status of BTS, you may click the button of corresponding BTS ID.
Then, the following window of Figure 3.51 and Figure 3.52 displays and represents all the
statuses of BTS in detail. The board equipped in the system displays green color. If one of
them produces alarms, BSM displays its status with red, orange, and yellow color
according to the grade of alarm.
You can move to the previous display window by pressing “Return” button or “Space bar”
key.
Figure 3.51 Main window of BTS
Figure 3.52 Main window of Micro-BTS
3.1.6.4.2 Main window of CDU
If you press a “CDU” button in the window of Figure 3.51, the window of Figure 3.53
Page 78

User’s Manual
displays. If you press “Return’ key or “Space bar” key, you can be back to the previous
window.
Figure 3.53 The window of CDU
3.1.6.4.3 Main window of ENV
If you press a “Environment” button in the window of Figure 3.51, the window of Figure
3.54 displays. If you press “Return’ key or “Space bar” key, you can be back to the
previous window.
Figure 3.54 The window of BTS ENV
3.1.6.4.4 Main window of BSC
Page 79

Figure 3.55 The window of BSC
3.1.6.4.5 Main window of TSB
User’s Manual
If you press a TSB button in Figure 3.55, the following window of Figure 3.56 is
represented.
Figure 3.56 The window of TSB
3.1.6.4.6 Main of GPS
When you press the “GPS” button of Figure 3.50, the following window of Figure 3.57 is
represented.
Page 80

3.1.6.4.7 Main of GCIN
User’s Manual
Figure 3.57 The window of GPS
When you press the “GCIN” button of Figure 3.50, the following window of Figure 3.58 is
represented.
Figure 3.58 The window of GCIN
3.1.6.5 Command Handling Window
Command Handling window of Figure 3.59 outputs the contents of inputted command for
the text-typed command or the command using GUI. And, it displays its results.
Page 81

User’s Manual
Figure 3.59 BSM Main Screen
3.1.6.5.1 Command Re-execution Method
This provides the simple method of executing the previously executed command. Re-
execution of the recently entered 20 commands is available.
(1) h Command
Entering h (or H) in the Command window and pressing Enter key displays the list of
recently entered 20 commands.
[ BSMcmd : 40 ] h
Page 82

21 DIS-ALM-STS:BSC=0;
22 DIS-ALM-STS:BSC=1;
23 DIS-ALM-STS:BSC=2;
24 DIS-ALM-STS:BSC=3;
25 DIS-ALM-STS:BSC=4;
26 DIS-ALM-STS:BSC=5;
27 DIS-ALM-STS:BSC=6;
28 DIS-ALM-STS:BSC=7;
29 DIS-ALM-STS:BSC=8;
30 DIS-ALM-STS:BSC=9;
31 DIS-ALM-STS:BSC=10;
32 DIS-ALM-STS:BSC=11;
33 DIS-ALM-STS:BTS=0;
34 DIS-ALM-STS:BTS=1;
35 DIS-ALM-STS:BTS=2;
36 DIS-ALM-STS:BTS=3;
37 DIS-ALM-STS:BTS=4;
38 DIS-ALM-STS:BTS=5;
39 DIS-ALM-STS:BTS=6;
40 h
[ BSMcmd : 41 ]
User’s Manual
Table Error! No sequence specified.. Example of h Command Result
(2) Command Re-execution
1) ! + (Command Number)
2) ! + (Command Initial String)
3) !!
You can re-execute the previously entered command by the above 3 methods.
The next table follows the Example of h Command Result of Table 1.
35 DIS-ALM-STS:BTS=2;
36 DIS-ALM-STS:BTS=3;
37 DIS-ALM-STS:BTS=4;
38 DIS-ALM-STS:BTS=5;
39 DIS-ALM-STS:BTS=6;
40 H
Page 83

[ BSMcmd : 41 ] !35
Table Error! No sequence specified.. ! + Command Number
User’s Manual
Page 84

User’s Manual
35 DIS-ALM-STS:BTS=2;
36 DIS-ALM-STS:BTS=3;
37 DIS-ALM-STS:BTS=4;
38 DIS-ALM-STS:BTS=5;
39 DIS-ALM-STS:BTS=6;
40 H
[ BSMcmd : 41 ] DIS-ALM-STS:BTS=2;
Table Error! No sequence specified.. Result
• Input (in italic) as shown in the Table 2 is replaced by the command corresponding to
the number as in the Table 3. Pressing Enter key at this state executes the command
immediately. If you want to modify the command, edit with the mouse, Delete or
Backspace key and press Enter key.
35 DIS-ALM-STS:BTS=2;
36 DIS-ALM-STS:BTS=3;
37 DIS-ALM-STS:BTS=4;
38 DIS-ALM-STS:BTS=5;
39 DIS-ALM-STS:BTS=6;
40 h
[ BSMcmd : 41 ] !DI
Table Error! No sequence specified.. ! + String
35 DIS-ALM-STS:BTS=2;
36 DIS-ALM-STS:BTS=3;
37 DIS-ALM-STS:BTS=4;
38 DIS-ALM-STS:BTS=5;
39 DIS-ALM-STS:BTS=6;
40 H
[ BSMcmd : 41 ] DIS-ALM-STS:BTS=6;
Table Error! No sequence specified.. Result
• Input (in italic) as shown in the Table 4 is replaced by the latest command that begins
Page 85

User’s Manual
with the string as in the Table 5. Pressing Enter key at this state executes the command
immediately. If you want to modify the command, edit with the mouse, Delete or
Backspace key and press Enter key.
35 DIS-ALM-STS:BTS=2;
36 DIS-ALM-STS:BTS=3;
37 DIS-ALM-STS:BTS=4;
38 DIS-ALM-STS:BTS=5;
39 DIS-ALM-STS:BTS=6;
40 h
[ BSMcmd : 41 ] DIS-ALM-STS:BSC=0;
1998-04-18 11:40:34 Fri
M1004 DISPLAY ALARM STATUS
CCP 0 NO ALARM STATUS
DISPLAY BCP ALARM COUNT
BCP_ID CRI MAJ MIN
[ BSMcmd : 42 ] !!
Table Error! No sequence specified.. !! Command
38 DIS-ALM-STS:BTS=5;
39 DIS-ALM-STS:BTS=6;
40 H
[ BSMcmd : 41 ] DIS-ALM-STS:BSC=0;
1998-04-18 11:40:34 Fri
M1004 DISPLAY ALARM STATUS
CCP 0 NO ALARM STATUS
DISPLAY BCP ALARM COUNT
BCP_ID CRI MAJ MIN
[ BSMcmd : 42 ] DIS-ALM-STS:BSC=0;
Table Error! No sequence specified.. Result
• Input (in italic) as shown in the Table 6 is replaced by the previously executed command
Page 86

User’s Manual
as in the Table 7. Pressing Enter key at this state executes the command immediately. If
you want to modify the command, edit with the mouse, Delete or Backspace key and
press Enter key.
3.1.6.5.2 Help Command in the Command Handling Window
(1) (Command + ‘?’)
• In command window, if you want to print the command help, you must input “command
+ ‘?’” or “command + ‘?’+’;’”.
[ BSMcmd : 1 ] CHG-SECT-INFO? or CHG-SECT-INFO?;
1998-07-02 09:37:34 Thu
• CHG-SECT-INFO HELP MESSAGE
• Change Sector Information.
CHG-SECT-INFO : {BSC=bsc, BCP=bcp}, SECT = sect {[Param]} ;
{BTS=bts }
bsc BSC id (0-11)
bcp BCP id (0-31)
bts BTS id (0-383)
sect Sector id (ALPHA, BETA, GAMMA)
Param :
PILOT Pilot Offset
TXFA Tx Fine Adjust
TXCA Tx Coarse Adjust
RXFA Rx Fine Adjust
RXCA Rx Coarse Adjust
RTDTHR Common Round Trip Delay Thresh
CYCIDX Max Slot Cycle Index
PREV CAI Revision
PMREV CAI Minimum Revision
(2) ?XXX (‘?’ + string)
Page 87

User’s Manual
• If you attatched ‘?’ at any string, you can see all commands involving the string.
[ BSMcmd : 1 ] ?SECT
1 CHG-SECT-INFO
2 DIS-SECT-INFO
[ BSMcmd : 2 ] ?CE
3 CHG-CE-CONF
4 CHG-CE-TYPE
5 CHG-SCEL-INFO
6 DIS-CE-STS
7 DIS-PN-CELL
8 DIS-SCEL-INFO
9 DIS-TCE-STS
10 STRT-STAT-CE
11 TST-CE
[ BSMcmd : 3 ] ?-CE-
12 CHG-CE-CONF
13 CHG-CE-TYPE
14 DIS-CE-STS
[ BSMcmd : 3 ] ?
1 ACT-LINK
2 ACT-LSET
3 ACT-OVLD-THR
4 ADD-LDNG-BLK
5 ADD-NEBR
6 ALW-ALM-MSG
. . .
248 TST-SVE
249 UINH-LINK
All commands are displayed.
Page 88

User’s Manual
PROPRIETARY & CONFIDENTIAL 3-44
3.2 System Status Management
3.2.1 System Status Test
BSC system may always audit and monitor processor status, alarm status, channel and
link status whether the call is normal. If the status is abnormal or system has a certain
fault, BSC system may take an action and then maintain the active status of system.
3.2.1.1 Alarm Test
(1) Alarm Monitoring
1) If the BSC system is an abnormal status or makes a certain fault, system may be
alerting the alarms. So, it must maintain the audible or visible alarm status in order to
output and create an alarm.
2) If you inhibited the audible or visible alarm, you must be always aware of not
outputting those alarms when the system is an abnormal status or a fault.
3) In reporting alarms to the system, it outputs the content of alarm and it checks the
corresponding block automatically. So, it solves the problems to the reported alarm.
4) You input a command of outputting alarm status and verify whether the alarm is
occurred.
(2) Alarm Test
1) You enable the system to output the alarm messages created until now.
C1004 DIS-ALM-STS:[BSC=aa[,BCP=bb],BTS=cc];
aa : BSC ID
bb : BCP ID
cc : BTS ID
You make sure of the number of alarm messages in the corresponding block.
2) You are able to output the alarm message information and then confirm the
Page 89

PROPRIETARY & CONFIDENTIAL 3-45
corresponding alarms.
C1006 DIS-ALM-INFO:AN=aa;
aa : Alarm Number ( 0000 - 9999 )
In the output messages, you confirm the contents of alarms and check the
corresponding block. You have to take an action for the corresponding block in
order to solve the alarm status.
3) You verify to the inhibited output messages of a lot of alarm messages.
C1007 DIS-INH-ALM;
User’s Manual
In this case, alarm code is not included in the output message.
4) You can change the alarm message generation mode. So, you can confirm to the
alarm messages occurred.
C1000 ALW-ALM-MSG:AN=aa;
aa : Alarm Code Number ( 0000 - 9999 )
You verify whether the alarm of inhibited output is not included on checking the
corresponding devices.
3.2.1.2 Fault Test
(1) Fault Audit
1) You always verify whether the fault is occurred according to the corresponding
system devices.
2) You must audit if the status of channel or link is blocked. So, you manage these
resources and then maintain them to the normal states for efficient call processing.
3) You check or audit the output alarm messages and verify if the corresponding
Page 90

PROPRIETARY & CONFIDENTIAL 3-46
devices are faults or abnormal.
(2) Fault Test for the listed items
1) You make sure whether the channel or link is blocked.
C3306 DIS-OOS-STS:BSC=aa,[BCP=bb,]DEV=cc,TYPE=dd;
aa : BSC ID
bb : BCP ID
cc : DEVICE TYPE ( SVE/MLNK/BLNK/TCE )
dd : Type ( MBLK/FBLK/TBLK )
2) You verify which fault message is inhibited.
C1008 DIS-INH-FLT;
User’s Manual
The code of inhibiting message dose not report to the system.
3) When you want to print the inhibited fault message, you must release the messages
that cannot print or report to the system. Therefore, you have to allow the messages
to print.
C1002 ALW-FLT-MSG:FN=aa;
aa : Fault CodeNumber ( 0000 - 9999 )
3.2.1.3 Test for control of processor status
(1) The status audit of processor
1) You always verify whether the status of processors is normal.
2) You change the status of stand-by processor to active processor and verify if the
status of this processor is normal or abnormal.
3) If the status of processor is abnormal, you have to repair it rapidly.
4) For the processor is the main part of system, you have to maintain that one or more
Page 91

User’s Manual
PROPRIETARY & CONFIDENTIAL 3-47
than processor is normal at least.
(2) Status test of processor
1) You verify if the status of CCP in the system is normal.
C3001 DIS-CCP-STS:[BSC=aa];
aa : BSC ID
If you don’t input the corresponding BSC ID, you can verify the statues of all
CCPs.
2) After you check and verify the status of processors, you switch over the status of
processor.
C2012 SWT-PRC:BSC=aa,PROC=CCP;
aa : BSC ID
You check the output message and verify if CCP is switched over in that message.
After the processor is switched over, you verify if its status is normal. If the system
does not have a standby processor, that is, it has only one processor, this command
is unable to be executed.
3) You verify the status of SIP in the system.
C3002 DIS-SIP-STS:BSC=aa;
aa : BSC ID
4) You check the status of SVP in the system.
C3003 DIS-SVP-STS:BSC=aa,[SIP=bb];
aa : BSC ID
bb : SIP ID
5) You verify the status of ACP in the system.
Page 92

PROPRIETARY & CONFIDENTIAL 3-48
C3401 DIS-BSC-ACP:[BSC=aa];
aa : BSC ID
6) You verify whether the processors of BTS are normal or abnormal.
C3101 DIS-BTS-PRC:BSC=aa,BCP=bb[,BTS=cc];
aa : BSC ID
bb : BCP ID
cc : BTS ID
7) You check whether the status of cards or boards in BTS is normal.
C3102 DIS-BTS-CARD:BSC=aa,BCP=bb[,BTS=cc],CARD=dd,MIC_CARD=ee;
aa : BSC ID
bb : BCP ID
cc : BTS ID
dd : SRC,TCC,TCU,TFC,BIC,GPS,AMP
ee : UP,DOWN,SYNU,BIC,STFU,RFRU
User’s Manual
3.2.1.4 Status test for links and channels
(1) Status audit of links and channels
1) You verify if the statuses of links and channels are normal.
2) When the links of BTS is blocked, you note that the call is cut off.
3) When the links and channels are blocked, you use TST command to check the
states of them.
(2) Status test of links
1) You check whether the status of MSC-links is normal.
C3005 DIS-MLNK-STS:BSC=aa;
aa : BSC ID
2) You verify the status of BTS-links.
Page 93

PROPRIETARY & CONFIDENTIAL 3-49
C3007 DIS-BLNK-STS:[BSC=aa,BCP=bb];
aa : BSC ID
bb : BCP ID
cc : BTS ID
(3) Status test of channel
1) You check the status of vocoder.
C3004 DIS-SVE-STS:BSC=aa,SIP=bb[,SVP=cc];
aa : BSC ID
bb : SIP ID
cc : SVP ID
User’s Manual
[BTS=c]
2) You verify the status of CE.
C3106 DIS-CE-STS:BSC=aa,BCP=bb[,BTS=cc],DU=dd;
aa : BSC ID
bb : BCP ID
cc : BTS ID
dd : DU ID
3.2.2 System Diagnosis
Diagnosis is the testing of resources that are closely related to call processing in operating
the system and its results is reported to the operators. If its results are abnormal, you
exclude this resource for the service of call process. If the resource of call process is
recoverable, you enable this resource to use the call services or to add the resource pool
of system immediately.
3.2.2.1 Diagnosis of vocoder
(1) Diagnostic method
Page 94

User’s Manual
PROPRIETARY & CONFIDENTIAL 3-50
There are four diagnostic methods of vocoder: Polling, Code compare, physical test,
and algorithm test.
1) Polling
You use this method to initialize the SVE(DSP) which is requested to diagnose. As
a result of its response, you can verify or check the status of vocoder.
2) Code Compare
This diagnostic method uses the result that the system compares the original DSP
code in VSOA-A1’s DRAM to the code in DSP’s SRAM.
If the system starts to diagnose the vocoders, it compares the code of vocoder
requested which is the code of SRAM in the DSP module with that of normal
vocoder which is the code of DRAM in VSOA-A1.
If the result of comparing the codes is identical, system may initialize the
vocoder. If the system receives acknowledgment from vocoder, system regards
this vocoder as normal. Otherwise, system decides that the status of vocoder
itself is abnormal.
If the result of comparing the codes is not same, system loads the normal code
to the DSP’s SRAM and replaces the code of SRAM. Then, system compares
the codes again. If the result of comparing the codes also is not same, system
decides the SRAM-related error.
If the result of comparing as above is same, system sends the initialization
message to the vocoder again and then waits for its response.
If the system receives the response for the message of initialization, this
response represents that the abnormal vocoder changes to the normal one
again. Otherwise, system decides that the status of vocoder is abnormal.
3) Physical Test (Will be implemented)
It tests the state of the internal ALU and RAM of DSP.
4) Algorithm Test (Will be implemented)
Page 95

User’s Manual
PROPRIETARY & CONFIDENTIAL 3-51
As it cmopares the the test tone in DSP with the encoding and decoding data using
the vocoder algorithm pointed by the operator, you can check the state of the
vocoder algorithm
5) All Test (Will be implemented)
It stops disgnosting in the step if it detecs the error diagnosting the vocoder as the
following sequence ; Code compare Physical test Algorithm test.
Page 96

User’s Manual
PROPRIETARY & CONFIDENTIAL 3-52
Page 97

PROPRIETARY & CONFIDENTIAL 3-53
(2) Diagnostic Test
1) You can use the following command to verify the status of vocoder.
C3004 DIS-SVE-STS:BSC=a,SIP=b[,SVP=c];
a : BSC Id
b : SIP Id
c : SVP Id
2) Next, you test the vocoder using the following command.
C4017 TST-SVE:BSC=a,SIP=b[,SVP=c,SVE=d],LEVEL=e,ALGORITHM=f;
a : BSC Id
b : SIP Id
c : SVP Id
d : SVE Id
e : Test Level (POLL_TST/CODE_CMP/PHYSICAL_TST/ALGORITHM_TST/ALL)
f : Vocoder algorithm (QCELP_8K/QCELP_13K/EVRC)
User’s Manual
(3) Inter-working with call processing
1) For vocoder is related with call processing directly, you can confirm enough to
diagnose the status of it.
2) In case of maintaining call, system decides on the normal state of vocoder. System
need not to diagnose, and reports the “BUSY” state to the operators.
3) If the vocoder is idle, system changes its state to test block (T_BLK) in order not to
use this resource not to set a call on diagnosing. And then, system enters to
diagnose.
4) After the diagnosis end up, system changes the state to idle and is able to use or
set a call service.
(4) Analysis for result of diagnosis
1) As a result of polling, vocoder sends VOC_OK/VOC_NOK to the system. If the
system is not able to receive the response normally, it decides on the abnormal
state of vocoder.
Page 98

User’s Manual
PROPRIETARY & CONFIDENTIAL 3-54
2) The response of comparing to code of memory is composed to three messages:
VOC_OK, VOC_NOK, and RAM_ERROR. If the code is normal or system does not
receive the response, system decides that DSP chip is abnormal or makes a
problem. If the vocoders do not load normally to DSP chip, system decides that the
problem results from the error of SRAM or DSP chip.
1)
(note
3)
4) The vocoder reports the result of Algorithm test to VOC_OK|FREG_ERR|GAIN_
The vocoder reports the result of Physical test to VOC_OK|ALU_ERR|DSP_
RAM_ERR|RAM/ALU_ERR. ALU_ERR is the error in the arithmetic or register and
DSP_RAM_ERR is the error in RAM of DSP. RAM/ALU_ERR is the error
ERR|FREQ/GAIN_ERR. FREQ_ERR is the error for the frequency deviation
exceeding the reference value after the generated signal encoding and decoding.
GAIN_ERR is the error for the energy deviation exceeding the reference value after
the generated signal encoding and decoding. FREQ/GAIN_ERR is the error for
occurring both FREQ_ERR and GAIN_ERR.
5) The result of All test is reported all the case for 2) ~ 4).
6) If the error except the result of the seccsion 1) ~ 4), for example, NRSP_SVE|
VOC_BUSY|ALRDY_TEST|VOC_NEQ|NRSP_SVP, is reported, it is the result of
the abnormal diagnostic test. NRSP_SVE is the no responce of the vocoder and
VOC_BUSY is the case that the vocoder does not carry out the diagnostic order.
ALRDY_TEST is the case that the vocoder is executing other diagnostic command
and VOC_NEQ is the case that the vocoder is not equipped yet. NRSP_SVP is the
case that it can’t execute the order because of SVP no response.
3.2.2.2 Diagnosis of HRNA
(1) Diagnostic method
The diagnosis of HRNA’s Node is executed by HICA. There are two methods of
diagnoses – Polling and Self Test – but both methods are concurrently executed.
1) Polling
1)
(note
3) ~ 6) will be implemented ASAP.
Page 99

PROPRIETARY & CONFIDENTIAL 3-55
HICA sends polling messages to each of nodes which interfaces with processors.
As a response of several polling messages, HICA reports the status of nodes to
the system.
2) Self Test
Without having response to polling, HICA enters to the self test and system
verifies the minimum status of node. This test can be only used to setting to alarm
mask in case of not connecting to the processors. Self Test is the test which is a
loop-back test for the Tx and Rx of node.
(2) Diagnostic test
1) You can verify the status of HRNA using the following command.
C3204 DIS-GCIN-NODE;
C3205 DIS-LCIN-NODE:BSC=a;
C3206 DIS-BIN-NODE:{BSC=a,BCP=b};
{BTS=c}
a : BSC Id
b : BCP Id
c : BTS Id
User’s Manual
2) You can use the following command to test and diagnose the node of HRNA.
C4016 TST-HRNA:DEV=a,{BSC=b,BCP=c,}HRNA=e,NODE=f;
{BTS=d,}
a : Test HRNA Type (GCIN/LCIN/BIN)
b : BSC Id
c : BCP Id
d : BTS Id
e : HRNA Id
f : HRNA NODE
(3) Analysis for the result of diagnosis
1) For the diagnosis of node is composed of one network unlike another test, this test
is impossible to test, after excluding the call services.
2) The diagnostic result of node represents OK or NOK. This result is meaningful for
Page 100

User’s Manual
PROPRIETARY & CONFIDENTIAL 3-56
the only node that connects to the corresponding device, because this is capable of
self-test.
3.2.2.3 Diagnosis of BTS-link
(1) Diagnostic method
The diagnosis of B-link is executed by HICA. There are three type of tests : node test,
local loop-back test and remote loop-back test. This test is able to execute all tests
concurrently at once and you can verify the overall status of B-link by executing
concurrently.
1) Test method of node
This is a loop-back test for the node of HNTA.
2) Method of local loop-back test
You enable this loop-back test in the T1 FRAMER of HNTA which controls to the
mechanical links to check the data returned from HICA.
3) Method of remote loop-back test
This is executed by HICA, which is a part of LCIN and exchanges messages or
sends/receives the data. First, HICA connects to the Rx and Tx of HNTA’s T1
FRAMER in peer BIN and then starts to the loop-back mode test. After diagnosing,
HICA changes diagnostic mode to the original test mode.
(2) Diagnostic test
1) You use the following command to verify the status of BTS-link.
C3007 DIS-BLNK-STS:{BSC=a,BCP=b};
{BTS=c}
a : BSC Id
b : BCP Id
c : BTS Id
 Loading...